Embed Size (px)
Citation preview
TRADEaFF BETWEEN COST AND EFFECTIVENESS OF CONTROL OF NUTRIENT LOADING INTO A WATER BODY
Istvan Bogardi Tiszadata Consulting Engineers, Mikb u. 1, 1012 Budapest, Hungary
Laszlo David Department o f Transport and Water Management, State Office for Technical Development, 1374 Budapest, Hungary
Lucien Duckstein Systems and Industrial Engineering Department, University o f Arizona, Tucson, Arizona 85 721, USA
RR-83-19 July 1983
INTERNATIONAL INSTITUTE FOR APPLIED SYSTEMS ANALYSB Laxenburg, Austria

International Standard Book Number 3-7045-0064-X
Research Reports, which record research conducted at IIASA, are independently reviewed before publication. However, the views and opinions they express are not necessarily those of the Institute or the National Member Organizations that support it.
Copyright @ 1983 international Institute for Applied Systems Analysis
All rights reserved. No part of this publication may be reproduced or transmitted in any form or by any means, electronic or mechanical, including photocopy, recording, or any information storage or retrieval system, without permission in writing from the publisher.
FOREWORD
The Lake Balaton Eutrophication Study was jointly initiated in 1978 by the Inter- national Institute for Applied Systems Analysis (IIASA) and the Hungarian Academy of Sciences, in recognition of the facts that (i) the eutrophication of shallow water bodies is not satisfactorily understood and (ii) there is widespread interest in methods for "opti- mally" improving water quality, that is in managing the system formed by a lake and its watershed. Concerning both of these issues, understanding and management, several ap- proaches were developed within the framework of the Balaton study; for details the reader is referred to van Straten and Somlyody (1980) and to Somlyody (1981, 1982).
In the Balaton region there is a conflict of interests between the growth of tourism and agriculture and the protection of the lake's water quality. This report presents an ap- proach that contrasts agricultural revenue and environmental protection, and considers the trade-off between minimizing the nutrient loads reaching the lake and the economic costs and losses related to various control alternatives. The approach takes special account of the stochastic nature of the problem and is developed using the example of a subwater- shed of the Balaton catchment area.
LASZLO SOMLYODY Leader
Lake Balaton Case Study

CONTENTS
SUMMARY
1 INTRODUCTION
2 PROBLEM DESCRIPTION 2.1 The General Problem 2.2 A Joint Lake-Watershed System 2.3 Phosphorus Loading 2.4 Possible Control Actions
3 MODEL DEVELOPMENT FOR LAKE BALATON 3.1 The Problem of Lake Balaton 3.2 The Watershed Considered 3.3 Economic Analysis of Control Alternatives 3.4 A Systems Model for the Watershed 3.5 Trade-Off Analysis
4 DISCUSSION 4.1 Relationship between the Lake and its Catchment Area 4.2 Simulation Error 4.3 Uncertainty 4.4 Snowmelt 4.5 Lake Modeling 4.6 Major Steps in the Analysis
5 CONCLUSIONS
APPENDIX: GUIDELINES FOR THE SELECTION OF A MULTIOBJECTIVE DECISION-MAKING (MODM) TECHNIQUE
REFERENCES

Research Report RR-83-19, July 1983
TRADE-OFF BETWEEN COST AND EFFECTIVENESS OF CONTROL OF NUTRIENT LOADING INTO A WATER BODY
Jstvan Bogardi Tiszadata Consulting Engineers, Mikb u. 1, 101 2 Budapest, Hungary
Laszlo David Department of Transport and Water Management, State Office for Technical Development, 1374 Budapest, Hungary
Lucien Duckstein Systems and Industrial Engineering Department, University o f Arizona, Tucson, Arizona 85 721, USA
SUMMARY
A system consisting o f a watershed and a water body is considered, and a methodol- ogy is presented for selecting the alternative scheme offering the best compromise between economic activity in the watershed and quality o f the water body. The general problem is specified for the system of a watershed and a lake endangered by eutrophication. Both economic activity and eutrophication can be characterized by several criteria. The method is applied to actual data from a subwatershed of Lake Balaton, Hungary, where the eco- nomic objective is to minimize the sum of costs and losses for the various control measures and the environmental objective is to minimize the amount of phosphorus available for algal growth. Both o f these objectives are decomposed into several criteria. The action space consists o f six pure strategies, namely, the control o f (1 ) point-source pollution, ( 2 ) fertilizer, ( 3 ) emsion, (4) land use, ( 5 ) nrnoff; and ( 6 ) sediment yield. l lese six pure actions lead to the definition of eight mixed alternatives l l e phosphorus-loading portion o f the model is run repeatedly with different stochastic input sequences to account for hydrologic uncertainty and the corresponding environmental objective is expressed as the probability uj that alternative j results in the largest decrease in phosphorus loading. Model parameters are estimated using available data or published tables and graphs. Com- promise programming is used to find a trade-off (or satisfactum solution) that balances the two conflicting objectives. In order to facilitate further application of the methodology, several points are discussed such as the relationship between the lake and its catchment,
the error in stochastic simulation, the consideration of various uncertainties, the effect o i snowmelt, and possible coupling with detailed lake eutrophication models. Finally, a step- by-step summary of the methodology isgiven to facilitate application of the model to other cases. Multicriterion decision-making techniques are briefy reviewed in the appendix so that cases with more than two objectives may also be approached.
1 INTRODUCTION
This report presents a methodology for selecting from a number of alternative schemes the one that offers the best comproniise between regional economic activity and water quality protection.
We consider a system comprising a water body, which may include surface and underground elements, and the corresponding watershed(s). The water body serves vari- ous water supply, environmental, or recreational purposes, while several types of socio- economic activity, such as urban development, industry, and agriculture, take place in the area of the watershed. The water body can only continue to meet the demands placed upon it if an adequate level of water quality is maintained. On the other hand, regional economic objectives call for the development of the socioeconomic activities in the water- shed. Conflicting interests can thus emerge, since socioeconomic growth in the watershed may adversely affect water quality, while the cost of water quality control can diminish economic benefits. Thus, the problem appears t o be of a multiobjective nature (Major 1977) and a compromise solution or "satisfactum" is sought (March and Simon 1958, Wierzbicki 1979).
The problem fornlulation and a modeling framework are first provided for the gen- eral case. We then analyze in detail a frequently encountered case, concerning a recreational lake (natural or man-made) for which:
water quality is affected by eutrophication, which is measured by indicators or criteria such as nutrient input, primary algal production, sedimentation, turbid- ity, and trophic state indices (Wetzel 1975, Meta Systems Inc. 1978, Walker 1979); watershed economic activity can be characterized in terms of annual economic benefit, manpower utilization, energy requirements, a watershed development index (David 1979), etc; costs of eutrophication control can be estimated and viewed as economic losses.
The methodology is applied t o the example of Lake Ralaton in Hungary within the framework of the IIASA Balaton Case Study.
The report is thus organized as follows. Section 2 describes the general problem of water quality control and watershed socioeconomic development, with special emphasis on surface water bodies. In Section 3 a model is developed for a typical subwatershed of Lake Balaton. Details of the model building steps are provided, and numerical results are placed in perspective to facilitate applications to other cases. In Section 4 the technique is discussed and a step-by-step summary of the methodology is given. Section 5 gives the main conclusions of the work.
2 PROBLEM DESCRIPTION
2.1 The General Problem
Consider a water body used for several purposes, such as water supply (drinking, irri- gation, industrial, etc.) and recreation. This body can be surface water, such as an estuary, a natural lake, or a reservoir, or it may be underground water. Water is supplied t o the water body by a hydrological system of rainfall-runoff-infiltration and by direct input from other connected water bodies. A range of social and economic activities take place throughout the area that drains into the water body. The problem addressed is the conflict between the socioeconomic development of the region and the environmental deteriora- tion of the water body (David 1978). Based on the "satisficing" approach, a set of activities is sought that results in a compro~nise solution or "satisfactum" between these conflicting interests (Wierzbicki 1980).
Previous work in this area includes, for example, a multiobjective inodel of water- shed management proposed by Miller and Byers (1973), and a groundwater management problem involving a conflict between coal mining, water supply, and environmental effects has been modeled using a multiobjective decision-making (MODM) technique by Bogardi e t al. (1978). Das and Haimes (1979) presented a multiobjective inodel of water quality and land management; however, their loading submodel considers neither the transport oT pollutants over the watershed nor the stochastic features of the phenomena involved, in inarked contrast t o the approach described here.
2.2 A Joint Lake-Watershed System
We now consider a specific water body (a lake or reservoir) for which an acceleration of the eutrophication process has recently been observed. We will assume that this accel- eration has been traced to an increase in nutrient loading, which in turn has been caused by regional development in the watershed, such as a growth in tourism, an increase in the use of agricultural chemicals, or growth in animal farming and industry (see for example Timmons e t al. 1968, David et al. 1979, National Water Authority 1979).
For our purposes the most important nutrients are carbon, nitrogen, and phosphorus (Rich 1973, Kovacs 1977); increases in the concentrations of these nutrients, particularly nitrogen and phosphorus, can accelerate the eutrophication process in water bodies (Vollen- weider 1968, Felfoldy and Toth 1970). Both nutrients have basic roles in the biological processes of eutrophication, but their precise effects depend on their relative contribution to the total amount of nutrients reaching the water body. Consequently, lake modeling efforts have frequently reflected cases where either nitrogen or phosphorus is the limiting factor (e.g., Horne 1975, Vollenweider 1975, Jdrgensen 1976). Since many studies have identified the limiting factor o n algal growth as phosphorus (e.g., Wetzel 1975), we will illustrate our approach by considering only that nutrient.
Alternative control actions available for improving the trophic state of a lake include decreasing the nutrient loading level o r the residence time of water in the lake, increasing the depth of the lake, and biological control within the water body (Serruya and Serruya
1975). In most cases, decreasing the nutrient loading appears t o be the most effective and manageable method (Vollenweider 1968, J6rgensen 1976).
2.3 Phosphorus Loading
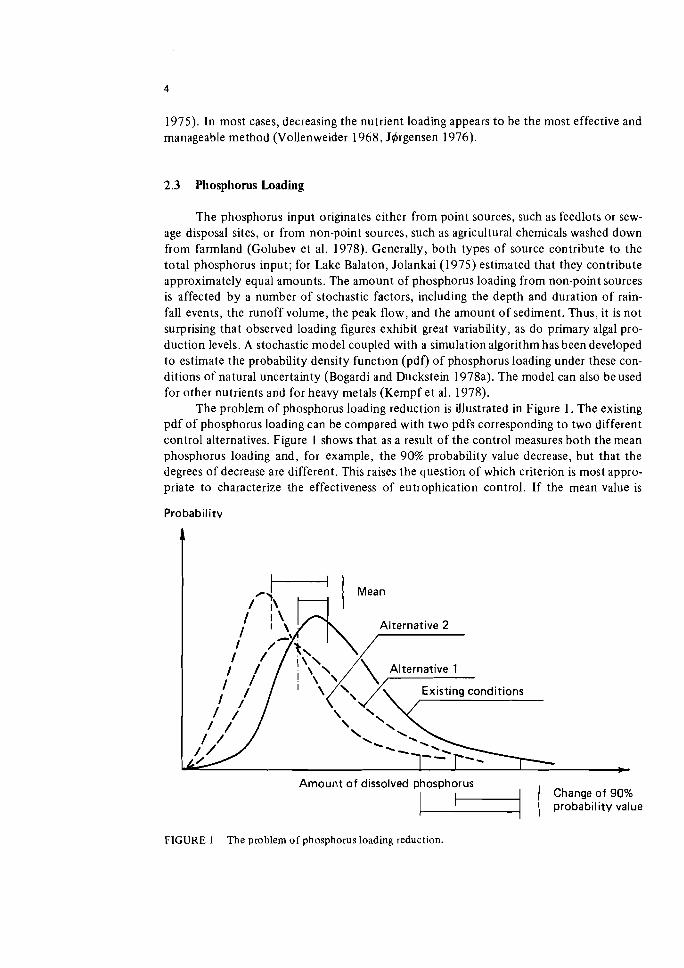
The phosphorus input originates either from point sources, such as feedlots or sew- age disposal sites, or from non-point sources, such as agricultural chemicals washed down from farmland (Golubev et al. 1978). Generally, both types of source contribute t o the total phosphorus input; for Lake Balaton, Jolankai (1975) estimated that they contribute approximately equal amounts. The amount of phosphorus loading from non-point sources is affected by a number of stochastic factors, including the depth and duration of rain- fall events, the runoff volume, the peak flow, and the amount o f sediment. Thus, it is not surprising that observed loading figures exhibit great variability, as do primary algal pro- duction levels. A stochastic model coupled with a simulation algorithm has been developed t o estimate the probability density function (pdf) of phosphorus loading under these con- ditions of natural uncertainty (Bogardi and Duckstein 1978a). The model can also beused for other nutrients and for heavy metals (Kempf et al. 1978).
The problem of phosphorus loading reduction is illustrated in Figure 1. The existing pdf of phosphorus loading can be compared with two pdfs corresponding t o two different control alternatives. Figure 1 shows that as a result of the control measures both the mean phosphorus loading and, for example, the 90% probability value decrease, but that the degrees of decrease are different. This raises the question of which criterion is most appro- priate to characterize the effectiveness of eutrophication control. If the mean value is
Probabilitv
A
Alternative 2
Alternative 1
Amount of dissolved phosphorus Change of 90% probability value
I 1
FIGURE 1 The problem of phosphorus loading reduction.
considered, then an improved trophic state can be expected o n the average, but excessive algal blooms leading t o fish kills or other undesirable effects are still likely t o occur. On the other hand, if we choose as our criterion the variance or some upper probability value, then excessive algal blooming will be a rare occurrence, but the average trophic level may remain too high. It thus appears that some measure of uncertainty (Reckhow 1979) or even the entire pdf should be taken into account when comparing alternatives.
The nutrient phosphorus has two major roles in the eutrophication process (Wetzel 1975, Toth et al. 1975). On the one hand, dissolved phosphorus in runoff enters the lake, and some of it is directly assimilated by the phytoplankton present (Holt e t al. 1970). On the other, the so-called "available" part of the phosphorus fixed t o sediments originating from surface erosion is stored at the bottom of the lake; it can then be released and used by the phytoplankton under certain conditions (Armstrong and Weimer 1973). Since con- trol alternatives frequently have different effects o n the loading of dissolved and fixed phosphorus, each type will be measured separately until the phosphorus reaches the lake itself.
2.4 Possible Control Actions
Social and economic activities in the watershed influence both the sources and the transport of pollution. The watershed area may be utilized for various purposes such as industry, agriculture, or urban development, and the overall development scheme can be characterized by criteria including economic benefit, manpower utilization, land utilization, and energy requirements (David et al. 1979). As a result o f watershed development, pol- lution is transported by runoff into the water body where it causes eutrophication. This phenomenon can be monitored by inflow indicators such as the amounts of nutrient, pes- ticide, herbicide, heavy metals, or erosion and lake indicators such as chlorophyll concen- tration. transparency, phosphorus level, hypolimnetic oxygen deficit, or primary algal pro- duction. There is n o single, general measure for the trophic state of a water body. Control of phosphorus loading may be effected both at the source and during transport into the lake. In this study we will assume that the following "pure" control actions can be taken:
Control o f the Source A1 - decreased loading from point sources (tertiary treatment of municipal, indus-
trial, and feedlot effluent); A2 - fertilizer control (type, amount, ratio, timing, and mode of application); A3 - erosion control (contour farming, terraces); A4 - crop management (land use control);
Control o f the Transport A5 - runoff control (retention reservoirs); A6 - sediment trapping (silting basins).
Since most control variables are continuous, there are an infinite number of potential alternatives. However, only a finite subset of these will be considered here for two reasons.
First, water-management authorities usually identify only a small number of control alter- natives; for example, this is the case for Lake Balaton. Second, solving a continuous sto- chastic control model with nonlinear cost functions is no easy task; at the same time, prac- tical results are needed immediately if the eutrophication process is t o be controlled at all.
3 MODEL DEVELOPMENT FOR LAKE BALATON
3.1 The Problem of Lake Balaton
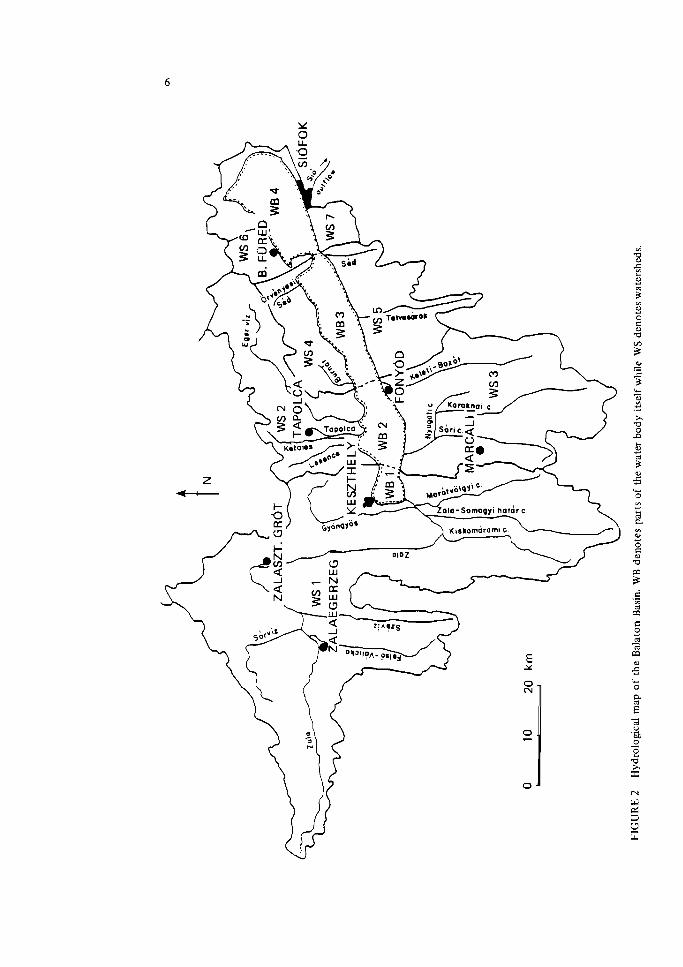
Lake Balaton is relatively large (600 km2) and shallow (average depth 3.5 m), with a catchment area of 5,180 km2 (Figure 2). During the last decade, tourism in the area around the lake and agriculture in the watershed have developed rapidly; unfortunately, the trophic state of the lake has deteriorated at a similarly rapid rate (Herodek and Tamas 1975a, 1975b, van Straten et al. 1979). It has been shown that the sudden increase in primary algal production has mostly been caused by an increase in phosphorus loading (Toth et al. 1975); therefore, it is assumed here that the trophic state of the lake can be characterized by the amount of phosphorus reaching the lake. As mentioned earlier. pre- liminary observations indicate that point and non-point sources contribute approximately equal amounts t o the overall loading (Jolankai 1975).
Point sources are essentially domestic or industrial waste-discharge outlets, which may be somewhere within the catchment area, so that the waste is transported into the lake by rivers, or o n the shore of the lake itself; in either case, local concentrations of nutrients must be taken into account when examining the trophic state of a given portion of the lake. Sewage treatment plants and feedlots are typical point sources.
The output from non-point sources may be soluble organic phosphorus(wastes from grazing animals, leaching of vegetation), soluble inorganic phosphorus (orthophosphate, hydrolyzable polyphosphates), or phosphorus suspended in soluble inorganic compounds, sorbed, or fixed. Much of the non-point source phosphorus originates from commercial or natural fertilizers.
The development of agriculture coincides with the use of growing amounts of chem- icals such as fertilizers. Two conflicting goals therefore arise: decreasing phosphorus load- ing and increasing agricultural revenue.
The inverse relationship between the benefits of tourism and the level of eutrophica- tion has been strikingly evident for Lake Balaton. Though it is theoretically possible t o express in monetary terms the value of Balaton tourism, we have not attempted to d o this because the preservation of good water quality is much more than a purely economic ques- tion, involving as it does significant social and political dimensions. To complicate matters further, tourism is itself a factor in point-source pollution.
3.2 The Watershed Considered
The actual watershed considered is the area denoted as WS5 in the hydrological clas- sification of Lake Balaton (David et al. 1979) (see Figure 2). We note in passing that the
stochastic loading model described later in this report was first calibrated on and applied to the Tetves watershed (Bogardi and Duckstein 1978a) which is a part of watershed WS5.
Concerning the relationship between the lake and its catchment area (see Section 4), it is assumed here that no mixing occurs in the lake, so that the eutrophication control model we will present can be used independently of control measures adopted in other parts of the lake. Note that this assumption is for illustrative purposes only and may be changed in other applications.
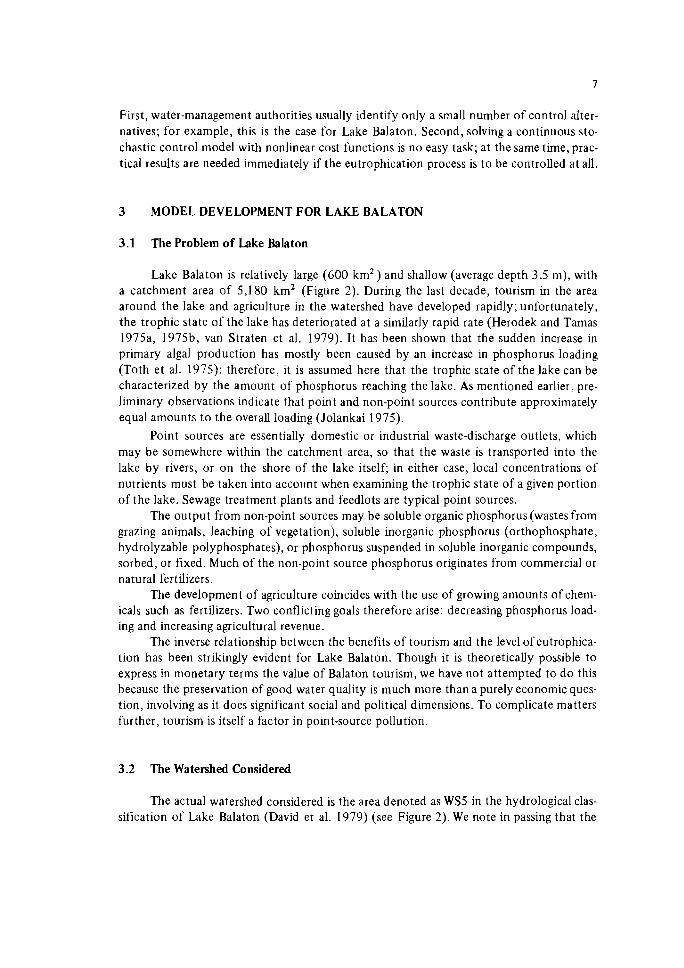
Watershed WS5 is located in the middle part of the southern shore of Lake Balaton (Figure 2). Its area is 3 10 km2, which is 6% of the total watershed of the lake. Table 1 shows that the principal activities in the area are agriculture and forestry. Although water- shed WS5 forms a relatively small part of the total BaIaton watershed, the hydrological, soil, land use, and slope conditions are fairly typical of conditions found south of the lake. Built-up areas are mainly concentrated along the lake shore. Of the four watercourses in WS5, the Tetves creek (Tetvesarok) is the most important from both hydrological and phosphorus-loading viewpoints. Surface erosion is considerable throughout the area: the average soil erosion is estimated at 34.6 t ha-' yr-' . The total amount of fertilizers applied in 1975 was 280 kg ha-' yr-' with a phosphorus content of 25%.
TABLE 1 Characteristics of Balaton watershed WS5.
Hydrological properties Area: 3 10 km2 Width (along the lakeshore): 27 km Average length: 11.5 km Maximum length: 25 km Average slope of main water course: 4% Annual average rainfall: 650 mm Multiannual average runoff: 60 X lo9 m > f ' (1.9 m3 s-' )
Average soil composition Loess: 35% Sand loam: 33% Gravel and sand: 28% Others: 4%
Land use pattern (in 1 9 75) km2 %
Agricultural land: cropland 128 41 meadows 34 11 vineyards and orchards 8 3 (subtotal) (170) (55)
Forest land: 120 3 9 Urbanized and other areas: 20 6
Slope categories o f agricultural land Category (% slope) 0-5 5-12 12-17 17-25 25-35 Percentage of land 30 30 19 15 6
3.3 Economic Analysis of Control Alternatives
Corresponding to the six control actions presented in Section 2.4, cost or revenue functions have been developed for the following six control variables, based on the Water Management Development Plan (WMDP) for Lake Balaton (National Water Authority 1979):
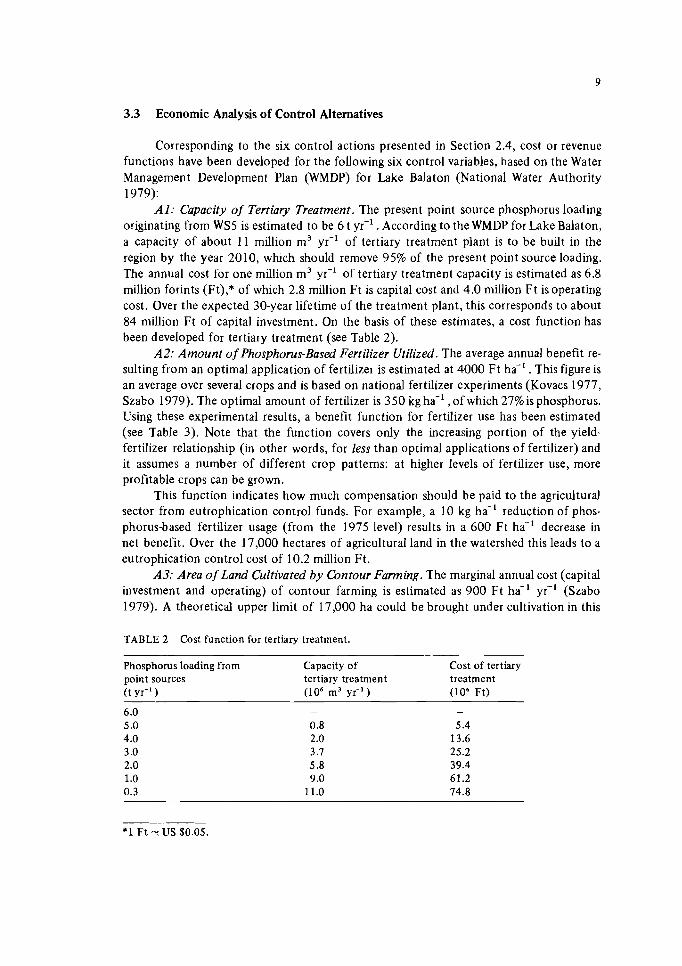
A l : Capacity of Tertiary Treatment. The present point source phosphorus loading originating from WS5 is estimated to be 6 t yr-' . According to the WMDP for Lake Balaton, a capacity of about 11 million m3 yr-' of tertiary treatment plant is to be built in the region by the year 2010, which should remove 95% of the present point source loading. The annual cost for one million m3 yr-' of tertiary treatment capacity is estimated as 6.8 million forints (Ft),* of which 2.8 million Ft is capital cost and 4.0 million F t is operating cost. Over the expected 30-year lifetime of the treatment plant, this corresponds to about 84 million Ft of capital investment. On the basis of these estimates, a cost function has been developed for tertiary treatment (see Table 2).
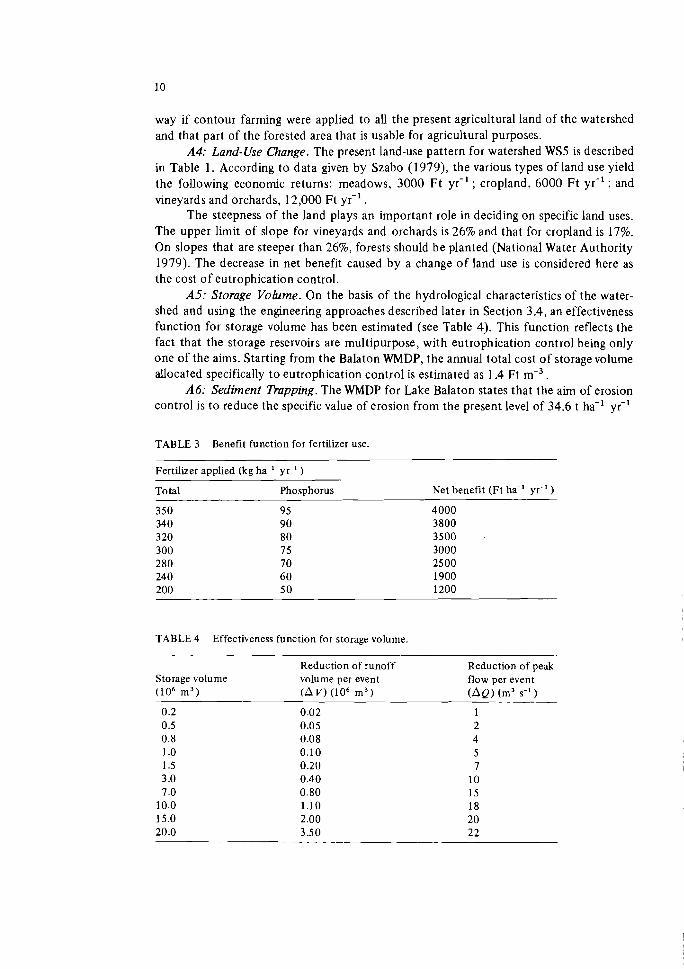
A2: Amount of Phosphorus-Based Fertilizer Utilized. The average annual benefit re- sulting from an optimal application of fertilizer is estimated at 4000 Ft ha-' . This figure is an average over several crops and is based on national fertilizer experiments (Kovacs 1977, Szabo 1979). The optimal amount of fertilizer is 350 kg ha-' ,of which 27% is phosphorus. Using these experimental results, a benefit function for fertilizer use has been estimated (see Table 3). Note that the function covers only the increasing portion of the yield- fertilizer relationship (in other words, for less than optimal applications of fertilizer) and it assumes a number of different crop patterns: at higher levels of fertilizer use, more profitable crops can be grown.
This function indicates how much compensation should be paid to the agricultural sector from eutrophication control funds. For example, a 10 kg ha-' reduction of phos- phorus-based fertilizer usage (from the 1975 level) results in a 600 Ft ha-' decrease in net benefit. Over the 17,000 hectares of agricultural land in the watershed this leads to a eutrophication control cost of 10.2 million Ft.
A3: Area of Land Cultivated by Contour Farming. The marginal annual cost (capital investment and operating) of contour farming is estimated as 900 Ft ha-' yr-' (Szabo 1979). A theoretical upper limit of 17,000 ha could be brought under cultivation in this
TABLE 2 Cost function for tertiary treatment.
Phosphorus loading from Capacity of Cost of tertiary point sources tertiary treatment treatment (t YI-' ) (lo6 m3 y i ' ) (lo6 Ft)
way if contour farming were applied to all the present agricultural land of the watershed and that part of the forested area that is usable for agricultural purposes.
A4: Land-Use Change. The present land-use pattern for watershed WS5 is described in Table 1. According t o data given by Szabo (1979), the various types of land use yield the following economic returns: meadows, 3000 F t ~ r - ' ; cropland, 6000 F t ~ r - ' ; and vineyards and orchards, 12,000 Ft yr-' .
The steepness of the land plays an important role in deciding on specific land uses. The upper limit of slope for vineyards and orchards is 26% and that for cropland is 17%. On slopes that are steeper than 26%, forests should be planted (National Water Authority 1979). The decrease in net benefit caused by a change of land use is considered here as the cost o f eutrophication control.
A5: Storage Volume. On the basis of the hydrological characteristics of the water- shed and using the engineering approaches described later in Section 3.4, an effectiveness function for storage volume has been estimated (see Table 4). This function reflects the fact that the storage reservoirs are multipurpose, with eutrophication control being only one of the aims. Starting from the Balaton WMDP, the annual total cost of storage volume allocated specifically t o eutrophication control is estimated as 1.4 Ft m-3.
A6: Sediment Trapping. The WMDP for Lake Balaton states that the aim of erosion control is t o reduce the specific value of erosion from the present level of 34.6 t ha-' yr-'
TABLE 3 Benefit function for fertilizer use.
Fertilizer applied (kg ha.' yr-' )
Total Phosphorus Net benefit (Ft ha-' yr-' )
350 95 4000 340 90 3800 320 80 3500 300 7 5 3000 280 70 2500 24 0 60 1900 200 5 0 1200
TABLE 4 Effectiveness function for storage volume.
Reduction of runoff Reduction of peak Storage volume volume per event flow per event ( l o 6 m 3 ) cav, ( l o 6 m 3 ) ( A Q , (m3 s-' )
t o 1 5 t ha-' yr-' . To achieve this goal it is estimated that 15 million Ft yr-' will be re- quired to build and operate the necessary erosion control structures in watershed WS5. If less money is available, a proportionally smaller reduction in erosion will be possible.
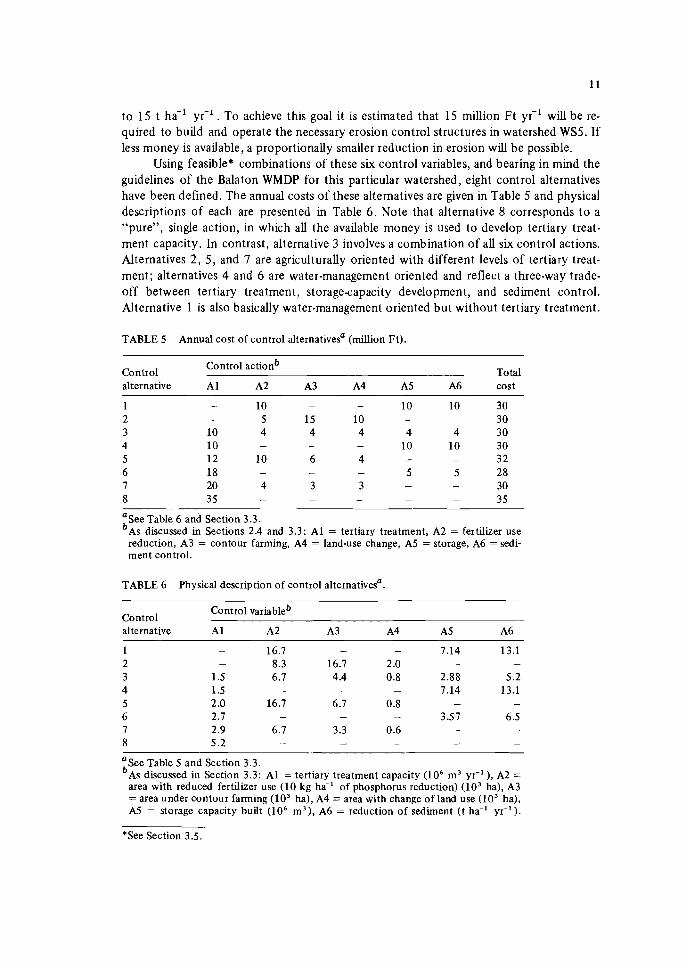
Using feasible* combinations of these six control variables, and bearing in mind the guidelines of the Balaton WMDP for this particular watershed, eight control alternatives have been defined. The annual costs of these alternatives are given in Table 5 and physical descriptions of each are presented in Table 6. Note that alternative 8 corresponds t o a "pure", single action, in which all the available money is used t o develop tertiary treat- ment capacity. In contrast, alternative 3 involves a combination of all six control actions. Alternatives 2, 5 , and 7 are agriculturally oriented with different levels of tertiary treat- ment; alternatives 4 and 6 are water-management oriented and reflect a three-way trade- off between tertiary treatment, storagecapacity development, and sediment control. Alternative 1 is also basically water-management oriented but without tertiary treatment.
TABLE 5 Annual cost of control alternativesa (million Ft).
Control actionb Control Total alternative A 1 A2 A3 A4 A5 A6 cost
1 - 10 - - 10 10 30 2 - 5 15 10 - - 30 3 10 4 4 4 4 4 30 4 10 - - - 10 10 30 5 12 10 6 4 - - 32 6 18 - - 5 5 28 -
7 20 4 3 3 - - 30 8 35 - - - - - 35
'see Table 6 and Section 3.3. b ~ s discussed in Sections 2.4 and 3.3: A1 = tertiary treatment, A2 = fertilizer use
reduction, A3 = contour farming, A4 = land-use change, A5 = storage, A6 = sedi- ment control.
TABLE 6 Physical description of control alternativesa.
Control variableb Control alternative A 1 A2 A3 A4 A5 A6
1 - 16.7 - - 7.14 13.1 2 - 8.3 16.7 2.0 - -
3 1.5 6.7 4.4 0.8 2.88 5.2 4 1.5 - - - 7.14 13.1 5 2 .O 16.7 6.7 0.8 - -
6 2.7 - - - 3.57 6.5 7 2.9 6.7 3.3 0.6 - - 8 5.2 - - - - -
a ~ e e Table 5 and Section 3.3. b ~ s discussed in Section 3.3: A1 = tertiary treatment capacity ( lo6 m"r-' ), A2 =
area with reduced fertilizer use (10 kg ha.' of phosphorus reduction) (lo"), A3 = area under contour farming ( lo3 ha), A4 = area with change of land use (10%a), A5 = storage capacity built ( lo6 m3), A6 = reduction of sediment (t ha.' yr-').
*See Section 3.5.
3.4 A Systems Model for the Watershed
The control of nutrient loading into a lake may be described using a discrete systems model (Booth 1967, Duckstein and Simpson 1976, Wymore 1976, Duckstein and Bogardi 1978). The elements of this model can be defined as follows, for time periods T ( T =
0, I,. . .).
3.4.1 The Input The input I ( t ) comprises: statistical data (or derived statistics) on rainfall events
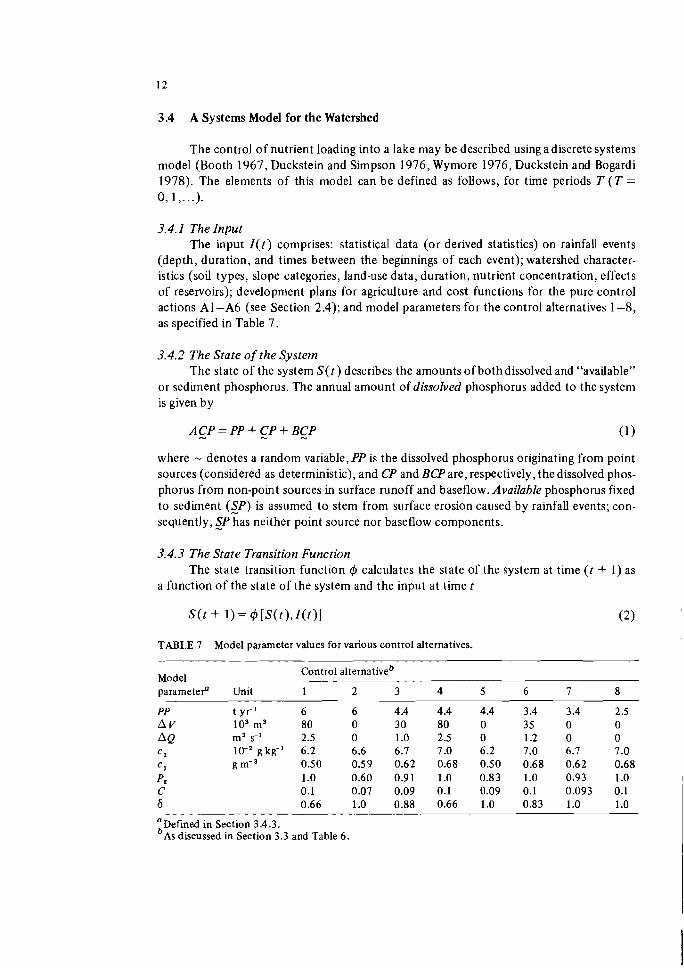
(depth, duration, and times between the beginnings of each event); watershed character- istics (soil types, slope categories, land-use data, duration, nutrient concentration, effects of reservoirs); development plans for agriculture and cost functions for the pure control actions A1 -A6 (see Section 2.4); and model parameters for the control alternatives 1-8, as specified in Table 7.
3.4.2 The State ofthe System The state of the system S ( t ) describes the amounts of both dissolved and "available"
or sediment phosphorus. The annual amount of dissolved phosphorus added to the system is given by
ACP = PP + CP + BCP - (1)
where - denotes a random variable, PP is the dissolved phosphorus originating from point sources (considered as deterministic), and CP and BCP are, respectively, the dissolved phos- phorus from non-point sources in surface runoff and baseflow. Available phosphorus fixed to sediment (ZP) is assumed to stem from surface erosion caused by rainfall events; con- sequently, ZP has neither point source nor baseflow components.
3.4.3 The State Transition Function The state transition function 4 calculates the state of the system at time ( t + 1) as
a function of the state of the system and the input at time t
TABLE 7 Model parameter values for various control alternatives.
Model Control alternativeb
parameter" Unit 1 2 3 4 5 6 7 8
PP t yr-I 6 6 4.4 4.4 4.4 3.4 3.4 2.5 A V lo3 m3 80 0 30 80 0 3 5 0 0 AQ m3 2.5 0 1.0 2.5 0 1.2 0 0 C z 10-2 g kg-' 6.2 6.6 6.7 7.0 6.2 7.0 6.7 7 .O C~ g m-" 0.50 0.59 0.62 0.68 0.50 0.68 0.62 0.68 pr 1 .O 0.60 0.91 1.0 0.83 1.0 0.93 1.0 C 0.1 0.07 0.09 0.1 0.09 0.1 0.093 0.1 6 0.66 1.0 0.88 0.66 1.0 0.83 1.0 1 .O
aDefined in Section 3.4.3. b ~ s discussed in Section 3.3 and Table 6.
Typical state transition functions are the mass and chemical balance equations for the watershed and the water body. An example is the partial differential equation describ- ing the diffusion of a polluted plume in a water body. Note that the numerical solution of such a n equation is generally calculated for discrete time steps, as in eqn. (2).
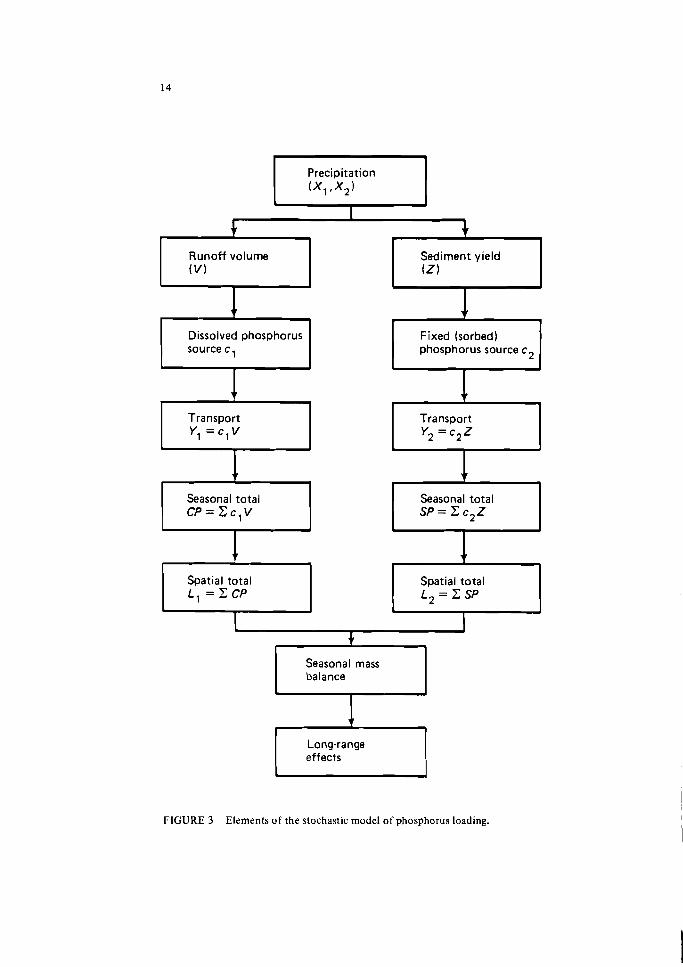
In the present case the state transition function is a rainfall-runoff-sediment yield model fed by stochastic rainfall input (Duckstein and Bogardi 1978) so that the probabil- ity density functions for ACP and SP can be estimated. A sequence of phosphorus-loading events triggered by precipitation events (XI , T z ,_T) is generated, where is the rainfall amount, Xz is the duration of the event, and _T is the time between the beginnings of each event. (TI , T z ) are dependent random variables, assumed t o follow a bivariate gamma distribution, while _T is assumed t o be exponentially distributed. The precipitation event causes runoff, which carries dissolved phosphorus at a concentration c l into the lake; the runoff also transports an amount of sediment _Z, which includes a fraction c2 of fixed or sorbed phosphorus, into the lake. The seasonal loading of phosphorus is calculated by summing a random number of random loadings (see Figure 3).
Empirical relationships are used t o estimate the runoff volume [, peak flow Q per event, and sediment yield per event Z. In the present model version, [ and Q are calczated using the US Soil Conservation Service (SCS) formula (Soil conservation Service 1972) and Z is estimated using the universal soil loss equation as derived for runoff events by Smith et al. (1977).
Explicit expressions can be written down for the mean and variance o f each type of phosphorus loading. Alternatively, a simulation method, as in Duckstein et al. (1978), is used t o estimate complete pdfs for these random variables.
Since, in addition t o the natural input described above, possible control decisions can also affect the state of the system, we now present a methodology for estimating phos- phorus loadings corresponding t o the various control alternatives.
The amount of dissolved phosphorus can be decreased by controlling:
- the runoff volume [per event, - the dissolved phosphorus concentration c l in the runoff, or - the amount of point source phosphorus released PP.
The amount of sediment phosphorus can be modified by controlling:
- the runoff volume y, - the peak flow Q per event, - the sediment Celd Z per event, - the erosion control factor P,, - the crop management factor C, - the sediment trapping factor 6 , or - the concentration cz of phosphorus in the sediment.
Next, the effect of the six pure actions o n pl~osphorus loading is considered. A l : Decreased Loading from Point Sources. The budget allocated for this purpose
immediately determines a specific tertiary treatment capacity; the corresponding reduction in point source phosphorus loading can then be estimated.
Precipitation
Runoff volume Sediment yield
Dissolved phosphorus source c l I I Fixed (sorbed)
phosphorus source c2
Transport Transport
Seasonal total Seasonal total
Spatial total Spatial total L, = C S P
Seasonal mass balance
I Long-range effects 1
FIGURE 3 Elements of the stochastic model of phosphorus loading.
A2: Fertilizer Control. By reducing the rate of fertilizer application the concentra- tions c, and c, will clearly decrease; however, even when observed data on c l and c, are available, the precise effect of different application rates can hardly be reliably predicted without a proper model. Soil scientists and environmental engineers have recently devel- oped models describing the movement of chemicals such as fertilizers through a watershed. One approach involves fairly complex simulations such as that described by Novotny et al. (1978); this type of approach is difficult to embed in a stochastic control model. On the other hand, the principles used in these complex models have led to the development of a second approach based on regression analysis of laboratory and field experiments (Romkens and Nelson 1974, Meta Systems Inc. 1978, Sharpley et al. 1978). This latter approach is used in the present study. More specifically, our method is as follows.
The soil sorptivity for phosphorus is mostly governed by such soil properties as aluminum, iron, clay, and organic material content, and pH. Thus, the first step is to sample and analyze watershed soils. Given knowledge of the soil properties, the concen- tration cz of available sorbed phosphorus can be estimated in three different ways, by:
- measuring the inorganic phosphorus extracted by 0.1 M NaCl from the surface (0-1 cm) of the soil (Sharpley et al. 1978);
- using a multiple regression model (Novotny et al. 1978); or - using the data published by Romkens and Nelson (1974) who investigated sev-
eral soils with different properties and summarized their results in the form of graphs.
This available particulate phosphorus is generally assumed to support algal growth in lakes (Wetzel 1975, Meta Systems Inc. 1978).
The main soil type found in watershed WS5 has the following properties: sand, 20%; clay, 19%; organic carbon, 1.8%; Fez 0 3 , 1.2%; Al, 0 3 , 0.21 %; and a pH of 6.9. Based on these properties and on the present fertilizer application rate of 70 kg phosphorus ha-', Rornkens and Nelson's graphs lead to a c, value of 7.10 X lo-' g m-3 .
The concentration c l of dissolved phosphorus can be estimated from concentration c, at the absorption equilibrium point according to either the Langmuir method or the Freundlich method of isotherms (Novotny et al. 1978). For the practical determination of the (cl ,c,) relationship, Romkens and Nelson (1974) propose graphs based on laboratory and field experiments with different soils. Using these graphs for c, = 7 X loy2 gm-3 and the given soil type, it is found that c l = 0.68 g m-3. Note that this estimated value of c1 is acceptably close (within one standard deviation) to the mean value of c l = 0.96 g m-3 observed for the Tetves watershed during a one-year period (Jolankai 1975).
Increased fertilizer application raises the concentration c, of available phosphorus; consequently, the concentration c , of dissolved phosphorus also increases. The effects of changes in application rates on c l and c, can be determined by subsequent sampling and measurement, or by using the graphs of Romkens and Nelson (1974). Meta Systems Inc. (1978) propose a relationship for calculating c, that includes not only the fertilizer appli- cation rate but also the effective tillage depth.
A3: Erosion Control. Given the cost function for erosion control measures such as contour farming and the portion of the budget allocated for these purposes, the mode
and degree of erosion control can be determined. An erosion control factor P, can then be assessed, as described by Wischmeier and Smith (1972).
A4: Crop Management. The money allocated for this purpose will be used t o com- pensate for losses of revenue incurred on changing to a less profitable type of land use; the underlying aim is, of course, t o reduce erosion losses and thus the amount of sediment phosphorus. The model procedure here consists of estimating an appropriate crop manage- ment factor C (Wischmeier and Smith 1972) that reflects the land-use type considered.
A5: Runoff Control. Flood-retention reservoirs are assumed t o decrease the peak flow Q by AQ and to utilize some part A V o f the runoff volume _V for other purposes such as water supply or irrigation. Note that A V refers to consumptive use only. Given the budget allocated t o runoff control, the total storage volume can be estimated, or, better, a preliminary design for the reservoirs can be prepared. Several methods are available to calculate AQ and A V, from simple engineering procedures such as reservoir routing (Chow 1964) t o sophisticated reservoir systems models (Murray and Yakowitz 1979). Given values of AQ and A V (which are often functions of Q and _V), Q and _V are replaced, re- spectively, by Q - AQ and _V - A V in the stochastickodel of &osphorus loading.
A6: sediment Trapping. This control action consists of building structures designed to trap sediment in watercourses. In principle, the same procedure can be used as for ac- tion AS: values o f AZ per sediment event are estimated and the stochastic loading model is used with (_Z - A Z ) = 6_Z replacing Z; the fraction 6 is referred to as the sediment trapping ratio (Brune 1953).
3.4.4 The Output The output R ( t ) may include elements of the state vector, for example the trophic
level o r the phosphorus loading, and other elements representing decision criteria, such as costs, benefits, losses, and various social indicators. In the present case, R ( t ) has just two elements. The first is the eutrophication output _L, which is considered to be the total amount o f phosphorus reaching the lake and feeding algal growth. The second element is the economic output - the sum of all economic losses and costs related t o eutrophication control measures.
3.4.5 The Output Function I The output function calculates the output vector as a function of S ( t ) and I ( t ) . I
Since the state variables ACP and SP (respectively, the dissolved and the sediment phos- phorus) have been estimated separately, it seems realistic (after Wetzel 1975) to estimate _L as a linear combination of A_CP and ZP
where k , is the proportion of dissolved phosphorus that becomes fixed to lake sediment, and k2 is the proportion of fixed phosphorus released from lake sediment.
Since _L is a random variable, the ranking of the alternative control actions j in this respect will be based o n a probability criterion ui such that ki is the smallest among all the alternatives. Let _ L I ,_Lz ,...,_L, be random values of the objective function pertaining t o alternatives I , 2 , . . . , n , with respective pdfs f , , f2 ,. .. , f,. Assuming that _L, ,_L2 ,. . .,_L, are statistically independent, the probability ui can be calculated as
with Cjui = 1 and j = 1,2, . . . ,n . Expression (4) can be calculated either numerically or by simulation. Also, there is
a direct way of estimating the probability ui from the simulation procedure: given a set of simulated values L , L, ,. . . ,L, , select the smallest; for a number N of simulation runs, let Ki be the number of times that Li is the smallest. Then, an estimate of the probability u .
I is Ki/N.
In the present case we are clearly dealing with a two-objective problem, composed of a eutrophication control objective Cfl) and an economic objective (f,).The eutrophica- tion control objective can be formulated mathematically as:
The economic output fZi, that is, costs for control actions A1, A3, AS, and A6, and revenue losses for control actions A2 and A4, can be estimated from input data (cost and loss functions) and is summarized in Table 5. The second objective is thus:
f, = min fZi ( j = 1 ,2 , ..., n) i
In principle, the economic objective f Z i should also be stochastic. The reason it is not also characterized by probability distributions is that the factors affecting cost are not readily described stochastically. Note that an alternative criterion for controlling non-point source pollution is equity among factors of different sizes (Miller and Gill 1976). Numer- ical model parameters for each of the various control alternatives are given in Table 7.
3.5 Trade-Off Analysis
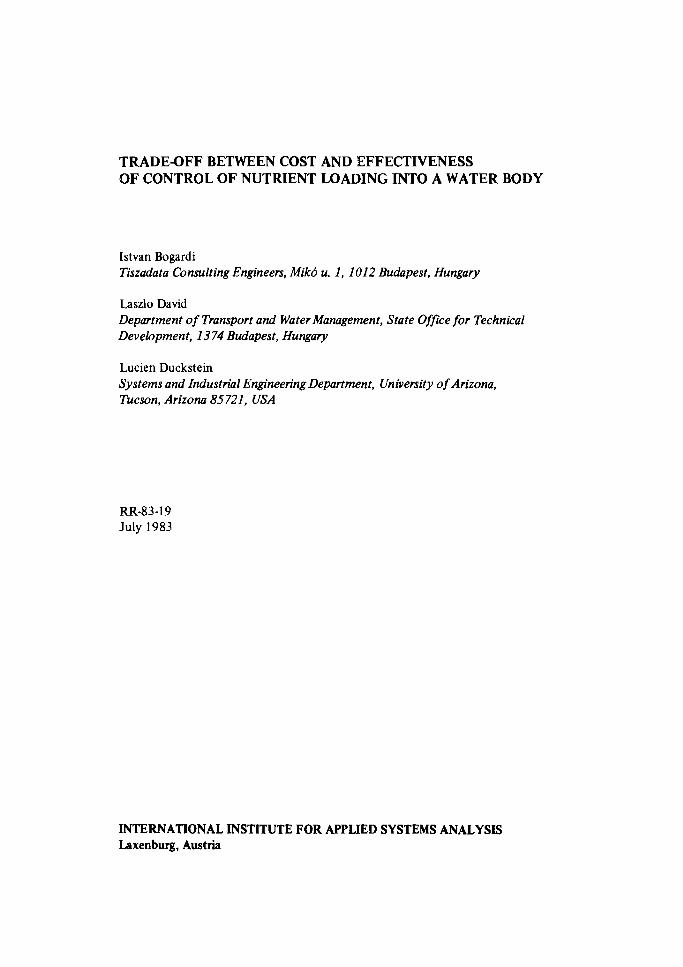
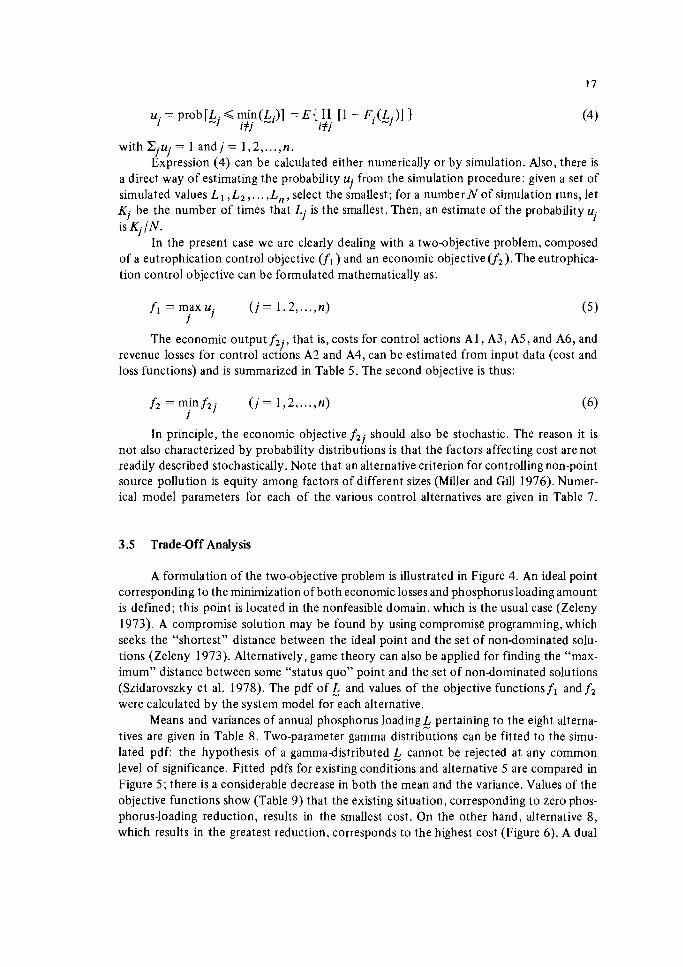
A formulation of the two-objective problem is illustrated in Figure 4. An ideal point corresponding to the minimization of both economic losses and phosphorus loading amount is defined; this point is located in the nonfeasible domain, which is the usual case (Zeleny 1973). A compromise solution may be found by using compromise programming, which seeks the "shortest" distance between the ideal point and the set of non-dominated solu- tions (Zeleny 1973). Alternatively, game theory can also be applied for finding the "max- imum" distance between some "status quo" point and the set of non-dominated solutions (Szidarovszky et al. 1978). The pdf of 4 and values of the objective functions fi and f, were calculated by the system model for each alternative.
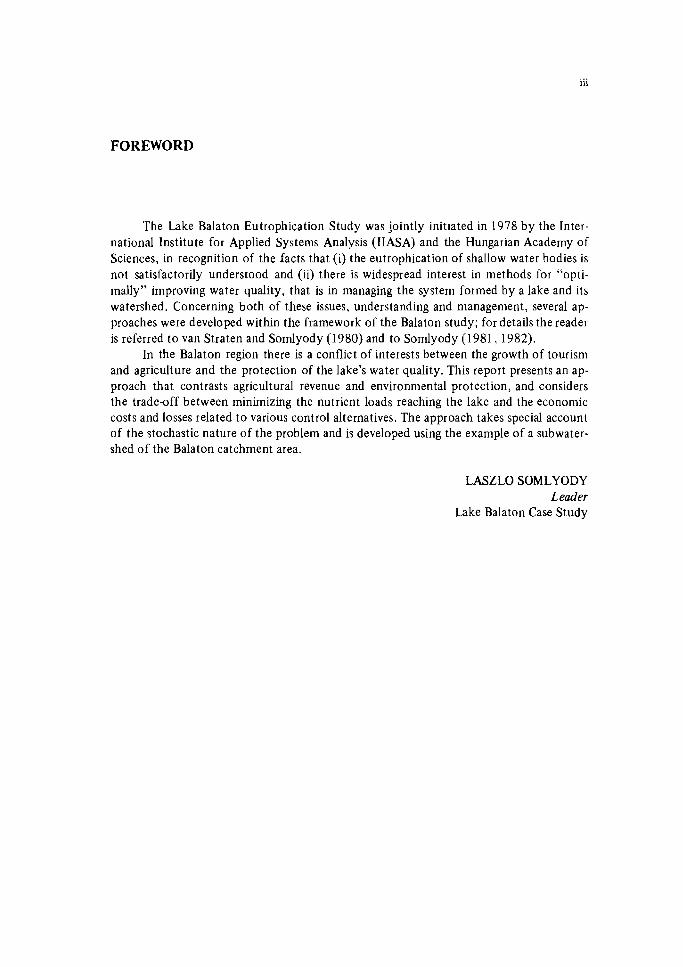
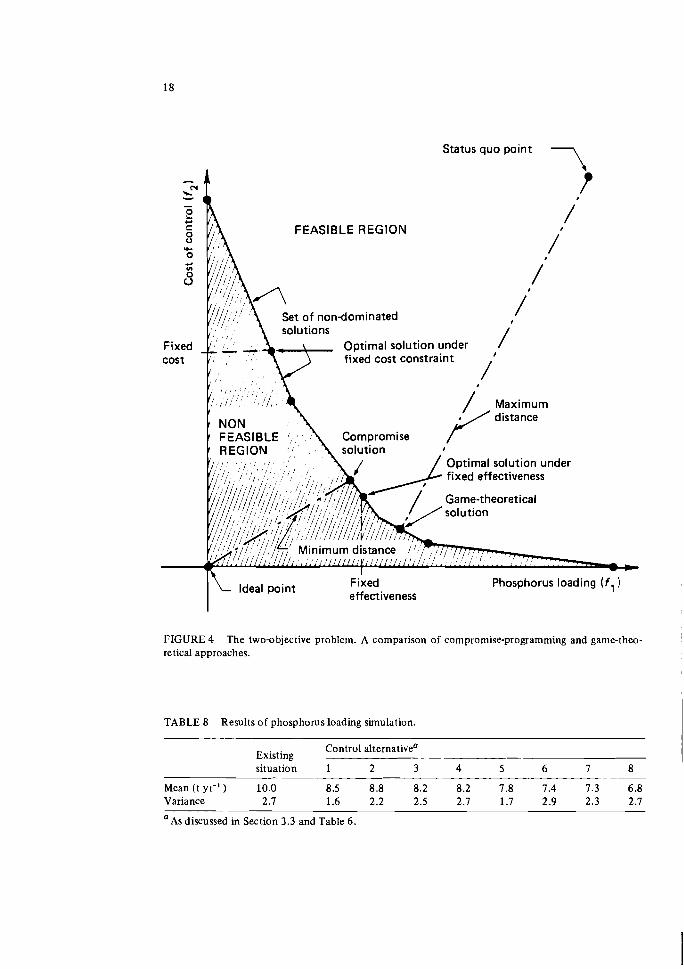
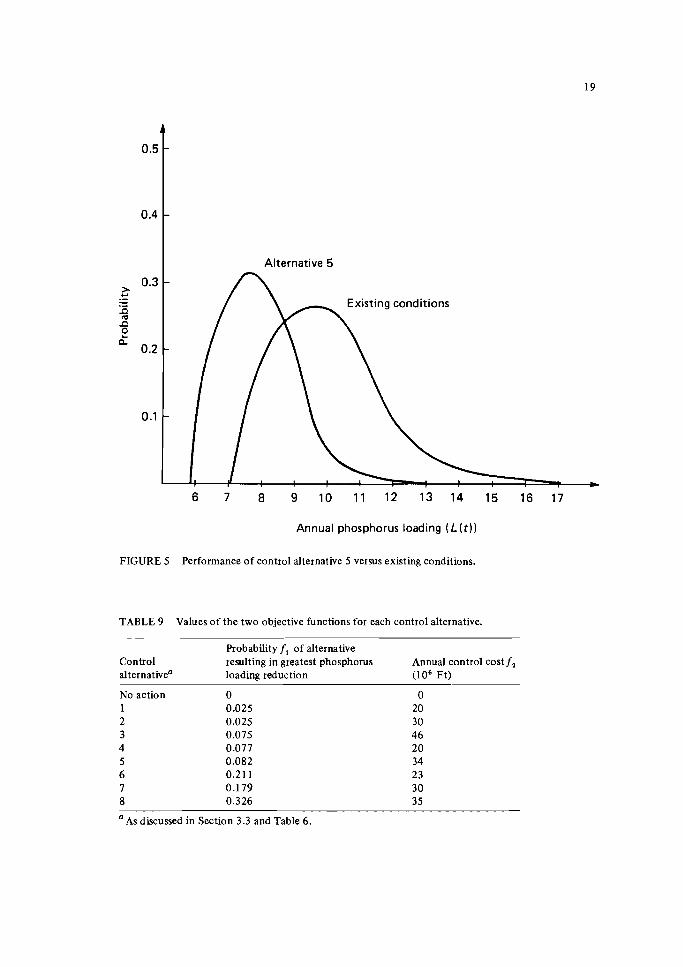
Means and variances of annual phosphorus loading 4 pertaining to the eight alterna- tives are given in Table 8. Two-parameter gamma distributions can be fitted to the simu- lated pdf: the hypothesis of a gammadistributed L cannot be rejected at any common level of significance. Fitted pdfs for existing conditions and alternative 5 are compared in Figure 5; there is a considerable decrease in both the mean and the variance. Values of the objective functions show (Table 9) that the existing situation, corresponding to zero phos- phorus-loading reduction, results in the smallest cost. On the other hand, alternative 8 , which results in the greatest reduction, corresponds to the highest cost (Figure 6). A dual
Status quo point 7
FEASIBLE REGlOlV
i f
Set of nondominated
Optimal solution under cost I ; , fixed cost constraint
Optimal solution under fixed effectiveness
Game-theoretical
I - - Ideal point Fixed Phosphorus loading ( f , )
effectiveness
FIGURE 4 The twoabjective problem. A comparison of compromise-programming and game-theo- retical approaches.
TABLE 8 Results of phosphorus loading simulation.
Control alternativea Existing situation 1 2 3 4 5 6 7 8
Meanityr-I) 10.0 8.5 8.8 8.2 8.2 7.8 7.4 7.3 6.8 Variance 2.7 1.6 2.2 2.5 2.7 1.7 2.9 2.3 2.7
'AS discussed in Section 3.3 and Table 6.
6 7 8 9 10 11 12 13 14 15 16 17
Annual phosphorus loading ( L ( t ) )
FIGURE 5 Performance of control alternative 5 versus existing conditions.
TABLE 9 Values of the two objective functions for each control alternative.
Probability f, of alternative Control resulting in greatest phosphorus Annual control cost f, alternativea loading reduction (lo6 Ft)
No action 0 0 1 0.025 20 2 0.025 30 3 0.075 46 4 0.077 20 5 0.082 34 6 0.21 1 2 3 7 0.179 30 8 0.326 35
a AS discussed in Section 3.3 and Table 6.
Annual phosphorus loading ( L ( t l )
FIGURE 6 Performance of control alternative 5 versus control alternative 8.
objective analysis may thus be applied t o find a t radeaf f between cost and pollution re- ductions. As mentioned in the Appendix, compromise programming has been selected for this purpose. The following objective function is minimized
where Mi and mi are, respectively, the maximum and minimum values o f & , n is the num- ber of objectives, ai is the weight or "importance" of the objective, and p is a parameter. As in Duckstein e t al. (1979), the linear weighting method is used, corresponding t o Cia , = 1 and p = 1. Three possible sets of weights are considered: environmental preference ( a l = 0 . 7 , ~ ~ = 0.3), agricultural preference ( a , = 0.3,CY2 = 0.7), and equal weighting ( a , = a, = 0.5). Compromise solutions referring to these preference structures are given in Table 10. The compromise solution, in the present application, is sensitive t o the prefer- ence structure. From a balanced environmental-economic viewpoint, which is a realistic approach, alternative 6 seems t o be a good compromise measure.
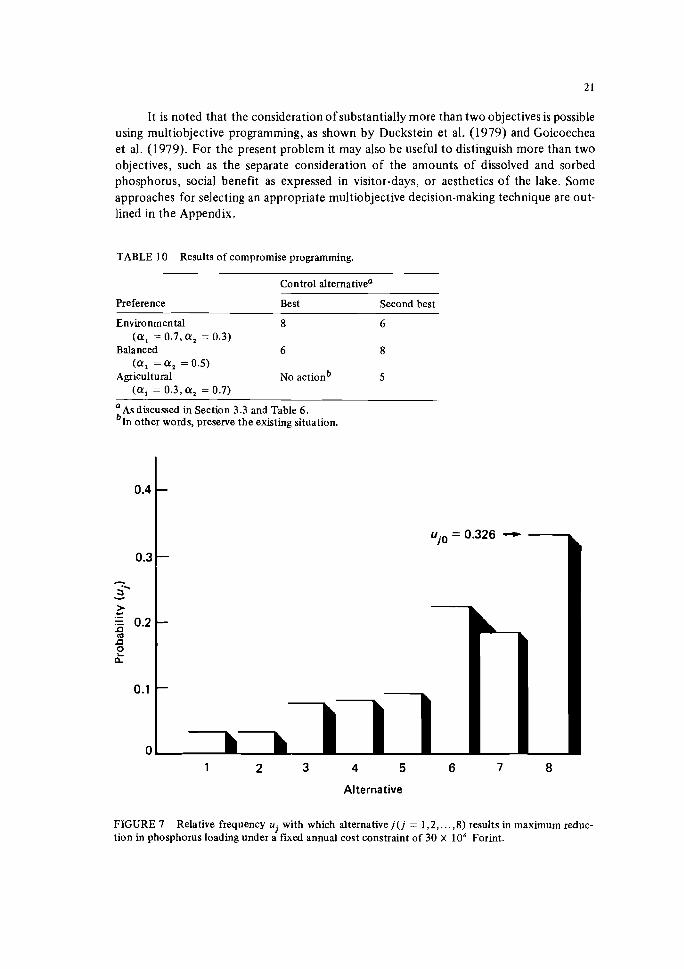
It is noted that the consideration of substantially more than two objectives is possible using multiobjective programming, as shown by Duckstein et al. (1979) and Goicoechea et al. ( I 979). For the present problem it may also be useful to distinguish more than two objectives, such as the separate consideration of the amounts of dissolved and sorbed phosphorus, social benefit as expressed in visitor-days, or aesthetics of the lake. Some approaches for selecting an appropriate multiobjective decision-making technique are out- lined in the Appendix.
TABLE 10 Results o f compromise programming.
Preference
Control alternativea
Best Second best
Environmental 8 6 (ff, = 0.7, f f , = 0.3)
Balanced 6 8 (ff, = ff , = 0.5)
Agricultural No actionb 5 (ff, = 0.3, ff, = 0.7)
a As discussed in Section 3.3 and Table 6. other words, preserve the existing situation.
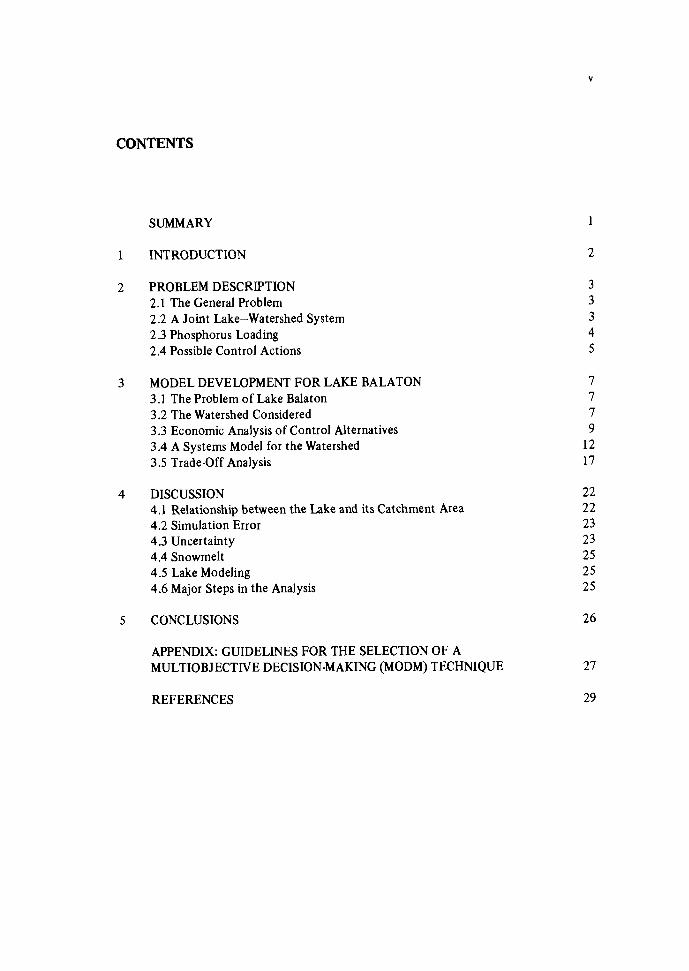
1 2 3 4 5 6 7 8
Alternative
FIGURE 7 Relative frequency u, with which alternative j ( j = 1,2, ..., 8) results in maximum reduc- tion in phosphorus loading under a fixed annual cost constraint of 30 x l o 6 Forint.
Note that the two classical questions:
- For a given budget allocated over a certain period, what is the most efficient way of controlling eutrophication?
- To reach a prescribed decrease of eutrophication likelihood, what are the most effective* actions?
correspond t o special cases of MODM analysis. In fact, one may fix one or more criteria or objective functions and seek the optimal value of the other objective functions under these new constraints (Figure 4). As an example, Figure 7 shows the ranking of alternatives under a fixed annual cost constraint of 3 0 X 106 Forints. It is believed, however, that the simultaneous consideration of all objectives may lead the decision maker t o a better trade- off or "satisfactum", as pointed out by Cohon (1978), Wierzbicki (1979),and Goicoechea e t al. (1982).
4 DISCUSSION
In this section we discuss several factors that must be considered when transferring the model t o other areas, identify various limitations of the present model in order t o provide guidelines for future research, and summarize the main methodological steps.
4.1 ReIationship between the Lake and its Catchment Area
As shown in Figure 3, annual spatial totals of dissolved and sediment phosphorus are calculated in the stochastic model. Depending on the relationship between the lake and its catchment area, three cases can be distinguished:
a. A single watershed feeds the whole lake, as is often the case for storage reser- voirs. The stochastic model shown in Figure 3 can be applied directly t o small watersheds, say those with an area of less than 3 5 0 k m 2 . In the case of a larger watershed, such as the Zala watershed (WSl) of Lake Balaton (see Figure 2), the model is run for each subwatershed, and estimates of the sediment delivery ratio (Williams 1977, Wade and Heady 1978, Meta Systems Inc. 1978) or sedi- ment routing (Novotny et al. 1978) may be used t o calculate the phosphorus loading at the outlet of the whole watershed.
b. One or more watersheds feed into a given portion of the lake, which is homoge- nous as far as the eutrophication phenomenon is concerned; for large natural lakes such as Balaton this is a frequent situation. Now L , and L 2 in Figure 3 denote the spatial sums of the contributions of every watershed. These sums are calculated taking due account of the interdependence between rainfall events over the watersheds. If mixing between various parts of the lake is weak, the control problem can be solved separately for each portion, starting with the area of the lake for which eutrophication is most severe.
c. Good mixing can be assumed for the whole lake, so that the individual loadings from all the watersheds can be added up.
*The effectiveness measure may be, for example, a cost function to be minimized.
If neither weak nor good mixing between the parts of the lake can be assumed a hydrodynamic mixing model, such as those developed by Somlyody (1979) or Raggio and Hutter (1980), becomes necessary, although the use of such a model in conjunction with a stochastic loading model poses considerable methodological difficulties.
Some may question whether a system model is required at all if directly observed data on phosphorus loadings are available to estimate the pdfs; and if the goal is merely to evaluate the existing situation, without prediction or decision analysis, there is certainly no need to use a model. In most real cases (e.g., that of Lake Balaton), however, decisions must be made on how to control future eutrophication, and therefore forecasting and eval- uation of future phosphorus loadings corresponding to various control alternatives must be undertaken.
4.2 Simulation Error
It may happen that, as in our example, the phosphorus loading values estimated for various control measures are quite close to each other. Therefore, before the results are interpreted, one should check whether or not the differences are greater than the random error of stochastic simulation. For example, an error bound E on the mean may be esti- mated (Szidarovszky 1974) as
where I* is the standard deviation of simulated elements, Po is a selected level of probabil- ity, N is the number of simulated elements, and 4 [ - I is the standard normal distribution function.
For the Balaton case study, N = 500 elements; in other words, 500 loading events were simulated. Given that I* = 1.65 for the existing phosphorus loading conditions, the error bound is, with a probability Po = 0.90
This bound on the mean is not larger than the differences exhibited in Table 8. Fur- ther details of the simulation can be found in Duckstein et al. (1978).
4.3 Uncertainty
From the previous sections, it is clear that if our model adequately describes reality in the watershed studied, the compromise programming method provides a useful way to trade off economic and environmental costs. However, as always, the results of the analy- sis may deviate from the unknown "true" results because of the effects of three kinds of uncertainty: natural, parameter, and model uncertainty.
4.3.1 Natural Uncertainty Natural uncertainty stems from the fact that nutrient loading is triggered by random
natural events, such as storms. The use of the stochastic model fully accounts for natural uncertainty.
4.3.2 Parameter Uncertainty Parameter or sample uncertainty originates from the generally limited statistical
information available for estimating the parameters 8_L1 and eLz of the probability den- sity functions of _L, and L z . This uncertainty can be accounted for by considering these statistical parameters as random variables with respective pdfs p ( a l ) and p ( Q 2 ) . Natu- ral and sample uncertainty can then be considered jointly by using Bayesian distributions (Benjamin and Cornell 1970)
for h1 and a similar distribution for h2. Concerning parameter uncertainty in the estimation of the pdfs for concentrations
c1 and:,, two cases can be distinguished: - (i) No observed data on concentrations are available. This is the situation we face in
the present example. As shown earlier, models are available to estimate the mean values of c and:,, and the variances of; and:, can also be obtained. In a Bayesian framework, - these statistics permit the construction of two-parameter prior distributions of statisti- cal parameters of and _cz ; Bayesian distributions can then be estimated by simulation (Szidarovszky et al. 1976).
(ii) Some observed data are available on c l and:, . These data-based estimates can be generated by Iikelhood functions l(xlf) , where x is the data set. Prior and data-based information can then be combined by means of Bayes' rule to obtain posterior estimates.
4.3.3 Model Uncertainty Model uncertainty is present in several parts of the methodology; some of the more
important sources are as follows:
- procedures for the estimation of runoff, sediment yield, and concentration;* - selection of the type of pdf for phosphorus loading; - consideration of a finite - and often small - number of control alternatives; - number and type of criteria used to characterize the objectives of watershed
activity and eutrophication control; - failure to take into account the dynamic nature of decision making or transient
effects following the implementation of control measures;** - choice of MODM technique.
Model uncertainty can cause considerable distortion of the results. No general "cure" is available, but three approaches for minimizing the difficulties may be mentioned. First, sensitivity analysis can be used to ascertain the effects of important sources of model un- certainty. Second, the methodology can be developed in the direction of more sophisticated
*It is known that the connection between rainfall, runoff, sediment, and phosphorus loading is very complex and difficult to model. We have used here the universal soil loss equation modified for ap- plication to short-term events as in Smith et al. (1977), but the main principles of our approach would still be applicable if a more sophisticated sediment yield model were used.
**For example, contour farming techniques yield long-term benefits to the farmers in terms of reduc- tion or elimination of topsoil losses. Accounting for the costs of contouring without including the benefits of topsoil conservation would be valid only for short- or at most medium-term planning.
models, such as the one for runoff estimation. Thud, observed data can be used to calibrate various submodels such as those for runoff, sediment, and phosphorus concentrations.
Snowmelt runoff may release substantial quantities of dissolved phosphorus from crop residues left on the surface of the soil after the fall harvest (Timmons et al. 1970, Meta Systems Inc. 1978). since this dissolved phosphorus may not be in equilibrium with frozen surface soils, the relationships between c2 and cl generally used may not hold. The tillage method used has a critical impact on phosphorus loading in snowmelt; methods not involving plowing tend to leave crop residues on the surface and thus create a greater potential for snowmelt phosphorus loading. A relatively simple relationship is available to estimate average annual snowmelt phosphorus loading (Meta Systems Inc. 1978); also sto- chastic models of snowmelt (Cary et al. 1977) can be used within the event-based frame- work of phosphorus loading. These two approaches can be coupled, leading to a simulation of loading per snowmelt event; the inclusion of snowmelt phosphorus loading in the control model is then straightforward.
4.5 Lake Modeling
It is assumed in our example that phosphorus loading, as described in eqn. (3), ade- quately characterizes the trophic state of the lake. Coefficients kl and k2 (in eqn. 3) can be estimated with the same precision as other parameters of a limnological model, that is, with at least 10% error. The sensitivity of the objective functions f1 and fi to these coef- ficients should be investigated further. In reality, there are a great number of other physi- cal and chemical variables, such as nitrate concentrations, lake sediment, light, and tem- perature, affecting primary algal production. Detailed simulation models are available to describe the eutrophication process in a water body (for example lmboden and Gachter 1975, Herodek and Csaki 1980). These are, however, difficult to use for forecasting and/ or control, since many model parameters are unknown, while nonstationarity of the lake makes calibration impossible; furthermore, a number of the input variables or parameters may be stochastic. To cope with these difficulties, several semiempirical lake models have been developed. One of the simplest of these (Vollenweider 1968) forms the basis of our example. We believe, however, that further progress is possible in the direction of stochastic control models based on more sophisticated lake representations, such as those proposed by Schlinder et al. (1978), Walker (1979), and Reckhow and Chapra (1979).
4.6 Major Steps in the Analysis
We provide here a step-by-step summary of the methodology in order to facilitate future real-life applications:
a. Evaluate present and expected future socioeconomic activities in the area of the watershed.
Evaluate the main environmental problems affecting the water body. Select appropriate indicators, criteria, or measures of effectiveness for socio- economic activities (benefits, costs, population, energy requirements, etc.) and environmental problems (pollution loading, trophic index, primary algal pro- duction, etc.). Select possible control actions considering the pollution sources, the transport process, and the water body itself. Both structural and nonstructural measures should be taken into account. Derive relationships between socioeconomic activities, possible control measures, and environmental problems o n the basis of the criteria selected in step (c). Define the elements (input, state, state transition, output , output function) of the system model (see Section 3.1). Select a suitable MODM technique using the "elimination" procedure recom- mended in the Appendix. Find the solution t o the problem. Evaluate the results by considering uncertainties (see Section 4.3), using sensi- tivity analysis and analysis of observed data.
Note that several feedbacks or iterations may be necessary between various steps, for example between MODM selection (g) and criteria selection (c), or between steps (i) and (d).
5 CONCLUSIONS
The t radeaf f between the environmental protection of a water body and the eco- nomic interests such as agriculture in the area of the associated watershed can be usefully considered within a multiobjective decision-making framework. In the example studied, two objectives, each composed of several criteria, have been considered, namely the re- duction of dissolved and sediment phosphorus loading and the costs and economic losses connected with proposed control measures. For situations involving multiple objectives, MODM techniques are briefly reviewed in the Appendix.
Stochastic modeling is necessary for eutrophication control planning, especially if both point and non-point sources contribute t o nutrient loading. The stochastic model for phosphorus loading estimation described here can be incorporated into a decision model in order t o identify the most effective control alternative. The model can also be used for other nutrients and for heavy metal pollutants.
Both structural (tertiary treatment, runoff regulation, sediment trapping) and non- structural measures (fertilizer control, land-use change) have been considered in designing a finite number of realistic control alternatives. To account for the stochastic character o f phosphorus loading, we have used the relative frequency u, with which alternative j results in the greatest reduction in loading as our measure of control effectiveness. Finally, under case study conditions, the combined control measure consisting of storage, sediment silt- ing, and tertiary treatment seems to represent the best compromise.
ACKNOWLEDGMENTS
The research leading t o this report was mostly carried out during short-term visits of the authors t o the International Institute for Applied Systems Analysis, where the en- couragement and useful advice of Oleg Vasiliev, Janusz Kindler, and Laszlo Somlyody was highly appreciated. Partial support from the US National Science Foundation under grant INT 78-1 2 184, from the Hungarian IIASA Committee, and from the team of SZTAKI sci- entists led by A. Prekopa, is gratefully acknowledged. The simulation algorithm was de- veloped and run with the help of Jim Kempf, whose biosystem knowledge has been a precious asset throughout the research.
APPENDIX: GUIDELINES FOR THE SELECTION O F A MULTIOBJECTIVE DECISION-MAKING (MODM) TECHNIQUE
Arrays of Systems versus Criteria
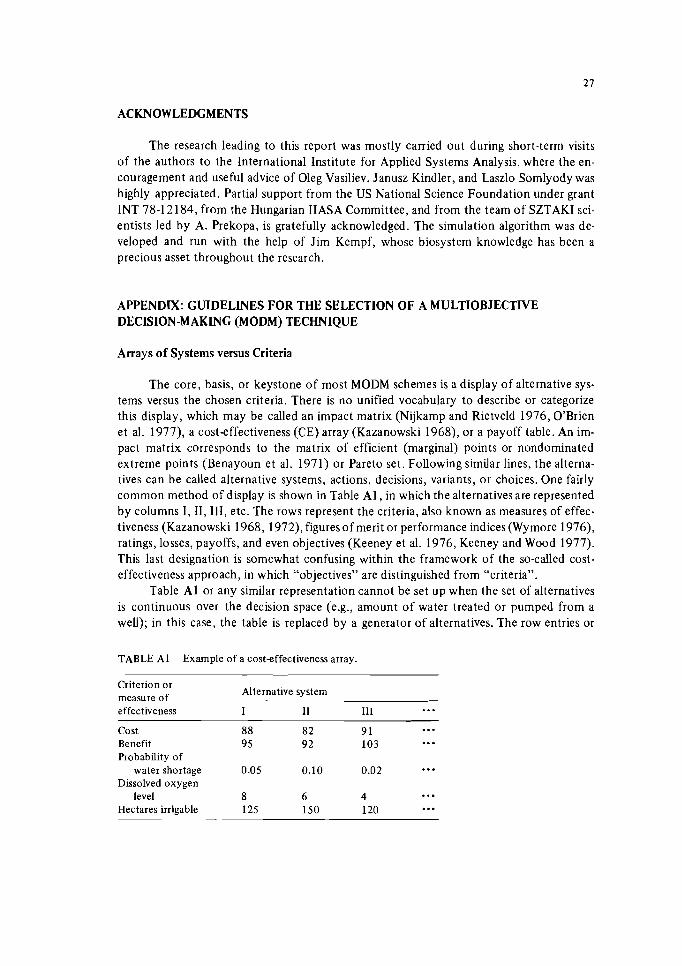
The core, basis, or keystone of most MODM schemes is a display of alternative sys- tems versus the chosen criteria. There is no unified vocabulary t o describe or categorize this display, which may be called an impact matrix (Nijkamp and Rietveld 1976, O'Brien et al. 1977), a cost-effectiveness (CE) array (Kazanowski 1968), or a payoff table. An im- pact matrix corresponds t o the matrix of efficient (marginal) points or nondominated extreme points (Benayoun et al. 1971) or Pareto set. Following similar lines, the alterna- tives can be called alternative systems, actions, decisions, variants, or choices. One fairly common method of display is shown in Table A l , in which the alternatives are represented by columns I, 11,111, etc. The rows represent the criteria, also known as measures of effec- tiveness (Kazanowski 1968, 1972), figures of merit or performance indices (Wymore 1976), ratings, losses, payoffs, and even objectives (Keeney et al. 1976, Keeney and Wood 1977). This last designation is somewhat confusing within the framework of the so-called cost- effectiveness approach, in which "objectives" are distinguished from "criteria".
Table A1 or any similar representation cannot be set u p when the set of alternatives is continuous over the decision space (e.g., amount of water treated or pumped from a well); in this case, the table is replaced by a generator of alternatives. The row entries or
TABLE A1 Example of a cost-effectiveness array.
Criterion or Alternative system measure of
effectiveness 1 11 111 . . . Cost 88 82 9 1 . . . Benefit 95 9 2 103 ... Probability of
water shortage 0.05 0.10 0.02 ... Dissolved oxygen
level 8 6 4 . . . Hectares irrigable 125 150 120 . . .
criteria define the decision space to be used for MODM between these alternatives. Note that various measures of uncertainty, such as probability of water shortage, may them- selves be used as criteria.
If it is accepted that something similar to Table A1 or, equivalently, a generator of alternatives is the core or centerpiece of MODM, then we can move to the selection of a specific approach, as described next.
Selection of an MODM Approach
There is a huge body of recent literature in which MODM methods are presented, reviewed, and classified. For example, classifications of MODM methods are found in Roy (1971), MacCrimmon (1973), Cohon and Marks (1975), Goicoechea (1977), Starr and Zeleny (1977), and Cohon (1978), and elsewhere. However, such taxonomies of MODM methods run into difficulties because of the combinatorial nature of the task. Any dichotomous classification with n categories - discrete or continuous state or decision variable, deterministic or stochastic, single or multiple period, prior articulation of prefer- ences or interactive, etc. - will yield 2" categories. Furthermore, hardly any method will fit exactly in one category; for example, most methods can be made interactive.
Our advice here is to ask questions about the desiderata and capabilities of the deci- sion maker on the one hand, and about the nature of the problem (including availability of resources and data) on the other, and then to match the answers to the two setsof ques- tions. By the end of this procedure the number of remaining applicable MODM approaches is generally very small.
It is useful to begin with two questions concerning the decision maker: What are the decision makerS desiderata? The decision maker may wish to be presented with a single "best" system; in this
case a method that collapses all the objectives into a single index, such as multiattribute utility theory (MAUT) (Keeney and Raiffa 1976), one that always leads to complete order- ing, such as ELECTRE I1 (Duckstein and Gershon 1981), or cooperative game theory with a given starting or "status quo" point (Szidarovszky et al. 1978) are possible contenders. Alternatively, he may require a decision-making aid that reduces the choice set; ELECTRE I (Benayoun et al. 1966) can be used for discrete systems and compromise programming (CP) (Zeleny 1973) for continuous ones.
Another possible response is that the decision maker wants to participate actively in the decision-making process, in which case interactive methods such as SEMOPS (Monarchi et al. 1973) or TRADE (Goicoechea et al. 1976) can be used. Finally, he may wish to introduce the effects of uncertainty. Statistical or economic uncertainty can be incorpo- rated in one or more criteria (Duckstein 1978), and for continuous problems it is possible to introduce uncertainty into multiobjective linear programs (Sengupta et al. 1973, Goicoechea et al. 1979).
What are the decision maker's capabilities? As pointed out by Lettermaier and Burges (1978), real-life decision makers may not
always have a strong theoretical background, and they are unlikely to have much time available for interaction with analysts, computers, or models. It is thus important not to choose overly complicated models that require the decision maker to possess sophisticated
analytical knowledge and to spend much of his time in calibration. This latter point is discussed in some detail in Major (1977), Krzysztofowicz el al. (1977), Cohon and Marks (1977), and Cohon (1978).
Turning now to the problem itself, two broad questions suggest themselves: Are there qualitative criteria involved that should preferably not be quantified? If the answer is yes, this eliminates all multiobjective programming approaches, such
as surrogate worth tradeaff (SWT) (Hairnes et al. 1975), STEM (Benayoun et al. 1971), SEMOPS (Monarchi et al. 1973), TRADE (Goicoechea 1977), MAUT, PROTRADE, co- operative game theory, goal and compromise programming, the iterative algorithm of Neuman and Krzysztofowicz (1977) or the approach developed by Wierzbicki (1980). On the other hand, it would indicate methods such as metagame theory (Hipel et al. 1974, 1976, Ragade et al. 1976a, 1976b), ELECTRE I, 11, and 111 (Roy 1977), and concordance analysis (Nijkamp and Rietveld 1976).
If all criteria can be quantified, are the alternative systems defined in a discrete or continuous mode?
If a finite set of distinct alternatives is used, then again most multiobjective pro- gramming methods are ruled out. On the other hand, the use of goal and compromise programming, cooperative game theory, MAUT, or ELECTRE may well be indicated. For example, ELECTRE I has been used as a decision-making aid for problems with quantita- tive and qualitative criteria and discrete alternatives by David and Duckstein (1976) and Gershon et al. (1 980).
REFERENCES
Armstrong, D.E. and Weimer, W.C. (1973). Storage and cycling of pollutants in water bodies. Trans- actions of the American Society of Civil Engineers, Paper No. 71-748:573-577.
Benayoun, R., Roy, B., and Sussmann, B. (1966). ELECTRE: Une Methode Pour Guider le Choix en Presence de Points de Vue Multiples. Note de Travail No. 49. Direction Scientifique, SEMA, Paris.
Benayoun, R., de Montgolfier, J., Tergny, I., and Laritchev, 0. (1971). Linear programming with mul- tiple objective functions: step method (STEM). Mathematical Programming, l(3): 366-375.
Benjamin, J.R. and Cornell, C.A. (1970). Probability, Statistics and Decision for Civil Engineers. McGraw-Hill, New York.
Bogardi, I. and Duckstein, L. (1978a). Input for a stochastic control model of P loading. Ecological Modelling, 4:173-195.
Bogardi, I. and Duckstein, L. (1978b). A Stochastic Model of Phosphorus Loading from Non-point Sources. RM-78-33. International Institute for Applied Systems Analysis, Laxenburg, Austria.
Bogardi, I., Duckstein, L., and Szidarovszky, F. (1978). Multiobjective modeling for regional natural resources management. In: Proceedings of the Task Force Meeting on the Notec Regional De- velopment Project, Jablonna, Poland, September.
Booth, T.L. (1967). Sequential Machines and Automata Theory. Wiley, New York. Brune, G.M. (1953). Trap efficiency of reservoirs. EOS: Transactions of the American Geophysical
Union, 34(3):607-618. Cary, L., Fogel, M., and Duckstein, L. (1977). Snow accumulation and ablation: a stochastic model.
In: Proceedings of the International Hydrology Symposium, 3rd, Colorado State University, Fort Collins, Colorado, 27-29 June.
Chow, V. (Ed.) (1964). Handbook of Applied Hydrology. McGraw-Hill, New York. Cohon, J. (1978). Multiobjective Programming and Planning. Academic Press, New York.
Cohon, J. and Marks, D. (1975). A review and evaluation of multiobjective programming techniques. Water Resources Research, 1 l(2): 208-220.
Cohon, J . and Marks, D. (1977). Reply. Water Resources Research, 13(3). Das, P. and Haimes, Y.Y. (1979). Multiobjective optimization in water quality and land management.
Water Resources Research, 15(6): 131 3-1322. David, L. (1978). System development o f water resources and water quality control. Modelling of
water quality of the hydrological cycle. In: Proceedings of the IAHS-IIASA Symposium, Baden, September. IAHS Publication No. 125, pp. 262-268.
David, L. (1979). Watershed development approach to control the eutrophication of shallow lakes. In: Proceedings of the International Conference o n Environmental Management of Agricultural Watersheds, Smolenice, Czechoslovakia, April.
David, L. and Duckstein, L. (1976). Multi-criterion ranking of alternative long-range water resource systems. Water Resources Bulletin, 12(3):731-754.
David, L., Telegdi, L., and van Straten, G. (1979). A Watershed Development Approach to the Eutro- phication Problem of Lake Balaton. CP-79-16. lnternational Institute for Applied Systems Analysis, Laxenburg, Austria.
Duckstein, L. (1978). Imbedding uncertainties into multiobjective decision models in water resources. In: Proceedings of the lnternational Symposium o n Risk and Reliability in Water Resources, University of Waterloo, Ontario, 26-28 June, pp. 3-30.
Duckstein, L. and Bogardi, 1. (1978). Uncertainties in lake management. In: Proceedings of the Inter- national Symposium on Risk and Reliability in Water Resources, university of Waterloo, Ontario, 26-28 June, pp. 638-661.
Duckstein, L. and Gershon, M. (1981). Multiobjective Analysis of a Vegetation Management Problem Using ELECTRE 11. Working Paper No. 81-1 1. Department of Systems and Industrial Engineer- ing, University of Arizona, Tucson, Arizona.
Duckstein, L. and Simpson, E. (1976). Uncertainties in karstic water resources systems. In: Proceed- ings of the US-Yugoslavian Symposium, Dubrovnik, June 1975. Water Resources Publications, Fort Collins, Colorado, June 1976, pp. 22-1-22-24.
Duckstein, L., Bogardi, I., and Fogel, M. (1978). An event-based stochastic model of phosphorus load- ing into a lake. Advances in Water Resources, 1(6):321-329.
Duckstein, L., Bogardi, l., and Szidarovszky, F. (1979). Trade-off between regional mining develop- ment and environmental impact. In: Proceedings of the lnternational Symposium o n Application of Computers and Operations Research in the Mineral Industry, 16th, SME/AIME Fall Meeting, Tucson, Arizona, pp. 355-364.
Felfoldy, L. and Toth, L. (1970). The effect of agricultural chemicals on water resources. VIZDOK Report, Budapest. (In Hungarian.)
Gershon, M., McAniff, R., and Duckstein, L. (1980). A multi-objective approach to river basin plan- ning. In: Proceedings of the 1980 Meetings of the AWRA (AZ Section) and the AZ-Nevada Academy of Sciences (Hydrology Section), Las Vegas, Nevada, April.
Goicoechea, A. (1977). A multi-objective, stochastic programming model in watershed management. Unpublished Ph.D. Dissertation. Department of Systems and Industrial Engineering, University of Arizona, Tucson, Arizona.
Goicoechea, A., Duckstein, L., and Fogel, M. (1976). Multiobjectiveprogrammingin watershed manage- ment: a study of the Charleston watershed. Water Resources Research, 12(6):1085-1092.
Goicoechea, A., Duckstein, L., and Fogel, M. (1979). Multiple objectives under uncertainty: a n illus- trative application of PROTRADE. Water Resources Research, 15(2):203-210.
Goicoechea, A., Hansen, D.R., and Duckstein, L. (1982). Multiobjective Decision Analysis with Engi- neering and Business Applications. Wiley, New York.
Golubev, G., Shvytov, l., and Vasiliev, 0. (1978). Environmental Problems of Agriculture, I. Water- Related Environmental Impact of Agriculture a t the Field Level. RM-78-32. International Insti- tute for Applied Systems Analysis, Laxenburg, Austria.
Haimes, Y., Hall, W., and Freedman, H. (1975). Multiobjective Optimization in Water Resources Sys- tems: The Surrogate Worth Trade-off Methods. Elsevier, Amsterdam.
Herodek, S. and Csaki, P. (1980). The BEM modeling approach, 1: ecological aspects of the Lake Balaton eutrophication model. In: Proceedings of the Joint MTA-IIASA Task Force Meeting o n Lake Balaton Modeling, 2nd, Veszprem, Hungary, pp. 8 1 - 102.
Herodek, S. and Tamas, G. (1975a). Phytoplankton production in Lake Balaton. Symposia Biologica Hungarica, 15:29-34.
Herodek, S. and Tamas, G. (1975b). The primary production of phytoplankton in the Keszthely Basin of Lake Balaton in 1973-74. Annales Instituti Biologici (Tihany) Hungaricae Academiae Scien- tarum, 42:175-190.
Hipel, K., Ragade, R., and Unny, T. (1974). Metagame analysis of water resources conflicts. Journal of the Hydraulics Division, American Society of Civil Engineers, 100 (HY10, Proceedings Paper 1P861): 1437-1455.
Hipel, K., Ragade, R., and Unny, T. (1976). Political resolution of environmental conflicts. Water Re- sources Bulletin, 12(3):813-827.
Holt, R.F., Timmons, D.R., and Latterell, J.J. (1970). Accumulation of phosphates in water. Journal of Agricultural and Food Chemistry, 18(5):781-784.
Horne, A.J. (1975). Nitrogen fixation - a review of this phenomenon as a polluting process. In: Pro- ceedings of the Conference on Nitrogen as a Water Pollutant, International Association of Water Resources, Copenhagen.
Imboden, D.M. and Gachter, R. (1975). Modelling and control of lake eutrophication. Preprint, IFAC Triannual World Congress, 6th, Boston, Massachusetts.
Jolankai, G. (1975). lnvestigation of Non-Point Pollution of Lake Balaton. Report from the Research Institute for Water Resources, VITUKI, Budapest. (In Hungarian.)
JQrgensen, S.E. (1976). A eutrophication model for a lake. Ecological Modelling, 2:147-165. Kazanowski, A.D. (1968). A standardized approach to cost-effectiveness evaluation. In: J. English
(Ed.), Cost-Effectiveness: The Economic Evaluation of Engineered Systems. Wiley, New York, pp. 113-150.
Kazanowski, A.D. (1972). Treatment of some of the uncertainties encountered in the conduct of hy- drologic cost-effectiveness evaluation. In: Proceedings of the International Symposium on Un- certainties in Hydrologic and Water Resource Systems, Tucson, Arizona, pp. 771-785.
Keeney, R.L. and Raiffa, H. (1976). Decisions with Multiple Objectives: Preferences and Value Trade- offs. Wiley, New York.
Keeney, R.L. and Wood, E.F. (1977). An illustrative example of the useofmultiattributeutility theory for water resource planning. Water Resources Research, 13(4): 705-7 12.
Keeney, R.L., Wood, E.F., David, L., and Csontos, K. (1976). Evaluating Tisza River Basin Develop- ment Plans Using Multiattribute Utility Theory. CP-76-3. International Institute for Applied Systems Analysis, Laxenburg, Austria.
Kempf, J., Leonhard, L., Fogel, M., and Duckstein, L. (1978). Water quality of runoff from surface mined lands in Northern Arizona. Hydrology and Water Resources in Arizona and the South- west, Vol. 8. In: Proceedings of the 1978 Meetings of the AWRA (Arizona Section) and the AZ- Nevada Academy of Sciences (Hydrology Section), Flagstaff, Arizona, 14-15 April.
Kovacs, M. (Ed.) (1977). Biological Bases of Environmental Control. Mezaqazdasadi Kiado, Budapest. (In Hungarian.)
Krzysztofowicz, R., Castano, E., and Fike, R. (1977). Comment on 'A review and evaluation of multi- objective programming techniques' by Jared L. Cohon and David H. Marks. Water Resources Research, 13(3):690-692.
Lettermaier, D.P. and Burges, S.J. (1978). A nonparametric approach to the analysis of extreme hy- drologic events. In: Proceedings of the International Symposium on Risk and Reliability in Water Resources, University of Waterloo, Ontario, 26-28 June, pp. 799-818.
MacCrimmon, K.R. (1973). An overview of multiple objective decision making. In: J. Cochrane and M. Zeleny (Eds.), Multiple Criteria Decision Making. University of South Carolina Press, Columbia, South Carolina, pp. 18-44.
Major, D. (1977). Multi-Objective Water Resource Planning, Vol. 4. Water Resources Monograph Series, American Geophysical Union, Washington, D.C.
March, J.G. and Simon, H.A. (1958). Organizations. Wley, New York. Meta Systems Inc. (1978). Water Quality Impact and Socio-Economic Aspects of Reducing Nonpoint
Source Pollution from Agriculture. Draft Report and Appendices, R 8050 3641-1. US Environ- mental Protection Agency, Athens, Georgia.
Miller, W.L. and Byers, D.M. (1973). Development and display of multiple objective project impacts. Water Resources Research, 9(1): 11-20.
Miller, W.L. and Gill, J.H. (1976). Equity considerations in controlling non-point pollution from agri- cultural sources. Water Resources Bulletin, 12(2):253-261.
Monarchi, D., Kisiel, C., and Duckstein, L. (1973). Interactive multi-objective programming in water resources: a case study. Water Resources Research, 9(4):837-850.
Murray, D. and Yakowitz, S. (1979). Constrained differential dynamic programmingand its application to multireservoir control. Water Resources Research, 15(5):1017-1027.
National Water Authority (1979). Water Management Development Program of Lake Balaton. Hungarian National Water Authority, Budapest. (In Hungarian.)
Neuman, S. and Krzysztofowicz, R. (1977). An iterative algorithm for interactive multiobjective pro- gramming. Advances in Water Resources, l(1): 1-14.
Nijkamp, P. and Rietveld, P. (1976). Multi-objective programming models: new ways in regional decision- making. Research Memo No. 43. Department of Economics, Free University, Amsterdam.
Novotny, V., Tran, H., Simsiman, G.V., and Chesters, G. (1978). Mathematical modeling of land runoff contaminated by phosphorus. Journal of the Water Pollution Control Federation, 50(1):101- 112.
O'Brien, W.T., Thornby, A.A., and Atkins, A.S. (1 977). Multiobjective Planning for Water Resources Management. Technical Paper No. 27. Australian Water Resources Council, Canberra, A.C.T.
Ragade, R.K., Hipel, K.W., and Unny, T.E. (1976a). Metarationality in benefit-cost analyses. Water Resources Research, 12(5): 1069-1076.
Ragade, R.K., Hipel, K.W., and Unny, T.E. (1976b). Nonquantitative methods in water resources man- agement. Journal of the Water Resources Planning and Management Division, American Society of Civil Engineers, 102 (WR2, Proceedings Paper 12565):297-309.
Raggio, G. and Hutter, K. (1980). A Kantorovich model for the wave motion of homogeneous lakes of elongated shape. Submitted to Journal of Fluid Mechanics.
Reckhow, K. (1979). The use of a simple model and uncertainty analysis in lake management. Water Resources Bulletin, 15(3):601-611.
Reckhow, K. and Chapra, S. (1979). A note on error analysis for a phosphorus retention model. Water Resources Research, 15(6): 1643-1646.
Rich, G.L. (1973). Environmental Systems Engineering. McGraw-Hill, New York. Romkens, M.J.M. and Nelson, D.W. (1974). Phosphorus relationships in runoff from fertilized soils.
Journal of Environmental Quality, 3(1):10-13. Roy, B. (1971). Problems and methods with multiple objective functions. Mathematical Programming,
1(2):239-268. Roy, B. (1977). A conceptual framework for a prescriptive theory of decision-aid. In: M.K. Starr and
M. Zeleny (Eds.), Multiple Criteria Decision Making. North-Holland, Amsterdam. Schlinder, D.W., Fee, E.J., and Ryszczynski, T. (1978). Phosphorus input and its consequences for
phytoplankton standing crop and production in the experimental lakes area and in similar lakes. Journal of the Fisheries Research Board of Canada, 135: 190- 196.
Sengupta, S.S., Podrebarac, M.L., and Fernando, T.D.H. (1973). Probabilities of optima in multi- objective linear programmes. In: J. Cochrane and M. Zeleny (Eds.), Multiple Criteria Decision Making. University of South Carolina Press, Columbia, South Carolina, pp. 217-235.
Serruya, C. and Serruya, S. (1975). A comprehensivelimnological modelling of LakeKinneret. Reprint, IFAC Triannual World Congress, 6th, Boston, Massachusetts.
Sharpley, A.N., Syers, J.K., and Tillman, R.W. (1978). An improved soil sampling procedure for the prediction of dissolved inorganic phosphate corlcentrations in surface runoff from pasture. Jour- nal of Environmental Quality, 7(3):455-456.
Smith, J., Davis, D., and Fogel, M. (1977). Determination of sediment yield by transferring rainfall data. Water Resources Bulletin, 13(3):529-541.
Soil Conservation Service (1972). Hydrology. National Engineering Handbook, US Department of Agri- culture, Washington, D.C.
Somlyody, L. (1979). Hydrodynamical Aspects of the Eutrophication Modelling in the Case of Lake Balaton. CP-79-1. International Institute for Applied Systems Analysis, Laxenburg, Austria.
Sornlyody, L. (1981). Modeling a Complex Environmental System: The Lake Balaton Case Study. WP-81-100. International Institute for Applied Systems Analysis, Laxenburg, Austria.
Somlyody, L. (1982). A Systems Approach to Eutrophication Management with Application to Lake Balaton. Paper presented at the International Conference on the State of the Art in Ecological Modeling, 3rd, Colorado State University, Fort Collins, Colorado, 24-28 May.
Starr, M.K. and Zeleny, M. (1977). MCDM - state and future of the art. In: M.K. Starr and M. Zeleny (Eds.), Multiple Criteria Decision Making. North-Holland, Amsterdam, pp. 5-29.
Szabo, J. (1979). Handbook of Agricultural Land Improvement. Mezogazdasagi Kiado, Budapest. (In Hungarian.)
Szidarovszky, F. (1974). An Introduction to Numerical Methods. Kozg. 6s Jogi Konyvkiado, Budapest. (In Hungarian.)
Szidarovszky, F., Yakowitz, S., and Krzysztofowicz, R. (1976). A Bayes approach for simulating sedi- ment yield. Journal of Hydrological Sciences, 3(1/2):33-45.
Szidarovszky, F., Bogardi, I., and Duckstein, L. (1978). Use of cooperative games in a multiobjective analysis of mining and environment. In: Proceedings of the International Conference on Applied Numerical Modeling, 2nd, Madrid, 11- 15 September.
Timmons, D.R., Burwell, R.E., and Holt, R.F. (1968). Loss of crop nutrients through runoff. Minne sota Science, 24:16-18.
Timmons, D.R., Holt, R.F., and Latterell, J.J. (1970). Leaching of crop residues as a source of nutrients in surface runoff water. Water Resources Research, 6(5):1367-1375.
Toth, L., Olah, J., and Toth, E. (1975). Phosphorus Cycle in Lake Balaton. Committee for Water Pro- tection (Lake Balaton), Budapest. (In Hungarian.)
van Straten, G. and Somlyody, L. (1980). Lake Balaton Eutrophication Study: Present Status and Future Program. WP-80-187. International Institute for Applied Systems Analysis, Laxenburg, Austria.
van Straten, G., Jolankai, G., and Herodek, S. (1979). Review and Evaluation of Research on the Eu- trophication of Lake Balaton - A Background Report for Modeling. CP-79-13. International Institute for Applied Systems Analysis, Laxenburg, Austria.
Vollenweider, R.A. (1968). Scientific Fundamentals of theEutrophication of Lakes and Flowing Waters with Particular Reference to Nitrogen and Phosphorus as Factors in Eutrophication. Technical Report DAS/SCI/63,27, p. 159. OECD, Paris.
Vollenweider, R.A. (1975). Input-output models with special reference to the phosphorus loading concept in limnology. Schweizerische Zeitschrift fk Hydrologie, 37:53-89.
Wade, L.C. and Heady, E.D. (1978). Measurement of sediment control impacts on agriculture. Water Resources Research, 14(1):1-8.
Walker, W.W. (1979). Use of hypolimnetic oxygen depletion rate as a trophic state index for lakes. Water Resources Research, 15(6): 1463- 1470.
Wetzel, R.G. (1975). Limnology. W.B. Saunders, London. Wierzbicki, A.P. (1979). A Methodological Guide to Multiobjective Optimization. WP-79-122. Inter-
national Institute for Applied Systems Analysis, Laxenburg, Austria. Wierzbicki, A.P. (1980). A Mathematical Basis for Satisficing Decision Making. WP-80-90. International
Institute for Applied Systems Analysis, Laxenburg, Austria. Williams, J.R. (1977). Sediment delivery ratios determined with sediment and runoff models. In: Pro-
ceedings of the IAHS-AISH Symposium, Paris. IAHS Publication No. 122. Wischmeier, W.H. and Smith, D.D. (1972). Predicting Rainfall Erosion Losses from Cropland East of
the Rocky Mountains. Agriculture Handbook No. 282. US Department of Agriculture, Washing- ton, D.C.
Wymore, A.W. (1976). Interdisciplinary Systems Engineering Methodology for Interdisciplinary Teams. Wiley-Interscience, New York.
Zeleny, M. (1973). Compromise programming. In: J.L. Cochrane and M. Zeleny (Eds.), Multiple Criteria Decision-Making. University of South Carolina Press, Columbia, South Carolina, pp. 262-301.

THE AUTHORS
Istvan Bogardi is Senior Scientist at TISZADATA Consulting Engineers, Mikd u. 1, 1012 Buda- pest, Hungary. His main area of interest is the use of applied systems analysis in natural resource management, and particularly the topics of risk and reliability and multicriteria decision making.
Laszlo David is Director of the Department of Transport and Water Management a t the State Office for Technical Development, Martinelli ter 8, Pf. 565,1374 Budapest, Hungary.
Lucien Duckstein is Professor of Systems and Industrial Engineering and Hydrology at the University of Arizona, Tucson, Arizona 85721, USA. He is currently engaged in teaching and research in decision theory, multiobjective decision making, and then applications in natural resource manage- inent. He has written numerous papers on these topics and is the coauthor of a recent textbook on multiobjective analysis.
36
RELATED IIASA PUBLICATIONS
Research Reports
Fedra, K. (1981). Mathematical Modeling - A Management Tool for Aquatic Ecosystems? RR-81-2 (available for a handling charge of $1.00). Reprinted from Helgoliinder Meeresuntersuchungen , vol. 34 (1 980).
Gouevsky, I.V. and Popchev, I.P. (1975). Man-Machine Procedure for Multiobjective Control in Water Resource Systems. RR-75-18 ($5.00).
Gouevsky, I.V., Maidment, D.R., and Sikorski, W. (1980). Agricultural Water Demands in the Silistra Region. RR-80-38 ($10.00).
Haith, D.A. (1982). Models for Analyzing Agricultural Non-Point Source Pollution. RR-82-17 ($5.00).
Hashirnoto, T., Loucks, D.P., and Stedinger, J.R. (1982). Reliability, Resiliency, Robust- ness, and Vulnerability Criteria for Water Resource Systems. RR-8240 (available for a handling charge of $1.00). Reprinted from Water Resources Research, vol. 18 (1981).
Collaborative Proceedings
Somlyody, L., Herodek, S., and Fischer, J. (Eds.) (1983). Eutrophication of Shallow Lakes: Modeling and Management. The Lake Balaton Case Study. CP-8333 ($16.00).
Zwirnmann, K.-H. (Ed.) (1982). Nonpoint Nitrate Pollution of Municipal Water Supply Sources: Issues of Analysis and Control. CP-82-S4 ($4.00).