Embed Size (px)
Citation preview
WORKING PAPER SERIES
Trade, Growth and Capital: A Case Study of Jamaica
Donald S. Allen
Michelle T. Gyles
Working Paper 1995-012B
http://research.stlouisfed.org/wp/1995/95-012.pdf
FEDERAL RESERVE BANK OF ST. LOUISResearch Division
411 Locust Street
St. Louis, MO 63102
______________________________________________________________________________________
The views expressed are those of the individual authors and do not necessarily reflect official positions of
the Federal Reserve Bank of St. Louis, the Federal Reserve System, or the Board of Governors.
Federal Reserve Bank of St. Louis Working Papers are preliminary materials circulated to stimulate
discussion and critical comment. References in publications to Federal Reserve Bank of St. Louis Working
Papers (other than an acknowledgment that the writer has had access to unpublished material) should be
cleared with the author or authors.
Photo courtesy of The Gateway Arch, St. Louis, MO. www.gatewayarch.com
TRADE, GROWTH AND CAPITAL: A CASE STUDY OF JAMAICA
September 1995
ABSTRACT
This is the first of two articles on the dynamics of the Jamaican economy over the last two and
a half decades. It compares the overall macroeconomy of Jamaica in the areas of output, fiscal
and monetary policy, capital formation and trade to that of Singapore and South Korea. The
conclusion from the aggregate data is that government spending in the second half of the 1970’s
and the first half of the 1980’s may have had a significant role in the inflationary episodes and
reduced capital formation during this period. The second article will delve deeper into the
details of the fiscal and monetary policies, domestic industrial and social policies and
international relationships in place during this period in order to focus more precisely on the
“micro” causes of or obstacles to growth.
KEYWORDS: Growth & Development, Fiscal Policy
JEL CLASSIFICATION: F43, 054
Donald S. AllenEconomistResearch DepartmentFederal Reserve Bank of St. Louis411 Locust StreetSt. Louis, MO 63102
Michelle T. GylesLegal AttacheEmbassy of Jamaica1520 New Hampshire Avenue, N.W.Washington, DC 20036
Acknowledgment: Tom Pollmann provided research assistance for this article
Trade, Growth and Capital: A Case Study of Jamaica
I. An Overview
Donald S. Allen*
Michelle T. Gyles**
Introduction
The post-Arab oil embargo period has been one of precipitous decline in living
standards for Jamaica. In the last two decades, Jamaica has moved from the forefront of
developing countries in most measures of living standards to join the laggards ofthe less
developed countries. A once enviable middle class has declined considerably. Nations like
Korea and Singapore, which were behind Jamaica in per capita income in the late 1960’s,
have exploded in growth to become symbols of industrialization during the same period. In
the early 1990’s, Jamaica has returned to a positive growth path and hopefully will recover
from the period decline.
What were the root causes ofthe decline in Jamaica’s economy? Can these causes
be identified and avoided in the future? The finger of blame can be pointed in many
directions - the political regimes are easy targets, impoverishment by oil prices, debt agony,
capital flight, immigrationlbrain drain are all potential factors. What is certain is that the
process is dynamic and has memory. The consequences ofdecisions made in the past are
still being felt today; decisions made today will have long lasting impact. An analysis of the
* Economist, Federal Reserve Bank of St. Louis.* * Legal Attaché, Embassy of Jamaica.
1
dynamics ofthe macroeconomy is a vital start to determine how to reverse the trend and
innoculate the country against future reversals through appropriate policies and institutions.
This is the first of two articles assessing the dynamic path ofgrowth in Jamaica over
the last two and a halfdecades. This article compares the performance ofthe economy of
Jamaica to those ofthe Asian countries of South Korea and Singapore to gain insights into
correlations between each country’s performance in fundamental areas. It restricts the
analysis to differences in macroeconomic variables among Jamaica and the Newly
Industrialized Economies (NIEs) of Singapore and Korea and infers from these differences
potential causes ofthe economic decline. The second article will delve into the underlying
policy regimes and microeconomic distortions which may have influenced these outcomes.
The next section discusses general issues in growth and development. The following
sections compare the performance of Jamaica, Singapore, and Korea in areas of fiscal
responsibility, investment, financial market stability, and trade. Finally we provide some
comments on key areas for maintaining competitiveness in the global economy.
Growth and Development
The key to sustainable growth is elusive. Consistent themes in the literature on
growth theory are sound fiscal policy, stable financial markets with efficient intermediation
between savers and borrowers, growth in physical and human capital stock, relative control
over trade balances, and microeconomic government policies geared toward industrial
development. These fundamentals are both intuitive and compatible with economic theory.
2
Increased productivity appears to be causally linked to capital investment in plant and
equipment. Improvements in capital plant and equipment increases labor productivity and
stimulates per capita output improvement. Although there may be some controversy about
how well these factors stand up to empirical scrutiny, there are probably few economists who
would consider these elements detrimental to development.
For small trade-dependent economies, balance oftrade accounts also have significant
impact on growth. As a result, these economies tend to focus investment and growth
prospects in the area oftrade. The debate on whether investments should center around
import substitution or increases in export is continuing. Many Pacific Rim, newly
industrialized nations have been able to expand both exports and imports and demonstrate
immense output and income growth.’ Investments in these economies have come both
domestically (with some government subsidies) and from foreign direct investment by multi-
national corporations. The viability ofthese investments are enhanced by a stable financial
sector, including stable exchange rates.
In the quest for sustainable economic growth, economies that are unable to attract
private investment have been forced to international financial institutions, primarily the
Bretton-Woods organizations, the International Monetary Fund (IMF) and the World Bank
(International Bank for Reconstruction and Development). The IMF’s financial assistance
consists primarily of short-horizon loans to governments that are ostensibly in need of
structural adjustment of temporary macroeconomic imbalances. These loans come with
conditionalities to reassure the IMF that steps are being taken by the recipients to ensure that
The extent to which favorable bilateral tradeagreements contributed to this growth through increased
markets is not being addressed here.
3
the imbalance is being corrected. A typical and often enforced reform is a currency
devaluation for those countries under a fixed exchange rate regime when their currency
appeared to be overvalued against major trading partners. In theory, the lower value of the
domestic currency should boost the exports ofthe debtor nation and, in conjunction with
other austerity measures, return the country to a sustainable growth path. There is a paucity
ofempirical verification ofthis theory. Whether or not the so-called structural adjustments
have resulted in stimulating real growth is still unanswered. In some instances devaluations
implemented together with trade liberalization resulted in net increases in imports that
exacerbated weakness in the currency.
While long term exchange rates are still governed by the fundamentals ofpurchasing
power parity, tariffs and quotas, productivity, and preferences for foreign versus domestic
goods, the short term movements are affected by perceived changes in the relative rates of
return on asset portfolios denominated in the particular currency. As financial markets
become more globalized, small open economies become more sensitive to international
financial events. When monetary policy uses interest rate targets and credit restrictions,
international portfolios respond by flowing to or from temporary deposits. Small
perturbations in the policies of industrialized nations have unsettling impacts on international
financial markets. As Mexico found out, very liquid portfolios will take flight rapidly at the
first sign of instability or reduction in the rate of return relative to some perceived risk
premium. When Mexico was forced to devalue in late 1994, the rate ofreturn on assets
denominated in pesos (relative to dollars) fell and a flight to quality ensued, further reducing
the exchange rate and the expected rate ofreturn.
4
Monetary policy becomes vital in attracting both long-term and short-term
investment. Most central bankers who are motivated to maintain financial market stability
pay close attention to the long-term bond market because they reflect the source of fixed
investment financing. If there is uncertainty in the rate ofreturn on long term investment,
both the suppliers ofcredit and potential investors will be deterred. A high risk premium is
demanded for long-term investment in a climate ofpolitical or monetary instability. This
risk premium is reflected in the long-term bond yield. In economies heavily dependent on
trade and foreign investment, exchange rate instability can have a chilling effect. Fiscal and
trade imbalances put pressure on the value ofthe currencyand are not compatible with long-
term growth. Prudent monetary policy is required to maintain the integrity ofthe currency.
What has been Jamaica’s record on fiscal austerity, financial market/exchange rate
stability, and trade management? Or more specifically, how does Jamaica’s record in these
areas compare to two of the so-called tigers ofAsia -South Korea and Singapore?
Sound Fiscal Policy
Sound government fiscal policy is best measured by government budget surplus.
Temporary deficits canbe good for the economy ifthey reflect investment in physical capital
or infrastructure rather than consumption. Recurring deficits accumulate into a debt burden
which makes interest payments a large part of the government’s budget and restricts the
ability to return to fiscal prudence. Total debt or debt service ratio gives a better indication
ofthe fiscal health ofthe government, reflecting the cumulative deficits incurred in the past.
The proportion offoreigndebt gives evidence ofthe exposure ofthe fiscal budget to external
5
pressures on the currency. Debt denominated in foreign currency escalates as local currency
is devalued. Sources of revenue that expose inefficient tax collection, and/or excess
dependence on foreign financial markets also can reveal fiscal instability.
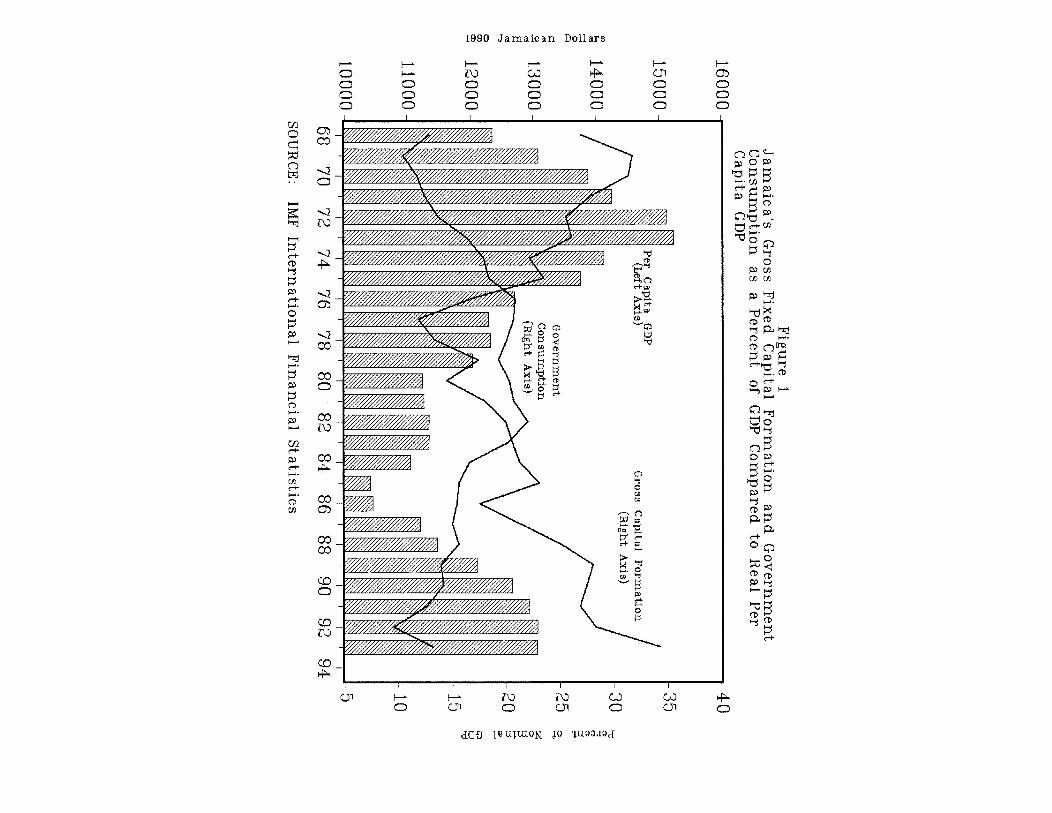
For the purposes ofthis article, the line item ofgovernment consumption expressed
as a percent ofGDP is used as a measure offiscal austerity for comparison with Singapore
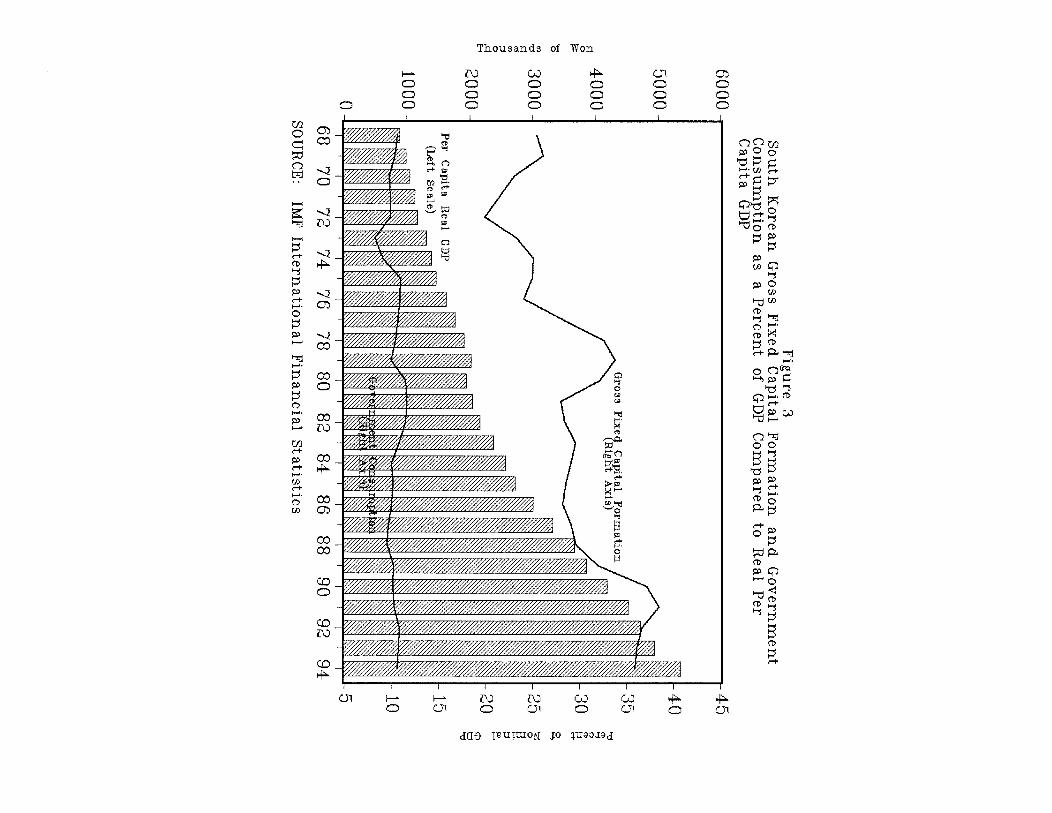
and South Korea. Figure 1 shows the real GDP per capita in Jamaica from 1968 to 1993
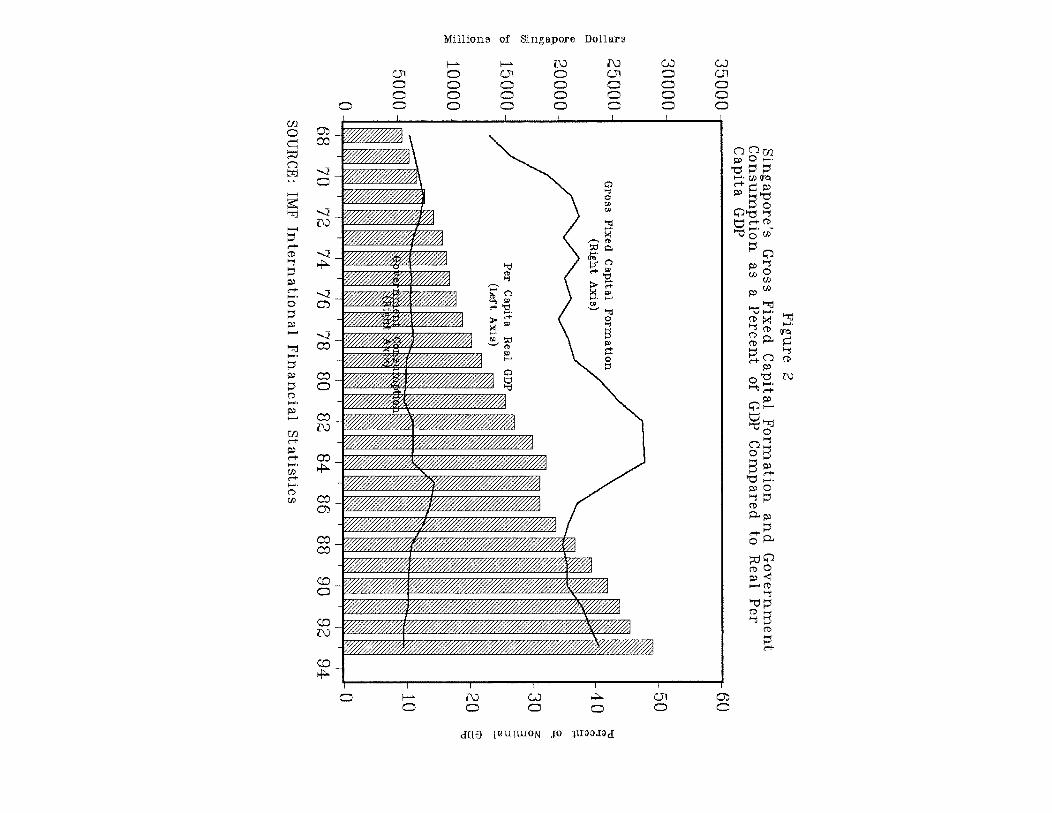
compared to the government consumption and capital formation during these years. Figures
2 and 3 show the equivalent data for Singapore and South Korea, respectively. Per capita
GDP in Jamaica declined from 1973 until 1985 by approximately 30%. During the same
period, government consumption increased from about 10% ofGDP in 1969 to a peak of
about 20% in 1982. As government consumption declined as a percentage ofGDP, real per
capita income began to increase again beginning in 1985. Singapore and South Korea, by
comparison, maintain government consumption at about 10% ofGDP.
Increased government consumption in Jamaica between 1974 an 1979 reflect the
brief flirtation with democratic socialism as a response to increasing income disparity. The
increased government consumption in the early 1980’s reflect an increase in debt,
particularly external debt denominated in foreign currency. Details on these specific causes
will be discussed in the next article. Figure 4 shows the total external debt and actual annual
repayments in U.S. dollars for the period 1979 to 1993. The debt is converted to Jamaican
dollars to show the effect of devaluations. The external debt doubled between 1979 and
1981, after the change in political administration, from 1.1 billion U.S. dollars in 1979 to
2.3 billion U.S. dollars and peaked at 4.7 billion U.S. by 1987. Annual repayments jumped
6
from 200 million U.S. dollars per year to a peak ofalmost 750 million U.S. dollars, putting
an equivalent strain on foreign reserves. Ensuing weakness in the curency contributed to
devaluations which increased the debt in terms of local currency, from about $2 billion
Jamaican dollars in 1979 when the exchange rate was 1.78 per US dollar, to $142 billion
Jamaican in 1993 at an exchange rate of 32.48 per US dollar.
Economic theory maintains that excess government spending will result in crowding
out ofprivate investment. The presence of the government in credit markets raises the cost
of capital and deters private investment. Lower private investment reduces the growth of
the capital stock ofthe country, lowering the growth ofcapital to labor ratio and, therefore,
labor productivity. Could this have occurred in Jamaica? The data suggest that government
consumption as a percent of GDP in Jamaicais excessive compared to Singapore and South
Korea. The next section looks at the movement of capital formation over the period without
inferring causality.
Capital Formation
Both intuitively and theoretically we can make the connection between increased
physical capital, improved productivity, and increased standard of living. Has private
investment been less than ideal in Jamaica over the last two decades? There are no easy
measures of capital flight (human or physical), but we can measure actual growth in the
capital stock through measures of capital formation. From figure 1 we also see the Gross
Fixed Capital Formation (GFCF) as a percent ofGDP compared to per capita real GDP. As
7
a measure ofprivate sector investment, GFCF fell from approximately 30% of GDP in 1969
to low of about 12% in 1977. With an incipient lag ofabout three years, we see per capita
GDP tracking the reduction in GFCF; declining beginning in 1974 and leveling offby 1980.
As GFCF recovered to over 25% of GDP by 1990 per capita GDP appears to be headed back
to steady growth. The implication is that the reduction in investment in new capital leads
to reduced growth as the physical plant depreciates and the economy loses the efficiency
gains from newtechnology. By comparison Singapore and South Korea’s experience shown
in Figures 2 and 3 reflect a trend rise in GFCF from a low ofabout 20% of GDP in 1972 to
over 35% of GDP in 1992. IfJamaicacan strive for and maintain capital additions at this
30% to 35% ofGDP, and maintain government consumption at the 10% level, the return to
growth may be sustainable.
Part of the explanation of the GFCF movement in Jamaica lies in the pattern of
investment in the bauxite industry, which was very heavy in the late sixties and early
seventies but dried up after that. The sources ofthe increased GFCF during the 1980’s need
to be identified. The next article will explore the sectoral investment patterns during the
period in more detail. The next section looks at indicators ofthe level offinancial market
stability over the time period.
8
Stable Financial Markets
Iffixed investment is the engine of growth, then savings is the fuel and a stable
financial sector is the lubricant of the engine.
Keynes suggests that “animal spirits” move investors, while classical theory
maintains that investment reflects the equilibrium of savings and investment at the marginal
productivity of capital. If marginal productivity of capital drives investment, then it is
paradoxical that, given the expected greater marginal productivity ofcapital in developing
countries like Jamaica, and the international mobility of capital, investment flows from
developed countries to lesser developed countries is so limited (Lucas, AER May 1990).
The reasons for reduced capital flows are probably many, but one easy explanation ofthis
paradox is stability in financial markets.
A major motivation for investors is expectation of profits. Unstable financial
markets (as well as political instability) threatens the realization of profits. A natural
asymmetry of information exists between providers ofcapital and entrepreneurs. Anything
which reduces the impact ofthis asymmetry is good, anything which adds to the uncertainty
is bad. Uncertainty in the financial markets, whether due to inflation, foreign exchange
instability, or general political instability, is reflected in higher cost of capital and lower
investment levels.
Two highly correlated indicators of financial market instability are domestic
inflation and exchange rate instability. As Mexico found out, fixed exchange rates have
proven futile in the presence of persistent fiscal and trade imbalance, high foreign-
denominated debt servicing and liberalized capital markets. Rampant inflation is sometimes
9
a manifestation of government deficits financed by increasing money supply. Currency
devaluations also can be precipitated by government debt servicing pressures combined with
increasing domestic demand for imports. For this article, the exchange rate and consumer
price index will be used to compare the financial market stability ofthe three countries but
the causes of inflationary spirals or devaluations are not being inferred.
Figure 5 shows the domestic currency per US$ for Jamaica and Figures 6 and 7 for
Singapore and South Korea over the 1968-1994 period. Singapore data reflect a steady
appreciation ofthe Singapore dollar to the US$, whereas South Korea shows fluctuations
which may be more tied to fundamentals such as trade flow.
Figure 8 shows the consumer price index (CPI) compared to the money stock in
Jamaica. There has been an over 400% increase in the price level since the base year of
1990. The strong correlation between the money stock and the CPI is obvious. An investor
in nominal securities would have to be guaranteed in excess of 100% per year return before
considering long term investment denominated in Jamaican currency. By contrast, figure
8 shows a much more stable price level for Singapore and Korea.
Milton Friedman asserts that inflation is always and everywhere a monetary
phenomenon, meaning that inflation is fueled primarily by growth in the money supply.
Even those economists who disagree with him on issues ofpolicy are apt to agree with the
quantity theory ofmoney and that, over the long run, a monetary authority that allows the
money supply to grow faster than the growth of goods and services contributes to increases
in prices. In some instances, this growth in the money supply can be a deliberate (or at least
tacit) use ofthe central bank to monetize government deficit expenditure. Most industrial
10
countries, -- and especially Germany which has had two periods ofhyperinflation in their
memory --, establish a central bank that is independent ofthe government, to remove the
temptation to use inflationary policies as an alternative to direct tax revenues. This is not
the case in Jamaica and many less developed countries. An independent monetary authority
is one method of ensuring that the integrity ofthe currency is maintained. The central bank
is also a primary watch dog institution for financial entities, ensuring that banks maintain
appropriate asset/liability ratios to cover the risk ofinsolvency and liquidity crises. Other
deposit insurance institutions and regulatory bodies outside the central bank can also be
established to maintain financial market integrity.
Trade Balance
At the base of many of the NIE’s growth has been a trade-focussed development
program ofindustrialization, a so-called outward looking economy. The limited ability for
isolated growth suggests that countries with limited resources look to the increasing world
market for growth in income. Although Japan stands out as a counter-example, island
economies like Jamaica have limited resources and, must plan within narrow confines.
Development specialists argue whether import substitution or exports should be the focus
of industrialization. Park (1992) suggests that South Korea began with import substitution
and gained the growth in human capital necessary to become competitiveon the international
market for goods traditionally dominated by more industrialized nations. Singapore, on the
other hand, focussed on opening its economyto foreign direct investment (FDI). Hong Kong
chose a path that evolved from a simple “Trading Post” history. Revenues stemmed
11
primarily from business activities. Therefore, to the extent that these could be encouraged,
growth could be assured. This does not imply that every country should risk their
sovereignty by opening ownership of national resources to all. It can be argued that any
trade related development process must be custom-tailored to the individual country. It is
clear, however, that an increasing trade deficit of majorproportion to GDP is not consistent
with growth. Increasing exports lend positively to GDP growth.
It might seem inappropriate to compare a country like South Korea with over 40
million people with Jamaica, a small island of2.5 million people, except that prior to 1970,
Jamaica had a higher standard ofliving than either ofthese two nations. It is also useful to
know what the differences have been both from a policy standpoint and from a trade
environment standpoint.
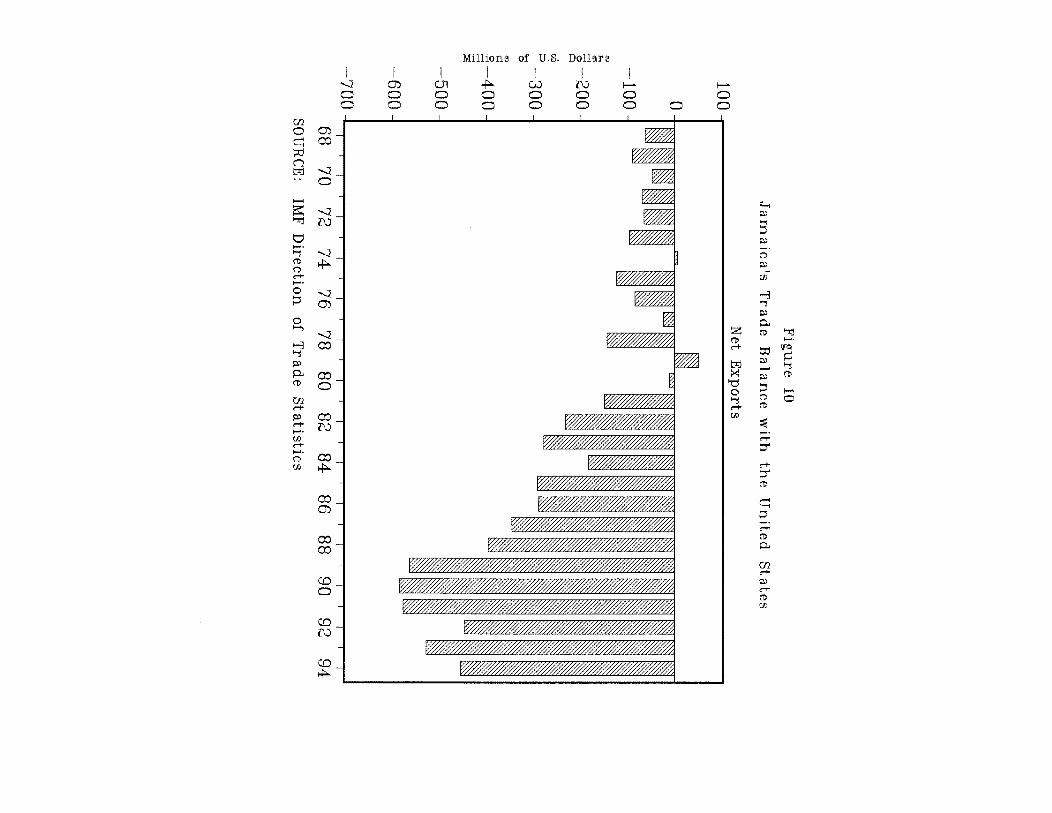
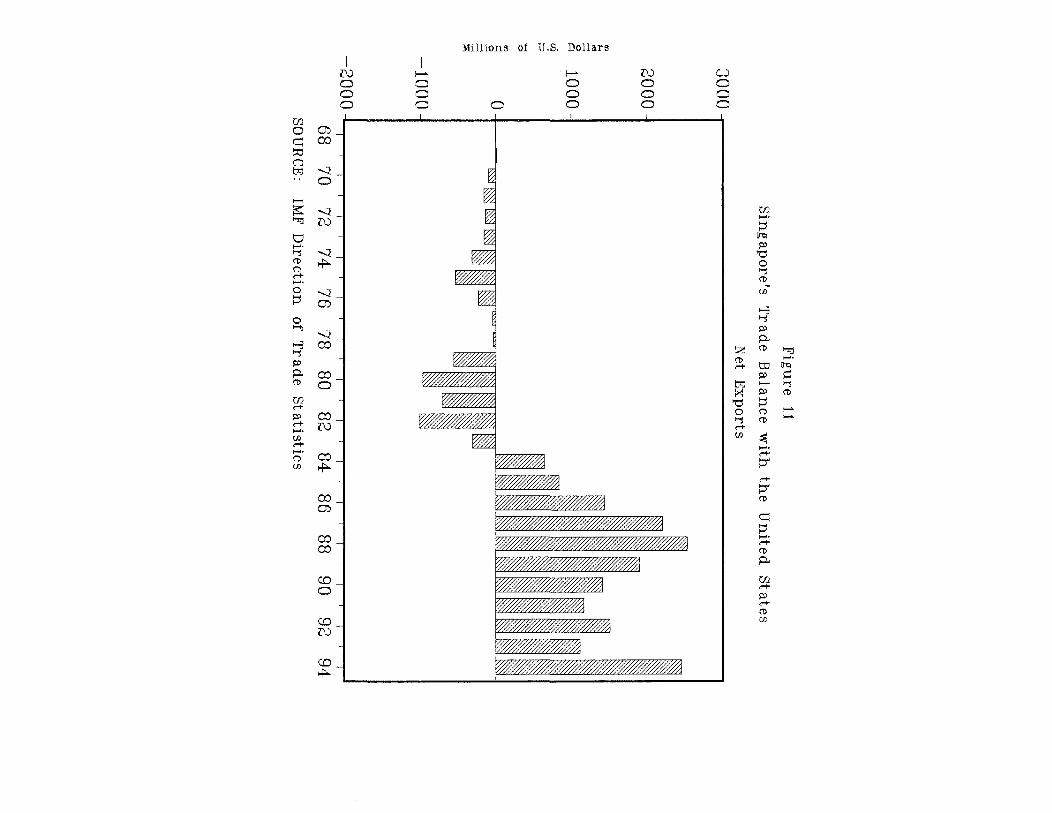
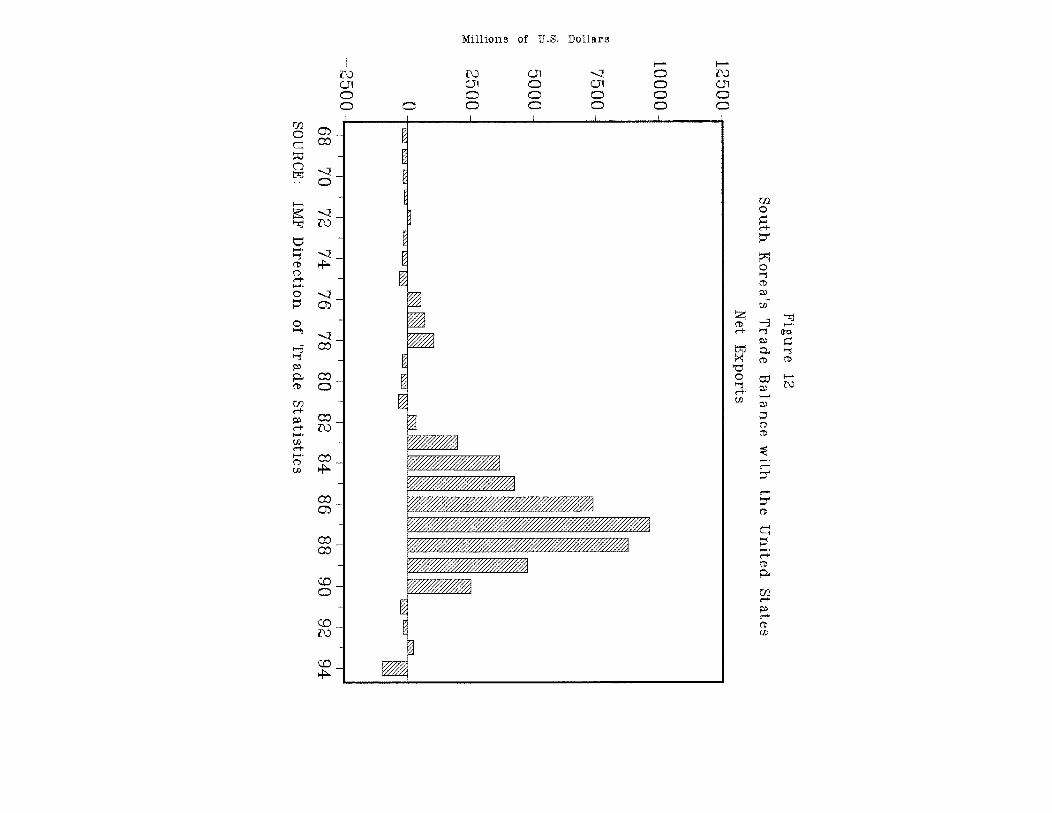
One instructive comparison is in the trade deficit maintained with the United States.
Jamaica has maintained a trade deficit with the US throughout the period in question. Figure
10 shows the net exports with the U.S. for Jamaica from 1968 to 1994. By comparison, the
net exports with the U.S. for Singapore and South Korea are shown in Figures 11 and 12.
The trade surplus by both South Korea and Singapore is obvious from the graphs. Although
both South Korea and Singapore show periods oftrade deficits, these periods do not compare
to the “occasional” surplus year for Jamaica. Is this trade balance a reflection ofpreferential
trade treatment ofgoods imported into the US from Singapore and Korea?
The Reagan administration established a trade agreement known as the Caribbean
Basin Initiative (CBI) in the mid-1980’s. The agreement established reduced tariffs on
certain commodities that meet specific rules of origin criteria. The CBI resulted in a
12
significant increase in exports from the Caribbean (including Jamaica) to the U.S.
Simultaneously, however, imports from the U.S. increased dramatically, resulting in a net
increase in Jamaica’s trade deficit with the U.S. The composition of imports is a better
indicator ofthe long-term impact oftrade deficits. Ifcapital goods are the focus ofincreased
imports, this suggests a future strengthening the economy. A more detailed analysis ofthe
data in the next article will provide answers.
The simple comparison is that Singapore and South Korea maintained better trade
balances and achieved higher growth. As the data shows, Singapore and South Korea
maintained a trade surplus with the US during most of the 1980’s and early 1990’s. By
contrast, even with the CBI, Jamaica’s trade deficit with the US has climbed dramatically
since the eighties. This deficit growth and subsequent devaluation of the currency coincides
with the removal ofimport tariffs and quotas by the Jamaica Labour Party regime in 1980.
As the pressure of demand for imports increased during the 1980’s, the demand for US
dollars put increasing pressure on the Jamaican dollar. This pressure, combined with
domestic inflationpossibly fueled by fiscal irresponsibility, forced devaluation. Onthe other
hand, the promised boon to exports from devaluation did not seem to materialize. In fact,
closer observation ofthe data suggests that prior to the last major devaluation, imports had
begun to fall offsignificantly.
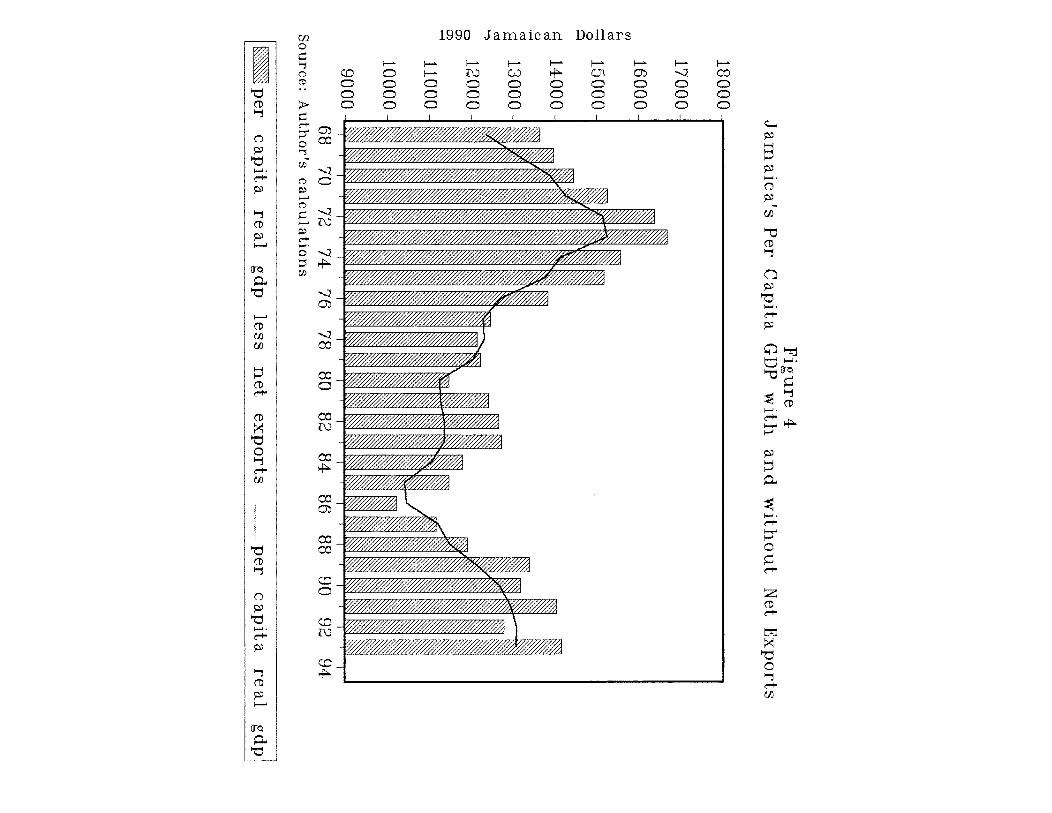
Figure 13 compares Jamaica’s per capita GDP with GDP minus net exports. This
gives an indication of the contribution of the trade deficit/surplus to GDP growth.2
2 This is an unorthodox comparison since some gains from trade are not offsetting.
However, in a strict accounting sense, a trade deficit is a drag on GDP and when trade dwarfs thedomestic economy it is difficult to ignore.
13
Throughout the period, the trade deficit was a drag on GDP and in the early 1980’s, per
capita GDP remained flat instead of rising because of the rising trade deficit. Singapore and
South Korea by contrast had trade surpluses, which increased their respective per capita
GDP.
What does it all mean?
Comparing Jamaica with South Korea and Singapore statistically shows that the
Jamaican economyhas yet to recover to its pre-embargo levels ofper capita output. It also
suggests a future rational path. Despite all the controversy surrounding growth theory, most
camps will agree that
o Increasing capital increases labor productivity,
o Monetization of debt leads to inflation,
o Inflation destabilizes financial markets,
o Unstable financial markets increase the cost ofcapital and deters investment,
o Trade surpluses contribute positively to GDP (tautology).
A comparison of Jamaica with these two NIEs shows that Jamaica has fallen behind in
capital formation, controlling inflation, and managing government consumption. The high
cost ofcapital which grows out of inflation and the crowding out ofprivate investment by
government is evident in the Jamaican economy. It also shows that an increasing, consistent
14
trade deficit has been the Jamaican profile, whereas South Korea and Singapore have
maintained surpluses during the expansion period.
This scenario is probably typical for many so-called Third World nations. The
reasons for this dismal state of affairs are probably unique and yet overlapping in core for
each country. What is not clear is whether the so-called success stories in east Asia reflect
entirely endogenous growth from the proper policies or exogenous (political) shocks. For
example, is a liberal market economy the source of success of South Korea as much as
preferential trade treatment, which provided ready access to a major market? Did
Singapore’s stable financial market occur as a policy action or did FDI in export
commodities provide sufficient foreign currency to stabilize financial markets? Even if
growth in these countries are a result ofpolitical preferential treatment, how does a country
negotiate such preferential treatment in the post-cold war/post-Uruguay Round era?
Strategic locations allow Egypt and Israel access to foreign aid grants, which need not be
repaid. Much poorer nations with little or no strategic importance are saddled with debt
many times their GNP, which must be repaid out ofscant export earnings. Some ofthese
countries that have had preferential trade treatment in the past have lost that extraedge. Will
theirperformance drop accordingly? Will the enforcement ofGATT rules level the playing
field, or remove a past source of competitive edge, (e.g. intellectual property rights
enforcement in Pacific Rim nations)? Trade liberalization still will be a political football.
Countries with power will still be able to stroke their allies and strangle their enemies; and
those to whom they are indifferent must lobby. One thing is evident and that is that poor
nations will no longer be able to depend on the international financial institutions to provide
15
investment directly to governments. The future must be to attractprivate investment in plant
equipment, whether service or industry based. Unless a substantial middle class can be
generated overnight, domestic savings will be insufficient to provide the investment needed
for growth, so for the near future, capital must come from international sources. With
increased foreign capital, developing nations must scrutinize their balance sheets to ensure
that net repatriated returns to capital do not exceed the benefits ofincome growth through
domestic factor input returns.
How Do Capital-Poor Countries Attract Foreign Investors?
The puzzle of limited (private) capital flows from developed to less developed
countries still remains, given the huge potential for marginal productivity increases from
capital. Any measure of industrialization will indicate that these nations are under-
capitalized and the potential returns are much more than industrialized nations can hope to
gain. Instability is one explanation as discussed above. The rational response to this
instability is a risk premium. But some studies have shown that even with risk premiums,
there is a certain irrationality to the way financial markets ignore less developed countries.
Information flow also has been cited as a potential deterrent to foreign investment. In the
mid-90’s “emerging markets” caught the interest ofportfolio investors but suffered from the
“Tequila Effect” when the sudden collapse of the Mexican peso left many investors with
losses and leery of developing economies. Some analysts blame the slow flow of
information for the crisis of confidence in Mexico in early 1995. More transparency in
financial markets through improved information gathering and communication will engender
16
confidence in international investment. Political stability has always been of concern to
foreign investment. Although Jamaica does not have a history of political instability,
assurances ofproperty rights and international rule of law within a democratic framework
reflects a stable climate that will open doors for capital inflows by private investors and
reduce the dependency on international financial agencies.
Domestic investment is preferable to FDI. But without a large enough middle class
with sufficient disposable income to boost domestic saving, the international savings must
be the source of investment for developing countries. FDI is preferable to government
borrowing. Government borrowing places a tax burden on future generations unless
micromanagement uses foreignborrowings as loans denominated in the appropriate currency
for private investment opportunity. The new South Africa has astutely avoided the
international financial agencies. Instead, South Africa has advertised heavily in international
publications to encourage foreign investment in domestic industries. In addition, the
government has successfully gone to the international bond market with a major offering in
1994. After the initial warm reception, the international bond markets have not been one
hundred percent favorable to the second South African issue. Nonetheless further issues are
in the works. Of course this latter option which removes the burden of restrictions
associated with international financial agencies may not be available to most developing
countries, but the small island nation ofMauritius has recently entered the international bond
market and with its excellent economic growth over the past decade should fare well. A
comprehensive plan of marketing and a decisive effort to increase information flow in
17
conjunction with property rights guarantees to foreign investors will go a long way to
attracting capital to developing countries.
The Current Outlook For Jamaica
The present administration is striving to keep Jamaica on a firm growth path.
Advances in the equity market shows that financial markets are being opened. Fiscal
responsibility appears to be the mode. The central bank, although still under the guidance
ofthe Ministry ofFinance, appears to be more cognizant ofthe impact offinancial market
stability on the economy over the long run. Inflation has been curtailed sharply - down to
1% increase in May 1995 with the prospect of falling to single digits by 1996. If this
stability can be sustained, then the prospect for sustainable growth is encouraging. In recent
months failures of some commercial banks due to liquidity crises have forced the central
bank to intervene. It appears that these interventions have been successful in shoring up the
financialsector. The currentFinance Minister, Dr. Omar Davies, is providing an atmosphere
that engenders internatinal confidence. Trade negotiations, both regional and bilateral, are
setting the stage for future growth.
18
References
Findlay, Ronald, and Stanislaw Wellisz, editors, Five Small Open Economies, 1993,
Published for the World Bank, Oxford University Press.
Lucas, Robert E. Jr.. “Why Doesn’t Capital Flow from Rich to Poor Countries?” The
American Economic Review (May 1990), Vol. 80, No. 2, pp. 92-96.
Park, Sung Sang. “The Korean Economic Development Experience: Its Relevance to
Jamaica,” in Jamaica: Preparing for the Twenty-first Century, Edited by Patsy
Lewis, Ian Randle Publishers, Kingston, Jamaica 1992.
19
1990 Jamaican Do11ar~
02
C
C,
p
C
p
~rj
p
C)
p
02
p
0)
C)0)
C)C
—~ 1
C
‘—‘ C)
~-4.
pOP
0)pp ~
Cp0)0)0)
p~
~CD
‘1C) ~.
Ct’ C,~
— CDC p i—
op~-ç
C
p
CDP
‘-4.
Cc)C
CDC)
~- I IC ~\) C~) ClC C C C C CC C C C C CC C C C C C
—
~•••.••••••••••••••.~.•~,,~\ ,•,,,••~••••,•-~••~•••••~
C,
C
C,
C
C,
00
(C
C
,.4. ~
—
- ~(C
Cl I IC Cl C Cl C Cl C
&ID T~UT~OMJO tU~O.I~d
Millions of Singapore Dollars
C.~)(ii C CD C (31 C CD
o C C C 0 C Co o C 0 C 0 0
C 0 0 C 0 C 0 0
_ I
_______ p 0 —~
_____ —~u
~_________ S
~c)
—a—____ ___ - p
—_______ _____ —t
_____ ____ o_____ ____ 5 ‘1
_____ _____ CD_____ ____ CD CDP~____ ____ -I
pC)
E ~ ____ ________
_____ __________ o4/________________________
p0ct
CD
- ______________
%WSV~VSS~7~V M CD 0
C — P— CDo ________________________________
(0_
(0~
0 I tO (31 0)
0 0 C 0 0 0
dUD l~T~ITmONJO JUQOJ~j
Thousands of Won
02
C
C-)
‘-4.
CD
p‘-4.
C
p
p
C)
p
02‘-4-
p‘-4.
0)‘-4-
C)U)
C,CCC
Cl
C,C,02poC
‘-4.
p
4-~CCD
I~L
C
~. CD
CC
pP
CDC
CDPc)4-~ C4-
eCDCD~
CD
‘-4-
ClC C C C CC C C C C
C C C C C C
:~—~ —~• ~
—~*-~-
~•~fr~——w—•
~-~~—
•
~—~
~—• ~
—————~— r~
~_/•
/~
Cl ~-
C Cl C Cl C Cl C
J~urtnoN JO 1U~O.I~d
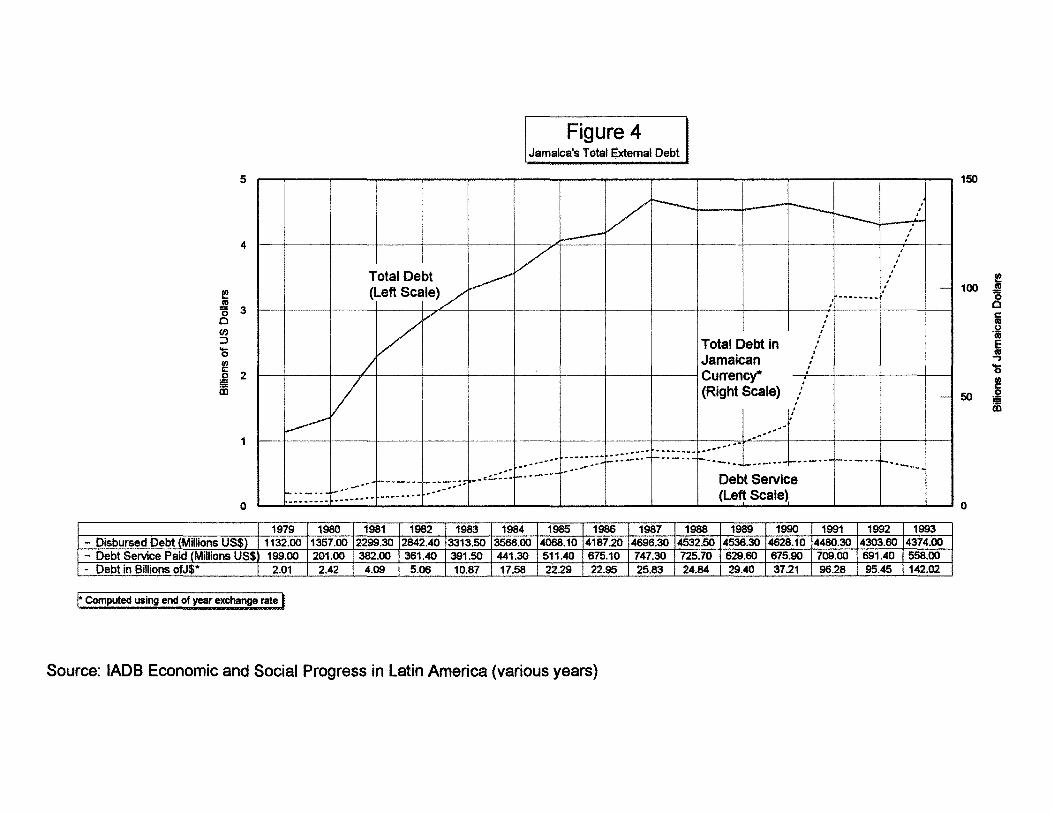
Figure 4Jamaicas Total External Debt
5
4
3
2
0
___________________________ 1979 1980 1981 1982 1983 1984 1985 1986 1987 1988 1989 1990 1991 1992 1993— Disbursed Debt (Millions US$) 1132.00 1357.00 2299.30 2842.40 3313.50 3566.00 4068.10 4187.20 4696.30 4532.50 4536.30 4628.10 4480.30 4303.60 4374.00— Debt Service Paid (Millions US$ 199.00 201.00 382.00 361.40 391.50 441.30 511.40 675.10 747.30 725.70 629.60 675.90 709.00 691.40 558.00- Debt in Billions otJ$* 2.01 2.42 4.09 5.06 10.87 17.58 22.29 22.95 25.83 24.84 29.40 37.21 96.28 95.45 142.02
150
1005
50~
0
1* Computed using end of year exchange rate
Source: IADB Economic and Social Progress in Latin America (various years)
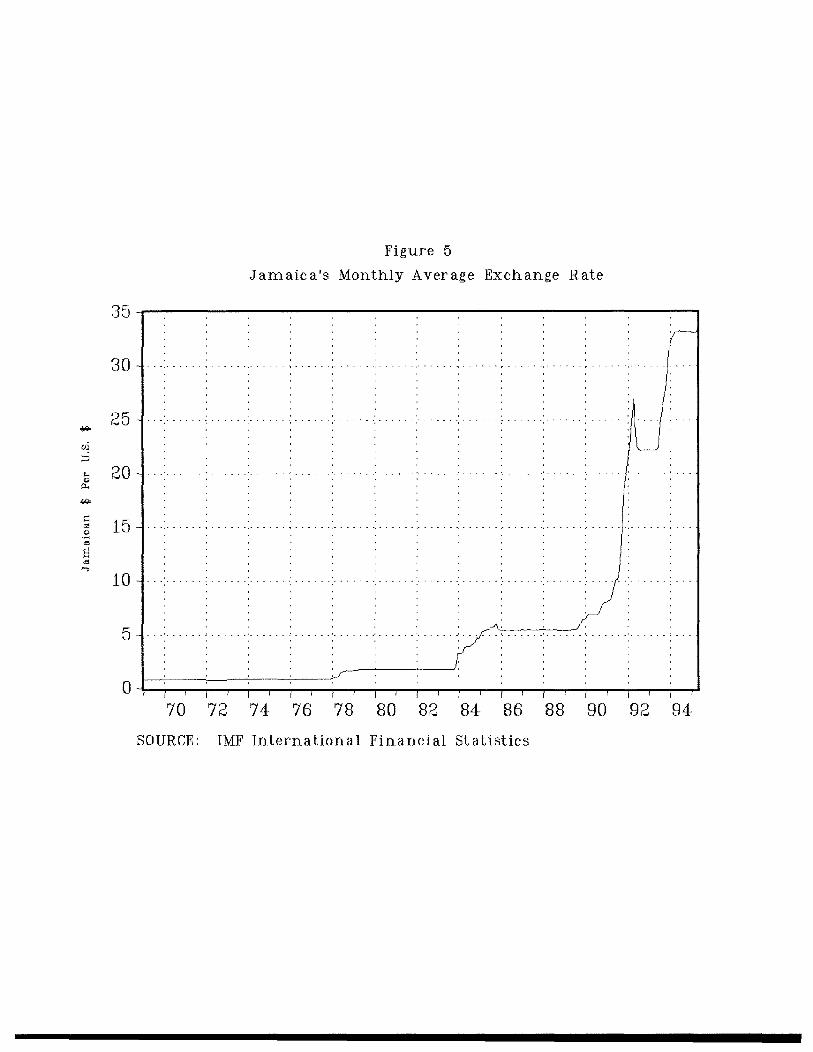
Figure 5
Jamaica’s Monthly Average Exchange Rate
70 72 74 76 78 80 82 84 86 88 90 92 94
SOURCE: IMF International Financial Statistics
35
30
25
~ 20
I
5
0
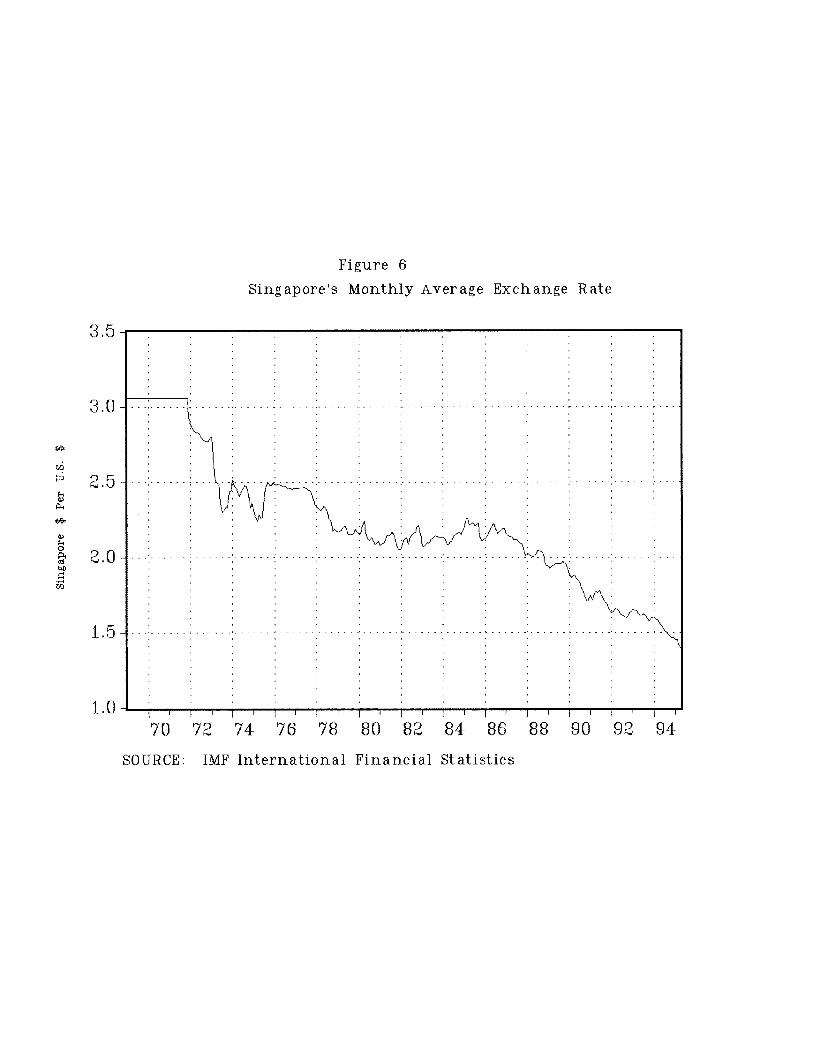
Figure 6
Singapore’s Monthly Average Exchange Rate
SOURCE: IMF International Financial Statistics
4,
V4,C
0)
3.5
3.0
2.5
2.0
1.5
1.070 72 74 76 78 80 82 84 86 88 90 92 94
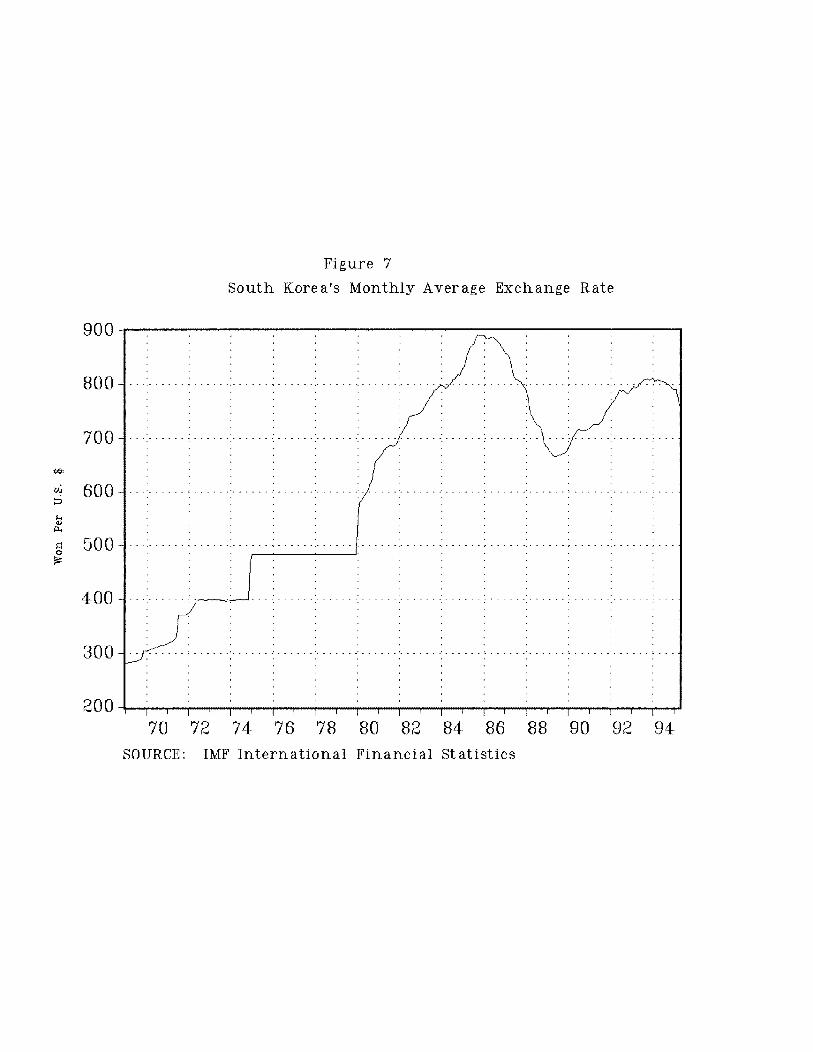
Figure 7
South Korea’s Monthly Average Exchange Rate
70 72 74 76 78 80 82 84 86 88 90 92 94SOURCE: IMF International Financial Statistics
I-
V
0
900
800
700
600
500
400
300
200
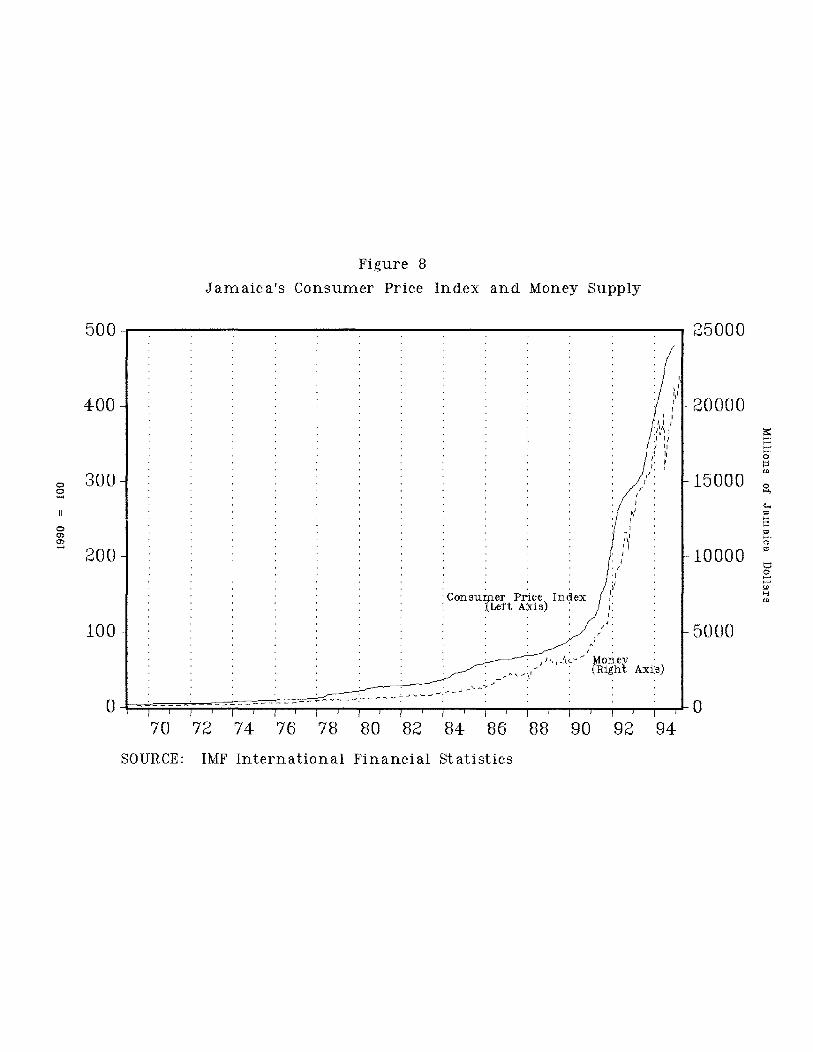
Figure 8
Jamaica’s Consumer Price Index and Money Supply
Consumer(Left
Price IndexA~ds)
80 82 84 86 88 90 92 94
25000
20000
0
Ii
15000<~1CD
CD
10000
5000
0
SOURCE: IMF International Financial Statistics
500
400
300
0C) 200
100
070 72 74 76 78
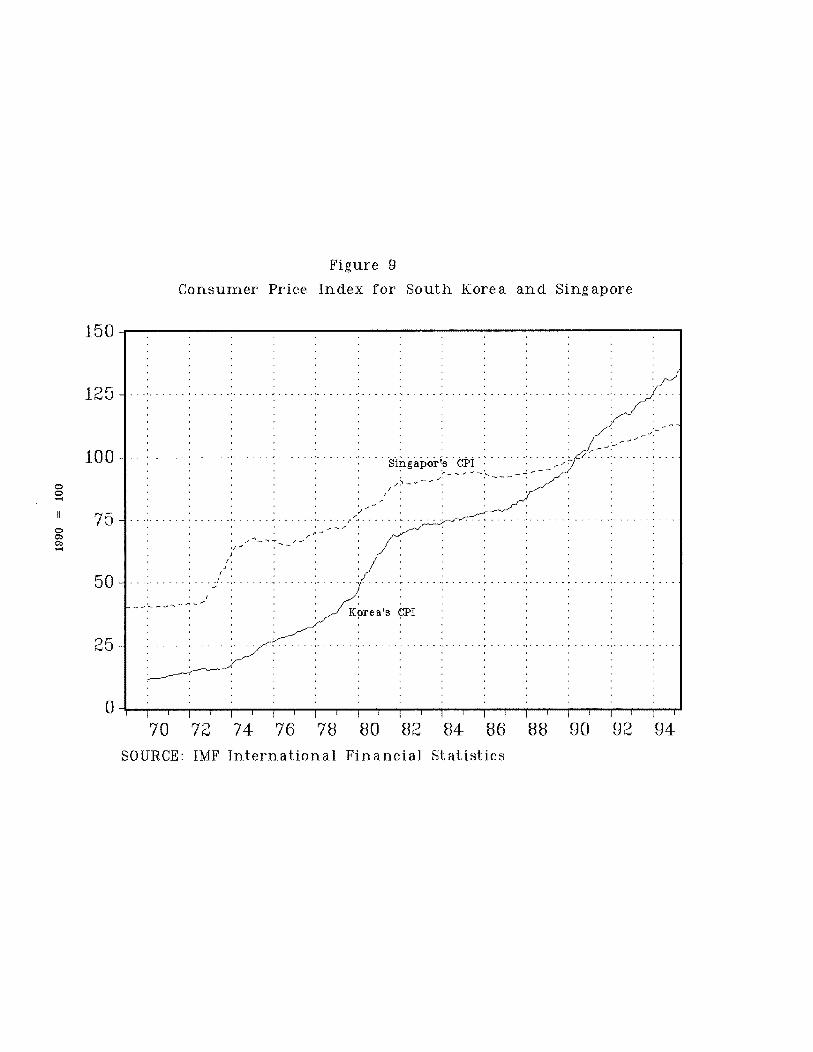
Figure 9
Consumer Price Index for South Korea and Singapore
Korea’s CPI
SOURCE: IMF International Financial Statistics
00
0C)C)—4
150
125
100
75
50
25
070 72 74 76 78 80 82 84 86 88 90 92 94
Millions of U.S. Dollars
I I I I I~J C, Cl ~ ~C C C C C C C CC C C C C C C C C
I I I I ________________________CC,
C,
C
p4.~ C)
__ P
‘-4.
pp CDCDC
02 ‘-~~ CD
~ ~- _______ U)
C) 00
• ________________
- ___________________ a• _______________________
- ____________________• _______________________________
- _______________
Millions of U.S. Dollars
I r\.) (~)C C C C CC C C C CC C C C C C
02 I I ICC,
C,
C
~ 02I-”
CDC)‘-4- __
C
~ C,~
Cp
~CD ~hIp ____
CD C ________ p__________ 4— hI
kPCD02 •
C C) _
P 00 ~1 CD
_____ ‘-4.
CDC, _____________
00 _________________ CD
(C 02
C ‘-4.p‘-4.CD
(C_ ~•••~•.•.••~•,•••~ 0)
(C - _____________
Millions of U.S. Dollars
Cl CCl Cl C Cl C ClC C C C C CC C C C C C C
__________ I I I I02
C,
4- 02C
‘-4.
CD ChI‘-4.
4—
C ~.J p~ C,
Z 4-rJC CD
..-~ ~4. hI O~
hI • k CD CDp
C ~
CDC
02 p
‘+ ~:\) .~ C)
~. ~- ______
- _____________
- ________________ a(CC 02
‘-4.• p
‘-4.(C CD
U)
(C
cn 1990 Jamaican Dollars0
I ~— ~ ~— ~ I I
C) C 0 I— tO 0,) * CD C) -,2 ~CD 0 0 0 0 0 0 C C C C
0 0 0 C 0 C C C C C~ C C C C C C C C C C
I I I I I I I I— __________________
C~)
—. (D,~ ~
C)Cp ~ ~
— p— U)
—tOp— — CD
To Cat —~-
C) -
—CDU)
CD C ________
CD
U) _______ a
t __________
CD
C
tO ________
t0I-I
CDp U)
Toat