Embed Size (px)
Citation preview
Trade Misinvoicing and Capital Flight from India
Ila Patnaik Deepa Vasudevan
Dr. Ila PatnaikSenior Economist,National Council ofApplied Economic ResearchParisila Bhawan11, Indraprastha Estate,New Delhi 110002
Ms.Deepa VasudevanConsultant,National Council ofApplied Economic ResearchParisila Bhawan11, Indraprastha Estate,New Delhi 110002
2
Abstract
The program of economic reform in India in the nineties has led to liberalisation
of the current account and the foreign exchange market. The capital account has
been made convertible for foreign nationals but it still remains closed for resident
Indians. While residents can bring money into the country they are not free to
take it out. This has created a situation that encourages trade misinvoicing by
residents in order to move capital abroad. This paper attempts to measure the
extent of misinvoicing and capital flight from India in the post-reform period.
3
Contents
1. Introduction
2. Capital account convertibility
3. Trade misinvoicing
3.1 Export underinvoicing
3.2 Import underinvoicing
3.3 Adjustment of current account for trade misinvoicing
3.4 Black market premium
4. Estimation of capital flight
4.1 The residual method
4.2 The Morgan Guaranty Trust Company method
4.3 Measuring capital flight for India
5. Conclusion
4
1.Introduction
Capital flows from one country to another may take place for a number of
reasons. Globalisation of financial markets have resulted in capital flows that
result from households’ attempts to maximize returns through international
portfolio diversification. Savings of households in advanced countries flow to
developing countries through portfolio investment via foreign institutional
investors (FIIs) whose activities are now spread across stock markets
worldwide. The expansion of world trade and commerce has increased
enterprises’ efforts to promote trade through providing export credits leading to
movement of capital. Worldwide dispersal of productive units by multinational
enterprises has led them to accumulate working balances abroad and invest
directly in the acquisition of productive capacity abroad. Commercial banks’
efforts to expand their activities have resulted in their accumulating deposits
with foreign banks and acquiring claims on non-residents through portfolio and
direct investment.
The above movement of capital can be considered to be “normal”. However,
capital outflows may also be motivated by the concern that assets held
domestically would be subject to substantial loss or impairment due to risks of
expropriation, exchange rate depreciation, taxation or other forms of financial
repression. They are then not considered part of the normal flow process and
5
are defined as capital flight (Deppler and Williamson, 1987).
In this paper we attempt to look at the causes and route of capital flight from India
in the nineties. The program of economic reform has led to convertibility on the
current account. However, the capital account has been made convertible for
foreign nationals, but it still remains closed for resident Indians. While residents
can bring money into the country they are not free to take it out. It is still illegal for
resident Indians to hold bank accounts or other financial assets abroad. Thus
there is no legal source of foreign exchange for a resident Indian who wishes to
hold such assets abroad. This has created a situation that encourages trade
misinvoicing to move capital abroad. This paper attempts to measure the extent
of misinvoicing and capital flight from India in the post-reform period.
2. Capital Account Convertibility
Evidence shows that despite strict capital controls, substantial capital flight took
place from India in the seventies and eighties (Rishi and Boyce, 1990). The
reform process entailed progressive liberalisation of the current account, while
the capital account continued to be partially controlled. The decontrol of the
capital market included allowing foreign institutional investors to invest in the
Indian stock market.
6
Following the permission to FIIs to hold shares in the Indian stock market,
between 1993 and 1994, India’s share of total portfolio equity flows to developing
countries rose from 4.1% to 14.3%. In fiscal year 1993-94, portfolio investment by
FIIs rose from $4 million in the previous year to $1634 million and inflows through
Global Depository Receipts (GDRs) and Euroconvertible bond issues shot up
from $240 million to $2493 million. Currently, FIIs, Non resident Indians and
overseas corporate bodies can collectively invest up to 30% in a single company
out of which 24% is through the automatic approval route. With a view to
increasing the flow of funds to the gilts market, the Reserve Bank of India (RBI)
has allowed FIIs, including proprietary funds, to invest in dated Government
securities and set up dedicated debt funds. FIIs have also been permitted to
purchase/sell treasury bills within the overall approved debt ceiling. FIIs have
been permitted to take forward covers on their currency exposures on debt
instruments.
The move toward capital account convertibility is, however, only partial. While
FIIs, Non resident Indians and overseas corporate bodies are allowed to take
money out of the country when ever they wish, resident Indians are not
permitted to transfer or hold money abroad. Thus the capital account is fully
convertible for foreigners but fully closed for resident Indians. For instance, in
reaction to the Asian currency and stock market crisis monthly net FII
investment turned negative in November 1997, as there was large-scale
7
offloading of Indian stocks. Resident Indians do not have the option of holding
stocks in foreign financial markets and cannot turn to more lucrative markets if
the Indian market is depressed or if they expect the rupee to depreciate.
The partial convertibility of the capital account has been accompanied by
convertibility on the current account. The current account was liberalized as
part of the reform process. Foreign exchange transactions necessary for
imports and exports are permitted. As observed by the Tarapore Committee on
Capital Account Convertibility, the above dichotomy of a closed capital account
for residents with an open current account would encourage the movement of
capital through the current account (RBI, 1997). It has created a situation where
there is incentive for capital flows to take place through the current account
route by trade misinvoicing. As residents are not allowed to officially move
money out of the country as FIIs can, fear of devaluation encourages exporters
and importers to under and over invoice their trade figures.
3. Trade misinvoicing
Comparing export-import data furnished by India’s trading partners with official
Indian data can identify trade misinvoicing. The discrepancy between official
Indian exports to the world (adjusted for shipping and insurance) and the world's
imports from India can be defined as export misinvoicing. Traditionally, all export
data are in f.o.b terms (excluding the costs of shipping and insurance) and all
8
import data are in c.i.f terms (i.e. including the costs of shipping and insurance).
Therefore, on adding shipping and insurance costs to the official figure for India’s
exports to the world we should arrive at the figure for the world’s imports from
India. The conversion of export data from f.o.b to c.i.f terms is carried out by
multiplying it with the cif/fob factor [derived to be 1.11 (IMF Balance of Payments
Yearbook 1997)]. The residual discrepancy after this conversion is attributed to
export misinvoicing. Export under invoicing takes place when official export data
reports lower exports as compared to the actual value of goods transferred out of
the country. The purpose of under invoicing is to enable the exporter to retain
some export proceeds outside the country.
Similarly, the difference between official figures of India’s imports from the world
and the world’s exports to India (adjusted for shipping and insurance) is attributed
to import misinvoicing. If official figures on India’s imports were higher than the
adjusted figures for the world’s exports to India, it would indicate import over
invoicing. Import over invoicing would enable the importer to acquire excess
foreign exchange and subsequently transfer it abroad. The opposite situation
would arise in case of import under invoicing, which would generally be motivated
by tariff evasion.
3.1. Export Under invoicing
Data for India’s exports to and imports from the rest of the world are sourced
9
from the Economic Survey, 1997-98. Data for the world’s imports from and
exports to India are sourced from the Direction of Trade Statistics published by
the IMF. Data from these two sources was not found to be comparable initially,
because export-import data of India’s trading partners is provided on a
calendar-year (January to December) basis, whereas official Indian data is
available on a fiscal-year (April to March) basis. To make them comparable we
converted international data to fiscal-year basis by using quarterly estimates of
the world’s exports to and imports from India (Source: Direction of Trade
Statistics Quarterly, various issues) and consolidating the appropriate quarters
to generate fiscal-year estimates.
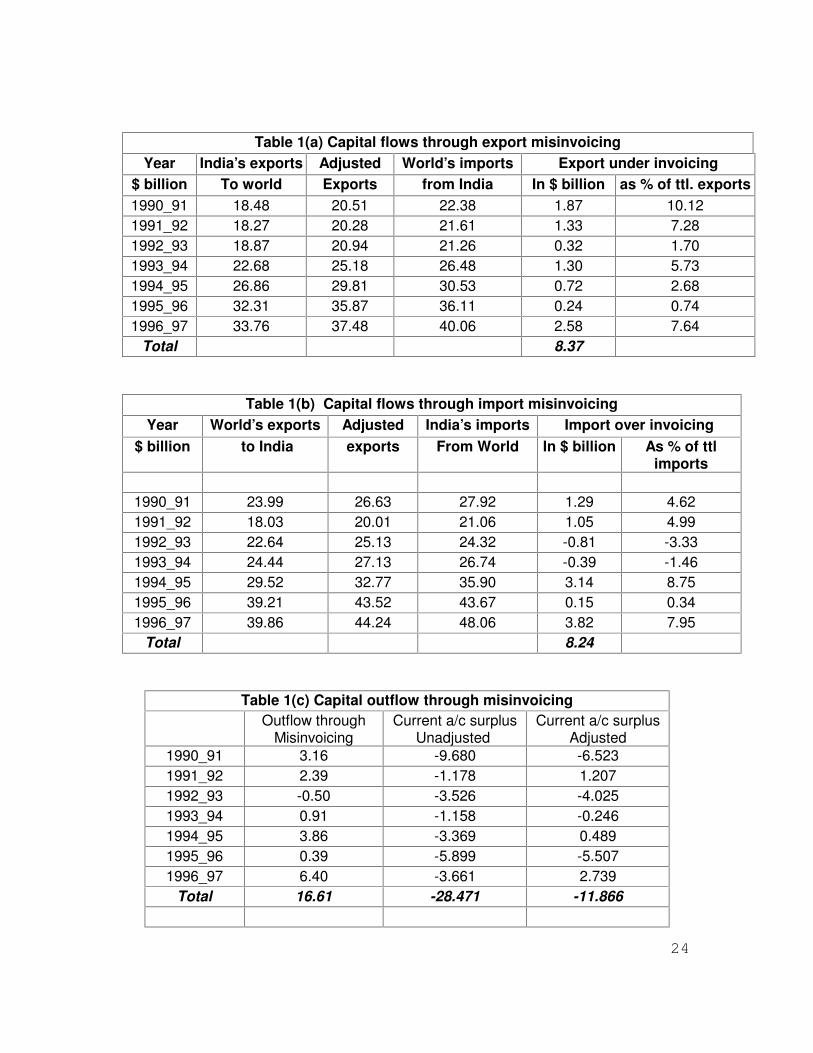
Trade data comparison between India and the world reveal dominant export
under invoicing in India (Table 1(a)).
Exports under invoicing may take place when expectations of exchange rate
depreciation are built up in the market. Such an expectation may arise, for
instance, if the “official” exchange rate is fixed at levels below the market rate.
Under invoicing of exports would enable the exporter to realize a greater amount
of domestic currency for the same amount of foreign exchange receipts when the
expected depreciation actually takes place. It follows, therefore, that once the
expected depreciation takes place under invoicing of exports should reduce.
However, a devaluation of the exchange rate may often create uncertainty in
10
forex markets and fuel suspicions of a further fall. In such a situation an
exporter would prefer to under invoice exports and keep capital abroad till such
time as the exchange rate policy is made clearer. The actual pattern of export
misinvoicing in a year of depreciation of the domestic exchange rate would
depend on which of these two factors is stronger.
After 1993-94, market perceptions of the exchange rate may be captured by the
forward premium. Forward premia have ranged between 0.5%- 30% in 1993-94
to 1996-97, but are generally in the region of 5-6%. This indicates that the market
expects, or at least, does not rule out further depreciation of the rupee. The
perception that the rupee would depreciate continues as inflation rates in India
continue to be higher than inflation rates in the OECD countries.
The dual exchange rate system adopted in February 1992, that allowed exporters
to convert sixty percent of export proceeds at the market exchange rate and the
remaining forty percent at a lower official rate, was the first step towards
discouraging export under invoicing. This may explain the sharp fall in export
under invoicing in 1992-93 to 1.7% of total exports from 7.3% in the previous
year. In 1993-94, as the surge in foreign portfolio inflows put upward pressure
on the exchange rate, the Central Bank responded by maintaining the rupee
dollar rate at nearly constant levels. Despite expectations of appreciation,
export under invoicing increased to 5.73% of total exports. Later, there was an
11
exchange rate depreciation in September 1995, which reduced under invoicing
levels to a negligible 0.74% of total exports in 1995-96. Most instances of
depreciation were thus accompanied by a reduction in underinvoicing. This
suggests that the rupee had been perceived to be overvalued and the
depreciation was corrective.
Intervention by the Central Bank in the foreign exchange market often kept the
rupee at levels that diverged from what the market would have determined. For
instance in the period 1993 to 1995 the Rupee stayed at a constant rate for
nearly 2 years. During this period there was market pressure on the rupee to
appreciate due to inflow of foreign capital. It was not allowed to do so. But nor
was it allowed to depreciate when pressure from the rising current account deficit
built up. It was only in August-September 1995 that the RBI finally let go and the
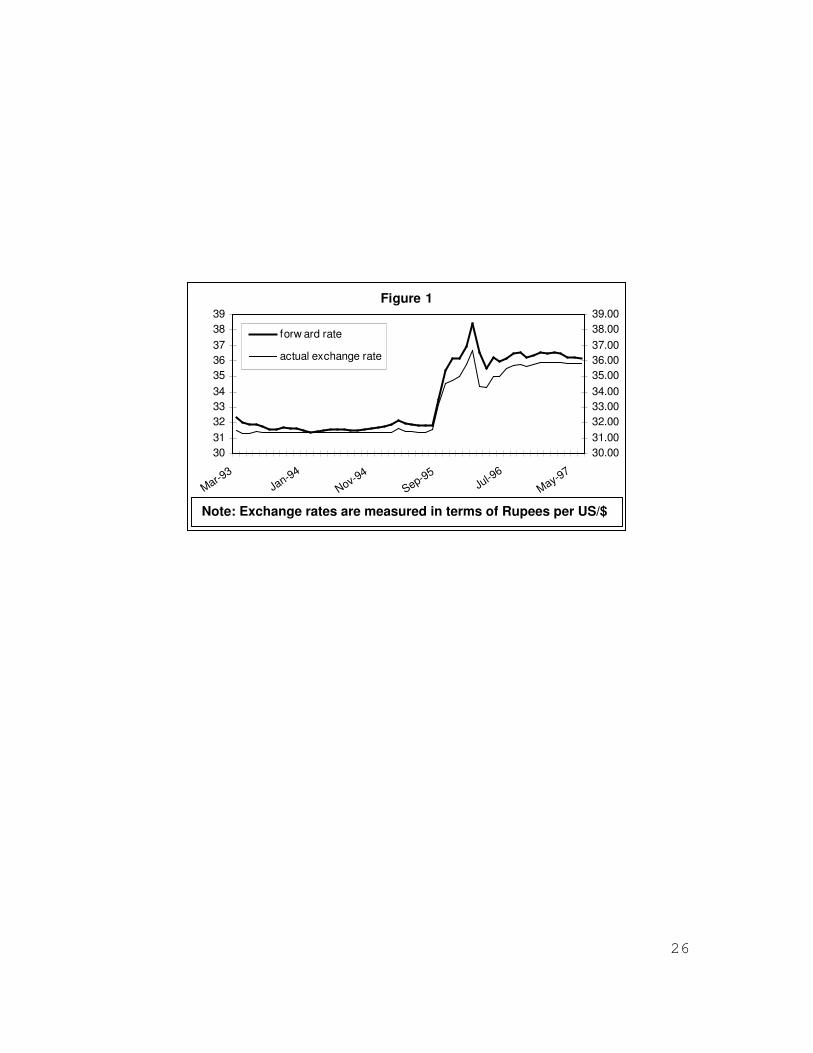
rupee fell sharply. The Central Bank’s exchange rate policy is not very clearly
stated and usually creates fears of depreciation. The fact that the forward rate
indicated a higher depreciation than was actually realized is evidence of the
market’s perception (Figure 1).
Total under invoicing between 1990-91 and 1996-97 amounted to $ 8.37 billion.
In general, in an economy with controlled capital movements, export under
invoicing is accompanied by import over invoicing, both of which contribute to
illegal capital flight from the economy.
12
3.2. Import Underinvoicing
We observe import over invoicing in India over most of the 1990s, excepting
1992-93 and 1993-94, when imports were under invoiced by about $ 1.2 billion
(Table 1(b)).
Despite rationalisation of the tariff structure and lowering of tariffs in the post-
reform period, India continues to have relatively high tariffs in the post reform
period. Mean tariff rates for the economy as a whole fell from 128% in 1990-91 to
71% in 1993-94, and further to 34% in 1997-98 (World Bank, 1998). High tariff
rates would normally result in under-reporting of imports, as importers attempt to
reduce tariff payments. During 1990-91 and 1991-92, crisis conditions in the
domestic economy outweighed the high tariffs and led to capital flight through
over invoicing. In the following two years, however, tariff evasion dominated over
fears of capital depreciation and import under invoicing took place. The trend
reversed from 1994-95, with $ 3.2 billion of import over invoicing (about to 8.8%
of total imports) taking place in that year. The unnaturally high over invoicing in
1994-95 can be attributed to the capital market boom in that period, which
facilitated the financing of several industrial projects set up with imports of capital
goods. These imports were generally over invoiced, so as to enable corporates to
accumulate illegal balances overseas. With the collapse of the public issue
market and tightening of credit in 1995-96, over invoicing dropped to 0.15% of
13
imports.
In the period 1990-97, export under invoicing resulted in capital outflows of about
$ 8.4 billion, and simultaneously imports were over invoiced to the extent of about
$ 8.2 billion. In all, $ 16.6 billion of capital fled the country through the trade
misinvoicing route.
3.3. Adjustment of Current Account for Trade Misinvoicing
The combined effect of export under invoicing and import over invoicing is to
overstate the trade deficit or understate the trade surplus (Table 1(c)). Therefore,
current account deficit/surplus figures need to be decreased/increased to reflect
total trade misinvoicing.
Export under invoicing leads to the current account deficit being larger than if
there were no misinvoicing and import under invoicing results in the current
account deficit appearing smaller than it would be without misinvoicing. The
direction of the net adjustment to the official current account deficit depends on
the relative magnitude of the two causal factors.
Official balance-of-payments data thus does not reflect possible misinvoicing in
imports and exports. To illustrate, suppose exports and imports are each $1000,
then the trade deficit is zero. In this case, under invoicing of exports of the
magnitude of $200 i.e. reporting exports to be $800 leads to a current account
14
deficit of $200 (assuming zero invisibles). At the same time, import over invoicing,
can also take place, say by $200, motivated by the desire to acquire foreign
exchange. This would result in imports being reported as $1200 and would
further increase the deficit to $400. On the other hand, under invoicing of imports
would reduce the current account deficit. Therefore, estimates of capital flight
obtained by any of the other methods need to be adjusted by the extent of trade
misinvoicing.
3.4. Black Market Premium
All misinvoicing may, however, not constitute capital flight. In most regulated
economies, including India, underinvoicing of exports is also encouraged by the
existence of a “black” or parallel market for foreign exchange, where the local
currency can be sold at a premium to the official exchange rate. Similarly
importers could obtain foreign currency ostensibly for imports and sell it at a
premium.
The black market premium remained significant in India till the early nineties. For
instance, the spread between the official and the black market rate, or the black
market premium was as high as 13.77% in March 1992, rising to 24% in
February 1993. However, the deregulation of the foreign exchange market has
wiped out the premium to a large extent (Marjit, 1998).
15
It may be argued that in the pre-reform period a considerable portion of what
may appear to be capital flight through export under invoicing is not really so,
as export earnings enter the country through the black market. However, in the
nineties no significant black market for foreign exchange existed as the value of
the rupee was market determined. Thus under invoicing of exports was not
meant to route export earning back into the country through the black market.
Rather, it was done to transfer export earnings to foreign accounts thereby
contributing to capital flight. As there is no other advantage from under invoicing
exports than to unofficially move capital abroad the extent to which exports and
imports are misinvoiced constitute a measure of capital flight. A restricted capital
account that does not allow residents to transfer money to foreign accounts
through official channels provided the necessary incentive for capital movements
in the guise of trade transactions. As the current account was liberalised it was
relatively easier to channel money through this route.
16
4. Estimation of capital flight
There are several approaches to measuring capital flight. We briefly present the
residual or broad measure and its variant, the Morgan Guaranty Trust Company
method estimates the totality of funds available for capital flight.
4.1.The residual method
The residual or the broad measure is an indirect approach to measuring capital
flight based on a comparison between sources and uses of foreign exchange.
This method measures capital flight as those inflows of foreign exchange which
have no accounted/reported uses. Thus, the residual or difference between
inflows and uses of foreign exchange are computed; and a surplus of inflows
over reported uses measures the extent of unaccounted uses or reflects capital
flight from the country. Foreign exchange inflows are calculated as the sum of the
increase in net external borrowing and the total non-debt creating foreign inflows
in a given year. Uses of foreign exchange include the current account deficit and
the net increase in foreign reserves. Operationally, we compute capital flight as
the sum of change in external debt, foreign investment inflows, current account
surplus and change in international reserves.
If official sources/inflows exceed the official uses of foreign exchange, then it is
17
assumed that the forex has been used unofficially or has left the country without
being officially recorded. In other words, capital flight has occurred.
4.2.The Morgan Guaranty Trust Company method
This method of computing capital flight (Morgan Guaranty Trust Co., 1986) is a
variant of the residual measure. Inflows of foreign exchange are defined in the
same manner, but they are assumed to being used to finance the current
account deficit as well as add to the net foreign exchange assets of the banking
sector. Commercial banks’ net foreign assets are added to those of the central
bank on the grounds that the central bank directly or indirectly controls a large
fraction of commercial banks’ foreign assets in many developing countries
(Cuddington, 1986).
The difference between the inflows and uses continues to be defined as capital
flight. As in the residual method, negative figures for capital flight suggest net
unofficial inflows of forex.
4.3. Measuring Capital Flight for India
External debt, measured as total external debt less some categories of rupee
18
debt1, and non-debt creating foreign inflows, measured as foreign direct and
portfolio investment were obtained from official estimates published in the
Economic Survey 1997-98. Similarly, we used official government data for
estimates of foreign reserves (excluding gold). Finally, estimates of net foreign
exchange assets of the banking system were obtained from the monthly bulletins
of the Reserve Bank of India.
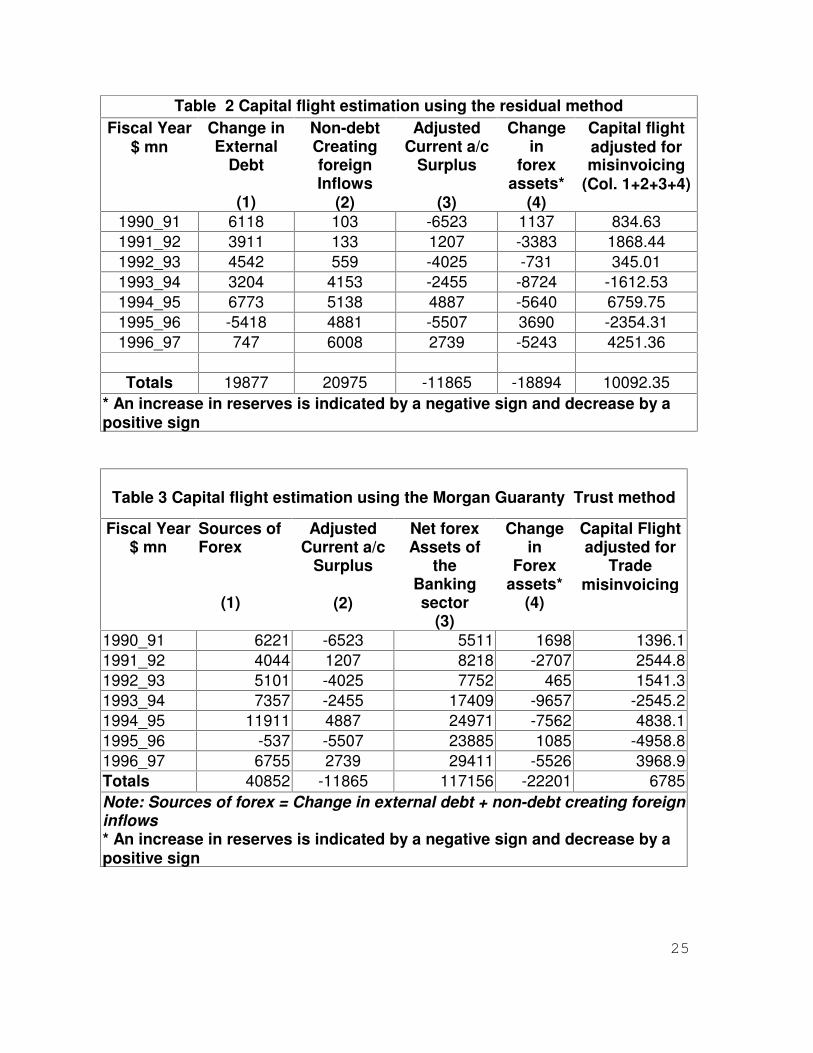
Tables 2 and 3 present the estimates of capital flight for India. Total capital flight
measured by the residual method, adjusted for trade misinvoicing, amounted to
$10.1 billion over the period 1990-97 (Table2). Using the more comprehensive
Morgan Guaranty Trust Company method, capital flight adjusted for trade
misinvoicing amounted to $6.8 billion in the period 1990-97 (Table 3).
1 Refers to debt owed to Russia, denominated in rupees and payable in exports.
19
5. Conclusion
Our results indicate the reforms of the nineties that opened up the capital account
to foreigners but kept it closed to India’s encourage the movement of capital
through illegal routes such as trade misinvoicing. We believe that all the
misinvoicing observed in the post reform period constitutes capital flight as there
is no black market premium in the forex market that would encourage
misinvoicing for rerouting foreign exchange at higher rates. Intervention by the
Central Bank in the foreign exchange market to keep the rupee at levels diverged
from the market-determined rate created fears of depreciation. The fact that the
forward rate indicated a higher depreciation than was actually realized is
evidence of the market’s perception. The view that the rupee is “overvalued” and
would slip lower if left to market forces combined with the existence of a regime
restricting residents to hold foreign assets or bank deposits abroad, led to capital
flight through trade misinvoicing.
20
ACKNOWLEDGEMENT
This paper forms part of the Financial Sector Modelling project sponsored by
the Canadian International Development Agency (CIDA) and the Industrial
Credit and Investment Corporation of India (ICICI).
21
References
Deppler,M and Williamson,M (1987), ”Capital Flight: Concepts, Measurements
and Issues”, IMF Staff Studies for the World Economic Outlook, August, pp 39-
58.
Rishi,M and Boyce,James K.(1990), ”Capital Flight and Trade Misinvoicing in
India 1971-86”, Economic and Political Weekly, July 28, pp 1645-48.
Morgan Guaranty Trust Company of New York (1986), ”LDC Capital Flight”,
World Financial Markets, March, pp13-15.
Cuddington, John.T (1986), ”Capital flight: Estimates, Issues and Explanations,
Princeton Studies in International Finance, No.58 (December).
Ajayi Ibi, S (1996), “ An analysis of external debt and capital flight in the heavily
indebted poor countries of sub-Saharan Africa”, in ‘External finance for low-
income countries’, eds Zubair Iqbal and Ravi Kanbur, IMF, pp 77-117.
Khan, Mohsin.S. (1987), “Capital flight from developing countries”, Finance and
Development, Vol. 24 (March), pp 2-5.
22
Marjit, Sugata, B.Dasgupta and S.Mitra (1998), “ Exchange rate and exports from
India- A fresh look at the official statistics”, Unpublished paper.
Reserve Bank of India (1997), “Report of the Committee on Capital Account
Convertibility”, Chaired by S.S.Tarapore, Mumbai.
23
List of Tables
Table 1(a) Capital flows through export misinvoicing
Table 1(b) Capital flows through import misinvoicing
Table 1(C) Capital outflow through misinvoicing
Table 2 Capital flight estimation using the residual method
Table 3 Capital flight estimation using the Morgan Guaranty Trust
Company Method
Graphs
Figure 1 Forward rate and actual exchange rate of the Rupee
24
Table 1(a) Capital flows through export misinvoicingYear India’s exports Adjusted World’s imports Export under invoicing
$ billion To world Exports from India In $ billion as % of ttl. exports1990_91 18.48 20.51 22.38 1.87 10.121991_92 18.27 20.28 21.61 1.33 7.281992_93 18.87 20.94 21.26 0.32 1.701993_94 22.68 25.18 26.48 1.30 5.731994_95 26.86 29.81 30.53 0.72 2.681995_96 32.31 35.87 36.11 0.24 0.741996_97 33.76 37.48 40.06 2.58 7.64
Total 8.37
Table 1(b) Capital flows through import misinvoicingYear World’s exports Adjusted India’s imports Import over invoicing
$ billion to India exports From World In $ billion As % of ttlimports
1990_91 23.99 26.63 27.92 1.29 4.621991_92 18.03 20.01 21.06 1.05 4.991992_93 22.64 25.13 24.32 -0.81 -3.331993_94 24.44 27.13 26.74 -0.39 -1.461994_95 29.52 32.77 35.90 3.14 8.751995_96 39.21 43.52 43.67 0.15 0.341996_97 39.86 44.24 48.06 3.82 7.95
Total 8.24
Table 1(c) Capital outflow through misinvoicingOutflow through
MisinvoicingCurrent a/c surplus
Unadjusted Current a/c surplus
Adjusted1990_91 3.16 -9.680 -6.5231991_92 2.39 -1.178 1.2071992_93 -0.50 -3.526 -4.0251993_94 0.91 -1.158 -0.2461994_95 3.86 -3.369 0.4891995_96 0.39 -5.899 -5.5071996_97 6.40 -3.661 2.739
Total 16.61 -28.471 -11.866
25
Table 2 Capital flight estimation using the residual methodFiscal Year
$ mnChange inExternal
Debt
(1)
Non-debtCreatingforeignInflows
(2)
AdjustedCurrent a/c
Surplus
(3)
Changein
forexassets*
(4)
Capital flightadjusted formisinvoicing
(Col. 1+2+3+4)
1990_91 6118 103 -6523 1137 834.631991_92 3911 133 1207 -3383 1868.441992_93 4542 559 -4025 -731 345.011993_94 3204 4153 -2455 -8724 -1612.531994_95 6773 5138 4887 -5640 6759.751995_96 -5418 4881 -5507 3690 -2354.311996_97 747 6008 2739 -5243 4251.36
Totals 19877 20975 -11865 -18894 10092.35* An increase in reserves is indicated by a negative sign and decrease by apositive sign
Table 3 Capital flight estimation using the Morgan Guaranty Trust method
Fiscal Year$ mn
Sources ofForex
(1)
AdjustedCurrent a/c
Surplus
(2)
Net forexAssets of
theBankingsector
(3)
Changein
Forexassets*
(4)
Capital Flightadjusted for
Trademisinvoicing
1990_91 6221 -6523 5511 1698 1396.11991_92 4044 1207 8218 -2707 2544.81992_93 5101 -4025 7752 465 1541.31993_94 7357 -2455 17409 -9657 -2545.21994_95 11911 4887 24971 -7562 4838.11995_96 -537 -5507 23885 1085 -4958.81996_97 6755 2739 29411 -5526 3968.9Totals 40852 -11865 117156 -22201 6785Note: Sources of forex = Change in external debt + non-debt creating foreigninflows* An increase in reserves is indicated by a negative sign and decrease by apositive sign
26
Figure 1
30313233343536373839
Mar-93
Jan-94
Nov-94
Sep-95 Jul-9
6
May-97 30.0031.0032.0033.0034.0035.0036.0037.0038.0039.00
forw ard rate
actual exchange rate
Note: Exchange rates are measured in terms of Rupees per US/$