Embed Size (px)
Citation preview
Tracking Pink Lady apple firmness
Ian Wilkinson Agriculture Victoria
Project Number: AP01036
AP01036 This report is published by Horticulture Australia Ltd to pass on information concerning horticultural research and development undertaken for the apple and pear industry. The research contained in this report was funded by Horticulture Australia Ltd with the financial support of Rohm and Haas Australia Pty Ltd, Phosyn Nutrition Specials and the apple and pear industry. All expressions of opinion are not to be regarded as expressing the opinion of Horticulture Australia Ltd or any authority of the Australian Government. The Company and the Australian Government accept no responsibility for any of the opinions or the accuracy of the information contained in this report and readers should rely upon their own enquiries in making decisions concerning their own interests. ISBN 0 7341 1044 8 Published and distributed by: Horticultural Australia Ltd Level 1 50 Carrington Street Sydney NSW 2000 Telephone: (02) 8295 2300 Fax: (02) 8295 2399 E-Mail: [email protected] © Copyright 2005
Tracking Pink Lady apple firmness -- AP 01036__________________________________________________________________________
1
Horticulture Australia ProjectNumber AP 01036 (November, 2004)
Final ReportIan Wilkinson, Christine Frisina, Peter Franz and Gordon Brown
Department of Primary Industries Research, VictoriaKnoxfield
DEPARTMENT OF PRIMARY INDUSTRIES
TRACKING PINK LADY APPLE FIRMNESS
Tracking Pink Lady apple firmness -- AP 01036___________________________________________________________________________
__________________________________________________________________________2
DPI-Knoxfield
Horticulture Australia Project Number AP01036Tracking Pink Lady apple firmnessFinal ReportProject Leader:
Ian Wilkinson
Department of Primary Industries, Knoxfield,Private Bag 15Ferntree Gully Delivery Centre, Vic. 3156.Phone: 03 9210 9231FAX: 03 9800 3521E-mail: [email protected]
Other key personnel were:
Christine Frisina, Technical OfficerNorm Morrison, Farm support officerMark Collins, Fruit check officerJohn Faragher, ScientistBruce Tomkins, ScientistJanyce Truett, ScientistGlenn Hale, ScientistAndrew Hamilton, ScientistPam Rogers, Technical OfficerPeter Franz, BiometricianFiona Thomson, BiometricianChris Brien, Biometrician (University of South Australia)Colin Little, (Private consultant)Gordon Brown, (Scientific Horticulture Pty Ltd) E-mail: [email protected] Sanders, (Phosyn plc) E-mail: [email protected]
Purpose:
1. Determine the effects of fruit nutrient status, harvest maturity, crop load on Pink Ladyapple firmness after storage and shipping.
2. Determine the effects of rootstocks and retardation on Pink Lady apple firmness.3. Determine the effect of SmartFreshTM on Pink Lady and Jonagold apples firmness.
The project was funded by the Apple and Pear Industry R&D levy, Horticultural Australiaand the Department of Primary Industries, Victoria. Rohm and Haas and Phosyn plcsupplied voluntary contributions.
Tracking Pink Lady apple firmness -- AP 01036__________________________________________________________________________
_________________________________________________________________________3
DPI-Knoxfield
November 2004
Disclaimers:
Any recommendations contained in this publication do not necessarily represent currentHorticulture Australia policy. No person should act on the basis of the contents of thispublication, whether as to matter of fact or opinion or other content, without first obtainingspecific, independent professional advice in respect of the matters set out in thispublication.
The advice provided in this publication is intended as a source of information only.Always read the labels before using any of the products mentioned. The authors, the Stateof Victoria and its employees do not guarantee that the publication is without flaw of anykind or is wholly appropriate for your particular purposes and therefore disclaim allliability for any error, loss or other consequence which may arise from you relying on anyinformation in this publication.
TABLE OF CONTENTS1. MEDIA SUMMARY .................................................................................................................................5
2. TECHNICAL SUMMARY.......................................................................................................................7
3. INTRODUCTION ...................................................................................................................................10
4. GENERAL MATERIALS & METHODS.............................................................................................11
4.1 PROJECT METHODOLOGY AND EXPERIMENTAL DESIGN..........................................................................114.2 FRUIT QUALITY MEASUREMENTS..........................................................................................................11
5. SMARTFRESHTM ...................................................................................................................................12
5.1 SMARTFRESHTM LITERATURE REVIEW ...................................................................................................125.2 EFFECT OF SMARTFRESHTM ON THE FIRMNESS OF PINK LADY APPLES ..................................................155.3 SIMULATED EXPORT TRIAL: EFFECT OF SMARTFRESHTM ON PINK LADY APPLE FIRMNESS....................495.4 COMMERCIAL EXPORT TRIAL: EFFECT OF SMARTFRESHTM ON PINK LADY APPLE FIRMNESS.................545.5 EFFECT OF SMARTFRESHTM ON THE STORAGE QUALITY OF TASMANIAN ‘JONAGOLD’ AND ‘GALA’
APPLES FOR DOMESTIC AND EXPORT MARKETS. .....................................................................................60
6. MATURITY.............................................................................................................................................65
6.1 MATURITY LITERATURE REVIEW ...........................................................................................................656.2 EFFECT OF HARVEST MATURITY ON PINK LADY APPLE FIRMNESS. ........................................................66
7. STORAGE AND SIMULATED SHIPPING.........................................................................................77
7.1 STORAGE AND SHIPPING LITERATURE REVIEW.......................................................................................777.2 EXPERIMENT 1. STORAGE EXPERIMENT.................................................................................................797.3 EXPERIMENT 2. STATIC SIMULATED SHIPPING EXPERIMENT .................................................................88
8. NUTRITION............................................................................................................................................95
8.1 NUTRITION LITERATURE REVIEW...........................................................................................................958.2 EFFECT OF EARLY SEASON FRUITLET NUTRIENT ANALYSIS ON PINK LADY APPLE FIRMNESS. ................988.3 EFFECT OF POST HARVEST CALCIUM DIPPING ON PINK LADY APPLE FIRMNESS....................................118
9. EFFECT OF CROP LOAD AND TREE VIGOUR ON PINK LADY APPLE FIRMNESS..........120
10. WEATHER ............................................................................................................................................124
10.1 WEATHER LITERATURE REVIEW......................................................................................................12410.2 EFFECT OF WEATHER ON PINK LADY APPLE FIRMNESS ...................................................................125
11. ROOTSTOCK AND GROWTH RETARDATION METHODS EFFECTS ON FIRMNESS ANDINTERNAL BROWNING ....................................................................................................................128
11.1 LITERATURE REVIEW ......................................................................................................................12811.2 MINIMISING INTERNAL BROWNING IN PINK LADY APPLES- SCIENTIFIC HORTICULTURE PROJECT ..13011.3 DPI, KNOXFIELD FLESH BROWNING ...............................................................................................150
12. CONCLUSIONS....................................................................................................................................155
13. TECHNOLOGY TRANSFER..............................................................................................................160
13.1 PUBLICATIONS ................................................................................................................................16013.2 MEETINGS AND PRESENTATIONS.....................................................................................................16013.3 IMPLEMENTATION...........................................................................................................................161
14. RECOMMENDATIONS ......................................................................................................................162
15. ACKNOWLEDGMENTS.....................................................................................................................163
16. BIBLIOGRAPHY..................................................................................................................................165
17. APPENDIX ............................................................................................................................................171
Tracking Pink Lady apple firmness -- AP 01036___________________________________________________________________________
__________________________________________________________________________5
DPI-Knoxfield
1. MEDIA SUMMARYAs a result of this project, growers and packers have a new fruit firmness management toolin SmartFreshTM to avoid soft Pink Lady apple outturns on domestic and export markets.Furthermore the project has investigated a number of other production and handlingpractices that may impact on fruit firmness.
Ethylene the fruits’ natural ripening hormone, has been identified as a prime factor in softfruit outturns. SmartFreshTM is a gas that inhibits ethylene action when applied shortly afterharvest to warm or cooled fruit. Fruit treated with SmartFreshTM were significantly firmerthan non-treated fruit after medium and long term air and CA storage plus a simulatedmarketing period. In 2002 and 2003 actual trial shipments of SmartFreshTM treated fruitfrom 12 orchards in the Goulburn Valley were sent to the UK. In both years theSmartFreshTM treated fruit from all orchards exceeded the market specifications whereas theuntreated fruit from most orchards did not meet the export standard. SmartFreshTM insuresagainst soft fruit outturns provided the fruit leave Australia with an average firmness of 7.5kgf and less than 10% of the fruit are 7.0 to 7.4 kgf. Supplementary work to this projectconducted by Dr Gordon Brown in Tasmania showed that treatment of Jonagold and Galaapples with SmartFreshTM resulted in fruit that were well above market specifications.
Overall, the fruit from the optimum harvest time was significantly firmer than the fruit froma later harvest after long-term storage. It did not seem to be linked to starch levels. It wasmore the fact that earlier picked fruit were firmer and remained that way during storagecompared to later picked fruit.
The firmness of the fruit should be monitored both before and during the harvest period. Ifthe fruit is harvested with a firmness greater than 8 kgf with less than 10% of a samplepopulation less than 8 kgf then with good post harvest management it should outturn wellafter long term storage and would be suitable for export. However, in a severe drought yearsuch as the 2003 season, caution should be taken in predicting outturn firmness based onharvest firmness.
Apples should be held at close to 0oC to minimise quality loss through increased fruitrespiration. In the simulated shipping trials conducted as part of the static trials and theSmartFreshTM trials the effects of 6 weeks simulated shipping at 4oC on fruit firmness wasvariable. In some trials there was a significant reduction in fruit firmness at 4oC comparedto maintaining the cool chain at 0oC. The response of the fruit to poor storage temperaturediffered between orchards. Given that shipping containers will most likely have warmerspots during transport it is possible that shipping temperature is a limiting factor toachieving firm outturns in the UK for fruit from some orchards.
There are many publications that show the benefits of elevated calcium with appropriatenitrogen to calcium ratios on improved fruit firmness. However, the industry wanted toknow if foliar sprays applied during the early fruitlet stages 25 grams to 55 grams, couldcorrect mineral imbalances in time to achieve a normal level at harvest. In the two droughtyears that the higher nutrient input were trialed, there was no evidence that the early warningsystem wasn’t working. The nutrient levels did improve between the 25 gram and 55 gramfruitlet stages as a result of the higher nutrient input applied between the 25 gram and 50gram fruitlet stages. However, there were also orchards on lower nutrient inputs whose
Tracking Pink Lady apple firmness -- AP 01036___________________________________________________________________________
__________________________________________________________________________6
DPI-Knoxfield
fruit had similar nutrient levels 90 days after full bloom (DAFB) and at harvest. Therefore,the results from this project are inconclusive. The drought conditions were probablyhaving a bigger effect on fruit firmness than the nutrient levels in the fruit. The nutritionalstatus of the fruit needs to be viewed in relation to the crop load and tree vigour. It may bepossible to carry two consecutive high yielding years provided the trees vigour is reducedand the nitrogen to calcium ratio is low meaning that the calcium available for the fruitdevelopment is not a limiting factor for firm fruit. Nutritional trials are usually run overmany years because the benefits of proper nutrition can take time. Two years was not longenough, particularly during drought years to fully determine the benefits of early fruitletanalysis on fruit firmness at harvest and after storage and export.
Flesh browning (FB) also known as ‘internal browning’ of Pink Lady apples is anundefined physiological condition of fruit, which is expressed during storage under certainconditions. FB was first observed in the 2000 season. The incidence and severityincreased over the next two seasons being worst in 2002 season. FB was not a problem in2003. Three types of browning were characterised in this project, Type I senescent(diffuse browning in the cortex), Type II radial (rays of browning in the cortex), Type IIIcarbon dioxide (patches of browning and associated cavities in the cortex). The problemappears to be orchard specific, with large or misshapen, late maturing fruit being moresusceptible. Seasonal variations, root disease and growth retardation methods influencethe risk of getting FB. In this study, SmartFreshTM applied to Pink Lady apples harvestedat commercial maturity had no significant effect on the incidence and severity of internalbrowning.
Fact sheets have been prepared for minimising firmness loss of Pink Lady apples fordomestic and export markets.
Tracking Pink Lady apple firmness -- AP 01036___________________________________________________________________________
__________________________________________________________________________7
DPI-Knoxfield
2. TECHNICAL SUMMARY
Firmness is a key characteristic that influences consumer acceptability of apples. Firmness isinfluenced by pre-harvest and post-harvest factors. Pink Lady apple premature softening instorage was identified by the industry in 1998 as a significant problem. This was reflected in1998 and 1999 when some export shipments of Pink Lady apples were rejected or downgraded because the fruit was too soft, that is, greater than 10% of the fruit were less than 6.5kgf. The purpose of this research project was to identify when and why Pink Lady applessoften. The probable causes for loss of firmness are well documented. It was proposed todetermine which of the known factors such as fruit nutrient status, harvest maturity, cropload, tree vigour, retardation treatments, colouration, root-stocks, storage atmosphere,ethylene and the use of SmartFreshTM, an ethylene inhibitor and shipping temperature werethe major factors contributing to soft fruit on arrival in the UK.
Ethylene is the fruits natural ripening hormone. SmartFreshTM (active ingredient, 1-methylcyclopropene) is a gas that blocks the action of ethylene and the effect on firmnessloss during storage, shipping and marketing is significantly reduced. A single application ofSmartFreshTM at 625 parts per billion (ppb) applied shortly after harvest to warm or cooledfruit significantly improved fruit quality (firmness, colour and total soluble solids). WhileSmartFreshTM is not a replacement for refrigeration, apple quality will deteriorate slowerunder sub-optimal temperature conditions during shipping if previously treated withSmartFreshTM. In 2002 and 2003 actual trial shipments of SmartFreshTM treated Pink Ladyapples from 12 orchards in the Goulburn Valley were shipped to the UK. SmartFreshTM
treated fruit from all 12 orchards met import market specification for firmness in both yearswhereas fruit not treated with SmartFreshTM from most orchards failed to meet the requiredstandard. Supplementary work to this project conducted by Dr Gordon Brown showed thattreatment of Jonagold and Gala apples with SmartFreshTM resulted in fruit that were wellabove the market specifications. Production of ripe aromas is stimulated by ethylene duringapple fruit ripening. Aromas and flavours were not measured in this project. The impact ofSmartFreshTM on ripe aromas and flavours from overseas results suggest that consumer likeSmartFreshTM treated fruit. However, the acceptance of SmartFreshTM treated fruit byAustralian consumers will need to be established.
Overall, the fruit from the first harvest was significantly firmer than the fruit from secondharvest after long-term storage. It did not seem to be directly correlated to starch levels. Itwas more the fact that earlier picked fruit were firmer and remained that way during storagecompared to later picked fruit.
The firmness of the fruit should be monitored before and during the harvest period. If thefruit is harvested with a firmness greater than 8 kgf but with less than 10% of a samplepopulation less than 8 kgf then with good post harvest management it should outturn wellafter long term storage and would be suitable for export. However, in a severe drought yearsuch as the 2003 season caution should be taken in predicting outturn firmness based onharvest firmness
Ethylene is a major limiting factor for firm fruit outturns. This was demonstrated by the useof SmartFreshTM to block ethylene action that significantly increased fruit firmness for allorchards. Therefore, if possible, the rooms need to be scrubbed for ethylene while the
Tracking Pink Lady apple firmness -- AP 01036___________________________________________________________________________
__________________________________________________________________________8
DPI-Knoxfield
rooms are being filled and during storage, if less than 1 ppm in the storage roomatmosphere can be achieved. In addition, the fruit needs to be cooled rapidly after harvestand the fruit stored in 1.5% oxygen. The alternative to ethylene scrubbing is treating thefruit with SmartFreshTM.
Apples should be held at close to 0oC to minimise quality loss through increased fruitrespiration. In the simulated shipping trials conducted as part of the static trials and theSmartFreshTM trials the effects of 6 weeks simulated shipping at 4oC on fruit firmness wasvariable. In some trials there was a significant reduction in fruit firmness at 4oC comparedto maintaining the cool chain at 0oC. The response of the fruit to poor storage temperaturediffered between orchards. Given that it is likely that shipping containers will have warmspots during transport it is possible that poor shipping temperatures are a contributor to softoutturns in the UK for fruit from some orchards.
There are many publications that show the benefits of elevated calcium with appropriatenitrogen to calcium ratios on improved fruit firmness. However, the industry wanted toknow if foliar sprays applied during the early fruitlet stages 25 grams to 55 grams, couldcorrect mineral imbalances in time to achieve normal level at harvest. In the two droughtyears that the higher nutrient input was trialed, there was no evidence that the earlywarning system wasn’t working. The nutrient levels did improve between the 25 gram and55 gran fruitlet stages as a result of the higher input applied between the 25 gram and 50gram fruitlet stages. However, there were also orchards on lower nutrient inputs whosefruit had similar nutrient levels 90 DAFB and at harvest. Therefore, the results from thisproject are inconclusive. The drought conditions were probably having a bigger effect onfruit firmness than the nutrient levels in the fruit.
The nutritional status of the fruit needs to be viewed in relation to the crop load and treevigour. It may be possible to carry two consecutive high yielding years provided the treesvigour is reduced and the nitrogen to calcium ratio is low meaning that the calciumavailable for the fruit development is not a limiting factor for firm fruit.
The drought conditions were probably having a bigger effect on fruit firmness than thenutrient levels in the fruit. Nutritional studies are usually run over many years andnutritional programs such as Phosyn full nutritional program can take several years beforethe full benefits are achieved. Therefore, more years of evaluation are needed to clarify thebenefits of the early warning nutrient correction system. Hopefully, this will not includemore years of drought conditions.
Over all, there appears to be a need to get more sprays on during the 50 DAFB when thecell division phase of fruit growth occurs to maximise the mineral levels in the fruit. Thisshould have maximum effect on improving Pink Lady apple firmness, colour and returnbloom of the trees in subsequent seasons.
DPI, Knoxfield will continue to work with Phosyn in analysing the full set of mineral dataand the results will be made available to the industry when they are complete.
A postharvest calcium dip of apples has been shown to improve fruit firmness outturn forother apple varieties. In this project, there was no significant effect of "Stopit" calcium dip(16% calcium as calcium chloride) used at the rate of 1.35 litres per 100 litre of water on
Tracking Pink Lady apple firmness -- AP 01036___________________________________________________________________________
__________________________________________________________________________9
DPI-Knoxfield
fruit firmness after 8 months CA storage. This has also been confirmed by Gordon Brownin the HAL funded project on 'Jonagold' apples (AP99031). The failure to achieve asignificant result may have been due to 1) the recommended rate being too low to benefitfruit firmness, or 2) the fruit was not dipped on the day it was picked. Further research isneeded to confirm these hypotheses.
The weather as measured by accumulated degree-days was not significantly differentbetween the orchards and was not seen as a major factor affecting fruit firmness.However, the micro-climatic differences associated with orchards 1, 4, 9 and 10 that wereclose to the Goulburn river cannot be overlooked. Early red colour development andharvesting fruit less mature would have a positive effect on firmness.
Flesh browning (FB) of Pink Lady apples is a physiological condition of fruit, which isexpressed during storage. FB was first observed in the 2000 season. The incidence andseverity increased over the next two seasons being worst in 2002 season. FB was not amajor problem in 2003. Three types of browning were characterised in this project. TypeI: senescent (diffuse browning in the cortex), Type II: radial (rays of browning in thecortex), Type III: carbon dioxide (patches of browning and associated cavities in thecortex). In 2001 and 2002, fruit from 6 and 12 orchards respectively harvested atcommercial maturity were stored in the same controlled atmosphere CA (2.5% O2 plus 1%CO2) tent for 4 months before being shipped to the UK. FB assessments showed that onlysome of the orchards had FB that suggests the problem is orchard specific and that the fruitis pre-conditioned to the disorder prior to storage. Seasonal conditions strongly influencethe incidence of FB and it was absent in 2003. Dr Gordon Brown’s work shows that overmature fruit at harvest, root disease, less vigorous root-stocks and cincturing are factorsthat increase the risk of getting FB. Regalis a growth inhibitor and reflective cloths aretreatments growers could use to reduce the risk of fruit developing FB. Storage quality(firmness and total soluble solids) was not affected by rootstock, cultural practices(cincturing, chain-sawing, summer-pruning, Regalis, Retain / Ethrel, or reflectivecloth). Work done with the ethylene inhibitor SmartFreshTM at DPI-Knoxfield suggests thatethylene is not influencing the incidence and severity of FB.
Fact sheets have been prepared for minimising firmness loss of Pink Lady apples fordomestic and export markets.
Tracking Pink Lady apple firmness -- AP 01036___________________________________________________________________________
__________________________________________________________________________10
DPI-Knoxfield
3. INTRODUCTIONFirmness is a key characteristic that influences consumer acceptability of apples. Firmnessis influenced by pre-harvest and post-harvest factors. Pre-harvest factors that influenceapple firmness at harvest have been reviewed by DeEll et.al. 2001; Harker et. al. 1997;Johnston et al. 2000c and Sams, 1999. However, there is limited information available onthe influence of pre-harvest factors on softening rates of apples through storage (Johnstonet al. 2000c). Pre-harvest factors include climatic effects, temperature, light intensity,sunshine hours, rainfall, cultural practices such as mineral nutrition, timing, irrigation,thinning, tree management, growth regulators and genetic factors such as rootstocks andinterstocks. Johnston et. al., (2002c) reviewed the pattern of softening for harvested applefruit and how it is influenced by different pre-harvest at harvest and post-harvest factors.Many apple cultivars have three phase changes in firmness loss. Fruit soften slowly duringphase (I), more rapidly during phase (II) which once induced is difficult to stop and phase(III) softening is slow. It is important to prolong phase (I) if firmness is to be maintainedduring long-term storage. However, despite many softening studies, there is still poorunderstanding of what causes firmness variation in the marketplace. The major objectiveof post-harvest procedures is to maintain fruit firmness during storage, grading andtransport to have crisp fruit reach the consumer. This is achieved by correct harvestmaturity and limiting respiration and ethylene production during storage and transport.
Premature softening of Pink Lady apple in storage was identified by the industry in 1998as a significant problem. This was reflected in 1998 and 1999 when some shipments ofPink Lady apples to the UK were rejected or down graded because the fruit was too soft.The Australian apple industry is domestic market driven. The domestic market demandhighly coloured fruit which can result in the fruit being softer at harvest than is optimumfor fruit destined for long-term storage and export. Overseas market quality standards forfruit firmness are much higher than the standards required on the domestic market. TheUK standard requires Pink Lady apples to have a firmness value greater than or equal to 7kgf with a minimum acceptance of 10% at 6.0 to 6.9 kgf compared to 6.5 kgf for domesticconsumption. But the rewards can be higher for exported fruit. UK consumers areprepared to pay a premium for Australian Pink Lady apples. Therefore, if Australiangrowers are to maintain a premium status for their fruit, poor outturns must be stopped.Otherwise Australia’s reputation as suppliers of high quality apples will be damaged andwill result in reduced financial returns.
Growers seeking a greater return for their Pink Lady apples will need to export and thiswill require planning to start immediately after harvest, targeting specific blocks. In 2003there was an over supply of Pink Lady apples on the domestic market. The pressure toexport will be greater in years to come and provided the exchange rate is favourable,growers can make better money from exporting their fruit compared to returns on thedomestic market. However, if the Australian Pink Lady apple market share is to increase inthe UK, it will require consistent quality apples.
The purpose of this research project was to identify when and why Pink Lady applessoften. The probable causes for loss of firmness are well documented. It was proposed todetermine which of the known factors such as fruit nutrient status, maturity, crop load, treevigour, retardation treatments, colouration, root-stocks, storage atmosphere, ethylene andthe effect of SmartFreshTM, an ethylene inhibitor and shipping temperature are majorlimiting factors contributing to soft fruit on arrival in the UK.
Tracking Pink Lady apple firmness -- AP 01036___________________________________________________________________________
__________________________________________________________________________11
DPI-Knoxfield
4. GENERAL MATERIALS & METHODS
4.1 Project methodology and experimental designFruit was harvested from 6 orchards (2001 harvest) and 12 orchards (2002 and 2003harvests) in the Goulburn Valley. The trees were grown on MM106 rootstock and the treeage ranged from 6 to 9 years (in 2002). The names of growers participating in this projectremain confidential. Therefore, each orchard was given an identifying number. The sameorchard numbers were used through out the report, for every experiment conducted at DPI,Knoxfield. At each orchard, five field blocks of trees were tagged and the fruit from eachfield block was matched with its storage replicate block design.
4.2 Fruit Quality Measurements
4.2.1 FirmnessFruit was assessed for firmness on both sides of the fruit (chosen at random) using a hand-held Effigi penetrometer or in the UK a automated Food Texture Analyser (FTA). A stripof skin was removed with a vegetable peeler from the cheek of the fruit, midway betweenthe stem and calyx, and the plunger inserted up to the scribed line. The plunger diameterwas 11 mm. Results were recorded in kg force and the mean of several apples wascalculated.
4.2.2 MaturityFruit maturity was assessed using the starch iodine test, which measures the distribution ofstarch in the fruit, and the extent to which starch has been converted to sugars. At eachharvest twenty fruit were picked at shoulder height from a representative sample of trees.Apples were assessed as soon as possible after picking using the Ctifl 10 point scale starchindex scale, where 1 = no starch conversion in the apple interior and 10 = no starch left inthe apple interior. Patterns were compared using a radial type rating scale (see Section6.2.6. Plate 1).
4.2.3 Total Soluble SolidsTotal soluble solids (TSS) was measured using a KRÜSS model DR 10/32 digitalrefractometer or a hand held visual refractometer. Individual fruit were measured, using thejuice expressed while conducting firmness tests and the mean value was then calculated.
4.2.4 ColourFruit skin colour was measured with a Minolta CR-200 Chromameter (Minolta, Osaka,Japan) using the white calibration tile and a C illuminant (6774 k). Hue angle (H°) wascalculated from the L, a and b measurements using the equation H° = arc (tangent b/a)where 0° = red, 90° = yellow and 180° = green.
4.2.5 Internal browning incidence and severityIn 2001 season export fruit was assessed only for incidence of internal browning (IB). AnyIB regardless of the intensity of browning or percentage of flesh cut surface covered wasrecorded and the percentage of fruit affected calculated. In 2002 and 2003 seasons exportfruit the incidence and severity of IB was recorded in export fruit. Severity was rated as 1= none, 2 = trace, 3 = slight, 4 = moderate and 5 = severe (see Section 11.3.2. Plate 1).
Tracking Pink Lady apple firmness -- AP 01036___________________________________________________________________________
__________________________________________________________________________12
DPI-Knoxfield
5. SMARTFRESHTM
5.1 SmartFreshTM literature review
SmartFreshTM [active ingredient 3.3% 1-methylcyclopropene (1-MCP)] is a gas that blocksthe action of ethylene in plant tissue (Sisler et al. 1996a, b). SmartFreshTM has beenformulated as a powder that releases the active ingredient 1-MCP when mixed with water.It has a non-toxic mode of action similar to the naturally occurring plant substance, ethylene.In addition, residues in apples are less than 5 ppb, which is well below the level generallyconsidered significant by regulatory authorities (SmartFreshTM Apple Technical Bulletin).
SmartFreshTM is being developed for use in fruit and vegetables by AgroFresh Inc. a wholly-owned subsidiary of the Rohm and Haas Company. SmartFreshTM has been registered foruse on apples in Australia (April 16th, 2004), the United States, Chile, Argentina, Mexico,New Zealand and South Africa (Turner, 2003).
Since ethylene is the plant growth regulator involved in fruit ripening, preventing its actionby the use of SmartFreshTM has the potential to extend storage life of horticultural products.SmartFreshTM works by binding the active ingredient 1-MCP irreversibly to the ethylenebinding sites of the plant. In apples it is thought after some time, new receptor sites aremanufactured allowing the return of ethylene action and therefore normal ripening andsenescence (Beaudry, 2003). The effects of SmartFreshTM on apples are similar to those ofcontrolled atmosphere (CA) which suppresses ethylene production and action, resulting inpreservation of firmness and titratable acidity (Anderson and Abbot, 1975; Knee, 1976).
SmartFreshTM should be added as soon as possible after harvest before the climacteric peakof respiration has occurred (SmartFreshTM Apple Technical Bulletin). The rate of ethyleneproduction in apples is low and fairly constant in preclimacteric fruit but as the fruitcommences ripening there is an abrupt increase in the rate of production of ethylene, knownas the climacteric. To realise maximum benefit of SmartFreshTM fruit should be harvested atoptimum quality which is slightly before or just after ripening has begun. AgroFresh Inc.recommends that the interval between harvest and storage be no longer than 7 – 14 days.Cooling fruit in accordance with standard commercial practices remains critical to qualityand should continue to form part of the storage regime.
SmartFreshTM is used at extremely low concentration 250 to 1000 parts per billion (ppb) inthe airspace around the fruit. The time needed for effective treatment is relatively short 12 to16 hours at 0°C to 20°C (Beaudry 2003). AgroFresh Inc. recommends a single applicationfor 24 hours (SmartFreshTM Apple Technical Bulletin). It is thought that better responses toSmartFreshTM are obtained when fruit are treated warm on the day of harvest (Watkins,2000). However, until we know more about SmartFreshTM it is best to cool the fruit beforeapplying the treatment. At this stage normal storage temperatures are recommended forstorage of SmartFreshTM treated fruit (Watkins et al. , 2000).
SmartFreshTM substantially reduces the loss of apple flesh firmness (Blankenship andUnrath, 1998, Pre-Aymard et al. 2003, Fan et al. 1999a; Fan et al. 1999b; Mir et al. 2001),Rupasinghe et al. 2000, Watkins et al. 2002, Zanella, 2003) and also titratable acidity of
Tracking Pink Lady apple firmness -- AP 01036___________________________________________________________________________
__________________________________________________________________________13
DPI-Knoxfield
different cultivars of preclimacteric and climacteric apples after long-term cool-storage andreduces respiration rate and ethylene production (Fan et al. 1999a).
A single postharvest treatment of SmartFreshTM can prevent ripening for an extended period(greater than 30 days) at ambient (23.9oC) temperature relative to non-treated controls(Beaudry 2003). Firmness of apples treated with SmartFreshTM stored in regular air (RA)was statistically equivalent to untreated CA, the current industry standard for storing apples(Warner et al. 2002).
However, Watkins et al.(2000) reported the effect of SmartFreshTM was greater in controlledatmosphere than in air storage. Apples treated with SmartFreshTM combined with CAstorage consistently outturn with higher firmness, titratable acidity and sugars after 6 monthsstorage plus 7 days ripening at room temperature compared to CA alone (Warner et al.2002).
SmartFreshTM eliminates or substantially reduces physiological disorders of apple fruitduring storage such as superficial scald, soft scald, core flush and greasiness (Rupasinghe et.al., 2000; Watkins et al. 2000; Kreidl et al. 2003, Zanella, 2001, Fan et al. 1999b).
SmartFreshTM provides very good control of superficial scald at very low concentrations.There is strong evidence that α-farnesene is involved in scald development. Ethylene playsa part in regulating α-farnesene biosynthesis during fruit ripening and there are correlationsbetween increasing internal ethylene and α-farnesene production (Ju and Curry, 2000). Aswell as inhibiting ethylene action 1-MCP is reported to delay or reduce the accumulation ofα-farnesene and its oxidation products (Watkins et al. 2000). This would therefore lead to adelay in scald development.
The most common current chemical treatment for controlling superficial scald isdiphenylamine (DPA). However, caution must be taken in substituting SmartFreshTM fordiphenylamine (DPA) to control superficial scald for all varieties (Watkins, 2002). In termsof scald control SmartFreshTM needs to be monitored over several seasons before it can berecommended as a replacement for DPA.
Production of ripe aromas is stimulated by ethylene during apple fruit ripening (Mattheis etal. 2002). Fruit treated with SmartFreshTM
have delayed production of many compoundsthat impart ripe, fruity aromas and contribute to characteristic flavour. SmartFreshTM reducesvolatile production of apple fruits (Song et al. 1997) and inhibits differentially theproduction of many volatiles alcohols and esters in climacteric ‘Fuji’ apples compared tomethyl jasmonate (Fan and Mattheis, 1999c). The effect of SmartFreshTM is similar inmagnitude to that induced by long-term CA. However, production of ripe aroma declinesrapidly after SmartFreshTM treatment compared to effects of CA, which takes several monthsto develop. SmartFreshTM treated fruit maintain the fresh green aromas. How important ripearomas are to the consumer needs to be established. For example, the absence of ripearomas is potentially more important for Gala than for Granny Smith. Lurie et al. (2002)reported that Anna apples treated with 1µl /L 1-MCP developed less ripe aromas thancontrol fruit or fruit treated with 0.1µl /L 1-MCP, although the consumer preference was forthe fruit treated with the higher concentration. Therefore, while the impact of SmartFreshTM
on ripe aroma production is pronounced, it remains to be demonstrated how this impacts onmarketability of fruit on a cultivar by cultivar basis.
Tracking Pink Lady apple firmness -- AP 01036___________________________________________________________________________
__________________________________________________________________________14
DPI-Knoxfield
One big concern about SmartFreshTM is that fruit that are harvested too early may fail todevelop flavour (Watkins, 2000). However, this does not mean that fruit should be pickedover-mature. The great temptation for growers will be to pick fruit later with redder skincolour and size and then treat them with SmartFreshTM. But until we know more about theimpact of harvest maturity on eating quality it is suggested that apples should be harvestedas per normal best practice for long term CA storage.
SmartFreshTM substantially improves quality of apples stored for at least 2 months in air, andtherefore has the potential to improve the quality of air-stored fruit presented to theconsumer (Watkins, 2002).
Apples lose quality during shipment if the fruit is mishandled or particularly when displayedat retail without refrigeration (Mattheis et al. 2002). While SmartFreshTM is not areplacement for refrigeration for prolonged storage, apple quality will deteriorate slowerunder sub-optimal temperature conditions if previously treated with SmartFreshTM.
A major potential benefit of SmartFreshTM will be in maintaining apple firmness post storageduring shipping. Red Delicious apples that were stored for 140 days in CA at 0.6°Cfollowed by 4 weeks at 0°C plus 7 days at 20°C remained firmer than non-treated fruit(SmartFreshTM Apple Technical Bulletin).
SmartFreshTM has been reported to increase the risk of CO2 injury in sensitive cultivars(Watkins, 2002). However, if the CO2 level is maintained low during the first 4 weeks ofstorage this should not be a problem.
The Tracking Pink Lady apple project has conducted a series of experiments during the pastthree years, to establish the benefits of SmartFreshTM on maintaining fruit firmness afterlong-term air and CA storage, after simulated and actual shipments of fruit to the UK.Scientific Horticulture P/L conducted trials with Jonagold and Gala apples. The results,conclusions, discussion and recommendations of this body of SmartFreshTM work arepresented as follows.
Tracking Pink Lady apple firmness -- AP 01036___________________________________________________________________________
__________________________________________________________________________15
DPI-Knoxfield
5.2 Effect of SmartFreshTM on the firmness of Pink Ladyapples
INTRODUCTIONPremature softening of Pink Lady apples in storage or during sea-freight export has beenidentified by the industry as a significant problem. This was reflected in 1998 and 1999when some shipments of Pink Lady apples to the UK were rejected or down graded becausethe fruit was too soft. The unreliability of Australian Pink Lady apples arriving in the UKforced some suppliers to stop exporting. UK consumers are prepared to pay a premium forAustralian Pink Lady apples but continued quality failures may force the insurancecompanies to increase the cost of insurance premiums to a level where export is not a viableoption.
Large numbers of Pink Lady apple trees are in the ground and most are not yet in fullproduction. In three years time it is estimated that there will be an over supply of Pink Ladyapples on the domestic market. The future success of Pink Lady apples hinges on export.Failure to fully develop export markets will see a significant downturn in the return forgrowers of Pink Lady apples.
If the Australian Pink Lady apple market share is to increase in the UK, it will requireconsistent, high quality apples.
SmartFreshTM (1-methylcyclopropene or1-MCP) is a gas that can block the action ofethylene in harvested fruit. Preliminary storage trials overseas and at DPI, Knoxfield havedemonstrated that apples treated with SmartFreshTM before storage or before simulated sea-freight export can receive a significant beneficial effect by reducing apple softening. It wasproposed to determine the benefits of treating Pink Lady apples before storage (air and CA),and before simulated sea-freight to maintain apple firmness. SmartFreshTM is for use in theUSA, New Zealand, Chile and Argentina for use on apples and it now registered inAustralia.
This report summarises a series of trials conducted at DPI, Knoxfield in 2001, to establishthe effect of 1-MCP on the storage life and quality of Pink Lady apples.
5.2.1 EXPERIMENTAL OBJECTIVES
Experiment 1(Parts 1 and 2). Effect of SmartFreshTM treatment temperature andtreatment time on the storage life and quality of Pink Lady apples.
Determine the effect of harvest maturity, SmartFreshTM treatment temperature andSmartFreshTM treatment time on Pink Lady storage life and quality.
Experiment 2 (Parts 1, 2 and 3). SmartFreshTM Pink Lady simulated shipment trial.Effect of treatment before and after storage.
Determine if Pink Lady apples treated with SmartFreshTM immediately after harvest, afterstorage or a combination of both, outturn firmer than untreated fruit.
Tracking Pink Lady apple firmness -- AP 01036___________________________________________________________________________
__________________________________________________________________________16
DPI-Knoxfield
Experiment 3. SmartFreshTM Pink Lady commercial shipment trial.Effect of treatment and growing locality.
Determine the effect of treatment with SmartFreshTM on Pink Lady apples collected fromaround Australia and incorporate the fruit after CA storage in an actual shipment to the UKwhere the fruit firmness will be assessed.
5.2.2 MATERIALS AND METHODS
Handling, SmartFreshTM treatment, storage and simulated sea-freight and marketing
Experiment 1 (Part 1). Effect of SmartFreshTM treatment temperature and treatment timeon the storage life and quality of Pink Lady apples.
Harvest 1Fruit was picked at grower one's orchard on the 11th April at the optimum harvest maturityfor long term CA storage (starch score 4.8, firmness 9.1 kgf and TSS 14.1 °Brix). The fruitwas transported to DPI, Knoxfield and placed at 2.5°C on the 11th April. 15 fruit wereplaced into nylon netting bags on the 14th April and then placed at 0°C. Three rooms wereset at 4°C, 12°C or 20°C, each containing 16 treatment chambers. The treatment chamberconsisted of 150-litre stainless steel base and a perspex lid, which was sealed by a watermoat. Each treatment chamber contained a small air pump to create some air circulation.There were four treatment chambers per experimental block. The treatments were a control(0 ppb) and 10,000 ppb SmartFreshTM by three treatment times and three temperatures. Onthe 15th April six bags of fruit were placed into each treatment chamber (3 bags for airstorage and 3 bags for CA, allowing for three removal times 12, 16 and 20 weeks) at 4°C,12°C or 20°C. The fruit pulp temperatures were at the room temperature when theSmartFreshTM treatments commenced. SmartFreshTM powder (3.3% active ingredient) wasprovided by Rohm and Haas Ltd. The manufacturer provided the weight of 1-MCP powderneeded to provide a specific concentration of SmartFreshTM gas in a given volume of air. Inaddition, 50 ml of potassium hydroxide (20% w/v) was placed in the chambers to absorbcarbon dioxide. SmartFreshTM was weighed into glass vials and taped to the perspex lidbelow an injection port. Water at room temperature was injected into the vials containingSmartFreshTM powder at a rate of 16 ml per gram of SmartFreshTM. The fruit was treated for12, 24 or 48 hours at 4°, 6° or 12°C, 24 hours at 12°C and 3, 6 or 12 hours at 20°C. Thecontrol fruit received no SmartFreshTM were stored in an unsealed treatment chamber for 48hours at 0°C, 24 hours at 12°C and 12 hours at 20°C. Fruit was then put in storage at 0°C inair or CA (2.5% O2 : 2.0% CO2) on the 20th April. The treatment times were synchronisedto finish at the same time.
Two storage rooms both set at 0°C were used to store two experimental blocks. The storageblocks corresponded to the treatment blocks. The 6 bags per treatment chamber wereseparated for storage, three for air storage and three for CA storage. The three bags for 3removal times were stored in separate CA chambers or for air-stored fruit in crates with ahigh humidity liner.
Harvest 2Fruit was picked at grower one's orchard on the 18th April with a harvest maturity suitablefor long term CA storage (starch score 5.5, firmness 9.2 kgf and TSS 14.5 °Brix). The fruit
Tracking Pink Lady apple firmness -- AP 01036___________________________________________________________________________
__________________________________________________________________________17
DPI-Knoxfield
was transported to DPI, Knoxfield and placed at 4°C on the 18th April. On the 20th April 15fruit were placed into nylon netting bags and then placed at 4°C, 12°C or 20°C. The fruitpulp temperature was at the room temperature when the SmartFreshTM treatmentscommenced. The SmartFreshTM treatments were 0 ppb and 10,000 ppb. The treatmentprocedure, treatment temperatures, treatment times and storage were the same as describedabove. The fruit was placed in storage at 0°C in air or CA (2.5% O2 : 2.0% CO2) on the 23rd
April.
Fruit quality was assessed after the simulated marketing period. That is, after 12, 16 or 20weeks storage followed by 6 weeks simulated sea-freight export at 0°C and 6 days at 20°Cto simulate marketing.
Experimental Design:
Two SmartFreshTM treatments (before storage) x 3 treatment temperatures x 3 treatmenttimes x 2 storage atmospheres x 3 storage times x 1 simulated marketing time x 4 replicateblocks x 15 fruit per replicate.
SmartFreshTM concentration: 10,000 ppb or control (0 ppb).
Treatment time x temperature: 3, 6 and 12 hours at 20°C 6, 12 and 24 hours at 12°C 12, 24 and 48 hours at 4°C
Maturity at harvest: Pick 1 (11th April) and Pick 2 (18th
April) were suitable for long term CA.
Timing of treatment application: Before storage.
Storage atmosphere: Air or Controlled atmosphere (2.5% O2 : 2 CO2).
Storage time and temperature: 12, 16 or 20 weeks storage at 0°C
Simulated market time and temperature: 6 days at 20°C.
Statistical Analysis
The data was analysed by analysis of variance (ANOVA) using Genstat version 5.4.2software (All tests used the 5% significance level unless otherwise specified).
Experiment 1 (Part 2). Effect of SmartFreshTM treatment temperature andtreatment time on the storage life and quality of Pink Lady apples.
Fruit was picked at grower one's orchard on the 27th April at commercial pick maturitysuitable for medium term CA storage (starch score 7.5, firmness 8.3 kgf and TSS 14.5°Brix). The fruit was transported to DPI, Knoxfield and placed at 0°C on the 27th April. Onthe 4th May 8 fruit were placed into nylon netting bags and then placed at 4°C, 12°C or 20°Cand the 1-MCP treatment (0 ppb and 1,000 ppb for 12 hours) applied. The fruit pulp
Tracking Pink Lady apple firmness -- AP 01036___________________________________________________________________________
__________________________________________________________________________18
DPI-Knoxfield
temperature was at room temperature when the SmartFreshTM treatments commenced. ASmartFreshTM stock concentrate of 10,000,000 ppb was prepared and 15 ml of theconcentrate was injected into the treatment chambers. 15ml of saturated ammoniumsulphate was injected into the concentrate flask to standardise the volume and pressure. Thefruit was placed at 0°C in CA (2.5% O2 : 2.0% CO2) on the 8th May.
In addition, fruit was treated with SmartFreshTM (0 ppb and 1000 ppb) for 12 hours at 20°Cor 48 hours at 4°C after which the fruit was stored in air for 16 weeks at 0°C.
Fruit quality was assessed after the simulated marketing period. That is, after 16 weeksstorage followed by 6 weeks simulated sea-freight at 0°C and 6 days at 20°C to simulatemarketing.
Experimental Design:
For CA stored fruit:Two SmartFreshTM treatments x 3 treatment temperatures x 1 treatment time x 1 storageatmosphere x 1 storage time x 1 sea-freight time x 6 replicate blocks x 8 fruit per replicate.
For air stored fruit:Two SmartFreshTM treatments x 2 treatment times x 1 storage atmosphere x 1 storage time x1 sea-freight time x 6 replicate blocks x 8 fruit pre replicate
For air and CA stored fruit:SmartFreshTM concentration: 1,000 ppb or control (0 ppb)
Treatment time: CA: 12 hoursAir: 12 hours or 48 hours
Treatment temperature: CA: 4°C, 12°C or 20°CAir: 20°C for 12 hour treatment time or 4°Cfor 48 hour treatment time
Maturity at harvest: Late pick (27th April) suitable for medium term CA
Timing of treatment application: Before storage
Storage atmosphere: Air or Controlled atmosphere(2.5% O2 : 2% CO2)
Storage time and temperature: 16 weeks storage at 0°C
Simulated market time and temperature: 6 days at 20°C
Statistical Analysis
The data was analysed by analysis of variance (ANOVA) using Genstat version 5.4.2software. (All tests used the 5% significance level unless otherwise specified).
Tracking Pink Lady apple firmness -- AP 01036___________________________________________________________________________
__________________________________________________________________________19
DPI-Knoxfield
Experiment 2 (Part 1). SmartFreshTM Pink Lady simulated shipment trial. Effect oftreatment before storage.
Fruit was picked on the 26th April from growers two and threes' orchards. Fruit picked atgrower two's orchard was at a commercial pick maturity suitable for medium term CAstorage (starch score 7.6, firmness 8.4 kgf and TSS 14.6 °Brix). Fruit picked at growerthree's orchard was at commercial pick maturity suitable for medium term CA storage(starch score 7.6, firmness 9.0 kgf and TSS 16.4 °Brix). The fruit was stored at 0°Covernight in a commercial store before being transported on the 27th April to DPI, Knoxfieldand placed at 4°C.
On the 2nd May the fruit pulp temperature was warmed to 20°C before commencing theSmartFreshTM treatment (1000 ppb for 14 hour treatment).
The fruit was prepared for the SmartFreshTM treatment by placing 15 fruit in nylon nettedbags. Two bags of 15 fruit were placed into each of 5 treatment chambers to provide fruitfor storage in air and CA at 0°C. Control untreated fruit were in unsealed treatmentchambers during treatment. A SmartFreshTM stock concentrate of 10,000,000 ppb wasprepared and 15 ml of the concentrate was injected into the treatment chambers. 15ml ofsaturated ammonium sulphate was injected into the concentrate flask to standardise thevolume and pressure.
On the 3rd May the fruit was returned to 0°C for the air and CA storage phase. CA storagecommenced on the 4th May.
Fruit quality was assessed after the simulated marketing period. This is, after 12 weeks airstorage or 18 weeks CA storage, followed by 6 weeks simulated sea-freight and 1 day at20°C simulated marketing.
Experimental Design:
Two SmartFreshTM treatments (before storage) x 2 storage atmospheres x 1 storage time x 1sea-freight time x 2 simulated sea-freight temperatures x 5 replicate blocks x 15 fruit perreplicate.
Treatments:
SmartFreshTM concentration: 0 ppb or 1,000 ppb.
Maturity at harvest: Late pick (26th April) suitable for mediumterm CA.
Treatment time: 14 hours.
Treatment temperature: 20°C.
Storage atmosphere: Air or Controlled atmosphere(2.5% O2 : 2% CO2).
Tracking Pink Lady apple firmness -- AP 01036___________________________________________________________________________
__________________________________________________________________________20
DPI-Knoxfield
Storage time: 12 weeks for air storage and 18 weeks for CAstored fruit.
Simulated sea-freight temperature: 0°C or 4°C.
Simulated sea-freight time: 6 weeks.
Simulated marketing time and temperature: 1 day at 20°C.
Sea-freight atmosphere: Air.
Statistical Analysis
The data was analysed by analysis of variance (ANOVA) using Genstat version 5.4. 2software. (All tests used the 5% significance level unless otherwise specified).
Experiment 2 (Part 2). SmartFreshTM Pink Lady simulated shipment trial. Effect oftreatment before and after storage.
Fruit was picked at grower two's orchard on the 17thApril with a harvest maturity suitablefor long term CA storage (starch score 5.1, firmness 8.7 kgf and TSS 13.4 °Brix). The fruitwas transported to DPI, Knoxfield and was placed at 0°C on the 17th April. On the 19th
April 15 fruit were placed in nylon netting bags at room temperature. The fruit pulptemperature was approximately 20°C when the SmartFreshTM treatment (10,000 ppb for 14hours) commenced on the 19th April. The SmartFreshTM powder in the glass vial techniquewas used to administer the 1-MCP. The fruit was placed at 0°C in air or CA (2.5% O2 :2.0% CO2) on the 20th April.
The following treatment combinations were applied:1. Fruit with or without SmartFreshTM applied before storage in air and CA for 16 weeks
followed by 6 weeks simulated sea-freight in air at 0°C and 6 day at 20°C to simulatemarketing.
2. Fruit with or without SmartFreshTM applied before storage in air and CA, followed by apre-shipment treatment with or without SmartFreshTM (1000 ppb for 18 hours at 4°C),followed by 6 weeks simulated sea-freight in air at 0°C and 6 days at 20°C to simulatemarketing.
3. Fruit with or without SmartFreshTM applied before storage in CA, followed by 6 weekssimulated sea-freight in air or CA (2.5% O2 : 2.0% CO2) at 0°C and 6 days at 20°C tosimulate marketing.
After treatment the three CA storage treatment combinations were randomised and allocatedto one of three CA tubs per block (4 blocks in total). The air storage treatment combinationswere stored in perforated plastic bags to maintain a high humidity air environment andplaced on top of their matching CA treatments.
Fruit quality was only assessed after the simulated marketing period. This is, after 16 weeksstorage, followed by 6 weeks at 2°C to simulate sea-freight and 6 days at 20°C to simulatemarketing.
Tracking Pink Lady apple firmness -- AP 01036___________________________________________________________________________
__________________________________________________________________________21
DPI-Knoxfield
Experimental Design:
Two SmartFreshTM treatments x 2 storage atmospheres x 1 storage time x 1 sea-freight timex 1 simulated sea-freight temperature x 2 pre-ship SmartFreshTM treatments x 2 sea-freightatmosphere x 4 replicates x 15 fruit per replicate.
Treatments:
SmartFreshTM concentration: 0 ppb or 10,000 ppb (before storage).0 ppb or 1,000 ppb (pre-shipment) after storage.
Maturity at harvest: Optimal suitable for long term CA(Date 11th April).
Treatment time: 14 hours (before storage). 18 hours (pre-shipment).
Treatment temperature: 20°C (before storage). 4°C (pre-shipment).
Storage atmosphere: Air or Controlled atmosphere(2.5% O2 : 2% CO2).
Storage time: 16 weeks
Simulated sea-freight temperature: 2°C.
Simulated sea-freight time: 6 weeks
Sea-freight atmosphere: Air or Controlled atmosphere(2.5% O2 : 2% CO2).
Marketing time and temperature: 6 days at 20°C.
Statistical AnalysisThe data was analysed by analysis of variance (ANOVA) using Genstat version 5.4. 2software. (All tests used the 5% significance level unless otherwise specified).
Experiment 2 (Part 3). SmartFreshTM Pink Lady simulated shipment trial. Effect oftreatment before and after storage.
Fruit was picked at grower two's orchard on the 26thApril with a harvest maturity suitablefor medium term CA storage (starch score 7.6, firmness 8.1 kgf and TSS 14.6 °Brix). Thefruit was transported to IHD, Knoxfield and was placed at 0°C on the 27th April. On the 7th
May 15 fruit were placed in nylon netting bags, at room temperature and returned to 0°C.On the 8th May the SmartFreshTM treatment (1,000 ppb for 14 hours) commenced. The fruitpulp temperature was approximately 20°C when the treatment commenced. TheSmartFreshTM gas injection technique was used to administer SmartFreshTM as described
Tracking Pink Lady apple firmness -- AP 01036___________________________________________________________________________
__________________________________________________________________________22
DPI-Knoxfield
above (see Experiment 1, Part 2). The fruit was placed at 0°C in air or CA (2.5% O2 : 2.0%CO2) on the 9th May.
The treatment combinations were the same as described above for experiment 2 (Part 2).After 16 weeks storage all treatment combinations were transferred to 4°C for 18 hoursduring the pre-shipment SmartFreshTM treatment period. The exceptions being thetreatment, fruit with or without SmartFreshTM stored in CA followed by simulated CA sea-freight which were transferred to 2°C.
Fruit quality was only assessed after the simulated marketing period. That is, after16 weeksstorage, followed by 6 weeks-simulated sea-freight at 2°C plus 6 days at 20°C to simulatemarketing.
Experimental Design:
Two SmartFreshTM treatments (before storage) x 2 storage atmospheres x 1 storage time x 1sea-freight time x 1 simulated sea-freight temperature x 2 pre-ship 1-MCP x 2 sea-freightatmosphere x 4 replicates x 15 fruit per replicate.
Treatments:
SmartFreshTM concentration: 0 ppb or 1,000 ppb.
Maturity at harvest: Late pick (26th April) suitable for medium term CA.
Treatment time: 14 hours.
Treatment temperature: 20°C.
Storage atmosphere: Air or Controlled atmosphere(2.5% O2 : 2% CO2).
Storage time: 16 weeks.
Simulated sea-freight temperature: 2°C .
Simulated sea-freight time: 6 weeks
Sea-freight atmosphere: Air or Controlled atmosphere(2.5% O2 : 2% CO2).
Marketing time and temperature: 6 days at 20°C.
Statistical Analysis
The data was analysed by analysis of variance (ANOVA) using Genstat version 5.4. 2software. (All tests used the 5% significance level unless otherwise specified).
Tracking Pink Lady apple firmness -- AP 01036___________________________________________________________________________
__________________________________________________________________________23
DPI-Knoxfield
Experiment 3. SmartFreshTM Pink Lady commercial shipment trial. Effect oftreatment and growing locality.
Eight cartons of Pink Lady apples were supplied by growers from six regions withinAustralia. The fruit was picked at commercial harvest maturity. Fruit from grower 4(Victoria) arrived 2/5/01, grower 5 (South Australia) arrived 7/5/01, grower 6 (SouthAustralia) arrived 7/5/01, grower 7 (Victoria) arrived 17/5/01, grower 8 (Tasmania) arrived21/5/01 and grower 9 (Western Australia) arrived 21/6/01. Four export cartons were treatedon arrival at DPI, Knoxfield with SmartFreshTM (1000 ppb for 14 hours at 20°C) and fourwere untreated. After treatment the 1-MCP treated and untreated cartons were placed in CA(2.5% O2 : 2.0% CO2).
On the 12th September the export cartons were transported non-refrigerated to Tatura. Thetravel time was approximately 3 hours. On arrival the fruit was placed in a 0°C cool room.On the 17th September the cartons were stowed into a sea-freight container as part of acommercial shipment to the UK.
Fruit quality of a sub-sample of six fruit per carton was assessed 3 weeks prior to sea-freight (24th August) to establish SmartFreshTM effect on fruit firmness. On arrival in theUK (24th October) the quality of 50 fruit was assessed per replicate carton.
Experimental Design: For each grower:
Two SmartFreshTM treatment (before storage) x 4 replicate cartons x 50 fruit per replicate.
Treatments:
SmartFreshTM concentration: 0 ppb or 1,000 ppb.
Maturity at harvest: Commercial pick suitable for medium term CA.
Treatment time: 14 hours.
Treatment temperature: 20°C.
Storage atmosphere: Controlled atmosphere (2.5% O2 : 2% CO2).
Storage time: 18 weeks (Note a sub-sample of fruit was assessed at15 weeks to determine if the fruit was still suitable forshipment to the UK)
Actual sea-freight time: 6 weeks
Sea-freight atmosphere: Air.
Statistical Analysis
The data was analysed by analysis of variance (ANOVA) using Genstat version 5.4. 2software. (All tests used the 5% significance level unless otherwise specified).
Tracking Pink Lady apple firmness -- AP 01036___________________________________________________________________________
__________________________________________________________________________24
DPI-Knoxfield
Measurements and assessments
Temperature
Ambient air temperature was monitored continually during the storage period. The roomswere within ±0.5oC of the set point.
Atmosphere
Carbon dioxide and oxygen levels inside the CA chambers were monitored and controlledby a Bishop Instrument gas analyser. Gas levels were maintained at± 0.5% of the setpoint.
Quality
Fruit quality for each maturity was assessed before storage and after simulated marketing.
Initial fruit quality before each experiment was compared with respect to background colour,firmness and total soluble solids (TSS). The starch scores of the fruit were measuredvisually using the European 10 point scale pictorial guide (see Appendix A).
Background colour was measured using a Minolta CR200 chromameter using the whitecalibration tile (L= 97.3, a= -0.49, b= 1.91). The b-values and a-values measured by thechromameter were used to calculate the hue angle values. Hue angle was used to determinethe change in ground colour greenness. Hue angle (ho) = arc(tangent b/a) where 90o =yellow and 180o = green. Consequently, high ho values indicate greener fruit. A hue anglevalue of 110 ho represents green and 105 ho represents green / yellow. Relatively smallchanges in ho can represent a substantial visual change in the fruit background colour fromgreen to yellow.
Flesh firmness, expressed as kilogram force (kgf) was measured using an Effigipenetrometer with an 11 mm plunger.
Total soluble solids (TSS) expressed as oBrix was measured using a digital refractometer.
Superficial scald was assessed on an incidence basis and recorded as a percentage of fruitaffected.
All fruit quality assessments were conducted when the fruit had reached room temperature.
Tracking Pink Lady apple firmness -- AP 01036___________________________________________________________________________
__________________________________________________________________________25
DPI-Knoxfield
5.2.3. RESULTS
Experiment 1 (Part 1). Effect of SmartFreshTM on the storage life and quality ofPink Lady apples.
In experiment 1 (Part 1) the apples from two harvest dates were treated with or withoutSmartFreshTM at 10,000 ppb for 3 different treatment times for each temperature 4°C, 12°Cor 20°C. All apples were stored for 12 weeks, 16 weeks or 20 weeks in air or CA at 0°C,followed by 6 weeks at 0°C to simulate sea-freight conditions, followed by 6 days at 20°C tosimulate marketing.
Fruit quality after 12 weeks storage
FirmnessFor fruit stored in air, the effects of SmartFreshTM on firmness, at all treatment temperatureswere significant with treated fruit firmer by 0.5 to 0.8 kgf (Table 1)*. For apples stored inCA, SmartFreshTM had a significant effect on the firmness of fruit treated at 20°C but not onfruit treated at the lower temperatures.
There was no significant effect of treatment time on firmness at any treatment temperature,nor was there evidence of an interaction between harvest date, storage conditions andtreatment temperatures (Data not shown).
Total soluble solidsFor fruit stored either in air or CA, the effects of SmartFreshTM on TSS at all 3 treatmenttemperatures was not significant (Table 2).
There was no significant effect of treatment time on total soluble solids at any treatmenttemperature, nor was there evidence of an interaction between harvest date, storageconditions and treatment temperatures (Data not shown).
Ground colourFor fruit stored in air, the effects of SmartFreshTM on ground colour was only significant fortreatment temperatures of 4°C and 12°C. SmartFreshTM did not have a significant effect onthe colour of CA stored apples at any treatment temperatures (Table 3).
There was no significant effect of treatment time on ground colour, nor was there evidenceof an interaction between harvest date, storage conditions and treatment temperatures (Datanot shown).
Fruit quality after16 weeks storage
FirmnessFor fruit stored in air, the effect of SmartFreshTM on firmness at 4°C and 20°C treatmenttemperatures was significant with treated fruit firmer by approximately 0.7 kgf (Table 4).There was no significant effect of SmartFreshTM on firmness with the 12°C treatmenttemperature. For apples stored in CA, SmartFreshTM only had a significant effect on thefirmness of fruit treated at 12°C.
* All tables referenced are to be found within the current chapter.
Tracking Pink Lady apple firmness -- AP 01036___________________________________________________________________________
__________________________________________________________________________26
DPI-Knoxfield
There was no significant effect of treatment time on firmness, nor was there evidence of aninteraction between harvest date, storage conditions and treatment temperatures (Data notshown).
Total soluble solidsSmartFreshTM only had a significant effect on TSS content of fruit treated at 4°C and storedin air and treated at 20°C and stored in CA (Table 5).
There was no significant effect of treatment time on total soluble solids, nor was thereevidence of an interaction between harvest date, storage conditions and treatmenttemperatures (Data not shown).
Ground colourSmartFreshTM had a significant effect in maintaining green ground colour of fruit treated at4°C or 12°C and stored in air (Table 6). Both treated and untreated fruit stored in CA weresignificantly greener compared to fruit not treated and stored in air. Treated fruit stored inair were as green as treated and untreated fruit stored in CA. There was no significant effectof treatment time on ground colour, nor was there evidence of an interaction betweenharvest date, storage conditions and treatment temperatures (Data not shown).
Fruit quality after 20 weeks storage
FirmnessFor fruit stored in air, the effect of SmartFreshTM on firmness at all treatment temperatureswas significant with treated fruit firmer by 0.7 kgf to 0.9 kgf (Table 7). For apples stored inCA, SmartFreshTM had a significant effect on firmness at all 3 treatment temperatures withtreated fruit 0.3 – 0.4 kgf firmer.
There was no significant effect of treatment time on firmness, nor was there evidence of aninteraction between harvest date, storage conditions and treatment temperatures (Data notshown).
Total soluble solidsThe effect of SmartFreshTM on total soluble solids content of fruit stored in air or CA, at all3 treatment temperatures was not significant (Table 8). The only exception being for fruitstored in air and treated at 12°C which had an increased total soluble solids content of 0.5°Brix.
There was no significant effect of treatment time on total soluble solids, nor was thereevidence of an interaction between harvest date, storage conditions and treatmenttemperatures (Data not shown).
Ground colourThe effect of SmartFreshTM on ground colour of fruit treated at all 3 treatment temperaturesand stored in air or CA was not significant (Table 9). However, untreated fruit stored in CAwere significantly greener compared to untreated fruit stored in air. Treated fruit treated at4°C and 12°C and stored in CA were significantly greener than untreated fruit stored in CA.
Tracking Pink Lady apple firmness -- AP 01036___________________________________________________________________________
__________________________________________________________________________27
DPI-Knoxfield
There was no significant difference between untreated fruit and treated fruit treated at 20°Cand stored in air or CA.
There was no significant effect of treatment time on ground colour, nor was there evidenceof an interaction between harvest date, storage conditions and treatment temperatures (Datanot shown).
Experiment 1 (Part 2). Effect of SmartFreshTM on the storage life and quality ofPink Lady apples.
In experiment 1 (Part 2), the apples were treated with or without SmartFreshTM at 1,000 ppb.CA (2.5% O2 : 2.0% CO2) stored fruit were treated for 12hours at 4°C, 12°C or 20°Cwhereas air stored fruit were treated for either 48 hours at 4°C or 12 hours at 20°C. Allapples were stored for 16 weeks at 0°C, followed by 6 weeks at 0°C to simulate sea-freightconditions, followed by 6 days at 20°C to simulate marketing.
FirmnessThe effect of SmartFreshTM on Pink Lady apple firmness after 16 weeks storage in CA wassignificant for fruit treated at 12°C and 20°C (Table 10). SmartFreshTM treated fruit wereapproximately 0.4 kgf firmer than untreated fruit.
For fruit stored in air, the effect of SmartFreshTM treatment for 48 hours at 4°C on firmnesswas significant (Table 11). SmartFreshTM treated fruit were approximately 0.8 kgf firmerthan untreated fruit.
For fruit stored in air, the effect of SmartFreshTM treatment for 12 hours at 20°C on firmnesswas significant. SmartFreshTM treated fruit were approximately 1.0 kgf firmer thanuntreated fruit.
Total soluble solidsThe effect of SmartFreshTM on Pink Lady apple total soluble solids content after 16 weeksstorage in CA was significant for the fruit treated at 20°C (Table 13).
For fruit stored in air, the effect of SmartFreshTM treatment for 48 hours at 4°C on totalsoluble solids content was not significant (Table 14).
For fruit stored in air, the effect of SmartFreshTM treatment for 12 hours at 20°C on totalsoluble solids content was not significant (Table 15).
Ground colourThe effect of SmartFreshTM on Pink Lady apple ground colour after 16 weeksstorage in CA was not significant for all 3 treatment temperatures (Table 16). Therewas no ground colour data available for air stored fruit.
Experiment 2 (Part 1). SmartFreshTM Pink Lady simulated shipment trial.Effect of treatment before storage.
Apples were sourced from two growers and treated with SmartFreshTM at 1,000 ppb or nottreated for 14 hours at 20°C then stored in air for 12 weeks at 0°C or CA storage
Tracking Pink Lady apple firmness -- AP 01036___________________________________________________________________________
__________________________________________________________________________28
DPI-Knoxfield
(2.5% O2 : 2.0% CO2) for 18 weeks at 0°C. The apples were then kept for 6 weeks at either0°C or 4°C to simulate sea-freight conditions, followed by 6 days at 20°C to simulatemarketing.
FirmnessThe overall effect of SmartFreshTM on Pink Lady apple firmness after 12 weeks storage inair was significant with an increase in fruit firmness of 0.9 kgf to 1.4 kgf for grower 2 and 3respectively (Table 17). Fruit from grower 2 treated with SmartFreshTM and stored at 0°Cwas significantly firmer than fruit stored at 4°C. For grower 3, only untreated fruit stored at0°C were significantly firmer than fruit stored at 4°C.
The effect of SmartFreshTM on Pink Lady apple firmness after 18 weeks storage in CA wassignificant for both simulated sea-freight temperatures with an increase in fruit firmness of0.4 kgf for grower 3 but not grower 2 (Table 18). There was no significant effect of the twosea-freight temperatures on firmness.
Experiment 2 (Part 2). SmartFreshTM Pink Lady simulated shipment trial. Effect of treatment before and after storage.
In experiment 2 (Part 2), the apples were either treated with SmartFreshTM at 10,000 ppb or0 ppb for 14 hours at 20°C before storage. The apples were stored in air or CA storage(2.5% O2 : 2.0% CO2) for 16 weeks at 0°C. The apples were then treated again or not treatedwith SmartFreshTM at 1,000 ppb for 18 hours at 4°C, followed by 6 weeks at 2°C in air orCA (2.5% O2 : 2.0% CO2) to simulate sea-freight conditions plus 6 days at 20°C to simulatemarketing.
FirmnessThe overall effect of SmartFreshTM on firmness was significant for fruit shipped in either airor CA with fruit firmer by 1.0 kgf and 0.5 kgf respectively (Table 19). Fruit treated withSmartFreshTM and shipped in air was 0.4 kgf firmer than untreated CA fruit, which wassignificant. Fruit not treated with SmartFreshTM and shipped in CA was 0.6 kgf firmer thanuntreated fruit shipped in air.
Treating fruit with SmartFreshTM again prior to sea-freight did not have a significant effecton fruit firmness (Table 20).
The overall effect of SmartFreshTM was to significantly increase fruit firmness for all storageand simulated sea-freight atmosphere combinations (Table 21). The firmness of fruit treatedwith SmartFreshTM and stored in air or CA and shipped in air were not significantly differentto fruit stored in CA and shipped in CA. However, the firmness of fruit not treated withSmartFreshTM and stored in CA was significantly higher than untreated fruit stored in air.There was no significant difference in the firmness of fruit stored in CA and shipped in airor CA.
Total soluble solidsThe effect of SmartFreshTM on total soluble solids content was significant for fruit shippedin air with TSS higher by 0.4 °Brix (Table 22). However, there was no significant effect onthe fruit shipped in CA. The °Brix levels of fruit shipped in air and CA were notsignificantly different.
Tracking Pink Lady apple firmness -- AP 01036___________________________________________________________________________
__________________________________________________________________________29
DPI-Knoxfield
Re-treating fruit with SmartFreshTM prior to sea-freight did not have a significant effect ontotal soluble solids content (Table 23).
The effect of SmartFreshTM on total soluble solids content was significant if the fruit wasstored in either air or CA and shipped in air with an increase of approximately 0.4 °Brix.The effect was not significant if the fruit was shipped in CA (Table 24). The total solublesolids content of fruit treated with SmartFreshTM and stored in either air or CA and shippedin air was not significantly different to fruit stored in CA and shipped in CA. There was nosignificant difference in the total soluble solids content of fruit stored in CA and thenshipped in air or CA.
Ground colourThe effect of SmartFreshTM on ground colour was significant for fruit shipped in air but notfor fruit shipped in CA (Table 25). Fruit shipped in CA and not treated with SmartFreshTM
were significantly greener compared to fruit shipped in air.
Treating fruit with SmartFreshTM prior to sea-freight did not have a significant effect onground colour (Table 26).
The effect of SmartFreshTM on ground colour was significant if the fruit was stored in CAand then shipped in air but not if it was stored and shipped in CA or stored in air andshipped in air (Table 27). There was no significant difference in the ground colour oftreated fruit stored in CA and shipped in air compared to treated fruit stored in CA and thenshipped in CA. Treated fruit stored in CA and shipped in air or CA were greener thantreated fruit stored in air and shipped in air.
Experiment 2 (Part 3). SmartFreshTM Pink Lady simulated shipment trial.Effect of treatment before and after storage.
In experiment 2 (Part 3), the apples were either treated with SmartFreshTM at 1,000 ppb ornot for 14 hours at 20°C before storage. The apples were then stored in air or CA (2.5% O2: 2.0% CO2) for 16 weeks at 0°C. The apples were either treated again or not treated withSmartFreshTM at 1,000 ppb for 18 hours at 4°C and then stored for by 6 weeks at 2°C ineither air or CA (2.5% O2 : 2.0% CO2) to simulate sea-freight conditions plus 6 days at 20°Cto simulate marketing.
FirmnessThe effect of SmartFreshTM on firmness was significant with treated fruit shipped in air andCA, firmer by 1.2 kgf and 0.6 kgf respectively (Table 28). Fruit not treated withSmartFreshTM and shipped in CA were 0.6 kgf firmer than to fruit shipped in air. Fruittreated with SmartFreshTM and shipped in air was not significantly different to treated fruitshipped in CA. Untreated fruit shipped in CA was 0.6 kgf firmer than untreated fruit shippedin air.
The effect of re-treating fruit with SmartFreshTM, prior to sea-freight was not significant onfruit firmness after shipment in either air or CA (Table 29).
The overall effect of SmartFreshTM on fruit firmness was significant for all three storage andsea-freight atmosphere combinations (Table 30). For fruit treated with SmartFreshTM, there
Tracking Pink Lady apple firmness -- AP 01036___________________________________________________________________________
__________________________________________________________________________30
DPI-Knoxfield
was no significant difference in firmness between any of the atmosphere combinations.However, untreated fruit stored in CA and shipped in CA or air were significantly firmercompared to fruit stored in air and shipped in air.
Total soluble solidsThe effect of SmartFreshTM on total soluble solids content was significant for fruit shippedin air but not for CA (Table 31). Fruit treated with SmartFreshTM shipped in air were notsignificantly different to fruit not treated and shipped in CA.
The effect of treating fruit again with SmartFreshTM, prior to sea-freight was not significanton total soluble solids content (Table 32).
The effect of SmartFreshTM on total soluble solids content was significant if the fruit wasstored and shipped in air but not for the other CA and air combinations (Table 33).
Ground colourThe effect of SmartFreshTM on ground colour was significant for fruit shipped in air but notfor CA (Table 34). Fruit treated with SmartFreshTM and shipped in air were not significantlydifferent to fruit not treated and shipped in CA.
Treating fruit again with SmartFreshTM prior to sea-freight did not have a significant effecton ground colour (Table 35).
The effect of SmartFreshTM on ground colour was significant if the fruit was stored in airand shipped in air but not if it was stored in CA and shipped in CA or stored in CA andshipped in air (Table 36). Fruit treated with SmartFreshTM and stored and shipped in CA wassignificantly greener than untreated fruit stored and shipped in air.
Superficial ScaldNo scald was observed in CA stored fruit irrespective of 1-MCP treatment and only verylow levels (0.9 - 1.8%) in air stored fruit not treated with 1-MCP (Data not shown).
Experiment 3. SmartFreshTM Pink Lady commercial shipment trial. Effect of treatment and growing locality.
FirmnessApples sourced from the Goulburn Valley (Growers 4 and 7), South Australia (Growers 5and 6), Tasmania (Grower 8) and Western Australia (Grower 9) were treated with 1-MCP at1,000 ppb or not for 14 hours at 20°C. The apples were then stored in CA (2.5% O2 : 2.0%CO2) for 15 weeks at 0°C and a sub-sample of the fruit was assessed to determine if the fruitwas suitable to send to the UK. After 18 weeks storage the apples were shipped to the UKwhere the fruit was assessed again.
The effect of SmartFreshTM on fruit firmness was significant for fruit sourced from theGoulburn Valley (Growers 4 and 7), South Australia (Growers 5 and 6) and Tasmania(Grower 8), with fruit firmer by 0.4 kgf to 1.2 kgf after 15 weeks storage at 0°C plus 6 daysat 20°C (Table 37). For apples sourced from Western Australia (Grower 9) the effect ofSmartFreshTM was not significant, most likely due to the fruit being over mature based onthe starch patterns of the fruit on arrival at DPI, Knoxfield. The Western Australian fruitwas not sent to the UK because the fruit did not meet export quality. The apples assessed inthe UK that were treated with SmartFreshTM were significantly firmer than untreated fruit by0.5 kgf to 1.3 kgf (Table 38).
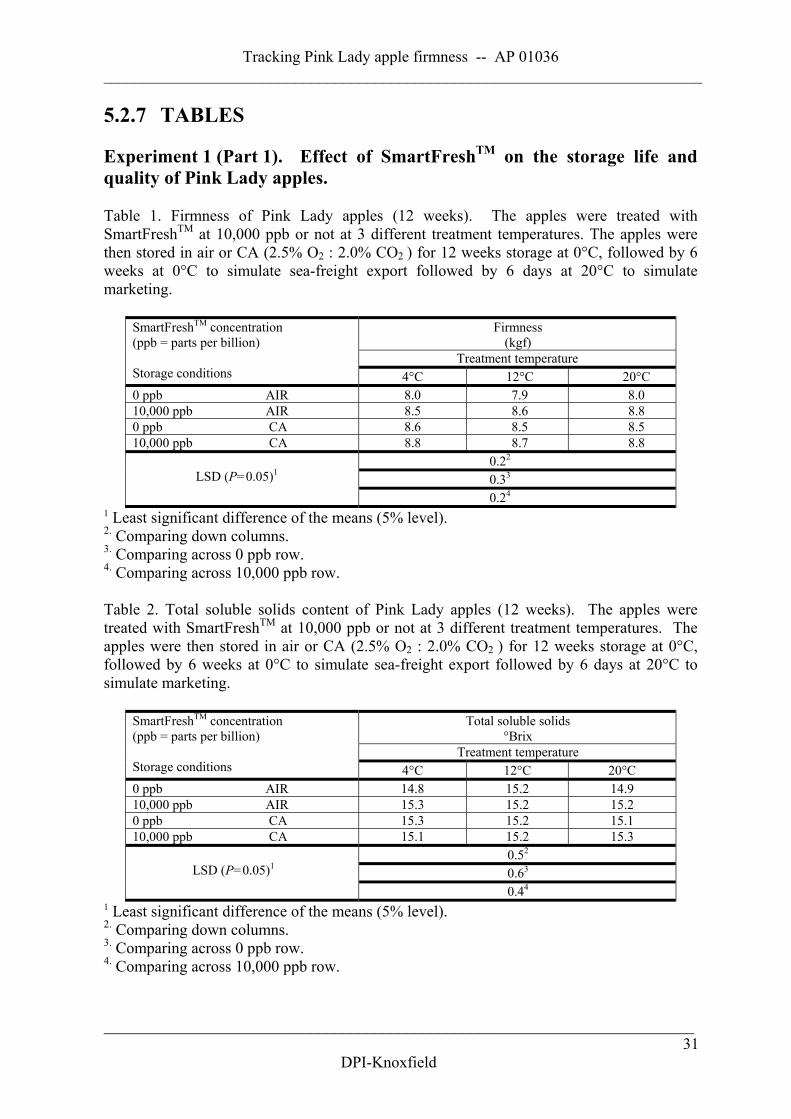
Tracking Pink Lady apple firmness -- AP 01036___________________________________________________________________________
__________________________________________________________________________31
DPI-Knoxfield
5.2.7 TABLES
Experiment 1 (Part 1). Effect of SmartFreshTM on the storage life andquality of Pink Lady apples.
Table 1. Firmness of Pink Lady apples (12 weeks). The apples were treated withSmartFreshTM at 10,000 ppb or not at 3 different treatment temperatures. The apples werethen stored in air or CA (2.5% O2 : 2.0% CO2
) for 12 weeks storage at 0°C, followed by 6weeks at 0°C to simulate sea-freight export followed by 6 days at 20°C to simulatemarketing.
Firmness(kgf)
Treatment temperature
SmartFreshTM concentration(ppb = parts per billion)
Storage conditions 4°C 12°C 20°C0 ppb AIR 8.0 7.9 8.010,000 ppb AIR 8.5 8.6 8.80 ppb CA 8.6 8.5 8.510,000 ppb CA 8.8 8.7 8.8
0.22
0.33 LSD (P=0.05)1
0.24
1 Least significant difference of the means (5% level).2. Comparing down columns.3. Comparing across 0 ppb row.4. Comparing across 10,000 ppb row.
Table 2. Total soluble solids content of Pink Lady apples (12 weeks). The apples weretreated with SmartFreshTM at 10,000 ppb or not at 3 different treatment temperatures. Theapples were then stored in air or CA (2.5% O2 : 2.0% CO2
) for 12 weeks storage at 0°C,followed by 6 weeks at 0°C to simulate sea-freight export followed by 6 days at 20°C tosimulate marketing.
Total soluble solids°Brix
Treatment temperature
SmartFreshTM concentration(ppb = parts per billion)
Storage conditions 4°C 12°C 20°C0 ppb AIR 14.8 15.2 14.910,000 ppb AIR 15.3 15.2 15.20 ppb CA 15.3 15.2 15.110,000 ppb CA 15.1 15.2 15.3
0.52
0.63 LSD (P=0.05)1
0.44
1 Least significant difference of the means (5% level).2. Comparing down columns.3. Comparing across 0 ppb row.4. Comparing across 10,000 ppb row.
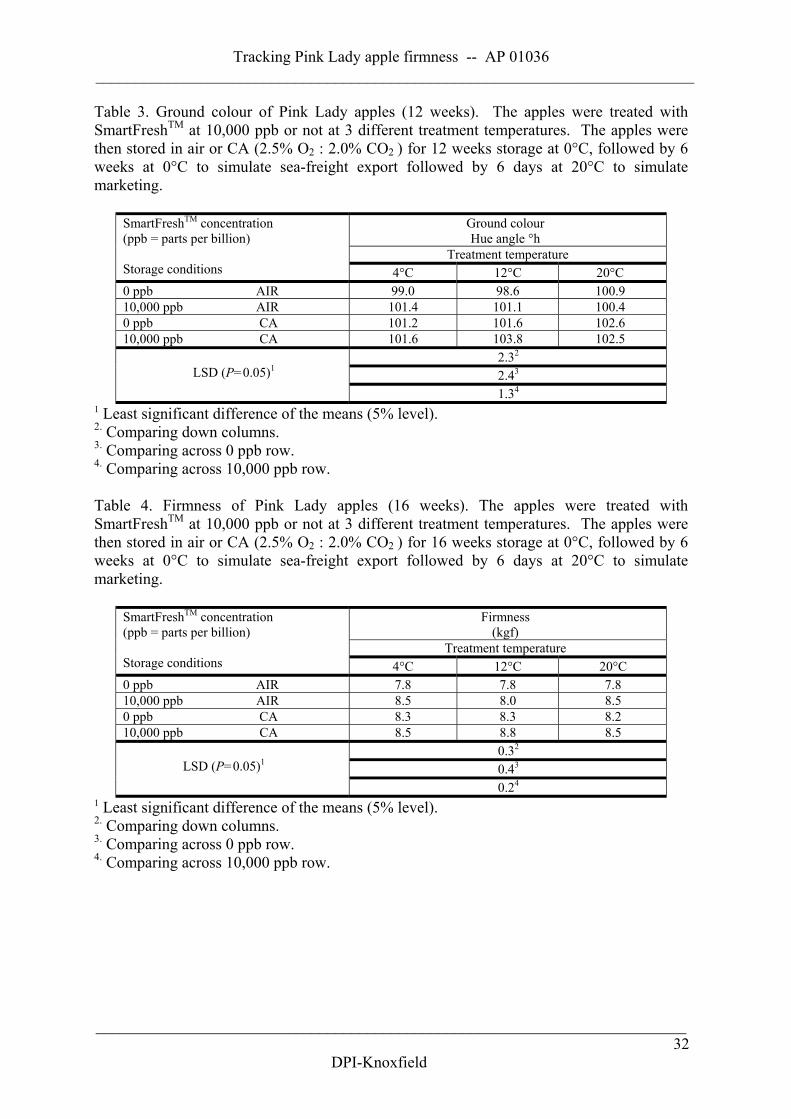
Tracking Pink Lady apple firmness -- AP 01036___________________________________________________________________________
__________________________________________________________________________32
DPI-Knoxfield
Table 3. Ground colour of Pink Lady apples (12 weeks). The apples were treated withSmartFreshTM at 10,000 ppb or not at 3 different treatment temperatures. The apples werethen stored in air or CA (2.5% O2 : 2.0% CO2
) for 12 weeks storage at 0°C, followed by 6weeks at 0°C to simulate sea-freight export followed by 6 days at 20°C to simulatemarketing.
Ground colourHue angle °h
Treatment temperature
SmartFreshTM concentration(ppb = parts per billion)
Storage conditions 4°C 12°C 20°C0 ppb AIR 99.0 98.6 100.910,000 ppb AIR 101.4 101.1 100.40 ppb CA 101.2 101.6 102.610,000 ppb CA 101.6 103.8 102.5
2.32
2.43 LSD (P=0.05)1
1.34
1 Least significant difference of the means (5% level).2. Comparing down columns.3. Comparing across 0 ppb row.4. Comparing across 10,000 ppb row.
Table 4. Firmness of Pink Lady apples (16 weeks). The apples were treated withSmartFreshTM at 10,000 ppb or not at 3 different treatment temperatures. The apples werethen stored in air or CA (2.5% O2 : 2.0% CO2
) for 16 weeks storage at 0°C, followed by 6weeks at 0°C to simulate sea-freight export followed by 6 days at 20°C to simulatemarketing.
Firmness(kgf)
Treatment temperature
SmartFreshTM concentration(ppb = parts per billion)
Storage conditions 4°C 12°C 20°C0 ppb AIR 7.8 7.8 7.810,000 ppb AIR 8.5 8.0 8.50 ppb CA 8.3 8.3 8.210,000 ppb CA 8.5 8.8 8.5
0.32
0.43 LSD (P=0.05)1
0.24
1 Least significant difference of the means (5% level).2. Comparing down columns.3. Comparing across 0 ppb row.4. Comparing across 10,000 ppb row.
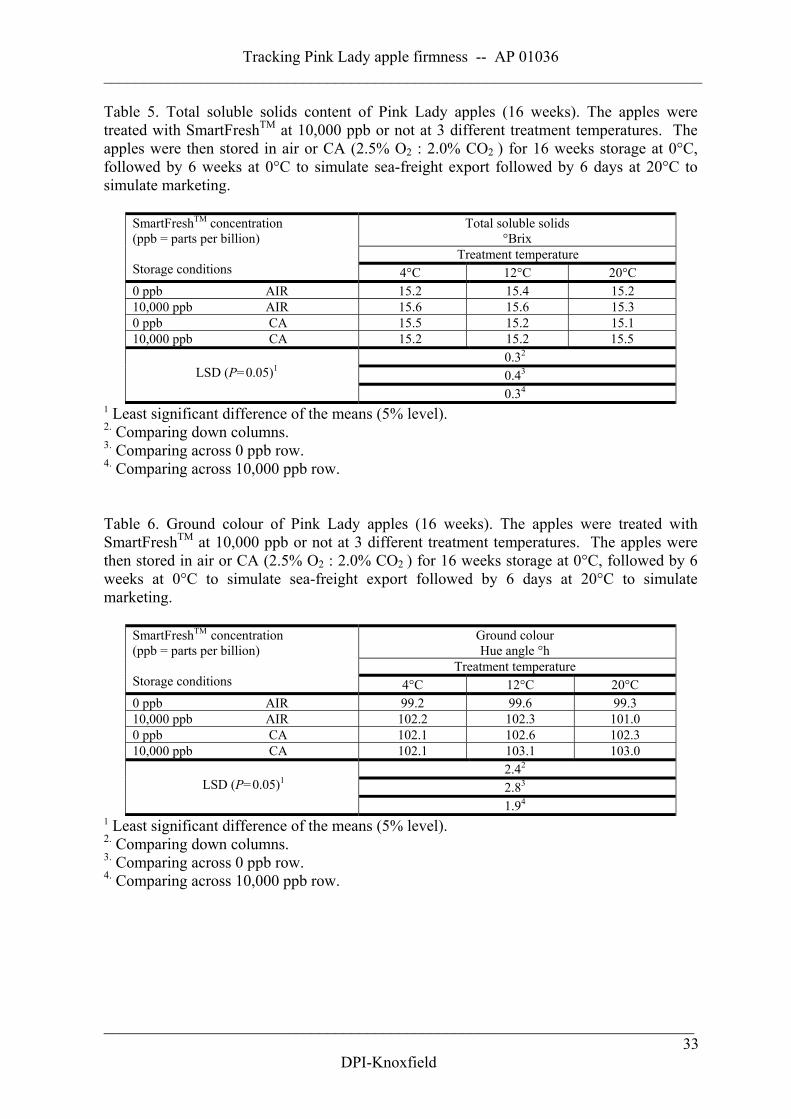
Tracking Pink Lady apple firmness -- AP 01036___________________________________________________________________________
__________________________________________________________________________33
DPI-Knoxfield
Table 5. Total soluble solids content of Pink Lady apples (16 weeks). The apples weretreated with SmartFreshTM at 10,000 ppb or not at 3 different treatment temperatures. Theapples were then stored in air or CA (2.5% O2 : 2.0% CO2
) for 16 weeks storage at 0°C,followed by 6 weeks at 0°C to simulate sea-freight export followed by 6 days at 20°C tosimulate marketing.
Total soluble solids°Brix
Treatment temperature
SmartFreshTM concentration(ppb = parts per billion)
Storage conditions 4°C 12°C 20°C0 ppb AIR 15.2 15.4 15.210,000 ppb AIR 15.6 15.6 15.30 ppb CA 15.5 15.2 15.110,000 ppb CA 15.2 15.2 15.5
0.32
0.43 LSD (P=0.05)1
0.34
1 Least significant difference of the means (5% level).2. Comparing down columns.3. Comparing across 0 ppb row.4. Comparing across 10,000 ppb row.
Table 6. Ground colour of Pink Lady apples (16 weeks). The apples were treated withSmartFreshTM at 10,000 ppb or not at 3 different treatment temperatures. The apples werethen stored in air or CA (2.5% O2 : 2.0% CO2
) for 16 weeks storage at 0°C, followed by 6weeks at 0°C to simulate sea-freight export followed by 6 days at 20°C to simulatemarketing.
Ground colourHue angle °h
Treatment temperature
SmartFreshTM concentration(ppb = parts per billion)
Storage conditions 4°C 12°C 20°C0 ppb AIR 99.2 99.6 99.310,000 ppb AIR 102.2 102.3 101.00 ppb CA 102.1 102.6 102.310,000 ppb CA 102.1 103.1 103.0
2.42
2.83 LSD (P=0.05)1
1.94
1 Least significant difference of the means (5% level).2. Comparing down columns.3. Comparing across 0 ppb row.4. Comparing across 10,000 ppb row.
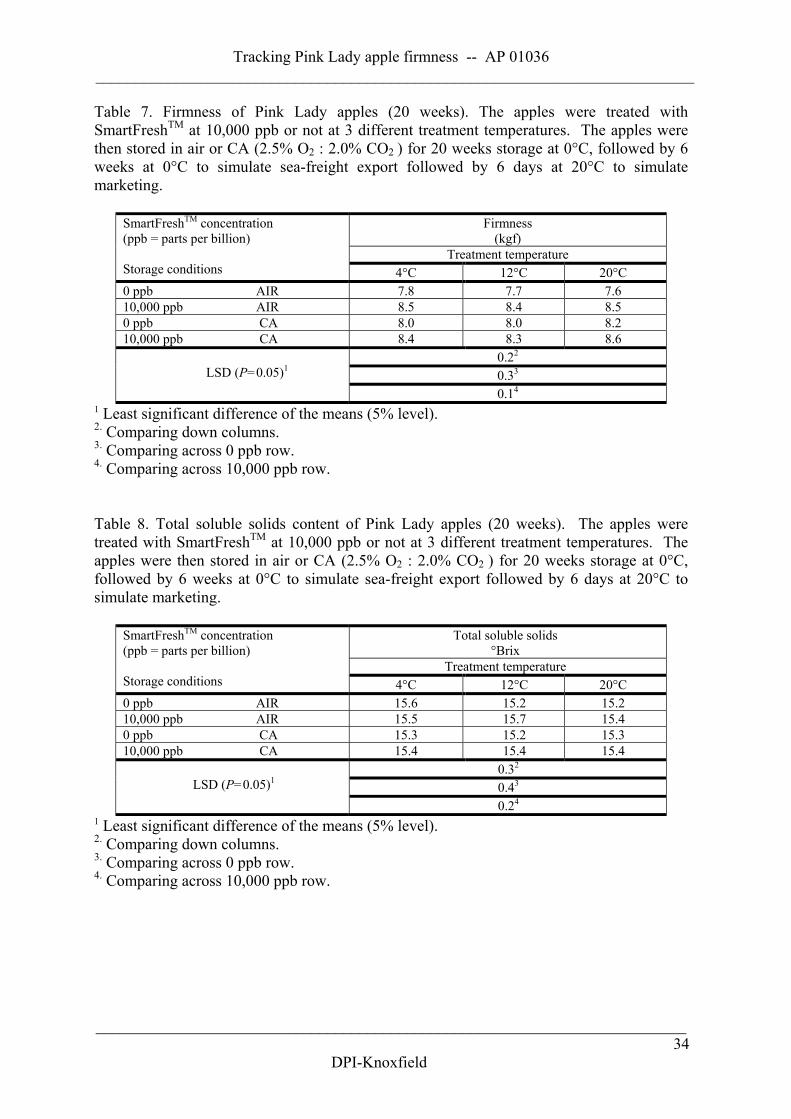
Tracking Pink Lady apple firmness -- AP 01036___________________________________________________________________________
__________________________________________________________________________34
DPI-Knoxfield
Table 7. Firmness of Pink Lady apples (20 weeks). The apples were treated withSmartFreshTM at 10,000 ppb or not at 3 different treatment temperatures. The apples werethen stored in air or CA (2.5% O2 : 2.0% CO2
) for 20 weeks storage at 0°C, followed by 6weeks at 0°C to simulate sea-freight export followed by 6 days at 20°C to simulatemarketing.
Firmness(kgf)
Treatment temperature
SmartFreshTM concentration(ppb = parts per billion)
Storage conditions 4°C 12°C 20°C0 ppb AIR 7.8 7.7 7.610,000 ppb AIR 8.5 8.4 8.50 ppb CA 8.0 8.0 8.210,000 ppb CA 8.4 8.3 8.6
0.22
0.33 LSD (P=0.05)1
0.14
1 Least significant difference of the means (5% level).2. Comparing down columns.3. Comparing across 0 ppb row.4. Comparing across 10,000 ppb row.
Table 8. Total soluble solids content of Pink Lady apples (20 weeks). The apples weretreated with SmartFreshTM at 10,000 ppb or not at 3 different treatment temperatures. Theapples were then stored in air or CA (2.5% O2 : 2.0% CO2
) for 20 weeks storage at 0°C,followed by 6 weeks at 0°C to simulate sea-freight export followed by 6 days at 20°C tosimulate marketing.
Total soluble solids°Brix
Treatment temperature
SmartFreshTM concentration(ppb = parts per billion)
Storage conditions 4°C 12°C 20°C0 ppb AIR 15.6 15.2 15.210,000 ppb AIR 15.5 15.7 15.40 ppb CA 15.3 15.2 15.310,000 ppb CA 15.4 15.4 15.4
0.32
0.43 LSD (P=0.05)1
0.24
1 Least significant difference of the means (5% level).2. Comparing down columns.3. Comparing across 0 ppb row.4. Comparing across 10,000 ppb row.
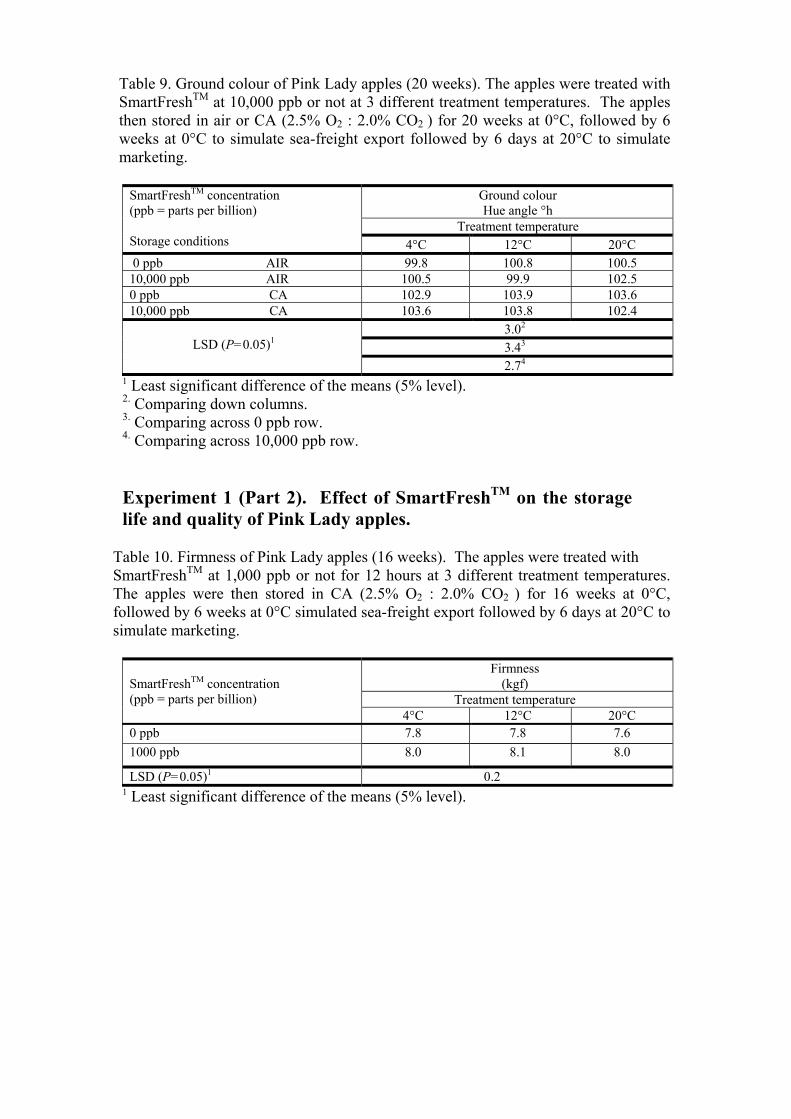
Table 9. Ground colour of Pink Lady apples (20 weeks). The apples were treated withSmartFreshTM at 10,000 ppb or not at 3 different treatment temperatures. The applesthen stored in air or CA (2.5% O2 : 2.0% CO2
) for 20 weeks at 0°C, followed by 6weeks at 0°C to simulate sea-freight export followed by 6 days at 20°C to simulatemarketing.
Ground colourHue angle °h
Treatment temperature
SmartFreshTM concentration(ppb = parts per billion)
Storage conditions 4°C 12°C 20°C 0 ppb AIR 99.8 100.8 100.510,000 ppb AIR 100.5 99.9 102.50 ppb CA 102.9 103.9 103.610,000 ppb CA 103.6 103.8 102.4
3.02
3.43 LSD (P=0.05)1
2.74
1 Least significant difference of the means (5% level).2. Comparing down columns.3. Comparing across 0 ppb row.4. Comparing across 10,000 ppb row.
Experiment 1 (Part 2). Effect of SmartFreshTM on the storagelife and quality of Pink Lady apples.
Table 10. Firmness of Pink Lady apples (16 weeks). The apples were treated withSmartFreshTM at 1,000 ppb or not for 12 hours at 3 different treatment temperatures.The apples were then stored in CA (2.5% O2 : 2.0% CO2
) for 16 weeks at 0°C,followed by 6 weeks at 0°C simulated sea-freight export followed by 6 days at 20°C tosimulate marketing.
Firmness(kgf)
Treatment temperatureSmartFreshTM concentration(ppb = parts per billion)
4°C 12°C 20°C0 ppb 7.8 7.8 7.61000 ppb 8.0 8.1 8.0
LSD (P=0.05)1 0.21 Least significant difference of the means (5% level).
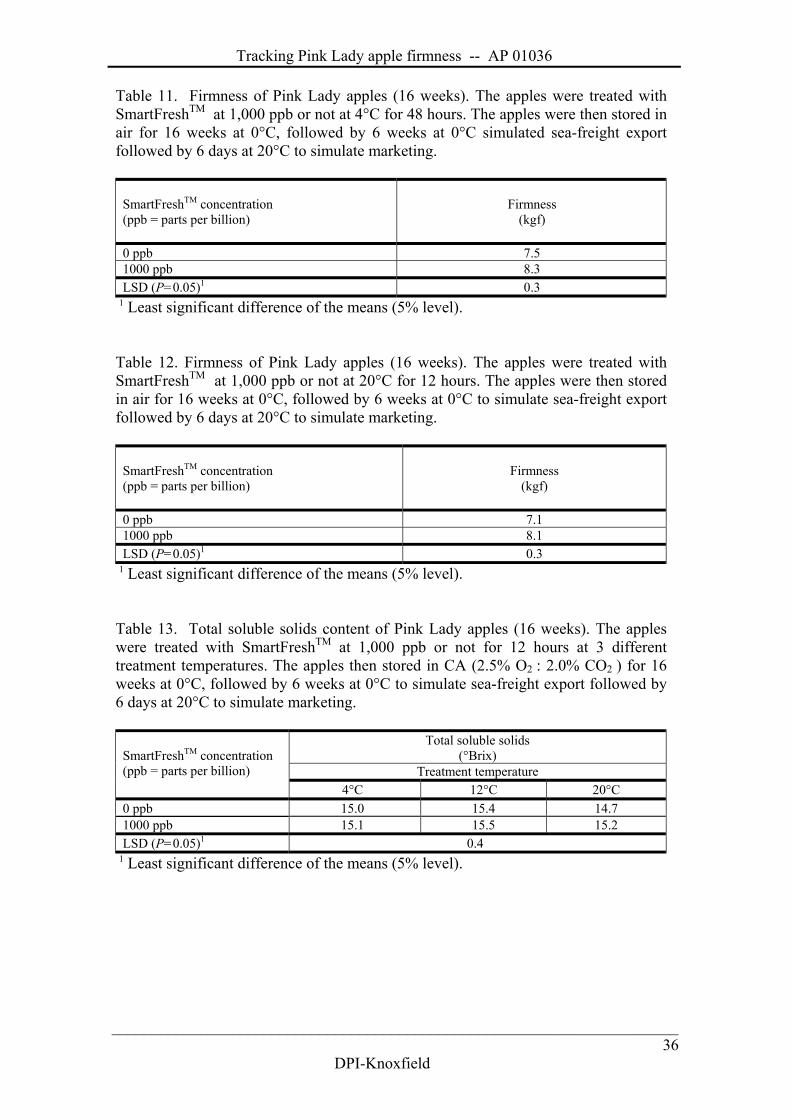
Tracking Pink Lady apple firmness -- AP 01036
_______________________________________________________________________
DPI-Knoxfield36
Table 11. Firmness of Pink Lady apples (16 weeks). The apples were treated withSmartFreshTM at 1,000 ppb or not at 4°C for 48 hours. The apples were then stored inair for 16 weeks at 0°C, followed by 6 weeks at 0°C simulated sea-freight exportfollowed by 6 days at 20°C to simulate marketing.
SmartFreshTM concentration(ppb = parts per billion)
Firmness(kgf)
0 ppb 7.51000 ppb 8.3LSD (P=0.05)1 0.3
1 Least significant difference of the means (5% level).
Table 12. Firmness of Pink Lady apples (16 weeks). The apples were treated withSmartFreshTM at 1,000 ppb or not at 20°C for 12 hours. The apples were then storedin air for 16 weeks at 0°C, followed by 6 weeks at 0°C to simulate sea-freight exportfollowed by 6 days at 20°C to simulate marketing.
SmartFreshTM concentration(ppb = parts per billion)
Firmness(kgf)
0 ppb 7.11000 ppb 8.1LSD (P=0.05)1 0.3
1 Least significant difference of the means (5% level).
Table 13. Total soluble solids content of Pink Lady apples (16 weeks). The appleswere treated with SmartFreshTM at 1,000 ppb or not for 12 hours at 3 differenttreatment temperatures. The apples then stored in CA (2.5% O2 : 2.0% CO2
) for 16weeks at 0°C, followed by 6 weeks at 0°C to simulate sea-freight export followed by6 days at 20°C to simulate marketing.
Total soluble solids(°Brix)
Treatment temperatureSmartFreshTM concentration(ppb = parts per billion)
4°C 12°C 20°C0 ppb 15.0 15.4 14.71000 ppb 15.1 15.5 15.2LSD (P=0.05)1 0.4
1 Least significant difference of the means (5% level).
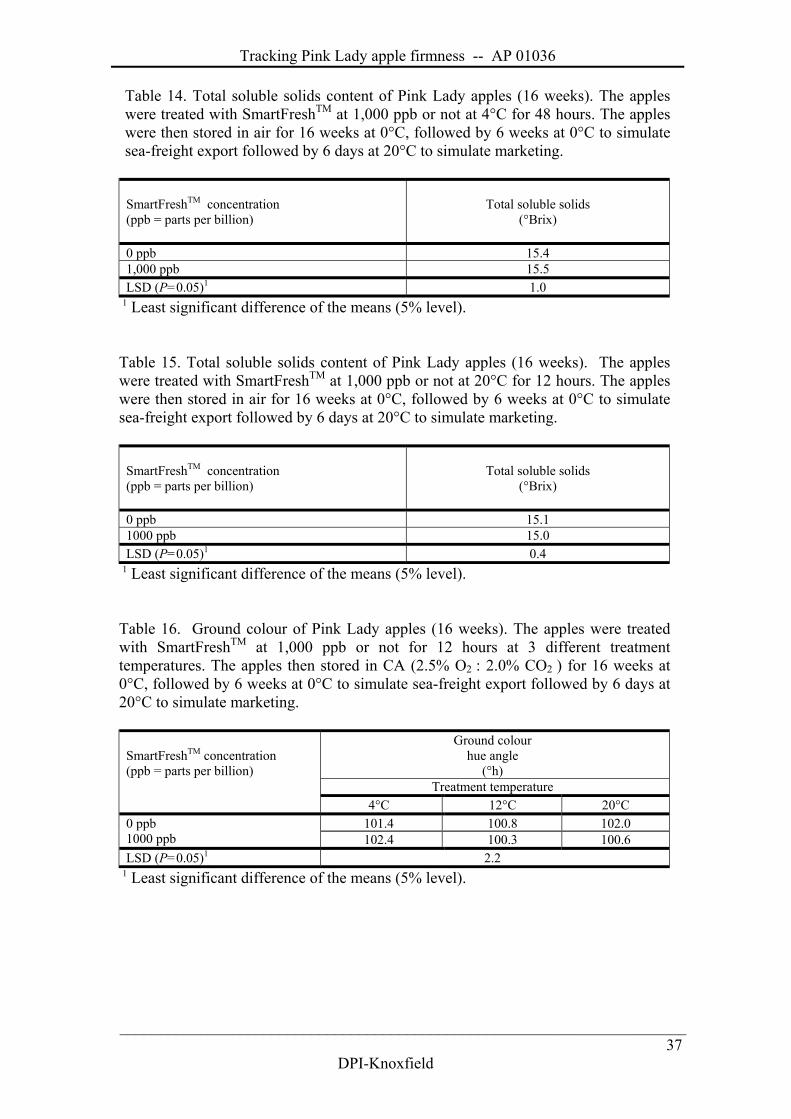
Tracking Pink Lady apple firmness -- AP 01036
_______________________________________________________________________
DPI-Knoxfield37
Table 14. Total soluble solids content of Pink Lady apples (16 weeks). The appleswere treated with SmartFreshTM at 1,000 ppb or not at 4°C for 48 hours. The appleswere then stored in air for 16 weeks at 0°C, followed by 6 weeks at 0°C to simulatesea-freight export followed by 6 days at 20°C to simulate marketing.
SmartFreshTM concentration(ppb = parts per billion)
Total soluble solids(°Brix)
0 ppb 15.41,000 ppb 15.5LSD (P=0.05)1 1.0
1 Least significant difference of the means (5% level).
Table 15. Total soluble solids content of Pink Lady apples (16 weeks). The appleswere treated with SmartFreshTM at 1,000 ppb or not at 20°C for 12 hours. The appleswere then stored in air for 16 weeks at 0°C, followed by 6 weeks at 0°C to simulatesea-freight export followed by 6 days at 20°C to simulate marketing.
SmartFreshTM concentration(ppb = parts per billion)
Total soluble solids(°Brix)
0 ppb 15.11000 ppb 15.0LSD (P=0.05)1 0.4
1 Least significant difference of the means (5% level).
Table 16. Ground colour of Pink Lady apples (16 weeks). The apples were treatedwith SmartFreshTM at 1,000 ppb or not for 12 hours at 3 different treatmenttemperatures. The apples then stored in CA (2.5% O2 : 2.0% CO2
) for 16 weeks at0°C, followed by 6 weeks at 0°C to simulate sea-freight export followed by 6 days at20°C to simulate marketing.
Ground colourhue angle
(°h)Treatment temperature
SmartFreshTM concentration(ppb = parts per billion)
4°C 12°C 20°C101.4 100.8 102.00 ppb
1000 ppb 102.4 100.3 100.6LSD (P=0.05)1 2.2
1 Least significant difference of the means (5% level).
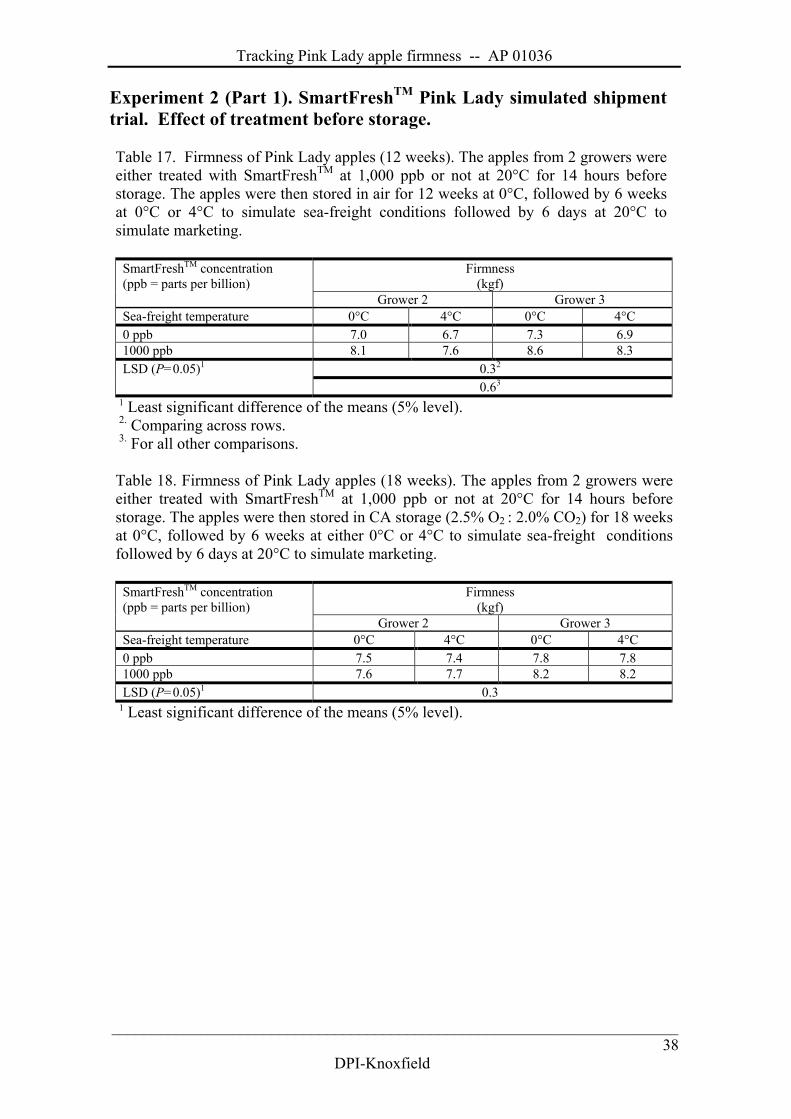
Tracking Pink Lady apple firmness -- AP 01036
_______________________________________________________________________
DPI-Knoxfield38
Experiment 2 (Part 1). SmartFreshTM Pink Lady simulated shipmenttrial. Effect of treatment before storage.
Table 17. Firmness of Pink Lady apples (12 weeks). The apples from 2 growers wereeither treated with SmartFreshTM at 1,000 ppb or not at 20°C for 14 hours beforestorage. The apples were then stored in air for 12 weeks at 0°C, followed by 6 weeksat 0°C or 4°C to simulate sea-freight conditions followed by 6 days at 20°C tosimulate marketing.
Firmness(kgf)
SmartFreshTM concentration(ppb = parts per billion)
Grower 2 Grower 3Sea-freight temperature 0°C 4°C 0°C 4°C0 ppb 7.0 6.7 7.3 6.91000 ppb 8.1 7.6 8.6 8.3
0.32LSD (P=0.05)1
0.63
1 Least significant difference of the means (5% level).2. Comparing across rows.3. For all other comparisons.
Table 18. Firmness of Pink Lady apples (18 weeks). The apples from 2 growers wereeither treated with SmartFreshTM at 1,000 ppb or not at 20°C for 14 hours beforestorage. The apples were then stored in CA storage (2.5% O2 : 2.0% CO2) for 18 weeksat 0°C, followed by 6 weeks at either 0°C or 4°C to simulate sea-freight conditionsfollowed by 6 days at 20°C to simulate marketing.
Firmness(kgf)
SmartFreshTM concentration(ppb = parts per billion)
Grower 2 Grower 3Sea-freight temperature 0°C 4°C 0°C 4°C0 ppb 7.5 7.4 7.8 7.81000 ppb 7.6 7.7 8.2 8.2LSD (P=0.05)1 0.3
1 Least significant difference of the means (5% level).
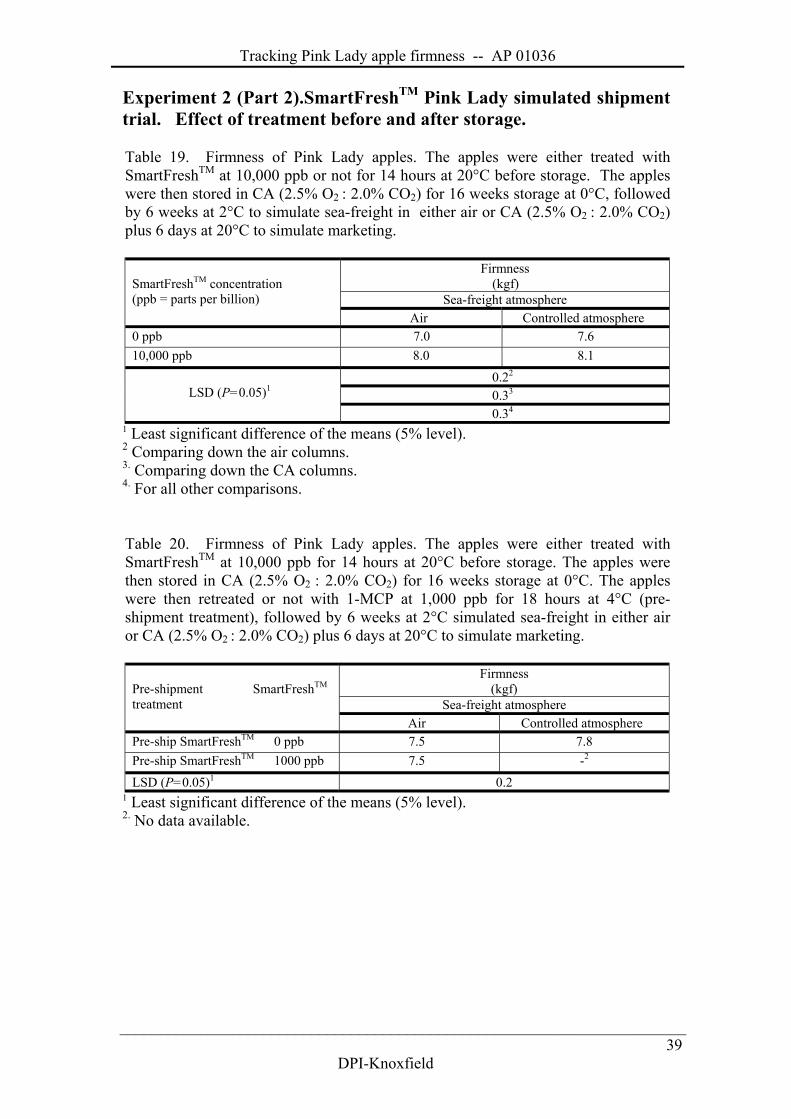
Tracking Pink Lady apple firmness -- AP 01036
_______________________________________________________________________
DPI-Knoxfield39
Experiment 2 (Part 2).SmartFreshTM Pink Lady simulated shipmenttrial. Effect of treatment before and after storage.
Table 19. Firmness of Pink Lady apples. The apples were either treated withSmartFreshTM at 10,000 ppb or not for 14 hours at 20°C before storage. The appleswere then stored in CA (2.5% O2 : 2.0% CO2) for 16 weeks storage at 0°C, followedby 6 weeks at 2°C to simulate sea-freight in either air or CA (2.5% O2 : 2.0% CO2)plus 6 days at 20°C to simulate marketing.
Firmness(kgf)
Sea-freight atmosphereSmartFreshTM concentration(ppb = parts per billion)
Air Controlled atmosphere0 ppb 7.0 7.610,000 ppb 8.0 8.1
0.22
0.33 LSD (P=0.05)1
0.34
1 Least significant difference of the means (5% level).2 Comparing down the air columns.3. Comparing down the CA columns.4. For all other comparisons.
Table 20. Firmness of Pink Lady apples. The apples were either treated withSmartFreshTM at 10,000 ppb for 14 hours at 20°C before storage. The apples werethen stored in CA (2.5% O2 : 2.0% CO2) for 16 weeks storage at 0°C. The appleswere then retreated or not with 1-MCP at 1,000 ppb for 18 hours at 4°C (pre-shipment treatment), followed by 6 weeks at 2°C simulated sea-freight in either airor CA (2.5% O2 : 2.0% CO2) plus 6 days at 20°C to simulate marketing.
Firmness(kgf)
Sea-freight atmospherePre-shipment SmartFreshTM
treatmentAir Controlled atmosphere
Pre-ship SmartFreshTM 0 ppb 7.5 7.8Pre-ship SmartFreshTM 1000 ppb 7.5 -2
LSD (P=0.05)1 0.21 Least significant difference of the means (5% level).2. No data available.
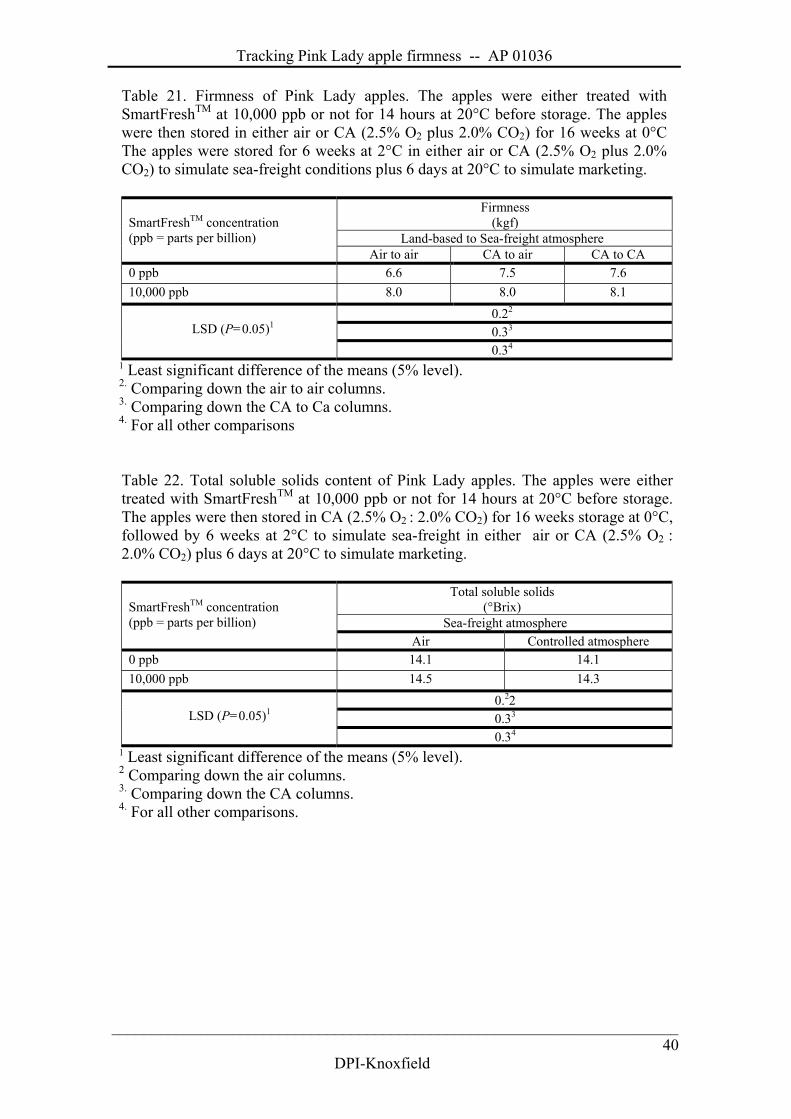
Tracking Pink Lady apple firmness -- AP 01036
_______________________________________________________________________
DPI-Knoxfield40
Table 21. Firmness of Pink Lady apples. The apples were either treated withSmartFreshTM at 10,000 ppb or not for 14 hours at 20°C before storage. The appleswere then stored in either air or CA (2.5% O2 plus 2.0% CO2) for 16 weeks at 0°CThe apples were stored for 6 weeks at 2°C in either air or CA (2.5% O2 plus 2.0%CO2) to simulate sea-freight conditions plus 6 days at 20°C to simulate marketing.
Firmness(kgf)
Land-based to Sea-freight atmosphereSmartFreshTM concentration(ppb = parts per billion)
Air to air CA to air CA to CA0 ppb 6.6 7.5 7.610,000 ppb 8.0 8.0 8.1
0.22
0.33 LSD (P=0.05)1
0.34
1 Least significant difference of the means (5% level).2. Comparing down the air to air columns.3. Comparing down the CA to Ca columns.4. For all other comparisons
Table 22. Total soluble solids content of Pink Lady apples. The apples were eithertreated with SmartFreshTM at 10,000 ppb or not for 14 hours at 20°C before storage.The apples were then stored in CA (2.5% O2 : 2.0% CO2) for 16 weeks storage at 0°C,followed by 6 weeks at 2°C to simulate sea-freight in either air or CA (2.5% O2 :2.0% CO2) plus 6 days at 20°C to simulate marketing.
Total soluble solids(°Brix)
Sea-freight atmosphereSmartFreshTM concentration(ppb = parts per billion)
Air Controlled atmosphere0 ppb 14.1 14.110,000 ppb 14.5 14.3
0.220.33 LSD (P=0.05)1
0.34
1 Least significant difference of the means (5% level).2 Comparing down the air columns.3. Comparing down the CA columns.4. For all other comparisons.
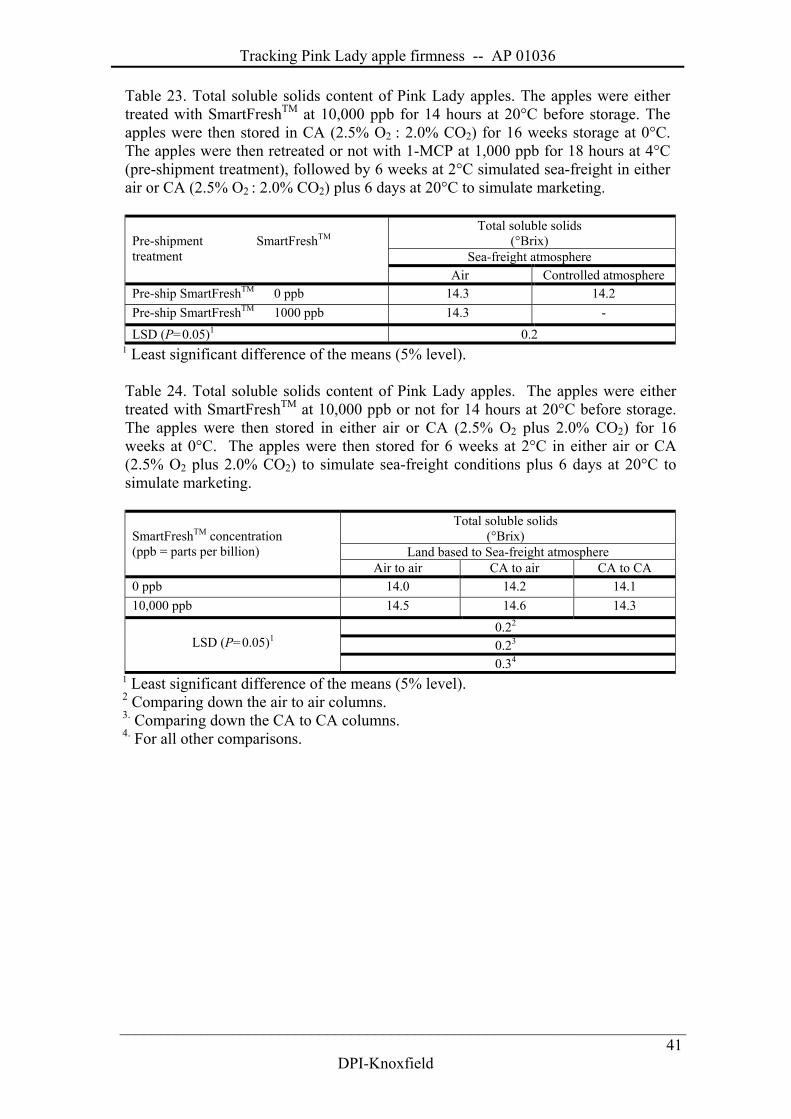
Tracking Pink Lady apple firmness -- AP 01036
_______________________________________________________________________
DPI-Knoxfield41
Table 23. Total soluble solids content of Pink Lady apples. The apples were eithertreated with SmartFreshTM at 10,000 ppb for 14 hours at 20°C before storage. Theapples were then stored in CA (2.5% O2 : 2.0% CO2) for 16 weeks storage at 0°C.The apples were then retreated or not with 1-MCP at 1,000 ppb for 18 hours at 4°C(pre-shipment treatment), followed by 6 weeks at 2°C simulated sea-freight in eitherair or CA (2.5% O2 : 2.0% CO2) plus 6 days at 20°C to simulate marketing.
Total soluble solids(°Brix)
Sea-freight atmospherePre-shipment SmartFreshTM
treatmentAir Controlled atmosphere
Pre-ship SmartFreshTM 0 ppb 14.3 14.2Pre-ship SmartFreshTM 1000 ppb 14.3 -LSD (P=0.05)1 0.2
1 Least significant difference of the means (5% level).
Table 24. Total soluble solids content of Pink Lady apples. The apples were eithertreated with SmartFreshTM at 10,000 ppb or not for 14 hours at 20°C before storage.The apples were then stored in either air or CA (2.5% O2 plus 2.0% CO2) for 16weeks at 0°C. The apples were then stored for 6 weeks at 2°C in either air or CA(2.5% O2 plus 2.0% CO2) to simulate sea-freight conditions plus 6 days at 20°C tosimulate marketing.
Total soluble solids(°Brix)
Land based to Sea-freight atmosphereSmartFreshTM concentration(ppb = parts per billion)
Air to air CA to air CA to CA0 ppb 14.0 14.2 14.110,000 ppb 14.5 14.6 14.3
0.22
0.23 LSD (P=0.05)1
0.34
1 Least significant difference of the means (5% level).2 Comparing down the air to air columns.3. Comparing down the CA to CA columns.4. For all other comparisons.
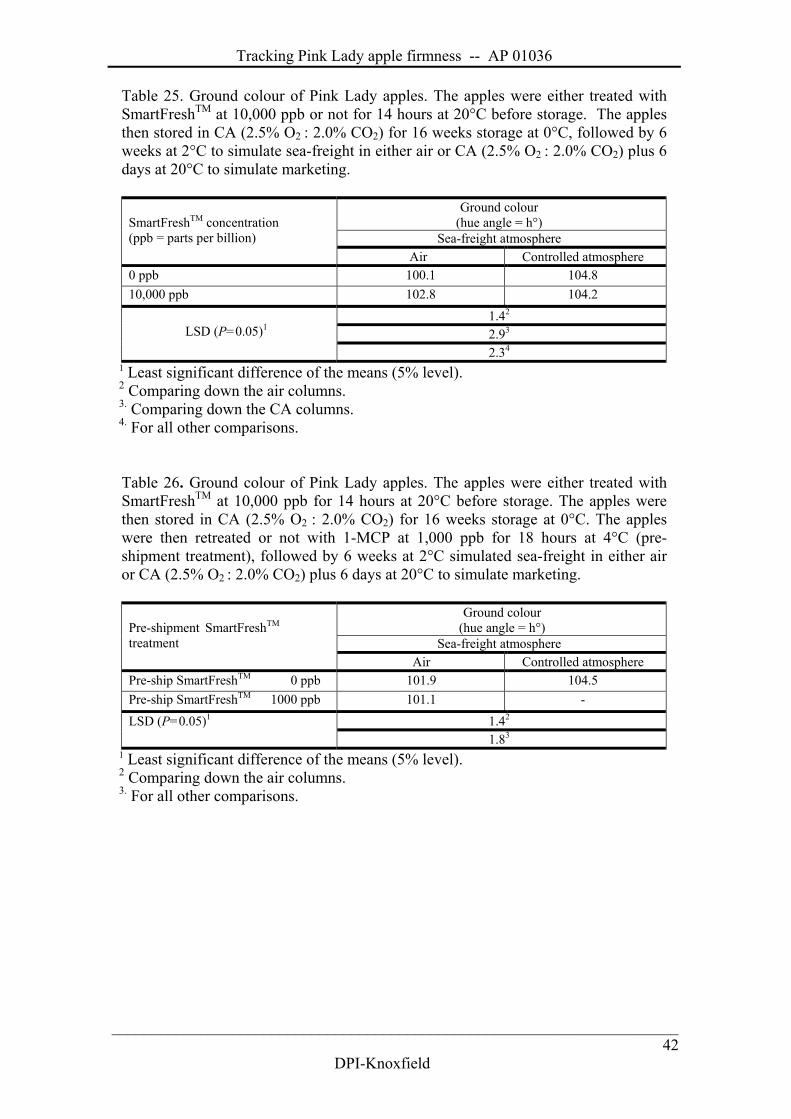
Tracking Pink Lady apple firmness -- AP 01036
_______________________________________________________________________
DPI-Knoxfield42
Table 25. Ground colour of Pink Lady apples. The apples were either treated withSmartFreshTM at 10,000 ppb or not for 14 hours at 20°C before storage. The applesthen stored in CA (2.5% O2 : 2.0% CO2) for 16 weeks storage at 0°C, followed by 6weeks at 2°C to simulate sea-freight in either air or CA (2.5% O2 : 2.0% CO2) plus 6days at 20°C to simulate marketing.
Ground colour(hue angle = h°)
Sea-freight atmosphereSmartFreshTM concentration(ppb = parts per billion)
Air Controlled atmosphere0 ppb 100.1 104.810,000 ppb 102.8 104.2
1.42
2.93 LSD (P=0.05)1
2.34
1 Least significant difference of the means (5% level).2 Comparing down the air columns.3. Comparing down the CA columns.4. For all other comparisons.
Table 26. Ground colour of Pink Lady apples. The apples were either treated withSmartFreshTM at 10,000 ppb for 14 hours at 20°C before storage. The apples werethen stored in CA (2.5% O2 : 2.0% CO2) for 16 weeks storage at 0°C. The appleswere then retreated or not with 1-MCP at 1,000 ppb for 18 hours at 4°C (pre-shipment treatment), followed by 6 weeks at 2°C simulated sea-freight in either airor CA (2.5% O2 : 2.0% CO2) plus 6 days at 20°C to simulate marketing.
Ground colour(hue angle = h°)
Sea-freight atmospherePre-shipment SmartFreshTM
treatmentAir Controlled atmosphere
Pre-ship SmartFreshTM 0 ppb 101.9 104.5Pre-ship SmartFreshTM 1000 ppb 101.1 -
1.42LSD (P=0.05)1
1.83
1 Least significant difference of the means (5% level).2 Comparing down the air columns.3. For all other comparisons.
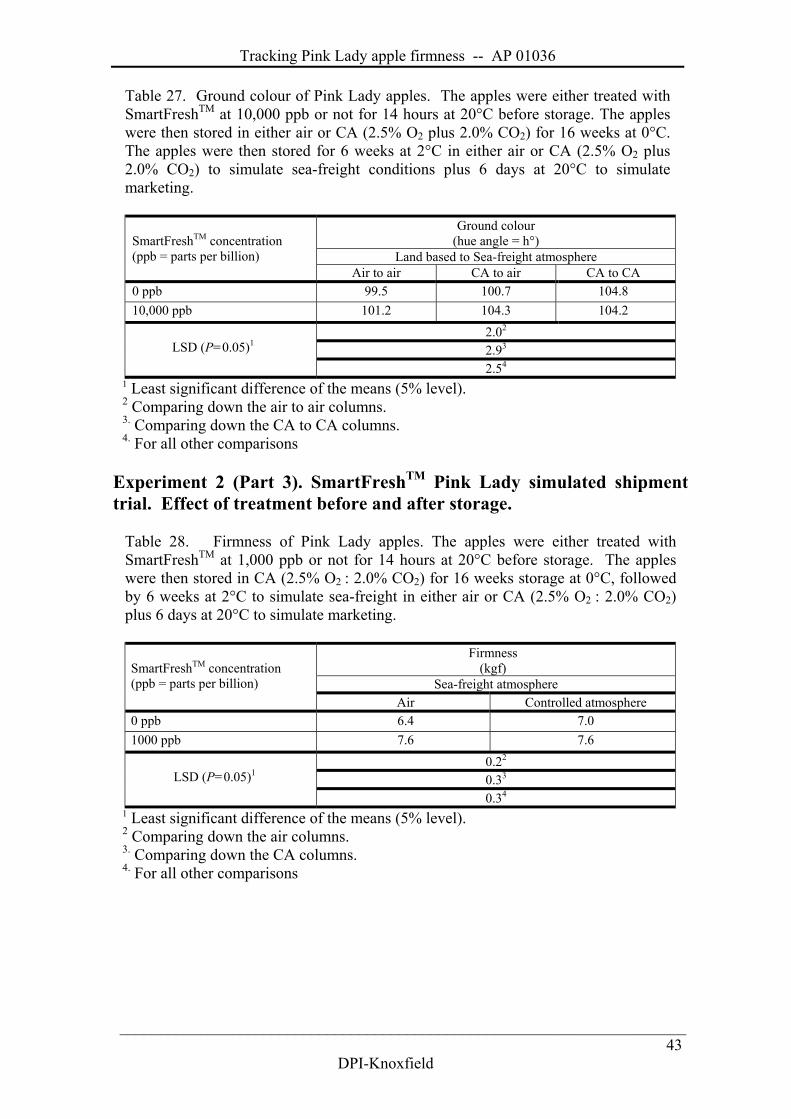
Tracking Pink Lady apple firmness -- AP 01036
_______________________________________________________________________
DPI-Knoxfield43
Table 27. Ground colour of Pink Lady apples. The apples were either treated withSmartFreshTM at 10,000 ppb or not for 14 hours at 20°C before storage. The appleswere then stored in either air or CA (2.5% O2 plus 2.0% CO2) for 16 weeks at 0°C.The apples were then stored for 6 weeks at 2°C in either air or CA (2.5% O2 plus2.0% CO2) to simulate sea-freight conditions plus 6 days at 20°C to simulatemarketing.
Ground colour(hue angle = h°)
Land based to Sea-freight atmosphereSmartFreshTM concentration(ppb = parts per billion)
Air to air CA to air CA to CA0 ppb 99.5 100.7 104.810,000 ppb 101.2 104.3 104.2
2.02
2.93 LSD (P=0.05)1
2.54
1 Least significant difference of the means (5% level).2 Comparing down the air to air columns.3. Comparing down the CA to CA columns.4. For all other comparisons
Experiment 2 (Part 3). SmartFreshTM Pink Lady simulated shipmenttrial. Effect of treatment before and after storage.
Table 28. Firmness of Pink Lady apples. The apples were either treated withSmartFreshTM at 1,000 ppb or not for 14 hours at 20°C before storage. The appleswere then stored in CA (2.5% O2 : 2.0% CO2) for 16 weeks storage at 0°C, followedby 6 weeks at 2°C to simulate sea-freight in either air or CA (2.5% O2 : 2.0% CO2)plus 6 days at 20°C to simulate marketing.
Firmness(kgf)
Sea-freight atmosphereSmartFreshTM concentration(ppb = parts per billion)
Air Controlled atmosphere0 ppb 6.4 7.01000 ppb 7.6 7.6
0.22
0.33 LSD (P=0.05)1
0.34
1 Least significant difference of the means (5% level).2 Comparing down the air columns.3. Comparing down the CA columns.4. For all other comparisons
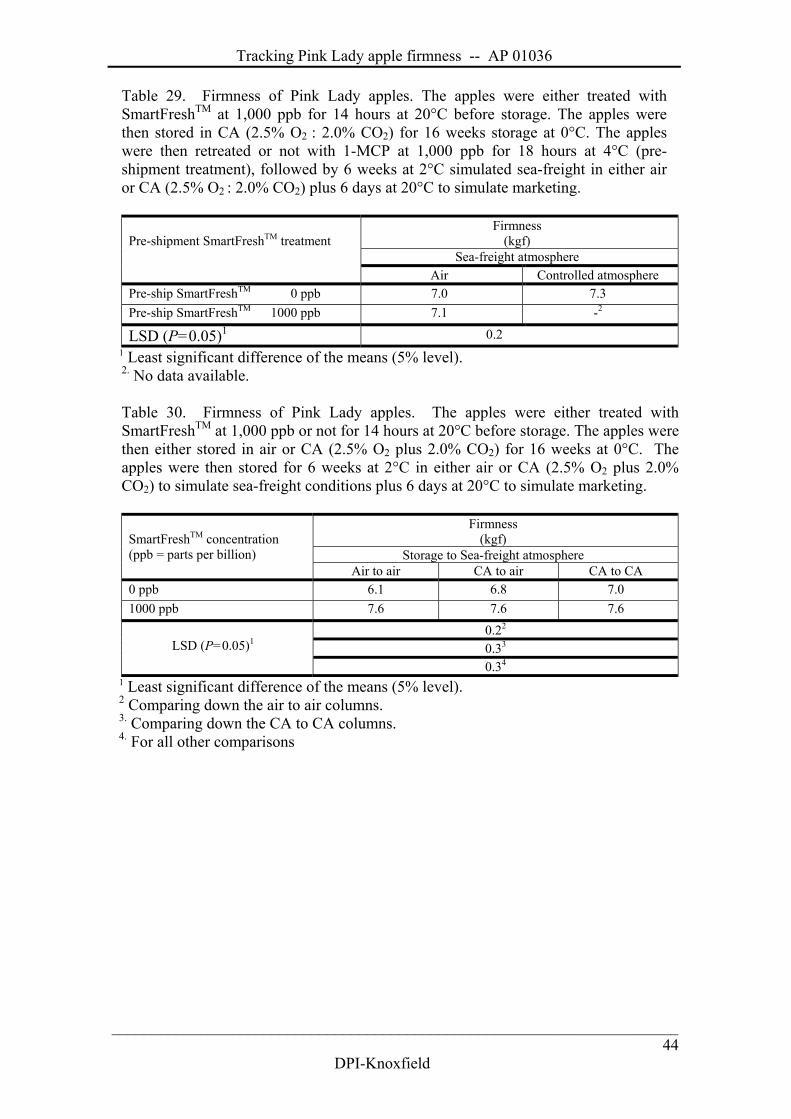
Tracking Pink Lady apple firmness -- AP 01036
_______________________________________________________________________
DPI-Knoxfield44
Table 29. Firmness of Pink Lady apples. The apples were either treated withSmartFreshTM at 1,000 ppb for 14 hours at 20°C before storage. The apples werethen stored in CA (2.5% O2 : 2.0% CO2) for 16 weeks storage at 0°C. The appleswere then retreated or not with 1-MCP at 1,000 ppb for 18 hours at 4°C (pre-shipment treatment), followed by 6 weeks at 2°C simulated sea-freight in either airor CA (2.5% O2 : 2.0% CO2) plus 6 days at 20°C to simulate marketing.
Firmness(kgf)
Sea-freight atmospherePre-shipment SmartFreshTM treatment
Air Controlled atmospherePre-ship SmartFreshTM 0 ppb 7.0 7.3Pre-ship SmartFreshTM 1000 ppb 7.1 -2
LSD (P=0.05)1 0.21 Least significant difference of the means (5% level).2. No data available.
Table 30. Firmness of Pink Lady apples. The apples were either treated withSmartFreshTM at 1,000 ppb or not for 14 hours at 20°C before storage. The apples werethen either stored in air or CA (2.5% O2 plus 2.0% CO2) for 16 weeks at 0°C. Theapples were then stored for 6 weeks at 2°C in either air or CA (2.5% O2 plus 2.0%CO2) to simulate sea-freight conditions plus 6 days at 20°C to simulate marketing.
Firmness(kgf)
Storage to Sea-freight atmosphereSmartFreshTM concentration(ppb = parts per billion)
Air to air CA to air CA to CA0 ppb 6.1 6.8 7.01000 ppb 7.6 7.6 7.6
0.22
0.33 LSD (P=0.05)1
0.34
1 Least significant difference of the means (5% level).2 Comparing down the air to air columns.3. Comparing down the CA to CA columns.4. For all other comparisons
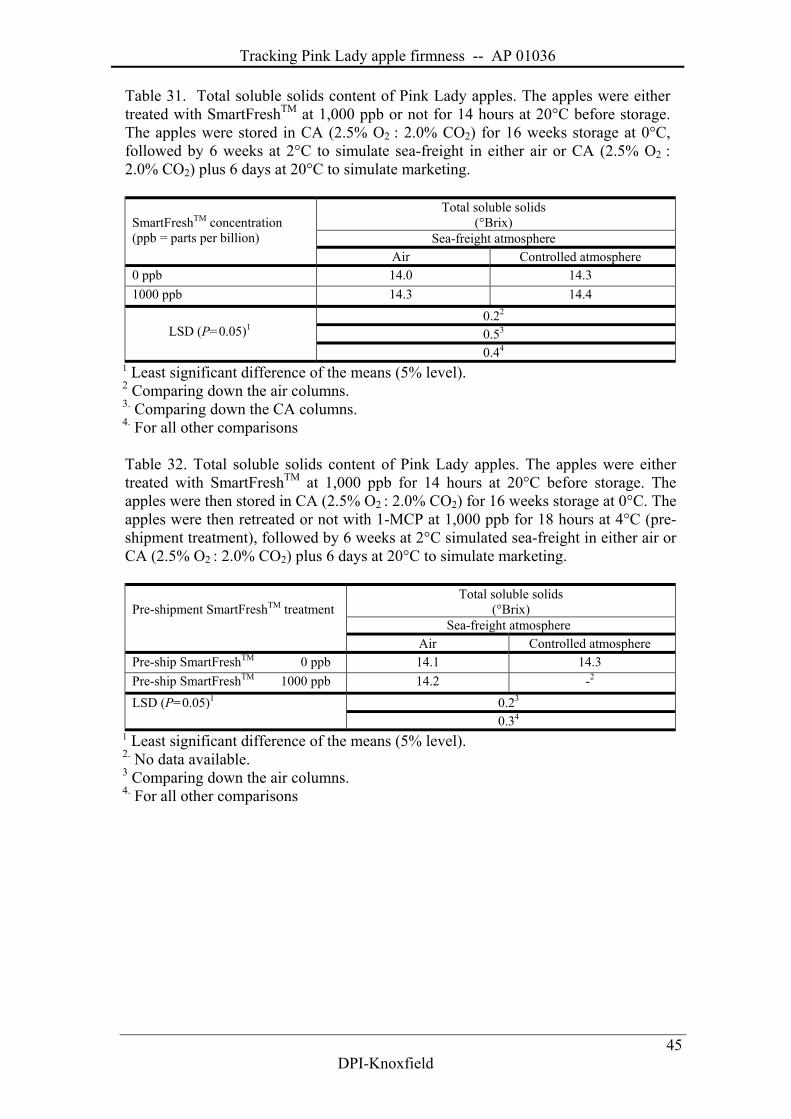
Tracking Pink Lady apple firmness -- AP 01036
_______________________________________________________________________
DPI-Knoxfield45
Table 31. Total soluble solids content of Pink Lady apples. The apples were eithertreated with SmartFreshTM at 1,000 ppb or not for 14 hours at 20°C before storage.The apples were stored in CA (2.5% O2 : 2.0% CO2) for 16 weeks storage at 0°C,followed by 6 weeks at 2°C to simulate sea-freight in either air or CA (2.5% O2 :2.0% CO2) plus 6 days at 20°C to simulate marketing.
Total soluble solids(°Brix)
Sea-freight atmosphereSmartFreshTM concentration(ppb = parts per billion)
Air Controlled atmosphere0 ppb 14.0 14.31000 ppb 14.3 14.4
0.22
0.53 LSD (P=0.05)1
0.44
1 Least significant difference of the means (5% level).2 Comparing down the air columns.3. Comparing down the CA columns.4. For all other comparisons
Table 32. Total soluble solids content of Pink Lady apples. The apples were eithertreated with SmartFreshTM at 1,000 ppb for 14 hours at 20°C before storage. Theapples were then stored in CA (2.5% O2 : 2.0% CO2) for 16 weeks storage at 0°C. Theapples were then retreated or not with 1-MCP at 1,000 ppb for 18 hours at 4°C (pre-shipment treatment), followed by 6 weeks at 2°C simulated sea-freight in either air orCA (2.5% O2 : 2.0% CO2) plus 6 days at 20°C to simulate marketing.
Total soluble solids(°Brix)
Sea-freight atmospherePre-shipment SmartFreshTM treatment
Air Controlled atmospherePre-ship SmartFreshTM 0 ppb 14.1 14.3Pre-ship SmartFreshTM 1000 ppb 14.2 -2
0.23LSD (P=0.05)1
0.34
1 Least significant difference of the means (5% level).2. No data available.3 Comparing down the air columns.4. For all other comparisons
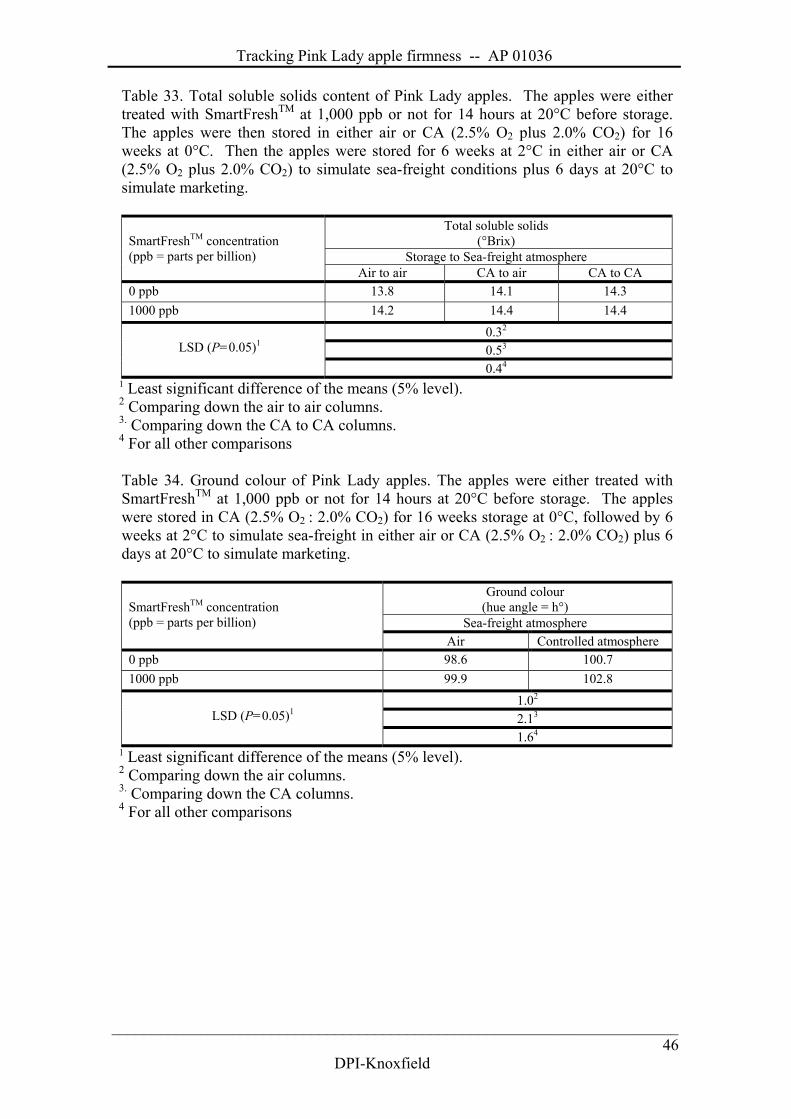
Tracking Pink Lady apple firmness -- AP 01036
_______________________________________________________________________
DPI-Knoxfield46
Table 33. Total soluble solids content of Pink Lady apples. The apples were eithertreated with SmartFreshTM at 1,000 ppb or not for 14 hours at 20°C before storage.The apples were then stored in either air or CA (2.5% O2 plus 2.0% CO2) for 16weeks at 0°C. Then the apples were stored for 6 weeks at 2°C in either air or CA(2.5% O2 plus 2.0% CO2) to simulate sea-freight conditions plus 6 days at 20°C tosimulate marketing.
Total soluble solids(°Brix)
Storage to Sea-freight atmosphereSmartFreshTM concentration(ppb = parts per billion)
Air to air CA to air CA to CA0 ppb 13.8 14.1 14.31000 ppb 14.2 14.4 14.4
0.32
0.53 LSD (P=0.05)1
0.44
1 Least significant difference of the means (5% level).2 Comparing down the air to air columns.3. Comparing down the CA to CA columns.4 For all other comparisons
Table 34. Ground colour of Pink Lady apples. The apples were either treated withSmartFreshTM at 1,000 ppb or not for 14 hours at 20°C before storage. The appleswere stored in CA (2.5% O2 : 2.0% CO2) for 16 weeks storage at 0°C, followed by 6weeks at 2°C to simulate sea-freight in either air or CA (2.5% O2 : 2.0% CO2) plus 6days at 20°C to simulate marketing.
Ground colour(hue angle = h°)
Sea-freight atmosphereSmartFreshTM concentration(ppb = parts per billion)
Air Controlled atmosphere0 ppb 98.6 100.71000 ppb 99.9 102.8
1.02
2.13 LSD (P=0.05)1
1.64
1 Least significant difference of the means (5% level).2 Comparing down the air columns.3. Comparing down the CA columns.4 For all other comparisons
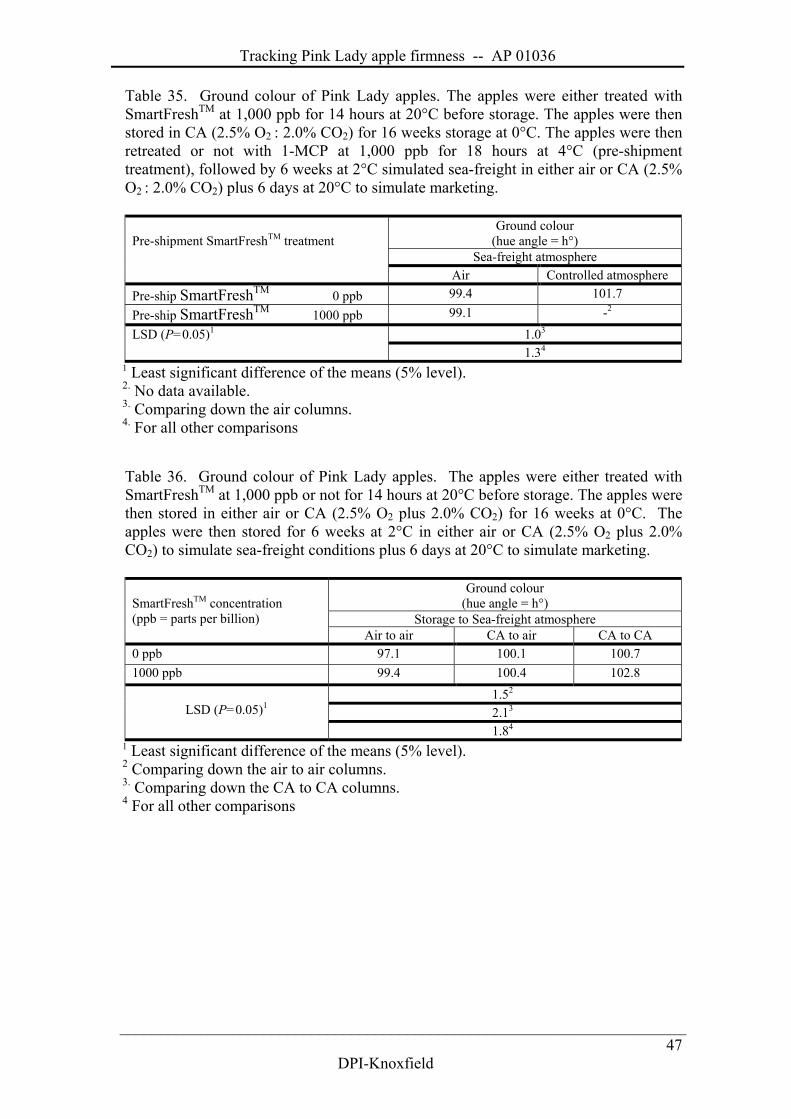
Tracking Pink Lady apple firmness -- AP 01036
_______________________________________________________________________
DPI-Knoxfield47
Table 35. Ground colour of Pink Lady apples. The apples were either treated withSmartFreshTM at 1,000 ppb for 14 hours at 20°C before storage. The apples were thenstored in CA (2.5% O2 : 2.0% CO2) for 16 weeks storage at 0°C. The apples were thenretreated or not with 1-MCP at 1,000 ppb for 18 hours at 4°C (pre-shipmenttreatment), followed by 6 weeks at 2°C simulated sea-freight in either air or CA (2.5%O2 : 2.0% CO2) plus 6 days at 20°C to simulate marketing.
Ground colour(hue angle = h°)
Sea-freight atmospherePre-shipment SmartFreshTM treatment
Air Controlled atmospherePre-ship SmartFreshTM 0 ppb 99.4 101.7Pre-ship SmartFreshTM 1000 ppb 99.1 -2
1.03LSD (P=0.05)1
1.34
1 Least significant difference of the means (5% level).2. No data available.3. Comparing down the air columns.4. For all other comparisons
Table 36. Ground colour of Pink Lady apples. The apples were either treated withSmartFreshTM at 1,000 ppb or not for 14 hours at 20°C before storage. The apples werethen stored in either air or CA (2.5% O2 plus 2.0% CO2) for 16 weeks at 0°C. Theapples were then stored for 6 weeks at 2°C in either air or CA (2.5% O2 plus 2.0%CO2) to simulate sea-freight conditions plus 6 days at 20°C to simulate marketing.
Ground colour(hue angle = h°)
Storage to Sea-freight atmosphereSmartFreshTM concentration(ppb = parts per billion)
Air to air CA to air CA to CA0 ppb 97.1 100.1 100.71000 ppb 99.4 100.4 102.8
1.52
2.13 LSD (P=0.05)1
1.84
1 Least significant difference of the means (5% level).2 Comparing down the air to air columns.3. Comparing down the CA to CA columns.4 For all other comparisons
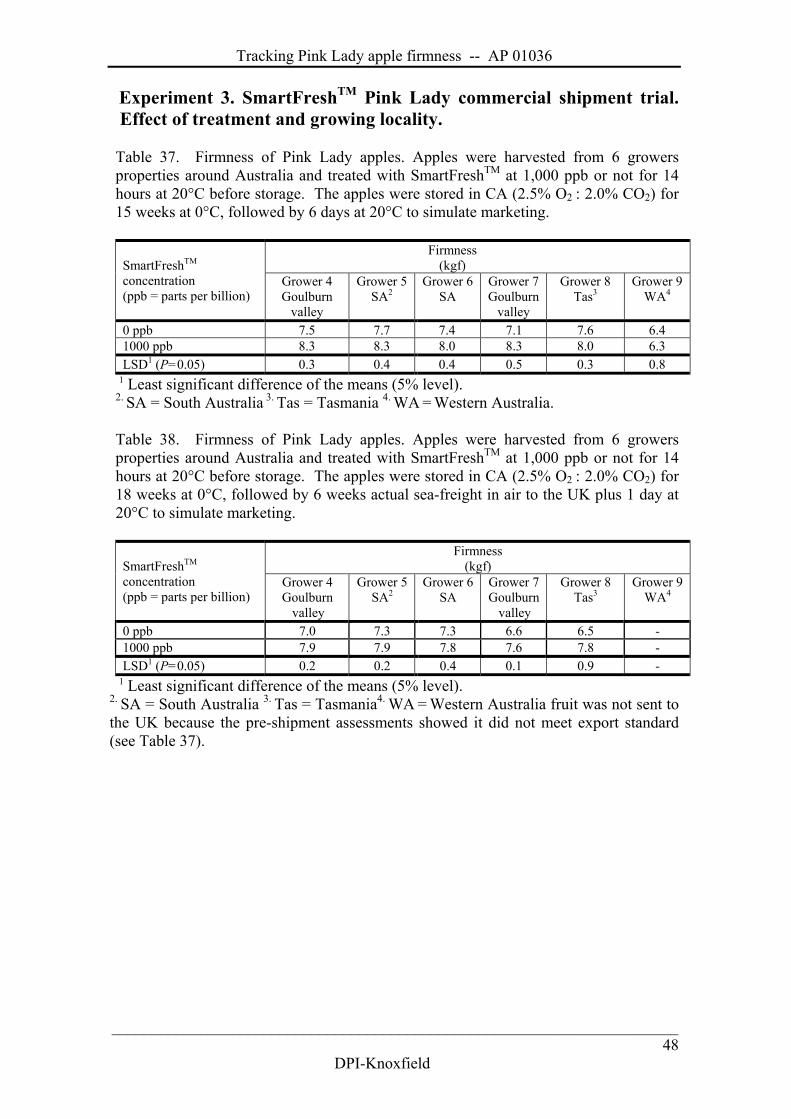
Tracking Pink Lady apple firmness -- AP 01036
_______________________________________________________________________
DPI-Knoxfield48
Experiment 3. SmartFreshTM Pink Lady commercial shipment trial.Effect of treatment and growing locality.
Table 37. Firmness of Pink Lady apples. Apples were harvested from 6 growersproperties around Australia and treated with SmartFreshTM at 1,000 ppb or not for 14hours at 20°C before storage. The apples were stored in CA (2.5% O2 : 2.0% CO2) for15 weeks at 0°C, followed by 6 days at 20°C to simulate marketing.
Firmness(kgf)SmartFreshTM
concentration(ppb = parts per billion)
Grower 4Goulburn
valley
Grower 5SA2
Grower 6SA
Grower 7Goulburn
valley
Grower 8Tas3
Grower 9WA4
0 ppb 7.5 7.7 7.4 7.1 7.6 6.41000 ppb 8.3 8.3 8.0 8.3 8.0 6.3LSD1 (P=0.05) 0.3 0.4 0.4 0.5 0.3 0.8
1 Least significant difference of the means (5% level).2. SA = South Australia 3. Tas = Tasmania 4. WA = Western Australia.
Table 38. Firmness of Pink Lady apples. Apples were harvested from 6 growersproperties around Australia and treated with SmartFreshTM at 1,000 ppb or not for 14hours at 20°C before storage. The apples were stored in CA (2.5% O2 : 2.0% CO2) for18 weeks at 0°C, followed by 6 weeks actual sea-freight in air to the UK plus 1 day at20°C to simulate marketing.
Firmness(kgf)SmartFreshTM
concentration(ppb = parts per billion)
Grower 4Goulburn
valley
Grower 5SA2
Grower 6SA
Grower 7Goulburn
valley
Grower 8Tas3
Grower 9WA4
0 ppb 7.0 7.3 7.3 6.6 6.5 -1000 ppb 7.9 7.9 7.8 7.6 7.8 -LSD1 (P=0.05) 0.2 0.2 0.4 0.1 0.9 -
1 Least significant difference of the means (5% level).2. SA = South Australia 3. Tas = Tasmania4. WA = Western Australia fruit was not sent tothe UK because the pre-shipment assessments showed it did not meet export standard(see Table 37).
Tracking Pink Lady apple firmness -- AP 01036
_______________________________________________________________________
DPI-Knoxfield49
5.3 Simulated export trial: Effect of SmartFreshTM on PinkLady apple firmness
INTRODUCTION
In 2001, 2002 and 2003 fruit was harvested from 2 orchards in the Goulburn Valley andtreated with SmartFreshTM and after 6 months controlled atmosphere storage the fruittreated and not treated with SmartFreshTM were shipped to the UK where the firmness ofthe fruit was assessed.
5.3.1 EXPERIMENTAL OBJECTIVES
Determine the effects of SmartFreshTM on Pink Lady apple firmness after air andcontrolled atmosphere storage followed by simulated shipping to the UK at optimum0°C or poor carriage temperature of 4°C.
5.3.2 MATERIALS AND METHODS
Season 2001Pink Lady apples were harvested from 2 orchards (orchard 2 and orchard 5) in theGoulburn Valley on 26thApril, 2001 (commercial harvest). The fruit was storedovernight in a commercial cool-room. On arrival at DPI, Knoxfield, the fruit was placedat 4oC. On the 2nd May the fruit was treated with SmartFreshTM at 625 ppb for 14 hoursat 20oC. The 0 ppb control treatments were stored in chambers without SmartFreshTM
and were removed from the SmartFreshTM treatment room first and placed in the 0°Ccold store followed by the SmartFreshTM treated fruit.
Non-SmartFreshTM (control) and SmartFreshTM treated fruit were stored in separatereplicated controlled atmosphere CA chambers (2.5% O2 plus 2% CO2). Air stored fruitwere held in a perforated plastic liner placed on top of the CA chambers. CAcommenced on the 4th May. After 12 weeks in air or 18 weeks in CA the fruit weretransferred to either 0oC or 4oC for 6 weeks to simulated shipping to the UK at optimalor sub-optimal shipping temperatures plus 1 day at 20oC to bring the fruit to roomtemperature. The fruit firmness was measured using a hand held penetrometer with ahand held 11 mm plunger.
Season 2002Pink Lady apples were harvested from 2 orchards (orchard 1 and orchard 4) in theGoulburn Valley on 19thApril, 2003 (commercial harvest). On the 19th April the fruitwas treated with SmartFreshTM as described for the 2001 harvest except that thetreatment was for 24 hours at 20°C. CA commenced on the 23rd April. Storage andsimulated shipping were the same as described for the 2001 harvest.
Season 2003Pink Lady apples were harvested from 2 orchards (orchard 1 and orchard 5) in theGoulburn Valley on 10thApril, 2003 (commercial harvest). On the 11th April the fruitwas treated with SmartFreshTM as described for the 2001 harvest except that thetreatment was for 24 hours at 12°C. CA commenced on the 13th April. Storage andsimulated shipping were the same as described for the 2001 harvest.
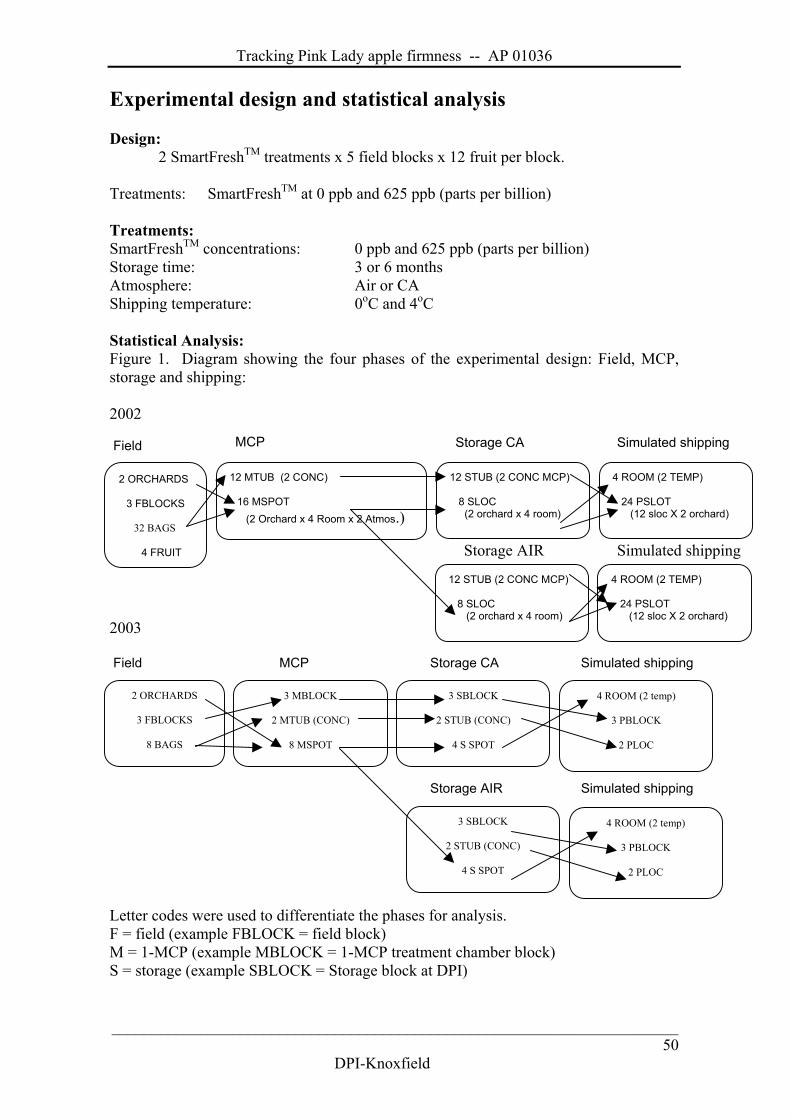
Tracking Pink Lady apple firmness -- AP 01036
_______________________________________________________________________
DPI-Knoxfield50
Experimental design and statistical analysis
Design:2 SmartFreshTM treatments x 5 field blocks x 12 fruit per block.
Treatments: SmartFreshTM at 0 ppb and 625 ppb (parts per billion)
Treatments:SmartFreshTM concentrations: 0 ppb and 625 ppb (parts per billion)Storage time: 3 or 6 monthsAtmosphere: Air or CAShipping temperature: 0oC and 4oC
Statistical Analysis:Figure 1. Diagram showing the four phases of the experimental design: Field, MCP,storage and shipping:
2002
Field
2003
Field MCP Storage CA Simulated shipping
Storage AIR Simulated shipping
Letter codes were used to differentiate the phases for analysis.F = field (example FBLOCK = field block)M = 1-MCP (example MBLOCK = 1-MCP treatment chamber block)S = storage (example SBLOCK = Storage block at DPI)
Simulated shipping
2 ORCHARDS
3 FBLOCKS
32 BAGS
4 FRUIT
12 MTUB (2 CONC)
16 MSPOT (2 Orchard x 4 Room x 2 Atmos.)
MCP
4 ROOM (2 TEMP)
24 PSLOT (12 sloc X 2 orchard)
Simulated shipping
Storage AIR
12 STUB (2 CONC MCP)
8 SLOC (2 orchard x 4 room)
Storage CA
12 STUB (2 CONC MCP)
8 SLOC (2 orchard x 4 room)
4 ROOM (2 TEMP)
24 PSLOT (12 sloc X 2 orchard)
2 ORCHARDS
3 FBLOCKS
8 BAGS
3 MBLOCK
2 MTUB (CONC)
8 MSPOT
4 ROOM (2 temp)
3 PBLOCK
2 PLOC
3 SBLOCK
2 STUB (CONC)
4 S SPOT
3 SBLOCK
2 STUB (CONC)
4 S SPOT
4 ROOM (2 temp)
3 PBLOCK
2 PLOC
Tracking Pink Lady apple firmness -- AP 01036
_______________________________________________________________________
DPI-Knoxfield51
5.3.3 RESULTS
Storage experiments in 2001 to 2003
Air storage experimentIn all years, the flesh of Pink Lady apples treated with SmartFreshTM was significantlyfirmer than for untreated fruit after 3 months air storage followed by 6 weeks simulatedshipping at 0°C or 4°C plus 1 day at 20°C (Tables 1, 2 and 3). This was true for the fruitfrom the two orchards used in the trials each year.
In 2001, the untreated fruit from both orchards held at 4°C simulated shippingtemperature were significantly softer than fruit held at 0°C (Table 1)*. There was nosignificant effect of the simulated shipping temperature on SmartFreshTM treated fruitfrom orchard 2. However, the fruit stored at 4°C from orchard 5 were significantlysofter than fruit stored at 0°C whether they were treated with SmartFreshTM or not.
In 2002 and 2003 the firmness of treated and untreated fruit from both was notsignificantly affected by the elevated simulated shipping temperature (Tables 2 and 3)
Controlled atmosphere storage experimentPink Lady apples treated with SmartFreshTM were significantly firmer than untreatedfruit after 6 months controlled atmosphere (CA) storage followed by 6 weeks simulatedshipping at 0°C or 4°C plus 1 day at 20°C every year (Tables 4, 5 and 6). The exceptionwas in 2001 when there was no significant difference in the firmness of treated anduntreated of orchard 5 fruit held continuously at 0°C (Table 3). There was no significanteffect of the simulated shipping temperature on firmness of treated or untreated fruitfrom all orchards in any of the years studied.
* All tables referenced are to be found within the current chapter.
Tracking Pink Lady apple firmness -- AP 01036
_______________________________________________________________________
DPI-Knoxfield52
5.3.4 TABLES
Table 1. The effect of SmartFreshTM on Pink Lady apple firmness after 12 weeks airstorage in 2001, followed by 6 weeks at 0oC or 4oC to simulate good and poor shippingtemperatures followed by 1 day at 20oC to bring the fruit to room temperature.
Orchard 2 Orchard 5SmartFreshTM
Concentration(parts per billion)
0oC 4oC 0oC 4oC
0 ppb 7.3 6.9 6.9 6.7625 ppb 8.5 8.3 8.1 7.6
0.22LSD (P=0.05)1
0.63
1 Least significant difference of the means (5% level)2 Comparing means across a row at the same level of SmartFreshTM.3 For all other comparisons.
Table 2. The effect of SmartFreshTM on Pink Lady apple firmness after 12 weeks airstorage in 2002, followed by 6 weeks at 0oC or 4oC to simulate good and poor shippingtemperatures followed by 1 day at 20oC to bring the fruit to room temperature.
Orchard 1 Orchard 4SmartFreshTM
Concentration(parts per billion)
0oC 4oC 0oC 4oC
0 ppb 7.2 7.0 6.5 6.2625 ppb 9.3 9.4 7.9 8.1LSD (P=0.05)1 0.31 Least significant difference of the means (5% level)
Table 3. The effect of SmartFreshTM on Pink Lady apple firmness after 12 weeks airstorage in 2003, followed by 6 weeks at 0oC or 4oC to simulate good and poor shippingtemperatures followed by 1 day at 20oC to bring the fruit to room temperature.
Orchard 1 Orchard 5SmartFreshTM
Concentration(parts per billion)
0oC 4oC 0oC 4oC
0 ppb 6.9 6.8 6.0 5.7625 ppb 8.3 8.3 7.6 7.4LSD (P=0.05)1 0.41 Least significant difference of the means (5% level)
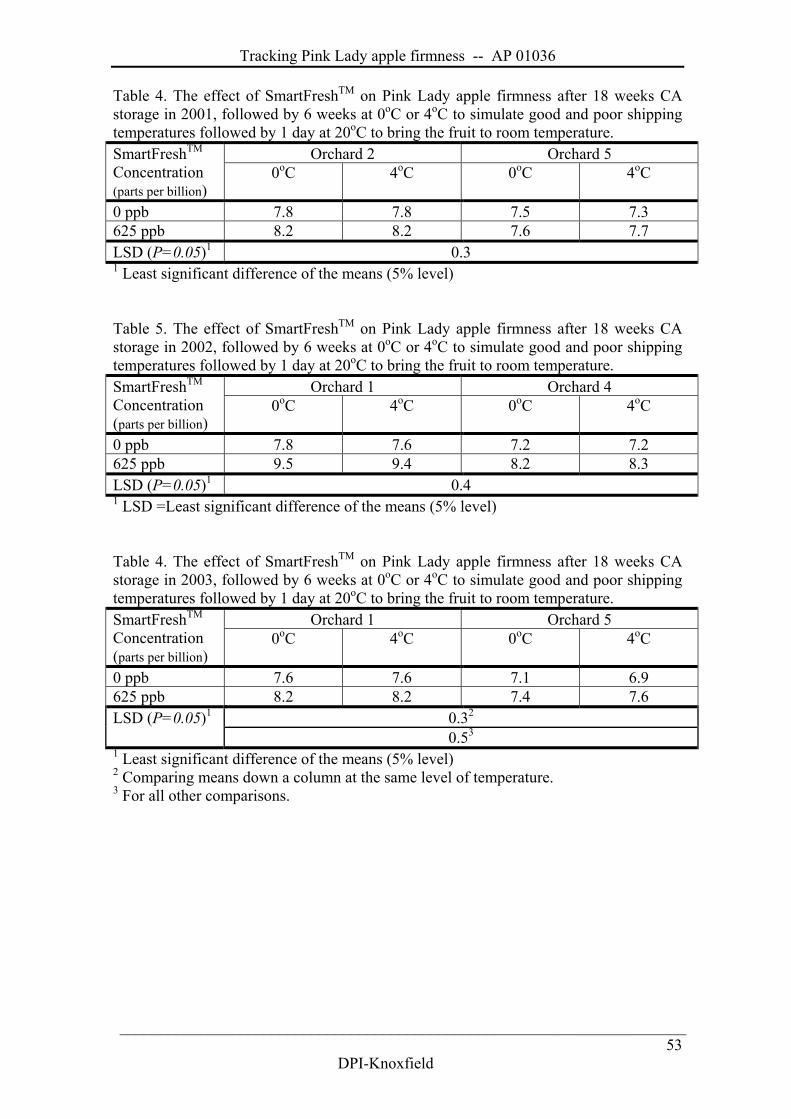
Tracking Pink Lady apple firmness -- AP 01036
_______________________________________________________________________
DPI-Knoxfield53
Table 4. The effect of SmartFreshTM on Pink Lady apple firmness after 18 weeks CAstorage in 2001, followed by 6 weeks at 0oC or 4oC to simulate good and poor shippingtemperatures followed by 1 day at 20oC to bring the fruit to room temperature.
Orchard 2 Orchard 5SmartFreshTM
Concentration(parts per billion)
0oC 4oC 0oC 4oC
0 ppb 7.8 7.8 7.5 7.3625 ppb 8.2 8.2 7.6 7.7LSD (P=0.05)1 0.31 Least significant difference of the means (5% level)
Table 5. The effect of SmartFreshTM on Pink Lady apple firmness after 18 weeks CAstorage in 2002, followed by 6 weeks at 0oC or 4oC to simulate good and poor shippingtemperatures followed by 1 day at 20oC to bring the fruit to room temperature.
Orchard 1 Orchard 4SmartFreshTM
Concentration(parts per billion)
0oC 4oC 0oC 4oC
0 ppb 7.8 7.6 7.2 7.2625 ppb 9.5 9.4 8.2 8.3LSD (P=0.05)1 0.41 LSD =Least significant difference of the means (5% level)
Table 4. The effect of SmartFreshTM on Pink Lady apple firmness after 18 weeks CAstorage in 2003, followed by 6 weeks at 0oC or 4oC to simulate good and poor shippingtemperatures followed by 1 day at 20oC to bring the fruit to room temperature.
Orchard 1 Orchard 5SmartFreshTM
Concentration(parts per billion)
0oC 4oC 0oC 4oC
0 ppb 7.6 7.6 7.1 6.9625 ppb 8.2 8.2 7.4 7.6
0.32LSD (P=0.05)1
0.53
1 Least significant difference of the means (5% level)2 Comparing means down a column at the same level of temperature.3 For all other comparisons.
Tracking Pink Lady apple firmness -- AP 01036
_______________________________________________________________________
DPI-Knoxfield54
5.4 Commercial export trial: Effect of SmartFreshTM onPink Lady apple firmness
INTRODUCTION
In 2002 and 2003 fruit was harvested from 12 orchards in the Goulburn Valley andtreated with SmartFreshTM. After 6 months controlled atmosphere storage the fruittreated and not treated with SmartFreshTM were shipped to the UK where the firmness ofthe fruit was assessed. The UK standard for imported Pink Lady apples is for the fruit tohave a firmness value greater than or equal to 7 kgf with a minimum acceptance of 10%at 6.0 to 6.9 kgf.
5.4.1 EXPERIMENTAL OBJECTIVES
Determine the effect of SmartFreshTM on Pink Lady apple firmness after prolongedstorage and shipment to the UK.
5.4.2 MATERIALS AND METHODS
Season 2002
Pink Lady apples were harvested from 12 orchards in the Goulburn Valley between29/4/2002 and 1/5/2002 during the normal commercial harvest period. On arrival atDPI, Knoxfield, the fruit was held at 0oC. The fruit was treated with SmartFreshTM
(3.3% active ingredient 1-MCP) on the 7th May for 24 hours at 20°C. A 2,000,000 ppbconcentrate was prepared and a gas sample was withdrawn with a syringe and injectedinto the 150 litre treatment chamber to deliver 625 ppb. Each chamber had a small fishtank pump running during the treatment to provide some air movement, see Plate 1. Thefruit was treated inside their storage and export cartons. The 0 ppb control treatmentswere placed in chambers without SmartFreshTM and were removed from theSmartFreshTM treatment room first and placed in the 0°C cold store followed by the 625ppb treatments. Non-SmartFreshTM (control) and SmartFreshTM treated fruit were storedin one large controlled atmosphere storage tent (2.5% O2 plus 2% CO2). The CA storagecommenced on the 8th May. On the 26th August, the experimental cartons of fruit weredelivered to Shepparton for inclusion in a commercial shipment of Pink Lady apples, toChingford Fruit Packers in the UK. The fruit firmness was measured on the 10th
October, using an automated firmness measuring unit, a Guss Food Texture Analyser(FTA). Fruit was also assessed for the incidence of flesh browning.
Season 2003
Pink Lady apples were harvested from 12 orchards in the Goulburn Valley between10/4/2003 to 15/4/2003 at optimum physiological maturity based on a starch index valueof approximately 4.5 (Based on the Ctifl 10 point scale index). On arrival at DPI,Knoxfield, the fruit was held at 4oC. On the 16th April the fruit was treated withSmartFreshTM at 625 ppb, using the same method as described in 2002 for 24 hours at12°C. The fruit were held in nylon netting bags during the treatment treatment and werestored in plastic crates. The CA storage commenced on the 18th May. On the 22nd
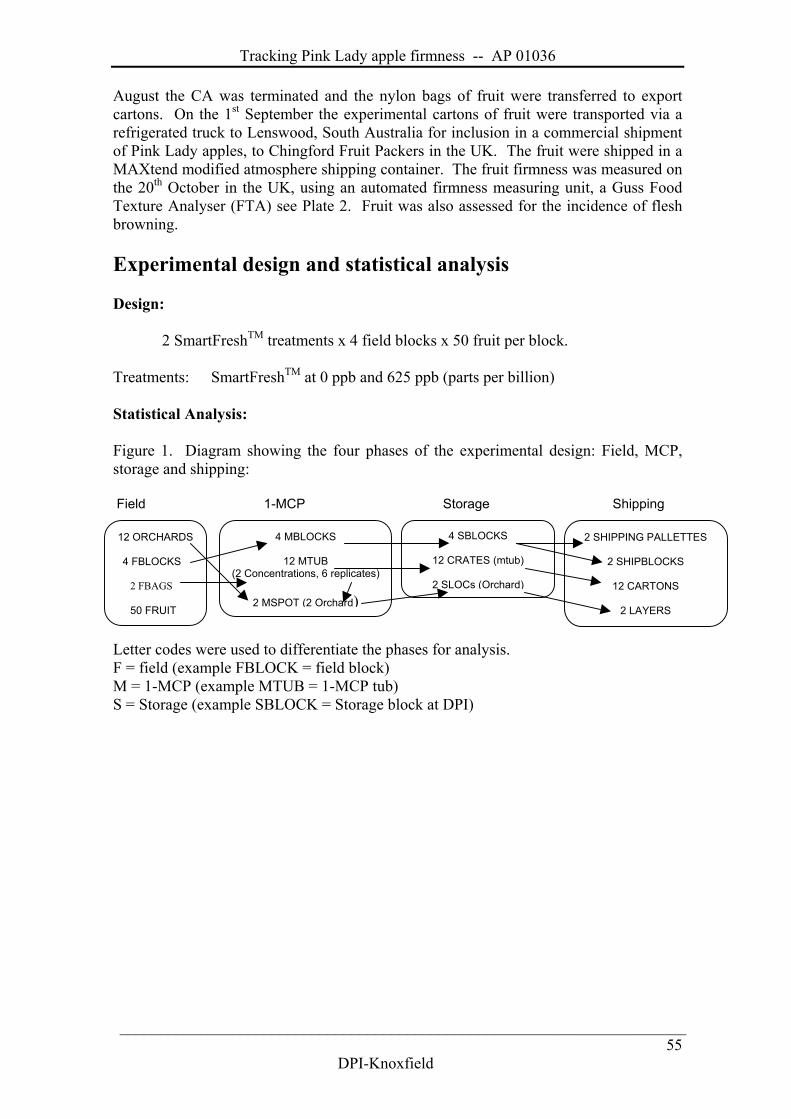
Tracking Pink Lady apple firmness -- AP 01036
_______________________________________________________________________
DPI-Knoxfield55
August the CA was terminated and the nylon bags of fruit were transferred to exportcartons. On the 1st September the experimental cartons of fruit were transported via arefrigerated truck to Lenswood, South Australia for inclusion in a commercial shipmentof Pink Lady apples, to Chingford Fruit Packers in the UK. The fruit were shipped in aMAXtend modified atmosphere shipping container. The fruit firmness was measured onthe 20th October in the UK, using an automated firmness measuring unit, a Guss FoodTexture Analyser (FTA) see Plate 2. Fruit was also assessed for the incidence of fleshbrowning.
Experimental design and statistical analysis
Design:
2 SmartFreshTM treatments x 4 field blocks x 50 fruit per block.
Treatments: SmartFreshTM at 0 ppb and 625 ppb (parts per billion)
Statistical Analysis:
Figure 1. Diagram showing the four phases of the experimental design: Field, MCP,storage and shipping:
Field 1-MCP Storage Shipping
Letter codes were used to differentiate the phases for analysis.F = field (example FBLOCK = field block)M = 1-MCP (example MTUB = 1-MCP tub)S = Storage (example SBLOCK = Storage block at DPI)
12 ORCHARDS
4 FBLOCKS
2 FBAGS
50 FRUIT
4 MBLOCKS
12 MTUB(2 Concentrations, 6 replicates)
2 MSPOT (2 Orchard)
2 SHIPPING PALLETTES
2 SHIPBLOCKS
12 CARTONS
2 LAYERS
4 SBLOCKS
12 CRATES (mtub)
2 SLOCs (Orchard)
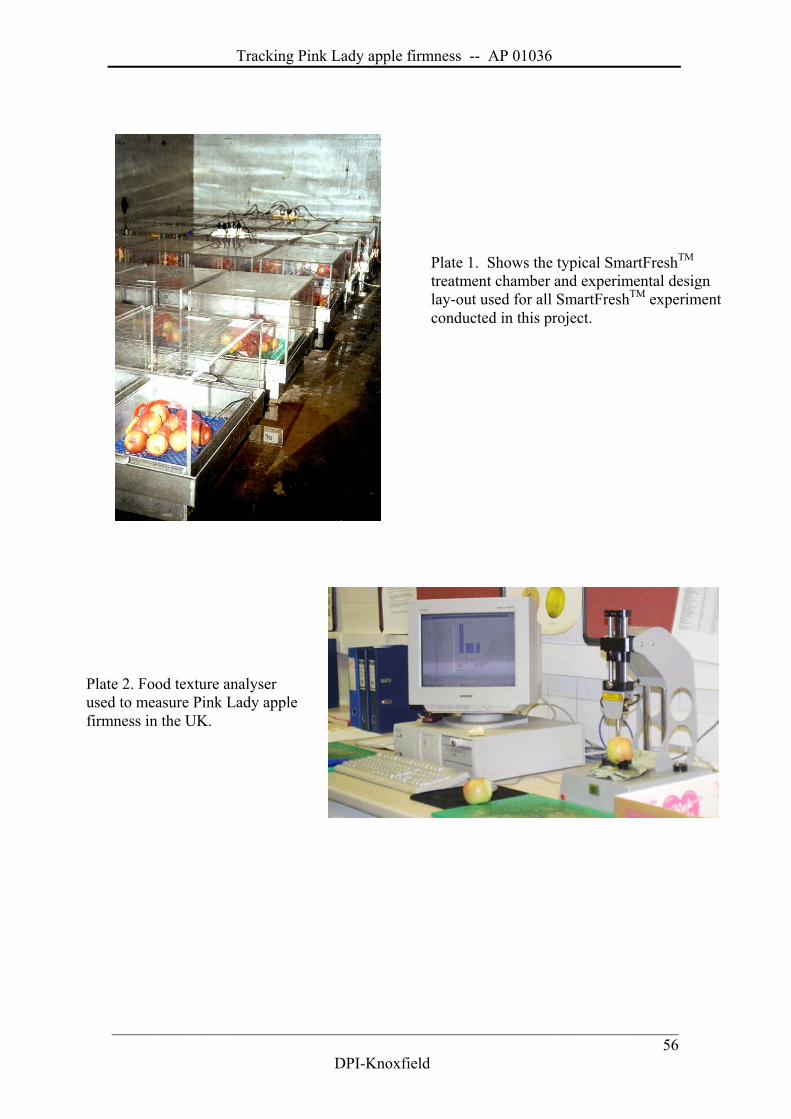
Tracking Pink Lady apple firmness -- AP 01036
_______________________________________________________________________
DPI-Knoxfield56
Plate 1. Shows the typical SmartFreshTM
treatment chamber and experimental designlay-out used for all SmartFreshTM experimentconducted in this project.
Plate 2. Food texture analyserused to measure Pink Lady applefirmness in the UK.
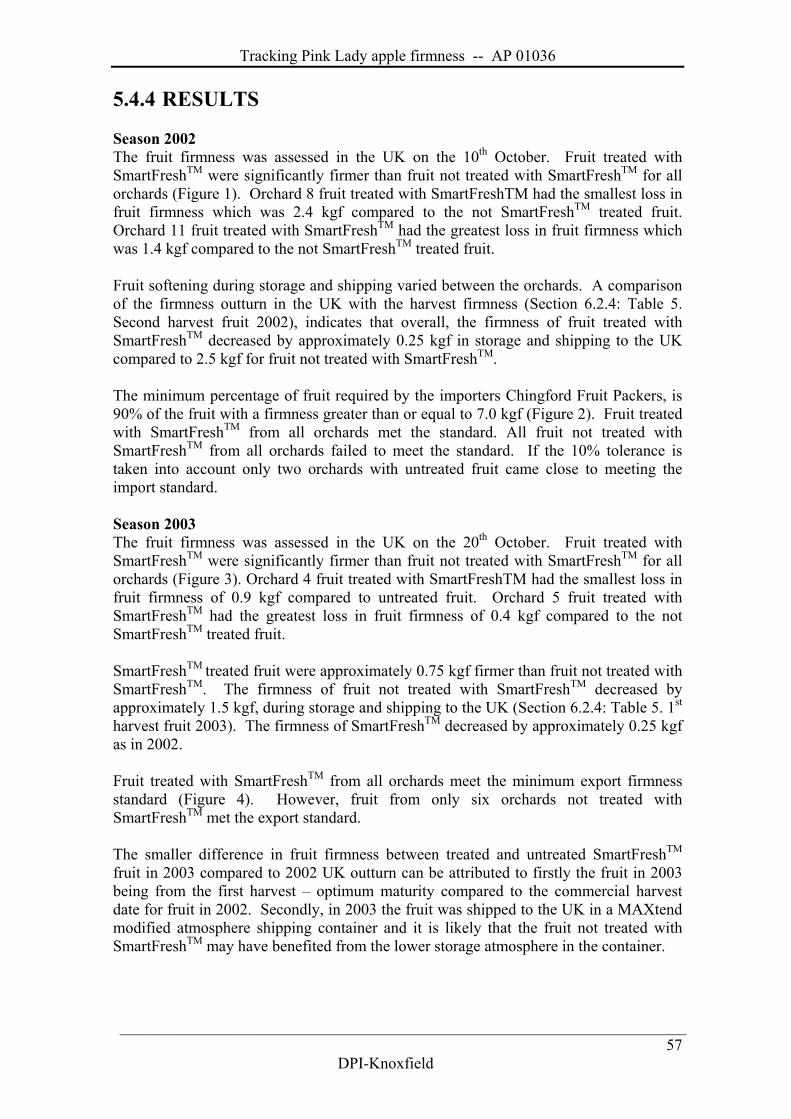
Tracking Pink Lady apple firmness -- AP 01036
_______________________________________________________________________
DPI-Knoxfield57
5.4.4 RESULTS
Season 2002The fruit firmness was assessed in the UK on the 10th October. Fruit treated withSmartFreshTM were significantly firmer than fruit not treated with SmartFreshTM for allorchards (Figure 1). Orchard 8 fruit treated with SmartFreshTM had the smallest loss infruit firmness which was 2.4 kgf compared to the not SmartFreshTM treated fruit.Orchard 11 fruit treated with SmartFreshTM had the greatest loss in fruit firmness whichwas 1.4 kgf compared to the not SmartFreshTM treated fruit.
Fruit softening during storage and shipping varied between the orchards. A comparisonof the firmness outturn in the UK with the harvest firmness (Section 6.2.4: Table 5.Second harvest fruit 2002), indicates that overall, the firmness of fruit treated withSmartFreshTM decreased by approximately 0.25 kgf in storage and shipping to the UKcompared to 2.5 kgf for fruit not treated with SmartFreshTM.
The minimum percentage of fruit required by the importers Chingford Fruit Packers, is90% of the fruit with a firmness greater than or equal to 7.0 kgf (Figure 2). Fruit treatedwith SmartFreshTM from all orchards met the standard. All fruit not treated withSmartFreshTM from all orchards failed to meet the standard. If the 10% tolerance istaken into account only two orchards with untreated fruit came close to meeting theimport standard.
Season 2003The fruit firmness was assessed in the UK on the 20th October. Fruit treated withSmartFreshTM were significantly firmer than fruit not treated with SmartFreshTM for allorchards (Figure 3). Orchard 4 fruit treated with SmartFreshTM had the smallest loss infruit firmness of 0.9 kgf compared to untreated fruit. Orchard 5 fruit treated withSmartFreshTM had the greatest loss in fruit firmness of 0.4 kgf compared to the notSmartFreshTM treated fruit.
SmartFreshTM treated fruit were approximately 0.75 kgf firmer than fruit not treated withSmartFreshTM. The firmness of fruit not treated with SmartFreshTM decreased byapproximately 1.5 kgf, during storage and shipping to the UK (Section 6.2.4: Table 5. 1st
harvest fruit 2003). The firmness of SmartFreshTM decreased by approximately 0.25 kgfas in 2002.
Fruit treated with SmartFreshTM from all orchards meet the minimum export firmnessstandard (Figure 4). However, fruit from only six orchards not treated withSmartFreshTM met the export standard.
The smaller difference in fruit firmness between treated and untreated SmartFreshTM
fruit in 2003 compared to 2002 UK outturn can be attributed to firstly the fruit in 2003being from the first harvest – optimum maturity compared to the commercial harvestdate for fruit in 2002. Secondly, in 2003 the fruit was shipped to the UK in a MAXtendmodified atmosphere shipping container and it is likely that the fruit not treated withSmartFreshTM may have benefited from the lower storage atmosphere in the container.
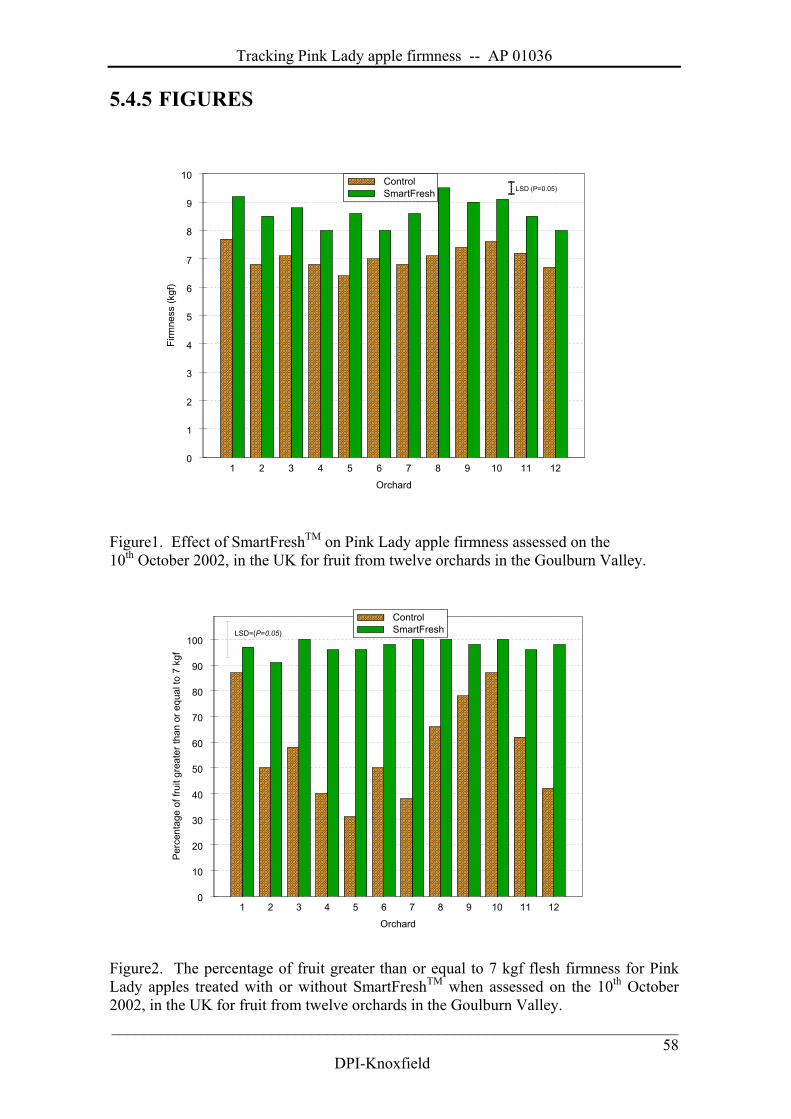
Tracking Pink Lady apple firmness -- AP 01036
_______________________________________________________________________
DPI-Knoxfield58
5.4.5 FIGURES
1 2 3 4 5 6 7 8 9 10 11 12
Orchard
0
1
2
3
4
5
6
7
8
9
10Fi
rmne
ss (k
gf)
ControlSmartFresh LSD (P=0.05)
Figure1. Effect of SmartFreshTM on Pink Lady apple firmness assessed on the10th October 2002, in the UK for fruit from twelve orchards in the Goulburn Valley.
1 2 3 4 5 6 7 8 9 10 11 12
Orchard
0
10
20
30
40
50
60
70
80
90
100
Per
cent
age
of fr
uit g
reat
er th
an o
r equ
al to
7 k
gf
ControlSmartFreshLSD=(P=0.05)
Figure2. The percentage of fruit greater than or equal to 7 kgf flesh firmness for PinkLady apples treated with or without SmartFreshTM when assessed on the 10th October2002, in the UK for fruit from twelve orchards in the Goulburn Valley.
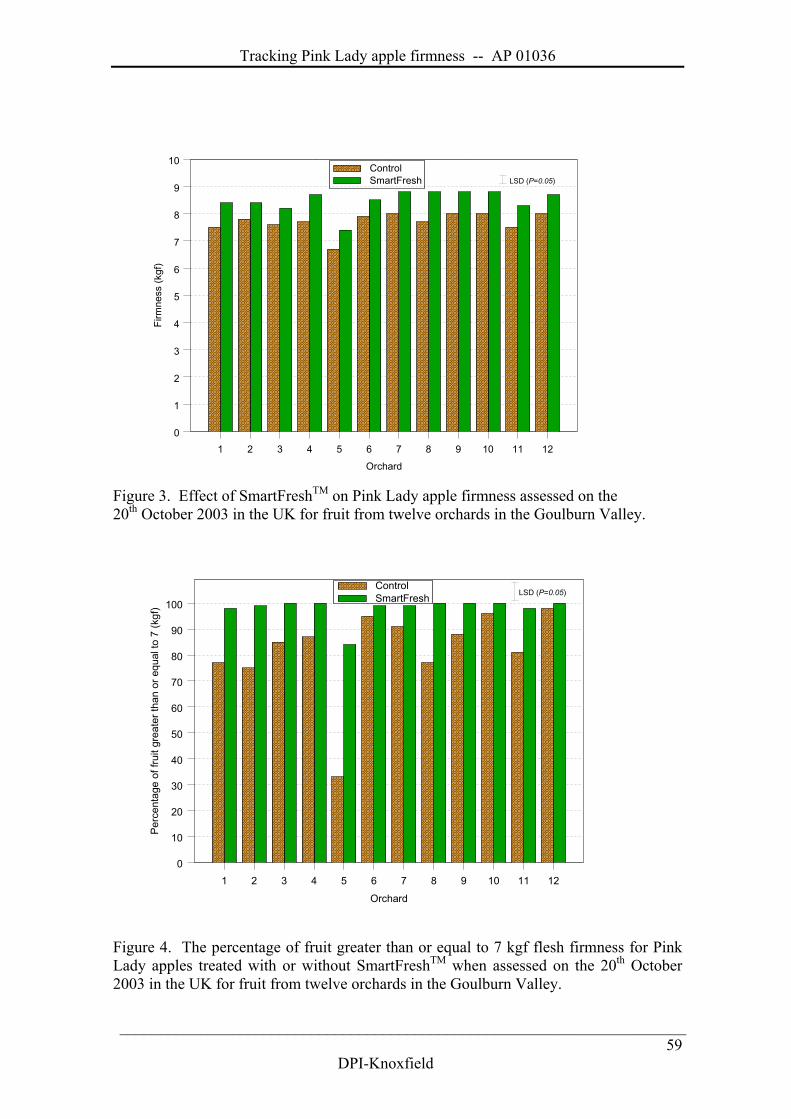
Tracking Pink Lady apple firmness -- AP 01036
_______________________________________________________________________
DPI-Knoxfield59
1 2 3 4 5 6 7 8 9 10 11 12
Orchard
0
1
2
3
4
5
6
7
8
9
10Fi
rmne
ss (k
gf)
ControlSmartFresh LSD (P=0.05)
Figure 3. Effect of SmartFreshTM on Pink Lady apple firmness assessed on the20th October 2003 in the UK for fruit from twelve orchards in the Goulburn Valley.
1 2 3 4 5 6 7 8 9 10 11 12
Orchard
0
10
20
30
40
50
60
70
80
90
100
Per
cent
age
of fr
uit g
reat
er th
an o
r equ
al to
7 (k
gf)
ControlSmartFresh LSD (P=0.05)
Figure 4. The percentage of fruit greater than or equal to 7 kgf flesh firmness for PinkLady apples treated with or without SmartFreshTM when assessed on the 20th October2003 in the UK for fruit from twelve orchards in the Goulburn Valley.
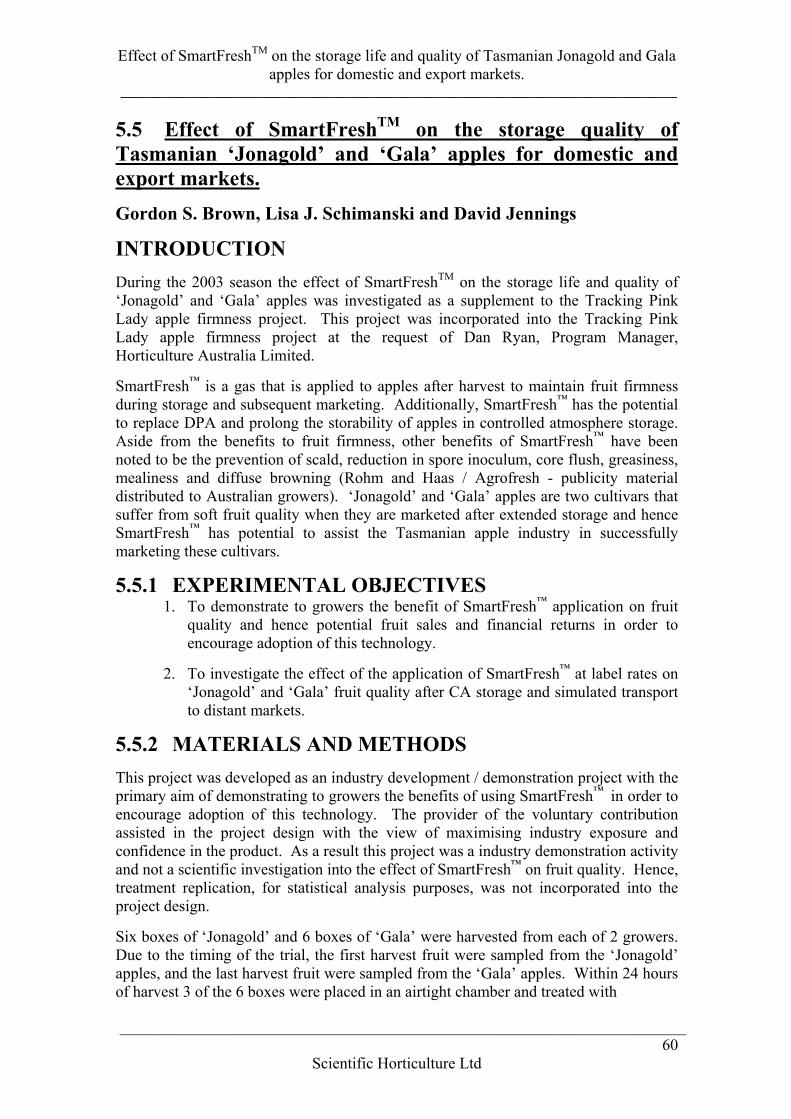
Effect of SmartFreshTM on the storage life and quality of Tasmanian Jonagold and Galaapples for domestic and export markets.
___________________________________________________________________________________
_______________________________________________________________________60
Scientific Horticulture Ltd
5.5 Effect of SmartFreshTM on the storage quality ofTasmanian ‘Jonagold’ and ‘Gala’ apples for domestic andexport markets.Gordon S. Brown, Lisa J. Schimanski and David Jennings
INTRODUCTIONDuring the 2003 season the effect of SmartFreshTM on the storage life and quality of‘Jonagold’ and ‘Gala’ apples was investigated as a supplement to the Tracking PinkLady apple firmness project. This project was incorporated into the Tracking PinkLady apple firmness project at the request of Dan Ryan, Program Manager,Horticulture Australia Limited.
SmartFresh™ is a gas that is applied to apples after harvest to maintain fruit firmnessduring storage and subsequent marketing. Additionally, SmartFresh™ has the potentialto replace DPA and prolong the storability of apples in controlled atmosphere storage.Aside from the benefits to fruit firmness, other benefits of SmartFresh™ have beennoted to be the prevention of scald, reduction in spore inoculum, core flush, greasiness,mealiness and diffuse browning (Rohm and Haas / Agrofresh - publicity materialdistributed to Australian growers). ‘Jonagold’ and ‘Gala’ apples are two cultivars thatsuffer from soft fruit quality when they are marketed after extended storage and henceSmartFresh™ has potential to assist the Tasmanian apple industry in successfullymarketing these cultivars.
5.5.1 EXPERIMENTAL OBJECTIVES1. To demonstrate to growers the benefit of SmartFresh™ application on fruit
quality and hence potential fruit sales and financial returns in order toencourage adoption of this technology.
2. To investigate the effect of the application of SmartFresh™ at label rates on‘Jonagold’ and ‘Gala’ fruit quality after CA storage and simulated transportto distant markets.
5.5.2 MATERIALS AND METHODSThis project was developed as an industry development / demonstration project with theprimary aim of demonstrating to growers the benefits of using SmartFresh™ in order toencourage adoption of this technology. The provider of the voluntary contributionassisted in the project design with the view of maximising industry exposure andconfidence in the product. As a result this project was a industry demonstration activityand not a scientific investigation into the effect of SmartFresh™ on fruit quality. Hence,treatment replication, for statistical analysis purposes, was not incorporated into theproject design.
Six boxes of ‘Jonagold’ and 6 boxes of ‘Gala’ were harvested from each of 2 growers.Due to the timing of the trial, the first harvest fruit were sampled from the ‘Jonagold’apples, and the last harvest fruit were sampled from the ‘Gala’ apples. Within 24 hoursof harvest 3 of the 6 boxes were placed in an airtight chamber and treated with
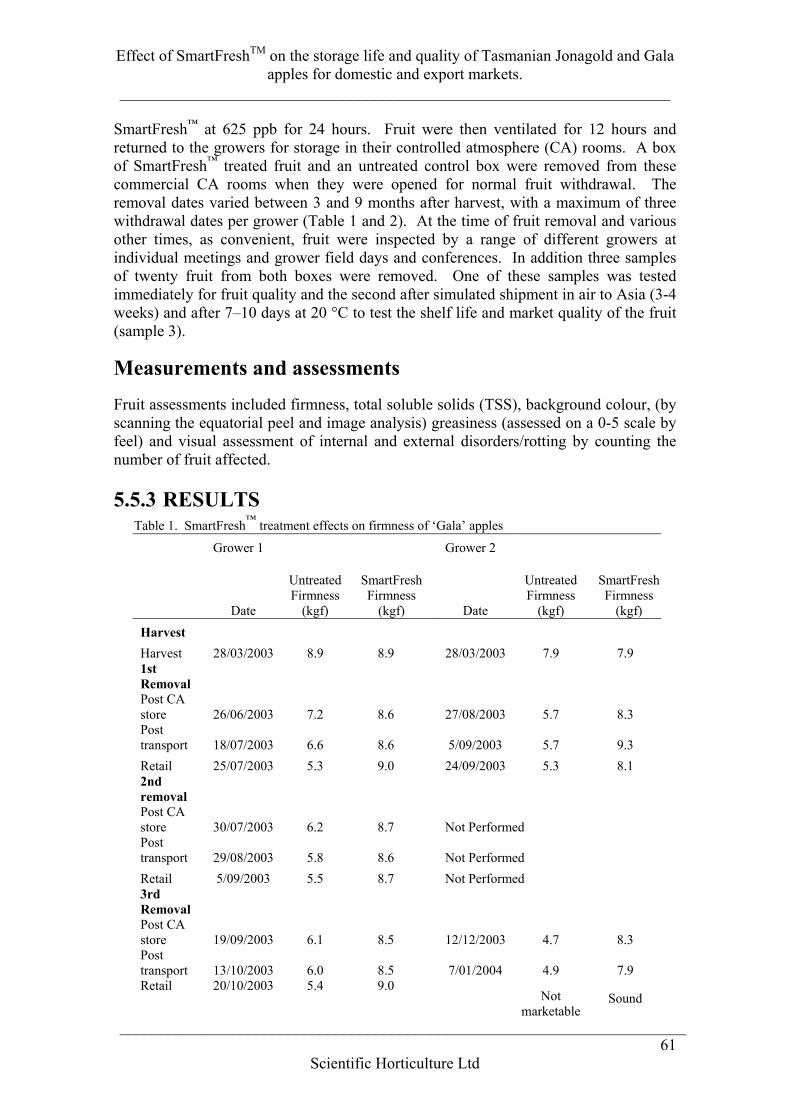
Effect of SmartFreshTM on the storage life and quality of Tasmanian Jonagold and Galaapples for domestic and export markets.
_____________________________________________________________________
_______________________________________________________________________61
Scientific Horticulture Ltd
SmartFresh™ at 625 ppb for 24 hours. Fruit were then ventilated for 12 hours andreturned to the growers for storage in their controlled atmosphere (CA) rooms. A boxof SmartFresh™ treated fruit and an untreated control box were removed from thesecommercial CA rooms when they were opened for normal fruit withdrawal. Theremoval dates varied between 3 and 9 months after harvest, with a maximum of threewithdrawal dates per grower (Table 1 and 2). At the time of fruit removal and variousother times, as convenient, fruit were inspected by a range of different growers atindividual meetings and grower field days and conferences. In addition three samplesof twenty fruit from both boxes were removed. One of these samples was testedimmediately for fruit quality and the second after simulated shipment in air to Asia (3-4weeks) and after 7–10 days at 20 °C to test the shelf life and market quality of the fruit(sample 3).
Measurements and assessmentsFruit assessments included firmness, total soluble solids (TSS), background colour, (byscanning the equatorial peel and image analysis) greasiness (assessed on a 0-5 scale byfeel) and visual assessment of internal and external disorders/rotting by counting thenumber of fruit affected.
5.5.3 RESULTSTable 1. SmartFresh™ treatment effects on firmness of ‘Gala’ apples
Grower 1 Grower 2
Date
UntreatedFirmness
(kgf)
SmartFreshFirmness
(kgf) Date
UntreatedFirmness
(kgf)
SmartFreshFirmness
(kgf)HarvestHarvest 28/03/2003 8.9 8.9 28/03/2003 7.9 7.91stRemovalPost CAstore 26/06/2003 7.2 8.6 27/08/2003 5.7 8.3Posttransport 18/07/2003 6.6 8.6 5/09/2003 5.7 9.3Retail 25/07/2003 5.3 9.0 24/09/2003 5.3 8.12ndremovalPost CAstore 30/07/2003 6.2 8.7 Not PerformedPosttransport 29/08/2003 5.8 8.6 Not PerformedRetail 5/09/2003 5.5 8.7 Not Performed3rdRemovalPost CAstore 19/09/2003 6.1 8.5 12/12/2003 4.7 8.3Posttransport 13/10/2003 6.0 8.5 7/01/2004 4.9 7.9Retail 20/10/2003 5.4 9.0
Notmarketable
Sound
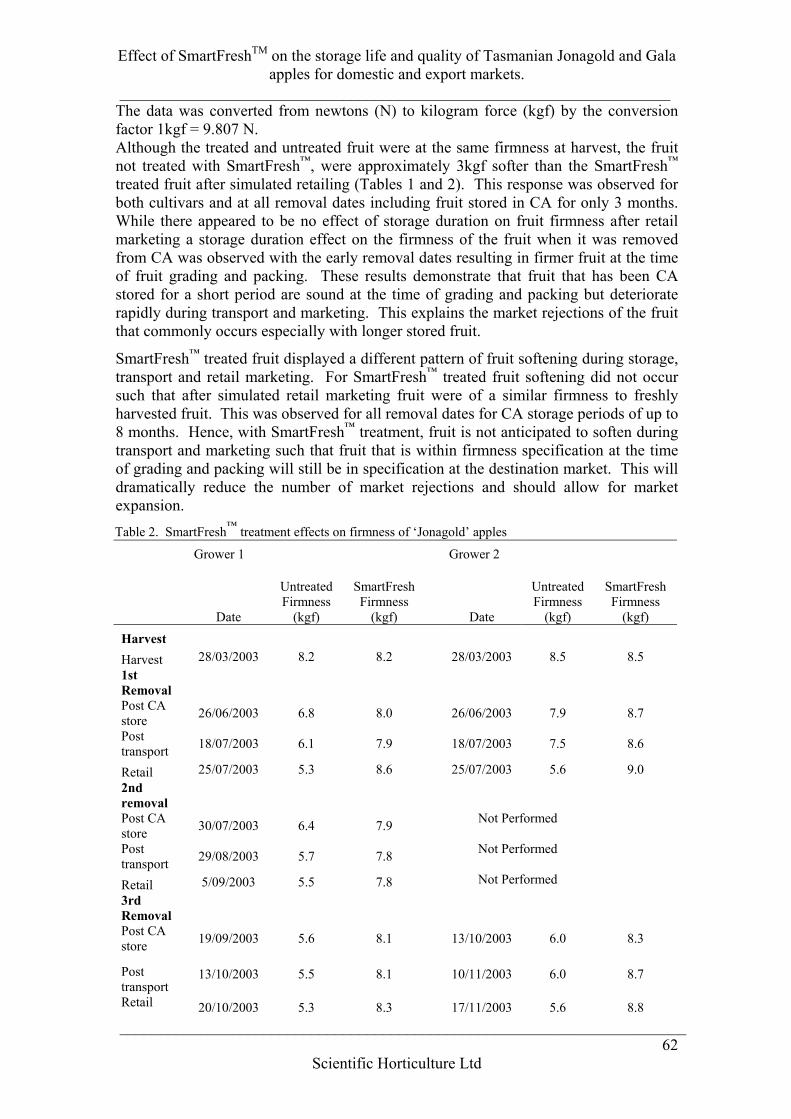
Effect of SmartFreshTM on the storage life and quality of Tasmanian Jonagold and Galaapples for domestic and export markets.
_____________________________________________________________________
_______________________________________________________________________62
Scientific Horticulture Ltd
The data was converted from newtons (N) to kilogram force (kgf) by the conversionfactor 1kgf = 9.807 N.Although the treated and untreated fruit were at the same firmness at harvest, the fruitnot treated with SmartFresh™, were approximately 3kgf softer than the SmartFresh™
treated fruit after simulated retailing (Tables 1 and 2). This response was observed forboth cultivars and at all removal dates including fruit stored in CA for only 3 months.While there appeared to be no effect of storage duration on fruit firmness after retailmarketing a storage duration effect on the firmness of the fruit when it was removedfrom CA was observed with the early removal dates resulting in firmer fruit at the timeof fruit grading and packing. These results demonstrate that fruit that has been CAstored for a short period are sound at the time of grading and packing but deterioraterapidly during transport and marketing. This explains the market rejections of the fruitthat commonly occurs especially with longer stored fruit.
SmartFresh™ treated fruit displayed a different pattern of fruit softening during storage,transport and retail marketing. For SmartFresh™ treated fruit softening did not occursuch that after simulated retail marketing fruit were of a similar firmness to freshlyharvested fruit. This was observed for all removal dates for CA storage periods of up to8 months. Hence, with SmartFresh™ treatment, fruit is not anticipated to soften duringtransport and marketing such that fruit that is within firmness specification at the timeof grading and packing will still be in specification at the destination market. This willdramatically reduce the number of market rejections and should allow for marketexpansion.
Data on SmartFresh™ effects on other fruit quality parameters are presented in tables 3and 4. The noteworthy observation in these tables is that of fruit greasiness, anothercommon complaint in the marketplace. Although the level of fruit greasiness was lowin this demonstration trial it was only observed in untreated fruit and was neverobserved in SmartFresh™ treated fruit. These observations support the claims that havebeen made that this material reduces the incidence of greasiness in marketed fruit.
Table 2. SmartFresh™ treatment effects on firmness of ‘Jonagold’ apples
Grower 1 Grower 2
Date
UntreatedFirmness
(kgf)
SmartFreshFirmness
(kgf) Date
UntreatedFirmness
(kgf)
SmartFreshFirmness
(kgf)HarvestHarvest 28/03/2003 8.2 8.2 28/03/2003 8.5 8.51stRemovalPost CAstore 26/06/2003 6.8 8.0 26/06/2003 7.9 8.7
Posttransport 18/07/2003 6.1 7.9 18/07/2003 7.5 8.6
Retail 25/07/2003 5.3 8.6 25/07/2003 5.6 9.02ndremovalPost CAstore 30/07/2003 6.4 7.9 Not Performed
Posttransport 29/08/2003 5.7 7.8 Not Performed
Retail 5/09/2003 5.5 7.8 Not Performed3rdRemovalPost CAstore 19/09/2003 5.6 8.1 13/10/2003 6.0 8.3
Posttransport
13/10/2003 5.5 8.1 10/11/2003 6.0 8.7
Retail 20/10/2003 5.3 8.3 17/11/2003 5.6 8.8
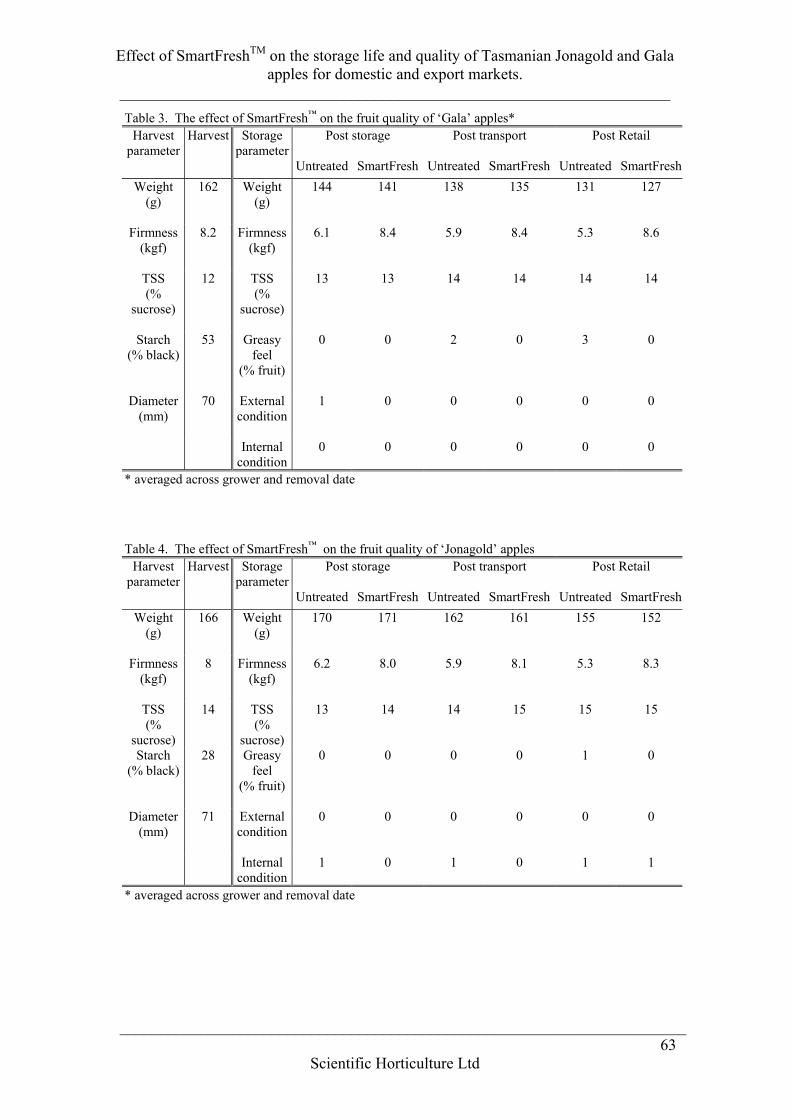
Effect of SmartFreshTM on the storage life and quality of Tasmanian Jonagold and Galaapples for domestic and export markets.
_____________________________________________________________________
_______________________________________________________________________63
Scientific Horticulture Ltd
Table 4. The effect of SmartFresh™ on the fruit quality of ‘Jonagold’ applesHarvest
parameterHarvest Storage
parameterPost storage Post transport Post Retail
Untreated SmartFresh Untreated SmartFresh Untreated SmartFreshWeight
(g)166 Weight
(g)170 171 162 161 155 152
Firmness(kgf)
8 Firmness(kgf)
6.2 8.0 5.9 8.1 5.3 8.3
TSS(%
sucrose)
14 TSS(%
sucrose)
13 14 14 15 15 15
Starch(% black)
28 Greasyfeel
(% fruit)
0 0 0 0 1 0
Diameter(mm)
71 Externalcondition
0 0 0 0 0 0
Internalcondition
1 0 1 0 1 1
* averaged across grower and removal date
Table 3. The effect of SmartFresh™ on the fruit quality of ‘Gala’ apples*Harvest
parameterHarvest Storage
parameterPost storage Post transport Post Retail
Untreated SmartFresh Untreated SmartFresh Untreated SmartFreshWeight
(g)162 Weight
(g)144 141 138 135 131 127
Firmness(kgf)
8.2 Firmness(kgf)
6.1 8.4 5.9 8.4 5.3 8.6
TSS(%
sucrose)
12 TSS(%
sucrose)
13 13 14 14 14 14
Starch(% black)
53 Greasyfeel
(% fruit)
0 0 2 0 3 0
Diameter(mm)
70 Externalcondition
1 0 0 0 0 0
Internalcondition
0 0 0 0 0 0
* averaged across grower and removal date
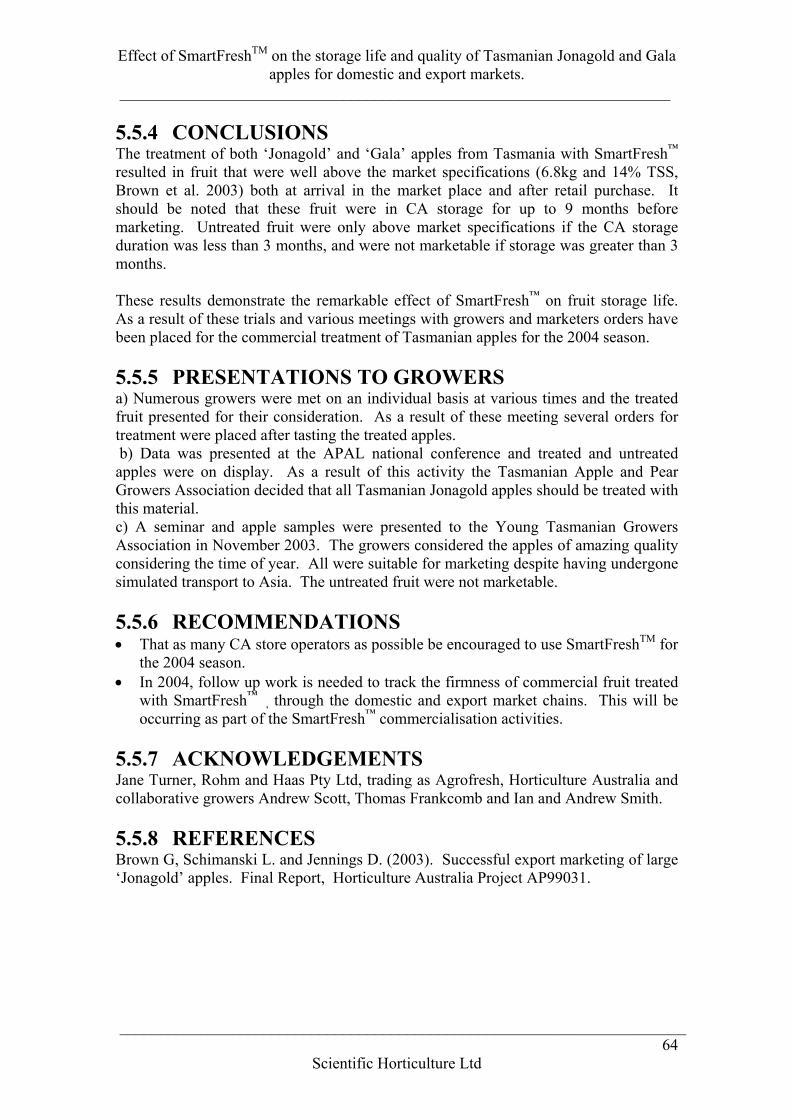
Effect of SmartFreshTM on the storage life and quality of Tasmanian Jonagold and Galaapples for domestic and export markets.
_____________________________________________________________________
_______________________________________________________________________64
Scientific Horticulture Ltd
5.5.4 CONCLUSIONSThe treatment of both ‘Jonagold’ and ‘Gala’ apples from Tasmania with SmartFresh™
resulted in fruit that were well above the market specifications (6.8kg and 14% TSS,Brown et al. 2003) both at arrival in the market place and after retail purchase. Itshould be noted that these fruit were in CA storage for up to 9 months beforemarketing. Untreated fruit were only above market specifications if the CA storageduration was less than 3 months, and were not marketable if storage was greater than 3months.
These results demonstrate the remarkable effect of SmartFresh™ on fruit storage life.As a result of these trials and various meetings with growers and marketers orders havebeen placed for the commercial treatment of Tasmanian apples for the 2004 season.
5.5.5 PRESENTATIONS TO GROWERSa) Numerous growers were met on an individual basis at various times and the treatedfruit presented for their consideration. As a result of these meeting several orders fortreatment were placed after tasting the treated apples. b) Data was presented at the APAL national conference and treated and untreatedapples were on display. As a result of this activity the Tasmanian Apple and PearGrowers Association decided that all Tasmanian Jonagold apples should be treated withthis material.c) A seminar and apple samples were presented to the Young Tasmanian GrowersAssociation in November 2003. The growers considered the apples of amazing qualityconsidering the time of year. All were suitable for marketing despite having undergonesimulated transport to Asia. The untreated fruit were not marketable.
5.5.6 RECOMMENDATIONS• That as many CA store operators as possible be encouraged to use SmartFreshTM for
the 2004 season.• In 2004, follow up work is needed to track the firmness of commercial fruit treated
with SmartFresh™ , through the domestic and export market chains. This will be
occurring as part of the SmartFresh™ commercialisation activities.
5.5.7 ACKNOWLEDGEMENTSJane Turner, Rohm and Haas Pty Ltd, trading as Agrofresh, Horticulture Australia andcollaborative growers Andrew Scott, Thomas Frankcomb and Ian and Andrew Smith.
5.5.8 REFERENCESBrown G, Schimanski L. and Jennings D. (2003). Successful export marketing of large‘Jonagold’ apples. Final Report, Horticulture Australia Project AP99031.
Tracking Pink Lady apple firmness – AP01036_____________________________________________________________________
______________________________________________________________________65
DPI-Knoxfield
6. MATURITY
6.1 Maturity literature review
Fruit should be harvested when they are mature but unripe and they still have the capacityto ripen normally and develop a full flavour. Fruit picked prematurely are likely to besmall, poorly coloured and will not develop full taste. Conversely, fruit that is picked toolate soften and become mealy, are more susceptible to bruising, flesh browning anddecay. There are a number of fruit indices that growers can use to help them decide whento harvest. Common maturity indices include measuring changes in flesh firmness, skinflesh colour, seed colour, total soluble solids, titratable acidity and starch hydrolysis.
Pink Lady is a late maturing cultivar. There are many good publications available whichoutline how and when these measurements should be taken (Little and Holmes, 2000,Chennell et al. 2002, Collins, 2002, MacKay et al. 1994). Therefore, detailed descriptionson maturity indice measurements will not be presented in this report.
Monitoring the maturity status of fruit, provides the grower with the capacity to managethe storability of harvested fruit through timely harvesting. Unfortunately, harvest seasonfactors such as weather, labour, and varying stages of colour development generally makeit unfeasible to get all the fruit at ideal maturity. In the Goulburn Valley, Victoria PinkLady matures ready to pick around mid to late April, depending on the season. Theoptimum firmness for picking Pink Lady apples for long term storage is 8 to 9.5 kgf or 7to 8 kgf for immediate marketing (MacKay et al. 1994)
Generally, starch accumulates in the fruit during the growing season and is hydrolysed tosugar in the later stages of maturation and development (Peirs et al. 2002). The quantityof starch in fruit is about 2% to 4% of fresh weight at commercial harvest and although itdisappears in apples during storage its products maintain the fruit metabolism throughoutcold storage and marketing (Little and Holmes 2000, p 38).
Light crops, crops from extended bloom periods, or crops with high nitrogen levels maydiffer markedly in maturity and subsequent storage potential. Each block should beevaluated separately for its maturity and storage potential (Penn State College, 2003). Itis important to monitor maturity during and at the end of harvest to know the spread ofmaturity for the harvest period.
If late-picked fruit is placed in CA storage for spring or summer marketing, fruitcondition problems may arise. Although the fruit may have good firmness directly out ofCA storage, it softens rapidly, resulting in an undesirable product arriving on the retailshelf (Olsen and Kupferman, 1984).
Section 6.4 will present the results of the effects of maturity at harvest on Pink Ladyapple firmness after storage and shipping.
Tracking Pink Lady apple firmness – AP01036______________________________________________________________________
________________________________________________________________________66
DPI-Knoxfield
6.2 Effect of harvest maturity on Pink Lady apple firmness.
INTRODUCTION
The maturity of the fruit at harvest should determine its ultimate market destination.Harvest maturity is based on maturity indices for starch, firmness, total soluble solidscontent, percentage blush and intensity, background colour and titratable acidity. In theGoulburn Valley some orchards have had problems colouring the fruit to meet the marketspecification for colour and this may have resulted in the fruit being over-mature inrespect to the other maturity indices. Therefore, to establish if over-maturity was a majorcontributing factor to soft fruit outturns after storage, fruit were harvested at optimummaturity based on the starch index of approximately 4.5 and a later harvest atapproximately 7.5 based on the Ctifl 10 point starch index).
6.2.1 EXPERIMENTAL OBJECTIVE
1. Determine the effect of harvest maturity on Pink Lady apple firmness.2. Produce a 10-point starch index chart for Pink Lady apples.3. Develop a limiting factor approach using existing harvest maturity indices to
decide when to harvest.
6.2.2 MATERIALS AND METHODS
Season 2001 Pink Lady apples were harvested from six orchards in the Goulburn Valley. The treeswere grown on mm106 rootstock. The tree ages were: orchard 1, 7 years; orchard 2, 7years; orchard 3, 7 years; orchard 4, 8 years; orchard 5, 8 years and orchard 6, 5 years.The fruit was harvested at two maturities, optimum and late maturity based on the starchindex, 10 point Ctifl starch chart (see Plate 1).
Colin Little monitored the harvest maturity up to and during harvest. The maturityindices measured by Colin Little were starch index using the 10 point Ctifl starch chart,firmness (kgf) using a hand held penetrometer, total soluble solids (o Brix) using a handheld refractometer, red blush using the visual percentage of apple surface area showingsome degree of redness and red intensity using a rating scale of 1 = pale bronzy red to 5 =full red colour. In addition, at each harvest, fifteen fruit were picked and assessed forfirmness and starch by DPI, Knoxfield staff.
As deciding when to harvest is based on a combination of factors a limiting factorapproach was developed to assist growers in the decision of when to harvest. Theaccepted optimum harvest standards for long-term storage are a starch score of 4.5(Ctifl), firmness greater than 8 kgf, TSS greater than13.5 oBrix and 40 to 50% blush.Fruit sampled for maturity assessment is recorded and the percentage of fruit that meetsthe harvest standard is plotted against time. The harvest commences when all harvestindices meet 80% of the standard. The limiting factor is that parameter that holds offcommencing the harvest.
Tracking Pink Lady apple firmness – AP01036_____________________________________________________________________
_______________________________________________________________________67
DPI-Knoxfield
Season 2002Pink Lady apples were harvested from twelve orchards in the Goulburn Valley. The treeages were: orchard 1, 8 years; orchard 2, 8 years; orchard 3, 8 years; orchard 4, 9 years;orchard 5, 9 years; orchard 6, 6 years; orchard 7, 7 years; orchard 8, 6 years; orchard 9, 7years; orchard 10, 7 years; orchard 11, 9 years and orchard 12, 7 years. The fruit washarvested at two maturities, optimum and late maturity based on the 10 point Ctifl starchindex. Maturity assessments were as described for season 2001.
Season 2003Pink Lady apples were harvested from the same twelve orchards as in 2001 / 2002 in theGoulburn Valley. The fruit was harvested at two maturities, optimum and late maturitybased on the 10 point starch starch index. Maturity assessments were as described forseason 2001.
The 10 point Ctifl starch conversion chart is a stylised pictorial representation of starchclearance patterns for radial type fruit. Pink Lady apples have radial type starch patterns.As part of this project a 10-point starch clearance chart has been developed that usesactual Pink Lady apple photographs.
6.2.3 RESULTS
Harvest datesIn 2000 / 2001 the first harvest was on the 13th April and the second was on 26th April(Table 1)*. In 2001/2002 the first pick was 4 to 5 days later than in 2000/2001. Thesecond pick was approximately 13 days after the first pick. In 2002 / the first pick formost orchards was 10th to 15th April. The second pick was 9 to 17 days later.
The growers participating in this project were asked to provide the actual harvest dateswhen they started harvesting from the same orchard block (Table 2). Most growersstarted picking close to the projects second pick in most years. The exceptions beingorchards 1 and 3, which commenced picking close to, the projects first pick in2000/2001.
Starch scoresThe fruit was picked based on physiological maturity. That is, it was picked based on thestarch scores. The Ctifl starch chart was used to record starch score (Plate 1). The aimwas to pick the fruit at optimum physiological maturity based on A starch score of about4.5 and the second harvest at commercial harvest with a Ctifl score of about 7.5.
In 2001, the Ctifl scores were close to the target with the exception being orchard 3 thathad starch scores of 8.2 and 8.9 for the first and second picks (Table 3).
In 2002, most orchards were harvested close to the target scores. The exceptions beingfor orchard 6 and orchard 12 that had starch scores higher than anticipated being 7.2 and7.4 at the first harvest. In the second pick, most orchards were harvested slightly earlywith an average starch score about 6.
* All tables referenced are to be found within the current chapter.
Tracking Pink Lady apple firmness – AP01036______________________________________________________________________
________________________________________________________________________68
DPI-Knoxfield
In 2003, most orchards were harvested close to the target scores for the first pick theexception being orchard 11 with a starch score of 6.9 for the first pick. In the secondpick, most orchards had starch scores of about 8. The exceptions being orchards 7 and 8with scores of 5 and 5.8 respectively.
The Ctifl starch chart is a stylised starch conversion chart for radial type apples. DPI,Knoxfield has prepared a starch clearance chart based on actual Pink Lady apple starchtests (Plate2).
Plate 3 shows three samples of iodine-stained Pink Lady apples taken from differentorchards within this project. Iodine reacts with starch to form a dark blue / purple colour.Plate 3a best depicts what is generally conceived to be optimal starch patterns for long-term CA storage, Plate 3b medium-term CA storage and Plate 3c short-term CA storage.
Starch charts are a guide to storage potential because the more starch present at harvestmeans there is more potential energy left to maintain the fruits integrity during storage.The energy comes from the conversion of starch to sugars. Therefore, using the DPIstarch chart it is recommended the fruit starch patterns for long term CA storage fallbetween 3 and 5, but it is preferable that the majority of the fruit falls within ratings 3 and4 because the fruit has more starch. Up to, 20% of fruit with a rating of 5 would beacceptable.
FirmnessThe aim was to be able to pick fruit with a firmness greater than 8 kgf for long term CAstorage. Colin Little recommends that the fruit has an average fruit firmness of 8.0 to 8.6kgf for long term CA storage, 7.5 to 8.0 for medium term CA storage and 7.0 to 7.6 kgffor short term CA storage.
In the 2001,2002 and 2003 harvests, the average fruit firmness at pick one was greaterthan 8 kgf (Table 4). The exceptions being orchard 3 in 2001 and orchard 5 in 2003. In2001 and 2002 the average fruit firmness at pick 2 was also greater than 8 kgf. Theexception being orchard 3 in 2001. In 2003 in the second pick only orchards 4, 7 and 8had an average fruit firmness greater than 8 kgf
The average fruit firmness is a guide to storage potential. It is important when decidingthe storage potential of the fruit to know the percentage of fruit that are greater than orequal to 8 kgf. not just the average fruit firmness. The aim would be to have at least80% of the fruit tested with a firmness of 8kgf or greater. In 2001 at the first harvestonly orchard 3 failed to meet this criterion (Table 5). However, by the second harvestonly orchard 2 and 4 met the criterion. In the 2002 harvest all orchards met the criterionfor both harvests. The exception was orchard 6 where only 50% of the fruit tested greaterthan 8 kgf. In the 2003 harvest only orchards 1,2,3,4,6,7,8,10 and 11 met the criterion atthe first harvest and at the second harvest only orchard 4 met the criterion.
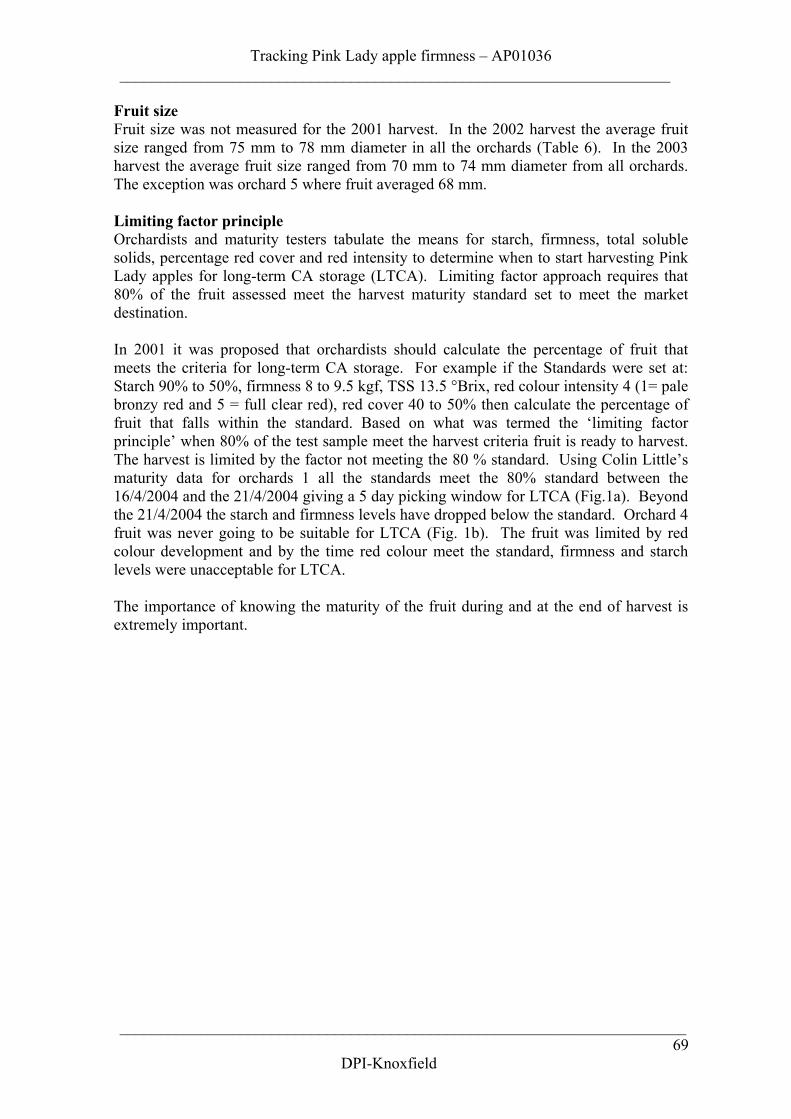
Tracking Pink Lady apple firmness – AP01036_____________________________________________________________________
_______________________________________________________________________69
DPI-Knoxfield
Fruit sizeFruit size was not measured for the 2001 harvest. In the 2002 harvest the average fruitsize ranged from 75 mm to 78 mm diameter in all the orchards (Table 6). In the 2003harvest the average fruit size ranged from 70 mm to 74 mm diameter from all orchards.The exception was orchard 5 where fruit averaged 68 mm.
Limiting factor principleOrchardists and maturity testers tabulate the means for starch, firmness, total solublesolids, percentage red cover and red intensity to determine when to start harvesting PinkLady apples for long-term CA storage (LTCA). Limiting factor approach requires that80% of the fruit assessed meet the harvest maturity standard set to meet the marketdestination.
In 2001 it was proposed that orchardists should calculate the percentage of fruit thatmeets the criteria for long-term CA storage. For example if the Standards were set at:Starch 90% to 50%, firmness 8 to 9.5 kgf, TSS 13.5 °Brix, red colour intensity 4 (1= palebronzy red and 5 = full clear red), red cover 40 to 50% then calculate the percentage offruit that falls within the standard. Based on what was termed the ‘limiting factorprinciple’ when 80% of the test sample meet the harvest criteria fruit is ready to harvest.The harvest is limited by the factor not meeting the 80 % standard. Using Colin Little’smaturity data for orchards 1 all the standards meet the 80% standard between the16/4/2004 and the 21/4/2004 giving a 5 day picking window for LTCA (Fig.1a). Beyondthe 21/4/2004 the starch and firmness levels have dropped below the standard. Orchard 4fruit was never going to be suitable for LTCA (Fig. 1b). The fruit was limited by redcolour development and by the time red colour meet the standard, firmness and starchlevels were unacceptable for LTCA.
The importance of knowing the maturity of the fruit during and at the end of harvest isextremely important.
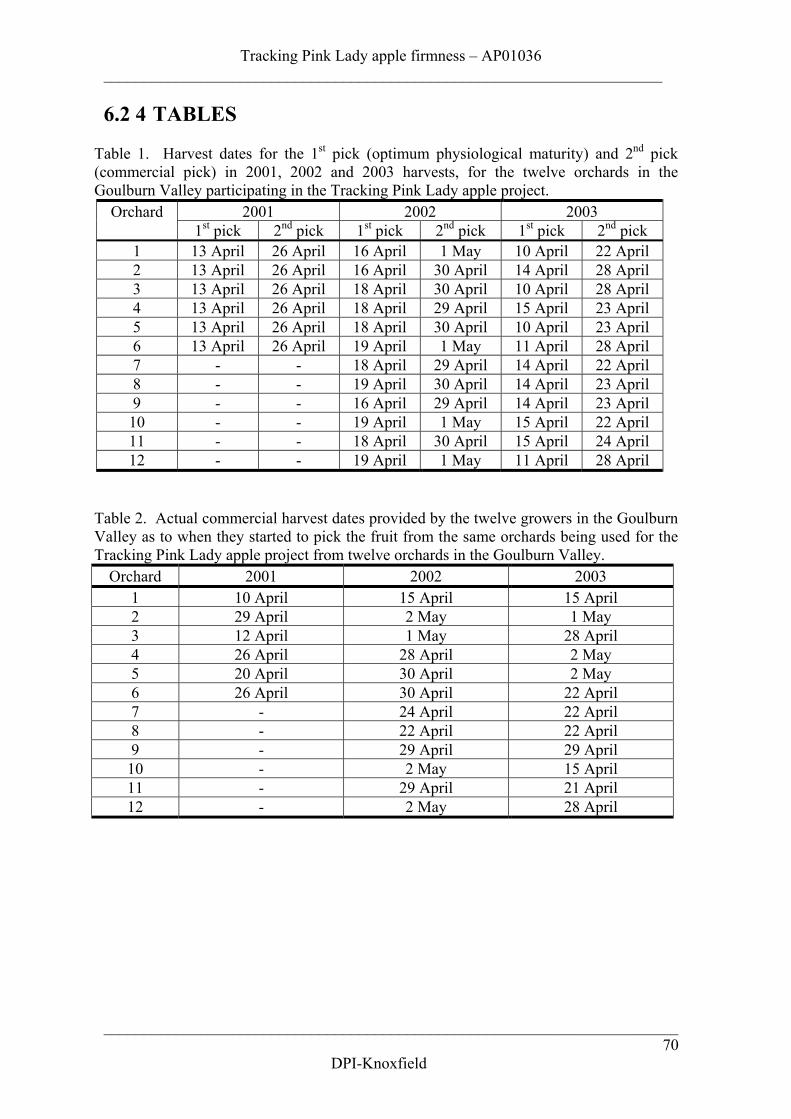
Tracking Pink Lady apple firmness – AP01036______________________________________________________________________
________________________________________________________________________70
DPI-Knoxfield
6.2 4 TABLES
Table 1. Harvest dates for the 1st pick (optimum physiological maturity) and 2nd pick(commercial pick) in 2001, 2002 and 2003 harvests, for the twelve orchards in theGoulburn Valley participating in the Tracking Pink Lady apple project.
2001 2002 2003Orchard1st pick 2nd pick 1st pick 2nd pick 1st pick 2nd pick
1 13 April 26 April 16 April 1 May 10 April 22 April2 13 April 26 April 16 April 30 April 14 April 28 April3 13 April 26 April 18 April 30 April 10 April 28 April4 13 April 26 April 18 April 29 April 15 April 23 April5 13 April 26 April 18 April 30 April 10 April 23 April6 13 April 26 April 19 April 1 May 11 April 28 April7 - - 18 April 29 April 14 April 22 April8 - - 19 April 30 April 14 April 23 April9 - - 16 April 29 April 14 April 23 April10 - - 19 April 1 May 15 April 22 April11 - - 18 April 30 April 15 April 24 April12 - - 19 April 1 May 11 April 28 April
Table 2. Actual commercial harvest dates provided by the twelve growers in the GoulburnValley as to when they started to pick the fruit from the same orchards being used for theTracking Pink Lady apple project from twelve orchards in the Goulburn Valley.
Orchard 2001 2002 20031 10 April 15 April 15 April2 29 April 2 May 1 May3 12 April 1 May 28 April4 26 April 28 April 2 May5 20 April 30 April 2 May6 26 April 30 April 22 April7 - 24 April 22 April8 - 22 April 22 April9 - 29 April 29 April10 - 2 May 15 April11 - 29 April 21 April12 - 2 May 28 April
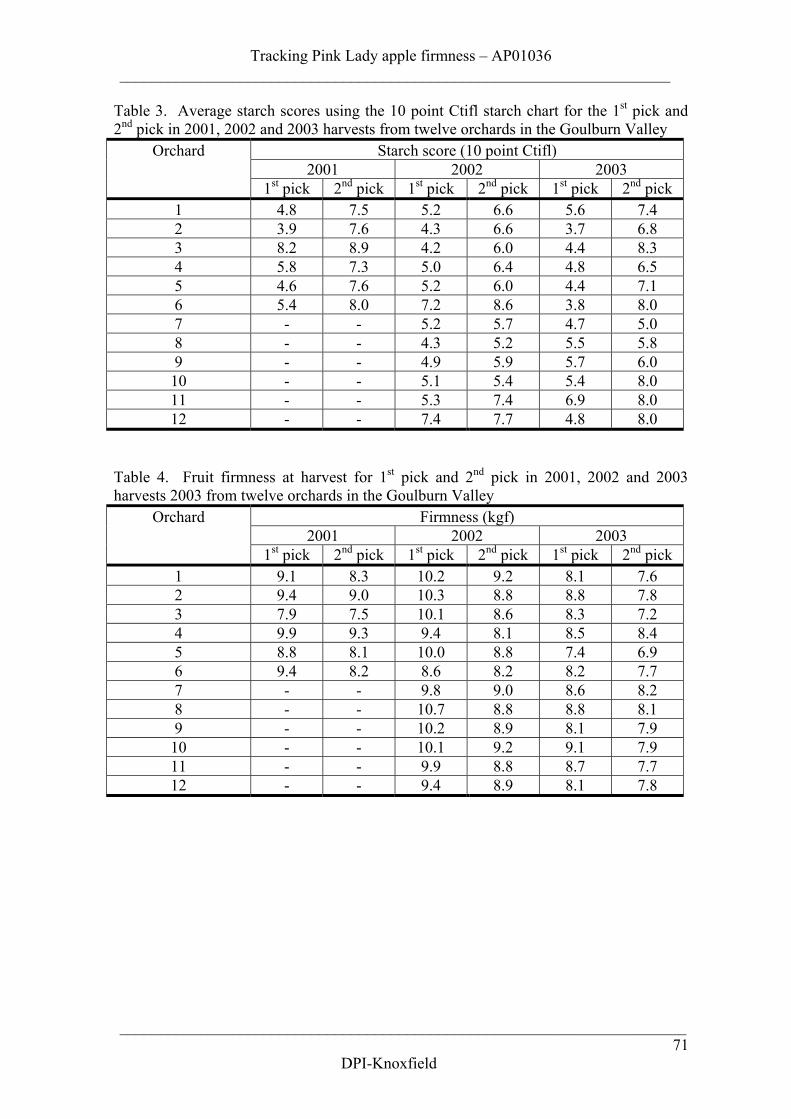
Tracking Pink Lady apple firmness – AP01036_____________________________________________________________________
_______________________________________________________________________71
DPI-Knoxfield
Table 3. Average starch scores using the 10 point Ctifl starch chart for the 1st pick and2nd pick in 2001, 2002 and 2003 harvests from twelve orchards in the Goulburn Valley
Starch score (10 point Ctifl)2001 2002 2003
Orchard
1st pick 2nd pick 1st pick 2nd pick 1st pick 2nd pick1 4.8 7.5 5.2 6.6 5.6 7.42 3.9 7.6 4.3 6.6 3.7 6.83 8.2 8.9 4.2 6.0 4.4 8.34 5.8 7.3 5.0 6.4 4.8 6.55 4.6 7.6 5.2 6.0 4.4 7.16 5.4 8.0 7.2 8.6 3.8 8.07 - - 5.2 5.7 4.7 5.08 - - 4.3 5.2 5.5 5.89 - - 4.9 5.9 5.7 6.010 - - 5.1 5.4 5.4 8.011 - - 5.3 7.4 6.9 8.012 - - 7.4 7.7 4.8 8.0
Table 4. Fruit firmness at harvest for 1st pick and 2nd pick in 2001, 2002 and 2003harvests 2003 from twelve orchards in the Goulburn Valley
Firmness (kgf)2001 2002 2003
Orchard
1st pick 2nd pick 1st pick 2nd pick 1st pick 2nd pick1 9.1 8.3 10.2 9.2 8.1 7.62 9.4 9.0 10.3 8.8 8.8 7.83 7.9 7.5 10.1 8.6 8.3 7.24 9.9 9.3 9.4 8.1 8.5 8.45 8.8 8.1 10.0 8.8 7.4 6.96 9.4 8.2 8.6 8.2 8.2 7.77 - - 9.8 9.0 8.6 8.28 - - 10.7 8.8 8.8 8.19 - - 10.2 8.9 8.1 7.910 - - 10.1 9.2 9.1 7.911 - - 9.9 8.8 8.7 7.712 - - 9.4 8.9 8.1 7.8
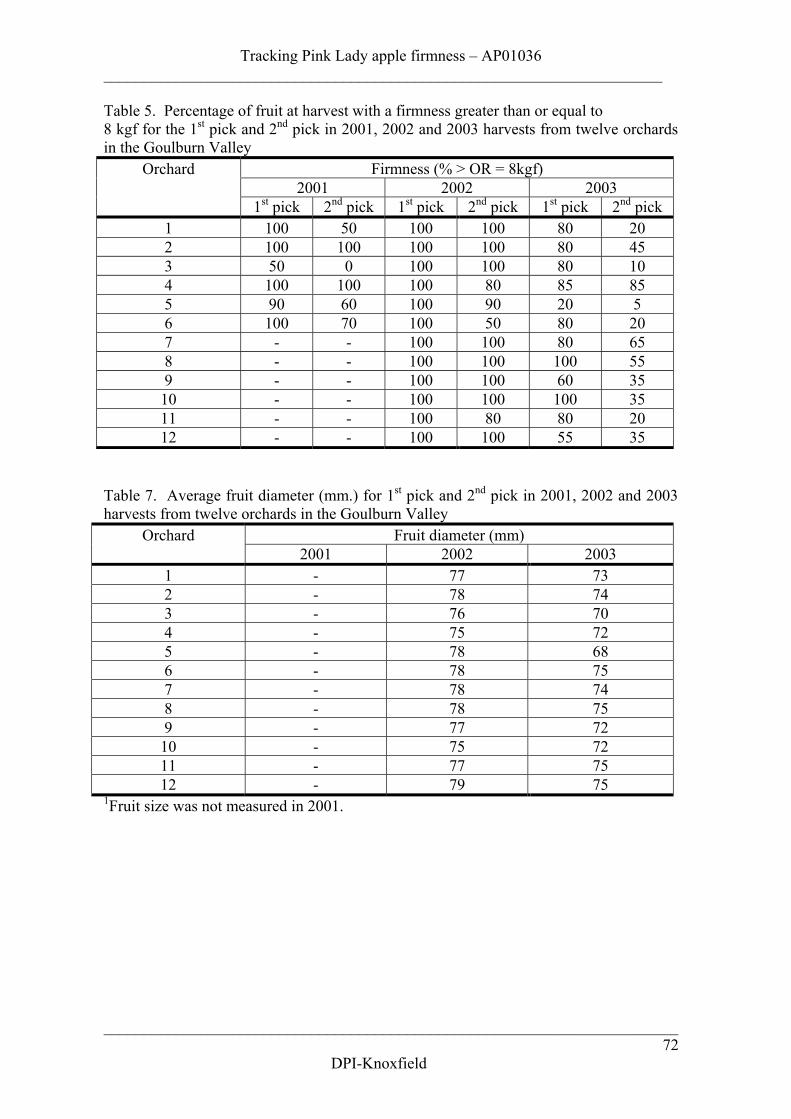
Tracking Pink Lady apple firmness – AP01036______________________________________________________________________
________________________________________________________________________72
DPI-Knoxfield
Table 5. Percentage of fruit at harvest with a firmness greater than or equal to8 kgf for the 1st pick and 2nd pick in 2001, 2002 and 2003 harvests from twelve orchardsin the Goulburn Valley
Firmness (% > OR = 8kgf)2001 2002 2003
Orchard
1st pick 2nd pick 1st pick 2nd pick 1st pick 2nd pick1 100 50 100 100 80 202 100 100 100 100 80 453 50 0 100 100 80 104 100 100 100 80 85 855 90 60 100 90 20 56 100 70 100 50 80 207 - - 100 100 80 658 - - 100 100 100 559 - - 100 100 60 3510 - - 100 100 100 3511 - - 100 80 80 2012 - - 100 100 55 35
Table 7. Average fruit diameter (mm.) for 1st pick and 2nd pick in 2001, 2002 and 2003harvests from twelve orchards in the Goulburn Valley
Fruit diameter (mm)Orchard2001 2002 2003
1 - 77 732 - 78 743 - 76 704 - 75 725 - 78 686 - 78 757 - 78 748 - 78 759 - 77 7210 - 75 7211 - 77 7512 - 79 75
1Fruit size was not measured in 2001.
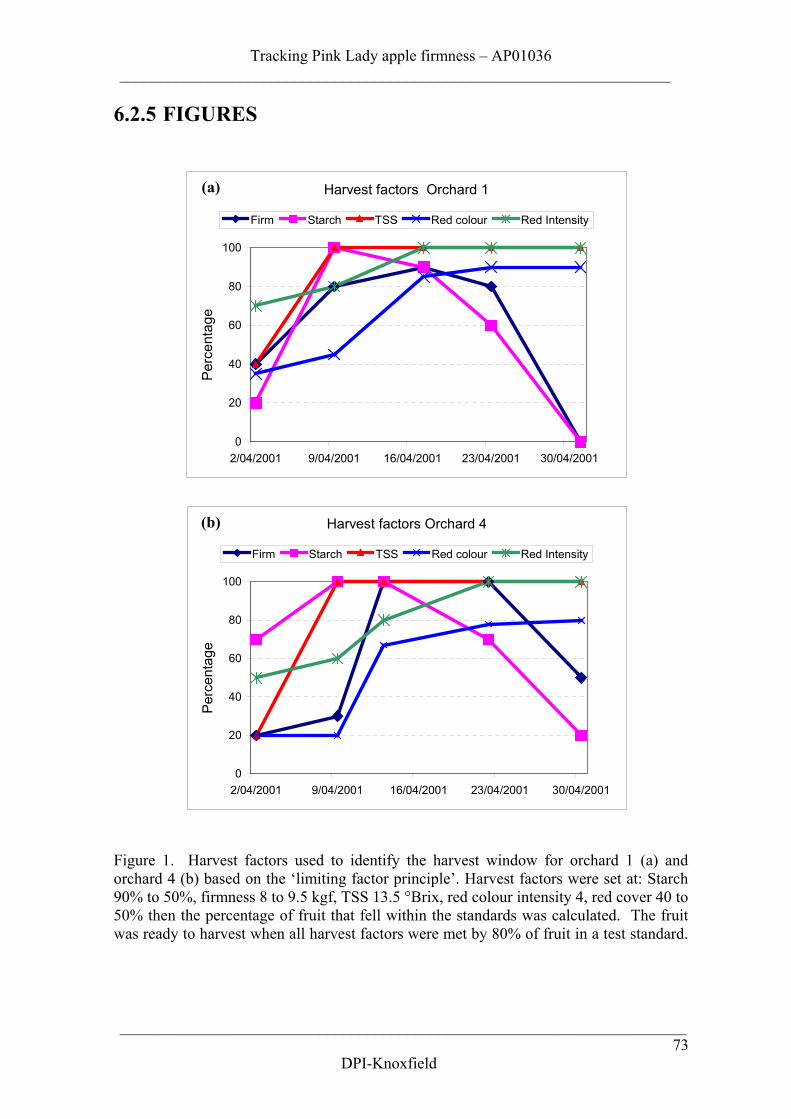
Tracking Pink Lady apple firmness – AP01036_____________________________________________________________________
_______________________________________________________________________73
DPI-Knoxfield
6.2.5 FIGURES
Figure 1. Harvest factors used to identify the harvest window for orchard 1 (a) andorchard 4 (b) based on the ‘limiting factor principle’. Harvest factors were set at: Starch90% to 50%, firmness 8 to 9.5 kgf, TSS 13.5 °Brix, red colour intensity 4, red cover 40 to50% then the percentage of fruit that fell within the standards was calculated. The fruitwas ready to harvest when all harvest factors were met by 80% of fruit in a test standard.
Harvest factors Orchard 1
0
20
40
60
80
100
2/04/2001 9/04/2001 16/04/2001 23/04/2001 30/04/2001
Per
cent
age
Firm Starch TSS Red colour Red Intensity
Harvest factors Orchard 4
0
20
40
60
80
100
2/04/2001 9/04/2001 16/04/2001 23/04/2001 30/04/2001
Per
cent
age
Firm Starch TSS Red colour Red Intensity
(a)
(b)
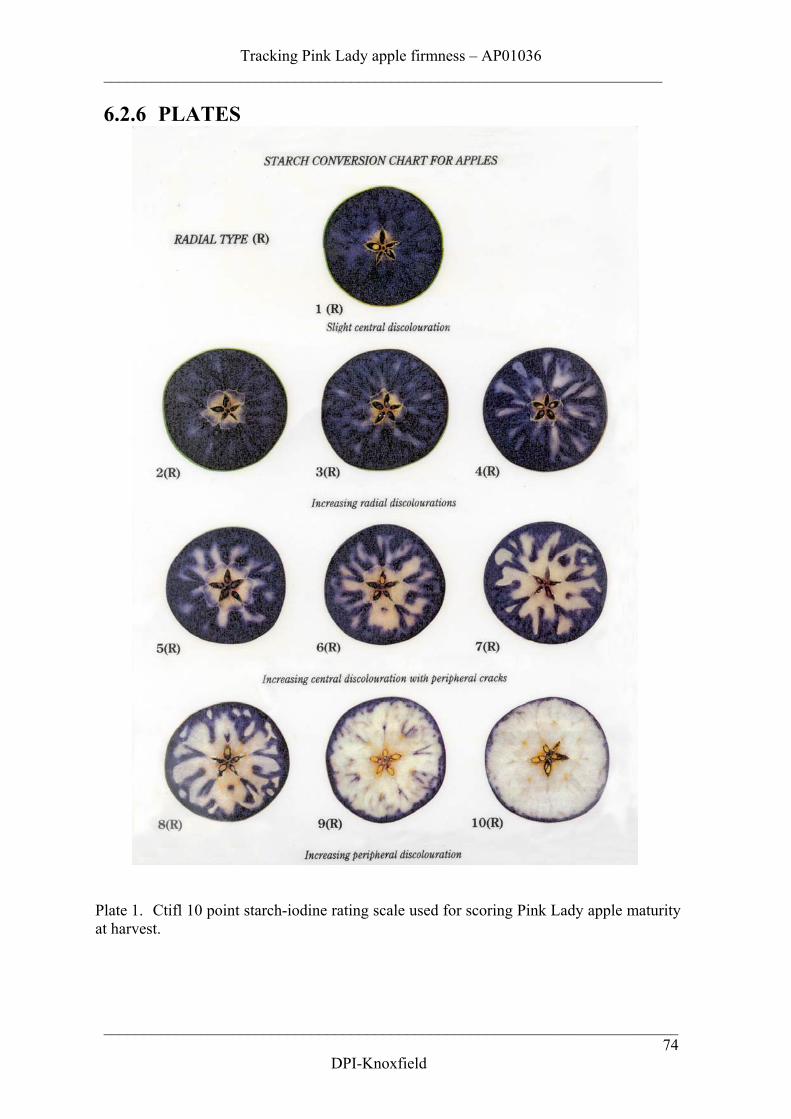
Tracking Pink Lady apple firmness – AP01036______________________________________________________________________
________________________________________________________________________74
DPI-Knoxfield
6.2.6 PLATES
Plate 1. Ctifl 10 point starch-iodine rating scale used for scoring Pink Lady apple maturityat harvest.
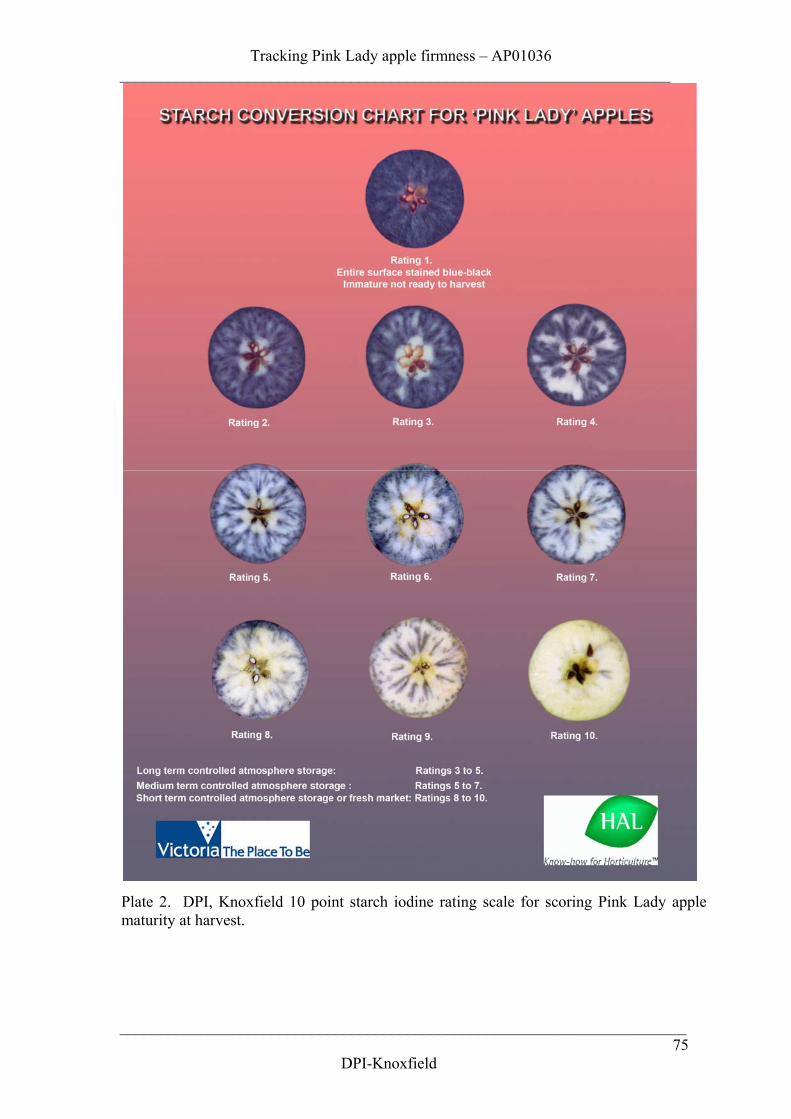
Tracking Pink Lady apple firmness – AP01036_____________________________________________________________________
_______________________________________________________________________75
DPI-Knoxfield
Plate 2. DPI, Knoxfield 10 point starch iodine rating scale for scoring Pink Lady applematurity at harvest.
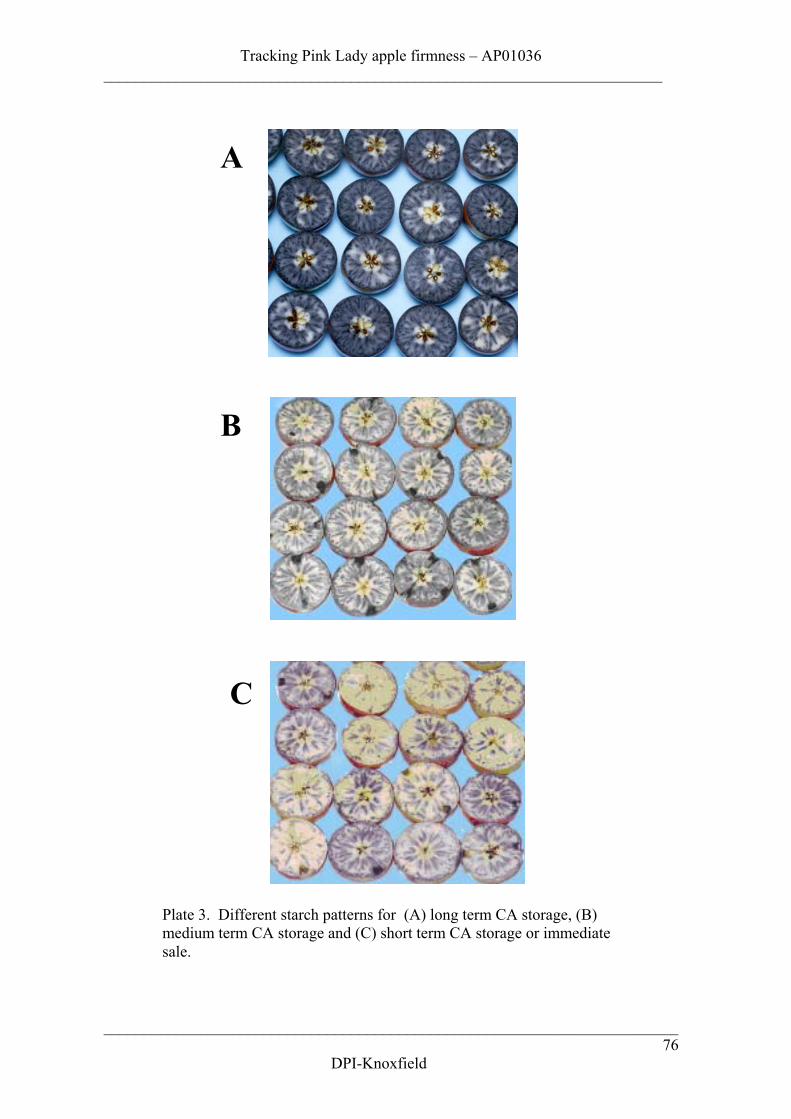
Tracking Pink Lady apple firmness – AP01036______________________________________________________________________
________________________________________________________________________76
DPI-Knoxfield
A
B
C
Plate 3. Different starch patterns for (A) long term CA storage, (B)medium term CA storage and (C) short term CA storage or immediatesale.
Tracking Pink Lady apple firmness – AP01036_____________________________________________________________________
_______________________________________________________________________77
DPI-Knoxfield
7. STORAGE AND SIMULATED SHIPPING
7.1 Storage and shipping literature review
Generally, apples soften faster in storage with advancing harvest date as a result ofincreasing maturity and ripeness. Consequently, firmness of fruit after removal fromstorage tends to be closely related to firmness at harvest (Lau, 1985, Knee and Smith,1989).
Unlike pre-harvest softening, which is largely due to thinning of cell walls as the cellsenlarge, post-harvest softening is mainly caused by the breakdown of the bonds betweenadjacent cells. The process enables cells to be separated more easily and slide against oneanother (Little and Holmes 2000, p.40).
In general, the treatment of fruit at harvest and during storage has a bigger impact onfirmness of fruit than preclimacteric factors. The two key factors during storage aretemperature and controlled atmosphere (CA) conditions (Harker et al. 2000).
Much of the variation in firmness between apples harvested on different harvest datesmay be reduced during storage (Harker et al. 1997). Once harvested, firmness generallydeclines as ethylene production or internal ethylene concentration (IEC) increases(Yoshioka et al. 1995, Watkins et al. 2000).
Over the years, many techniques have been developed to regulate the physiologicaleffects of ethylene. Controlled atmosphere is the standard for controlling postharvestethylene production and respiration rate of apples. Many types of ethylene scrubbershave been developed; however, none are highly successful due to difficulty in reducinginternal ethylene concentrations below physiologically active levels. Softening isreduced in CA if the ethylene level is maintained below IEC of 0.1 µl/L (Stow et al.2000) and 1 µl/L (Liu, 1977), respectively. Johnston et al. (2001 a & 2002 a, b) foundthat the onset of rapid softening was consistently associated with an IEC that exceeded1.5 µl/L.
High ethylene levels in the storage environment can initiate and stimulate fruit ripening(Beaudry et al. 1993). Pink Lady apples are classified as a climacteric fruit. Inclimacteric fruit the autocatalytic ethylene production initiates ripening processes;including flesh softening. Pink Lady apples are very high ethylene producers(Kupferman, 2002a). Therefore, where possible ethylene should be scrubbed duringloading of the storage room for the first 10 days (Little and Holmes 2000, p 423).Internal ethylene levels need to be kept at 1 ppm or lower which is difficult to maintain.The CA room must be filled and sealed in a short period to prevent an ethyleneconcentration in the fruit of more than 0.5 ppm while temperatures are in the 4°C to 6°Crange during initial cooling to 0°C (Little and Holmes 2000, p.457). Low levels ofoxygen (1.5%) and low temperatures (0°C to 1°C) help to inhibit the effects of highethylene levels (200 ppm to 400 ppm) in storage on fruit ripening (Little and Holmes2000, p.456).
Tracking Pink Lady apple firmness – AP01036______________________________________________________________________
________________________________________________________________________78
DPI-Knoxfield
For high ethylene producing varieties such as Pink Lady and Gala pull-down time that isthe number of days from fruit intake to when the oxygen has been reduced to less than5%, is critical to the storage potential of the fruit (Chennell et al. 2002).
The preclimacteric state cannot be maintained in storage even with the best CA storage.Ripening can be delayed by CA but not prevented. (Little and Holmes 2000, p 42).
Despite 0°C being the optimum postharvest temperature for slowing loss of firmness it isdifficult to maintain fruit at these optimum temperature through the entire postharvesthandling chain (Johnston et al. 2000c). Royal Gala apples remain firmer when stored at0°C than at 3°C for storage duration’s less than 50 days but there was no benefit ofstorage at 0°C compared to 3°C after 75 days (Harker et al. 2000). Apples soften abouttwice as fast at 4°C than at 0°C and about three times as fast at 15°C than at 4°C(Hardenburg et al. 1986). For most cultivars, firmness retention is improved when CA isestablished earlier, rather than later, after harvest (Dilley et al. 1989).
Temperature is the prime means of maintaining fruit quality during shipping. It isimportant to maintain optimum cool chain management. For Pink Lady apples and thisshould be between 0°C.
Pink Lady apples are predominantly exported from Australia in 12 meter (40 foot)integral containers, which take 4 to 5 weeks to reach the UK. Amos (1999), found fruittemperatures within a palletised stow of Pink Lady apples ranged from 0.5°C to 5°C in a40 foot container shipped from Australia to the UK with an air delivery set point of 0°C.
In 1997 there were differences in market quality in the UK between early and lateshipments of Pink Lady apples. Early exported fruit tended to be greasy and soft andthese problems were attributed to over mature fruit that had been air stored for up to 5weeks prior to shipping. Early picked fruit went straight into CA storage and formed thebasis of later shipments. These fruit were of a higher market quality. However, althoughthe majority of fruit being sent later in the year arrived in the UK in very good conditionsome shipments had fruit rejected. The purpose of the storage and shipping trials were toestablish the interaction between harvest maturity, storage conditions (air, commercialCA or experimental CA) and poor temperature management in simulated shippingcontainers on Pink Lady apple quality. In addition, actual shipments of Pink Lady appleswere sent to the UK and the outturn was assessed.
Tracking Pink Lady apple firmness – AP01036_____________________________________________________________________
_______________________________________________________________________79
DPI-Knoxfield
7.2 Experiment 1. Storage experiment
INTRODUCTIONStorage conditions will affect the firmness of apples after storage, after export and in theretail chain. In attempting to identify why fruit from some orchards outturns softer thanthat from others, we needed to establish if storage conditions are a major factor.Therefore, fruit harvested from the orchards were stored in commercial air storage in theGoulburn Valley and in experimental air and CA storage at DPI, Knoxfield.
7.2.1 EXPERIMENTAL OBJECTIVE
Determine the effect of storage conditions and maturity on Pink Lady apple firmnessafter storage.
7.2.2 MATERIALS AND METHODS
Season 2001Pink Lady apples were harvested from 6 orchards in the Goulburn Valley at optimum andlate harvest maturity (see Section 6.2.4 Table 1). At each orchard, the fruit from eachexperimental block of trees were pooled and then 15 fruit were selected at random andplaced in plastic mesh bags. The fruit was held temporarily in a commercial cool storeprior to transporting the fruit to DPI, Knoxfield. On arrival, the replicate storage bagswere placed in either air or CA (2.5% O2 plus 2% CO2). Fruit firmness was measuredafter 12 weeks air storage or 24 weeks CA storage and 1 day at 20°C to bring the fruit toroom temperature.
Five field replicate bags of 15 fruit, from each orchard were stored in a commercial coolroom. After 12 weeks the fruit was transported to DPI, Knoxfield where the fruit wasstored for 1 day at 20°C before fruit firmness was measured.
The participating growers provided the date when they started harvesting from theorchard containing the experimental block of trees (see Section 6.2.4 Table 2). Theactual harvest dates were able to be matched very closely to the harvest dates used forDPI storage trials. The potential outturn for commercially harvested fruit was tabulatedusing the DPI CA storage data firmness results.
Season 2002In 2002, the handling and storage conditions were as reported for 2001 except that therewere 12 orchards. The CA fruit were stored for 26 weeks and the commercial air storedfruit were stored for 14 weeks
Season 2003In 2003, the handling and storage conditions were as reported for 2001. Due to a fruit flyout-break in one region of the Goulburn Valley, fruit from orchards 6 and 12 were notincluded in the commercial storage trial.
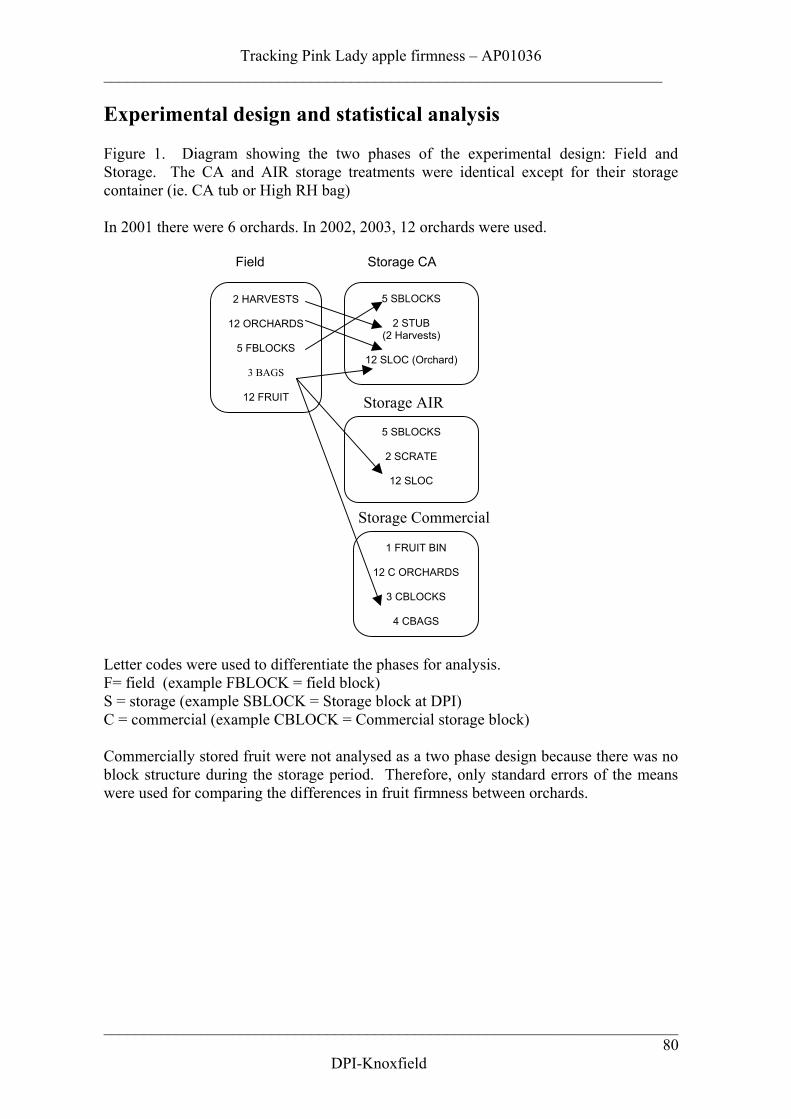
Tracking Pink Lady apple firmness – AP01036______________________________________________________________________
________________________________________________________________________80
DPI-Knoxfield
Experimental design and statistical analysis
Figure 1. Diagram showing the two phases of the experimental design: Field andStorage. The CA and AIR storage treatments were identical except for their storagecontainer (ie. CA tub or High RH bag)
In 2001 there were 6 orchards. In 2002, 2003, 12 orchards were used.
Field Storage CA
Storage Commercial
Letter codes were used to differentiate the phases for analysis.F= field (example FBLOCK = field block)S = storage (example SBLOCK = Storage block at DPI)C = commercial (example CBLOCK = Commercial storage block)
Commercially stored fruit were not analysed as a two phase design because there was noblock structure during the storage period. Therefore, only standard errors of the meanswere used for comparing the differences in fruit firmness between orchards.
2 HARVESTS
12 ORCHARDS
5 FBLOCKS
3 BAGS
12 FRUIT Storage AIR
5 SBLOCKS
2 STUB(2 Harvests)
12 SLOC (Orchard)
5 SBLOCKS
2 SCRATE
12 SLOC
1 FRUIT BIN
12 C ORCHARDS
3 CBLOCKS
4 CBAGS
Tracking Pink Lady apple firmness – AP01036_____________________________________________________________________
_______________________________________________________________________81
DPI-Knoxfield
7.2.3 RESULTS
Experimental Air storageIn the air storage experiment the fruit from harvest 1 and 2 were stored 3 months in airthen 1 day at 20°C to warm the fruit to room temperature before the fruit firmness wasmeasured.
Season 2001In 2001, the flesh firmness of Pink Lady apples after storage from orchard 1wassignificantly firmer than all other orchards in the project with the exception of orchard 4.Orchard 1 fruit was 8.1 kgf compared to fruit from orchard 3 which had the softest fruitwith a firmness of 7.0 kgf (Table 1)*.
Fruit from the second harvest were significantly softer for orchards 1,3 and 6 byapproximately 0.3 kgf, but not for the other orchards.
In terms of export it is proposed that the fruit firmness needs to be greater than or equal to7.5 kgf out of store to be considered suitable for shipping. If the fruit was harvested fromthe first pick orchards 1,2 and 4 fruit would have been suitable for export. For harvesttwo, fruit from orchards 1,2 and 4 would have still been suitable.
Season 2002In 2002, the firmest fruit after storage, from pick 1, was from orchard 8 being 8.3 kgf andthe softest fruit was from orchards 2 and 4. The firmness of fruit from orchard 8 wassignificantly greater than orchards 1, 2, 4, 6 and 12. The firmness of fruit from orchard 8and 9 (8.1 kgf) second pick, was significantly greater than fruit from orchards 3,4,5,6,11and 12. The softest fruit was from orchard 6 being 6.8 kgf (Table 2).
There was no significant effect of harvest date on fruit firmness for most orchards. Onlyorchard 3 and 11 had significantly softer fruit from the second harvest compared to thefirst.
In terms of export orchards 1,2,3,5,7,8,9,10 and 11 met the export standard for first pickfruit and for pick 2 orchards 1,2,5 7, 8,9 and 10 met the proposed standard of 7.5 kgf.
Season 2003In 2003, the firmest fruit after storage from pick 1 was from orchards 9 and 12 being 6.8kgf (Table3). The fruit from these orchards were significantly firmer than fruit fromorchards 1,3 and 5. The softest fruit was from orchard 5 with a fruit firmness of 5.4 kgf.Fruit from orchard 5 from the second harvest were significantly softer than fruit from allothers orchards at 5.5 kgf (Table 3).
There was no significant effect of the harvest date on outturn firmness except fororchards 1 and 6 where the fruit was significantly firmer from the second pick comparedto the first pick. In general, there was no substantial difference in the fruit firmnessbetween the two picks for most of the 12 orchards and this was reflected in the similaroutturn turn firmness after 12 weeks air storage at DPI, Knoxfield. The increasedfirmness of fruit from orchards 1 and 6 for the second pick being firmer than first picked
* All tables referenced are to be found within the current chapter.
Tracking Pink Lady apple firmness – AP01036______________________________________________________________________
________________________________________________________________________82
DPI-Knoxfield
fruit after storage suggests it was picked more mature. This could have occurred as aresult the first pick fruit being picked lower on the tree which matures faster than fruithigher in the tree from where the second pick fruit may have been sampled.
In terms of export no fruit from any orchard or maturity would have met the exportproposed requirement of 7.5 kgf fruit firmness after storage.
Commercial air storage
Season 2001In 2001, fruit from the first pick that was stored in a commercial coolroom were generallysofter than fruit stored at DPI, Knoxfield conditions by approximately 0.3 kgf afterstorage (see Table 4 and Table 1).
Season 2002In 2002, fruit from the second pick that was stored in a commercial coolroom weregenerally softer than fruit stored at DPI, Knoxfield by approximately 0.6 kgf after storage(Table 5). This varied between orchards and orchard 5 fruit was 0.7 kgf softer whenstored at DPI, Knoxfield.
Season 2003In 2003, fruit from the first pick that was stored in a commercial coolroom were over-allfirmer than the fruit stored under the DPI storage conditions by approximately 0.5 kgfafter storage (Table 6). This varied between orchards orchard 5 fruit was 1.2 kgf firmerwhen stored commercially. Fruit from the second harvest stored at DPI andcommercially had very similar firmness outturns (Table 7).
Experimental controlled atmosphere (CA) storage
In the CA storage experiment fruit from harvest 1 and 2 were stored for 6 months in CAthen 1 day at 20°C to warm the fruit to room temperature before the fruit firmness wasmeasured.
Season 2001In 2001, after CA storage orchard 4 had the firmest fruit being 8.3 kgf for the first pickand 8.0 for the second pick (Table 8). The softest fruit was from orchard 5, for harvest 1and orchards 5 and 6 for harvest 2.
Fruit firmness for the first pick for all orchards, with the exception of orchards 5 met theproposed export criterion of 7.5 kgf. For pick 2, only orchards 1,2 and 8 met the exportfirmness criterion.
There was no significant effect of harvest date on the outturn firmness for orchards 1, 2, 4and 5. Fruit from the second pick was significantly softer than first.pick fruit fororchards 3 and 6.
The firmness outturn for CA stored fruit after 6 months was very similar to the outturnfirmness of air stored fruit after 3months storage.
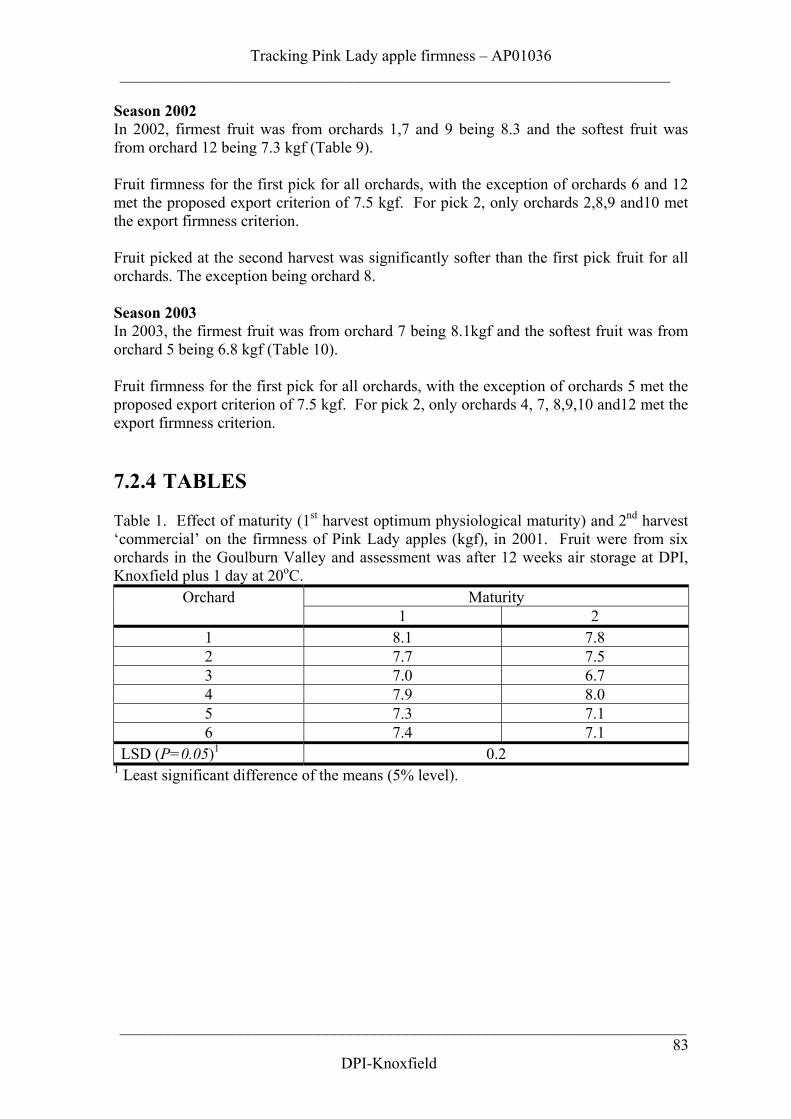
Tracking Pink Lady apple firmness – AP01036_____________________________________________________________________
_______________________________________________________________________83
DPI-Knoxfield
Season 2002In 2002, firmest fruit was from orchards 1,7 and 9 being 8.3 and the softest fruit wasfrom orchard 12 being 7.3 kgf (Table 9).
Fruit firmness for the first pick for all orchards, with the exception of orchards 6 and 12met the proposed export criterion of 7.5 kgf. For pick 2, only orchards 2,8,9 and10 metthe export firmness criterion.
Fruit picked at the second harvest was significantly softer than the first pick fruit for allorchards. The exception being orchard 8.
Season 2003In 2003, the firmest fruit was from orchard 7 being 8.1kgf and the softest fruit was fromorchard 5 being 6.8 kgf (Table 10).
Fruit firmness for the first pick for all orchards, with the exception of orchards 5 met theproposed export criterion of 7.5 kgf. For pick 2, only orchards 4, 7, 8,9,10 and12 met theexport firmness criterion.
7.2.4 TABLES
Table 1. Effect of maturity (1st harvest optimum physiological maturity) and 2nd harvest‘commercial’ on the firmness of Pink Lady apples (kgf), in 2001. Fruit were from sixorchards in the Goulburn Valley and assessment was after 12 weeks air storage at DPI,Knoxfield plus 1 day at 20oC.
MaturityOrchard1 2
1 8.1 7.82 7.7 7.53 7.0 6.74 7.9 8.05 7.3 7.16 7.4 7.1
LSD (P=0.05)1 0.21 Least significant difference of the means (5% level).
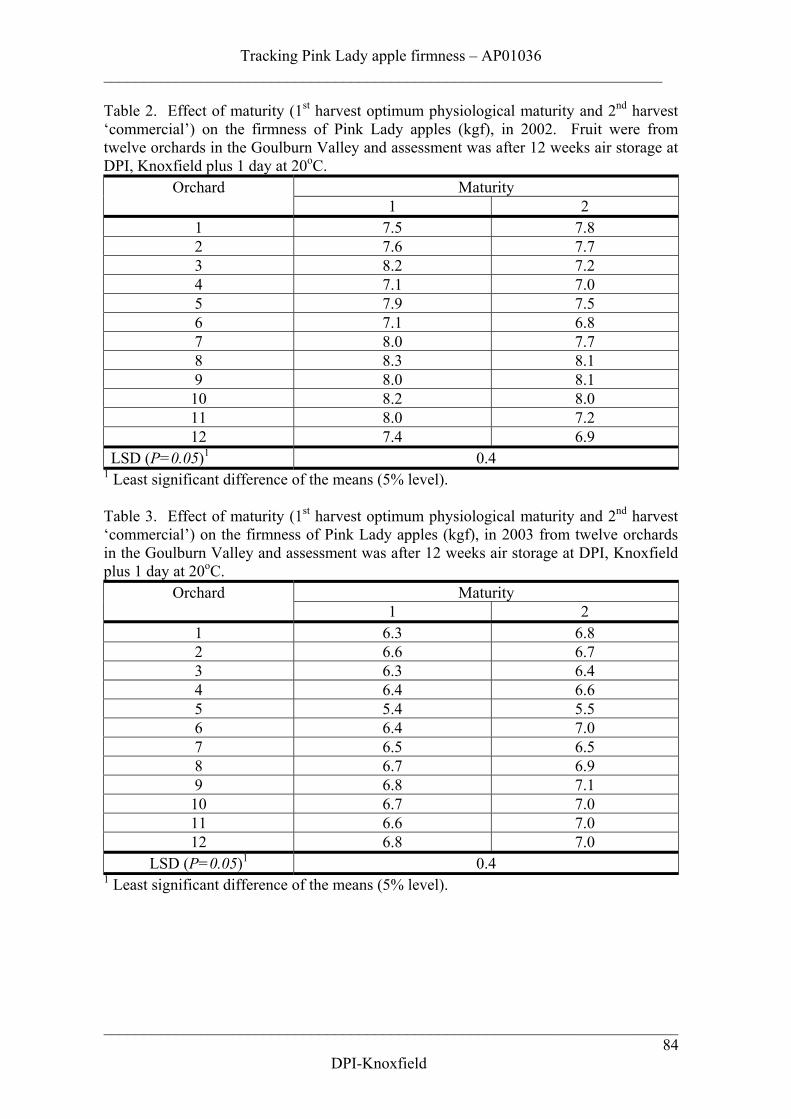
Tracking Pink Lady apple firmness – AP01036______________________________________________________________________
________________________________________________________________________84
DPI-Knoxfield
Table 2. Effect of maturity (1st harvest optimum physiological maturity and 2nd harvest‘commercial’) on the firmness of Pink Lady apples (kgf), in 2002. Fruit were fromtwelve orchards in the Goulburn Valley and assessment was after 12 weeks air storage atDPI, Knoxfield plus 1 day at 20oC.
MaturityOrchard1 2
1 7.5 7.82 7.6 7.73 8.2 7.24 7.1 7.05 7.9 7.56 7.1 6.87 8.0 7.78 8.3 8.19 8.0 8.110 8.2 8.011 8.0 7.212 7.4 6.9
LSD (P=0.05)1 0.41 Least significant difference of the means (5% level).
Table 3. Effect of maturity (1st harvest optimum physiological maturity and 2nd harvest‘commercial’) on the firmness of Pink Lady apples (kgf), in 2003 from twelve orchardsin the Goulburn Valley and assessment was after 12 weeks air storage at DPI, Knoxfieldplus 1 day at 20oC.
MaturityOrchard1 2
1 6.3 6.82 6.6 6.73 6.3 6.44 6.4 6.65 5.4 5.56 6.4 7.07 6.5 6.58 6.7 6.99 6.8 7.110 6.7 7.011 6.6 7.012 6.8 7.0
LSD (P=0.05)1 0.41 Least significant difference of the means (5% level).
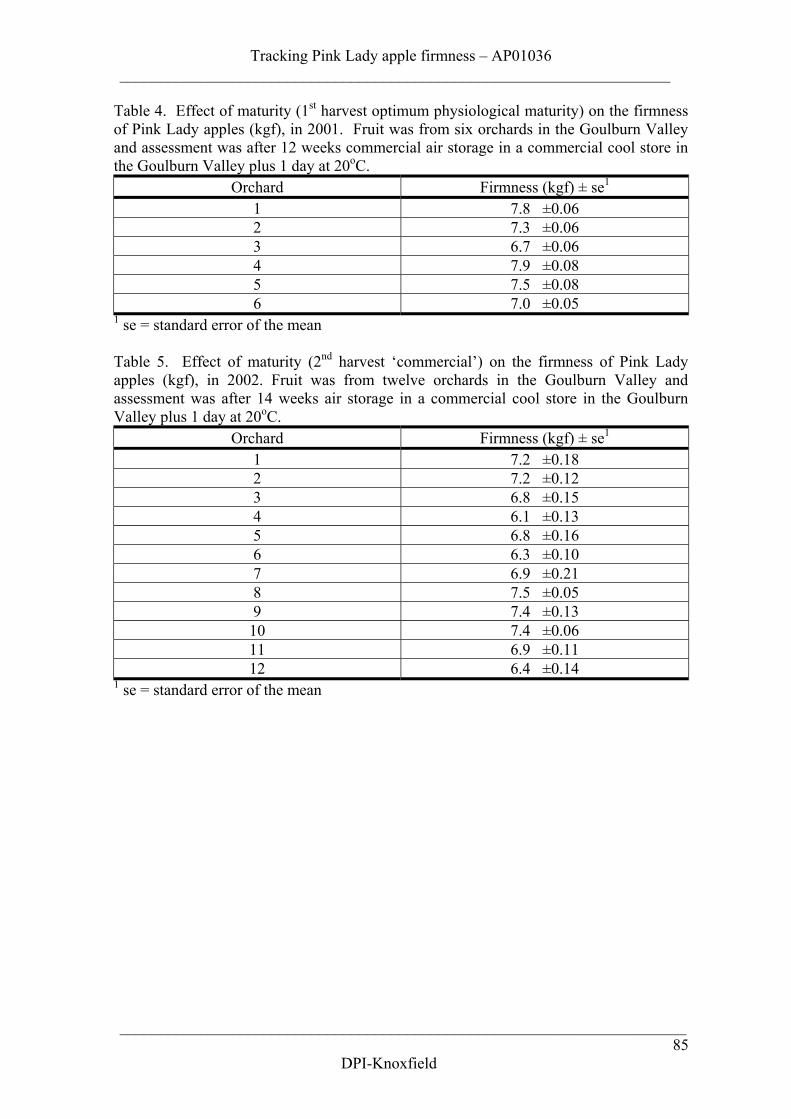
Tracking Pink Lady apple firmness – AP01036_____________________________________________________________________
_______________________________________________________________________85
DPI-Knoxfield
Table 4. Effect of maturity (1st harvest optimum physiological maturity) on the firmnessof Pink Lady apples (kgf), in 2001. Fruit was from six orchards in the Goulburn Valleyand assessment was after 12 weeks commercial air storage in a commercial cool store inthe Goulburn Valley plus 1 day at 20oC.
Orchard Firmness (kgf) ± se1
1 7.8 ±0.062 7.3 ±0.063 6.7 ±0.064 7.9 ±0.085 7.5 ±0.086 7.0 ±0.05
1 se = standard error of the mean
Table 5. Effect of maturity (2nd harvest ‘commercial’) on the firmness of Pink Ladyapples (kgf), in 2002. Fruit was from twelve orchards in the Goulburn Valley andassessment was after 14 weeks air storage in a commercial cool store in the GoulburnValley plus 1 day at 20oC.
Orchard Firmness (kgf) ± se1
1 7.2 ±0.182 7.2 ±0.123 6.8 ±0.154 6.1 ±0.135 6.8 ±0.166 6.3 ±0.107 6.9 ±0.218 7.5 ±0.059 7.4 ±0.1310 7.4 ±0.0611 6.9 ±0.1112 6.4 ±0.14
1 se = standard error of the mean
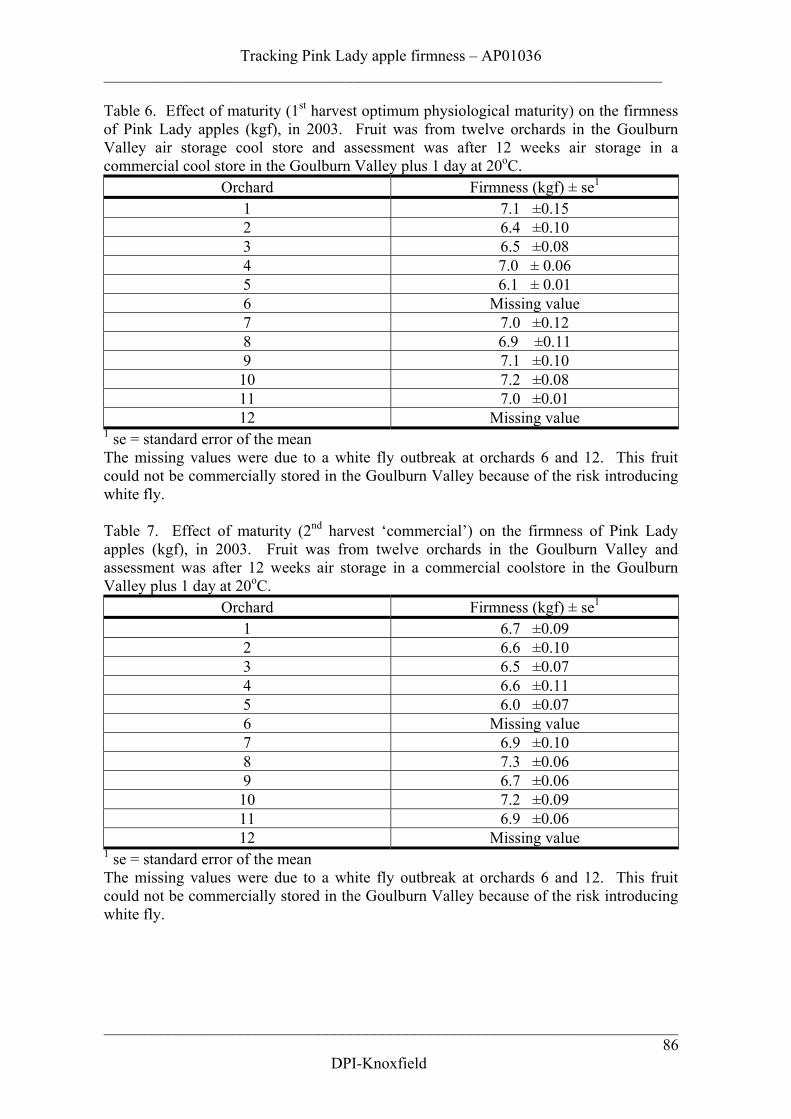
Tracking Pink Lady apple firmness – AP01036______________________________________________________________________
________________________________________________________________________86
DPI-Knoxfield
Table 6. Effect of maturity (1st harvest optimum physiological maturity) on the firmnessof Pink Lady apples (kgf), in 2003. Fruit was from twelve orchards in the GoulburnValley air storage cool store and assessment was after 12 weeks air storage in acommercial cool store in the Goulburn Valley plus 1 day at 20oC.
Orchard Firmness (kgf) ± se1
1 7.1 ±0.152 6.4 ±0.103 6.5 ±0.084 7.0 ± 0.065 6.1 ± 0.016 Missing value7 7.0 ±0.128 6.9 ±0.119 7.1 ±0.1010 7.2 ±0.0811 7.0 ±0.0112 Missing value
1 se = standard error of the meanThe missing values were due to a white fly outbreak at orchards 6 and 12. This fruitcould not be commercially stored in the Goulburn Valley because of the risk introducingwhite fly.
Table 7. Effect of maturity (2nd harvest ‘commercial’) on the firmness of Pink Ladyapples (kgf), in 2003. Fruit was from twelve orchards in the Goulburn Valley andassessment was after 12 weeks air storage in a commercial coolstore in the GoulburnValley plus 1 day at 20oC.
Orchard Firmness (kgf) ± se1
1 6.7 ±0.092 6.6 ±0.103 6.5 ±0.074 6.6 ±0.115 6.0 ±0.076 Missing value7 6.9 ±0.108 7.3 ±0.069 6.7 ±0.0610 7.2 ±0.0911 6.9 ±0.0612 Missing value
1 se = standard error of the meanThe missing values were due to a white fly outbreak at orchards 6 and 12. This fruitcould not be commercially stored in the Goulburn Valley because of the risk introducingwhite fly.
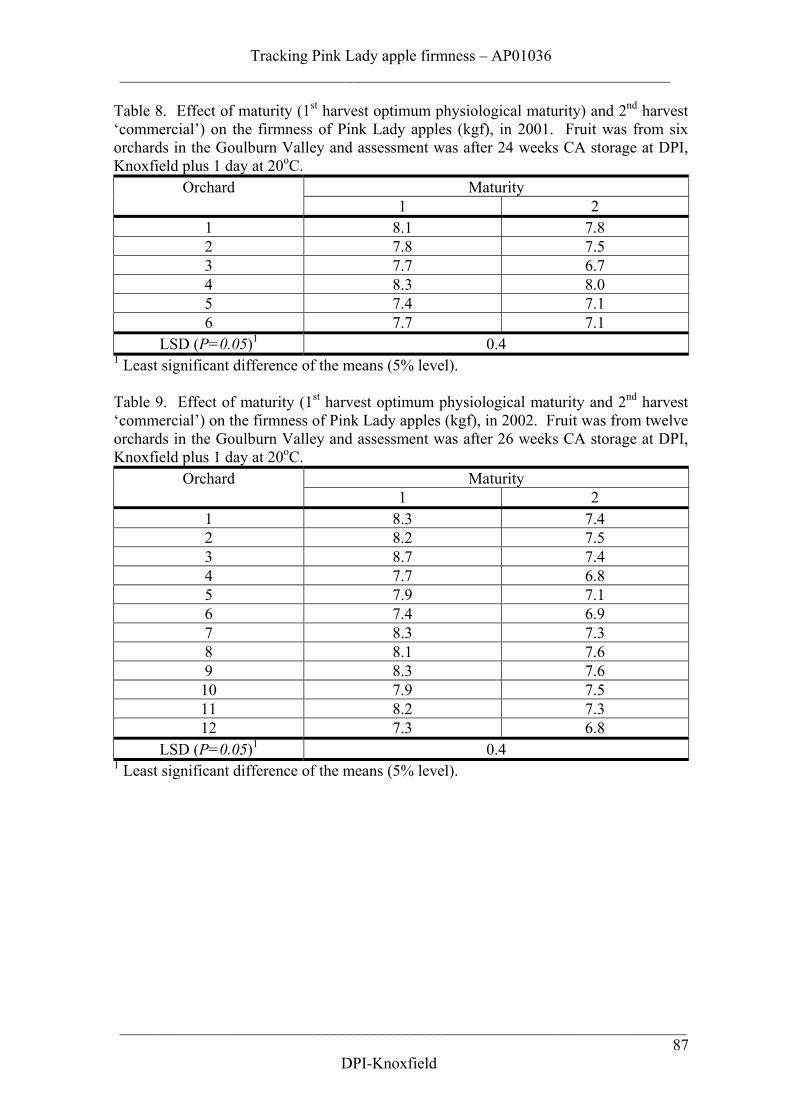
Tracking Pink Lady apple firmness – AP01036_____________________________________________________________________
_______________________________________________________________________87
DPI-Knoxfield
Table 8. Effect of maturity (1st harvest optimum physiological maturity) and 2nd harvest‘commercial’) on the firmness of Pink Lady apples (kgf), in 2001. Fruit was from sixorchards in the Goulburn Valley and assessment was after 24 weeks CA storage at DPI,Knoxfield plus 1 day at 20oC.
MaturityOrchard1 2
1 8.1 7.82 7.8 7.53 7.7 6.74 8.3 8.05 7.4 7.16 7.7 7.1
LSD (P=0.05)1 0.41 Least significant difference of the means (5% level).
Table 9. Effect of maturity (1st harvest optimum physiological maturity and 2nd harvest‘commercial’) on the firmness of Pink Lady apples (kgf), in 2002. Fruit was from twelveorchards in the Goulburn Valley and assessment was after 26 weeks CA storage at DPI,Knoxfield plus 1 day at 20oC.
MaturityOrchard1 2
1 8.3 7.42 8.2 7.53 8.7 7.44 7.7 6.85 7.9 7.16 7.4 6.97 8.3 7.38 8.1 7.69 8.3 7.610 7.9 7.511 8.2 7.312 7.3 6.8
LSD (P=0.05)1 0.41 Least significant difference of the means (5% level).
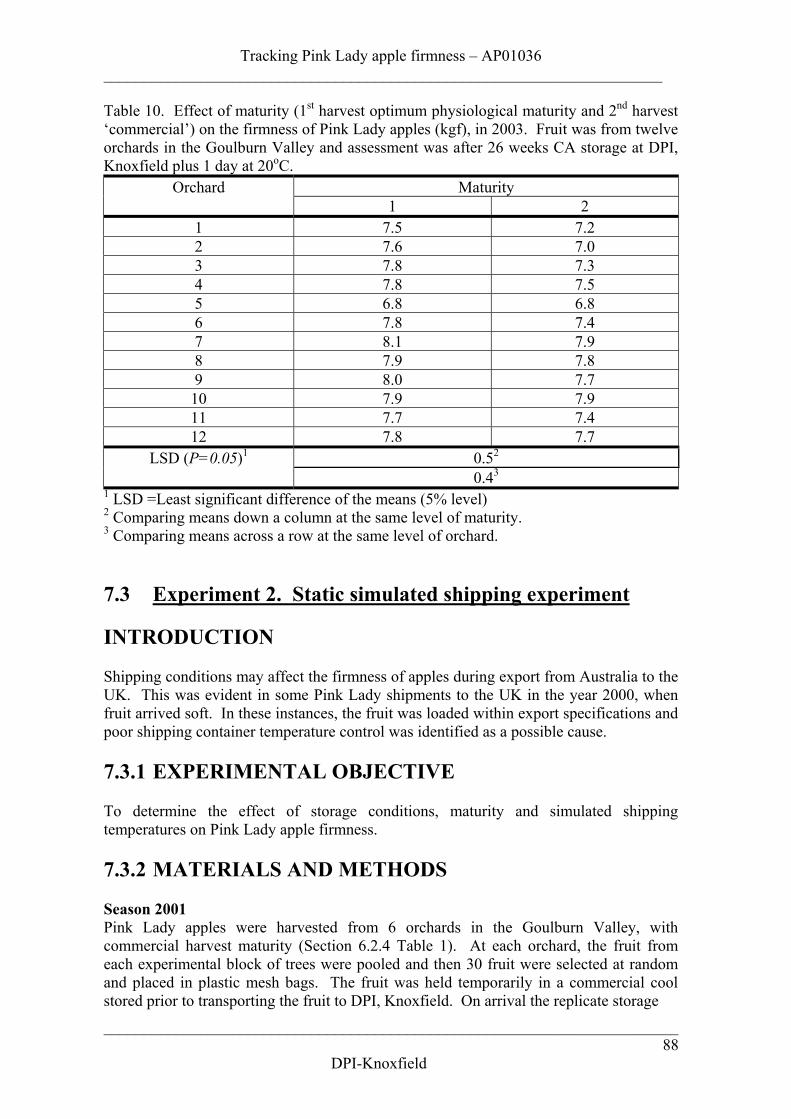
Tracking Pink Lady apple firmness – AP01036______________________________________________________________________
________________________________________________________________________88
DPI-Knoxfield
Table 10. Effect of maturity (1st harvest optimum physiological maturity and 2nd harvest‘commercial’) on the firmness of Pink Lady apples (kgf), in 2003. Fruit was from twelveorchards in the Goulburn Valley and assessment was after 26 weeks CA storage at DPI,Knoxfield plus 1 day at 20oC.
MaturityOrchard1 2
1 7.5 7.22 7.6 7.03 7.8 7.34 7.8 7.55 6.8 6.86 7.8 7.47 8.1 7.98 7.9 7.89 8.0 7.710 7.9 7.911 7.7 7.412 7.8 7.7
0.52LSD (P=0.05)1
0.43
1 LSD =Least significant difference of the means (5% level)2 Comparing means down a column at the same level of maturity.3 Comparing means across a row at the same level of orchard.
7.3 Experiment 2. Static simulated shipping experiment
INTRODUCTION
Shipping conditions may affect the firmness of apples during export from Australia to theUK. This was evident in some Pink Lady shipments to the UK in the year 2000, whenfruit arrived soft. In these instances, the fruit was loaded within export specifications andpoor shipping container temperature control was identified as a possible cause.
7.3.1 EXPERIMENTAL OBJECTIVE
To determine the effect of storage conditions, maturity and simulated shippingtemperatures on Pink Lady apple firmness.
7.3.2 MATERIALS AND METHODS
Season 2001Pink Lady apples were harvested from 6 orchards in the Goulburn Valley, withcommercial harvest maturity (Section 6.2.4 Table 1). At each orchard, the fruit fromeach experimental block of trees were pooled and then 30 fruit were selected at randomand placed in plastic mesh bags. The fruit was held temporarily in a commercial coolstored prior to transporting the fruit to DPI, Knoxfield. On arrival the replicate storage
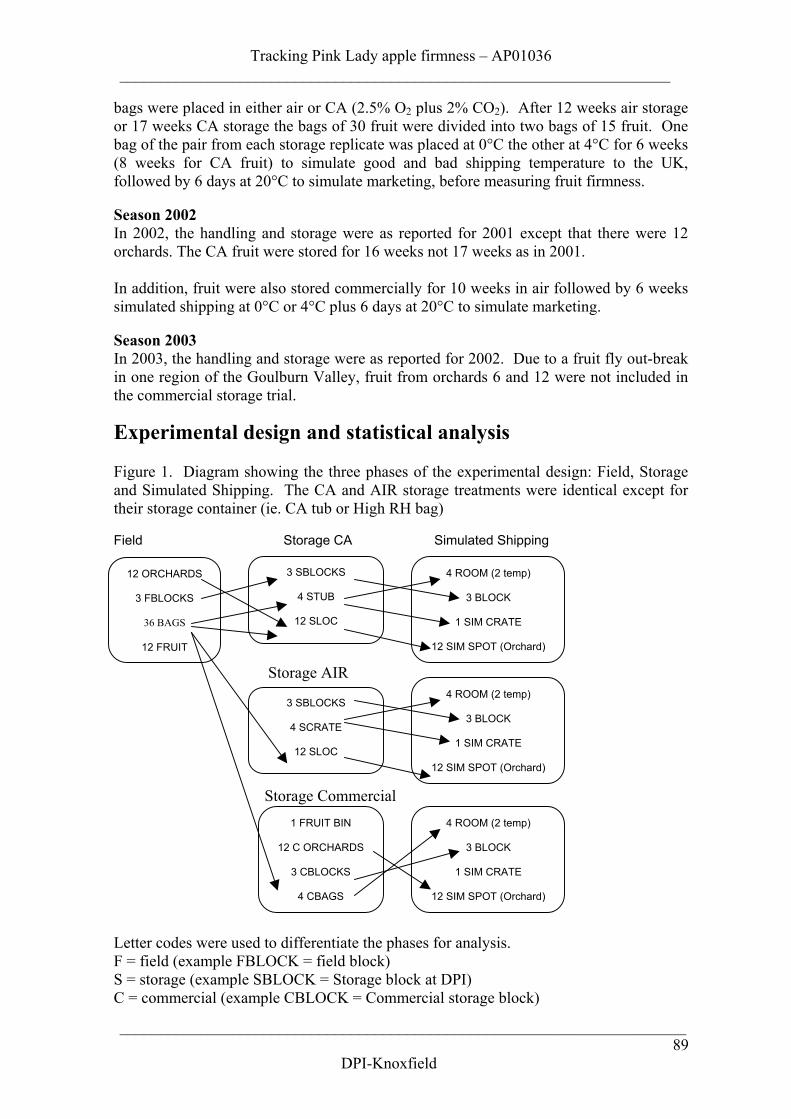
Tracking Pink Lady apple firmness – AP01036_____________________________________________________________________
_______________________________________________________________________89
DPI-Knoxfield
bags were placed in either air or CA (2.5% O2 plus 2% CO2). After 12 weeks air storageor 17 weeks CA storage the bags of 30 fruit were divided into two bags of 15 fruit. Onebag of the pair from each storage replicate was placed at 0°C the other at 4°C for 6 weeks(8 weeks for CA fruit) to simulate good and bad shipping temperature to the UK,followed by 6 days at 20°C to simulate marketing, before measuring fruit firmness.
Season 2002In 2002, the handling and storage were as reported for 2001 except that there were 12orchards. The CA fruit were stored for 16 weeks not 17 weeks as in 2001.
In addition, fruit were also stored commercially for 10 weeks in air followed by 6 weekssimulated shipping at 0°C or 4°C plus 6 days at 20°C to simulate marketing.
Season 2003In 2003, the handling and storage were as reported for 2002. Due to a fruit fly out-breakin one region of the Goulburn Valley, fruit from orchards 6 and 12 were not included inthe commercial storage trial.
Experimental design and statistical analysis
Figure 1. Diagram showing the three phases of the experimental design: Field, Storageand Simulated Shipping. The CA and AIR storage treatments were identical except fortheir storage container (ie. CA tub or High RH bag)
Field Storage CA Simulated Shipping
Storage Commercial
Letter codes were used to differentiate the phases for analysis.F = field (example FBLOCK = field block)S = storage (example SBLOCK = Storage block at DPI)C = commercial (example CBLOCK = Commercial storage block)
12 ORCHARDS
3 FBLOCKS
36 BAGS
12 FRUIT
4 ROOM (2 temp)
3 BLOCK
1 SIM CRATE
12 SIM SPOT (Orchard)
Storage AIR
3 SBLOCKS
4 STUB
12 SLOC
3 SBLOCKS
4 SCRATE
12 SLOC
4 ROOM (2 temp)
3 BLOCK
1 SIM CRATE
12 SIM SPOT (Orchard)
1 FRUIT BIN
12 C ORCHARDS
3 CBLOCKS
4 CBAGS
4 ROOM (2 temp)
3 BLOCK
1 SIM CRATE
12 SIM SPOT (Orchard)
Tracking Pink Lady apple firmness – AP01036______________________________________________________________________
________________________________________________________________________90
DPI-Knoxfield
Commercially stored fruit were not analysed as a three phase design because there was noblock structure during the storage period (Fig. 1). Therefore, only standard errors of themeans were used for comparing the differences in fruit firmness between orchards.
7.3.4 RESULTS
Static air storage experiment
In the static air storage experiment fruit from harvest 2 were stored 3 months in airfollowed by 6 weeks at 0°C or 4°C to simulate good and bad shipping temperatures then6 days at 20°C to simulate marketing before the fruit firmness was measured.
Season 2001In 2001, only fruit from orchard 2 stored in air and shipped at 4°C was significantlysofter than fruit shipped at 0°C by approximately 0.3 kgf (Table 1)*.
Season 2002In 2002, there was no significant effect of shipping temperature on firmness of air storedapples (Table 2).
Season 2003In 2003, there was no significant effect of shipping temperature on firmness of air storedapples (Table 3).
Static commercial air storage experiment
In the static commercial air storage experiment fruit from harvest 2 were stored in acommercial cool room in the Goulburn Valley for 10 weeks in air, followed by 6 weeksat 0°C or 4°C to simulate good and bad shipping temperatures then 6 days at 20°C tosimulate marketing before the fruit firmness was measured.
Season 2003In 2002, the fruit was air stored commercially followed by simulated shipping outturnedalmost identically to the DPI static trial (see Table 4 and Table 2).
Static controlled atmosphere (CA) storage experiment
In the static CA storage experiment the fruit from harvest 2 were stored 16 to 17 weeks inair followed by 6-8 weeks at 0°C or 4°C to simulate good and bad shipping temperaturesthen 6 days at 20°C to simulate marketing before the fruit firmness was measured.
Season 2001In 2001, there was no significant effect on CA stored fruit of shipping fruit at 4°Ccompared to 0°C on fruit firmness (Table 5).
Season 2002In 2002, fruit from orchards 5, 6 and 8 after CA storage and simulated shipping at 4°Cwere significantly softer than fruit shipped at 0°C (Table 6). There was no significanteffect of shipping temperature on the outturn firmness of fruit from the other orchards.
* All tables referenced are to be found within the current chapter.
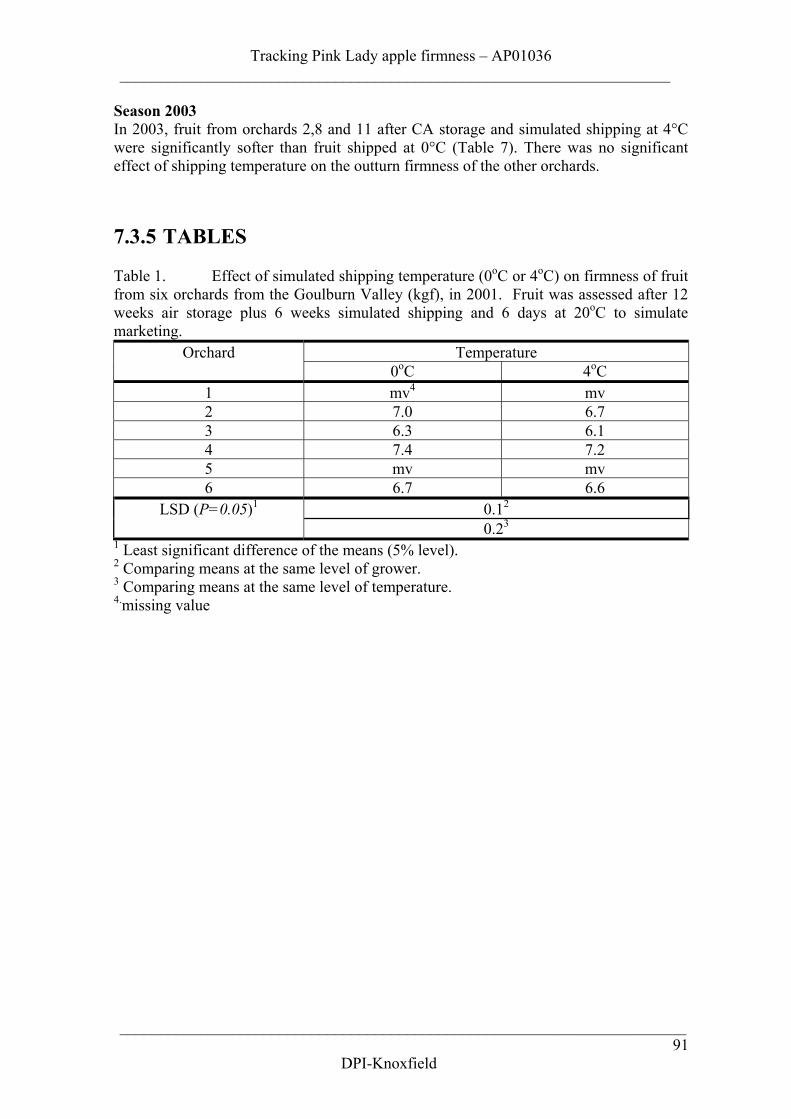
Tracking Pink Lady apple firmness – AP01036_____________________________________________________________________
_______________________________________________________________________91
DPI-Knoxfield
Season 2003In 2003, fruit from orchards 2,8 and 11 after CA storage and simulated shipping at 4°Cwere significantly softer than fruit shipped at 0°C (Table 7). There was no significanteffect of shipping temperature on the outturn firmness of the other orchards.
7.3.5 TABLES
Table 1. Effect of simulated shipping temperature (0oC or 4oC) on firmness of fruitfrom six orchards from the Goulburn Valley (kgf), in 2001. Fruit was assessed after 12weeks air storage plus 6 weeks simulated shipping and 6 days at 20oC to simulatemarketing.
TemperatureOrchard0oC 4oC
1 mv4 mv2 7.0 6.73 6.3 6.14 7.4 7.25 mv mv6 6.7 6.6
0.12LSD (P=0.05)1
0.23
1 Least significant difference of the means (5% level).2 Comparing means at the same level of grower.3 Comparing means at the same level of temperature.4.missing value
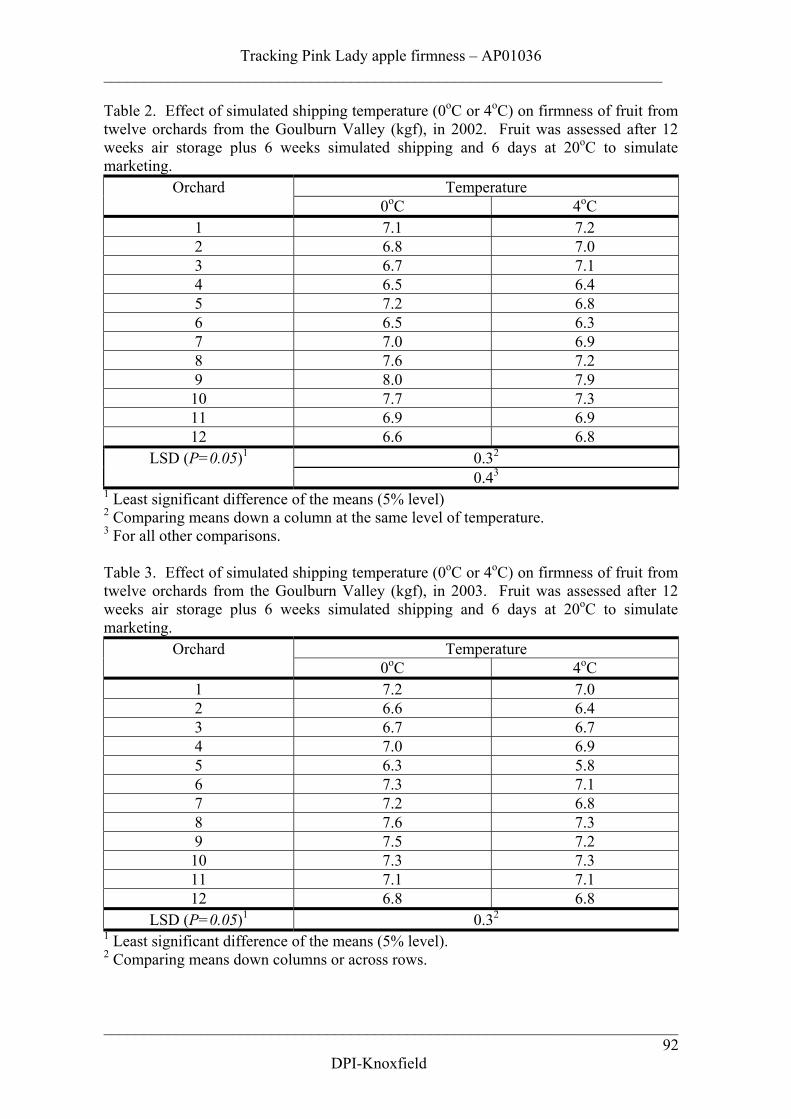
Tracking Pink Lady apple firmness – AP01036______________________________________________________________________
________________________________________________________________________92
DPI-Knoxfield
Table 2. Effect of simulated shipping temperature (0oC or 4oC) on firmness of fruit fromtwelve orchards from the Goulburn Valley (kgf), in 2002. Fruit was assessed after 12weeks air storage plus 6 weeks simulated shipping and 6 days at 20oC to simulatemarketing.
TemperatureOrchard0oC 4oC
1 7.1 7.22 6.8 7.03 6.7 7.14 6.5 6.45 7.2 6.86 6.5 6.37 7.0 6.98 7.6 7.29 8.0 7.910 7.7 7.311 6.9 6.912 6.6 6.8
0.32LSD (P=0.05)1
0.43
1 Least significant difference of the means (5% level)2 Comparing means down a column at the same level of temperature.3 For all other comparisons.
Table 3. Effect of simulated shipping temperature (0oC or 4oC) on firmness of fruit fromtwelve orchards from the Goulburn Valley (kgf), in 2003. Fruit was assessed after 12weeks air storage plus 6 weeks simulated shipping and 6 days at 20oC to simulatemarketing.
TemperatureOrchard0oC 4oC
1 7.2 7.02 6.6 6.43 6.7 6.74 7.0 6.95 6.3 5.86 7.3 7.17 7.2 6.88 7.6 7.39 7.5 7.210 7.3 7.311 7.1 7.112 6.8 6.8
LSD (P=0.05)1 0.32
1 Least significant difference of the means (5% level).2 Comparing means down columns or across rows.
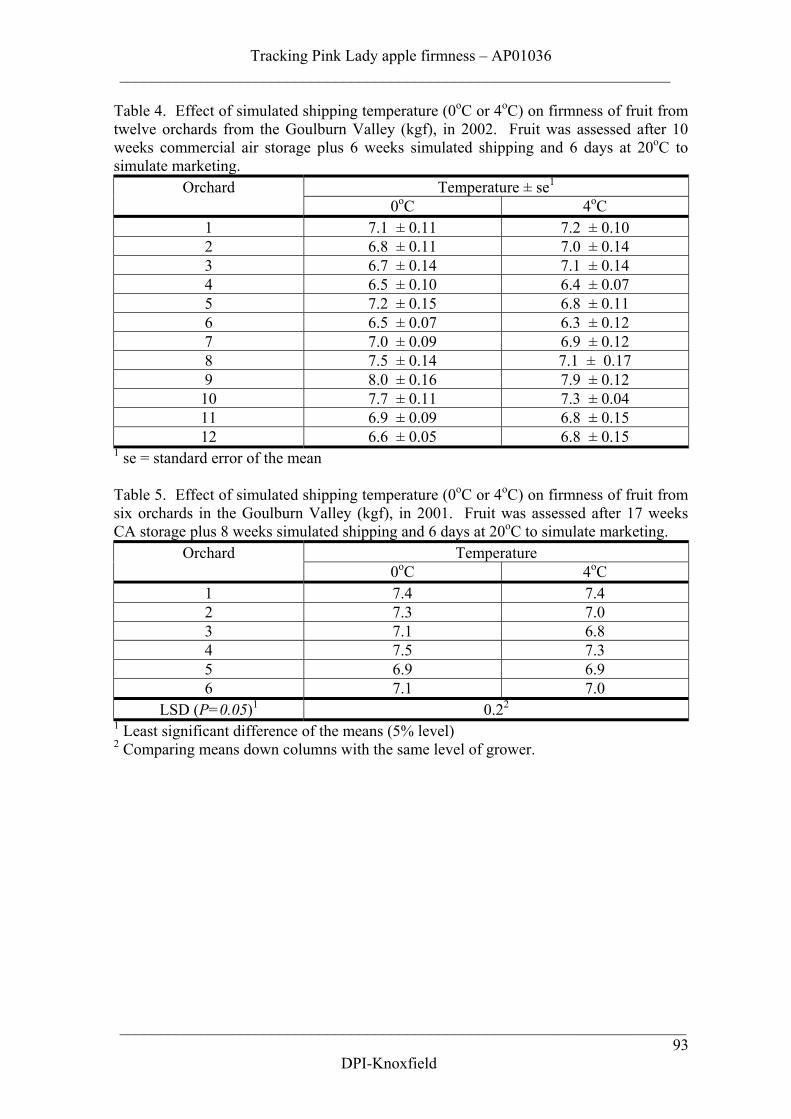
Tracking Pink Lady apple firmness – AP01036_____________________________________________________________________
_______________________________________________________________________93
DPI-Knoxfield
Table 4. Effect of simulated shipping temperature (0oC or 4oC) on firmness of fruit fromtwelve orchards from the Goulburn Valley (kgf), in 2002. Fruit was assessed after 10weeks commercial air storage plus 6 weeks simulated shipping and 6 days at 20oC tosimulate marketing.
Temperature ± se1Orchard0oC 4oC
1 7.1 ± 0.11 7.2 ± 0.102 6.8 ± 0.11 7.0 ± 0.143 6.7 ± 0.14 7.1 ± 0.144 6.5 ± 0.10 6.4 ± 0.075 7.2 ± 0.15 6.8 ± 0.116 6.5 ± 0.07 6.3 ± 0.127 7.0 ± 0.09 6.9 ± 0.128 7.5 ± 0.14 7.1 ± 0.179 8.0 ± 0.16 7.9 ± 0.1210 7.7 ± 0.11 7.3 ± 0.0411 6.9 ± 0.09 6.8 ± 0.1512 6.6 ± 0.05 6.8 ± 0.15
1 se = standard error of the mean
Table 5. Effect of simulated shipping temperature (0oC or 4oC) on firmness of fruit fromsix orchards in the Goulburn Valley (kgf), in 2001. Fruit was assessed after 17 weeksCA storage plus 8 weeks simulated shipping and 6 days at 20oC to simulate marketing.
TemperatureOrchard0oC 4oC
1 7.4 7.42 7.3 7.03 7.1 6.84 7.5 7.35 6.9 6.96 7.1 7.0
LSD (P=0.05)1 0.22
1 Least significant difference of the means (5% level)2 Comparing means down columns with the same level of grower.
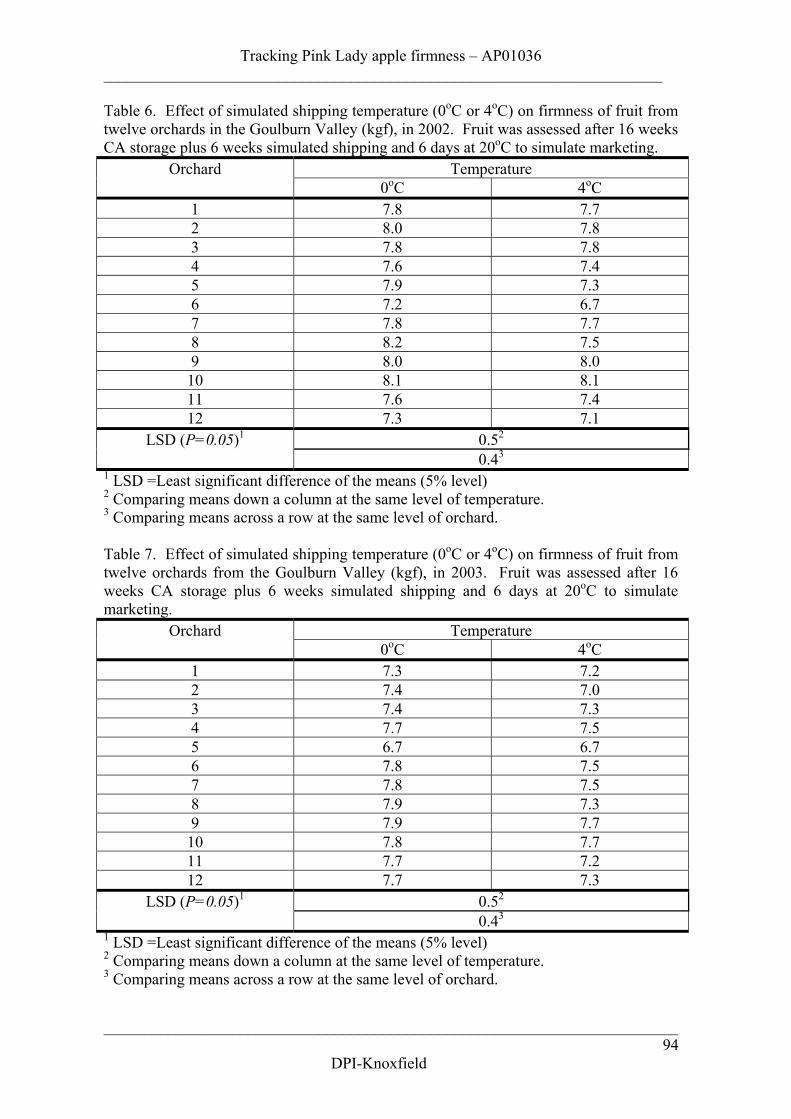
Tracking Pink Lady apple firmness – AP01036______________________________________________________________________
________________________________________________________________________94
DPI-Knoxfield
Table 6. Effect of simulated shipping temperature (0oC or 4oC) on firmness of fruit fromtwelve orchards in the Goulburn Valley (kgf), in 2002. Fruit was assessed after 16 weeksCA storage plus 6 weeks simulated shipping and 6 days at 20oC to simulate marketing.
TemperatureOrchard0oC 4oC
1 7.8 7.72 8.0 7.83 7.8 7.84 7.6 7.45 7.9 7.36 7.2 6.77 7.8 7.78 8.2 7.59 8.0 8.010 8.1 8.111 7.6 7.412 7.3 7.1
0.52LSD (P=0.05)1
0.43
1 LSD =Least significant difference of the means (5% level)2 Comparing means down a column at the same level of temperature.3 Comparing means across a row at the same level of orchard.
Table 7. Effect of simulated shipping temperature (0oC or 4oC) on firmness of fruit fromtwelve orchards from the Goulburn Valley (kgf), in 2003. Fruit was assessed after 16weeks CA storage plus 6 weeks simulated shipping and 6 days at 20oC to simulatemarketing.
TemperatureOrchard0oC 4oC
1 7.3 7.22 7.4 7.03 7.4 7.34 7.7 7.55 6.7 6.76 7.8 7.57 7.8 7.58 7.9 7.39 7.9 7.710 7.8 7.711 7.7 7.212 7.7 7.3
0.52LSD (P=0.05)1
0.43
1 LSD =Least significant difference of the means (5% level)2 Comparing means down a column at the same level of temperature.3 Comparing means across a row at the same level of orchard.
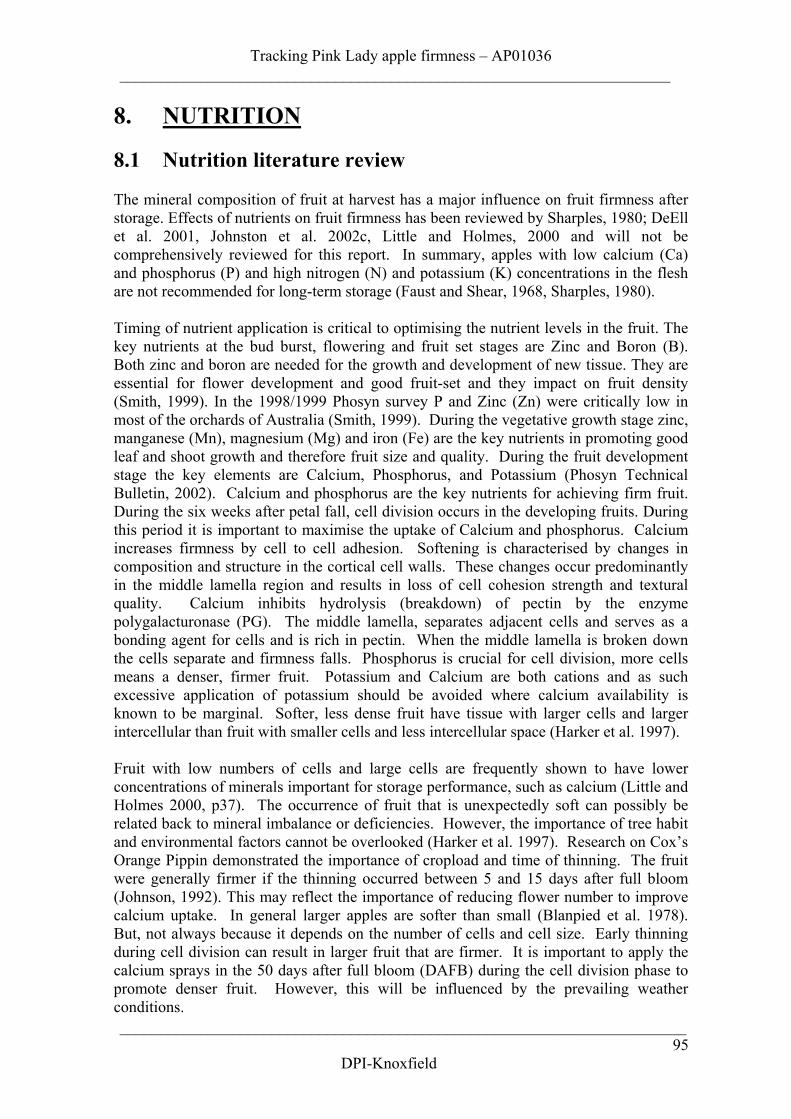
Tracking Pink Lady apple firmness – AP01036_____________________________________________________________________
_______________________________________________________________________95
DPI-Knoxfield
8. NUTRITION
8.1 Nutrition literature review
The mineral composition of fruit at harvest has a major influence on fruit firmness afterstorage. Effects of nutrients on fruit firmness has been reviewed by Sharples, 1980; DeEllet al. 2001, Johnston et al. 2002c, Little and Holmes, 2000 and will not becomprehensively reviewed for this report. In summary, apples with low calcium (Ca)and phosphorus (P) and high nitrogen (N) and potassium (K) concentrations in the fleshare not recommended for long-term storage (Faust and Shear, 1968, Sharples, 1980).
Timing of nutrient application is critical to optimising the nutrient levels in the fruit. Thekey nutrients at the bud burst, flowering and fruit set stages are Zinc and Boron (B).Both zinc and boron are needed for the growth and development of new tissue. They areessential for flower development and good fruit-set and they impact on fruit density(Smith, 1999). In the 1998/1999 Phosyn survey P and Zinc (Zn) were critically low inmost of the orchards of Australia (Smith, 1999). During the vegetative growth stage zinc,manganese (Mn), magnesium (Mg) and iron (Fe) are the key nutrients in promoting goodleaf and shoot growth and therefore fruit size and quality. During the fruit developmentstage the key elements are Calcium, Phosphorus, and Potassium (Phosyn TechnicalBulletin, 2002). Calcium and phosphorus are the key nutrients for achieving firm fruit.During the six weeks after petal fall, cell division occurs in the developing fruits. Duringthis period it is important to maximise the uptake of Calcium and phosphorus. Calciumincreases firmness by cell to cell adhesion. Softening is characterised by changes incomposition and structure in the cortical cell walls. These changes occur predominantlyin the middle lamella region and results in loss of cell cohesion strength and texturalquality. Calcium inhibits hydrolysis (breakdown) of pectin by the enzymepolygalacturonase (PG). The middle lamella, separates adjacent cells and serves as abonding agent for cells and is rich in pectin. When the middle lamella is broken downthe cells separate and firmness falls. Phosphorus is crucial for cell division, more cellsmeans a denser, firmer fruit. Potassium and Calcium are both cations and as suchexcessive application of potassium should be avoided where calcium availability isknown to be marginal. Softer, less dense fruit have tissue with larger cells and largerintercellular than fruit with smaller cells and less intercellular space (Harker et al. 1997).
Fruit with low numbers of cells and large cells are frequently shown to have lowerconcentrations of minerals important for storage performance, such as calcium (Little andHolmes 2000, p37). The occurrence of fruit that is unexpectedly soft can possibly berelated back to mineral imbalance or deficiencies. However, the importance of tree habitand environmental factors cannot be overlooked (Harker et al. 1997). Research on Cox’sOrange Pippin demonstrated the importance of cropload and time of thinning. The fruitwere generally firmer if the thinning occurred between 5 and 15 days after full bloom(Johnson, 1992). This may reflect the importance of reducing flower number to improvecalcium uptake. In general larger apples are softer than small (Blanpied et al. 1978).But, not always because it depends on the number of cells and cell size. Early thinningduring cell division can result in larger fruit that are firmer. It is important to apply thecalcium sprays in the 50 days after full bloom (DAFB) during the cell division phase topromote denser fruit. However, this will be influenced by the prevailing weatherconditions.
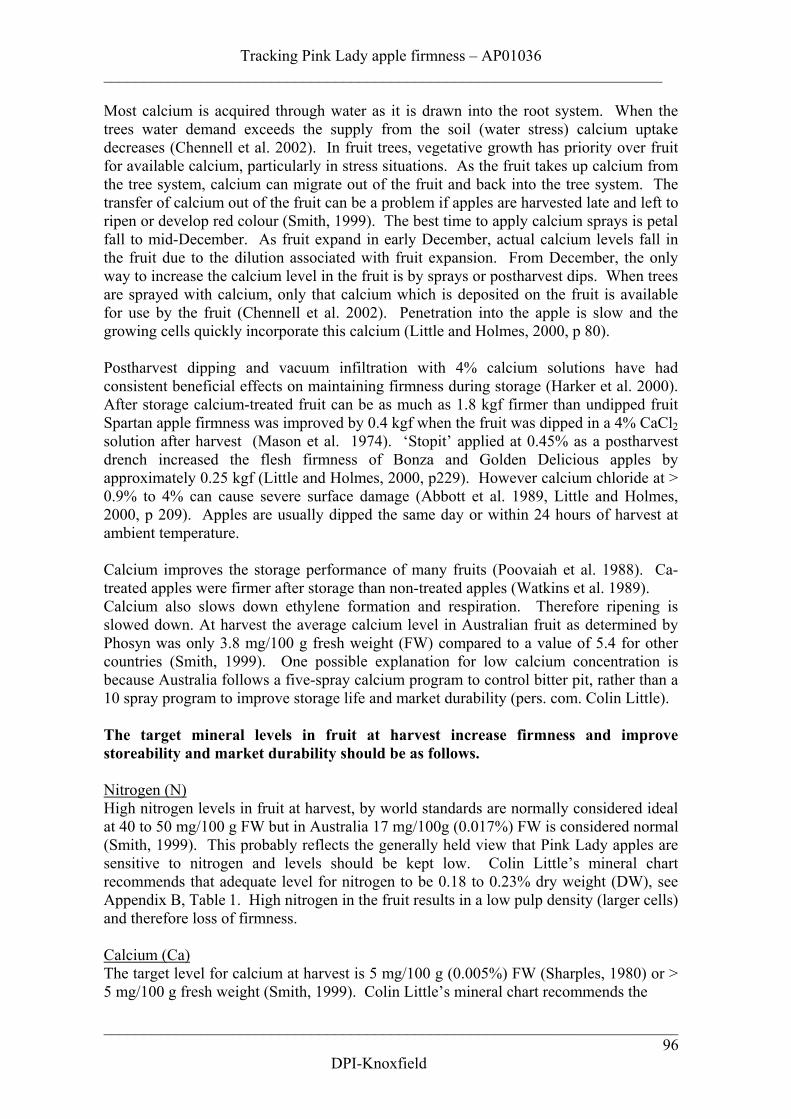
Tracking Pink Lady apple firmness – AP01036______________________________________________________________________
________________________________________________________________________96
DPI-Knoxfield
Most calcium is acquired through water as it is drawn into the root system. When thetrees water demand exceeds the supply from the soil (water stress) calcium uptakedecreases (Chennell et al. 2002). In fruit trees, vegetative growth has priority over fruitfor available calcium, particularly in stress situations. As the fruit takes up calcium fromthe tree system, calcium can migrate out of the fruit and back into the tree system. Thetransfer of calcium out of the fruit can be a problem if apples are harvested late and left toripen or develop red colour (Smith, 1999). The best time to apply calcium sprays is petalfall to mid-December. As fruit expand in early December, actual calcium levels fall inthe fruit due to the dilution associated with fruit expansion. From December, the onlyway to increase the calcium level in the fruit is by sprays or postharvest dips. When treesare sprayed with calcium, only that calcium which is deposited on the fruit is availablefor use by the fruit (Chennell et al. 2002). Penetration into the apple is slow and thegrowing cells quickly incorporate this calcium (Little and Holmes, 2000, p 80).
Postharvest dipping and vacuum infiltration with 4% calcium solutions have hadconsistent beneficial effects on maintaining firmness during storage (Harker et al. 2000).After storage calcium-treated fruit can be as much as 1.8 kgf firmer than undipped fruitSpartan apple firmness was improved by 0.4 kgf when the fruit was dipped in a 4% CaCl2solution after harvest (Mason et al. 1974). ‘Stopit’ applied at 0.45% as a postharvestdrench increased the flesh firmness of Bonza and Golden Delicious apples byapproximately 0.25 kgf (Little and Holmes, 2000, p229). However calcium chloride at >0.9% to 4% can cause severe surface damage (Abbott et al. 1989, Little and Holmes,2000, p 209). Apples are usually dipped the same day or within 24 hours of harvest atambient temperature.
Calcium improves the storage performance of many fruits (Poovaiah et al. 1988). Ca-treated apples were firmer after storage than non-treated apples (Watkins et al. 1989).Calcium also slows down ethylene formation and respiration. Therefore ripening isslowed down. At harvest the average calcium level in Australian fruit as determined byPhosyn was only 3.8 mg/100 g fresh weight (FW) compared to a value of 5.4 for othercountries (Smith, 1999). One possible explanation for low calcium concentration isbecause Australia follows a five-spray calcium program to control bitter pit, rather than a10 spray program to improve storage life and market durability (pers. com. Colin Little).
The target mineral levels in fruit at harvest increase firmness and improvestoreability and market durability should be as follows.
Nitrogen (N)High nitrogen levels in fruit at harvest, by world standards are normally considered idealat 40 to 50 mg/100 g FW but in Australia 17 mg/100g (0.017%) FW is considered normal(Smith, 1999). This probably reflects the generally held view that Pink Lady apples aresensitive to nitrogen and levels should be kept low. Colin Little’s mineral chartrecommends that adequate level for nitrogen to be 0.18 to 0.23% dry weight (DW), seeAppendix B, Table 1. High nitrogen in the fruit results in a low pulp density (larger cells)and therefore loss of firmness.
Calcium (Ca)The target level for calcium at harvest is 5 mg/100 g (0.005%) FW (Sharples, 1980) or >5 mg/100 g fresh weight (Smith, 1999). Colin Little’s mineral chart recommends the
Tracking Pink Lady apple firmness – AP01036_____________________________________________________________________
_______________________________________________________________________97
DPI-Knoxfield
adequate level for calcium to be 0.031% to 0.041% (percentage of the dry matter content)for long term CA storage. The mean N : Ca ratio approximately 10 to 14 (Sharples,1980, Dris et al. 1998, Little and Holmes, 2000, p. 100).
Phosphorus (P)The target level for phosphorus at harvest is 100 mg/100 g (Sharples, 1980) or >10mg/100 g FW (Smith, 1999). Colin Little’s mineral chart recommends the adequate levelfor phosphorus to be 0.06 to 0.08% DW.
Potassium (K)The target level for potassium at harvest is 130 – 160 mg/100 g FW (Sharples, 1980) or100 –120 mg/100 g FW (Smith, 1999). Colin Little’s mineral chart recommends thatadequate level for potassium to be 0.63 to 0.76% DW. The mean K : Ca ratio should notexceed 30 for good keeping quality (Faust and Shear, 1968). Little and Holmes, 2000,p.100 suggest that 30:1 is the ideal ratio.
Magnesium (Mg)Magnesium 5 mg/100 g FW (Sharples, 1980) and less than 5 mg/100 g (Smith, 1999).Colin Little’s mineral chart recommends that adequate level for magnesium to be 0.027to 0.035% DW. If magnesium levels are too high it could reverse the Ca/Mg ratio andtherefore reduce storability (Smith, 1999). The mean Ca : Mg 1:0.08 (Little and Holmes,2000, p.100)
Zinc (Zn)Zinc should be > 0.05 mg/100 g FW (Smith, 1999). Colin Little’s mineral chartrecommends that adequate level for zinc to be 5 to 10 parts per million (ppm) DW. MostAustralian apple fruit have extremely low zinc levels at harvest (Smith, 1999).
Boron (B)Boron should be 0.2 to 0.6 mg /100 g FW (Smith, 1999). Colin Little’s mineral chartrecommends that adequate level for boron to be 18 to 24 ppm (parts per millions dryweight).
Traditionally, analysis and interpretation of fruit samples are performed at harvest stageand thus analysis results indicating mineral deficiency cannot be corrected. Directanalysis of fruit samples at early growth and development stages was developed byPhosyn called the ‘Early Season Fruitlet Analysis’ (ESFA) technique which enables thegrower to analyse his fruit at the 40- 50 gram stage and gain advance warning, in time toapply pre-harvest fertilizers to correct any potential nutrient imbalance (Ridings, 2002).
This project aims to correlate the nutrient status of Pink Lady apples at 20-25 grams, 40-50 grams and at harvest with the firmness outturn after storage and export. The projecthas been linked to Phosyn’s nutritional research and Colin Little's Apple Maturityassessment work. AFFCO assisted by organising a shipment of Pink Lady to the UKwhere Ian Wilkinson determined the firmness of the fruit.
Tracking Pink Lady apple firmness – AP01036______________________________________________________________________
________________________________________________________________________98
DPI-Knoxfield
Sections 8.2 and 8.3 present the results which examine the benefits of using pre-harvestfoliar sprays and post harvest calcium dipping to maximise nutrient levels in Pink Ladyapples and their effect on firmness afterwards.
8.2 Effect of early season fruitlet nutrient analysis on PinkLady apple firmness.
INTRODUCTION
Calcium , phosphorus, potassium and nitrogen levels in the fruit can have a major impacton apple firmness. Phosyn developed the ‘Early Season Fruitlet Analysis’ ESFAtechnique as a means of gaining advanced warning on the nutrient status of the fruit, intime to apply pre-harvest fertilisers to correct any potential nutrient imbalance. Thisproject attempts to adapt the EFSA technique to Pink Lady apples.
The Pink Lady apple industry has two basic questions:1) Does the fruit from orchards with soft fruit outturns have poor fruit nutrient status?2) Can the nutrient status of the fruit be improved by using an ESFA approach for fruit
nutrient status management?
8.2.1 EXPERIMENTAL OBJECTIVES
1. Determine the effect of foliar nutrients sprays on nutrient levels in Pink Lady apples.2. Determine the correlation of Pink Lady apple fruit nutrient levels at 20-25 gram, 40-
55 gram and at harvest with post storage firmness.
8.2.2 MATERIALS AND METHODS
Season 2001
Six orchards with 5 to 7 year old Pink Lady apple trees on MM106 rootstock wereselected in the Goulburn Valley region.
At harvest a bulk sample of 20 fruit approximately 145 gram to 160 gram in weight werecollected from each orchard for nutrient analysis at the 1st pick. The samples wereanalysed by the State Chemistry Laboratory, Victoria.
Season 2002
In year 2 the number of orchards was increased from six to twelve. The aim was to havefive orchards using a modified Phosyn program (higher nutrient input) compared to 7orchards using their normal spray programs (lower nutrient input.). The growers paid forthe sprays.
Tracking Pink Lady apple firmness – AP01036_____________________________________________________________________
_______________________________________________________________________99
DPI-Knoxfield
The growers supplied the actual foliar spray records for the orchards used in this project.Nick Sanders, Phosyn Plc calculated the total amounts of each element applied duringfruit growth period. The total amounts of nitrogen, calcium and phosphorus arepresented in this report.
Products used by the growers were:
Orchard 1 Stopit, calcium chloride, Phoztrac, Caltrac, calcium nitrate Hydromag.Orchard 2 Standard calcium program using Stopit.Orchard 3 High nutrient input, full calcium program Stopit and Phoztrac for
phosphorus and ZincOrchard 4 Stopit, Biomin calcium, Phoztrac, Calstop and PhozcareOrchard 5 CalstopOrchard 6 High nutrient input, Phoztrac, Pitstop, CaP, Caltrac 400, Seniphos,
Mantrac and CoptrelOrchard 7 Stopit program. Minimal zinc or phosphorusOrchard 8 High nutrient input, Full calcium program with Phoztrac for additional
zinc and phosphorus.Orchard 9 High nutrient input, Bortrac, Stopit Caltrac, Phoztrac for additional zinc
and phosphorus, Seniphos.Orchard 10 High nutrient input, Phoztrac, Caltrac, Hydrophos, Stopit, calcium
chloride, calcium nitrate, Seniphos, Hydromag, Budbuilder and Safe NOrchard 11 Calstop and Biomin calciumOrchard 12 Pitstop Phoztrac, Caltrac and Biomin calcium
At approximately the 25 gram fruitlet and 55 gram fruitlet stages a bulk sample of 12fruit were collected from each orchard. The fruit was sampled from across the 5 fieldblock replicates. At the first harvest (optimum physiological maturity) and at the secondharvest (commercial harvest) a sample of 6 fruit by three fruit sizes (small with anaverage weight 137 grams, medium average weight 189 gram and large with an averageweight 242 gram) were picked and their nutrient analysis determined by Phosynanalytical laboratory. It was felt after consultation with the growers and Phosyn that theeffect of fruit size on the nutrient status of the fruit should be taken into account. Therewere differences in the fruits sizes between the orchards. However, the analysis of 2002data found that fruit size was not having a significant effect on the nutrient status of thefruit at harvest with the exception of calcium. Larger fruit had significantly less calciumthan the medium and small fruit, but based on Phosyn’s and Colin Little’s standards, thecalcium levels for all sizes of fruit were within the adequate range for long term storage.Therefore, only data for medium sized fruit is presented in this report.
This project was not designed to establish optimum levels for nutrients in Pink Ladyapples. There are commonly accepted standards for apples published in the scientificliterature which identify normal levels in apples at harvest and target levels to maximisefruit firmness. Phosyn has established standards for their ESFA system. There are nospecific mineral standards for Pink Lady apples. Therefore, generic mineral standards areused to determine if nutrition is a limiting factor in soft fruit at harvest and after storage.Ratings for interpreting the mineral levels in fruitlets, have been produced by Phosyn as ameans of predicting the likelihood of fruit being soft after storage. At the 25 gram and 50gram fruit stages there was one bulk sample analysis which came with Phosyn’s ratings.
Tracking Pink Lady apple firmness – AP01036______________________________________________________________________
________________________________________________________________________100
DPI-Knoxfield
At harvest, five Phosyn analysis data sheets per orchard, that is the results of each fieldreplicate, were provided by Phosyn. Ratings for interpreting the harvest sample resultswere taken from Phosyn’s analysis sheets. The actual ratings used by Phosyn forinterpreting results and recommending correctional foliar nutrient sprays is Phosyn’sintellectual property and will not be presented. Similarly, the number of sprays and ratesof products used for the Full Phosyn nutrient program is not presented as it is Phosyn’sconfidential information. However, readers wanting a guide as to foliar spray nutrientrequirements (what products, application rates, how many sprays and what time of theyear they were provided), the foliar spray program of orchard 1, for the season’s 2001,2002 and 2003 is provided (see Section 17.1 Appendix A Table 8). Orchard 1 fruitfirmness picked at optimum physiological maturity (1st pick) met the proposed exportstandard of 7.5 kgf, after 6 months CA storage over the three seasons.
The nutritional levels of fruitlets at the 25 gram and 50 gram stages plus fruit at harvestwere plotted against fruit firmness after 3 months and 6 months CA storage.
The results are interpreted using the fresh weight results because there were no dryweight standards for the 25 gram and 55 gram fruitlet stages. However, for thecompleteness of reporting the results, both dry weight and fresh weight data is presentedfor readers who may be more familiar with interpreting dry weight nutrient analysis (seeSection 17.1 Appendix A, Tables 2 to 6).
Season 2003In year 3, Phosyn plc provided free foliar nutrients to five orchards to apply nutrientprogram recommended by Phosyn (being the same orchards that used modified Phosynnutrient programs in 2002) and the remaining seven orchards used their normal foliarspray programs.
Products used by the growers:
Orchard 1 Phoztrac, Caltrac, Seniphos and CalmaxOrchard 2 Bortrac, Stopit, Phoztrac, and SeniphosOrchard 3 Full Phosyn nutrient program, Phoztrac, Stopit and SeniphosOrchard 4 Stopit, Calmax, Caltrac and calcium chloride.Orchard 5 Calmax, Calstop, Biomin calcium, CaP and Tracel SP.Orchard 6 Full Phosyn nutrient program, Bortrac, Phoztrac, Calmax, Seniphos,
Caltrac and Stopit.Orchard 7 Bortrac, Stopit, Phoztrac and Seniphos.Orchard 8 Full Phosyn nutrient program, Bortrac, Stopit, Phoztrac and Seniphos.Orchard 9 Full Phosyn nutrient program, Bortrac, Zintrac, Phoztrac, Hydromag,
Seniphos, Calmax and Stopit.Orchard 10 Full Phosyn nutrient program, Bortrac, Phoztrac, Caltrac, Stopit,
Seniphos, Budbuilder and Safe N.Orchard 11 Calstop, Calmax, Biomin calcium, CaP, Trace SP.Orchard 12 Pitstop, Tech-Gro Alpha, Caltrac and Nutrifol CaP
Fruitlets were collected for nutrient analysis at the 25 gram and 55 gram stages, a total of50 fruitlets were collected at random from each orchard. In addition, at the first harvest asample of 6 fruit per orchard replication block, of one fruit size, (medium with an average
Tracking Pink Lady apple firmness – AP01036_____________________________________________________________________
_______________________________________________________________________101
DPI-Knoxfield
weight of 165 grams) were taken. The nutrient analysis was determined by Phosynanalytical laboratory.
The nutritional levels of fruitlets at the 25 gram and 50 gram stages plus fruit at harvestwere plotted against fruit firmness after 3 months and 6 months CA storage.
8.2.3 RESULTS AND DISCUSSIONSeason 2001In 2001 the nutrient status of the fruit was measured at harvest to provide a base line forcomparing the six orchards (Table 1)*.
The firmness of fruit from orchard 1 after 6 months CA storage plus 1 day at 20°C was8.1 kgf, which is very good. If low nitrogen levels in Pink Lady apples are essential forfirm fruit then orchard 1 meet the criteria (Table 1). It also had P, Ca, Mg and B in theadequate range for long term CA storage (LTCA). The N/Ca ratio was lower than the10:1 ideal ratio for apples, which is good for maintaining fruit firmness. K levels werehigh but the K/Ca ratio was close to ideal and the Ca/Mg was also very good. S, Zn, Cuand Mn were slightly lower than the standards required for normal levels in the fruit atharvest for LTCA. In general, the nutritional status of the fruit from orchard 1 was closeto ideal for LTCA. The fruit firmness was excellent for export, well above the proposedexport standard of 7.5 kgf.
Orchard 4 had the firmest fruit after storage (8.3 kgf) but the fruit had slightly lowcalcium levels at harvest (Table 1). However, the fruit had good N/Ca ratios at 5.9:1 anda P/Ca ratio would have favoured firmer fruit. On the negative side the fruit had higherthan ideal K/Ca ratio, which in theory would promote softer fruit. The fruit firmness wasexcellent for export, well above the proposed export standard of 7.5 kgf.
Orchard 5 had the softest fruit after storage and the fruit at harvest was nutritionally good(Table 1). Nitrogen levels in the fruit were low, P, Ca, Mg were normal, K was high butthe K/Ca ratio was good. B was slightly high but was not expected to affect the fruitfirmness after storage. All of the mineral ratios were good. The fruit firmness would nothave met the proposed export standard of 7.5 kgf.
Orchard 2 fruit was slightly low in calcium at harvest, high in potassium and had a highK/Ca ratio and the N/Ca were normal (Table 1). The fruit firmness would have met theproposed export standard of 7.5 kgf.
Orchard 3 fruit had slightly high N levels in the fruit at harvest but in respect to all otherminerals it was similar those in fruit from orchard 1 (Table 1). The fruit firmness wouldhave met the proposed export standard of 7.5 kgf.
Orchard 6 fruit had a similar nutritional profile to orchard 1 but orchard 6 fruit was 0.4kgf softer compared to orchard 1 after storage (Table 1). The fruit firmness would havemet the proposed export standard of 7.5 kgf.
There were no significant relationships between any of the minerals or mineral ratios inthe fruit at harvest and the firmness of the fruit after storage. The inability to achieve
* All tables referenced are to be found within the current chapter.
Tracking Pink Lady apple firmness – AP01036______________________________________________________________________
________________________________________________________________________102
DPI-Knoxfield
significant correlations between Ca and N levels in fruit at harvest and fruit firmness afterstorage is attributed to most fruit being within the normal expected ranges for long termstorage or close to it. The absence of fruit with very low or high Ca and N levels meantthat a significant line of fit was not possible.
Seasons 2002 and 2003
NitrogenNitrogen applications are one of the most controversial nutrient inputs in appleproduction. The main concerns are the negative impacts of excessive nitrogen on fruitquality, especially colour but also on fruit firmness. Colour is important because delaysin colour development can result in fruit with advanced maturity at harvest. Elevatednitrogen levels in the fruit dilute the benefits of calcium during ripening and result in afaster rate of softening during storage.
The nitrogen levels in the 25 gram and 55 gram fruitlets ranged from normal to very low(Tables 2a and 2b). Therefore, the growers were holding to the generally held conceptthat it is best to keep nitrogen levels low in Pink Lady apple to minimise the risk ofgetting soft fruit outturns. Most of the orchards applied 75% to 100% of the total seasonsnitrogen input by 90 days after full bloom (DAFB).
In 2002, orchard 4 applied no nitrogen and N levels in the fruit remained very low in thefruitlets and fruit, which is good. In 2003, the orchard received a large application ofcalcium nitrate but the N levels remained normal to slightly low during the fruitlet andfruit stages. Significantly, 71.4% of the nitrogen was applied during the first 60 DAFBand this may explain why the N levels were similar to the N levels in fruit from the other11 orchards which were rated as being slightly low which was on par for the other 11orchards.
In general, the nitrogen levels in the fruit at the first pick were not substantially differentto the 2nd pick for 2002 and 2003 harvest (Table 3a and 3b). Based on Phosyn standardsfor nitrogen in the fruit at harvest, the fruit N levels from most orchards ranged fromslightly low to normal. The N levels were lower than the normally accepted target levelof 40 to 50 mg/100 g FW. In both seasons the difference in nitrogen levels of the fruit atharvest did not reflect the difference in firmness after storage. There was no significantrelationship between the nitrogen levels in the fruit at harvest and the firmness at harvestand after storage (data not presented).
CalciumIn general, fruit with more than 0.030 % dry weight or 4.38 mg / 100g FW are firmer. Inthis project we wanted to see if there were major differences in the calcium level in fruitfrom orchards with softer fruit compared to orchards with firmer fruit. In addition, wewanted to see if calcium foliar sprays applied to fruitlets with low calcium levels at the 25gram stage could be corrected to normal levels and maintained at normal level at harvest.
It is important to get as much calcium as possible into the fruit during the cell divisionphase of the fruit development (50 DAFB). In 2002/2003 season orchards 6 and 12increased the amount of calcium applied during the 60 DAFB compared to the 2001/2002season and the firmness of the fruit after 6 months CA was improved substantially(Tables 3a, 3b, 5a and 5b). Orchards 5 and 11 received the same programs and only
Tracking Pink Lady apple firmness – AP01036_____________________________________________________________________
_______________________________________________________________________103
DPI-Knoxfield
5.8% of the season total calcium was applied in the 90 DAFB. Therefore, had orchard 5applied more calcium during 90 DAFB this may have improved the firmness of the fruit.However, orchard 11 on the same spray program had acceptable firmness and orchard 5did not. Orchard 4 had soft fruit in 2002 following low calcium input, but in 2003 thetrees received 30% more Ca by 90 DAFB and the fruit was much firmer. Therefore, if50% of the season’s total calcium is applied by 90 DAFB it may improve the chance offirmer fruit after long term storage, particularly if the fruit is harvested at ‘commercial’harvest (Tables 3a and 3b). More work over a number of seasons is required tosubstantiate this observation.
In 2001/2002, orchards 9 and 10 results showed normal ratings for calcium at the 55gram fruitlet stage, normal to high ratings at harvest with very good N : Ca ratios lessthan 4 and the fruit firmness after long term storage was very good. However, orchards11 and 12 tell a different story. They had low to slightly low calcium ratings at the 55gram fruitlet stage, less than normal calcium ratings at harvest with high N : Ca ratios.Orchard 12 fruit was soft after storage compared to orchard 10 however orchard 11 fruitwas not softer. This would suggest that factors other than calcium and nitrogen in thefruit were having an effect on the firmness of fruit from orchard 12 after storage.
In general, the calcium ratings improved from the 25 gram to 55 gram stages irrespectiveof the high or lower inputs of calcium (Table 5a and 5b). There is no evidence to suggestthe early ESFA doesn’t work because in the higher calcium input orchards, calciumratings improved between the 25 gram and 55 gram stages. Orchardists should know thecalcium status of the fruit as early as possible to allow sufficient time to correct anycalcium deficiency.
It is generally accepted that fruit with calcium levels greater than 5 mg / 100 g FW atharvest are likely to outturn firmer than fruit with less than 5 mg / 100 g FW. The idealN : Ca ratio for apples is considered to be 10:1 for apples. However, because Pink Ladyapples are thought to be more sensitive to nitrogen than other apple varieties the target Nlevel in the fruit is kept lower thus the Ca : N ratio is lower. However, the results fromthis project suggest that the 40 to 50 mg /100 g FW international benchmark of Ca andthe 10:1 N : Ca ratio may be safe for Pink Lady apples. However, more work is neededover a number of seasons to determine how sensitive Pink Lady apple is to nitrogenlevels in the fruit at harvest and its effect on fruit firmness.
In both seasons the difference in Ca levels of the fruit at harvest did not reflect thedifference in firmness of the fruit after storage. There was no significant relationshipbetween the calcium levels in the fruit at harvest and the firmness at harvest and afterstorage (data not presented).
Calcium is important for return bloom. Orchard 10 was able to have two consecutivehigh cropping years in 2002 and 2003 because the trees had reduced tree vigour coupledwith a high calcium to nitrogen ratio in both years (see Section 9.2.4 Tables 1 and 2). Inboth years the calcium level at the 25 gram and 55 gram fruitlets stages were slightly lowto low but by harvest the levels were normal to high. In both years the firmness atharvest and after storage was good (Table 5 b).
Tracking Pink Lady apple firmness – AP01036______________________________________________________________________
________________________________________________________________________104
DPI-Knoxfield
Phosphorus
The P levels in the fruit at the 55 gram fruitlet stage ranged from very low to low acrossthe orchards (Table 6a and 6b). No orchards had normal P levels at the 55 gram fruitletstage. Most orchards applied 50% or more of the season total P by 90 DAFB. At harvestthe P levels in the fruit from some orchards were less than normal. However, there wasno significant relationship between low and normal levels of P levels in relation to fruitfirmness after storage (data not presented).
In this project the amount of P applied from foliar sprays, ranged from none up to 13.17kg per hectare. Orchards 4,5 and 11 applied no P in 2002 and 2003 and the fruit atharvest still achieved normal levels of P. P was not applied to the soil at these orchardsin 2002 and 2003. Included in Section 17.2 Appendix B, Table 7 are the results of soilanalyses taken from each orchard in June 2002. The data is presented for readers wishingto know the soil nutritional status of the orchards. There was no obvious difference in thesoil P levels at orchards 4,5 and 11 compared to the other orchards. This may explainwhy the fruit P levels were normal at harvest.
Colour of the fruit was not measured as part of this project. But it would be interesting toknow what effect the N : P rating has on the skin red blush. Potentially, earlier colourmay enable the grower to pick his fruit earlier and thus the fruit could be closer tooptimum maturity for long term CA storage.
Most orchards had normal or slightly high N : P ratios. Whilst some orchards had higherthan normal levels of N : P in the fruit at harvest, this did not translate into softer fruit.
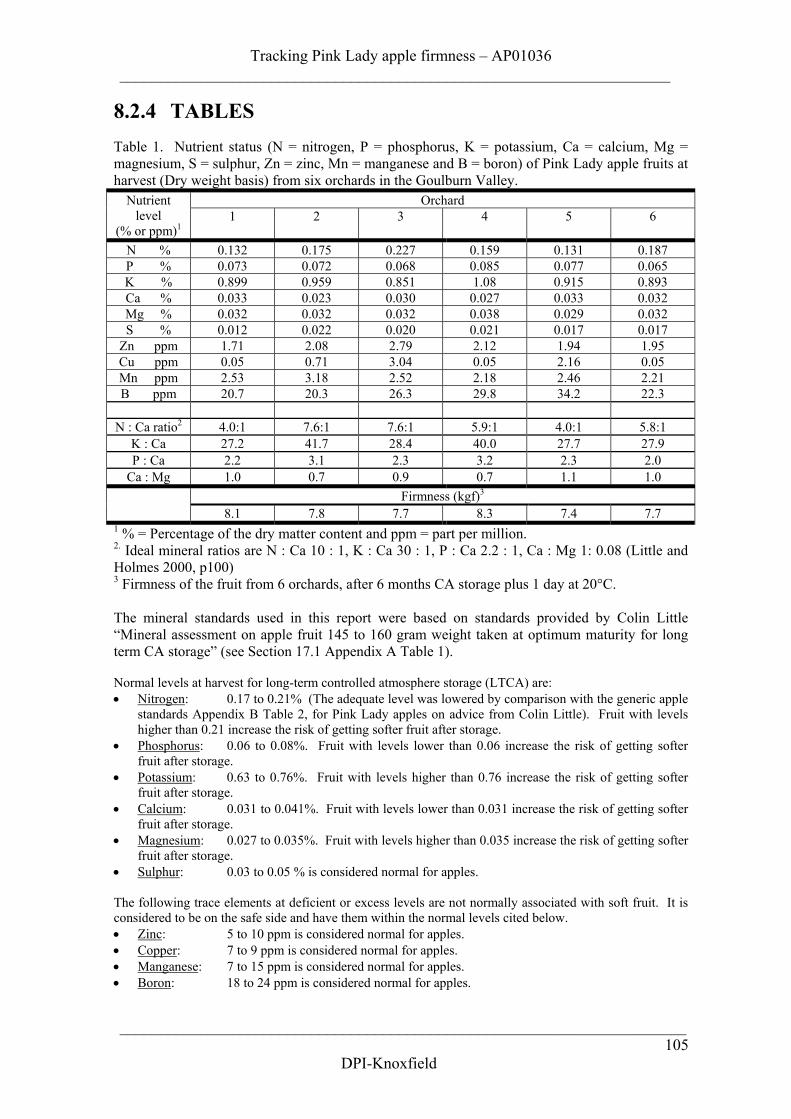
Tracking Pink Lady apple firmness – AP01036_____________________________________________________________________
_______________________________________________________________________105
DPI-Knoxfield
8.2.4 TABLESTable 1. Nutrient status (N = nitrogen, P = phosphorus, K = potassium, Ca = calcium, Mg =magnesium, S = sulphur, Zn = zinc, Mn = manganese and B = boron) of Pink Lady apple fruits atharvest (Dry weight basis) from six orchards in the Goulburn Valley.
OrchardNutrientlevel
(% or ppm)11 2 3 4 5 6
N % 0.132 0.175 0.227 0.159 0.131 0.187P % 0.073 0.072 0.068 0.085 0.077 0.065K % 0.899 0.959 0.851 1.08 0.915 0.893Ca % 0.033 0.023 0.030 0.027 0.033 0.032Mg % 0.032 0.032 0.032 0.038 0.029 0.032S % 0.012 0.022 0.020 0.021 0.017 0.017
Zn ppm 1.71 2.08 2.79 2.12 1.94 1.95Cu ppm 0.05 0.71 3.04 0.05 2.16 0.05Mn ppm 2.53 3.18 2.52 2.18 2.46 2.21B ppm 20.7 20.3 26.3 29.8 34.2 22.3
N : Ca ratio2 4.0:1 7.6:1 7.6:1 5.9:1 4.0:1 5.8:1K : Ca 27.2 41.7 28.4 40.0 27.7 27.9P : Ca 2.2 3.1 2.3 3.2 2.3 2.0
Ca : Mg 1.0 0.7 0.9 0.7 1.1 1.0Firmness (kgf)3
8.1 7.8 7.7 8.3 7.4 7.71 % = Percentage of the dry matter content and ppm = part per million.2. Ideal mineral ratios are N : Ca 10 : 1, K : Ca 30 : 1, P : Ca 2.2 : 1, Ca : Mg 1: 0.08 (Little andHolmes 2000, p100)3 Firmness of the fruit from 6 orchards, after 6 months CA storage plus 1 day at 20°C.
The mineral standards used in this report were based on standards provided by Colin Little“Mineral assessment on apple fruit 145 to 160 gram weight taken at optimum maturity for longterm CA storage” (see Section 17.1 Appendix A Table 1).
Normal levels at harvest for long-term controlled atmosphere storage (LTCA) are:• Nitrogen: 0.17 to 0.21% (The adequate level was lowered by comparison with the generic apple
standards Appendix B Table 2, for Pink Lady apples on advice from Colin Little). Fruit with levelshigher than 0.21 increase the risk of getting softer fruit after storage.
• Phosphorus: 0.06 to 0.08%. Fruit with levels lower than 0.06 increase the risk of getting softerfruit after storage.
• Potassium: 0.63 to 0.76%. Fruit with levels higher than 0.76 increase the risk of getting softerfruit after storage.
• Calcium: 0.031 to 0.041%. Fruit with levels lower than 0.031 increase the risk of getting softerfruit after storage.
• Magnesium: 0.027 to 0.035%. Fruit with levels higher than 0.035 increase the risk of getting softerfruit after storage.
• Sulphur: 0.03 to 0.05 % is considered normal for apples.
The following trace elements at deficient or excess levels are not normally associated with soft fruit. It isconsidered to be on the safe side and have them within the normal levels cited below.• Zinc: 5 to 10 ppm is considered normal for apples.• Copper: 7 to 9 ppm is considered normal for apples.• Manganese: 7 to 15 ppm is considered normal for apples.• Boron: 18 to 24 ppm is considered normal for apples.
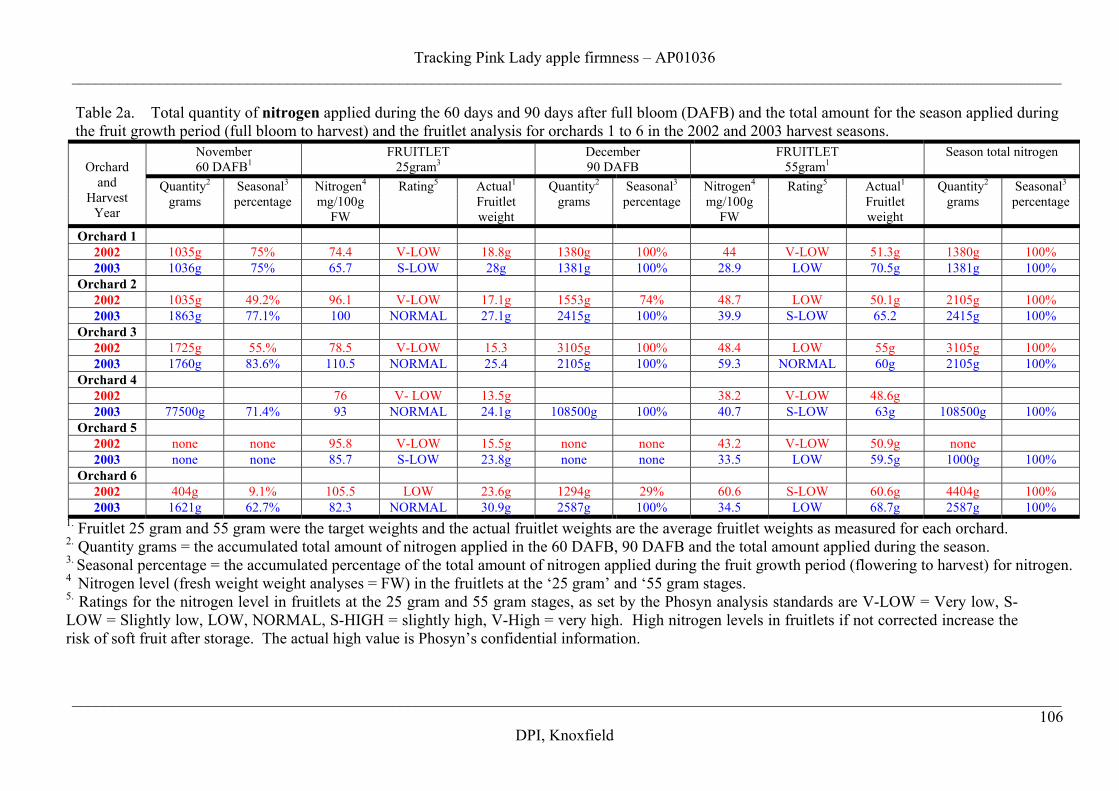
Tracking Pink Lady apple firmness – AP01036____________________________________________________________________________________________________________________________
____________________________________________________________________________________________________________________________106
DPI, Knoxfield
Table 2a. Total quantity of nitrogen applied during the 60 days and 90 days after full bloom (DAFB) and the total amount for the season applied duringthe fruit growth period (full bloom to harvest) and the fruitlet analysis for orchards 1 to 6 in the 2002 and 2003 harvest seasons.
November60 DAFB1
FRUITLET25gram3
December90 DAFB
FRUITLET55gram1
Season total nitrogenOrchard
andHarvest
Year
Quantity2
gramsSeasonal3
percentageNitrogen4
mg/100gFW
Rating5 Actual1
Fruitletweight
Quantity2
gramsSeasonal3
percentageNitrogen4
mg/100gFW
Rating5 Actual1
Fruitletweight
Quantity2
gramsSeasonal3
percentage
Orchard 12002 1035g 75% 74.4 V-LOW 18.8g 1380g 100% 44 V-LOW 51.3g 1380g 100%2003 1036g 75% 65.7 S-LOW 28g 1381g 100% 28.9 LOW 70.5g 1381g 100%
Orchard 22002 1035g 49.2% 96.1 V-LOW 17.1g 1553g 74% 48.7 LOW 50.1g 2105g 100%2003 1863g 77.1% 100 NORMAL 27.1g 2415g 100% 39.9 S-LOW 65.2 2415g 100%
Orchard 32002 1725g 55.% 78.5 V-LOW 15.3 3105g 100% 48.4 LOW 55g 3105g 100%2003 1760g 83.6% 110.5 NORMAL 25.4 2105g 100% 59.3 NORMAL 60g 2105g 100%
Orchard 42002 76 V- LOW 13.5g 38.2 V-LOW 48.6g2003 77500g 71.4% 93 NORMAL 24.1g 108500g 100% 40.7 S-LOW 63g 108500g 100%
Orchard 52002 none none 95.8 V-LOW 15.5g none none 43.2 V-LOW 50.9g none2003 none none 85.7 S-LOW 23.8g none none 33.5 LOW 59.5g 1000g 100%
Orchard 62002 404g 9.1% 105.5 LOW 23.6g 1294g 29% 60.6 S-LOW 60.6g 4404g 100%2003 1621g 62.7% 82.3 NORMAL 30.9g 2587g 100% 34.5 LOW 68.7g 2587g 100%
1. Fruitlet 25 gram and 55 gram were the target weights and the actual fruitlet weights are the average fruitlet weights as measured for each orchard.2. Quantity grams = the accumulated total amount of nitrogen applied in the 60 DAFB, 90 DAFB and the total amount applied during the season.3. Seasonal percentage = the accumulated percentage of the total amount of nitrogen applied during the fruit growth period (flowering to harvest) for nitrogen.4 Nitrogen level (fresh weight weight analyses = FW) in the fruitlets at the ‘25 gram’ and ‘55 gram stages.5. Ratings for the nitrogen level in fruitlets at the 25 gram and 55 gram stages, as set by the Phosyn analysis standards are V-LOW = Very low, S-LOW = Slightly low, LOW, NORMAL, S-HIGH = slightly high, V-High = very high. High nitrogen levels in fruitlets if not corrected increase therisk of soft fruit after storage. The actual high value is Phosyn’s confidential information.
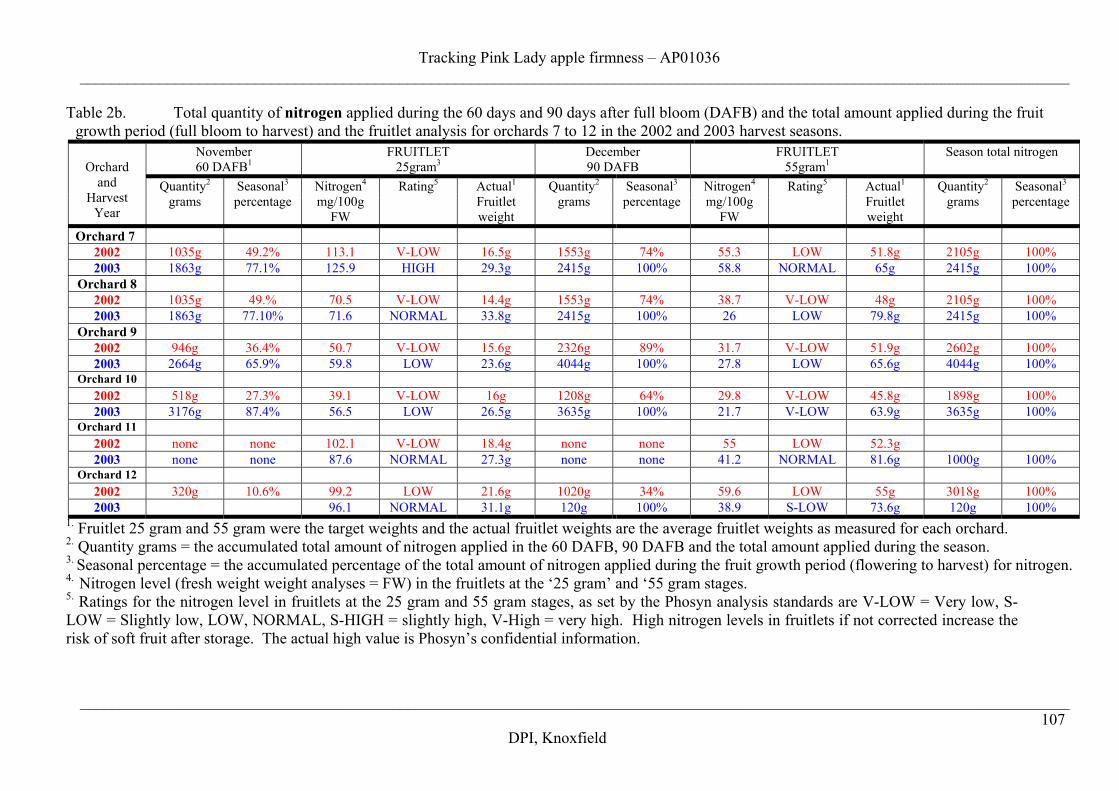
Tracking Pink Lady apple firmness – AP01036____________________________________________________________________________________________________________________________
____________________________________________________________________________________________________________________________107
DPI, Knoxfield
Table 2b. Total quantity of nitrogen applied during the 60 days and 90 days after full bloom (DAFB) and the total amount applied during the fruitgrowth period (full bloom to harvest) and the fruitlet analysis for orchards 7 to 12 in the 2002 and 2003 harvest seasons.
November60 DAFB1
FRUITLET25gram3
December90 DAFB
FRUITLET55gram1
Season total nitrogenOrchard
andHarvest
Year
Quantity2
gramsSeasonal3
percentageNitrogen4
mg/100gFW
Rating5 Actual1
Fruitletweight
Quantity2
gramsSeasonal3
percentageNitrogen4
mg/100gFW
Rating5 Actual1
Fruitletweight
Quantity2
gramsSeasonal3
percentage
Orchard 72002 1035g 49.2% 113.1 V-LOW 16.5g 1553g 74% 55.3 LOW 51.8g 2105g 100%2003 1863g 77.1% 125.9 HIGH 29.3g 2415g 100% 58.8 NORMAL 65g 2415g 100%
Orchard 82002 1035g 49.% 70.5 V-LOW 14.4g 1553g 74% 38.7 V-LOW 48g 2105g 100%2003 1863g 77.10% 71.6 NORMAL 33.8g 2415g 100% 26 LOW 79.8g 2415g 100%
Orchard 92002 946g 36.4% 50.7 V-LOW 15.6g 2326g 89% 31.7 V-LOW 51.9g 2602g 100%2003 2664g 65.9% 59.8 LOW 23.6g 4044g 100% 27.8 LOW 65.6g 4044g 100%
Orchard 102002 518g 27.3% 39.1 V-LOW 16g 1208g 64% 29.8 V-LOW 45.8g 1898g 100%2003 3176g 87.4% 56.5 LOW 26.5g 3635g 100% 21.7 V-LOW 63.9g 3635g 100%
Orchard 112002 none none 102.1 V-LOW 18.4g none none 55 LOW 52.3g2003 none none 87.6 NORMAL 27.3g none none 41.2 NORMAL 81.6g 1000g 100%
Orchard 122002 320g 10.6% 99.2 LOW 21.6g 1020g 34% 59.6 LOW 55g 3018g 100%2003 96.1 NORMAL 31.1g 120g 100% 38.9 S-LOW 73.6g 120g 100%
1. Fruitlet 25 gram and 55 gram were the target weights and the actual fruitlet weights are the average fruitlet weights as measured for each orchard.2. Quantity grams = the accumulated total amount of nitrogen applied in the 60 DAFB, 90 DAFB and the total amount applied during the season.3. Seasonal percentage = the accumulated percentage of the total amount of nitrogen applied during the fruit growth period (flowering to harvest) for nitrogen.4. Nitrogen level (fresh weight weight analyses = FW) in the fruitlets at the ‘25 gram’ and ‘55 gram stages.5. Ratings for the nitrogen level in fruitlets at the 25 gram and 55 gram stages, as set by the Phosyn analysis standards are V-LOW = Very low, S-LOW = Slightly low, LOW, NORMAL, S-HIGH = slightly high, V-High = very high. High nitrogen levels in fruitlets if not corrected increase therisk of soft fruit after storage. The actual high value is Phosyn’s confidential information.
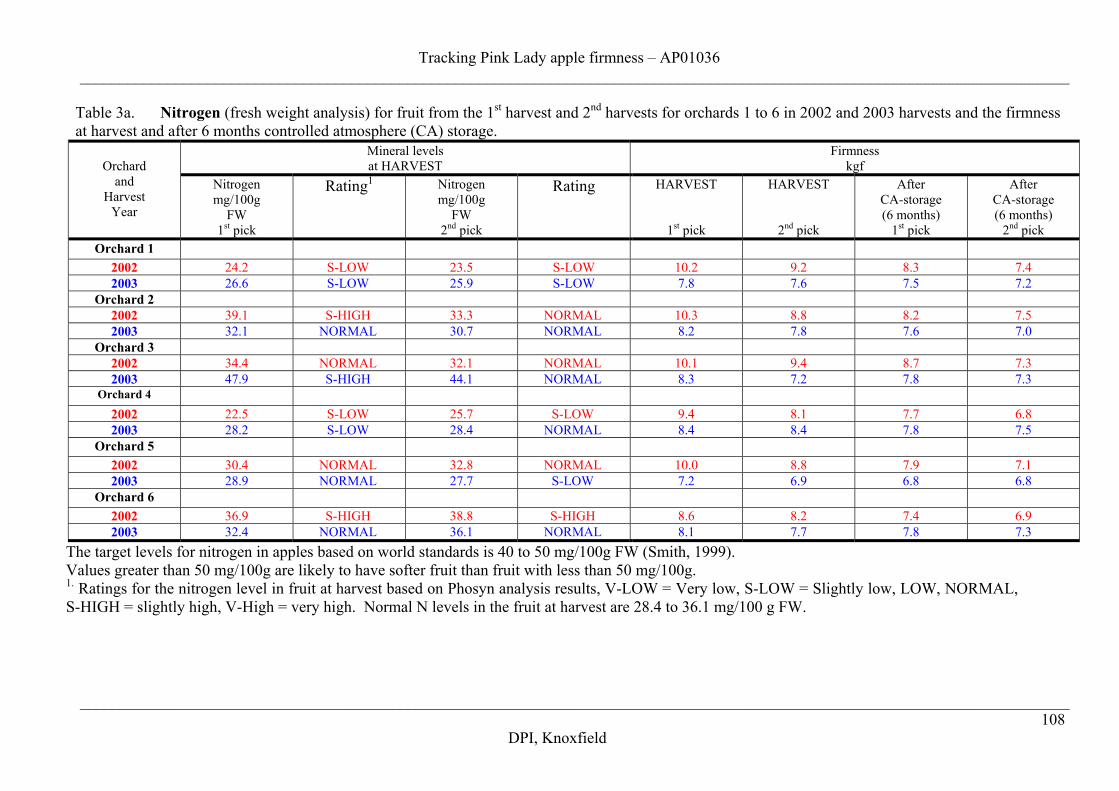
Tracking Pink Lady apple firmness – AP01036____________________________________________________________________________________________________________________________
____________________________________________________________________________________________________________________________108
DPI, Knoxfield
Table 3a. Nitrogen (fresh weight analysis) for fruit from the 1st harvest and 2nd harvests for orchards 1 to 6 in 2002 and 2003 harvests and the firmnessat harvest and after 6 months controlled atmosphere (CA) storage.
Mineral levelsat HARVEST
FirmnesskgfOrchard
andHarvest
Year
Nitrogenmg/100g
FW1st pick
Rating1 Nitrogenmg/100g
FW2nd pick
Rating HARVEST
1st pick
HARVEST
2nd pick
AfterCA-storage(6 months)
1st pick
AfterCA-storage(6 months)
2nd pickOrchard 1
2002 24.2 S-LOW 23.5 S-LOW 10.2 9.2 8.3 7.42003 26.6 S-LOW 25.9 S-LOW 7.8 7.6 7.5 7.2
Orchard 22002 39.1 S-HIGH 33.3 NORMAL 10.3 8.8 8.2 7.52003 32.1 NORMAL 30.7 NORMAL 8.2 7.8 7.6 7.0
Orchard 32002 34.4 NORMAL 32.1 NORMAL 10.1 9.4 8.7 7.32003 47.9 S-HIGH 44.1 NORMAL 8.3 7.2 7.8 7.3
Orchard 4
2002 22.5 S-LOW 25.7 S-LOW 9.4 8.1 7.7 6.82003 28.2 S-LOW 28.4 NORMAL 8.4 8.4 7.8 7.5
Orchard 52002 30.4 NORMAL 32.8 NORMAL 10.0 8.8 7.9 7.12003 28.9 NORMAL 27.7 S-LOW 7.2 6.9 6.8 6.8
Orchard 62002 36.9 S-HIGH 38.8 S-HIGH 8.6 8.2 7.4 6.92003 32.4 NORMAL 36.1 NORMAL 8.1 7.7 7.8 7.3
The target levels for nitrogen in apples based on world standards is 40 to 50 mg/100g FW (Smith, 1999).Values greater than 50 mg/100g are likely to have softer fruit than fruit with less than 50 mg/100g.1. Ratings for the nitrogen level in fruit at harvest based on Phosyn analysis results, V-LOW = Very low, S-LOW = Slightly low, LOW, NORMAL,S-HIGH = slightly high, V-High = very high. Normal N levels in the fruit at harvest are 28.4 to 36.1 mg/100 g FW.
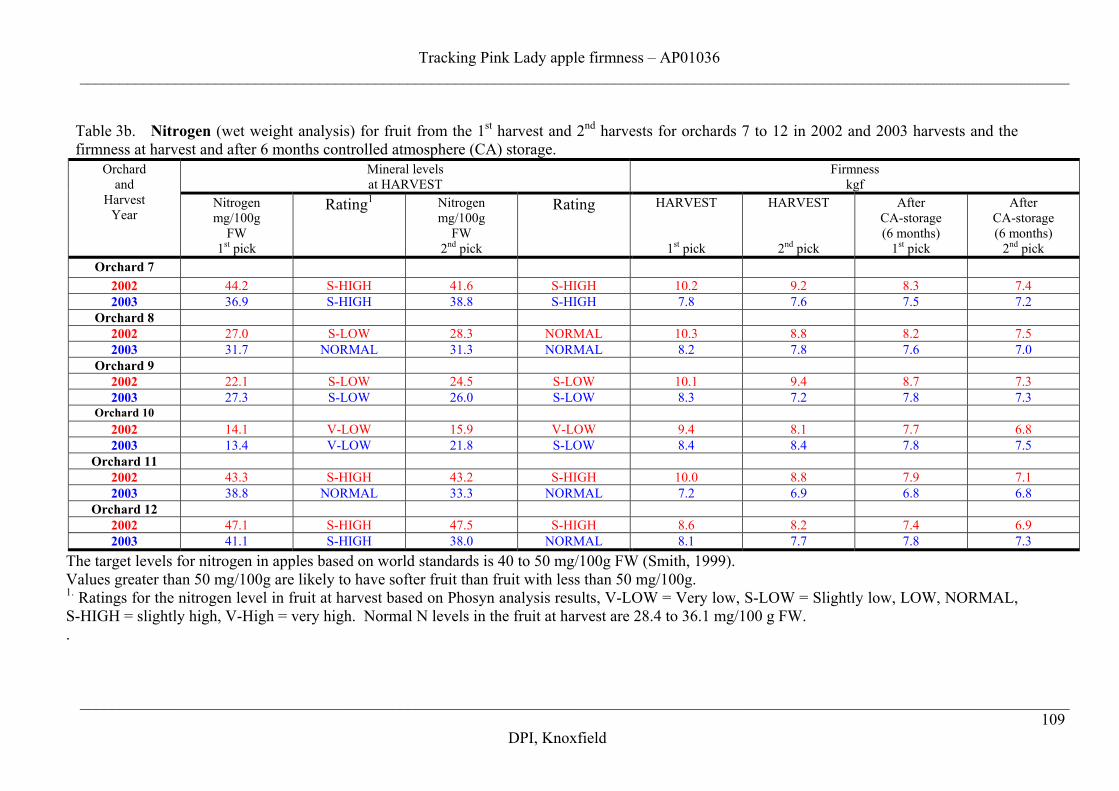
Tracking Pink Lady apple firmness – AP01036____________________________________________________________________________________________________________________________
____________________________________________________________________________________________________________________________109
DPI, Knoxfield
Table 3b. Nitrogen (wet weight analysis) for fruit from the 1st harvest and 2nd harvests for orchards 7 to 12 in 2002 and 2003 harvests and thefirmness at harvest and after 6 months controlled atmosphere (CA) storage.
Mineral levelsat HARVEST
Firmnesskgf
Orchardand
HarvestYear
Nitrogenmg/100g
FW1st pick
Rating1 Nitrogenmg/100g
FW2nd pick
Rating HARVEST
1st pick
HARVEST
2nd pick
AfterCA-storage(6 months)
1st pick
AfterCA-storage(6 months)
2nd pickOrchard 7
2002 44.2 S-HIGH 41.6 S-HIGH 10.2 9.2 8.3 7.42003 36.9 S-HIGH 38.8 S-HIGH 7.8 7.6 7.5 7.2
Orchard 82002 27.0 S-LOW 28.3 NORMAL 10.3 8.8 8.2 7.52003 31.7 NORMAL 31.3 NORMAL 8.2 7.8 7.6 7.0
Orchard 92002 22.1 S-LOW 24.5 S-LOW 10.1 9.4 8.7 7.32003 27.3 S-LOW 26.0 S-LOW 8.3 7.2 7.8 7.3
Orchard 102002 14.1 V-LOW 15.9 V-LOW 9.4 8.1 7.7 6.82003 13.4 V-LOW 21.8 S-LOW 8.4 8.4 7.8 7.5
Orchard 112002 43.3 S-HIGH 43.2 S-HIGH 10.0 8.8 7.9 7.12003 38.8 NORMAL 33.3 NORMAL 7.2 6.9 6.8 6.8
Orchard 122002 47.1 S-HIGH 47.5 S-HIGH 8.6 8.2 7.4 6.92003 41.1 S-HIGH 38.0 NORMAL 8.1 7.7 7.8 7.3
The target levels for nitrogen in apples based on world standards is 40 to 50 mg/100g FW (Smith, 1999).Values greater than 50 mg/100g are likely to have softer fruit than fruit with less than 50 mg/100g.1. Ratings for the nitrogen level in fruit at harvest based on Phosyn analysis results, V-LOW = Very low, S-LOW = Slightly low, LOW, NORMAL,S-HIGH = slightly high, V-High = very high. Normal N levels in the fruit at harvest are 28.4 to 36.1 mg/100 g FW..
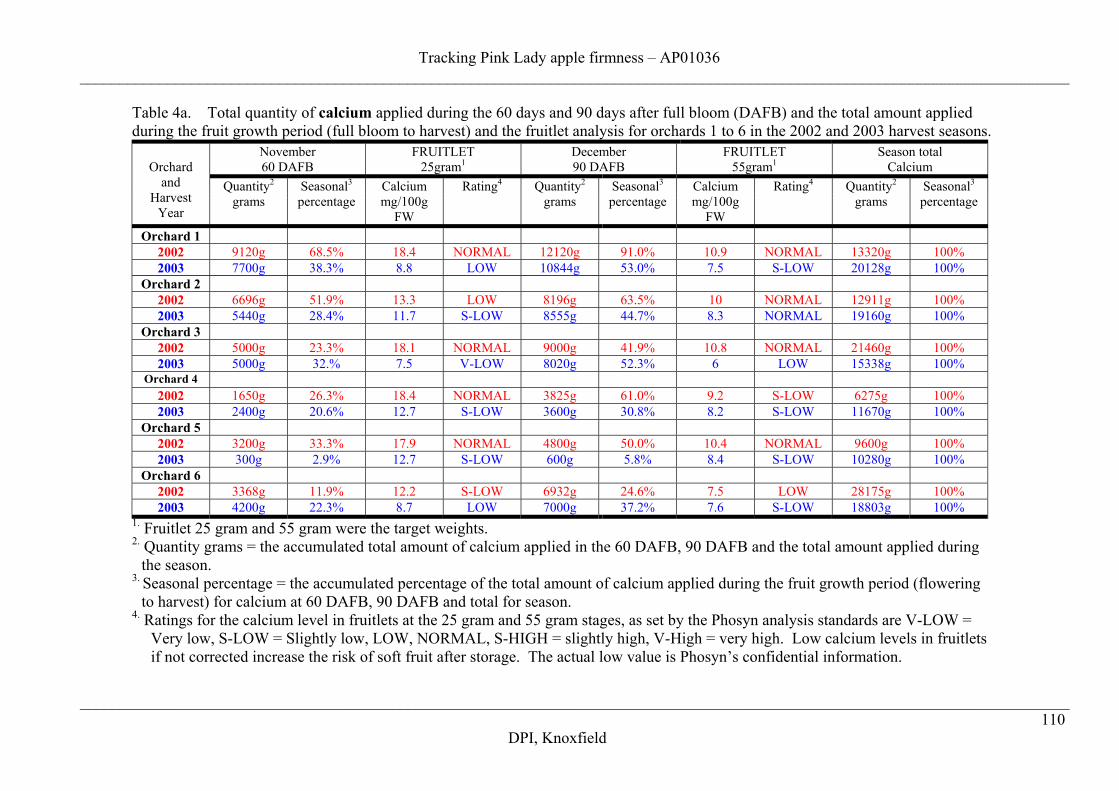
Tracking Pink Lady apple firmness – AP01036____________________________________________________________________________________________________________________________
____________________________________________________________________________________________________________________________110
DPI, Knoxfield
Table 4a. Total quantity of calcium applied during the 60 days and 90 days after full bloom (DAFB) and the total amount appliedduring the fruit growth period (full bloom to harvest) and the fruitlet analysis for orchards 1 to 6 in the 2002 and 2003 harvest seasons.
November60 DAFB
FRUITLET25gram1
December90 DAFB
FRUITLET55gram1
Season totalCalciumOrchard
andHarvest
Year
Quantity2
gramsSeasonal3
percentageCalciummg/100g
FW
Rating4 Quantity2
gramsSeasonal3
percentageCalciummg/100g
FW
Rating4 Quantity2
gramsSeasonal3
percentage
Orchard 12002 9120g 68.5% 18.4 NORMAL 12120g 91.0% 10.9 NORMAL 13320g 100%2003 7700g 38.3% 8.8 LOW 10844g 53.0% 7.5 S-LOW 20128g 100%
Orchard 22002 6696g 51.9% 13.3 LOW 8196g 63.5% 10 NORMAL 12911g 100%2003 5440g 28.4% 11.7 S-LOW 8555g 44.7% 8.3 NORMAL 19160g 100%
Orchard 32002 5000g 23.3% 18.1 NORMAL 9000g 41.9% 10.8 NORMAL 21460g 100%2003 5000g 32.% 7.5 V-LOW 8020g 52.3% 6 LOW 15338g 100%
Orchard 42002 1650g 26.3% 18.4 NORMAL 3825g 61.0% 9.2 S-LOW 6275g 100%2003 2400g 20.6% 12.7 S-LOW 3600g 30.8% 8.2 S-LOW 11670g 100%
Orchard 52002 3200g 33.3% 17.9 NORMAL 4800g 50.0% 10.4 NORMAL 9600g 100%2003 300g 2.9% 12.7 S-LOW 600g 5.8% 8.4 S-LOW 10280g 100%
Orchard 62002 3368g 11.9% 12.2 S-LOW 6932g 24.6% 7.5 LOW 28175g 100%2003 4200g 22.3% 8.7 LOW 7000g 37.2% 7.6 S-LOW 18803g 100%
1. Fruitlet 25 gram and 55 gram were the target weights.2. Quantity grams = the accumulated total amount of calcium applied in the 60 DAFB, 90 DAFB and the total amount applied during
the season.3. Seasonal percentage = the accumulated percentage of the total amount of calcium applied during the fruit growth period (flowering
to harvest) for calcium at 60 DAFB, 90 DAFB and total for season.4. Ratings for the calcium level in fruitlets at the 25 gram and 55 gram stages, as set by the Phosyn analysis standards are V-LOW =
Very low, S-LOW = Slightly low, LOW, NORMAL, S-HIGH = slightly high, V-High = very high. Low calcium levels in fruitletsif not corrected increase the risk of soft fruit after storage. The actual low value is Phosyn’s confidential information.
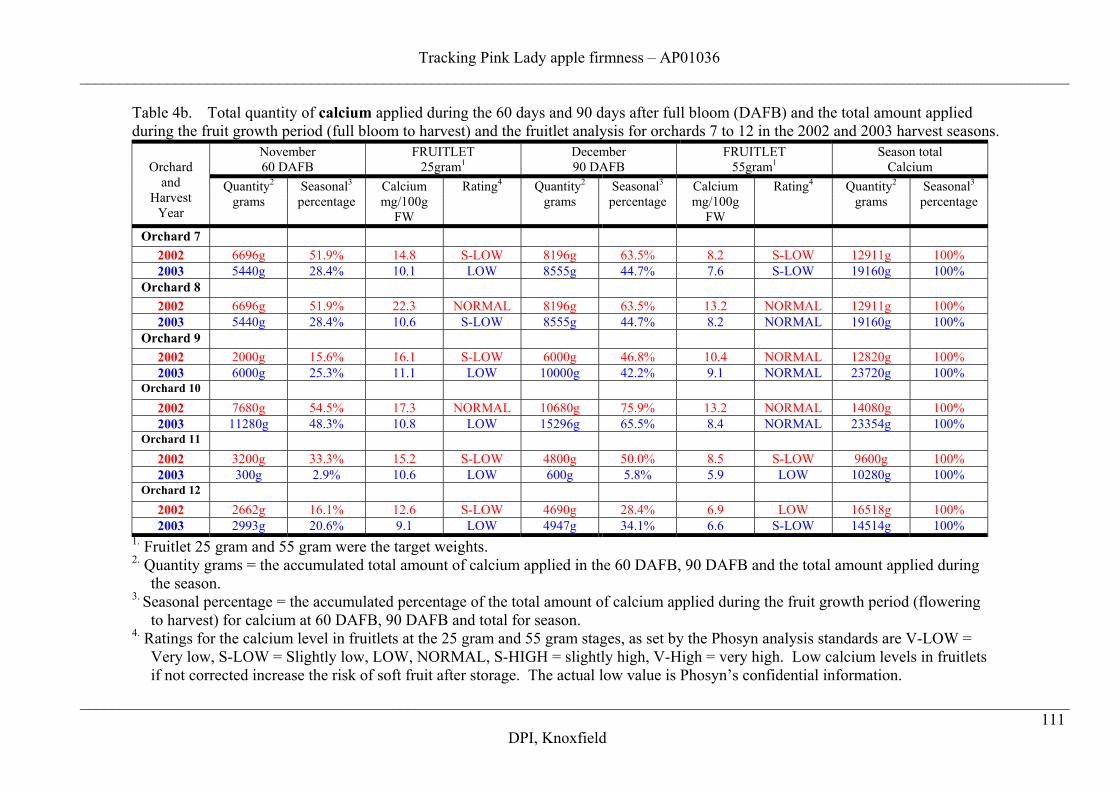
Tracking Pink Lady apple firmness – AP01036____________________________________________________________________________________________________________________________
____________________________________________________________________________________________________________________________111
DPI, Knoxfield
Table 4b. Total quantity of calcium applied during the 60 days and 90 days after full bloom (DAFB) and the total amount appliedduring the fruit growth period (full bloom to harvest) and the fruitlet analysis for orchards 7 to 12 in the 2002 and 2003 harvest seasons.
November60 DAFB
FRUITLET25gram1
December90 DAFB
FRUITLET55gram1
Season totalCalciumOrchard
andHarvest
Year
Quantity2
gramsSeasonal3
percentageCalciummg/100g
FW
Rating4 Quantity2
gramsSeasonal3
percentageCalciummg/100g
FW
Rating4 Quantity2
gramsSeasonal3
percentage
Orchard 72002 6696g 51.9% 14.8 S-LOW 8196g 63.5% 8.2 S-LOW 12911g 100%2003 5440g 28.4% 10.1 LOW 8555g 44.7% 7.6 S-LOW 19160g 100%
Orchard 82002 6696g 51.9% 22.3 NORMAL 8196g 63.5% 13.2 NORMAL 12911g 100%2003 5440g 28.4% 10.6 S-LOW 8555g 44.7% 8.2 NORMAL 19160g 100%
Orchard 92002 2000g 15.6% 16.1 S-LOW 6000g 46.8% 10.4 NORMAL 12820g 100%2003 6000g 25.3% 11.1 LOW 10000g 42.2% 9.1 NORMAL 23720g 100%
Orchard 10
2002 7680g 54.5% 17.3 NORMAL 10680g 75.9% 13.2 NORMAL 14080g 100%2003 11280g 48.3% 10.8 LOW 15296g 65.5% 8.4 NORMAL 23354g 100%
Orchard 11
2002 3200g 33.3% 15.2 S-LOW 4800g 50.0% 8.5 S-LOW 9600g 100%2003 300g 2.9% 10.6 LOW 600g 5.8% 5.9 LOW 10280g 100%
Orchard 12
2002 2662g 16.1% 12.6 S-LOW 4690g 28.4% 6.9 LOW 16518g 100%2003 2993g 20.6% 9.1 LOW 4947g 34.1% 6.6 S-LOW 14514g 100%
1. Fruitlet 25 gram and 55 gram were the target weights.2. Quantity grams = the accumulated total amount of calcium applied in the 60 DAFB, 90 DAFB and the total amount applied during
the season.3. Seasonal percentage = the accumulated percentage of the total amount of calcium applied during the fruit growth period (flowering
to harvest) for calcium at 60 DAFB, 90 DAFB and total for season.4. Ratings for the calcium level in fruitlets at the 25 gram and 55 gram stages, as set by the Phosyn analysis standards are V-LOW =
Very low, S-LOW = Slightly low, LOW, NORMAL, S-HIGH = slightly high, V-High = very high. Low calcium levels in fruitletsif not corrected increase the risk of soft fruit after storage. The actual low value is Phosyn’s confidential information.
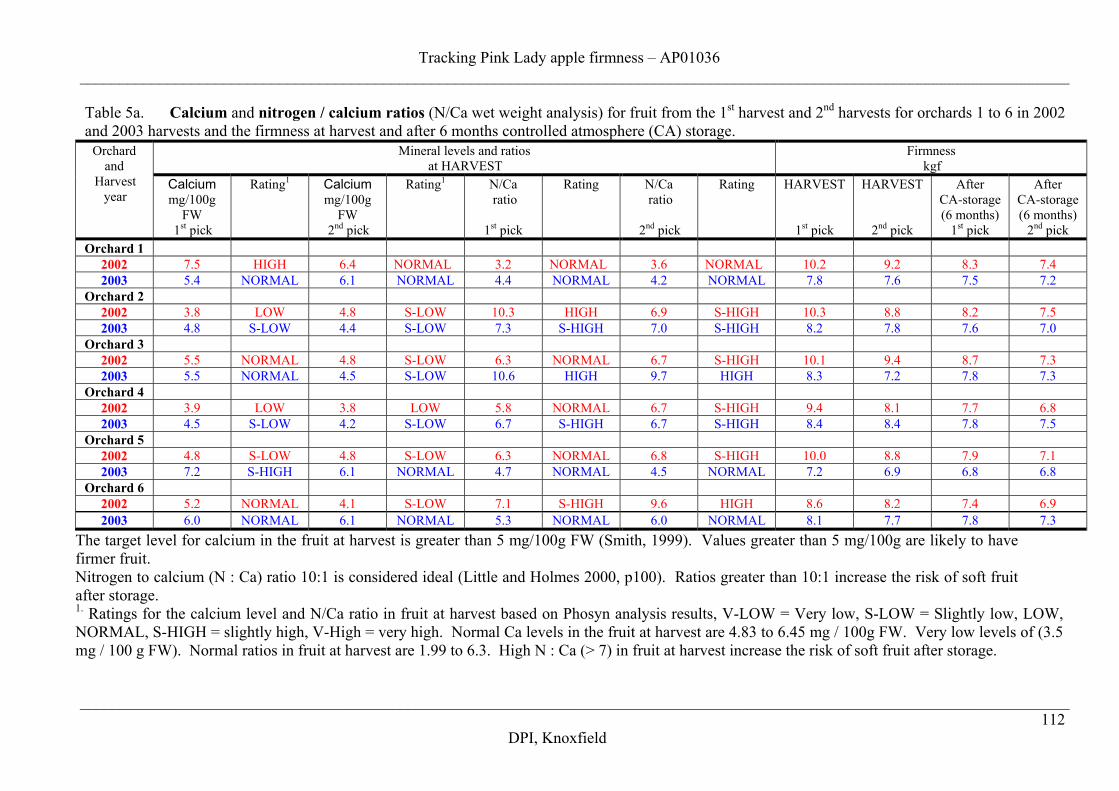
Tracking Pink Lady apple firmness – AP01036____________________________________________________________________________________________________________________________
____________________________________________________________________________________________________________________________112
DPI, Knoxfield
Table 5a. Calcium and nitrogen / calcium ratios (N/Ca wet weight analysis) for fruit from the 1st harvest and 2nd harvests for orchards 1 to 6 in 2002and 2003 harvests and the firmness at harvest and after 6 months controlled atmosphere (CA) storage.
Mineral levels and ratiosat HARVEST
Firmnesskgf
Orchardand
Harvestyear
Calciummg/100g
FW1st pick
Rating1 Calciummg/100g
FW2nd pick
Rating1 N/Ca ratio
1st pick
Rating N/Ca ratio
2nd pick
Rating HARVEST
1st pick
HARVEST
2nd pick
AfterCA-storage(6 months)
1st pick
AfterCA-storage(6 months)
2nd pickOrchard 1
2002 7.5 HIGH 6.4 NORMAL 3.2 NORMAL 3.6 NORMAL 10.2 9.2 8.3 7.42003 5.4 NORMAL 6.1 NORMAL 4.4 NORMAL 4.2 NORMAL 7.8 7.6 7.5 7.2
Orchard 22002 3.8 LOW 4.8 S-LOW 10.3 HIGH 6.9 S-HIGH 10.3 8.8 8.2 7.52003 4.8 S-LOW 4.4 S-LOW 7.3 S-HIGH 7.0 S-HIGH 8.2 7.8 7.6 7.0
Orchard 32002 5.5 NORMAL 4.8 S-LOW 6.3 NORMAL 6.7 S-HIGH 10.1 9.4 8.7 7.32003 5.5 NORMAL 4.5 S-LOW 10.6 HIGH 9.7 HIGH 8.3 7.2 7.8 7.3
Orchard 42002 3.9 LOW 3.8 LOW 5.8 NORMAL 6.7 S-HIGH 9.4 8.1 7.7 6.82003 4.5 S-LOW 4.2 S-LOW 6.7 S-HIGH 6.7 S-HIGH 8.4 8.4 7.8 7.5
Orchard 52002 4.8 S-LOW 4.8 S-LOW 6.3 NORMAL 6.8 S-HIGH 10.0 8.8 7.9 7.12003 7.2 S-HIGH 6.1 NORMAL 4.7 NORMAL 4.5 NORMAL 7.2 6.9 6.8 6.8
Orchard 62002 5.2 NORMAL 4.1 S-LOW 7.1 S-HIGH 9.6 HIGH 8.6 8.2 7.4 6.92003 6.0 NORMAL 6.1 NORMAL 5.3 NORMAL 6.0 NORMAL 8.1 7.7 7.8 7.3
The target level for calcium in the fruit at harvest is greater than 5 mg/100g FW (Smith, 1999). Values greater than 5 mg/100g are likely to havefirmer fruit.Nitrogen to calcium (N : Ca) ratio 10:1 is considered ideal (Little and Holmes 2000, p100). Ratios greater than 10:1 increase the risk of soft fruitafter storage.1. Ratings for the calcium level and N/Ca ratio in fruit at harvest based on Phosyn analysis results, V-LOW = Very low, S-LOW = Slightly low, LOW,NORMAL, S-HIGH = slightly high, V-High = very high. Normal Ca levels in the fruit at harvest are 4.83 to 6.45 mg / 100g FW. Very low levels of (3.5mg / 100 g FW). Normal ratios in fruit at harvest are 1.99 to 6.3. High N : Ca (> 7) in fruit at harvest increase the risk of soft fruit after storage.
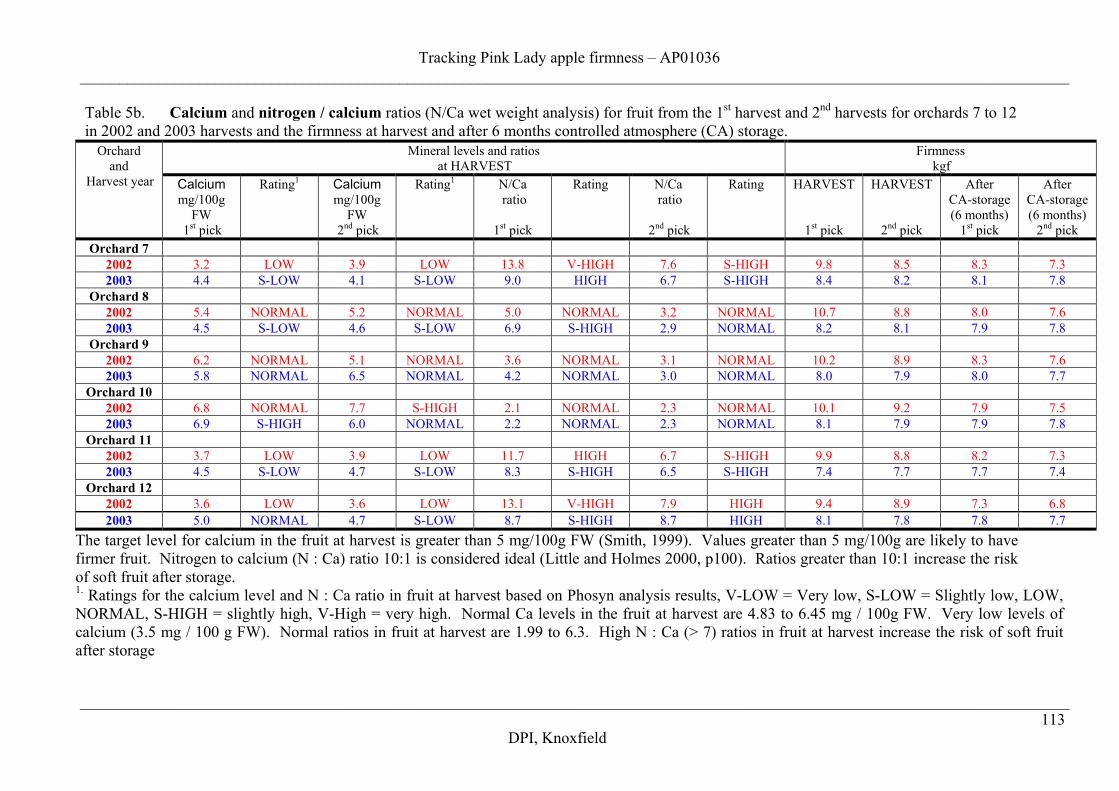
Tracking Pink Lady apple firmness – AP01036____________________________________________________________________________________________________________________________
____________________________________________________________________________________________________________________________113
DPI, Knoxfield
Table 5b. Calcium and nitrogen / calcium ratios (N/Ca wet weight analysis) for fruit from the 1st harvest and 2nd harvests for orchards 7 to 12in 2002 and 2003 harvests and the firmness at harvest and after 6 months controlled atmosphere (CA) storage.
Mineral levels and ratiosat HARVEST
Firmnesskgf
Orchardand
Harvest year Calciummg/100g
FW1st pick
Rating1 Calciummg/100g
FW2nd pick
Rating1 N/Ca ratio
1st pick
Rating N/Ca ratio
2nd pick
Rating HARVEST
1st pick
HARVEST
2nd pick
AfterCA-storage(6 months)
1st pick
AfterCA-storage(6 months)
2nd pickOrchard 7
2002 3.2 LOW 3.9 LOW 13.8 V-HIGH 7.6 S-HIGH 9.8 8.5 8.3 7.32003 4.4 S-LOW 4.1 S-LOW 9.0 HIGH 6.7 S-HIGH 8.4 8.2 8.1 7.8
Orchard 82002 5.4 NORMAL 5.2 NORMAL 5.0 NORMAL 3.2 NORMAL 10.7 8.8 8.0 7.62003 4.5 S-LOW 4.6 S-LOW 6.9 S-HIGH 2.9 NORMAL 8.2 8.1 7.9 7.8
Orchard 92002 6.2 NORMAL 5.1 NORMAL 3.6 NORMAL 3.1 NORMAL 10.2 8.9 8.3 7.62003 5.8 NORMAL 6.5 NORMAL 4.2 NORMAL 3.0 NORMAL 8.0 7.9 8.0 7.7
Orchard 102002 6.8 NORMAL 7.7 S-HIGH 2.1 NORMAL 2.3 NORMAL 10.1 9.2 7.9 7.52003 6.9 S-HIGH 6.0 NORMAL 2.2 NORMAL 2.3 NORMAL 8.1 7.9 7.9 7.8
Orchard 112002 3.7 LOW 3.9 LOW 11.7 HIGH 6.7 S-HIGH 9.9 8.8 8.2 7.32003 4.5 S-LOW 4.7 S-LOW 8.3 S-HIGH 6.5 S-HIGH 7.4 7.7 7.7 7.4
Orchard 122002 3.6 LOW 3.6 LOW 13.1 V-HIGH 7.9 HIGH 9.4 8.9 7.3 6.82003 5.0 NORMAL 4.7 S-LOW 8.7 S-HIGH 8.7 HIGH 8.1 7.8 7.8 7.7
The target level for calcium in the fruit at harvest is greater than 5 mg/100g FW (Smith, 1999). Values greater than 5 mg/100g are likely to havefirmer fruit. Nitrogen to calcium (N : Ca) ratio 10:1 is considered ideal (Little and Holmes 2000, p100). Ratios greater than 10:1 increase the riskof soft fruit after storage.1. Ratings for the calcium level and N : Ca ratio in fruit at harvest based on Phosyn analysis results, V-LOW = Very low, S-LOW = Slightly low, LOW,NORMAL, S-HIGH = slightly high, V-High = very high. Normal Ca levels in the fruit at harvest are 4.83 to 6.45 mg / 100g FW. Very low levels ofcalcium (3.5 mg / 100 g FW). Normal ratios in fruit at harvest are 1.99 to 6.3. High N : Ca (> 7) ratios in fruit at harvest increase the risk of soft fruitafter storage
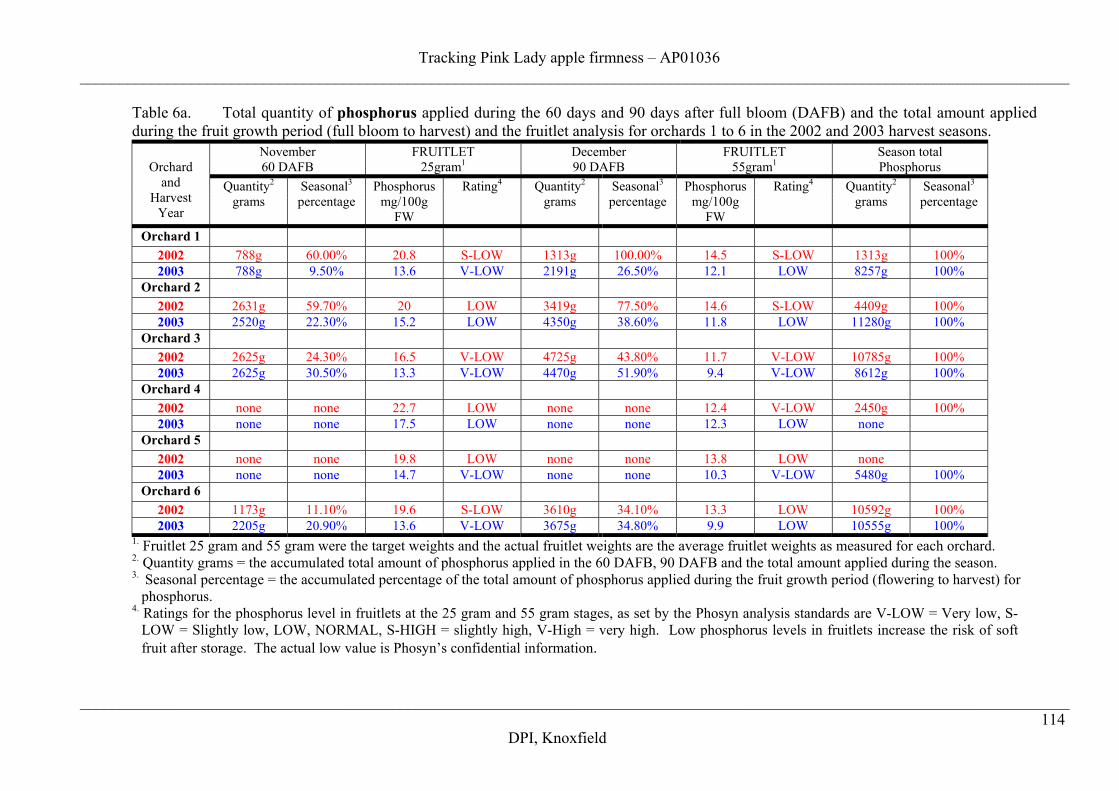
Tracking Pink Lady apple firmness – AP01036____________________________________________________________________________________________________________________________
____________________________________________________________________________________________________________________________114
DPI, Knoxfield
Table 6a. Total quantity of phosphorus applied during the 60 days and 90 days after full bloom (DAFB) and the total amount appliedduring the fruit growth period (full bloom to harvest) and the fruitlet analysis for orchards 1 to 6 in the 2002 and 2003 harvest seasons.
November60 DAFB
FRUITLET25gram1
December90 DAFB
FRUITLET55gram1
Season totalPhosphorusOrchard
andHarvest
Year
Quantity2
gramsSeasonal3
percentagePhosphorus
mg/100gFW
Rating4 Quantity2
gramsSeasonal3
percentagePhosphorus
mg/100gFW
Rating4 Quantity2
gramsSeasonal3
percentage
Orchard 12002 788g 60.00% 20.8 S-LOW 1313g 100.00% 14.5 S-LOW 1313g 100%2003 788g 9.50% 13.6 V-LOW 2191g 26.50% 12.1 LOW 8257g 100%
Orchard 22002 2631g 59.70% 20 LOW 3419g 77.50% 14.6 S-LOW 4409g 100%2003 2520g 22.30% 15.2 LOW 4350g 38.60% 11.8 LOW 11280g 100%
Orchard 32002 2625g 24.30% 16.5 V-LOW 4725g 43.80% 11.7 V-LOW 10785g 100%2003 2625g 30.50% 13.3 V-LOW 4470g 51.90% 9.4 V-LOW 8612g 100%
Orchard 42002 none none 22.7 LOW none none 12.4 V-LOW 2450g 100%2003 none none 17.5 LOW none none 12.3 LOW none
Orchard 52002 none none 19.8 LOW none none 13.8 LOW none2003 none none 14.7 V-LOW none none 10.3 V-LOW 5480g 100%
Orchard 62002 1173g 11.10% 19.6 S-LOW 3610g 34.10% 13.3 LOW 10592g 100%2003 2205g 20.90% 13.6 V-LOW 3675g 34.80% 9.9 LOW 10555g 100%
1. Fruitlet 25 gram and 55 gram were the target weights and the actual fruitlet weights are the average fruitlet weights as measured for each orchard.2. Quantity grams = the accumulated total amount of phosphorus applied in the 60 DAFB, 90 DAFB and the total amount applied during the season.3. Seasonal percentage = the accumulated percentage of the total amount of phosphorus applied during the fruit growth period (flowering to harvest) for
phosphorus.4. Ratings for the phosphorus level in fruitlets at the 25 gram and 55 gram stages, as set by the Phosyn analysis standards are V-LOW = Very low, S-
LOW = Slightly low, LOW, NORMAL, S-HIGH = slightly high, V-High = very high. Low phosphorus levels in fruitlets increase the risk of softfruit after storage. The actual low value is Phosyn’s confidential information.
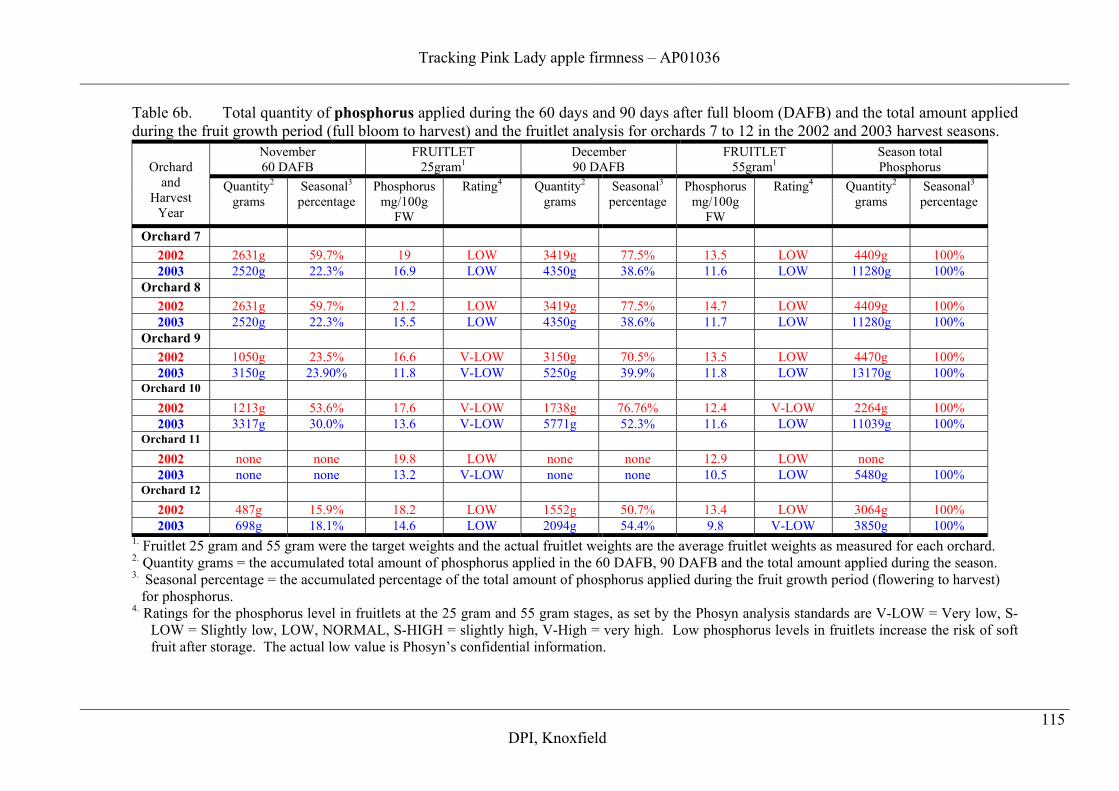
Tracking Pink Lady apple firmness – AP01036____________________________________________________________________________________________________________________________
____________________________________________________________________________________________________________________________115
DPI, Knoxfield
Table 6b. Total quantity of phosphorus applied during the 60 days and 90 days after full bloom (DAFB) and the total amount appliedduring the fruit growth period (full bloom to harvest) and the fruitlet analysis for orchards 7 to 12 in the 2002 and 2003 harvest seasons.
November60 DAFB
FRUITLET25gram1
December90 DAFB
FRUITLET55gram1
Season totalPhosphorusOrchard
andHarvest
Year
Quantity2
gramsSeasonal3
percentagePhosphorus
mg/100gFW
Rating4 Quantity2
gramsSeasonal3
percentagePhosphorus
mg/100gFW
Rating4 Quantity2
gramsSeasonal3
percentage
Orchard 72002 2631g 59.7% 19 LOW 3419g 77.5% 13.5 LOW 4409g 100%2003 2520g 22.3% 16.9 LOW 4350g 38.6% 11.6 LOW 11280g 100%
Orchard 82002 2631g 59.7% 21.2 LOW 3419g 77.5% 14.7 LOW 4409g 100%2003 2520g 22.3% 15.5 LOW 4350g 38.6% 11.7 LOW 11280g 100%
Orchard 92002 1050g 23.5% 16.6 V-LOW 3150g 70.5% 13.5 LOW 4470g 100%2003 3150g 23.90% 11.8 V-LOW 5250g 39.9% 11.8 LOW 13170g 100%
Orchard 10
2002 1213g 53.6% 17.6 V-LOW 1738g 76.76% 12.4 V-LOW 2264g 100%2003 3317g 30.0% 13.6 V-LOW 5771g 52.3% 11.6 LOW 11039g 100%
Orchard 11
2002 none none 19.8 LOW none none 12.9 LOW none2003 none none 13.2 V-LOW none none 10.5 LOW 5480g 100%
Orchard 12
2002 487g 15.9% 18.2 LOW 1552g 50.7% 13.4 LOW 3064g 100%2003 698g 18.1% 14.6 LOW 2094g 54.4% 9.8 V-LOW 3850g 100%
1. Fruitlet 25 gram and 55 gram were the target weights and the actual fruitlet weights are the average fruitlet weights as measured for each orchard.2. Quantity grams = the accumulated total amount of phosphorus applied in the 60 DAFB, 90 DAFB and the total amount applied during the season.3. Seasonal percentage = the accumulated percentage of the total amount of phosphorus applied during the fruit growth period (flowering to harvest)
for phosphorus.4. Ratings for the phosphorus level in fruitlets at the 25 gram and 55 gram stages, as set by the Phosyn analysis standards are V-LOW = Very low, S-
LOW = Slightly low, LOW, NORMAL, S-HIGH = slightly high, V-High = very high. Low phosphorus levels in fruitlets increase the risk of softfruit after storage. The actual low value is Phosyn’s confidential information.
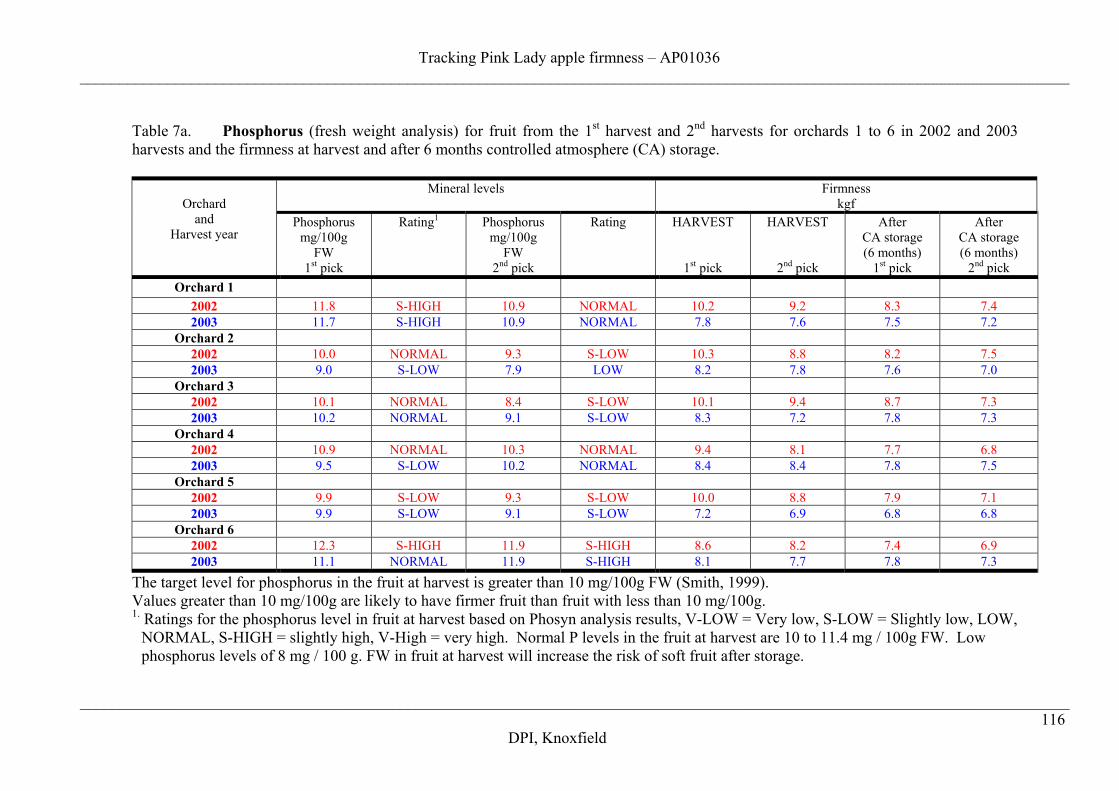
Tracking Pink Lady apple firmness – AP01036____________________________________________________________________________________________________________________________
____________________________________________________________________________________________________________________________116
DPI, Knoxfield
Table 7a. Phosphorus (fresh weight analysis) for fruit from the 1st harvest and 2nd harvests for orchards 1 to 6 in 2002 and 2003harvests and the firmness at harvest and after 6 months controlled atmosphere (CA) storage.
Mineral levels FirmnesskgfOrchard
andHarvest year
Phosphorusmg/100g
FW1st pick
Rating1 Phosphorusmg/100g
FW2nd pick
Rating HARVEST
1st pick
HARVEST
2nd pick
AfterCA storage(6 months)
1st pick
AfterCA storage(6 months)
2nd pickOrchard 1
2002 11.8 S-HIGH 10.9 NORMAL 10.2 9.2 8.3 7.42003 11.7 S-HIGH 10.9 NORMAL 7.8 7.6 7.5 7.2
Orchard 22002 10.0 NORMAL 9.3 S-LOW 10.3 8.8 8.2 7.52003 9.0 S-LOW 7.9 LOW 8.2 7.8 7.6 7.0
Orchard 32002 10.1 NORMAL 8.4 S-LOW 10.1 9.4 8.7 7.32003 10.2 NORMAL 9.1 S-LOW 8.3 7.2 7.8 7.3
Orchard 42002 10.9 NORMAL 10.3 NORMAL 9.4 8.1 7.7 6.82003 9.5 S-LOW 10.2 NORMAL 8.4 8.4 7.8 7.5
Orchard 52002 9.9 S-LOW 9.3 S-LOW 10.0 8.8 7.9 7.12003 9.9 S-LOW 9.1 S-LOW 7.2 6.9 6.8 6.8
Orchard 62002 12.3 S-HIGH 11.9 S-HIGH 8.6 8.2 7.4 6.92003 11.1 NORMAL 11.9 S-HIGH 8.1 7.7 7.8 7.3
The target level for phosphorus in the fruit at harvest is greater than 10 mg/100g FW (Smith, 1999).Values greater than 10 mg/100g are likely to have firmer fruit than fruit with less than 10 mg/100g.1. Ratings for the phosphorus level in fruit at harvest based on Phosyn analysis results, V-LOW = Very low, S-LOW = Slightly low, LOW,
NORMAL, S-HIGH = slightly high, V-High = very high. Normal P levels in the fruit at harvest are 10 to 11.4 mg / 100g FW. Lowphosphorus levels of 8 mg / 100 g. FW in fruit at harvest will increase the risk of soft fruit after storage.
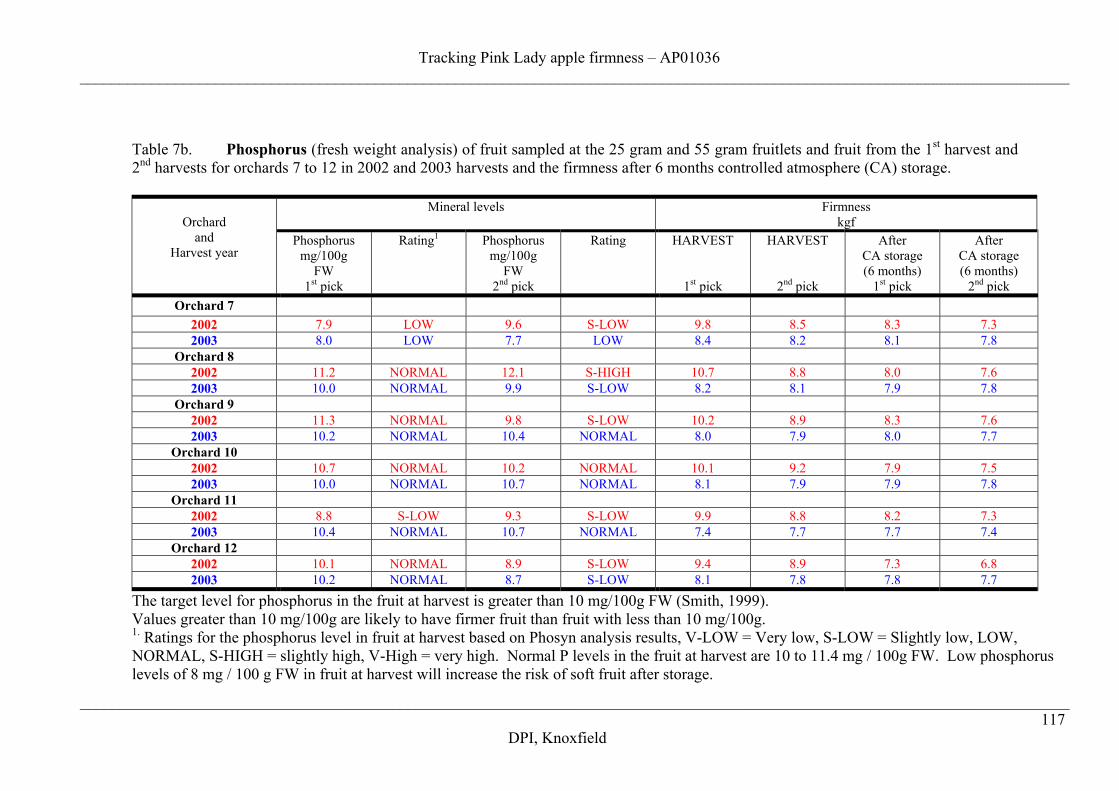
Tracking Pink Lady apple firmness – AP01036____________________________________________________________________________________________________________________________
____________________________________________________________________________________________________________________________117
DPI, Knoxfield
Table 7b. Phosphorus (fresh weight analysis) of fruit sampled at the 25 gram and 55 gram fruitlets and fruit from the 1st harvest and2nd harvests for orchards 7 to 12 in 2002 and 2003 harvests and the firmness after 6 months controlled atmosphere (CA) storage.
Mineral levels FirmnesskgfOrchard
andHarvest year
Phosphorusmg/100g
FW1st pick
Rating1 Phosphorusmg/100g
FW2nd pick
Rating HARVEST
1st pick
HARVEST
2nd pick
AfterCA storage(6 months)
1st pick
AfterCA storage(6 months)
2nd pickOrchard 7
2002 7.9 LOW 9.6 S-LOW 9.8 8.5 8.3 7.32003 8.0 LOW 7.7 LOW 8.4 8.2 8.1 7.8
Orchard 82002 11.2 NORMAL 12.1 S-HIGH 10.7 8.8 8.0 7.62003 10.0 NORMAL 9.9 S-LOW 8.2 8.1 7.9 7.8
Orchard 92002 11.3 NORMAL 9.8 S-LOW 10.2 8.9 8.3 7.62003 10.2 NORMAL 10.4 NORMAL 8.0 7.9 8.0 7.7
Orchard 102002 10.7 NORMAL 10.2 NORMAL 10.1 9.2 7.9 7.52003 10.0 NORMAL 10.7 NORMAL 8.1 7.9 7.9 7.8
Orchard 112002 8.8 S-LOW 9.3 S-LOW 9.9 8.8 8.2 7.32003 10.4 NORMAL 10.7 NORMAL 7.4 7.7 7.7 7.4
Orchard 122002 10.1 NORMAL 8.9 S-LOW 9.4 8.9 7.3 6.82003 10.2 NORMAL 8.7 S-LOW 8.1 7.8 7.8 7.7
The target level for phosphorus in the fruit at harvest is greater than 10 mg/100g FW (Smith, 1999).Values greater than 10 mg/100g are likely to have firmer fruit than fruit with less than 10 mg/100g.1. Ratings for the phosphorus level in fruit at harvest based on Phosyn analysis results, V-LOW = Very low, S-LOW = Slightly low, LOW,NORMAL, S-HIGH = slightly high, V-High = very high. Normal P levels in the fruit at harvest are 10 to 11.4 mg / 100g FW. Low phosphoruslevels of 8 mg / 100 g FW in fruit at harvest will increase the risk of soft fruit after storage.
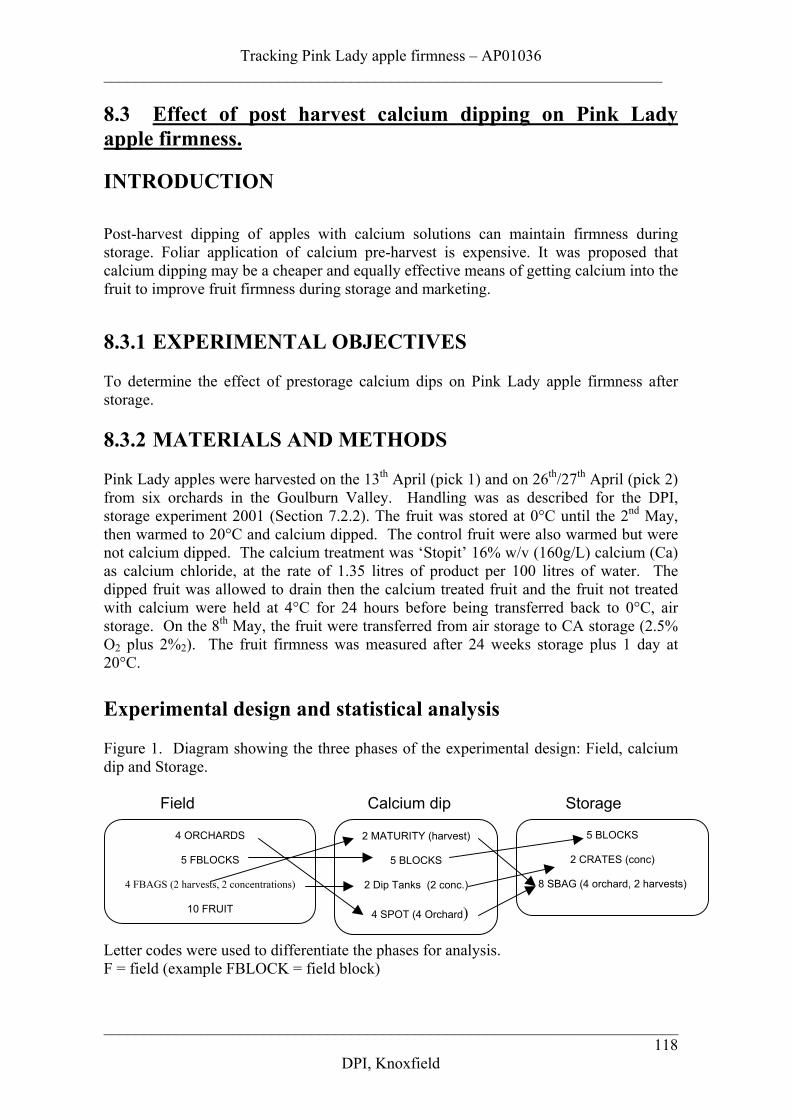
Tracking Pink Lady apple firmness – AP01036______________________________________________________________________
________________________________________________________________________118
DPI, Knoxfield
8.3 Effect of post harvest calcium dipping on Pink Ladyapple firmness.
INTRODUCTION
Post-harvest dipping of apples with calcium solutions can maintain firmness duringstorage. Foliar application of calcium pre-harvest is expensive. It was proposed thatcalcium dipping may be a cheaper and equally effective means of getting calcium into thefruit to improve fruit firmness during storage and marketing.
8.3.1 EXPERIMENTAL OBJECTIVES
To determine the effect of prestorage calcium dips on Pink Lady apple firmness afterstorage.
8.3.2 MATERIALS AND METHODS
Pink Lady apples were harvested on the 13th April (pick 1) and on 26th/27th April (pick 2)from six orchards in the Goulburn Valley. Handling was as described for the DPI,storage experiment 2001 (Section 7.2.2). The fruit was stored at 0°C until the 2nd May,then warmed to 20°C and calcium dipped. The control fruit were also warmed but werenot calcium dipped. The calcium treatment was ‘Stopit’ 16% w/v (160g/L) calcium (Ca)as calcium chloride, at the rate of 1.35 litres of product per 100 litres of water. Thedipped fruit was allowed to drain then the calcium treated fruit and the fruit not treatedwith calcium were held at 4°C for 24 hours before being transferred back to 0°C, airstorage. On the 8th May, the fruit were transferred from air storage to CA storage (2.5%O2 plus 2%2). The fruit firmness was measured after 24 weeks storage plus 1 day at20°C.
Experimental design and statistical analysis
Figure 1. Diagram showing the three phases of the experimental design: Field, calciumdip and Storage.
Field Calcium dip Storage
Letter codes were used to differentiate the phases for analysis.F = field (example FBLOCK = field block)
4 ORCHARDS
5 FBLOCKS
4 FBAGS (2 harvests, 2 concentrations)
10 FRUIT
2 MATURITY (harvest)
5 BLOCKS
2 Dip Tanks (2 conc.)
4 SPOT (4 Orchard)
5 BLOCKS
2 CRATES (conc)
8 SBAG (4 orchard, 2 harvests)
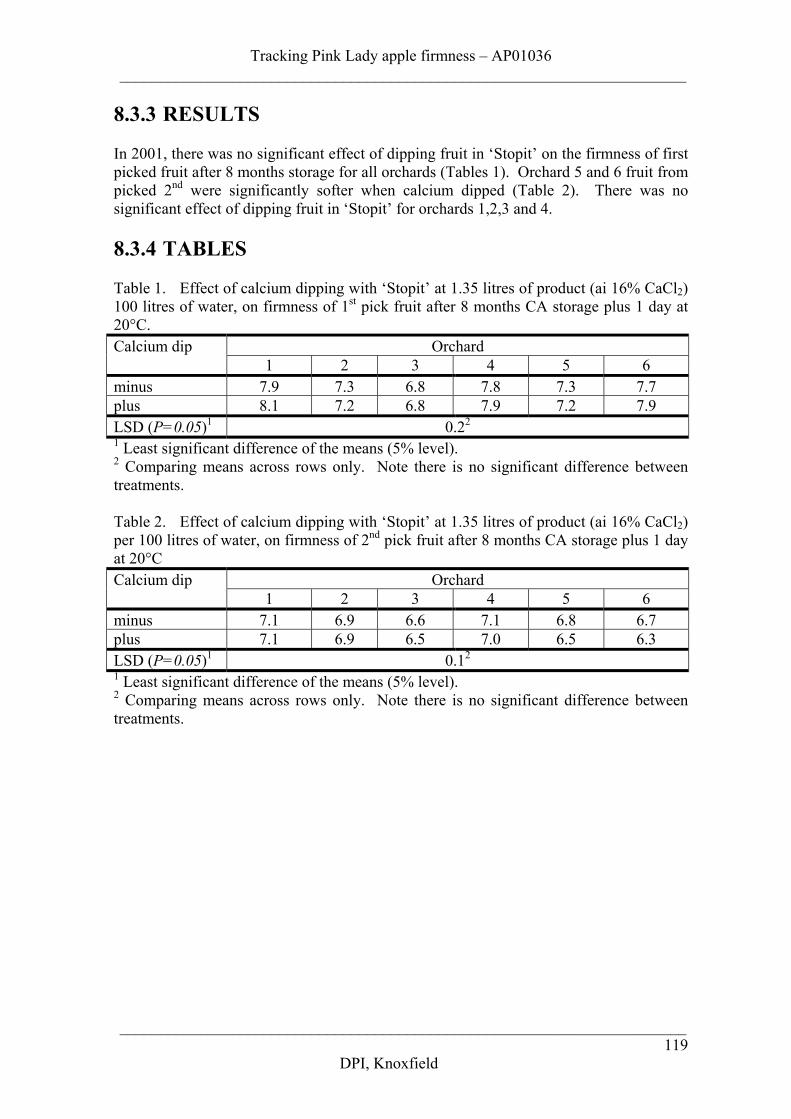
Tracking Pink Lady apple firmness – AP01036_______________________________________________________________________
_______________________________________________________________________
DPI, Knoxfield119
8.3.3 RESULTS
In 2001, there was no significant effect of dipping fruit in ‘Stopit’ on the firmness of firstpicked fruit after 8 months storage for all orchards (Tables 1). Orchard 5 and 6 fruit frompicked 2nd were significantly softer when calcium dipped (Table 2). There was nosignificant effect of dipping fruit in ‘Stopit’ for orchards 1,2,3 and 4.
8.3.4 TABLES
Table 1. Effect of calcium dipping with ‘Stopit’ at 1.35 litres of product (ai 16% CaCl2)100 litres of water, on firmness of 1st pick fruit after 8 months CA storage plus 1 day at20°C.
OrchardCalcium dip1 2 3 4 5 6
minus 7.9 7.3 6.8 7.8 7.3 7.7plus 8.1 7.2 6.8 7.9 7.2 7.9LSD (P=0.05)1 0.22
1 Least significant difference of the means (5% level).2 Comparing means across rows only. Note there is no significant difference betweentreatments.
Table 2. Effect of calcium dipping with ‘Stopit’ at 1.35 litres of product (ai 16% CaCl2)per 100 litres of water, on firmness of 2nd pick fruit after 8 months CA storage plus 1 dayat 20°C
OrchardCalcium dip1 2 3 4 5 6
minus 7.1 6.9 6.6 7.1 6.8 6.7plus 7.1 6.9 6.5 7.0 6.5 6.3LSD (P=0.05)1 0.12
1 Least significant difference of the means (5% level).2 Comparing means across rows only. Note there is no significant difference betweentreatments.
Tracking Pink Lady apple firmness – AP01036________________________________________________________________________
________________________________________________________________________
DPI, Knoxfield120
9. EFFECT OF CROP LOAD AND TREE VIGOURON PINK LADY APPLE FIRMNESS.
INTRODUCTIONLarge fruit tend to be softer than smaller fruit (Blanpied et al. 1978). However, Johnsonfound that early thinning during cell division that is between 5 and 15 days after fullbloom results in larger fruit that are firmer (Johnson, 1992). Therefore, it may be anover-simplification to focus on fruit size in relation to fruit firmness.
Fruit with large cells and larger intercellular spaces are generally considered to haveweaker tissue than fruits with smaller cells and smaller intercellular spaces (Harker et al.1997).
The influence of crop load on firmness cannot be solely explained by difference in fruitsize. Firmness is generally higher in fruit from low crop loads. The time that trees arethinned can also have an influence on firmness (Harker et al. 2000)
Crop load is a major factor in the evenness of maturity. Light crops differ markedly inmaturity and storage potential (Penn State College of Agricultural Sciences, 2003).
Tree vigour is related to tree pruning and rootstocks. If the tree canopy is too vigorous,the vegetative growth will draw nutrients away from the fruit and over-shading willresult, which will lead to fruit colouring problems, which in turn will result in the fruitbeing harvested over-mature which can result in softer fruit.
In this project crop load and tree vigour was measured at each orchard. The effects ofcrop load and tree vigour on Pink Lady apple firmness are presented as follows.
9.1 EXPERIMENTAL OBJECTIVESTo determine if there were major differences in crop load and tree vigour betweenorchards and whether this affected fruit firmness after storage.
9.1.2 MATERIALS AND METHODSSeason 2001On the 18th January 2001 the crop load of trees from six orchards in the Goulburn Valleywas measured after completion of hand thinning. Crop load is the number of fruit pertree divided by the butt circumference. Five trees were measured and the crop loads wereaveraged to give an estimate of the orchard crop load.
Crop load scoring for Pink Lady (Colin Little). Total number of fruit on the tree dividedby the butt circumference.1-2 = very light, 2-4 light crop, 4-6 light to moderate crop, 6-8moderate crop, 8-10 moderate to optimal, 10 –12 optimal for maximum term storage and>12 too heavy (Possible size reduction and risk of reduced return crop unless Nitrogen,Boron, Magnesium, Zinc and Phosphorus is applied as a foliar immediately post harvestand again at green tip).
No tree vigour was measured in 2001 season.
Tracking Pink Lady apple firmness – AP01036_______________________________________________________________________
_______________________________________________________________________
DPI, Knoxfield121
Season 2002On the 14th and 15th January 2001 the crop load of trees from six orchards in theGoulburn Valley was measured after completion of hand thinning.
Tree vigour was measured on the 6th December 2001 and was recorded as the averagelength of five new terminal shoots (Plate 1).
Season 2003Due to drought and severe heat conditions in the Goulburn Valley in the period 26December to 28 February, most orchards reduced crop loads by a second hand thinningduring January. On January 13th and 14th the crop loads were measured.
Tree vigour was measured on the 17th to 18th December 2002. Five new shoots weremeasured on five trees to give an estimate of orchard tree vigour. There are no standardsfor this type of measurement.
9.1.3 RESULTSSeason 2001
Crop loadIn 2001, there was a large range of crop loads between orchards. Orchards 1, 4 and 12were carrying optimum crop loads for long term storage (Table 1). Orchards 3 and 5were carrying moderate to optimal crop loads and orchard 2 had a moderate crop load.
Tree vigourTree vigour was not measured in 2001 season. However, there was considerablevariation in the tree canopy density between orchards as demonstrated for orchards 4 and6 (Plate 2).
Season 2002
Crop loadIn 2002, orchards 6 and 10 had optimum crop loads for long term storage, orchards 4, 5,7 and 12 had moderate crop loads and orchards 1, 2 and 3 had light to moderate croploads (Table 1).
Tree vigourOrchards 1, 2, 3, 5, 8, 9, 10, 11 and 12 had similar new shoot growth and the trees werefairly well settled-down. Orchard 4 was treated with Cultar® a growth retardant whichreduced tree vigour. Orchards 6 and 7 had excessive growth (Table 2). It was observedthat orchards 4, 5 and 7 had the poorest fruit red colour development.
Season 2003
Crop loadIn 2003, orchards 1, 10 and 11 had optimum crop loads for long term storage, orchards 5,6 and 12 had moderate crop loads, orchards 2,8,9, and 11 had light to moderate croploads and 3 and 7 had light crop loads (Table 1).
Tree VigourIn a drought year, new shoot growth was generally less than the previous year. Orchards6 and 7 growth had reduced vigour compared to the 2002 season growth (Table 2).
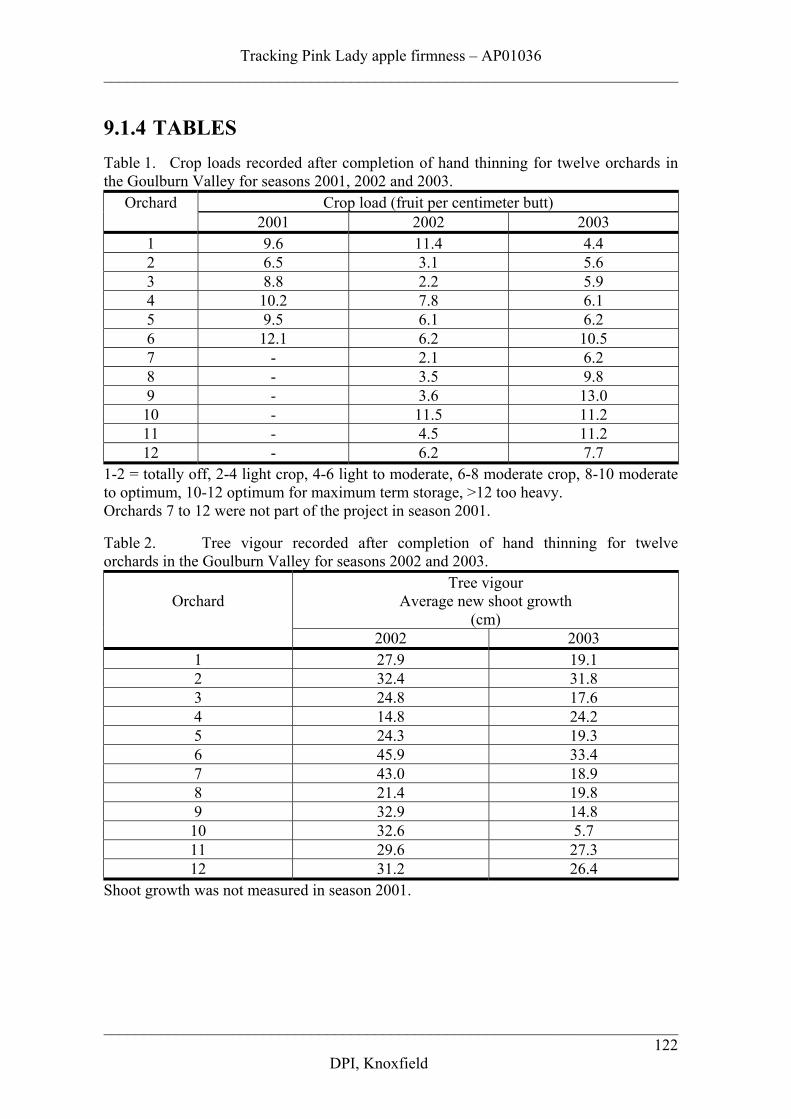
Tracking Pink Lady apple firmness – AP01036________________________________________________________________________
________________________________________________________________________
DPI, Knoxfield122
9.1.4 TABLESTable 1. Crop loads recorded after completion of hand thinning for twelve orchards inthe Goulburn Valley for seasons 2001, 2002 and 2003.
Crop load (fruit per centimeter butt)Orchard2001 2002 2003
1 9.6 11.4 4.42 6.5 3.1 5.63 8.8 2.2 5.94 10.2 7.8 6.15 9.5 6.1 6.26 12.1 6.2 10.57 - 2.1 6.28 - 3.5 9.89 - 3.6 13.010 - 11.5 11.211 - 4.5 11.212 - 6.2 7.7
1-2 = totally off, 2-4 light crop, 4-6 light to moderate, 6-8 moderate crop, 8-10 moderateto optimum, 10-12 optimum for maximum term storage, >12 too heavy.Orchards 7 to 12 were not part of the project in season 2001.
Table 2. Tree vigour recorded after completion of hand thinning for twelveorchards in the Goulburn Valley for seasons 2002 and 2003.
Tree vigourAverage new shoot growth
(cm)Orchard
2002 20031 27.9 19.12 32.4 31.83 24.8 17.64 14.8 24.25 24.3 19.36 45.9 33.47 43.0 18.98 21.4 19.89 32.9 14.810 32.6 5.711 29.6 27.312 31.2 26.4
Shoot growth was not measured in season 2001.
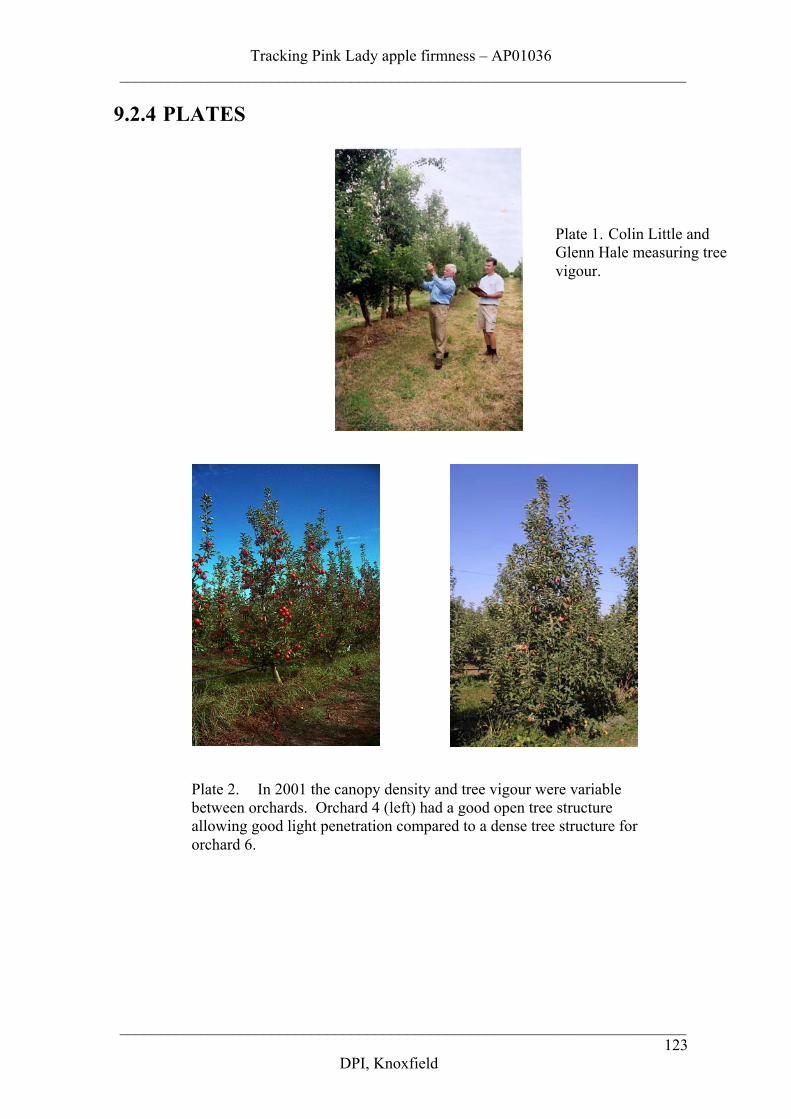
Tracking Pink Lady apple firmness – AP01036_______________________________________________________________________
_______________________________________________________________________
DPI, Knoxfield123
9.2.4 PLATES
Plate 1. Colin Little andGlenn Hale measuring treevigour.
Plate 2. In 2001 the canopy density and tree vigour were variablebetween orchards. Orchard 4 (left) had a good open tree structureallowing good light penetration compared to a dense tree structure fororchard 6.
Tracking Pink Lady apple firmness – AP01036________________________________________________________________________
________________________________________________________________________
DPI, Knoxfield124
10. WEATHER
10.1 Weather literature review
Many studies have described how apple firmness can vary between seasons, betweenorchards and between regions (Knee and Smith, 1989, Watkins, 1993). Weatherconditions at blossom time affect the uniformity of maturity within the tree. Most pomefruit mature with better quality if the maximum daytime temperatures are not too extreme(Little and Holmes 2000, p104). Wide variations between daytime maximum and nighttime minimum with many sunshine hours favour even maturation, high sugar levels,excellent red colour development and good storage characteristics (Little and Holmes2000, p106). Changing temperatures, rainfall patterns and dull weather tend to favourwider variability and non-uniform maturity within a tree canopy. Flowering can occurover several weeks’ especially during cooler weather favouring variable maturity atharvest.
Stanley et al. (2000) reported that the potential maximum fruit size is set by about 50days after pollenation (DAP) and this is determined by total cell fruit number, resultingfrom a temperature – responsive cell division growth phase. There are suggestions thathigher temperatures shorten the cell division phase, giving the fruit fewer, larger cells.After the period of cell division there is a second phase of cell expansion that is alsotemperature dependent. Warrington et al. (1999) found that fruit expansion rates werehighly responsive to temperature. Temperatures in the period from 30 to 40 days afterfull bloom (DAFB) are most critical in determining harvest maturity (Warrington et al.1999). Cell size and number directly influence fruit firmness at harvest. Warringtonconcluded that cell size and number directly influenced fruit firmness. This is consistentwith the observation that increased cell division, stimulated by the application ofbenzyladenine, resulted in enhanced firmness (Wismer et al. 1995).
The vegetative phase has finished by mid-December in the Goulburn Valley when celldivision has ceased (Little and Holmes 2000, p.62).
A number of studies have shown a strong positive correlation between temperaturesimmediately following bloom in the field and fruit size at harvest (Warrington et al.1999). The apple fruit grows in two district phases: an exponential phase of cell divisionthat typically lasts for approximately 35 to 45 days after anthesis, followed by aexpansion phase for the remainder of the season until commercial maturity.
The time that fruit reach optimum harvest maturity in commercial apple orchards can beinfluenced by a number of factors including bloom date and the climate, for exampletemperature, that prevail during fruit development. Some studies have determined a highcorrelation between accumulated heat units and the time interval between bloom andoptimum harvest. Kronenburg (1988) found that the conditions prevailing during thefirst month after flowering had the greatest impact on harvest date. Warrington et al.(1999) found that starch index was higher (ie starch hydrolysis was more advanced), fleshfirmness lower, and background colour more yellow under warmer than under coolermaximum/minimum temperature conditions.
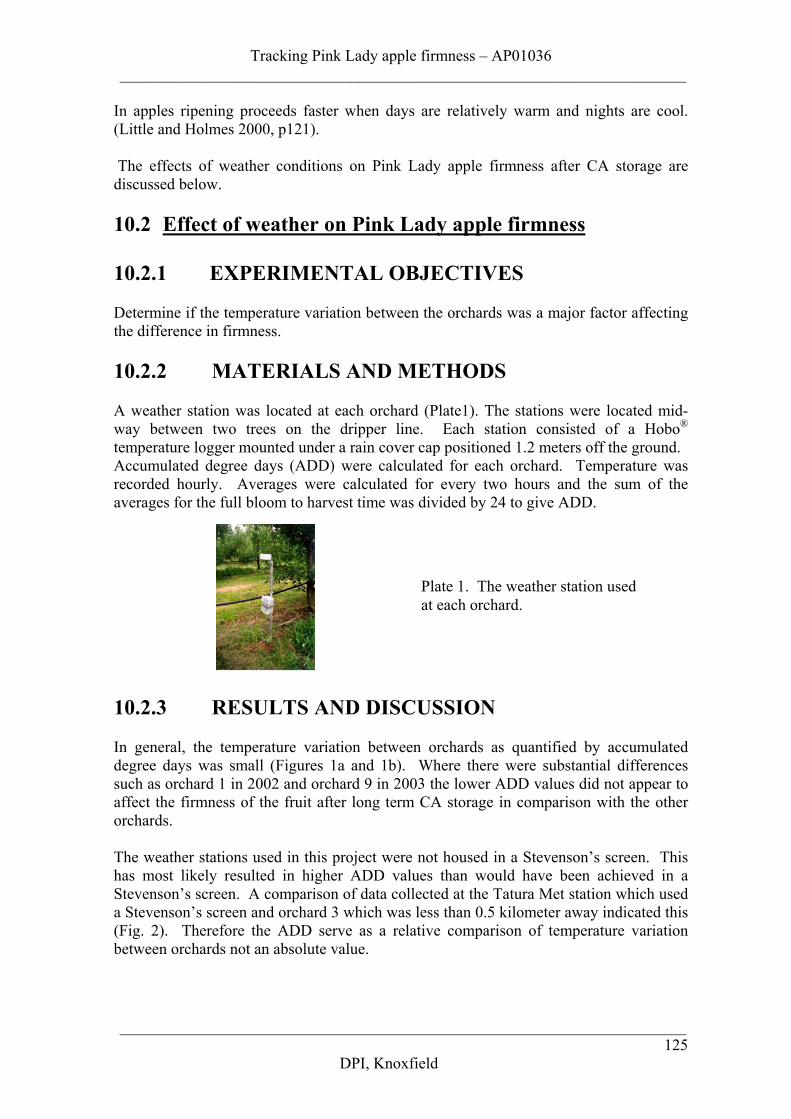
Tracking Pink Lady apple firmness – AP01036_______________________________________________________________________
_______________________________________________________________________
DPI, Knoxfield125
In apples ripening proceeds faster when days are relatively warm and nights are cool.(Little and Holmes 2000, p121).
The effects of weather conditions on Pink Lady apple firmness after CA storage arediscussed below.
10.2 Effect of weather on Pink Lady apple firmness
10.2.1 EXPERIMENTAL OBJECTIVES
Determine if the temperature variation between the orchards was a major factor affectingthe difference in firmness.
10.2.2 MATERIALS AND METHODS
A weather station was located at each orchard (Plate1). The stations were located mid-way between two trees on the dripper line. Each station consisted of a Hobo®
temperature logger mounted under a rain cover cap positioned 1.2 meters off the ground.Accumulated degree days (ADD) were calculated for each orchard. Temperature wasrecorded hourly. Averages were calculated for every two hours and the sum of theaverages for the full bloom to harvest time was divided by 24 to give ADD.
10.2.3 RESULTS AND DISCUSSION
In general, the temperature variation between orchards as quantified by accumulateddegree days was small (Figures 1a and 1b). Where there were substantial differencessuch as orchard 1 in 2002 and orchard 9 in 2003 the lower ADD values did not appear toaffect the firmness of the fruit after long term CA storage in comparison with the otherorchards.
The weather stations used in this project were not housed in a Stevenson’s screen. Thishas most likely resulted in higher ADD values than would have been achieved in aStevenson’s screen. A comparison of data collected at the Tatura Met station which useda Stevenson’s screen and orchard 3 which was less than 0.5 kilometer away indicated this(Fig. 2). Therefore the ADD serve as a relative comparison of temperature variationbetween orchards not an absolute value.
Plate 1. The weather station usedat each orchard.
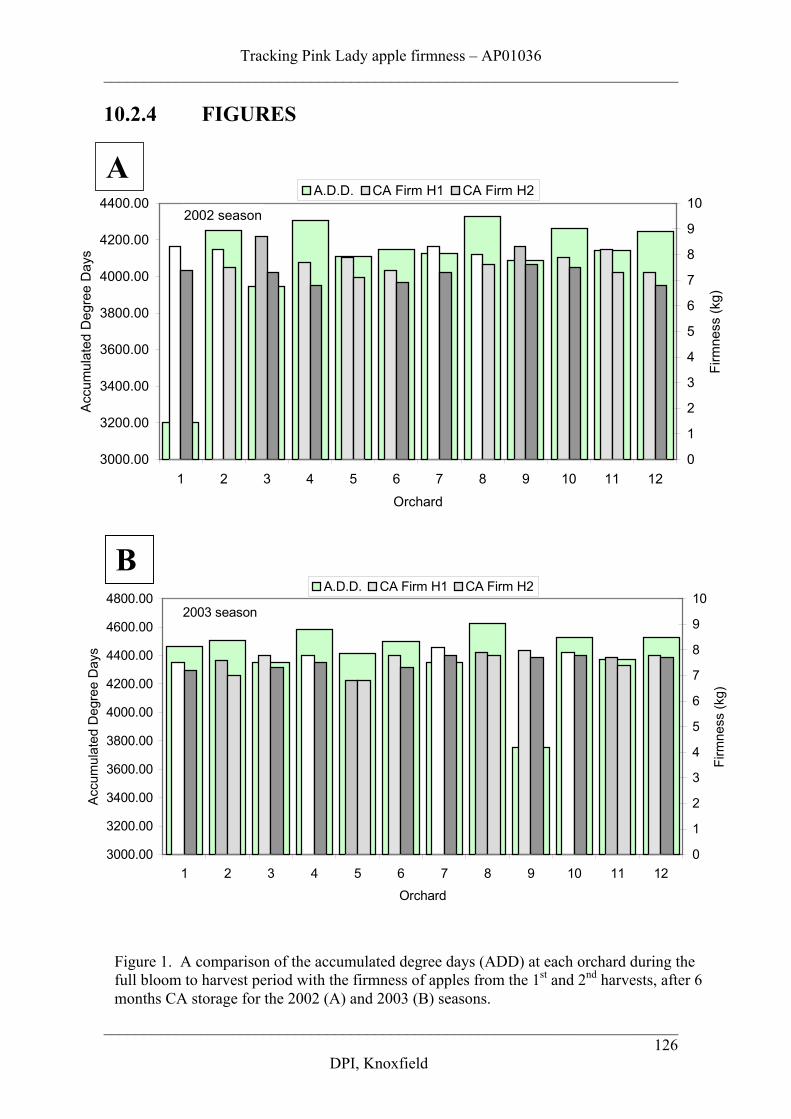
Tracking Pink Lady apple firmness – AP01036________________________________________________________________________
________________________________________________________________________
DPI, Knoxfield126
10.2.4 FIGURES
Figure 1. A comparison of the accumulated degree days (ADD) at each orchard during thefull bloom to harvest period with the firmness of apples from the 1st and 2nd harvests, after 6months CA storage for the 2002 (A) and 2003 (B) seasons.
3000.00
3200.00
3400.00
3600.00
3800.00
4000.00
4200.00
4400.00
1 2 3 4 5 6 7 8 9 10 11 12
Orchard
Acc
umul
ated
Deg
ree
Day
s
0
1
2
3
4
5
6
7
8
9
102002 season
Firm
ness
(kg)
A.D.D. CA Firm H1 CA Firm H2
3000.00
3200.00
3400.00
3600.00
3800.00
4000.00
4200.00
4400.00
4600.00
4800.00
1 2 3 4 5 6 7 8 9 10 11 12
Orchard
Acc
umul
ated
Deg
ree
Day
s
0
1
2
3
4
5
6
7
8
9
102003 season
Firm
ness
(kg)
A.D.D. CA Firm H1 CA Firm H2
A
B
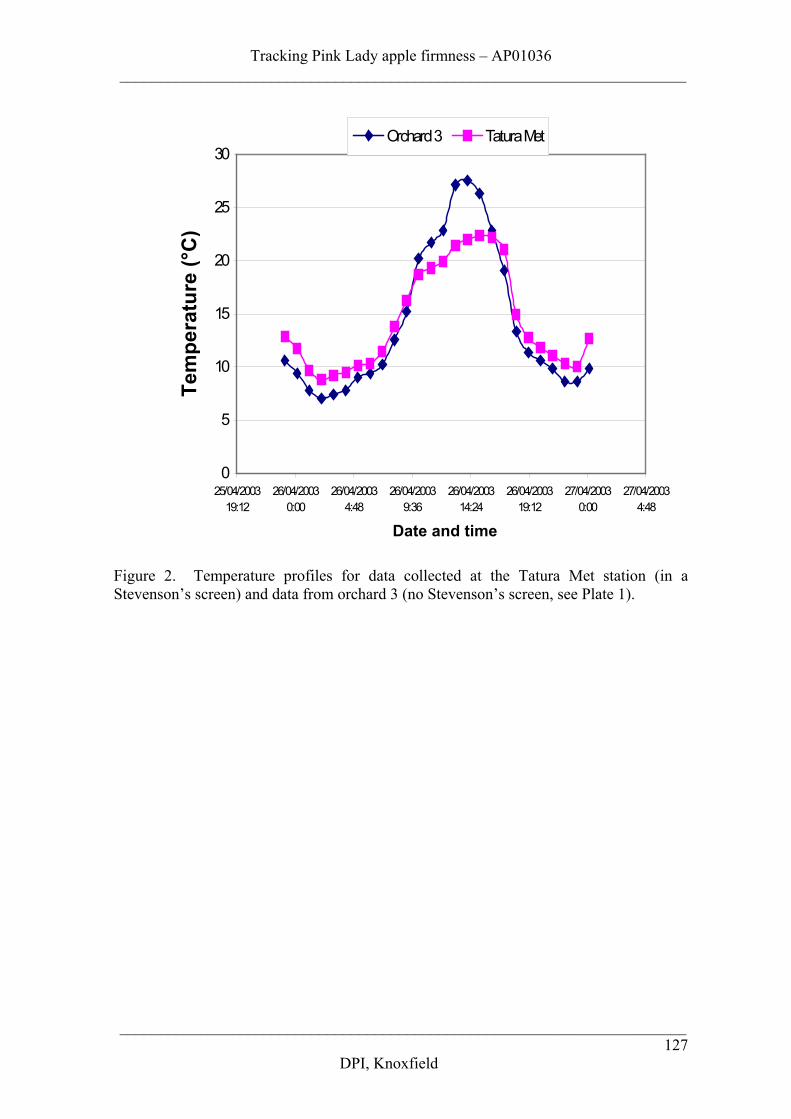
Tracking Pink Lady apple firmness – AP01036_______________________________________________________________________
_______________________________________________________________________
DPI, Knoxfield127
Figure 2. Temperature profiles for data collected at the Tatura Met station (in aStevenson’s screen) and data from orchard 3 (no Stevenson’s screen, see Plate 1).
0
5
10
15
20
25
30
25/04/200319:12
26/04/20030:00
26/04/20034:48
26/04/20039:36
26/04/200314:24
26/04/200319:12
27/04/20030:00
27/04/20034:48
Tem
pera
ture
(°C
)
Orchard 3 Tatura Met
Date and time
Tracking Pink Lady apple firmness – AP01036________________________________________________________________________
________________________________________________________________________
DPI, Knoxfield128
11. ROOTSTOCK AND GROWTH RETARDATIONMETHODS EFFECTS ON FIRMNESS ANDINTERNAL BROWNING
11.1 Literature review
The major purposes of rootstocks for apples are to control tree size, induce precocity,improve yield, provide soil adaptation and combat various soil-borne pests and diseases(Elfving, 1987). Castle, 1995 published an excellent review entitled “ Rootstocks as afactor in citrus and deciduous tree crop”. In the review, apple rootstocks are purported toaffect fruit quality, but much of the work is criticised because of a limited number ofrootstocks, too few years of study and failing to account for confounding factors such ascrop load, canopy management and environmental factors (Autio 1987, 1991).
Red colour development of Pink Lady apples in the Goulburn Valley can be a problemfor some growers. The market demands in 2001 was for Pink Lady apples to have 60%blush. This meant for some orchards the maturity at harvest was well past optimummaturity for long term storage (export). In 2004, the colour specification for Pink Ladyapples on the domestic market was lowered in line with the export specification of 45 to50% blush.
Red colour is based on the amount of the plant pigment called ‘anthocyanins’. Good redcolour depends on degradation of chlorophyll and increase in anthocyanins (Kupferman,2002b).
The critical colouring period is two to three weeks before harvest. The optimumtemperature for red colour formation varies among cultivars but generally between 20° -25°C with cool night temperatures less than 18°C (Gurnsey and Lawes, 1999). However,if cool night temperatures, are followed by excessive (greater than 30°C) daytimetemperatures, the positive effects on anthocyanin synthesis will be negated. Light levelsare also an important factor in anthocyanin synthesis. Apples require a minimum of 50 %full sunlight on fruits and leaves in order to achieve adequate red colour. Pink Ladyrequires both cold and warmth with high sunshine hours as fruit approaches harvest.
Seniphos (Phosyn) is a mineral mixture (high in phosphorus) which is applied 2-3 weeksbefore commercial harvest. Seniphos may improve colour in apples by increasing theactivity of phenylalanine-ammonia-lyase enzyme (PAL) which is a determining factor ofcolour enhancement (Larrigaudiere et al. 1996). Seniphos helps to increase fruitphosphorus level that may enhance colour development and firmness.
Reflective mulches placed on the ground between tree rows have been used to increasered colour. Products like Extenday improve fruit colour by increasing light interceptionand distribution back into the tree. Similarly, spray on reflective blankets called Sun-Brite can double the amount of light penetration into the tree canopy.
Regalis (prohexadione-Ca) is a growth regulator for use on pome fruit crops. It inhibitsthe growth hormone gibberellins (Roemmelt et al. 2003). As a result longitudinal shootgrowth is reduced.
Tracking Pink Lady apple firmness – AP01036_______________________________________________________________________
_______________________________________________________________________
DPI, Knoxfield129
Internal browning also referred to as flesh browning is sporadic in nature and occurs inair and CA storage. The disorder seems to be the result of a combination of factors thathave been implicated in other storage disorders of apples.
Internal browning was observed at DPI, Knoxfield in 2000 when assessing fruit as part ofthe Victorian State Government export initiative project Apple ExpHort 2000. In 2000,the symptoms were senescent-like, refereed to as FB type one (see Section 11.3.2 Plate1a). In 2001, apples were shipped to the UK, where again FB-type 1 was observed butonly in a few growers’ fruit. As fruit from the 6 growers were stored in the same CA tent(2.5% O2 plus 1% CO2) this result suggests that the fruit are pre-conditioned to thedisorder prior to storage. In 2002, the fruit had a different type of browning radial-like,refereed to as FB-type 2 (see Section 11.2.3 Plate 1b). Fruit from 12 orchards in theGoulburn Valley were treated with or without the ethylene action inhibitor SmartFreshTM
at harvest and stored for 6 months in CA. When the fruit was assessed for FB somegrowers’ fruit had severe FB-type 2 while other had none. A severity rating scale wascreated and used to assess the fruit (see Section 11.2.2 Plate 2). There was no significanteffect of SmartFreshTM on the incidence and severity of FB-type2.
Flesh browning occurs in more mature Pink Lady apples on fruit trees with high nitrogenand low calcium levels. When the crop load is heavy and there is a large temperaturedifferential at harvest between day and night, the risk of the disorder increases(Kupferman, 2002).
In 2000, Dr Gordon Brown submitted a proposal to Horticulture Australia Limited toinvestigate the effects of seasonality, rootstocks, maturity, and growth control methodson the storage life and flesh browning of Pink Lady apples. HAL made a decision toincorporate Gordon’s proposal into the ‘Tracking Pink Lady apple firmness project AP 01036’ (see Section 11.2).
Minimising internal browning in ‘Pink Lady apples’________________________________________________________________________
_________________________________________________________________________130
Scientific Horticulture P/L
11.2 Minimising internal browning in Pink Lady apples-Scientific Horticulture project
Gordon S. Brown, Lisa J. Schimanski and David Jennings
SummaryThe ‘Pink Lady’ cultivar was bred in Australia and released in 1991. The first knownoccurrence of internal browning of controlled atmosphere (CA) stored fruit was recognisedin September 2000. It first appeared in Tasmania, and has since also been recognised inmany other regions of Australia and overseas (New Zealand, France, Italy, UnitedKingdom, U.S.A, and South America). The problem appears to be region and growerspecific. The economic effects of internal browning in ‘Pink Lady’ apples not only resultin direct losses incurred by post-harvest operators and marketers, but also the flow-oneffects of loss of market confidence, and hence lower prices for the commodity, bothnationally and internationally.
A survey conducted by the authors in 2001 identified that fruit with internal browning wasmore often associated with orchards on dwarfing rootstocks and/or with severe growthcontrol practices. There was also a suggestion that fruit maturity may be important. Theaim of the research reported here was to ascertain the validity of these associations.
The results of this research showed that, i) seasonal variations strongly influence theincidence of internal browning in Tasmanian ‘Pink Lady’ apples; ii) the more dwarfing therootstock, the greater the incidence of internal browning and although, rootstock does notaffect fruit quality at harvest; there are indications that it will influence fruit metabolism;iii) the occurrence of root disease increases the incidence of internal browning in the fruit;iv) maturity is a key factor in the expression of the disorder, suggesting that this is a formof senescent breakdown.
Minimising internal browning in ‘Pink Lady apples’________________________________________________________________________
________________________________________________________________________131
Scientific Horticulture P/L
IntroductionThere are two major types of internal browning in ‘Pink Lady’ apples; diffuse and radialbrowning. Diffuse internal browning in ‘Pink Lady’ apples is located in the outer cortex ofthe fruit flesh, and initially the symptoms appeared as a slight grey colour that is barelyvisible. Radial internal browning occurs along the vascular traces radiating out from thecortex. Discolouration of the fruit flesh occurs in other apple cultivars, such as ‘Braeburn’apples, where browning is the result of elevated CO2 in the flesh of the fruit, this may beassociated with the high fruit density and skin resistance (Rajapakse et al. 1990).Sensitivity to high CO2 also causes flesh discolouration in ‘Fuji’ apples (Volz et al. 1998).However, in Tasmania the discolouration noted in the ‘Pink Lady’ cultivar was not in thecore region, and was not associated with high CO2 levels in storage indicating that this wasnot CO2 injury during storage. The symptoms were also inconsistent with other commonlyencountered forms of internal breakdown.
An extensive survey of fruit quality, storage conditions and orchard practices wasconducted by Brown and Schimanski (2001) on 13 lines of Tasmanian ‘Pink Lady’ apples,and four lines of fruit from Western Australian orchards. This survey identified thataffected fruit tended to; (i) be stored at lower CO2 and O2 levels (1.3% CO2 and 2.0% O2)than unaffected fruit (2.0% CO2 and 2.5% O2), (ii) have a higher firmness, (iii) be higher inzinc (commonly due to foliar zinc sprays), (iv) originated from dwarfing rootstocks, (v)were from trees where active growth control, such as cincturing and summer pruning, werepractised.
Rootstocks have been noted to have a large influence on fruit quality in other cultivars.For example, ‘Granny Smith’ apples on M26 (dwarfing) rootstocks produce fruit with ahigh firmness, soluble solids (TSS), Calcium content and early maturity, conversely thiscultivar was greener on M111 and seedling (Drake et al. 1991).
The aim of this investigation was to provide industry with some tools to reduce theincidence of internal browning for long stored fruit, by identifying the effect of seasonality,rootstock, root disease, maturity, and growth control methods on the incidence of internalbrowning.
Minimising internal browning in ‘Pink Lady apples’________________________________________________________________________
_________________________________________________________________________132
Scientific Horticulture P/L
Method
SeasonalityAn assessment of the incidence of internal browning on an annual basis has beenconducted from 1999-2003. These values were calculated on the average of internalbrowning for several growers through southern Tasmania.
Rootstocks trialSeason 2001Trial site - This trial was conducted at the Grove Research Station in the Huon Valley ofTasmania (Australia) on five year old trees that were grafted as single tree plots, onto‘MM106’, ‘MM106/9’ interstem, ‘M26’ and ‘Ottawa 3’ abbreviation ‘O3’. Rootstockabbreviation are Merton Malling ‘MM’ series and the Malling series ‘M’. The trial wascomposed of 8 replicates in a randomised complete block design, although due to rootdisease the trial was reduced to 5 replicates.Harvest assessments - Approximately 50 fruit per plot were harvested 1 week prior tocommercial harvest, at commercial harvest (23 April 2001) and 1 week after commercialharvest. At harvest, three fruit from each plot were pooled by rootstock and assessed forweight, firmness, total soluble solids (TSS) and starch. Firmness was measured using acomputer controlled fruit penetrometer (11 mm probe, skin removed) which also measureddiameter and obtained a sample of juice for the analysis of TSS. TSS was assessed using adigital refractometer. Starch was measured by cutting the fruit in half transversely andplacing one cut side face down in iodine for approximately 10 seconds. The percentage ofstarch blackening was visually assessed and random samples verified with image analysis.At the time of final harvest, the unharvested fruit were counted and the trunk crosssectional areas measured. The results for each harvest were averaged across therootstocks.Storage assessments - The fruit were stored at 0.5° C in air until the final harvest, thenplaced in a commercial controlled atmosphere (CA) storeroom (1.0% CO2, 2.2% O2 and0.5° C). After four months, the fruit were removed and placed into a 5° C refrigeratedcontainer for seven weeks to simulate poor shipping conditions to Europe. Twenty fruitfrom each plot were assessed for weight, firmness, diameter, TSS (all measured asdescribed above) and internal CO2 and O2. Internal CO2 and O2 were assessed by placing ahypodermic needle into the cavity of the apple and withdrawing a 1 ml sample of air. Thisair was pooled from all 20 fruit per plot and then injected through a modified BesselingAgri-technic B.V. portable duo O2 and CO2 analyzer to determine the internal cavityconcentrations of these gases. All fruit were assessed for greasiness and internal browning.Greasiness was assessed by feeling the fruit and scoring the level of greasiness on a scaleof 0-5, with 0 not being greasy and 5 being extremely greasy. A value over 3 would beconsidered unmarketable. To assess for internal browning the fruit were cut transverselyand any incidence of browning was recorded. The data was analysed using a split plot intime statistical analysis method. The average of all three harvest dates was taken to obtainvalues for the parameters measured.
Season 2002Trial site - This trial was conducted at the Grove Research station in the Huon Valley ofTasmania (Australia) on 10 year old trees that were grafted onto ‘MM106’, ‘MM106/27’
Minimising internal browning in ‘Pink Lady apples’________________________________________________________________________
________________________________________________________________________133
Scientific Horticulture P/L
interstem, ‘MM106/9’ interstem, in 3 tree plots, replicated 6 times in a randomised complete blockdesign.Harvest assessments - Approximately 80 fruit (1 loose pack box) per plot were harvested at10 days prior to commercial harvest, commercial harvest (19/04/02), and 10 days aftercommercial harvest. At harvest three fruit from each plot were pooled by rootstock andassessed for weight, firmness, total soluble solids (TSS) and starch (as describedpreviously).Storage assessments - The fruit were placed in a commercial CA storeroom for sevenmonths, and then transferred to a refrigerated container for five weeks to simulate transportto Europe. Fruit were assessed for weight, firmness, diameter, TSS and internal browning(as described above). The data was analysed using an ANOVA statistical analysis method.The average of all three harvest dates was taken to obtain the values for the parametersmeasured
Season 2003Trial site – This trial was conducted at the Lenswood Research station in South Australiaon 10 year old trees that were grafted onto ‘MM106’, ‘M7’, ‘M9’, ‘M26’, ‘O3’, and ‘M102’, in 5tree plots, replicated 4 times in a randomised complete block design.Harvest assessments – The fruit were monitored on a weekly basis, and each rootstock waspicked at the same starch plate of 3.5 on the Ctifl 10 point scale (consistent with fruit goinginto long term storage). There was a 7-10 day variation from the harvest of the earliestmaturing rootstock to the harvest of the latest one. Assessments of firmness, TSS andstarch were taken at harvest. Two loose packed boxes of fruit per plot were harvested.Storage assessments - Fruit were air stored until all the fruit were harvested. One box fromeach plot was kept in air store, while the other box from each plot was placed in acommercial CA storage facility for 6 months. These fruit were then transported toTasmania under refrigeration and placed in a refrigerated container for a further threeweeks to simulate transport to Europe. A sample of 20 fruit from each plot were assessedfor weight, TSS, firmness, diameter and greasiness (as previously described).Additionally, the red surface area of the equatorial peel of ten fruit was determined withimage analysis (Optimus 6.1). All fruit were assessed for internal browning.
Root Disease
Season 2001At the first harvest of the 2001 rootstock trial, a visual assessment (0-10) was made of thegeneral condition of the trees. From this assessment only one tree was noted as beingpoor, having symptoms consistent with a root disease such as phytophthora, fruit werestored and assessed as per the details outlined above. The following growing season(2001/2002) was unusually wet and during this growing season six trees in the trials sitedisplayed symptoms of severe root disease infection. The incidence of internal browningfor trees with severe symptoms of root disease was compared with nearby trees on thesame rootstock and analysed using a ‘T’ test.
Season 2002A visual assessment (0-10) was made of the general condition of the trees to give anindication of the presence of root diseases and approximately 80 fruit from both affectedand healthy trees was harvested. Fruit were stored and assessed in a similar manner to the2002 rootstock trial. The incidence of internal browning for trees with severe
Minimising internal browning in ‘Pink Lady apples’________________________________________________________________________
_________________________________________________________________________134
Scientific Horticulture P/L
symptoms of root disease was compared with nearby trees on the same rootstock andanalysed using a ‘T’ test.
Growth regulation trials
Season 2002This trial was set up in a commercial orchard of vigorous ‘Pink Lady’ apples in the HuonValley of Tasmania during the spring of 2001. The trees were approximately 4.5m tall,planted 2m apart in rows 4.8m wide. The trees were on ‘MM106/9’ rootstocks. Fullbloom was on 29 September 2001.
Six treatments were applied in 2001 and replicated 4 times on 3 tree plots. Treatmentswere; an untreated control, cincturing of the trees (4/10/2001), Regalis® (1/10/2001-12noon, overcast, breeze, 23°C, 52%RH and 8/11/2001-12 noon, overcast, calm, 21°C,75%RH at 1.266kg/Ha with an airblast sprayer), a severe summer pruning (28/12/2001 andpreharvest deleafing treatment (8/3/2003), reflective cloth (Extenday® 3m wide on eachside of plots, 8/3/2003) and Retain® (22/3/2003 – 830g/Ha with hand lance, calm, sunny20°C).
The shoot lengths of 15 vigorous shoots per plot were measured on the untreated control,Regalis® and Cincturing treatments on 2 November 2001 and 28 December 2001.Fruit harvest occurred on 24/4/2002. Approximately 60 fruit from each plot wereharvested and placed in a box for controlled atmosphere storage. In addition, a sample of20 fruit per plot was taken to determine harvest maturity. Fruit weight, firmness, TSS,starch, were assessed as per previously described, additionally, the red surface area of anequatorial peel of each fruit was determined with image analysis (Optimus 6.1). The fruitfor storage were placed in a commercial controlled atmosphere facility in a room operatingat 0.5°C, 1.5% CO2 and 1.5% O2. They were removed from storage after 7 months(20/11/2002) and a sample of 20 fruit per plot tested for firmness, TSS and internalbrowning (as previously described). The remaining fruit were stored in a commercial coldroom at 1°C for a further 19 days to simulate normal delays in marketing and then asample of 20 fruit were assessed for internal browning.
Season 2003The same trees as used in the 2001/02 trial were used for this seasons trial. The untreatedcontrol, cincturing, Regalis®, summer pruning, and reflective cloth treatments were allapplied to the same trees as in 2001/02. However, the Retain® treatment was replaced withan Ethrel® treatment and some unutilised trees in 2001/02 were given a chain sawtreatment. In this season full bloom occurred on 9 October 2002. The Regalis® wasapplied on October 10 2002 (11am, sunny and calm, 17°C and 43%RH) and October 292002 (12 noon, sunny and calm, 21°C, 40% RH) with an airblast sprayer. The cincturingoccurred on October 14 2002, Trees were chain sawed (half way through trunk at 200mmabove the ground and again on the other side of the trunk but 100mm higher) on October29 2002. The trees were summer pruned on January 6 2003 and the reflective cloth wasapplied on March 24 2003. Ethrel® was applied on 28 March 2003 (300ml/Ha with a handlance, overcast, 18°C and calm).
On October 10, 2002, visual estimates of the percentage of flowers open and flower
Minimising internal browning in ‘Pink Lady apples’________________________________________________________________________
________________________________________________________________________135
Scientific Horticulture P/L
density were made. The shoot lengths of 10 vigorous shoots were measured on theuntreated control, Regalis®, cinctured, summer pruned and chain sawed treatments onOctober 9 2002, December 10 2002 and May 26 2003. The Ethrel® treated trees wereharvested on April 17 2003 and the remaining trees were harvested a week later on April24 2004. At each harvest 2 boxes of 84 fruit were collected as well as a sample of 20 fruitfor harvest maturity determination (firmness, TSS, starch and percent area of red skin) asdetermined in the previous season. All fruit were placed in long term CA storage in acommercial facility and were assessed for fruit quality and internal browning (aspreviously described) on 8 October 2003.
Maturity trials
Season 2001This trial was conducted in conjunction with the 2001 rootstock trial; refer to this sectionin the methods for the trial site, harvest assessments and storage assessments. The effect ofharvest date was analysed with a split plot in time ANOVA, using LSD to split the means.
Season 2002This maturity trial was established in conjunction with the growth regulation trial; fruitwere harvested at weekly intervals from 6 weeks before commercial harvest and assessedfor maturity using the maturity index described below. Additionally, 80 fruit wereharvested at 2 weeks before harvest, 1 week before harvest, commercial harvest (22/04/02)and 1 week after harvest. Fruit were than placed in CA storage with the fruit from thegrowth regulation trial, and assessed in a similar manner.
Maturity IndexFrom 1998 to 2003 fruit were sampled from a number of orchards within the Huon Valleyof Tasmania to ascertain a profile of maturity. Twenty fruit (two from each of 10 trees)were harvested at weekly intervals from 5-6 weeks before commercial harvest tocommercial harvest. The fruit were assessed for firmness, TSS and starch as outlinedpreviously. The maturity index was calculated from the following equationMI = 10(Firmness (Kg) X TSS (%))
Starch (%black)
Results and discussion
SeasonalityThis disorder was first observed in 2000, prior to this, internal browning had not beenobserved in ‘Pink Lady’ apples, so it can be assumed to be below the 1% market tolerance.In the four seasons when this disorder has been studied, it was at a maximum in 2002; withhalf of all fruit examined having internal browning, and a minimum in 2003 with less than5% of fruit examined affected by the disorder (Fig 1.). The fluctuations in the annuallevels of the disorder indicate that there is a seasonal component to internal browning.Recent investigations by Schimanski et al. (2003) indicate that internal browning in ‘Fuji’apples due to treatment with methyl bromide, may be exacerbated by frost events just priorto picking. This is consistent with the results for ‘Braeburn’ apples, which indicate thatinternal browning in this cultivar is associated with cool growing season, especially if thefruit are over-mature (Lau 1998). Therefore, the occurrence of frost and sudden
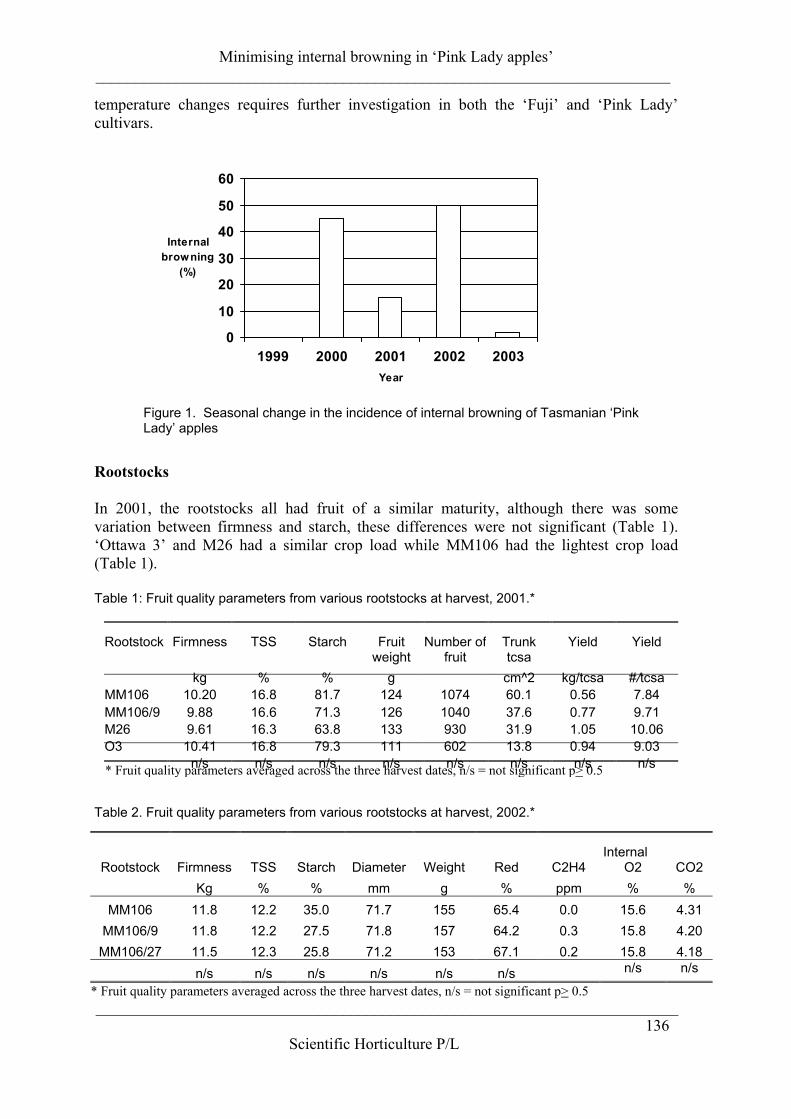
Minimising internal browning in ‘Pink Lady apples’________________________________________________________________________
_________________________________________________________________________136
Scientific Horticulture P/L
temperature changes requires further investigation in both the ‘Fuji’ and ‘Pink Lady’cultivars.
Rootstocks
In 2001, the rootstocks all had fruit of a similar maturity, although there was somevariation between firmness and starch, these differences were not significant (Table 1).‘Ottawa 3’ and M26 had a similar crop load while MM106 had the lightest crop load(Table 1).
Table 1: Fruit quality parameters from various rootstocks at harvest, 2001.*
Table 2. Fruit quality parameters from various rootstocks at harvest, 2002.*
InternalRootstock Firmness TSS Starch Diameter Weight Red C2H4 O2 CO2
Kg % % mm g % ppm % %MM106 11.8 12.2 35.0 71.7 155 65.4 0.0 15.6 4.31
MM106/9 11.8 12.2 27.5 71.8 157 64.2 0.3 15.8 4.20MM106/27 11.5 12.3 25.8 71.2 153 67.1 0.2 15.8 4.18
n/s n/s n/s n/s n/s n/s n/s n/s
* Fruit quality parameters averaged across the three harvest dates, n/s = not significant p> 0.5
0
10
20
30
40
50
60
1999 2000 2001 2002 2003Year
Internal browning
(%)
Figure 1. Seasonal change in the incidence of internal browning of Tasmanian ‘PinkLady’ apples
Rootstock Firmness TSS Starch Fruitweight
Number offruit
Trunktcsa
Yield Yield
kg % % g cm^2 kg/tcsa #/tcsaMM106 10.20 16.8 81.7 124 1074 60.1 0.56 7.84MM106/9 9.88 16.6 71.3 126 1040 37.6 0.77 9.71M26 9.61 16.3 63.8 133 930 31.9 1.05 10.06O3 10.41 16.8 79.3 111 602 13.8 0.94 9.03
n/s n/s n/s n/s n/s n/s n/s n/s* Fruit quality parameters averaged across the three harvest dates, n/s = not significant p> 0.5
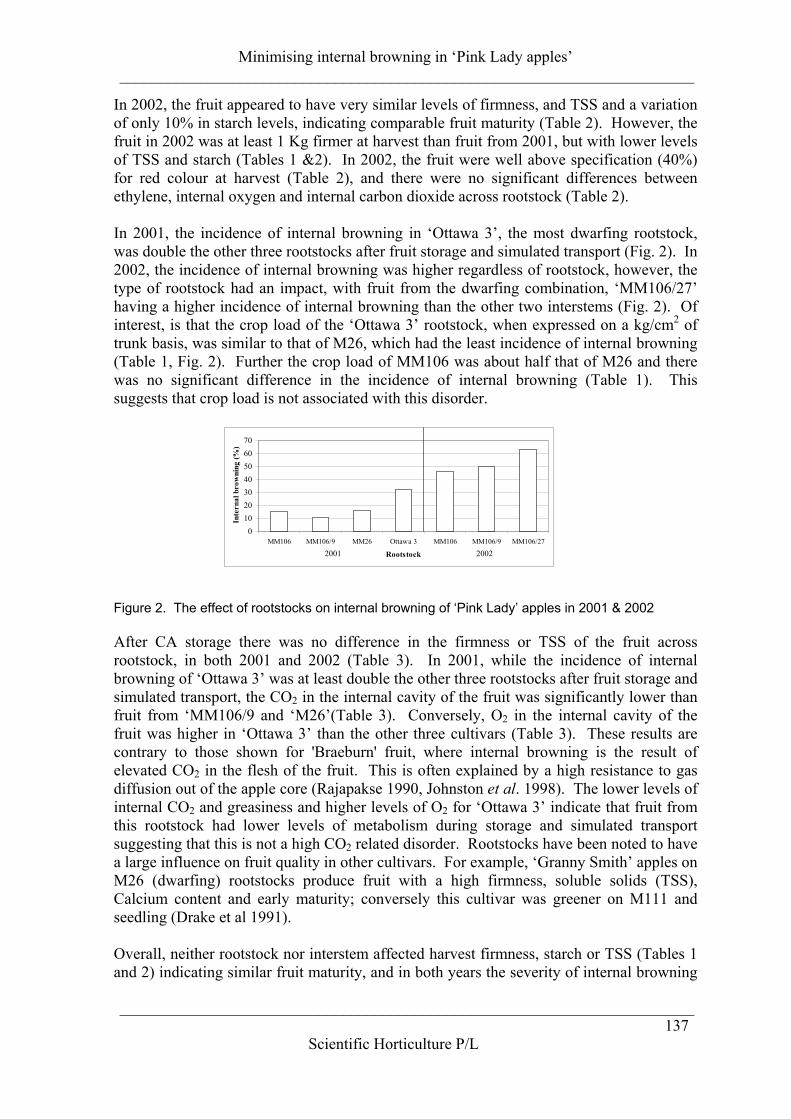
Minimising internal browning in ‘Pink Lady apples’________________________________________________________________________
________________________________________________________________________137
Scientific Horticulture P/L
In 2002, the fruit appeared to have very similar levels of firmness, and TSS and a variationof only 10% in starch levels, indicating comparable fruit maturity (Table 2). However, thefruit in 2002 was at least 1 Kg firmer at harvest than fruit from 2001, but with lower levelsof TSS and starch (Tables 1 &2). In 2002, the fruit were well above specification (40%)for red colour at harvest (Table 2), and there were no significant differences betweenethylene, internal oxygen and internal carbon dioxide across rootstock (Table 2).
In 2001, the incidence of internal browning in ‘Ottawa 3’, the most dwarfing rootstock,was double the other three rootstocks after fruit storage and simulated transport (Fig. 2). In2002, the incidence of internal browning was higher regardless of rootstock, however, thetype of rootstock had an impact, with fruit from the dwarfing combination, ‘MM106/27’having a higher incidence of internal browning than the other two interstems (Fig. 2). Ofinterest, is that the crop load of the ‘Ottawa 3’ rootstock, when expressed on a kg/cm2 oftrunk basis, was similar to that of M26, which had the least incidence of internal browning(Table 1, Fig. 2). Further the crop load of MM106 was about half that of M26 and therewas no significant difference in the incidence of internal browning (Table 1). Thissuggests that crop load is not associated with this disorder.
010203040506070
MM106 MM106/9 MM26 Ottawa 3 MM106 MM106/9 MM106/27
Rootstock
Inte
rnal
bro
wni
ng (%
)
20022001
Figure 2. The effect of rootstocks on internal browning of ‘Pink Lady’ apples in 2001 & 2002
After CA storage there was no difference in the firmness or TSS of the fruit acrossrootstock, in both 2001 and 2002 (Table 3). In 2001, while the incidence of internalbrowning of ‘Ottawa 3’ was at least double the other three rootstocks after fruit storage andsimulated transport, the CO2 in the internal cavity of the fruit was significantly lower thanfruit from ‘MM106/9 and ‘M26’(Table 3). Conversely, O2 in the internal cavity of thefruit was higher in ‘Ottawa 3’ than the other three cultivars (Table 3). These results arecontrary to those shown for 'Braeburn' fruit, where internal browning is the result ofelevated CO2 in the flesh of the fruit. This is often explained by a high resistance to gasdiffusion out of the apple core (Rajapakse 1990, Johnston et al. 1998). The lower levels ofinternal CO2 and greasiness and higher levels of O2 for ‘Ottawa 3’ indicate that fruit fromthis rootstock had lower levels of metabolism during storage and simulated transportsuggesting that this is not a high CO2 related disorder. Rootstocks have been noted to havea large influence on fruit quality in other cultivars. For example, ‘Granny Smith’ apples onM26 (dwarfing) rootstocks produce fruit with a high firmness, soluble solids (TSS),Calcium content and early maturity; conversely this cultivar was greener on M111 andseedling (Drake et al 1991).
Overall, neither rootstock nor interstem affected harvest firmness, starch or TSS (Tables 1and 2) indicating similar fruit maturity, and in both years the severity of internal browning
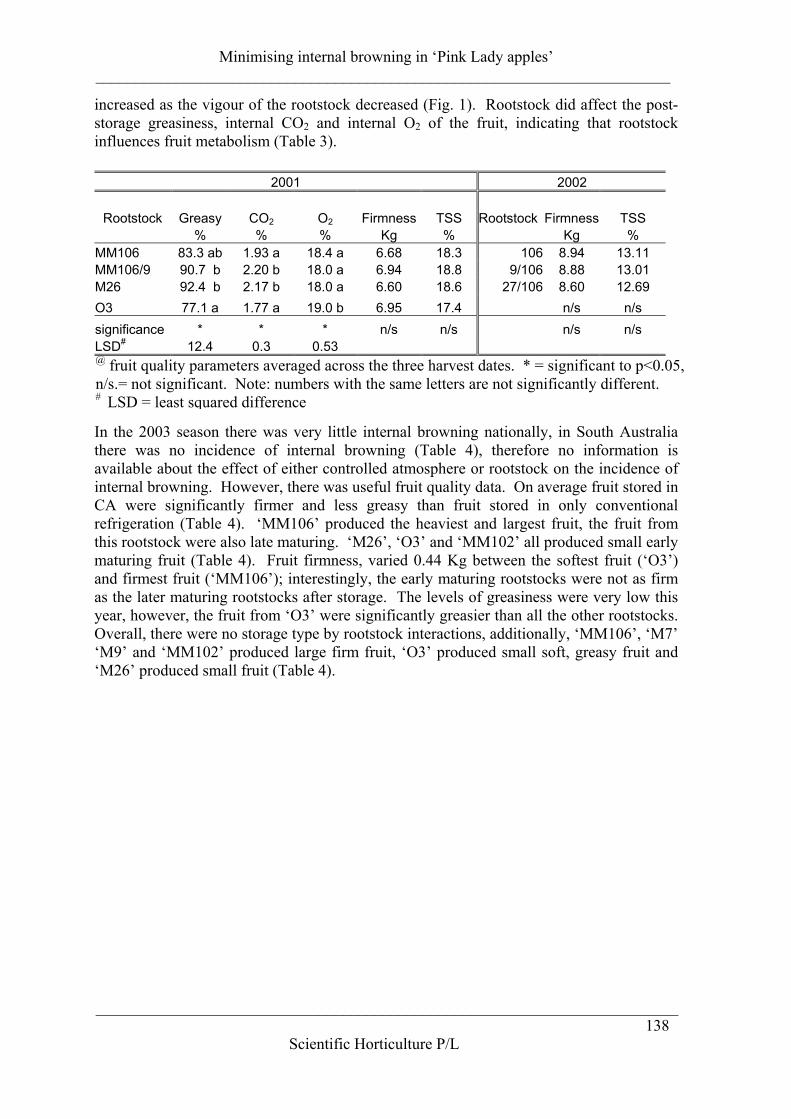
Minimising internal browning in ‘Pink Lady apples’________________________________________________________________________
_________________________________________________________________________138
Scientific Horticulture P/L
increased as the vigour of the rootstock decreased (Fig. 1). Rootstock did affect the post-storage greasiness, internal CO2 and internal O2 of the fruit, indicating that rootstockinfluences fruit metabolism (Table 3).
Table 3: The effect of rootstock on fruit quality parameters after storage 2001 and 2002
In the 2003 season there was very little internal browning nationally, in South Australiathere was no incidence of internal browning (Table 4), therefore no information isavailable about the effect of either controlled atmosphere or rootstock on the incidence ofinternal browning. However, there was useful fruit quality data. On average fruit stored inCA were significantly firmer and less greasy than fruit stored in only conventionalrefrigeration (Table 4). ‘MM106’ produced the heaviest and largest fruit, the fruit fromthis rootstock were also late maturing. ‘M26’, ‘O3’ and ‘MM102’ all produced small earlymaturing fruit (Table 4). Fruit firmness, varied 0.44 Kg between the softest fruit (‘O3’)and firmest fruit (‘MM106’); interestingly, the early maturing rootstocks were not as firmas the later maturing rootstocks after storage. The levels of greasiness were very low thisyear, however, the fruit from ‘O3’ were significantly greasier than all the other rootstocks.Overall, there were no storage type by rootstock interactions, additionally, ‘MM106’, ‘M7’‘M9’ and ‘MM102’ produced large firm fruit, ‘O3’ produced small soft, greasy fruit and‘M26’ produced small fruit (Table 4).
2001 2002
Rootstock Greasy CO2 O2 Firmness TSS Rootstock Firmness TSS% % % Kg % Kg %
MM106 83.3 ab 1.93 a 18.4 a 6.68 18.3 106 8.94 13.11MM106/9 90.7 b 2.20 b 18.0 a 6.94 18.8 9/106 8.88 13.01M26 92.4 b 2.17 b 18.0 a 6.60 18.6 27/106 8.60 12.69O3 77.1 a 1.77 a 19.0 b 6.95 17.4 n/s n/ssignificance * * * n/s n/s n/s n/sLSD# 12.4 0.3 0.53@ fruit quality parameters averaged across the three harvest dates. * = significant to p<0.05,n/s.= not significant. Note: numbers with the same letters are not significantly different.# LSD = least squared difference
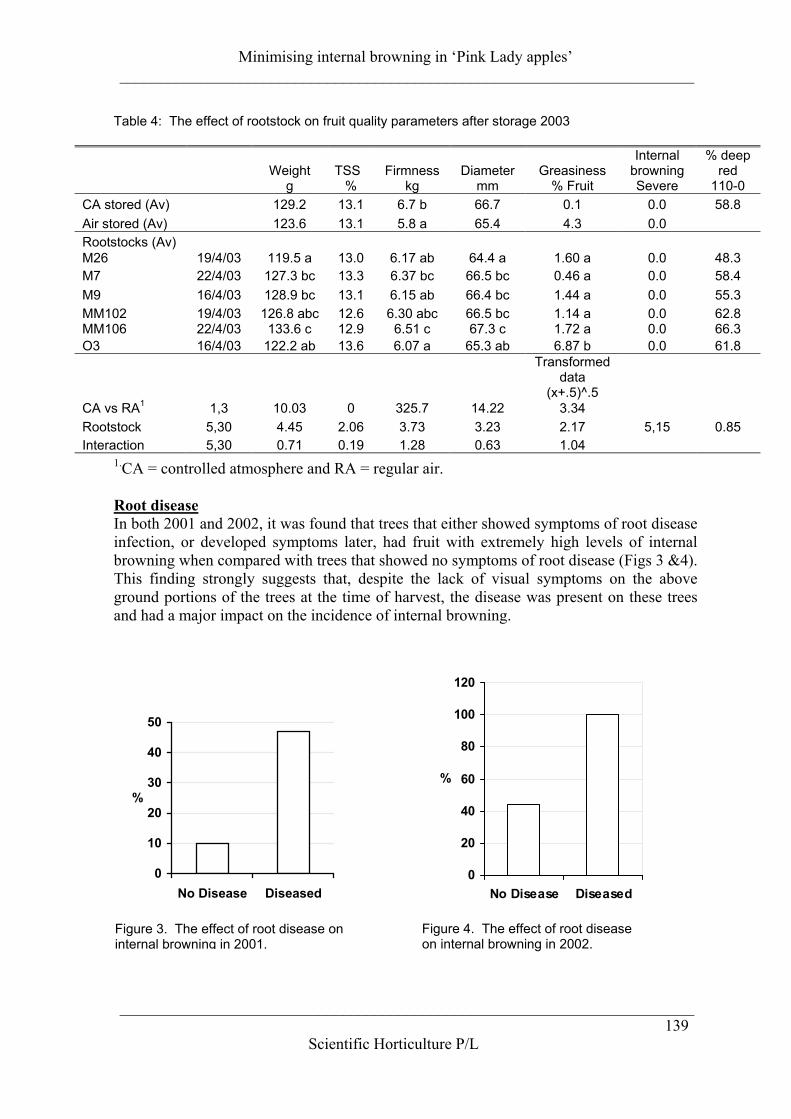
Minimising internal browning in ‘Pink Lady apples’________________________________________________________________________
________________________________________________________________________139
Scientific Horticulture P/L
Table 4: The effect of rootstock on fruit quality parameters after storage 2003
1.CA = controlled atmosphere and RA = regular air.
Root diseaseIn both 2001 and 2002, it was found that trees that either showed symptoms of root diseaseinfection, or developed symptoms later, had fruit with extremely high levels of internalbrowning when compared with trees that showed no symptoms of root disease (Figs 3 &4).This finding strongly suggests that, despite the lack of visual symptoms on the aboveground portions of the trees at the time of harvest, the disease was present on these treesand had a major impact on the incidence of internal browning.
Weight TSS Firmness Diameter GreasinessInternal
browning% deep
redg % kg mm % Fruit Severe 110-0
CA stored (Av) 129.2 13.1 6.7 b 66.7 0.1 0.0 58.8Air stored (Av) 123.6 13.1 5.8 a 65.4 4.3 0.0Rootstocks (Av)M26 19/4/03 119.5 a 13.0 6.17 ab 64.4 a 1.60 a 0.0 48.3M7 22/4/03 127.3 bc 13.3 6.37 bc 66.5 bc 0.46 a 0.0 58.4M9 16/4/03 128.9 bc 13.1 6.15 ab 66.4 bc 1.44 a 0.0 55.3MM102 19/4/03 126.8 abc 12.6 6.30 abc 66.5 bc 1.14 a 0.0 62.8MM106 22/4/03 133.6 c 12.9 6.51 c 67.3 c 1.72 a 0.0 66.3O3 16/4/03 122.2 ab 13.6 6.07 a 65.3 ab 6.87 b 0.0 61.8
Transformeddata
(x+.5)^.5CA vs RA1 1,3 10.03 0 325.7 14.22 3.34Rootstock 5,30 4.45 2.06 3.73 3.23 2.17 5,15 0.85Interaction 5,30 0.71 0.19 1.28 0.63 1.04
0
10
20
30
40
50
No Disease Diseased
%
Figure 3. The effect of root disease oninternal browning in 2001.
0
20
40
60
80
100
120
No Disease Diseased
%
Figure 4. The effect of root diseaseon internal browning in 2002.
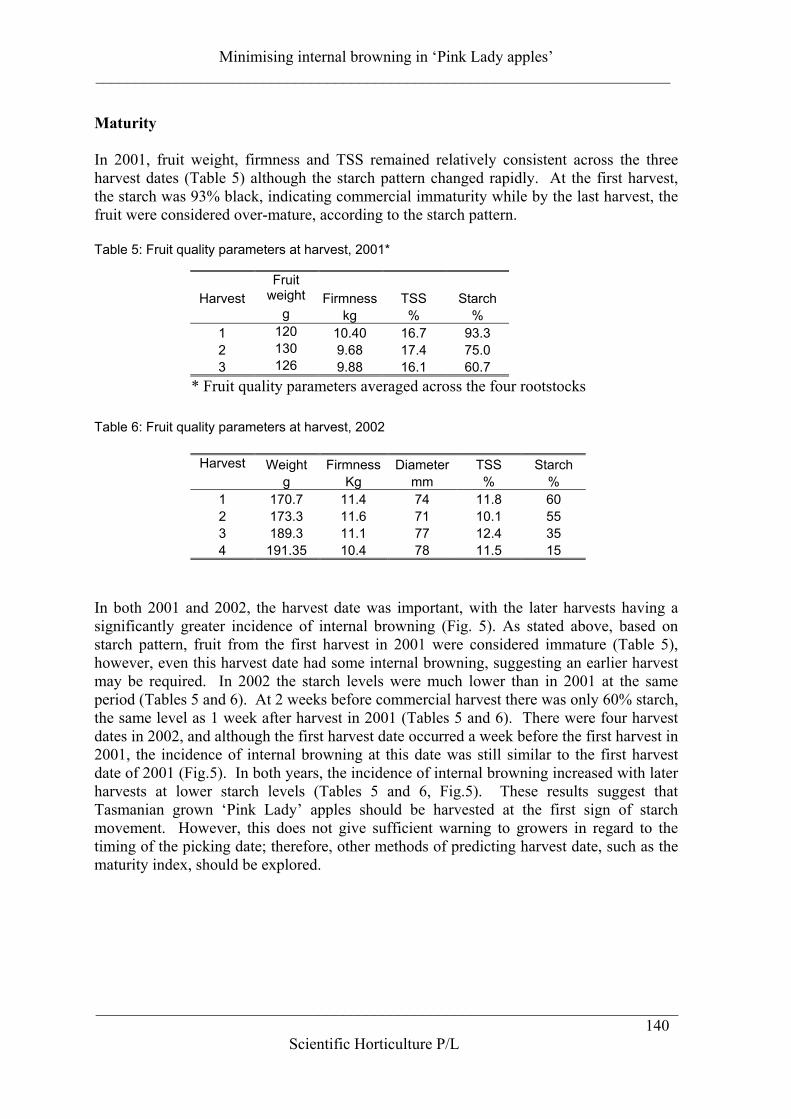
Minimising internal browning in ‘Pink Lady apples’________________________________________________________________________
_________________________________________________________________________140
Scientific Horticulture P/L
Maturity
In 2001, fruit weight, firmness and TSS remained relatively consistent across the threeharvest dates (Table 5) although the starch pattern changed rapidly. At the first harvest,the starch was 93% black, indicating commercial immaturity while by the last harvest, thefruit were considered over-mature, according to the starch pattern.
Table 5: Fruit quality parameters at harvest, 2001*
Table 6: Fruit quality parameters at harvest, 2002
In both 2001 and 2002, the harvest date was important, with the later harvests having asignificantly greater incidence of internal browning (Fig. 5). As stated above, based onstarch pattern, fruit from the first harvest in 2001 were considered immature (Table 5),however, even this harvest date had some internal browning, suggesting an earlier harvestmay be required. In 2002 the starch levels were much lower than in 2001 at the sameperiod (Tables 5 and 6). At 2 weeks before commercial harvest there was only 60% starch,the same level as 1 week after harvest in 2001 (Tables 5 and 6). There were four harvestdates in 2002, and although the first harvest date occurred a week before the first harvest in2001, the incidence of internal browning at this date was still similar to the first harvestdate of 2001 (Fig.5). In both years, the incidence of internal browning increased with laterharvests at lower starch levels (Tables 5 and 6, Fig.5). These results suggest thatTasmanian grown ‘Pink Lady’ apples should be harvested at the first sign of starchmovement. However, this does not give sufficient warning to growers in regard to thetiming of the picking date; therefore, other methods of predicting harvest date, such as thematurity index, should be explored.
HarvestFruit
weight Firmness TSS Starchg kg % %
1 120 10.40 16.7 93.32 130 9.68 17.4 75.03 126 9.88 16.1 60.7
* Fruit quality parameters averaged across the four rootstocks
Weight Firmness Diameter TSS StarchHarvestg Kg mm % %
1 170.7 11.4 74 11.8 602 173.3 11.6 71 10.1 553 189.3 11.1 77 12.4 354 191.35 10.4 78 11.5 15
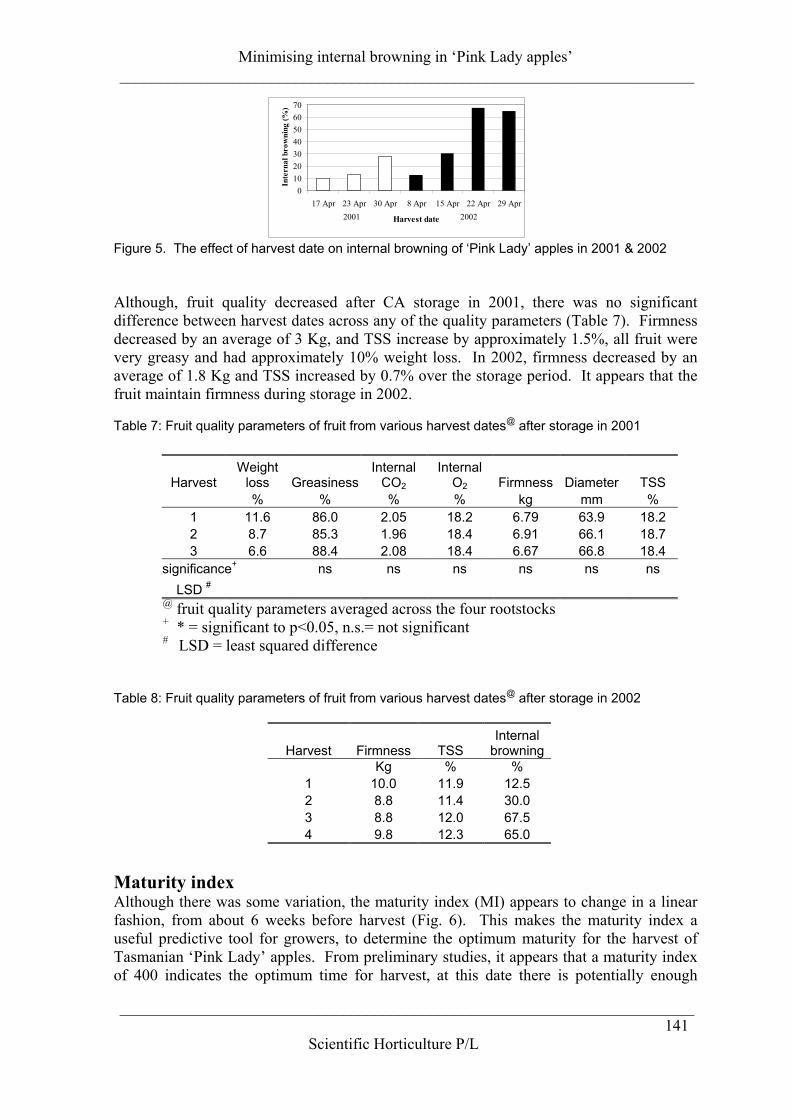
Minimising internal browning in ‘Pink Lady apples’________________________________________________________________________
________________________________________________________________________141
Scientific Horticulture P/L
010203040506070
17 Apr 23 Apr 30 Apr 8 Apr 15 Apr 22 Apr 29 Apr
Harvest date
Inte
rnal
bro
wni
ng (%
)
2001 2002
Figure 5. The effect of harvest date on internal browning of ‘Pink Lady’ apples in 2001 & 2002
Although, fruit quality decreased after CA storage in 2001, there was no significantdifference between harvest dates across any of the quality parameters (Table 7). Firmnessdecreased by an average of 3 Kg, and TSS increase by approximately 1.5%, all fruit werevery greasy and had approximately 10% weight loss. In 2002, firmness decreased by anaverage of 1.8 Kg and TSS increased by 0.7% over the storage period. It appears that thefruit maintain firmness during storage in 2002.
Table 7: Fruit quality parameters of fruit from various harvest dates@ after storage in 2001
Table 8: Fruit quality parameters of fruit from various harvest dates@ after storage in 2002
Maturity indexAlthough there was some variation, the maturity index (MI) appears to change in a linearfashion, from about 6 weeks before harvest (Fig. 6). This makes the maturity index auseful predictive tool for growers, to determine the optimum maturity for the harvest ofTasmanian ‘Pink Lady’ apples. From preliminary studies, it appears that a maturity indexof 400 indicates the optimum time for harvest, at this date there is potentially enough
HarvestWeight
loss GreasinessInternal
CO2
InternalO2 Firmness Diameter TSS
% % % % kg mm %1 11.6 86.0 2.05 18.2 6.79 63.9 18.22 8.7 85.3 1.96 18.4 6.91 66.1 18.73 6.6 88.4 2.08 18.4 6.67 66.8 18.4
significance+ ns ns ns ns ns nsLSD #
@ fruit quality parameters averaged across the four rootstocks+ * = significant to p<0.05, n.s.= not significant# LSD = least squared difference
Harvest Firmness TSSInternal
browningKg % %
1 10.0 11.9 12.52 8.8 11.4 30.03 8.8 12.0 67.54 9.8 12.3 65.0
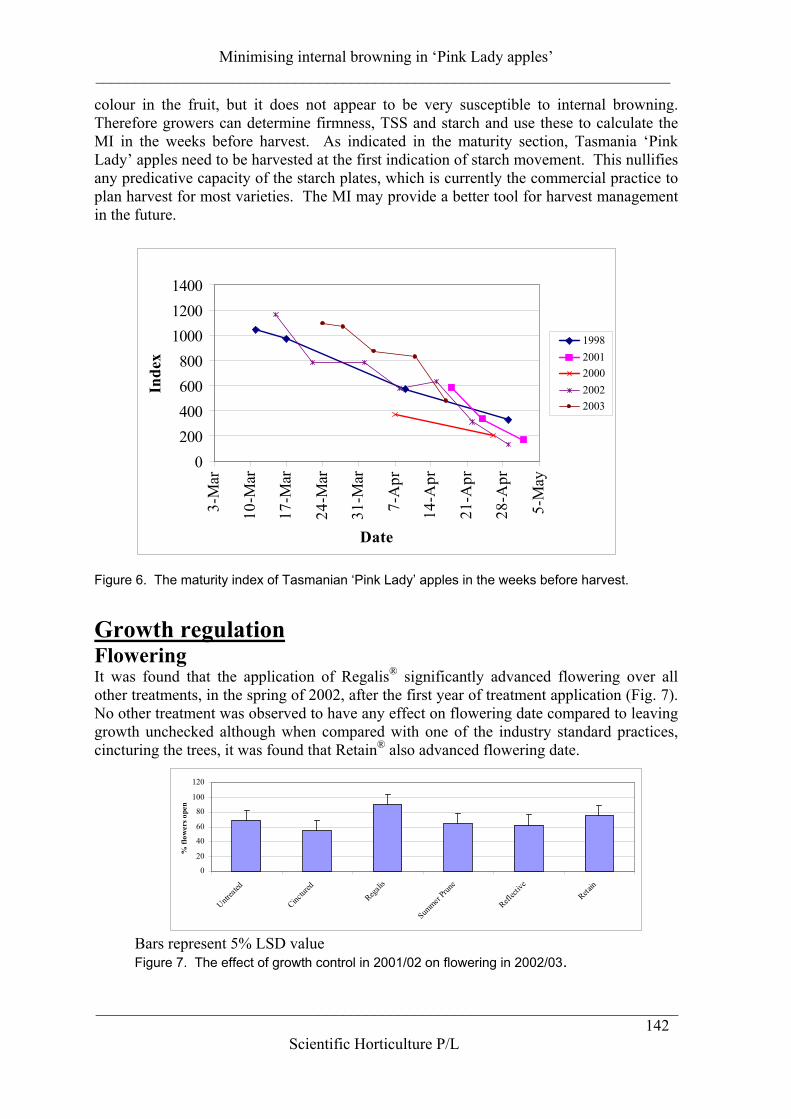
Minimising internal browning in ‘Pink Lady apples’________________________________________________________________________
_________________________________________________________________________142
Scientific Horticulture P/L
colour in the fruit, but it does not appear to be very susceptible to internal browning.Therefore growers can determine firmness, TSS and starch and use these to calculate theMI in the weeks before harvest. As indicated in the maturity section, Tasmania ‘PinkLady’ apples need to be harvested at the first indication of starch movement. This nullifiesany predicative capacity of the starch plates, which is currently the commercial practice toplan harvest for most varieties. The MI may provide a better tool for harvest managementin the future.
Figure 6. The maturity index of Tasmanian ‘Pink Lady’ apples in the weeks before harvest.
Growth regulationFloweringIt was found that the application of Regalis® significantly advanced flowering over allother treatments, in the spring of 2002, after the first year of treatment application (Fig. 7).No other treatment was observed to have any effect on flowering date compared to leavinggrowth unchecked although when compared with one of the industry standard practices,cincturing the trees, it was found that Retain® also advanced flowering date.
0
20
40
60
80
100
120
Untreat
ed
Cinctur
edRega
lis
Summer
Prune
Reflect
iveReta
in
% fl
ower
s ope
n
Bars represent 5% LSD valueFigure 7. The effect of growth control in 2001/02 on flowering in 2002/03.
0200400600800
100012001400
3-M
ar
10-M
ar
17-M
ar
24-M
ar
31-M
ar
7-A
pr
14-A
pr
21-A
pr
28-A
pr
5-M
ayDate
Inde
x
19982001200020022003
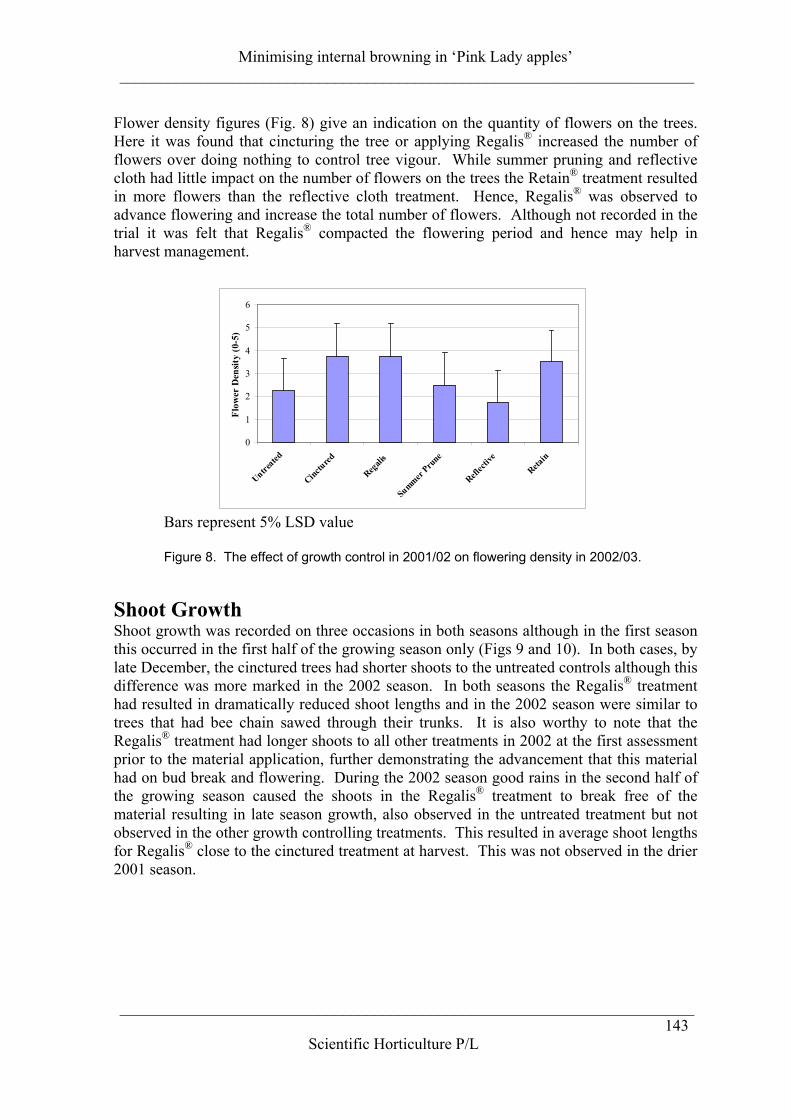
Minimising internal browning in ‘Pink Lady apples’________________________________________________________________________
________________________________________________________________________143
Scientific Horticulture P/L
Flower density figures (Fig. 8) give an indication on the quantity of flowers on the trees.Here it was found that cincturing the tree or applying Regalis® increased the number offlowers over doing nothing to control tree vigour. While summer pruning and reflectivecloth had little impact on the number of flowers on the trees the Retain® treatment resultedin more flowers than the reflective cloth treatment. Hence, Regalis® was observed toadvance flowering and increase the total number of flowers. Although not recorded in thetrial it was felt that Regalis® compacted the flowering period and hence may help inharvest management.
Shoot GrowthShoot growth was recorded on three occasions in both seasons although in the first seasonthis occurred in the first half of the growing season only (Figs 9 and 10). In both cases, bylate December, the cinctured trees had shorter shoots to the untreated controls although thisdifference was more marked in the 2002 season. In both seasons the Regalis® treatmenthad resulted in dramatically reduced shoot lengths and in the 2002 season were similar totrees that had bee chain sawed through their trunks. It is also worthy to note that theRegalis® treatment had longer shoots to all other treatments in 2002 at the first assessmentprior to the material application, further demonstrating the advancement that this materialhad on bud break and flowering. During the 2002 season good rains in the second half ofthe growing season caused the shoots in the Regalis® treatment to break free of thematerial resulting in late season growth, also observed in the untreated treatment but notobserved in the other growth controlling treatments. This resulted in average shoot lengthsfor Regalis® close to the cinctured treatment at harvest. This was not observed in the drier2001 season.
0
1
2
3
4
5
6
Untreated
Cinctured
Regali
s
Summer Pru
ne
Reflect
ive
Retain
Flow
er D
ensit
y (0
-5)
Bars represent 5% LSD value
Figure 8. The effect of growth control in 2001/02 on flowering density in 2002/03.
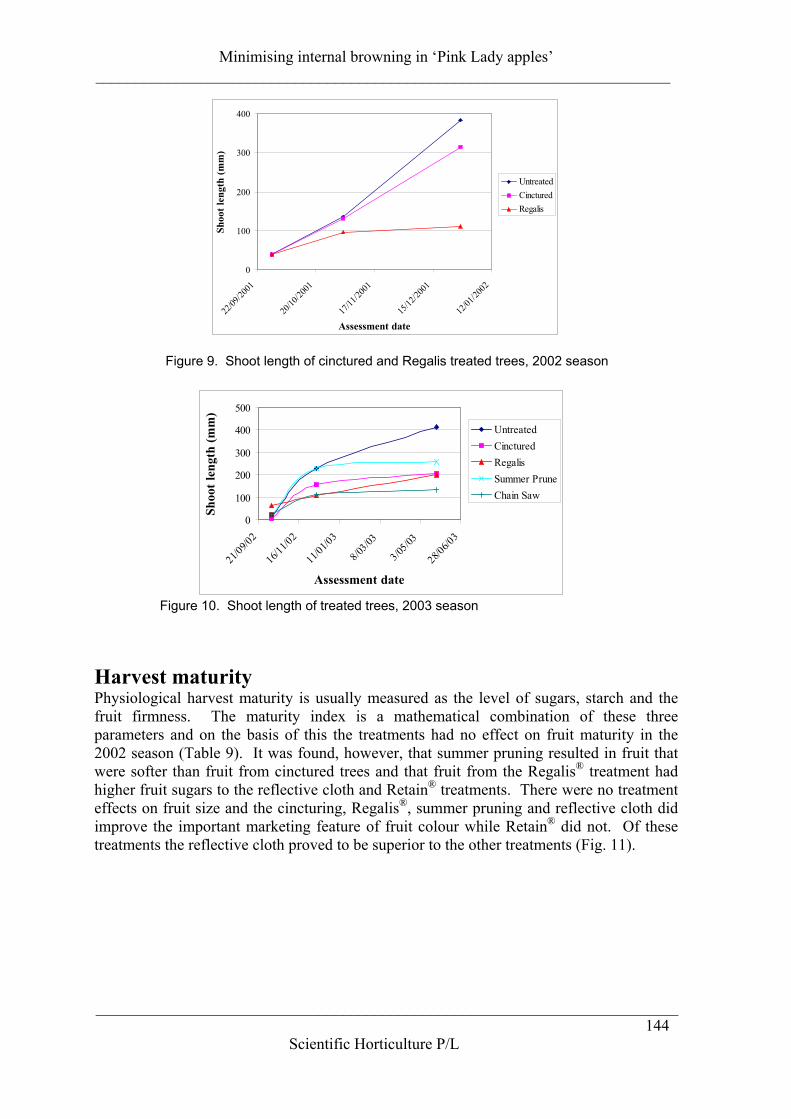
Minimising internal browning in ‘Pink Lady apples’________________________________________________________________________
_________________________________________________________________________144
Scientific Horticulture P/L
Harvest maturityPhysiological harvest maturity is usually measured as the level of sugars, starch and thefruit firmness. The maturity index is a mathematical combination of these threeparameters and on the basis of this the treatments had no effect on fruit maturity in the2002 season (Table 9). It was found, however, that summer pruning resulted in fruit thatwere softer than fruit from cinctured trees and that fruit from the Regalis® treatment hadhigher fruit sugars to the reflective cloth and Retain® treatments. There were no treatmenteffects on fruit size and the cincturing, Regalis®, summer pruning and reflective cloth didimprove the important marketing feature of fruit colour while Retain® did not. Of thesetreatments the reflective cloth proved to be superior to the other treatments (Fig. 11).
0
100
200
300
400
22/09
/2001
20/10
/2001
17/11
/2001
15/12
/2001
12/01
/2002
Assessment date
Shoo
t len
gth
(mm
)
UntreatedCincturedRegalis
Figure 9. Shoot length of cinctured and Regalis treated trees, 2002 season
0
100
200
300
400
500
21/09/0
2
16/11/0
2
11/01/0
3
8/03/03
3/05/03
28/06/0
3
Assessment date
Shoo
t len
gth
(mm
)
UntreatedCincturedRegalisSummer PruneChain Saw
Figure 10. Shoot length of treated trees, 2003 season
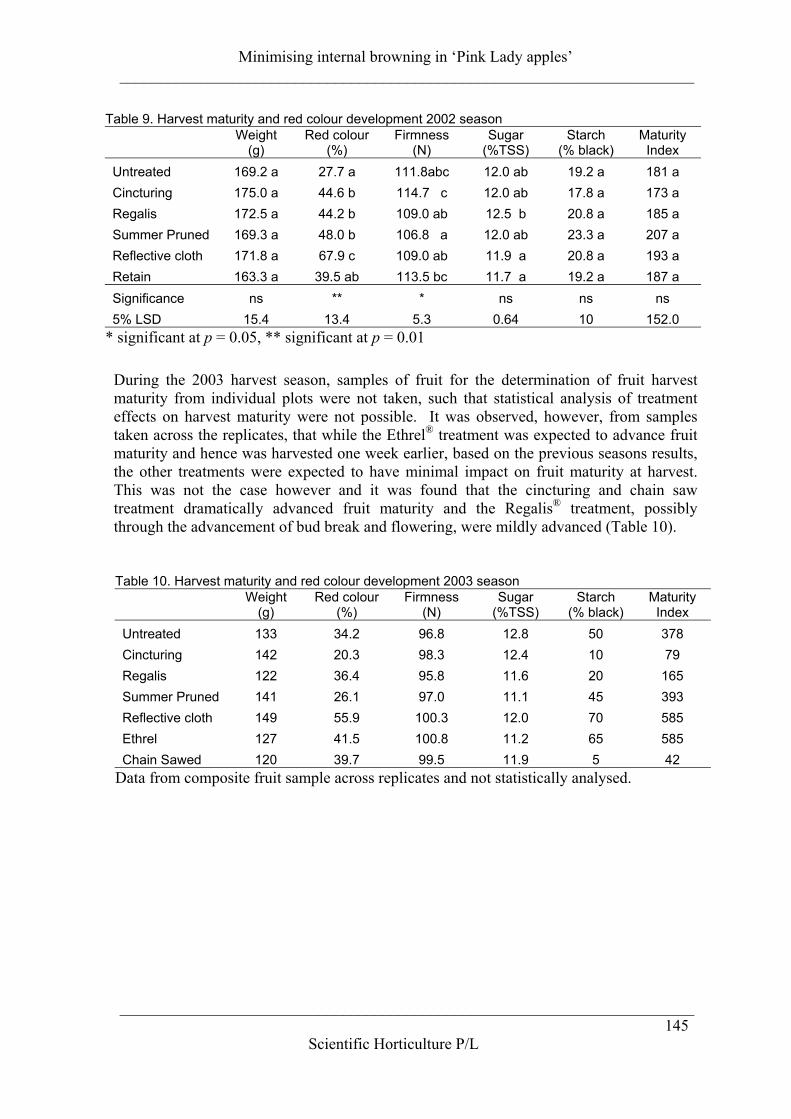
Minimising internal browning in ‘Pink Lady apples’________________________________________________________________________
________________________________________________________________________145
Scientific Horticulture P/L
During the 2003 harvest season, samples of fruit for the determination of fruit harvestmaturity from individual plots were not taken, such that statistical analysis of treatmenteffects on harvest maturity were not possible. It was observed, however, from samplestaken across the replicates, that while the Ethrel® treatment was expected to advance fruitmaturity and hence was harvested one week earlier, based on the previous seasons results,the other treatments were expected to have minimal impact on fruit maturity at harvest.This was not the case however and it was found that the cincturing and chain sawtreatment dramatically advanced fruit maturity and the Regalis® treatment, possiblythrough the advancement of bud break and flowering, were mildly advanced (Table 10).
Table 9. Harvest maturity and red colour development 2002 seasonWeight
(g)Red colour
(%)Firmness
(N)Sugar
(%TSS)Starch
(% black)Maturity
IndexUntreated 169.2 a 27.7 a 111.8abc 12.0 ab 19.2 a 181 aCincturing 175.0 a 44.6 b 114.7 c 12.0 ab 17.8 a 173 aRegalis 172.5 a 44.2 b 109.0 ab 12.5 b 20.8 a 185 aSummer Pruned 169.3 a 48.0 b 106.8 a 12.0 ab 23.3 a 207 aReflective cloth 171.8 a 67.9 c 109.0 ab 11.9 a 20.8 a 193 aRetain 163.3 a 39.5 ab 113.5 bc 11.7 a 19.2 a 187 aSignificance ns ** * ns ns ns5% LSD 15.4 13.4 5.3 0.64 10 152.0
* significant at p = 0.05, ** significant at p = 0.01
Table 10. Harvest maturity and red colour development 2003 seasonWeight
(g)Red colour
(%)Firmness
(N)Sugar
(%TSS)Starch
(% black)Maturity
IndexUntreated 133 34.2 96.8 12.8 50 378Cincturing 142 20.3 98.3 12.4 10 79Regalis 122 36.4 95.8 11.6 20 165Summer Pruned 141 26.1 97.0 11.1 45 393Reflective cloth 149 55.9 100.3 12.0 70 585Ethrel 127 41.5 100.8 11.2 65 585Chain Sawed 120 39.7 99.5 11.9 5 42
Data from composite fruit sample across replicates and not statistically analysed.
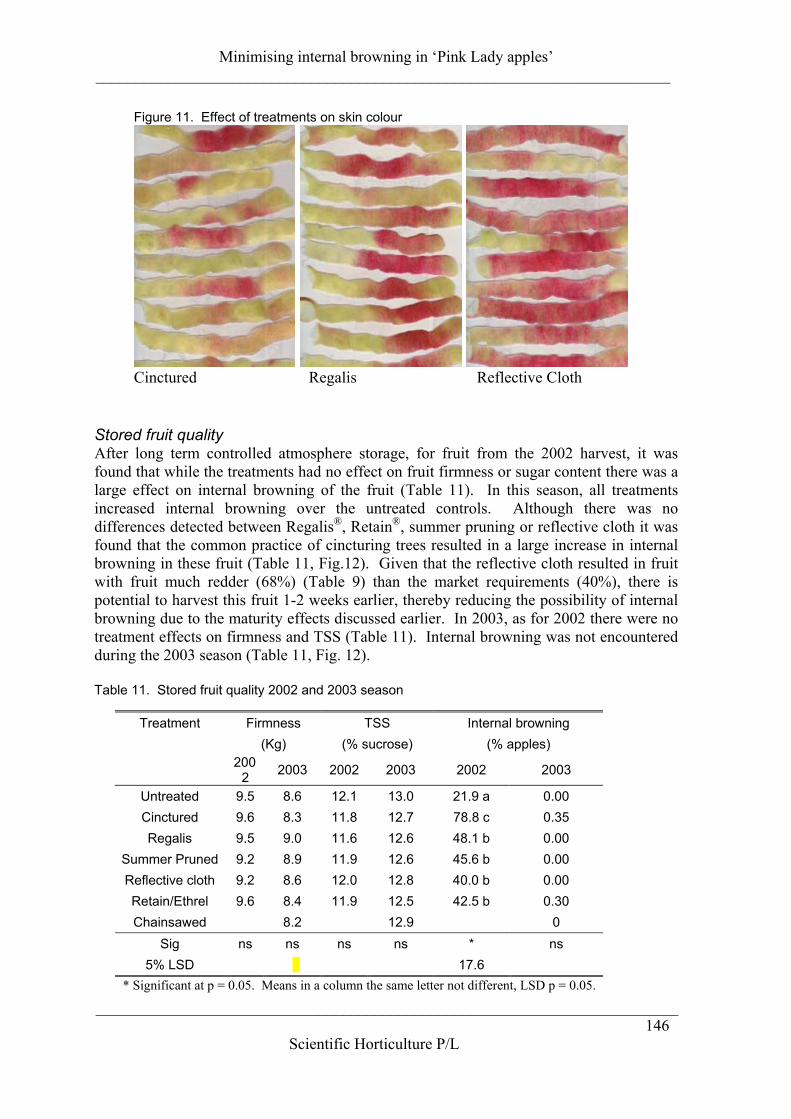
Minimising internal browning in ‘Pink Lady apples’________________________________________________________________________
_________________________________________________________________________146
Scientific Horticulture P/L
Stored fruit qualityAfter long term controlled atmosphere storage, for fruit from the 2002 harvest, it wasfound that while the treatments had no effect on fruit firmness or sugar content there was alarge effect on internal browning of the fruit (Table 11). In this season, all treatmentsincreased internal browning over the untreated controls. Although there was nodifferences detected between Regalis®, Retain®, summer pruning or reflective cloth it wasfound that the common practice of cincturing trees resulted in a large increase in internalbrowning in these fruit (Table 11, Fig.12). Given that the reflective cloth resulted in fruitwith fruit much redder (68%) (Table 9) than the market requirements (40%), there ispotential to harvest this fruit 1-2 weeks earlier, thereby reducing the possibility of internalbrowning due to the maturity effects discussed earlier. In 2003, as for 2002 there were notreatment effects on firmness and TSS (Table 11). Internal browning was not encounteredduring the 2003 season (Table 11, Fig. 12).
Table 11. Stored fruit quality 2002 and 2003 season
Figure 11. Effect of treatments on skin colour
Cinctured Regalis Reflective Cloth
Treatment Firmness TSS Internal browning(Kg) (% sucrose) (% apples)
2002 2003 2002 2003 2002 2003
Untreated 9.5 8.6 12.1 13.0 21.9 a 0.00Cinctured 9.6 8.3 11.8 12.7 78.8 c 0.35Regalis 9.5 9.0 11.6 12.6 48.1 b 0.00
Summer Pruned 9.2 8.9 11.9 12.6 45.6 b 0.00Reflective cloth 9.2 8.6 12.0 12.8 40.0 b 0.00Retain/Ethrel 9.6 8.4 11.9 12.5 42.5 b 0.30Chainsawed 8.2 12.9 0
Sig ns ns ns ns * ns5% LSD 17.6
* Significant at p = 0.05. Means in a column the same letter not different, LSD p = 0.05.
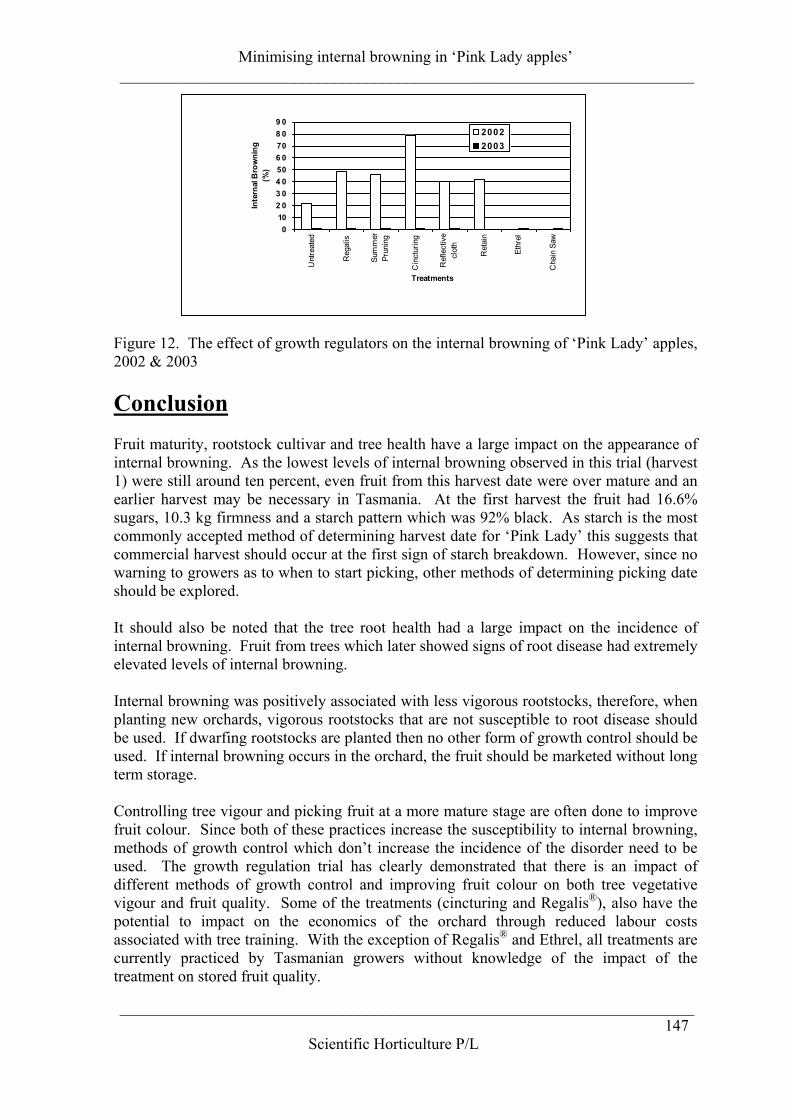
Minimising internal browning in ‘Pink Lady apples’________________________________________________________________________
________________________________________________________________________147
Scientific Horticulture P/L
Figure 12. The effect of growth regulators on the internal browning of ‘Pink Lady’ apples,2002 & 2003
ConclusionFruit maturity, rootstock cultivar and tree health have a large impact on the appearance ofinternal browning. As the lowest levels of internal browning observed in this trial (harvest1) were still around ten percent, even fruit from this harvest date were over mature and anearlier harvest may be necessary in Tasmania. At the first harvest the fruit had 16.6%sugars, 10.3 kg firmness and a starch pattern which was 92% black. As starch is the mostcommonly accepted method of determining harvest date for ‘Pink Lady’ this suggests thatcommercial harvest should occur at the first sign of starch breakdown. However, since nowarning to growers as to when to start picking, other methods of determining picking dateshould be explored.
It should also be noted that the tree root health had a large impact on the incidence ofinternal browning. Fruit from trees which later showed signs of root disease had extremelyelevated levels of internal browning.
Internal browning was positively associated with less vigorous rootstocks, therefore, whenplanting new orchards, vigorous rootstocks that are not susceptible to root disease shouldbe used. If dwarfing rootstocks are planted then no other form of growth control should beused. If internal browning occurs in the orchard, the fruit should be marketed without longterm storage.
Controlling tree vigour and picking fruit at a more mature stage are often done to improvefruit colour. Since both of these practices increase the susceptibility to internal browning,methods of growth control which don’t increase the incidence of the disorder need to beused. The growth regulation trial has clearly demonstrated that there is an impact ofdifferent methods of growth control and improving fruit colour on both tree vegetativevigour and fruit quality. Some of the treatments (cincturing and Regalis®), also have thepotential to impact on the economics of the orchard through reduced labour costsassociated with tree training. With the exception of Regalis® and Ethrel, all treatments arecurrently practiced by Tasmanian growers without knowledge of the impact of thetreatment on stored fruit quality.
0102 03 04 0506 0708 09 0
Unt
reat
ed
Reg
alis
Sum
mer
Prun
ing
Cin
ctur
ing
Ref
lect
ive
clot
h
Ret
ain
Ethr
el
Cha
in S
aw
Treatments
Inte
rnal
Bro
wni
ng (%
)
20022003
Minimising internal browning in ‘Pink Lady apples’________________________________________________________________________
_________________________________________________________________________148
Scientific Horticulture P/L
It was found that the level of fruit colour in the untreated control fruit in both seasons waswell below the market standard of 40% and hence this is not a viable option to the growersand some method of improving fruit colour is required. While cincturing the trees didreduce the vegetative vigour of the trees and increase the level of fruit colour it alsosubstantially increased the level of internal browning to unacceptable levels. As such,industry should be discouraged from applying this treatment to Pink Lady apples. TheRegalis®, summer pruning and Retain® treatments all increased fruit colour in the 2002season to a similar and acceptable level and the level of internal browning stimulated bythese treatments was also similar. Of these treatments Regalis® also eliminated the needfor summer and winter pruning providing a large cost saving to the grower. In additionthis treatment increased flowering in the following season and may have led to morecompacted flowering which may lead to more efficient harvesting procedures. The finaltreatment, reflective cloth, led to a massive increase in fruit red colour with a similar levelof internal browning to the other treatments. Hence this treatment, if adopted, would allowfor earlier harvest of fruit with the resultant benefit of reduced internal browning. Whilesummer pruning was not practiced in this orchard the vegetative growth of this treatmentwill need to be controlled, possibly with winter pruning.
In the 2003 season, that the two treatments that disrupt the water supply to the foliage,cincturing and chain sawing, caused the fruit to mature earlier than the other treatments.The earliness of the Regalis® treatment was probably due to its effect on flowering whereit caused earlier bud break and flowering. Overall, in the second season, fruit colourationwas not as high at harvest and internal browning of long term stored fruit was notencountered. The treatments with the greatest impact in the second season were Ethrel®
(not applied in 2002) and reflective cloths, with the reflective cloths providing superiorcolouration to all other treatments for a second season.
Recommendations
- Given the necessity to improve fruit colour, reduce the incidence of internal browningand to reduce overall operating costs of orchards it is necessary for more than onetechnique to be used by orchardists.
- For general tree health, consideration should be given to the use of vigourousrootstocks and soils should be well drained to reduce root disease. If replanting, thenconsideration should be given to methods of controlling root diseases, especially ifthey were observed in the previous crop.
- The fruit must be harvested at earlier stages of maturity, in order to maintain therequired colour specifications, especially in more vigorous rootstocks, it is necessary toapply treatments for growth control/improvement of fruit colour.
- The effects of cincturing on growth control is minimal and the impact on internalbrowning too high. It is anticipated that similar results will be obtained for the chainsaw treatment. As a result it is recommended that Regalis®, when it becomesavailable, be used by growers to control vegetative vigour. This treatment in itself willallow for improved fruit colour in healthy orchards with sufficient levels of irrigationand nutrition. If further fruit colouration is required then reflective cloths should beconsidered, or, depending on the outcomes of the 2004 season Ethrel® may becommercial alternative, although, at this stage it’s effect on internal browning is notknown and it will need to be registered for this purpose.
Minimising internal browning in ‘Pink Lady apples’________________________________________________________________________
________________________________________________________________________149
Scientific Horticulture P/L
References
Brown, G.S., Schimanski, L.J. (2001) Investigating internal browning of ‘Pink Lady’apples. Internal Report for Top Qual. Pty. Ltd. Hobart Australia.
Drake, S.R., Larsen, F.E., Higgins, S.S. (1991) Quality and storage of ‘Granny Smith’and‘Greenspur’ apples on seedling, M26, MM111 rootstocks. Journal of American Society ofHorticultural Science 116(2): 261-264
Johnston, D.S., Dover, C.J., Colgan, R.J., (1998) Effect of rate of establishment of CAconditions on the development of CO2 injury in Bramleys seedling apples. ActaHorticulturae 464:351-356
Lau, O.L. (1998) Effect of growing season, harvest maturity, waxing, low O2 and elevatedCO2 on flesh browning disorders in ‘Braeburn’ apples. Postharvest Biology andTechnology 14:131-141
Rajapakse, N.C., Banks, N.H., Hewett, E.W., Cleland, D.J., (1990) Development ofoxygen concentration gradients in flesh tissues of bulky plant organs. Journal of theAmerican Society for Horticultural Science. 115(5) 793-797
Schimanski, L.J., Brown, G.S., Jennings, D. (2003) Overcoming treatment damage ofTasmanian ‘Fuji’ apples for Japan. Horticulture Australia – milestone report Project #AP02039.
Volz, R.K., Biasi, W.V., Grant, J.V., Mitcham, E.J. (1998) Prediction of controlledatmosphere induced flesh browning in ‘Fuji’ apple. Postharvest Biology and Technology.13: 97-107
Acknowledgments
The authors wish to thank Grove Research station, Castle Farms, Top Qual, AFFCO, NRE(Victoria), the Australian Apple and Pear Growers Association and Horticulture Australiafor their support of this project.
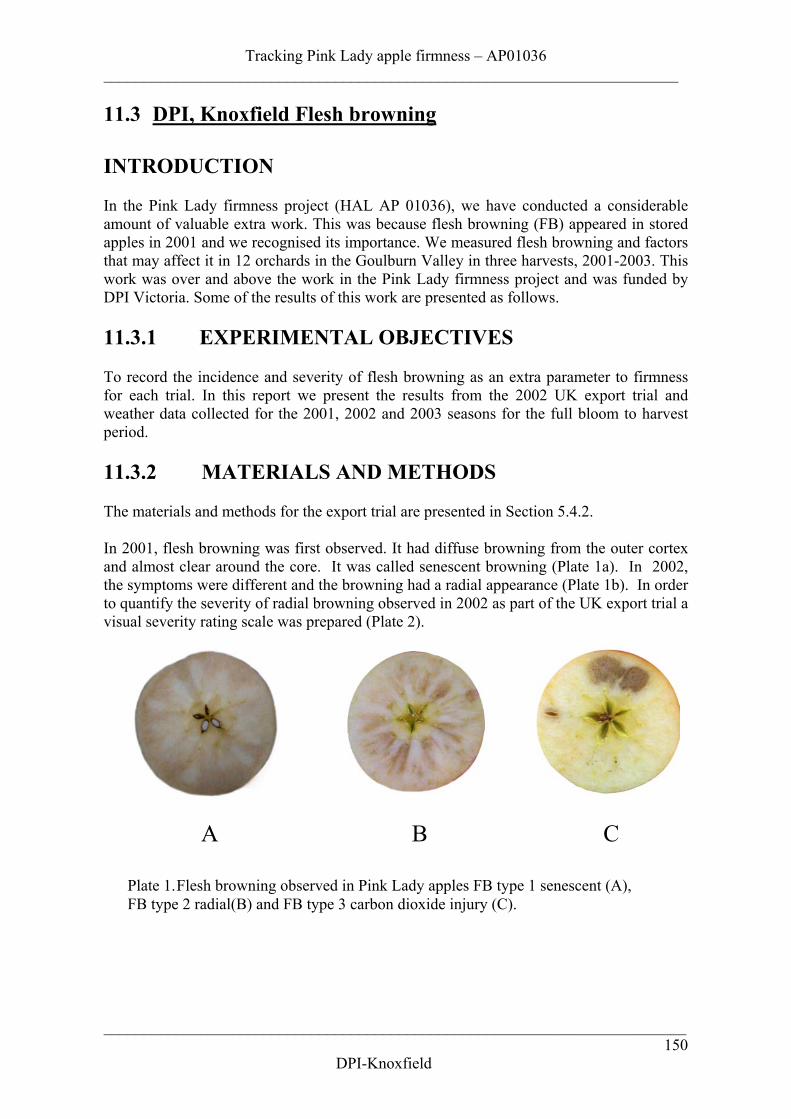
Tracking Pink Lady apple firmness – AP01036________________________________________________________________________
_________________________________________________________________________
DPI-Knoxfield150
11.3 DPI, Knoxfield Flesh browning
INTRODUCTION
In the Pink Lady firmness project (HAL AP 01036), we have conducted a considerableamount of valuable extra work. This was because flesh browning (FB) appeared in storedapples in 2001 and we recognised its importance. We measured flesh browning and factorsthat may affect it in 12 orchards in the Goulburn Valley in three harvests, 2001-2003. Thiswork was over and above the work in the Pink Lady firmness project and was funded byDPI Victoria. Some of the results of this work are presented as follows.
11.3.1 EXPERIMENTAL OBJECTIVES
To record the incidence and severity of flesh browning as an extra parameter to firmnessfor each trial. In this report we present the results from the 2002 UK export trial andweather data collected for the 2001, 2002 and 2003 seasons for the full bloom to harvestperiod.
11.3.2 MATERIALS AND METHODS
The materials and methods for the export trial are presented in Section 5.4.2.
In 2001, flesh browning was first observed. It had diffuse browning from the outer cortexand almost clear around the core. It was called senescent browning (Plate 1a). In 2002,the symptoms were different and the browning had a radial appearance (Plate 1b). In orderto quantify the severity of radial browning observed in 2002 as part of the UK export trial avisual severity rating scale was prepared (Plate 2).
A B C
Plate 1.Flesh browning observed in Pink Lady apples FB type 1 senescent (A),FB type 2 radial(B) and FB type 3 carbon dioxide injury (C).
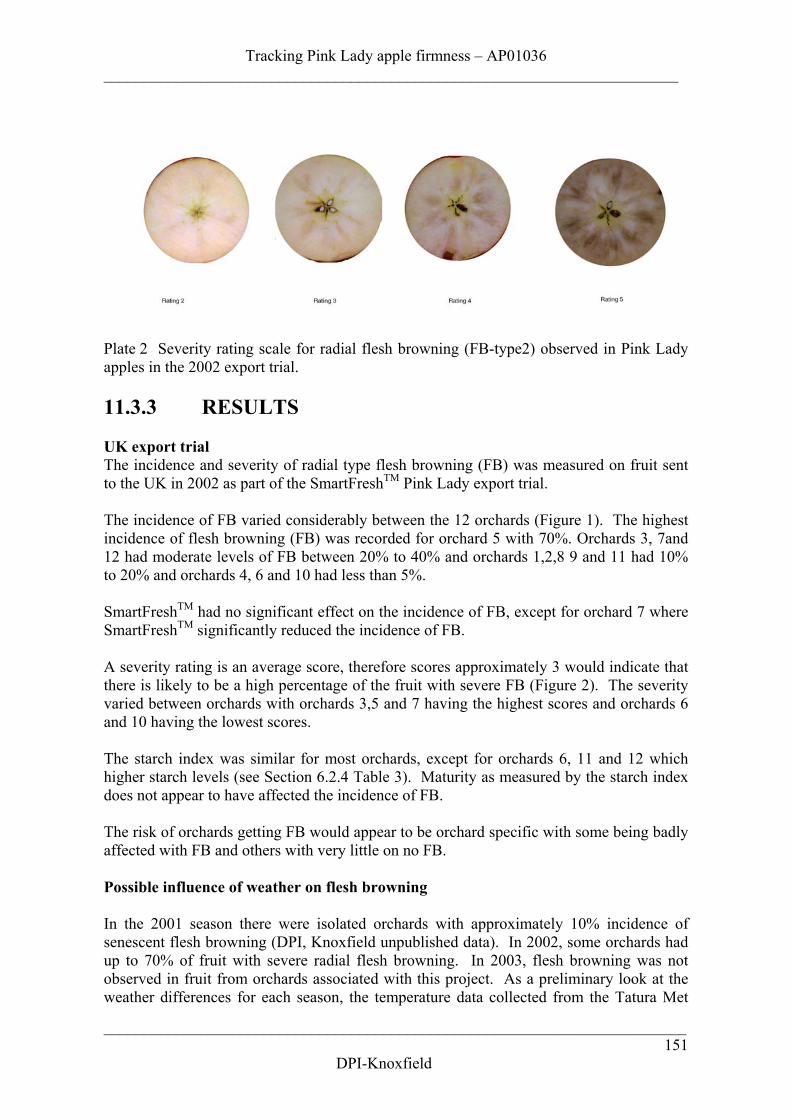
Tracking Pink Lady apple firmness – AP01036________________________________________________________________________
_________________________________________________________________________
DPI-Knoxfield151
Plate 2 Severity rating scale for radial flesh browning (FB-type2) observed in Pink Ladyapples in the 2002 export trial.
11.3.3 RESULTS
UK export trialThe incidence and severity of radial type flesh browning (FB) was measured on fruit sentto the UK in 2002 as part of the SmartFreshTM Pink Lady export trial.
The incidence of FB varied considerably between the 12 orchards (Figure 1). The highestincidence of flesh browning (FB) was recorded for orchard 5 with 70%. Orchards 3, 7and12 had moderate levels of FB between 20% to 40% and orchards 1,2,8 9 and 11 had 10%to 20% and orchards 4, 6 and 10 had less than 5%.
SmartFreshTM had no significant effect on the incidence of FB, except for orchard 7 whereSmartFreshTM significantly reduced the incidence of FB.
A severity rating is an average score, therefore scores approximately 3 would indicate thatthere is likely to be a high percentage of the fruit with severe FB (Figure 2). The severityvaried between orchards with orchards 3,5 and 7 having the highest scores and orchards 6and 10 having the lowest scores.
The starch index was similar for most orchards, except for orchards 6, 11 and 12 whichhigher starch levels (see Section 6.2.4 Table 3). Maturity as measured by the starch indexdoes not appear to have affected the incidence of FB.
The risk of orchards getting FB would appear to be orchard specific with some being badlyaffected with FB and others with very little on no FB.
Possible influence of weather on flesh browning
In the 2001 season there were isolated orchards with approximately 10% incidence ofsenescent flesh browning (DPI, Knoxfield unpublished data). In 2002, some orchards hadup to 70% of fruit with severe radial flesh browning. In 2003, flesh browning was notobserved in fruit from orchards associated with this project. As a preliminary look at theweather differences for each season, the temperature data collected from the Tatura Met
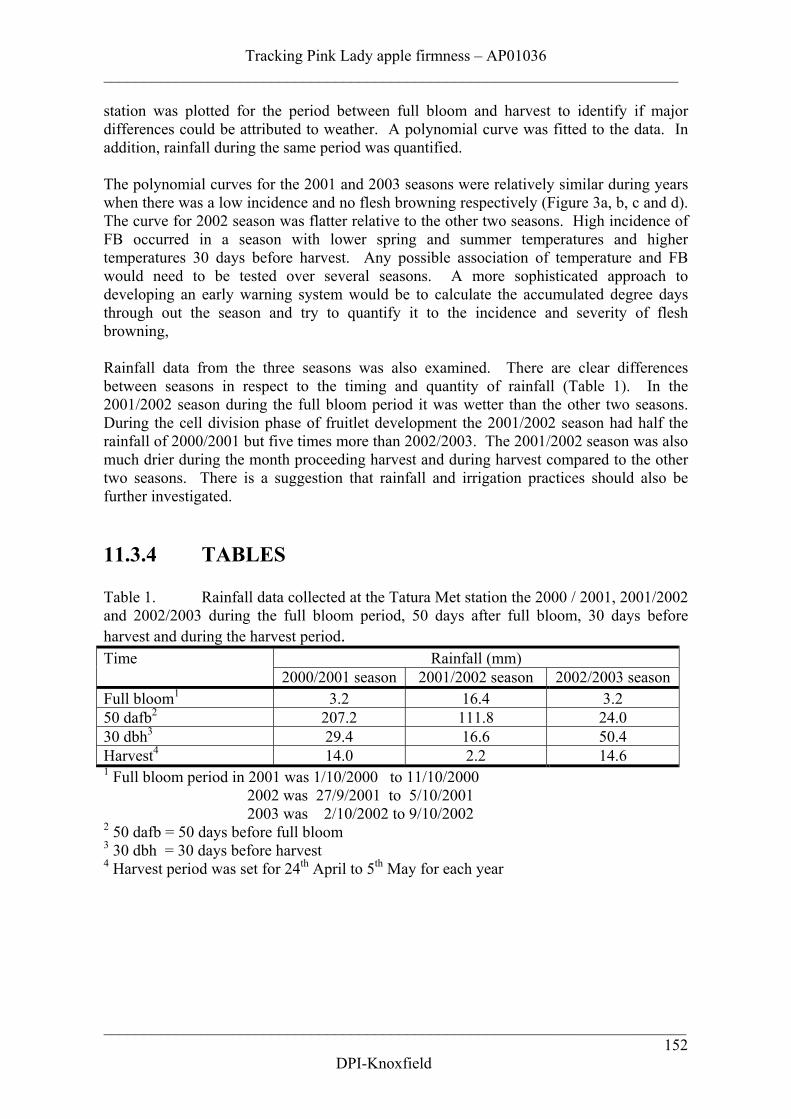
Tracking Pink Lady apple firmness – AP01036________________________________________________________________________
_________________________________________________________________________
DPI-Knoxfield152
station was plotted for the period between full bloom and harvest to identify if majordifferences could be attributed to weather. A polynomial curve was fitted to the data. Inaddition, rainfall during the same period was quantified.
The polynomial curves for the 2001 and 2003 seasons were relatively similar during yearswhen there was a low incidence and no flesh browning respectively (Figure 3a, b, c and d).The curve for 2002 season was flatter relative to the other two seasons. High incidence ofFB occurred in a season with lower spring and summer temperatures and highertemperatures 30 days before harvest. Any possible association of temperature and FBwould need to be tested over several seasons. A more sophisticated approach todeveloping an early warning system would be to calculate the accumulated degree daysthrough out the season and try to quantify it to the incidence and severity of fleshbrowning,
Rainfall data from the three seasons was also examined. There are clear differencesbetween seasons in respect to the timing and quantity of rainfall (Table 1). In the2001/2002 season during the full bloom period it was wetter than the other two seasons.During the cell division phase of fruitlet development the 2001/2002 season had half therainfall of 2000/2001 but five times more than 2002/2003. The 2001/2002 season was alsomuch drier during the month proceeding harvest and during harvest compared to the othertwo seasons. There is a suggestion that rainfall and irrigation practices should also befurther investigated.
11.3.4 TABLES
Table 1. Rainfall data collected at the Tatura Met station the 2000 / 2001, 2001/2002and 2002/2003 during the full bloom period, 50 days after full bloom, 30 days beforeharvest and during the harvest period.
Rainfall (mm)Time2000/2001 season 2001/2002 season 2002/2003 season
Full bloom1 3.2 16.4 3.250 dafb2 207.2 111.8 24.030 dbh3 29.4 16.6 50.4Harvest4 14.0 2.2 14.61 Full bloom period in 2001 was 1/10/2000 to 11/10/2000 2002 was 27/9/2001 to 5/10/2001 2003 was 2/10/2002 to 9/10/20022 50 dafb = 50 days before full bloom3 30 dbh = 30 days before harvest4 Harvest period was set for 24th April to 5th May for each year
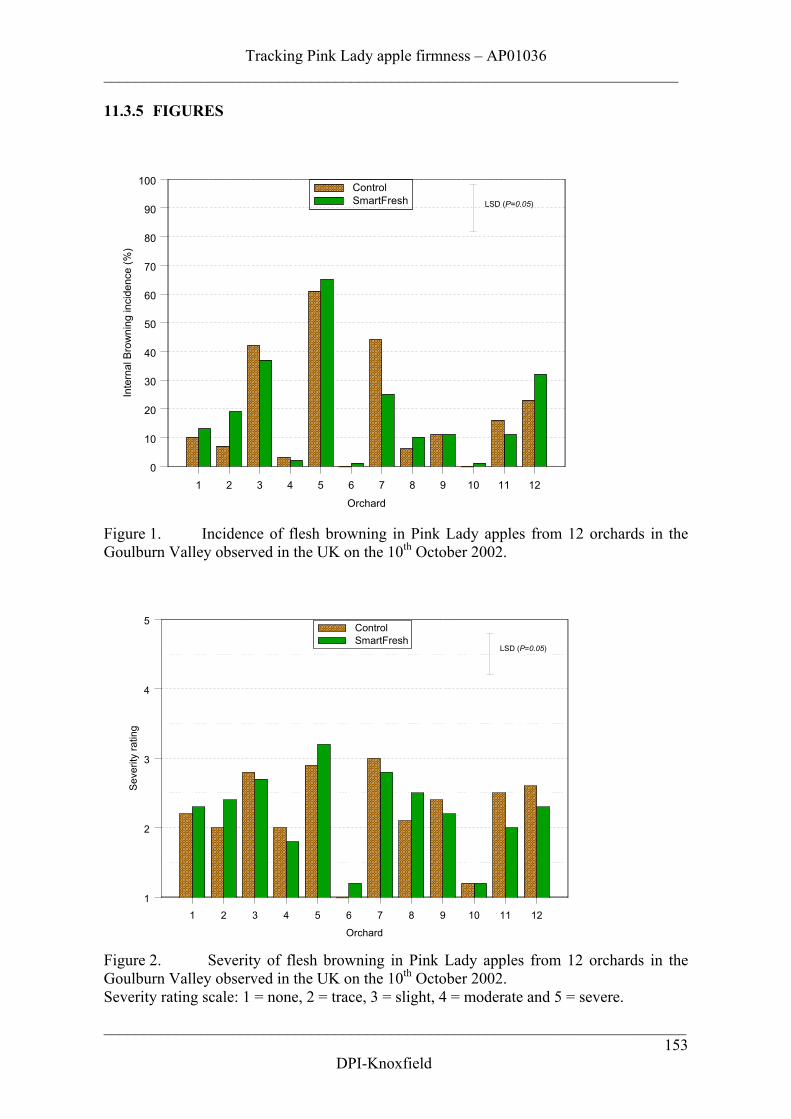
Tracking Pink Lady apple firmness – AP01036________________________________________________________________________
_________________________________________________________________________
DPI-Knoxfield153
11.3.5 FIGURES
1 2 3 4 5 6 7 8 9 10 11 12
Orchard
0
10
20
30
40
50
60
70
80
90
100
Inte
rnal
Bro
wni
ng in
cide
nce
(%)
ControlSmartFresh LSD (P=0.05)
Figure 1. Incidence of flesh browning in Pink Lady apples from 12 orchards in theGoulburn Valley observed in the UK on the 10th October 2002.
1 2 3 4 5 6 7 8 9 10 11 12
Orchard
1
2
3
4
5
Sev
erity
ratin
g
ControlSmartFresh
LSD (P=0.05)
Figure 2. Severity of flesh browning in Pink Lady apples from 12 orchards in theGoulburn Valley observed in the UK on the 10th October 2002.Severity rating scale: 1 = none, 2 = trace, 3 = slight, 4 = moderate and 5 = severe.
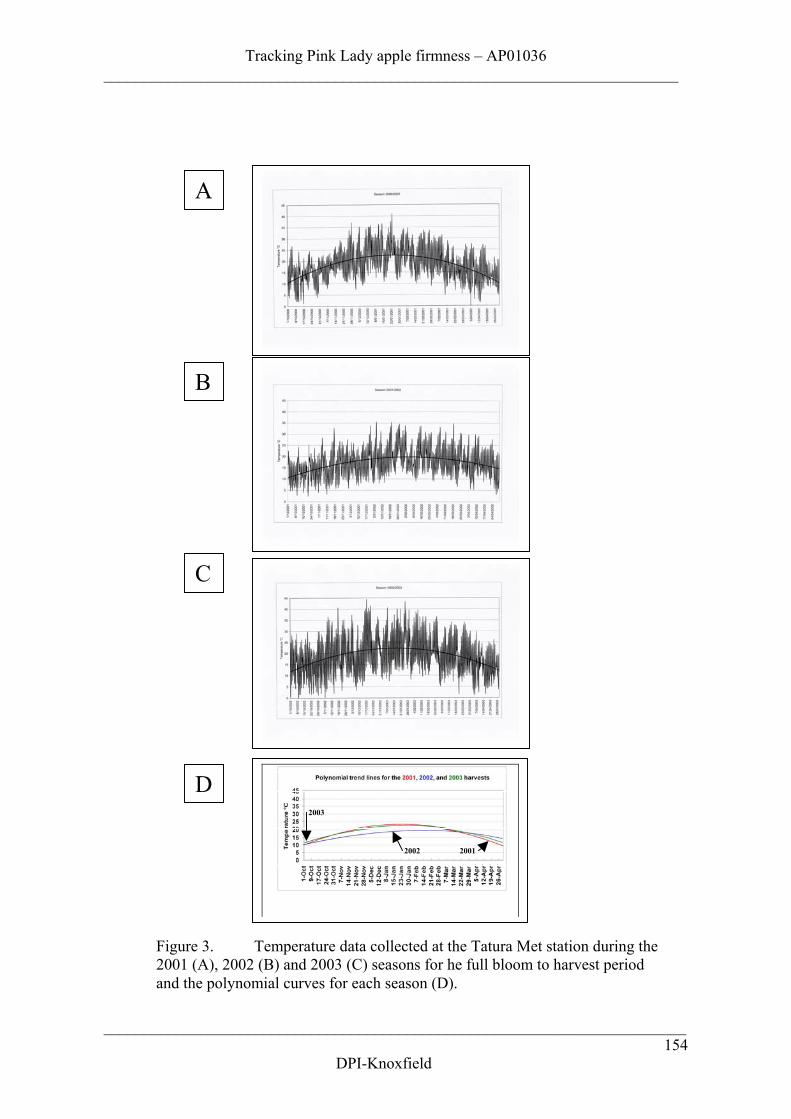
Tracking Pink Lady apple firmness – AP01036________________________________________________________________________
_________________________________________________________________________
DPI-Knoxfield154
A
B
C
D
Figure 3. Temperature data collected at the Tatura Met station during the2001 (A), 2002 (B) and 2003 (C) seasons for he full bloom to harvest periodand the polynomial curves for each season (D).
2003
2001 2002
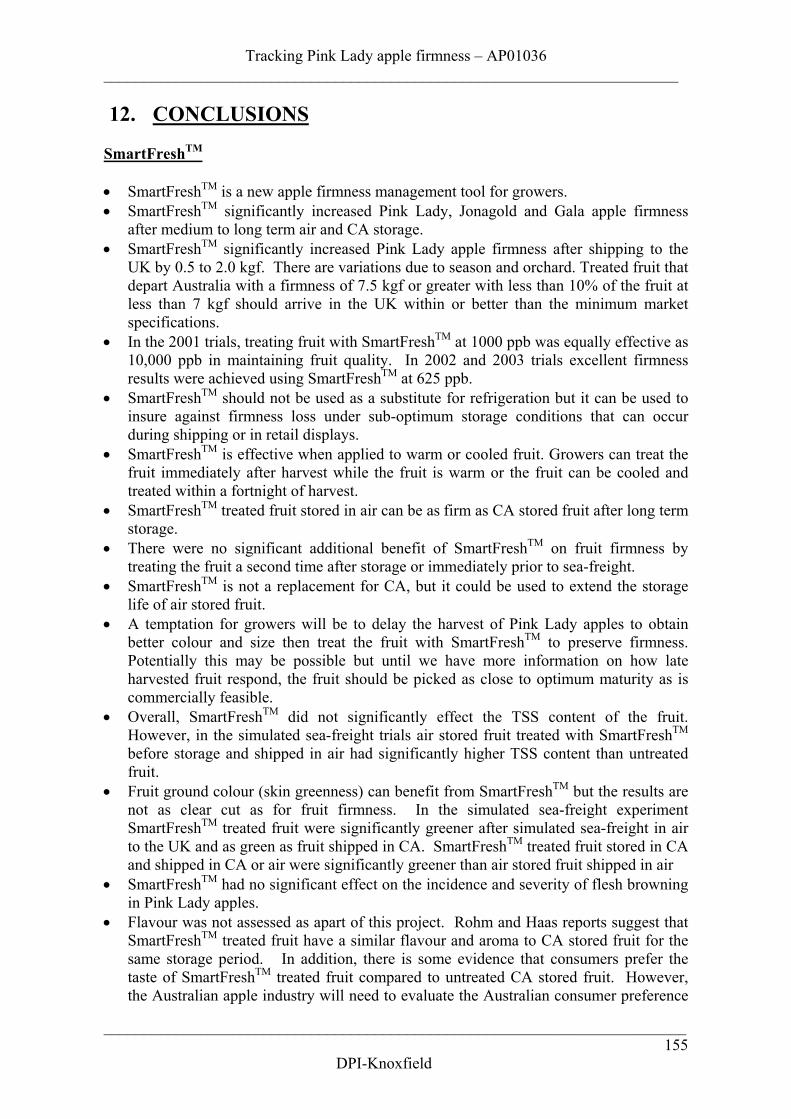
Tracking Pink Lady apple firmness – AP01036________________________________________________________________________
_________________________________________________________________________
DPI-Knoxfield155
12. CONCLUSIONS
SmartFreshTM
• SmartFreshTM is a new apple firmness management tool for growers.• SmartFreshTM significantly increased Pink Lady, Jonagold and Gala apple firmness
after medium to long term air and CA storage.• SmartFreshTM significantly increased Pink Lady apple firmness after shipping to the
UK by 0.5 to 2.0 kgf. There are variations due to season and orchard. Treated fruit thatdepart Australia with a firmness of 7.5 kgf or greater with less than 10% of the fruit atless than 7 kgf should arrive in the UK within or better than the minimum marketspecifications.
• In the 2001 trials, treating fruit with SmartFreshTM at 1000 ppb was equally effective as10,000 ppb in maintaining fruit quality. In 2002 and 2003 trials excellent firmnessresults were achieved using SmartFreshTM at 625 ppb.
• SmartFreshTM should not be used as a substitute for refrigeration but it can be used toinsure against firmness loss under sub-optimum storage conditions that can occurduring shipping or in retail displays.
• SmartFreshTM is effective when applied to warm or cooled fruit. Growers can treat thefruit immediately after harvest while the fruit is warm or the fruit can be cooled andtreated within a fortnight of harvest.
• SmartFreshTM treated fruit stored in air can be as firm as CA stored fruit after long termstorage.
• There were no significant additional benefit of SmartFreshTM on fruit firmness bytreating the fruit a second time after storage or immediately prior to sea-freight.
• SmartFreshTM is not a replacement for CA, but it could be used to extend the storagelife of air stored fruit.
• A temptation for growers will be to delay the harvest of Pink Lady apples to obtainbetter colour and size then treat the fruit with SmartFreshTM to preserve firmness.Potentially this may be possible but until we have more information on how lateharvested fruit respond, the fruit should be picked as close to optimum maturity as iscommercially feasible.
• Overall, SmartFreshTM did not significantly effect the TSS content of the fruit.However, in the simulated sea-freight trials air stored fruit treated with SmartFreshTM
before storage and shipped in air had significantly higher TSS content than untreatedfruit.
• Fruit ground colour (skin greenness) can benefit from SmartFreshTM but the results arenot as clear cut as for fruit firmness. In the simulated sea-freight experimentSmartFreshTM treated fruit were significantly greener after simulated sea-freight in airto the UK and as green as fruit shipped in CA. SmartFreshTM treated fruit stored in CAand shipped in CA or air were significantly greener than air stored fruit shipped in air
• SmartFreshTM had no significant effect on the incidence and severity of flesh browningin Pink Lady apples.
• Flavour was not assessed as apart of this project. Rohm and Haas reports suggest thatSmartFreshTM treated fruit have a similar flavour and aroma to CA stored fruit for thesame storage period. In addition, there is some evidence that consumers prefer thetaste of SmartFreshTM treated fruit compared to untreated CA stored fruit. However,the Australian apple industry will need to evaluate the Australian consumer preference
Tracking Pink Lady apple firmness – AP01036________________________________________________________________________
_________________________________________________________________________
DPI-Knoxfield156
for SmartFreshTM treated fruit stored in air or CA over short and long term storageperiods to determine its value as an apple quality management tool.
Maturity and storage
Overall, fruit from the first harvest was significantly firmer than fruit from the secondharvest after long-term storage. Firmness was not strongly linked to starch levels,however, earlier picked fruit were firmer and remained that way after harvest compared tolater picked fruit.
Generally, if the fruit goes in firm it will outturn firm. This was true for the 2001 and 2002harvests but in a bad drought year (2003 harvest) fruit lost firmness more rapidly instorage. For orchard 5 data, in 2001 and 2002 the fruit firmness at harvest was greater than8 kgf at the 2nd pick and the outturn firmness after 6 months CA storage was good at 7.1kgf. In the 2003 harvest the firmness had ‘bolted’. The starch scores were comparablewith the other orchards but the fruit firmness at harvest was low (6.9 kgf) at the 2nd pick.The nutrient status of the fruit was adequate for long term storage. It would appear thatthis fruit was stressed in the orchard, possibly due to drought. The export trialdemonstrated firmness loss was arrested by SmartFreshTM.
The firmness of the fruit should be monitored proceding and during the harvest period. Ina non drought season if the fruit is harvested with a firmness greater than 8 kgf with lessthan 10% of a sample population less than 8 kgf then with good post harvest managementit should outturn well after long term storage and would be suitable for export.
Firmness at harvest can be more of a limiting factor if the fruit is destined for the exportmarket. In this project fruit from the second harvest closely matched the dates when thegrowers started harvesting the same orchard. Over the three years this trial was conductedthe fruit from all of the collaborating orchards picked on the commercial harvest date metthe industry standard of 6.5 kgf after long term storage. The firmness standards for theexport market demand that the fruit firmness is greater than 7 kgf with no more than 10%of the fruit 6.0 kgf to 6.9 7kgf. Therefore, to meet an export market the fruit firmness atharvest needs to be at least 8 kgf.
Most growers in the Goulburn Valley pick from Pink Lady trees three times. The first pickis a colour pick and fruit is sold for cash flow. Unfortunately, this is the best fruit thatshould be going into long term storage. The second pick is for long term storage and thethird is usually for immediate sale but if there is glut, it goes into storage until the marketimproves. The domestic market colour standards were lowered in 2003 to 40% to 50%blush, comparable with export standards. Therefore, the minimum starting point forharvest is going to be based on colour. Starch tests are good if they match the minimumcolour standard, but there is a tendency for some growers to leave the fruit on the treelonger to get more than the minimum colour. As a result the starch levels drop below thelevel optimum for long term storage. A major economic consideration for growers is thepotential for fruit to size up substantially in the harvest window period between optimumphysiological maturity, based on starch and the commercial harvest time, ten days later.Gains of 1.6 tonnes per hectare in this period are possible. But the grower is banking onCA technology to arrest the firmness loss. For most CA operations today this may bepossible for firmness, but it may prove disastrous for fruit in a bad flesh-browning year.
Tracking Pink Lady apple firmness – AP01036________________________________________________________________________
_________________________________________________________________________
DPI-Knoxfield157
Ethylene is a major limiting factor to firm fruit outturns. This was demonstrated by the useof SmartFreshTM to block ethylene action which significantly increased fruit firmness forall orchards. Therefore, if possible, the rooms need to be scrubbed for ethylene while therooms are being filled and during storage. In addition, the fruit needs to be cooled rapidlyafter harvest and stored promptly in 1.5% oxygen. The alternative to ethylene scrubbing istreating the fruit with SmartFreshTM.
In the experimental air storage trials the results suggest that when the fruit was storedunder excellent temperature management with rapid cooling, as was provided at DPI,Knoxfield, fruit from some orchards outturned firmer compared to commercially storedfruit. Therefore, rapid cooling and maintenance of excellent storage temperature canimprove fruit firmness.
Shipping temperature
Maintaining the cool chain is a basic postharvest principle for maintaining fruit quality.Apples should be held at close to 0oC to minimise quality loss. In the simulated shippingtrials and the SmartFreshTM trials, the effects of 6 weeks simulated shipping at 4oC on fruitfirmness was variable. In some trials there was a significant reduction in fruit firmness at4oC compared to maintaining the coolchain at 0oC. The response of the fruit to poorstorage temperature was dependent on the orchard of origin. Given that it likely thatshipping containers will have hot spots then it is probable that shipping temperature willlimit consistently firm outturns in the UK for fruit from some orchards.
In this project we attempted to compare optimum harvest maturity with commercialharvest maturity. The starch levels for the 2nd pick commercial harvest wereapproximately 7.5 Ctifl. A starch level of 7.5 Ctifl is only slightly above where traditionalstarch scores are expected to be for medium term storage. For medium term storage astarch score between 5 and 7 is considered acceptable. Australian Pink Lady apples arewanted in the UK up to the end of October. This means that Pink Lady apples for exportneed only be stored for medium term CA storage up to early September (allowing for a 4to 5 week shipping time). Therefore, if the fruit can be harvested with a firmness of 8 kgfor greater and a starch score of approximately 7 and provided skin blush, intensity and totalsoluble solids and storage conditions are not limiting factors the fruit has a high probabilityof meeting the export firmness standard.
Nutrition
The industry wanted to know if foliar sprays applied during the early fruitlet stages couldcorrect mineral imbalances in time to achieve normal levels at harvest.
In this project the results were inconclusive. The nutrient levels did improve between the25 gram and 55 gram fruitlet stages as a result of the higher input applied between the 25gram and 50 gram fruitlet stages. However, there were also orchards on lower nutrientinputs with fruit of similar nutrient levels 90 DAFB and at harvest.
In two drought years that the higher nutrient input was trialed, there was no evidence thatthe early warning system wasn’t working. The drought conditions were probably having abigger effect on fruit firmness than the nutrient levels in the fruit. Nutritional studies are
Tracking Pink Lady apple firmness – AP01036________________________________________________________________________
_________________________________________________________________________
DPI-Knoxfield158
usually run over many years and nutritional programs such as Phosyn’s full nutritionalprogram can take several years before the full benefits are achieved. Therefore, more yearsof evaluation are needed to clarify the benefits of early warning nutrient correction system,hopefully not in drought conditions.
Overall there appears to be a need to get more sprays on during the 50 DAFB (cell divisionphase) to maximise the mineral levels and improve firmness, colour and return bloom. Thebest results are obtained from foliar sprays if applied when humidity is high, temperaturesare less the 25°C, light intensity is low, young foliage is fully turgid. The pH of themixture should be slightly acid and the leaf area should be thoroughly wetted.
Further work is needed to determine the optimum nutritional levels for Pink Lady apples.This project used standards as provided
DPI, Knoxfield will continue to work with Phosyn in analysing the full set of mineral dataand the results will be made available to the industry when they are complete.
Calcium dipping has been shown for other apple varieties to improve fruit firmnessoutturn. In this project, there was no significant effect of "Stopit" calcium dip (16%calcium as calcium chloride) used at the rate of 1.35 litres per 100 litre of water on fruitfirmness after 8 months CA storage. This has also been confirmed by Gordon Brown inthe HAL funded project on 'Jonagold' apples (AP99031). The failure to achieve asignificant result may have been due to: 1) the recommended rate being too low to benefitfruit firmness, in order to reduce the risk of lenticel injury and 2) the fruit was not dippedon the day it was picked, although research is needed to confirm this hypothesis.
Crop load and tree vigour
The crop load and tree vigour need to be looked at in relation to the nutritional status of thefruit. It may be possible to carry two consecutive high yielding years provided the treesvigour is reduced and the nitrogen to calcium ratio is low allowing high calciumavailability for the fruit.
Weather and microclimate
Orchard temperature (accumulated degree-days) was not significantly different betweenthe orchards and was therefore not seen as a major limiting factor for firm fruit. However,the proximity of orchards 1, 4, 9 and 10 to the Goulburn river was thought to produce amicroclimate conducive to red colour development and thus earlier harvesting (closer tooptimum for long term storage).
Flesh browning
The causes of flesh browning (FB) in Pink Lady apples are not well understood. It is mostlikely a combination of several factors that stress the fruit before harvest and postharvestconditions.• There is likely to be more than one type of flesh browning. This project has
characterised three types, Type I: senescent, Type II: radial, and Type III: carbondioxide injury. Each type may be the manifestation of different precursors.
Tracking Pink Lady apple firmness – AP01036________________________________________________________________________
_________________________________________________________________________
DPI-Knoxfield159
• Seasonal variation has an impact on FB as it was absent in 2003. How the weatherinteracts with the cultural practices or locations of individual orchards is not known.
• SmartFreshTM does not appear to affect the incidence or severity of flesh browning.This would suggest that the problem is independent of ethylene action.
• Late picked, over mature fruit are more susceptible to FB.• Diseased root systems, less vigorous root-stocks and cincturing are factors that can
increase the risk of fruit developing FB.• Regalis and the use of reflective cloth may reduce the risk of FB by reducing tree
vigour and advancing colour development which avoids having to pick over maturefruit.
• During this project fruit from several orchards have been stored at 0oC and in a CAstorage atmosphere of 2.5% O2 plus 1% CO2. Fruit from some orchards developed FBothers did not, even though they were stored in the same tent. This suggests that theproblem was orchard specific and that the fruit was pre-conditioned to the disorderprior to storage. In addition, the carbon dioxide level should not exceed 1% or FB-type3 may occur.
• If we knew why two orchards less than half a kilometer apart can differ so greatly inthe incidence and severity of FB then we may have the answers to predict or developstrategies for avoiding the problem in the future.
Some of the unknown factors that could be affecting fruit firmness that were notaddressed in this project are:
• Water stress.• Fruit tissue density and cell size.• Canopy density in relation to summer pruning.• Seasonal weather conditions temperature, relative humidity, and sunshine hours in the
preceding season.• Tree health management.• Fruit respiration rates at harvest.• Storage humidity.
In hindsight this project attempted to monitor too many parameters across many properties.It may have been prudent to work with fewer orchards, maybe even one orchard with ahistory of soft fruit outturns. In the latter situation we could divide the orchard up into anumber of experiments whereby only one factor was changed at a time.
The project was designed to investigate macro-effects not the micro-effects. Further workis recommended to investigate the micro-effects responsible for orchard differences in fruitfirmness.
Tracking Pink Lady apple firmness – AP01036________________________________________________________________________
_________________________________________________________________________
DPI-Knoxfield160
13. TECHNOLOGY TRANSFER
13.1 Publications
• ‘Tracking Pink Lady apple firmness” an article for NVFA Technical Bulletin based atalk by Ian Wilkinson 20th March 2002 at SPC/Ardmona PL.
13.2 Meetings and presentations
• On the 24th May 2001 a meeting was convened at the Institute of Sustainable IrrigatedAgriculture to report on the results to date and to plan the following season’s trialwork.
The original project proposal aim was to have 6 properties on which a block of treeswould be on the complete Phosyn nutrient correction program and the other block thegrower would use his existing nutrient program. The logistics of achieving this aimusing the growers spray unit and the difficulty of ensuring the two blocks of trees werenot cross contaminated by the two spray regimes meant that another strategy had todevised. It was decided to make the orchards experimental replicates and expand thenumber of blocks from 6 to 12. The aim was to have blocks ranging from poor toexcellent fruit nutrient status of which some will be on a full Phosyn nutrientcorrection program and to correlate the fruit nutrient status with fruit firmness.
• "Getting the nutrient analysis work back on track" A meeting was held at IHD,Knoxfield on the 17th April 2002 to review the nutrient status work. Present were NickSanders Phosyn PL and Bruce Tomkins and Ian Wilkinson DPI.
• "Getting the nutrient analysis work back on track" A meeting was held at theHoliday Inn St Kilda Rd. on the 23rd April 2002 to review and plan the nutrient analysiswork. Present were Steve Howse, Mark Ridings, Michael Waites, Nick Sanders fromPhosyn PL and Bruce Tomkins and Ian Wilkinson DPI.
• "2001 nutrient analysis results presented to growers participating in the full Phosynnutrient program". A meeting was held in Shepparton on the 23rd October 2002.Present were Nick Sanders Phosyn PL, Ian Wilkinson DPI, Colin Little privateconsultant and growers Mark Morey, Jim Ymer, Alex and Skinda Kaso, Phillip Pullarand Duncan Brown.
• "Progress report and planning meeting for nutrient analysis work". A meeting washeld on the 24th May 2002 at IHD, Knoxfield with John Brookes UK Phosyn to discussthe project progress and plan for the UK visit. Present were Nick Sanders Phosyn,Colin Little private consultant, Bruce Tomkins and Ian Wilkinson DPI.
• "Tracking Pink Lady apple firmness and flesh browning project summary" was presentedto Dr Angelo Zanella Laimburg Italy on the 3rd October 2002.
Tracking Pink Lady apple firmness – AP01036________________________________________________________________________
_________________________________________________________________________
DPI-Knoxfield161
• "A summary of 1-MCP work done at IHD, Knoxfield" was presented to Chingford FruitPackers UK which included the Pink Lady work, on the 8th October 2002.
• "A summary of 1-MCP work done at IHD, Knoxfield" was presented to Rohm and HaasPL in Philadelphia, USA on the 14th October 2002.
• "Tracking Pink Lady apple firmness summary of results so far" was presented at theAFFCO AGM, at the Stanford Hotel Glenelg, Adelaide 19th October 2002. A copy ofthe presentation is attached to this CD as an acrobat .pdf file.
• "Pink Lady UK outturn results". On the 20th November the results of the Pink LadyUK outturn results were sent to all 12 growers participating in the project.
• "IHD, Knoxfield SmartFreshTM (1-MCP) projects overview presented to JaneTurner, the new Australasian manager for SmartFreshTM". Meeting held at IHD,Knoxfield on the 27th November 2002. Present were John Faragher and Ian WilkinsonDPI and Nic Tydens Agrisearch.
• Flesh browning observations in the AP 01036 project was presented at the AFFcoworkshop held at Attwood, DPI on the 12th December 2002.
• “Effect of SmartFreshTM on apples and pears” talk presented at the AFFco World ClassApple Workshop “Moving towards world best practice” 31st May 2003.
• “Update on the Tracking Pink Lady apple firmness project”. AFFco Pink Ladytechnical workshop, 16th October 2003 at Primary Industries Research Victoria-Knoxfield.
• “Update on SmartFreshTM work from the Tracking Pink Lady apple firmness project”.AFFco Pink Lady technical workshop, 16th October 2003 at Primary IndustriesResearch Victoria-Knoxfield.
13.3 Implementation
SmartFreshTM became available in April 2004 and some coolstores are trying it for the firsttime on Pink Lady apples from the 2004 harvest.
Tracking Pink Lady apple firmness – AP01036________________________________________________________________________
_________________________________________________________________________
DPI-Knoxfield162
14. RECOMMENDATIONS
1. Soft fruit outturns appear to be orchard specific. A history of each orchard would be avaluable problem solving tool. We recommend growers keep management details ofindividual blocks and link this to postharvest performance records for fruit from thatblock.
2. Fruit should be picked close to the optimum starch score of 4.5 Ctifl or the DPI 10point scales for Pink Lady apples, because this, combined with fruit firmness greaterthan 8 kgf and less than 9.5 kgf minimises the risk of soft outturns after long termstorage.
3. The Ctifl 10 point starch chart is currently the best available starch rating chart.However, the DPI 10 point chart should be considered as an alternative given that theplates are actual photographs of iodine stained Pink Lady apples, not stylised radialtype staining patterns.
4. It is realistic to pick the fruit for medium term CA storage if it is going to be exportedno later than mid-September. However, with this strategy the postharvest cooling andCA establishment, needs to be prompt. Ethylene scrubbing during room filling andstorage is advised and storage in 1.5% oxygen and less than 1% carbon dioxide ispreferable.
5. SmartFreshTM can be applied immediately after harvest and excellent firmness outturnsfor Pink Lady apples should result, if picked at the correct maturity.
6. If treatment is not possible the same day the fruit is picked, SmartFreshTM should beapplied within 12 days of harvest.
7. The temptation for growers will be to use SmartFreshTM after harvest to enable fruit tobe left longer on the tree, to colour. This should be resisted until such time that it hasbeen shown to be safe for this purpose. There is a need to evaluate SmartFreshTM
effects on late harvested fruit firmness in relation to storage time and flavourdevelopment.
8. Treating fruit with SmartFreshTM after storage, prior to sending it to the UK is notrecommended because it does not appear to significantly improve outturn quality.
9. A method needs to be developed for determining the maturity variation within anorchard. A twenty fruit sample is probably not a good representation of the maturitystatus of the orchard. Part of the problem with soft outturns is due to variability of fruitfirmness at harvest. If the orchardist knows that the trees in an orchard are carryingfruit with a highly variable firmness then he will be better placed in his decisionmaking to it determine its ultimate market destination.
10. Trees’ vegetative growth needs to be settled down and the canopy opened up tomaximise light penetration into the tree to improve fruit colour development.
11. Balanced fruit nutrition is not a short-term investment. The orchardist needs to havefruit and leaf nutrition analyses done at the fruitlet stage each year to determinefertigation and foliar spray needs and to optimise the nutrient levels for improvingfirmness outturns.
12. It is proposed that the minimum fruit firmness for export should be 7.5 kgf, tominimise the risks of soft fruit outturns in the UK.
13. Growers are recommended to use the fact sheets for minimising firmness loss of PinkLady apples for domestic and export markets (see Section 17.2 Appendix B).
Tracking Pink Lady apple firmness – AP01036________________________________________________________________________
_________________________________________________________________________
DPI-Knoxfield163
15. ACKNOWLEDGMENTSThis project was jointly funded by Horticultural Australia Ltd, Apple and Pear AustraliaLtd, the Department of Primary Industries, Victoria and voluntary contributions fromAgroFresh and Phosyn plc.
The following individuals are also acknowledged for their contribution to the project:
A major thank you must go to Christine Frisina, without whose help this project would nothave been possible.
Colin Little for his assistance in collecting maturity, crop load and tree vigour data.
Nick Sanders, Senior Fruit consultant with Phosyn Plc for his assistance in formulating thePhosyn nutrient programs, collection of fruitlet samples for nutrient analysis and liasingwith the growers in respect to nutrient issues linked with this project.
Biometricians Peter Franz and Fiona Thomson (DPI, Knoxfield) and Chris Brien(University of South Australia) for their assistance in analysing the in data.
Thanks to Mark Ridings Manager and Rob Cirocco Laboratory Manager, AnalyticalServices Phosyn Australia for organising the fruit nutrient analysis.
Janyce Truett and Pam Rogers (DPI, Knoxfield) for providing and maintaining thecontrolled atmosphere and cold room requirements.
Norm Morrison, Glenn Hale, Andrew Hamilton, Mark Collins and Christine Frisina (seephotograph page 174), Simone Kreidl, Pam Rogers, Sonja Winkler, John Lopresti, WarrickTurnbull, John Faragher, Fouad Goubran, (DPI, Knoxfield), Paul James (SA Departmentof Agriculture) and Ben Williams (casual worker) for assisting in picking and getting thefruit into storage trials.
Bruce Tomkins and Robert Holmes (DPI, Knoxfield) for their assistance in writing thisreport.
Jane Turner, AgroFresh (Rohm and Haas Pty Ltd) for providing SmartFreshTM andsupporting the on going research.
Andrew Dick, Australian Fresh Fruit Company (AFFco) for organising a meeting withSteve Howse from Phosyn Plc which resulted in their collaboration in this project.
Nethersole Orchards, AFFco, Eastfield Orchard and Geoffery Thompson & Growers fortheir assistance in getting the experimental fruit to Chingford Fruit Packers in the UK.
Francis Wheatley and staff, at Chingford Fruit Packers for their help in getting the outturnquality of experimental shipments of apples done in 2001, 2002 and 2003 shipments.
All of the growers who kindly allowed us to harvest fruit and conduct trials on theirproperties.
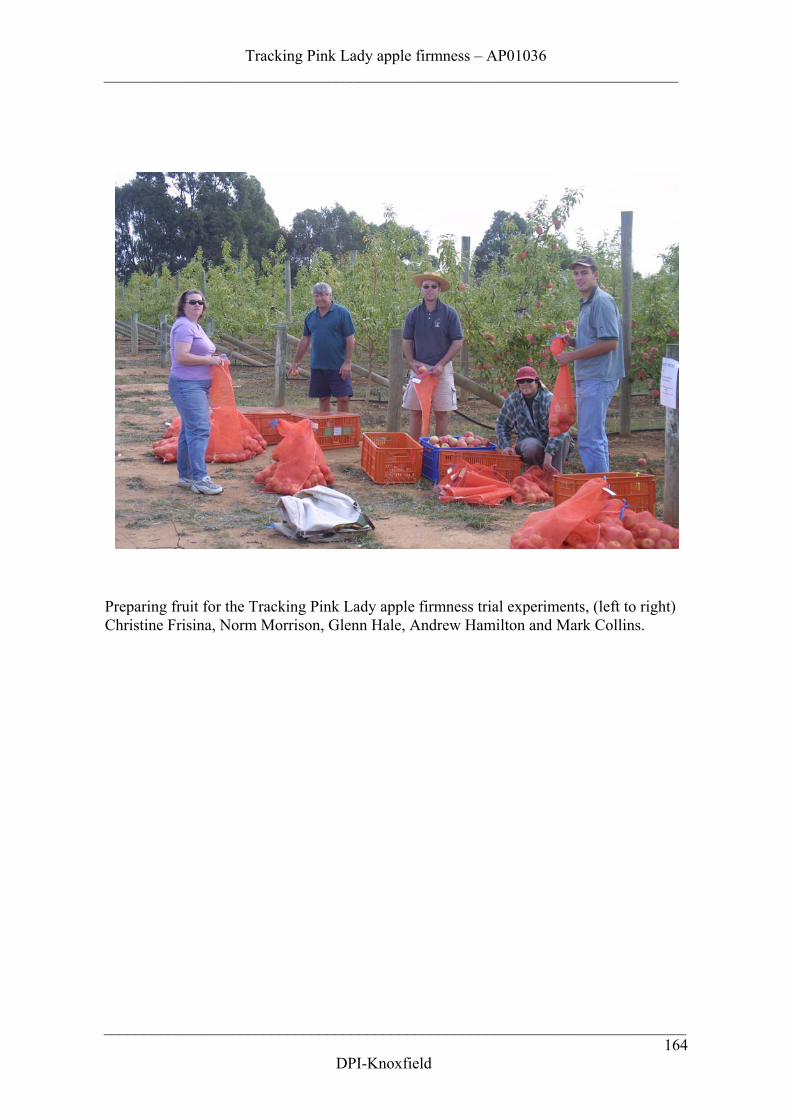
Tracking Pink Lady apple firmness – AP01036________________________________________________________________________
_________________________________________________________________________
DPI-Knoxfield164
Preparing fruit for the Tracking Pink Lady apple firmness trial experiments, (left to right)Christine Frisina, Norm Morrison, Glenn Hale, Andrew Hamilton and Mark Collins.
Tracking Pink Lady apple firmness – AP01036________________________________________________________________________
_________________________________________________________________________
DPI-Knoxfield165
16. BIBLIOGRAPHY
Abbott J A, Conway W S and Sams C E, (1989) Postharvest calcium chloride infiltrationaffects textural attributes of apples. Journal of the American Society of HorticulturalScience 114 (6):932-936.
Amos N D, (1999) Container temperatures under research scrutiny. Good Fruit andVegetables 9 (11): p. 50
Anderson R E and Abbot J, (1975) Apple quality after storage in air, delayed-CA or CA.HortScience 10:255-257.
Autio W R, (1987) Effects of rootstocks on apple ripening, size and quality. Compactfruit trees. 20:98-102.
Autio W R, (1991) Rootstocks affect ripening and other qualities of ‘Delicious’ apples.Journal of the American Society of Horticultural Science 116: 378-382.
Beaudry R, Schwallier P and Lennington M, (1993) Apple maturity prediction: Anextension tool to aid fruit storage decisions. HortTechnology 3(2) : 233-239.
Beaudry R, (2003) Use of MCP on apples. Michigan State University Tree fruit news 18(17): p.3-5.
Blankenship S M and Unrath C R, (1998) Ethylene inhibitor, 1-methylcyclopropene,delays apple softening. HortScience 33:469.
Blanpied G D, Bramlage W J, Dewey D H, LaBelle R L, Massey Jr. L M, Mattus G E,Stiles W C and Watada A E, (1978) A standardised method for collecting apple pressuretest data. Bulletin 74 Cornell Experimental Station.
Castle W S, (1995) Rootstock as a fruit quality factor in citrus and deciduous tree crops.New Zealand Journal of Crop and Horticultural Science. 23: 383-394.
Chennell A, Bates V and Williams D, (2002) Apple maturity Management TrainingWorkshop Manual. (Department of Primary Industries and Development, Victoria).
Collins M, (2002) Apple maturity management . Agriculture Notes AG0878 ISSN 1329-8062.
Dilley D C, Lange E and Tomala K, (1989) Optimising parameters for controlledatmosphere storage of apples. In Proceedings of the 5th International ControlledAtmosphere Research Conference Wenatchee, Washington, United States. Pp.221-236.
DeEll J R, Khanizadeh S, Saad F, and Ferree D, (2001) Factors affecting apple fruitfirmness. Journal American Pomological Society 55 (1): 8-27.
Tracking Pink Lady apple firmness – AP01036________________________________________________________________________
_________________________________________________________________________
DPI-Knoxfield166
Dris R, (1998) Effect of preharvest calcium treatments on postharvest quality of applesgrown in Finland. Department of Plant Production, Horticulture Section, University ofHelsinki, Publication No. 34, p.111 Helsinki. ISBN 951-45-8381-7, ISSN 1236-603X.
Elfving D C, (1987) Choosing an apple rootstock. Compact fruit trees 20: 112-115.
Fan X, Blankenship S M and Mattheis J P, (1999a) 1-Methylcyclopropene inhibits appleripening. Journal of the American Society of Horticultural Science 124 (6):690-695.
Fan X, Mattheis J P and Blankenship S M, (1999b) Development of apple superficialscald, soft scald, core flush and greasiness is reduced by MCP. Journal of Agriculturaland Food Chemistry 47:3063-3068.
Fan X and Mattheis J P, (1999c) Impact of 1-methylcyclopropene andmethylcyclopropene and methyl jasmonate on apple volatile. Journal of Agricultural andFood Chemistry 47: 2847-2853.
Faust M and Shear C B, (1968) Corking disorders of apples, a physiological andbiochemical review Botanical Reviews. 34:441-469.
Gurnsey S and Lawes G S, (1999) ‘Improving Apple Color’. Washington StateUniversity-Tree Fruit Research and Extension Center Article # RP2000A.
Hardenburg R E, Watada A E and Wang CY, (1986) The commercial storage of fruits,vegetables and florist and nursery stocks. USDA Agriculture Handbook Number 66.
Harker F R, Redgwell R J, Hallett I C, Murray S H and Carter G, (1997) Texture of freshfruit. Horticultural Reviews 20:121-224.
Harker F R, Volz R, Johnston J W, Hallett I C and DeBelie N, (2000) What makes fruitfirm and how to keep it that way. Washington State University-Tree fruit ResearchExtension center, 16th Annual Postharvest Conference, Yakima, WA. Article #PC2000BB.
Johnson D S, (1992) The effect of flower and fruit thinning on the firmness of Cox’sOrange Pippin apples at harvest and after storage. Journal of Horticultural Science 67:95-1001.
Johnston J W, Hewett E W, Banks NH, Harker F R and Hertog M A T M, (2001a)Temperature induces differential softening responses in apple cultivars. PostharvestBiology and Technology 23: 186-197.
Johnston J W, Hewett E W, Hertog M A T M and Harker F R, (2002a) Harvest date andfruit size affect postharvest apple softening Postharvest Biology and Technology 77: 355-360.
Johnston J W, Hewett E W, Hertog M A T M and Harker F R, (2002b) Temperature andethylene affect induction of rapid softening in ‘Granny Smith’ and ‘Pacific Rose’ applecultivars. Postharvest Biology and Technology 25: 257-264.
Tracking Pink Lady apple firmness – AP01036________________________________________________________________________
_________________________________________________________________________
DPI-Knoxfield167
Johnston J W, Hewett E W and Hertog M A T M, (2002c) Postharvest softening of apple(Malus domestica) fruit: a review. New Zealand Journal of Crop and HorticulturalScience. 30:145-160.
Ju Z, Curry E A (2000) Evidence that α-farnesene biosynthesis during fruit ripening ismediated by ethylene regulated gene expression in apples. Postharvest Biology andTechnology 19, 9-16.
Knee M and Smith S M, (1989) Variation in quality of apple fruits stored after harvest ondifferent dates. Journal of Horticultural Science. 64:413-419.
Knee M, (1976) Influence of ethylene on the ripening of stored apples’ Journal of ScienceFood and Agriculture 27:383-392.
Kreidl S, Holmes R, Lopresti J, Wilkinson I, Franz P and Rettke M, (2003) Nationalapplication of new techniques for scald control. Horticulture Australia Project NumberAP99010.
Kronenberg H G, (1988) Temperature requirements for growth and ripening of apples.Netherlands Journal of Agricultural Science 36:23-33.
Kupferman E, (2002a) Observations on harvest maturity and storage of apples and pears.Washington State University-Tree Fruit Research and Extension Center.http://postharvest.tfrec.wsu.edu
Kupferman E, (2002b) Critical aspects of harvest and quality management. WashingtonState University-Tree Fruit Research and Extension Centerhttp://postharvest.tfrec.wsu.edu/EMK2002A.pdf
Larrigaudiere C, Pinto E and Vendrell M, (1996) Differential effects of Ethephon andSeniphos on color development of Starking Delicious apple. Journal of the AmericanSociety of Horticultural Science 121 (4):746-750.
Lau O L, (1985) Harvest indices for B.C. apples. British Columbia Orchardist 7:1A-20A.
Little C R and Holmes R J (2000) Storage technology for apples and pears (Ed. Faragher,J.). (Department of Primary Industries and Development, Victoria).
Liu F W, (1977) Varietal and maturity differences of apples in response to ethylene incontrolled atmosphere storage. Journal of the American Society for Horticultural Science.102:93-95.
Lurie, S, Pre-Aymard C, Ravid U, Larkov O and Fallik E, (2002) Effect of 1-methylcyclopropene on volatile emission and aroma in cv. Anna apples. Journal ofAgricultural and Food Chemistry 50 (15):4251-4256.
MacKay A G, Godley G, Cripps J E L, Melvin-Carter E, Paterson J and Wood P, (1994)Pink Lady Sundowner Apples Bulletin 4285 (Department of Agriculture WesternAustralia).
Tracking Pink Lady apple firmness – AP01036________________________________________________________________________
_________________________________________________________________________
DPI-Knoxfield168
Mason J L, Drought B G and McDougald J M, (1974) Effect of a calcium chloride dip onsenescent breakdown, firmness and calcium concentration in ‘Spatan’ apple. HortScience9:596.
Mattheis J, Fan X and Argenta L, (2002) Factors influencing successful use of 1-mcp.Washington Tree Fruit Postharvest Conference, Yakima, WAhttp://postharvest.tfrec.wsu.edu/PC2002E.pdf
Mir N A, Curell E, Khan N, Whitaker M and Beaudry R M (2001) Harvest maturity,storage temperature and 1-MCP application frequency after firmness retention andchlorophyll fluorescence of Red Delicious apples. Journal of the American Society ofHorticultural Science 126:618-624.
Olsen K and Kupferman E, (1984) Monitoring the quality of apples in long-term CAstorage . Post Harvest Pomology Newsletter 2(4): 3-4.
Peirs A, Scheerlinck N, Perez A B, Jancsok Pal and Nicolai B M, (2002) Uncertaintyanalysis and modelling of the starch index during apple fruit maturation. PostharvestBiology and Technology 26(2):199-207.
Penn State College of Agricultural Sciences, (2003): Part V1 – Harvest and PostharvestHandling: Determining Fruit Maturity (2002 – 2003) Pennsylvania Tree Fruit ProductionGuide. http://tfpg.cas.psu.edu/part6/part61a.htm
Phosyn Technical Bulletin, (2002) The essential role of plant nutrition for pome [email protected]
Poovaiah B W, Glenn G M and Reddy A S N (1988) Calcium and fruit softening:physiology and biochemistry. Horticultural Reviews 10:107-152.
Pre-Aymard C, Weksler A and Lurie S, (2003) ‘Responses of ‘Anna’, a rapidly ripeningsummer apple, to 1-methylcyclopropene. Postharvest Biology and Technology 27:163-170.
Ridings R, (2002) Crop nutrition. Good Fruit and Vegetables 13 (3), p.18.
Roemmelt S, Zimmermann N, Rademacher W and Treutter D, (2003) Formation off novelflavonoids in apple (Malus x domestica) treated with the 2-oxoglutarate-dependentdioxygenase inhibitor prohexadione-Ca Phytochemistry 64:709-716.
Rupasinghe H P V, Murr D P, Paliyath G and Skog L, (2000) Inhibitory effect of 1-MCPon ripening and superficial scald development in MacIntosh and Delicious apples. Journalof Horticultural Science and Biotechnology 75:271-276.
Sams C E, (1999) Preharvest factors affecting postharvest texture. Postharvest Biologyand Technology 15: 249-259.
Tracking Pink Lady apple firmness – AP01036________________________________________________________________________
_________________________________________________________________________
DPI-Knoxfield169
Sharples R O, (1980) The influence of orchard nutrition on the storage quality of applesand pears grown in the United Kingdom. P.17-28. In: Atkinson D, Jackson J E, SharplesRO and Waller W M, (EDS). Mineral nutrition of fruit trees. Butterworths, London.
Sisler E C, Dupille E and Serek M, (1996a) Effect of 1-methylcyclopropene andmethylcyclopropene on ethylene binding and ethylene action on cut carnation.Plant Growth Regulator 18:79-86.
Sisler E C, Serek M, and Dupille E, (1996b) Comparison of cyclopropene, 1-methylcyclopropene, and 3,3-dimethylcyclopropene as ethylene antagonists in plants.Plant Growth Regulator 18:169-174.
SmartFresh Apple technical bulletin ‘SmartFreshTM The Smart Choice for Apples.
Smith P, (1999) Adjust nutrition before it is too late. Good Fruit and Vegetables 10 (4):pp.71 – 73.
Song J, Tian MS, Dilley D R, and Beaudry RM, (1997) Effect of 1-MCP on apple fruitripening and volatile production. HortScience 32:536.
Stanley C J, Tustin D S, Lupton G B, Mcartney S, Cashmore S and De Silva H N, (2000)Towards understanding the role of temperature in apple fruit growth responses in threegeographical regions within New Zealand. Journal of Horticultural Science &Biotechnology 75(4): 413-422.
Stow J, Dover C J and Genge P M, (2000) Control of ethylene biosynthesis and softeningin Cox’s Orange Pippin’ apples during low-ethylene, low oxygen storage. PostharvestBiology and Technology. 18:215-225.
Turner J, (2003) 1MCP / SmartFresh ‘AFFco World Class Workshop’ 31st May.
Volz, R.K., Biasi, W.V., Grant, J.V., Mitcham, E.J. (1998) Prediction of controlledatmosphere induced flesh browning in ‘Fuji’ apple. Postharvest Biology and Technology.13: 97-107
Warner H, Kollman G, Faubion D and Bates B, (2002) ‘Apples and beyond: Future goalsof 1-MCP’. Acta Horticulturae 628: XXVI International Horticultural Congress: Issuesand Advances in Postharvest Horticulture (Abtsract only).
Warrington I J, Fulton T A, Halligan E A and de Silva H N, (1999) Apple fruit growth andmaturity are affected by early season temperatures. Journal of the American Society ofHorticultural Science 124(5):468-477.
Watkins C B, Hewett W, Bateup C, Gunson Cand Triggs A (1989) Relationship betweenmaturity and storage disorders in ‘Cox’s Orange Pippin’ apples as influenced bypreharavest calcium or ethephon sprays. New Zealand Journal of Crop and HorticultureScience 17: 283-292.
Tracking Pink Lady apple firmness – AP01036________________________________________________________________________
_________________________________________________________________________
DPI-Knoxfield170
Watkins C, Harker R, Brookfield P and Tustin S (1993) Maturity of Royal Gala, Braeburnand Fuji-New Zealand experience. P. 16-19. Proc. 9th Annual Washington TreefruitPostharvest Conference Wenatchee.
Watkins C B, Nock J F and Whitaker B D, (2000) Responses of early, mid and late seasonapple cultivars to post-harvest application of 1-methylcyclopropene (1-MCP) under air andcontrolled atmosphere storage conditions. Post-harvest Biology and Technology 19:17-32.
Watkins C B and Rosenberger D A, (2002) SmartFreshTM (1-MCP) is registered for use onNew York-grown apples and A summary of conclusions about use of SmartFresh on NewYork-grown apples. Cornell Fruit Handling and Storage Newsletter p.2.http://www.hort.cornell.edu/department/watkins/extpubs.html
Wills R, McGlasson B G and Joyce D, (1998) Postharvest, an introduction to thephysiology and handling of fruit, vegetables and ornamentals. CAB International,Wallingford Oxon.
Wismer P T, Proctor J T A and Elfving D C, (1995) Benzyladenine affects cell divisionand cell size during apple fruit thinning. Journal of the American Society of HorticulturalScience 120:802-807.
Yoshioka H, Kahimura Y and Kaneko K, (1995) β-D-galactosidase and α-L-arabinofuranosidase activities during the softening of apples. Journal of the JapaneseSociety for Horticultural Science. 63:871-878.
Zanella A, (2001) Scald control and quality improvement of Granny Smith apples bypostharvest treatment with 1-MCP. Riv. Fruiticol. Ortofloricol. 63 (9):67-72.
Zanella A, (2003) Control of apple superficial scald and ripening-comparison between 1-methylcyclopropene and diphenylamine postharvest treatments, initial low oxygen stressand ultra low oxygen. Postharvest Biology and Technology 27:69-78.
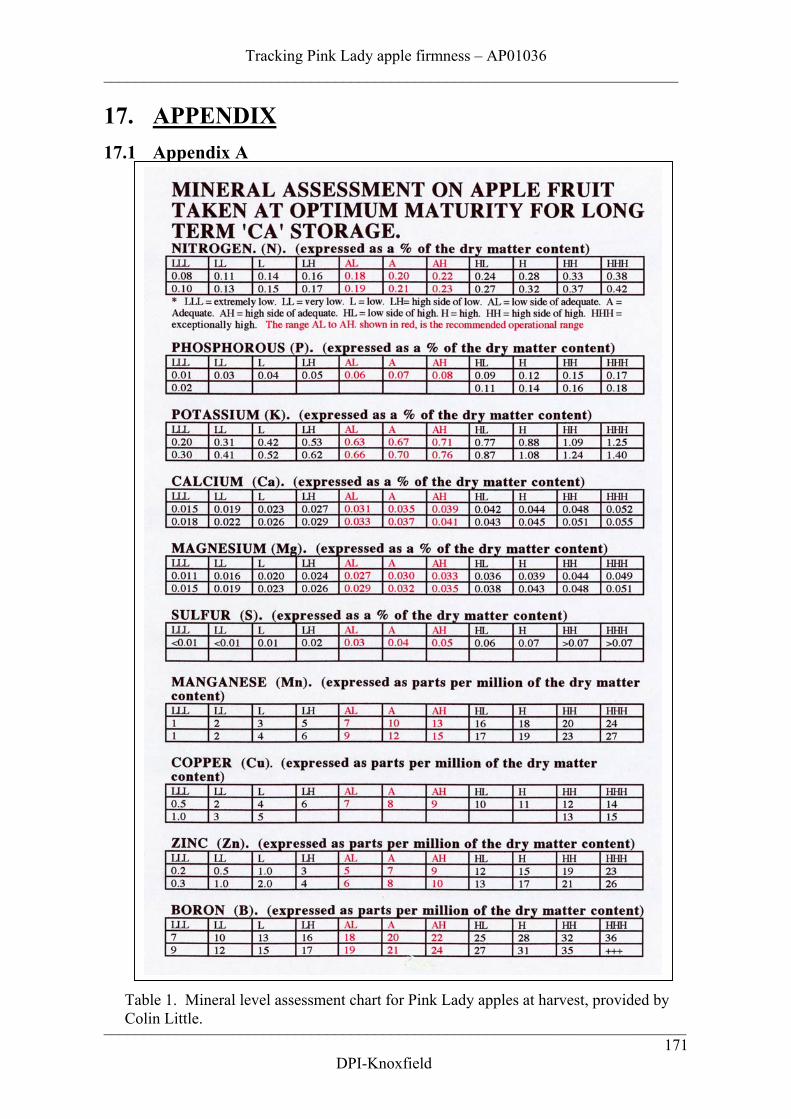
Tracking Pink Lady apple firmness – AP01036________________________________________________________________________
_________________________________________________________________________
DPI-Knoxfield171
17. APPENDIX17.1 Appendix A
Table 1. Mineral level assessment chart for Pink Lady apples at harvest, provided byColin Little.
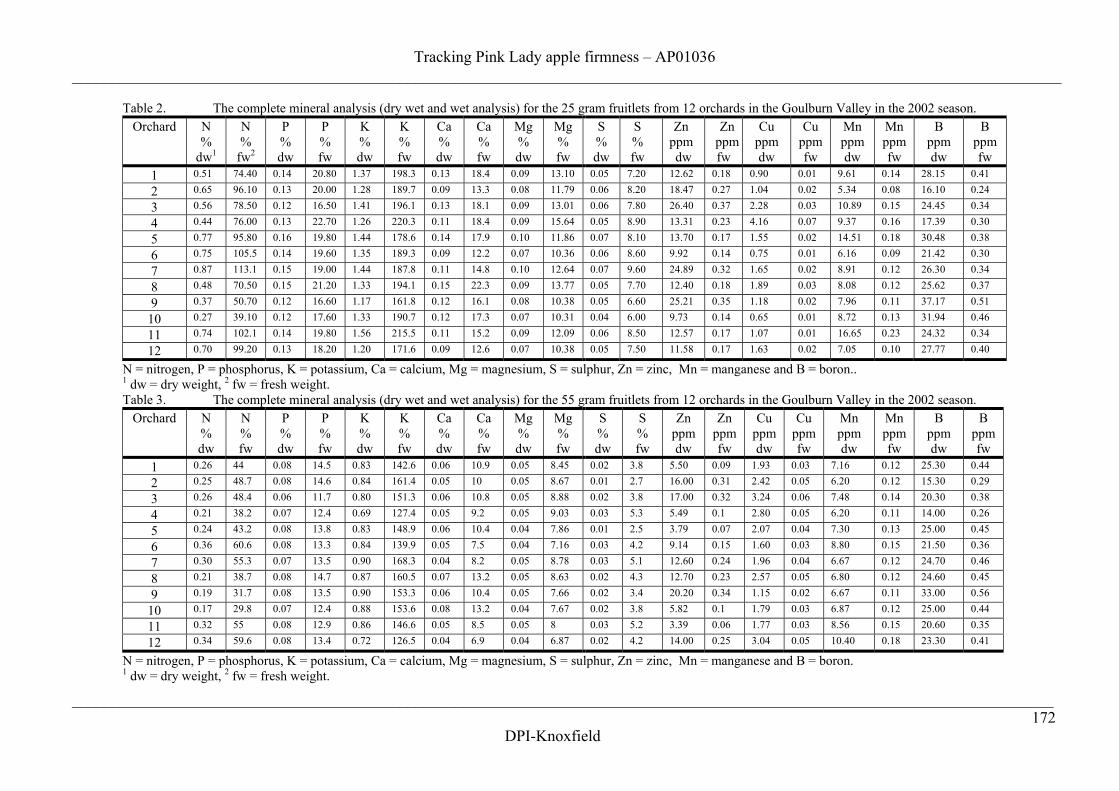
Tracking Pink Lady apple firmness – AP01036____________________________________________________________________________________________________________________________
___________________________________________________________________________________________________________________________172
DPI-Knoxfield
Table 2. The complete mineral analysis (dry wet and wet analysis) for the 25 gram fruitlets from 12 orchards in the Goulburn Valley in the 2002 season.Orchard N
%dw1
N%
fw2
P%dw
P%fw
K%dw
K%fw
Ca%dw
Ca%fw
Mg%dw
Mg%fw
S%dw
S%fw
Znppmdw
Znppmfw
Cuppmdw
Cuppmfw
Mnppmdw
Mnppmfw
Bppmdw
Bppmfw
1 0.51 74.40 0.14 20.80 1.37 198.3 0.13 18.4 0.09 13.10 0.05 7.20 12.62 0.18 0.90 0.01 9.61 0.14 28.15 0.41
2 0.65 96.10 0.13 20.00 1.28 189.7 0.09 13.3 0.08 11.79 0.06 8.20 18.47 0.27 1.04 0.02 5.34 0.08 16.10 0.24
3 0.56 78.50 0.12 16.50 1.41 196.1 0.13 18.1 0.09 13.01 0.06 7.80 26.40 0.37 2.28 0.03 10.89 0.15 24.45 0.34
4 0.44 76.00 0.13 22.70 1.26 220.3 0.11 18.4 0.09 15.64 0.05 8.90 13.31 0.23 4.16 0.07 9.37 0.16 17.39 0.30
5 0.77 95.80 0.16 19.80 1.44 178.6 0.14 17.9 0.10 11.86 0.07 8.10 13.70 0.17 1.55 0.02 14.51 0.18 30.48 0.38
6 0.75 105.5 0.14 19.60 1.35 189.3 0.09 12.2 0.07 10.36 0.06 8.60 9.92 0.14 0.75 0.01 6.16 0.09 21.42 0.30
7 0.87 113.1 0.15 19.00 1.44 187.8 0.11 14.8 0.10 12.64 0.07 9.60 24.89 0.32 1.65 0.02 8.91 0.12 26.30 0.34
8 0.48 70.50 0.15 21.20 1.33 194.1 0.15 22.3 0.09 13.77 0.05 7.70 12.40 0.18 1.89 0.03 8.08 0.12 25.62 0.37
9 0.37 50.70 0.12 16.60 1.17 161.8 0.12 16.1 0.08 10.38 0.05 6.60 25.21 0.35 1.18 0.02 7.96 0.11 37.17 0.51
10 0.27 39.10 0.12 17.60 1.33 190.7 0.12 17.3 0.07 10.31 0.04 6.00 9.73 0.14 0.65 0.01 8.72 0.13 31.94 0.46
11 0.74 102.1 0.14 19.80 1.56 215.5 0.11 15.2 0.09 12.09 0.06 8.50 12.57 0.17 1.07 0.01 16.65 0.23 24.32 0.34
12 0.70 99.20 0.13 18.20 1.20 171.6 0.09 12.6 0.07 10.38 0.05 7.50 11.58 0.17 1.63 0.02 7.05 0.10 27.77 0.40
N = nitrogen, P = phosphorus, K = potassium, Ca = calcium, Mg = magnesium, S = sulphur, Zn = zinc, Mn = manganese and B = boron..1 dw = dry weight, 2 fw = fresh weight.Table 3. The complete mineral analysis (dry wet and wet analysis) for the 55 gram fruitlets from 12 orchards in the Goulburn Valley in the 2002 season.
Orchard N%dw
N%fw
P%dw
P%fw
K%dw
K%fw
Ca%dw
Ca%fw
Mg%dw
Mg%fw
S%dw
S%fw
Znppmdw
Znppmfw
Cuppmdw
Cuppmfw
Mnppmdw
Mnppmfw
Bppmdw
Bppmfw
1 0.26 44 0.08 14.5 0.83 142.6 0.06 10.9 0.05 8.45 0.02 3.8 5.50 0.09 1.93 0.03 7.16 0.12 25.30 0.44
2 0.25 48.7 0.08 14.6 0.84 161.4 0.05 10 0.05 8.67 0.01 2.7 16.00 0.31 2.42 0.05 6.20 0.12 15.30 0.29
3 0.26 48.4 0.06 11.7 0.80 151.3 0.06 10.8 0.05 8.88 0.02 3.8 17.00 0.32 3.24 0.06 7.48 0.14 20.30 0.38
4 0.21 38.2 0.07 12.4 0.69 127.4 0.05 9.2 0.05 9.03 0.03 5.3 5.49 0.1 2.80 0.05 6.20 0.11 14.00 0.26
5 0.24 43.2 0.08 13.8 0.83 148.9 0.06 10.4 0.04 7.86 0.01 2.5 3.79 0.07 2.07 0.04 7.30 0.13 25.00 0.45
6 0.36 60.6 0.08 13.3 0.84 139.9 0.05 7.5 0.04 7.16 0.03 4.2 9.14 0.15 1.60 0.03 8.80 0.15 21.50 0.36
7 0.30 55.3 0.07 13.5 0.90 168.3 0.04 8.2 0.05 8.78 0.03 5.1 12.60 0.24 1.96 0.04 6.67 0.12 24.70 0.46
8 0.21 38.7 0.08 14.7 0.87 160.5 0.07 13.2 0.05 8.63 0.02 4.3 12.70 0.23 2.57 0.05 6.80 0.12 24.60 0.45
9 0.19 31.7 0.08 13.5 0.90 153.3 0.06 10.4 0.05 7.66 0.02 3.4 20.20 0.34 1.15 0.02 6.67 0.11 33.00 0.56
10 0.17 29.8 0.07 12.4 0.88 153.6 0.08 13.2 0.04 7.67 0.02 3.8 5.82 0.1 1.79 0.03 6.87 0.12 25.00 0.44
11 0.32 55 0.08 12.9 0.86 146.6 0.05 8.5 0.05 8 0.03 5.2 3.39 0.06 1.77 0.03 8.56 0.15 20.60 0.35
12 0.34 59.6 0.08 13.4 0.72 126.5 0.04 6.9 0.04 6.87 0.02 4.2 14.00 0.25 3.04 0.05 10.40 0.18 23.30 0.41
N = nitrogen, P = phosphorus, K = potassium, Ca = calcium, Mg = magnesium, S = sulphur, Zn = zinc, Mn = manganese and B = boron.1 dw = dry weight, 2 fw = fresh weight.
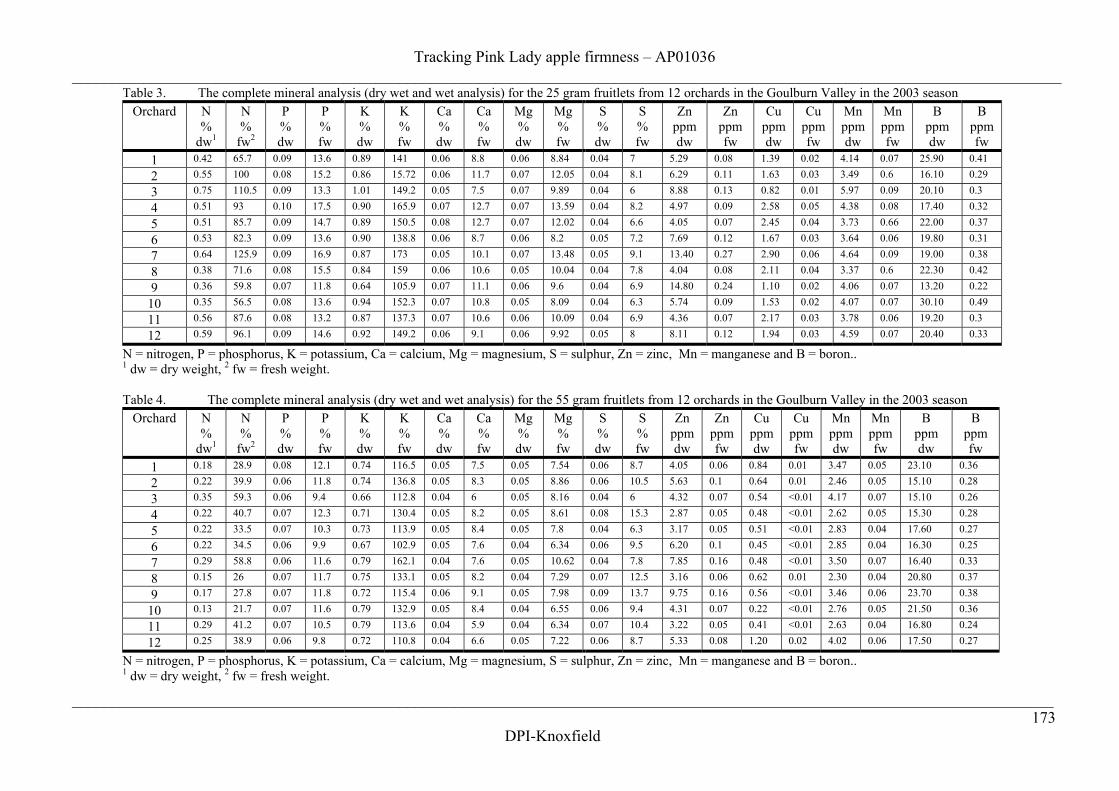
Tracking Pink Lady apple firmness – AP01036____________________________________________________________________________________________________________________________
___________________________________________________________________________________________________________________________173
DPI-Knoxfield
Table 3. The complete mineral analysis (dry wet and wet analysis) for the 25 gram fruitlets from 12 orchards in the Goulburn Valley in the 2003 seasonOrchard N
%dw1
N%
fw2
P%dw
P%fw
K%dw
K%fw
Ca%dw
Ca%fw
Mg%dw
Mg%fw
S%dw
S%fw
Znppmdw
Znppmfw
Cuppmdw
Cuppmfw
Mnppmdw
Mnppmfw
Bppmdw
Bppmfw
1 0.42 65.7 0.09 13.6 0.89 141 0.06 8.8 0.06 8.84 0.04 7 5.29 0.08 1.39 0.02 4.14 0.07 25.90 0.41
2 0.55 100 0.08 15.2 0.86 15.72 0.06 11.7 0.07 12.05 0.04 8.1 6.29 0.11 1.63 0.03 3.49 0.6 16.10 0.29
3 0.75 110.5 0.09 13.3 1.01 149.2 0.05 7.5 0.07 9.89 0.04 6 8.88 0.13 0.82 0.01 5.97 0.09 20.10 0.3
4 0.51 93 0.10 17.5 0.90 165.9 0.07 12.7 0.07 13.59 0.04 8.2 4.97 0.09 2.58 0.05 4.38 0.08 17.40 0.32
5 0.51 85.7 0.09 14.7 0.89 150.5 0.08 12.7 0.07 12.02 0.04 6.6 4.05 0.07 2.45 0.04 3.73 0.66 22.00 0.37
6 0.53 82.3 0.09 13.6 0.90 138.8 0.06 8.7 0.06 8.2 0.05 7.2 7.69 0.12 1.67 0.03 3.64 0.06 19.80 0.31
7 0.64 125.9 0.09 16.9 0.87 173 0.05 10.1 0.07 13.48 0.05 9.1 13.40 0.27 2.90 0.06 4.64 0.09 19.00 0.38
8 0.38 71.6 0.08 15.5 0.84 159 0.06 10.6 0.05 10.04 0.04 7.8 4.04 0.08 2.11 0.04 3.37 0.6 22.30 0.42
9 0.36 59.8 0.07 11.8 0.64 105.9 0.07 11.1 0.06 9.6 0.04 6.9 14.80 0.24 1.10 0.02 4.06 0.07 13.20 0.22
10 0.35 56.5 0.08 13.6 0.94 152.3 0.07 10.8 0.05 8.09 0.04 6.3 5.74 0.09 1.53 0.02 4.07 0.07 30.10 0.49
11 0.56 87.6 0.08 13.2 0.87 137.3 0.07 10.6 0.06 10.09 0.04 6.9 4.36 0.07 2.17 0.03 3.78 0.06 19.20 0.3
12 0.59 96.1 0.09 14.6 0.92 149.2 0.06 9.1 0.06 9.92 0.05 8 8.11 0.12 1.94 0.03 4.59 0.07 20.40 0.33
N = nitrogen, P = phosphorus, K = potassium, Ca = calcium, Mg = magnesium, S = sulphur, Zn = zinc, Mn = manganese and B = boron..1 dw = dry weight, 2 fw = fresh weight.
Table 4. The complete mineral analysis (dry wet and wet analysis) for the 55 gram fruitlets from 12 orchards in the Goulburn Valley in the 2003 seasonOrchard N
%dw1
N%
fw2
P%dw
P%fw
K%dw
K%fw
Ca%dw
Ca%fw
Mg%dw
Mg%fw
S%dw
S%fw
Znppmdw
Znppmfw
Cuppmdw
Cuppmfw
Mnppmdw
Mnppmfw
Bppmdw
Bppmfw
1 0.18 28.9 0.08 12.1 0.74 116.5 0.05 7.5 0.05 7.54 0.06 8.7 4.05 0.06 0.84 0.01 3.47 0.05 23.10 0.36
2 0.22 39.9 0.06 11.8 0.74 136.8 0.05 8.3 0.05 8.86 0.06 10.5 5.63 0.1 0.64 0.01 2.46 0.05 15.10 0.28
3 0.35 59.3 0.06 9.4 0.66 112.8 0.04 6 0.05 8.16 0.04 6 4.32 0.07 0.54 <0.01 4.17 0.07 15.10 0.26
4 0.22 40.7 0.07 12.3 0.71 130.4 0.05 8.2 0.05 8.61 0.08 15.3 2.87 0.05 0.48 <0.01 2.62 0.05 15.30 0.28
5 0.22 33.5 0.07 10.3 0.73 113.9 0.05 8.4 0.05 7.8 0.04 6.3 3.17 0.05 0.51 <0.01 2.83 0.04 17.60 0.27
6 0.22 34.5 0.06 9.9 0.67 102.9 0.05 7.6 0.04 6.34 0.06 9.5 6.20 0.1 0.45 <0.01 2.85 0.04 16.30 0.25
7 0.29 58.8 0.06 11.6 0.79 162.1 0.04 7.6 0.05 10.62 0.04 7.8 7.85 0.16 0.48 <0.01 3.50 0.07 16.40 0.33
8 0.15 26 0.07 11.7 0.75 133.1 0.05 8.2 0.04 7.29 0.07 12.5 3.16 0.06 0.62 0.01 2.30 0.04 20.80 0.37
9 0.17 27.8 0.07 11.8 0.72 115.4 0.06 9.1 0.05 7.98 0.09 13.7 9.75 0.16 0.56 <0.01 3.46 0.06 23.70 0.38
10 0.13 21.7 0.07 11.6 0.79 132.9 0.05 8.4 0.04 6.55 0.06 9.4 4.31 0.07 0.22 <0.01 2.76 0.05 21.50 0.36
11 0.29 41.2 0.07 10.5 0.79 113.6 0.04 5.9 0.04 6.34 0.07 10.4 3.22 0.05 0.41 <0.01 2.63 0.04 16.80 0.24
12 0.25 38.9 0.06 9.8 0.72 110.8 0.04 6.6 0.05 7.22 0.06 8.7 5.33 0.08 1.20 0.02 4.02 0.06 17.50 0.27
N = nitrogen, P = phosphorus, K = potassium, Ca = calcium, Mg = magnesium, S = sulphur, Zn = zinc, Mn = manganese and B = boron..1 dw = dry weight, 2 fw = fresh weight.
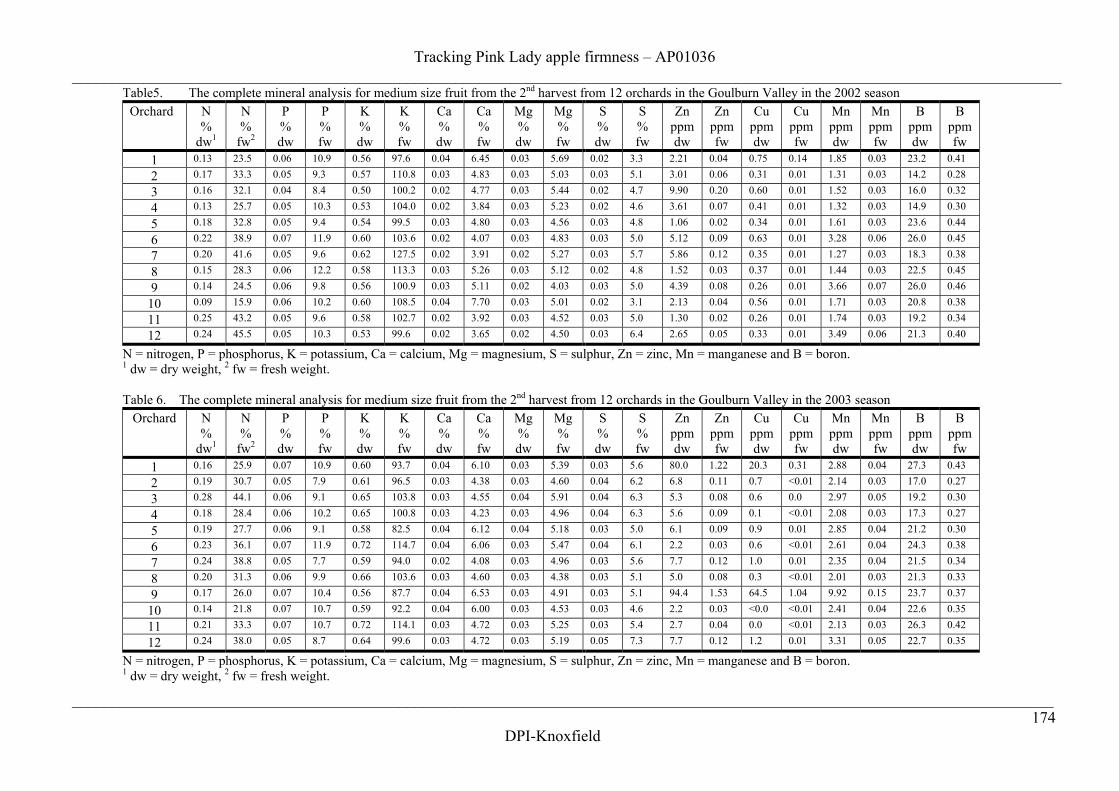
Tracking Pink Lady apple firmness – AP01036____________________________________________________________________________________________________________________________
___________________________________________________________________________________________________________________________174
DPI-Knoxfield
Table5. The complete mineral analysis for medium size fruit from the 2nd harvest from 12 orchards in the Goulburn Valley in the 2002 seasonOrchard N
%dw1
N%
fw2
P%dw
P%fw
K%dw
K%fw
Ca%dw
Ca%fw
Mg%dw
Mg%fw
S%dw
S%fw
Znppmdw
Znppmfw
Cuppmdw
Cuppmfw
Mnppmdw
Mnppmfw
Bppmdw
Bppmfw
1 0.13 23.5 0.06 10.9 0.56 97.6 0.04 6.45 0.03 5.69 0.02 3.3 2.21 0.04 0.75 0.14 1.85 0.03 23.2 0.41
2 0.17 33.3 0.05 9.3 0.57 110.8 0.03 4.83 0.03 5.03 0.03 5.1 3.01 0.06 0.31 0.01 1.31 0.03 14.2 0.28
3 0.16 32.1 0.04 8.4 0.50 100.2 0.02 4.77 0.03 5.44 0.02 4.7 9.90 0.20 0.60 0.01 1.52 0.03 16.0 0.32
4 0.13 25.7 0.05 10.3 0.53 104.0 0.02 3.84 0.03 5.23 0.02 4.6 3.61 0.07 0.41 0.01 1.32 0.03 14.9 0.30
5 0.18 32.8 0.05 9.4 0.54 99.5 0.03 4.80 0.03 4.56 0.03 4.8 1.06 0.02 0.34 0.01 1.61 0.03 23.6 0.44
6 0.22 38.9 0.07 11.9 0.60 103.6 0.02 4.07 0.03 4.83 0.03 5.0 5.12 0.09 0.63 0.01 3.28 0.06 26.0 0.45
7 0.20 41.6 0.05 9.6 0.62 127.5 0.02 3.91 0.02 5.27 0.03 5.7 5.86 0.12 0.35 0.01 1.27 0.03 18.3 0.38
8 0.15 28.3 0.06 12.2 0.58 113.3 0.03 5.26 0.03 5.12 0.02 4.8 1.52 0.03 0.37 0.01 1.44 0.03 22.5 0.45
9 0.14 24.5 0.06 9.8 0.56 100.9 0.03 5.11 0.02 4.03 0.03 5.0 4.39 0.08 0.26 0.01 3.66 0.07 26.0 0.46
10 0.09 15.9 0.06 10.2 0.60 108.5 0.04 7.70 0.03 5.01 0.02 3.1 2.13 0.04 0.56 0.01 1.71 0.03 20.8 0.38
11 0.25 43.2 0.05 9.6 0.58 102.7 0.02 3.92 0.03 4.52 0.03 5.0 1.30 0.02 0.26 0.01 1.74 0.03 19.2 0.34
12 0.24 45.5 0.05 10.3 0.53 99.6 0.02 3.65 0.02 4.50 0.03 6.4 2.65 0.05 0.33 0.01 3.49 0.06 21.3 0.40
N = nitrogen, P = phosphorus, K = potassium, Ca = calcium, Mg = magnesium, S = sulphur, Zn = zinc, Mn = manganese and B = boron.1 dw = dry weight, 2 fw = fresh weight.
Table 6. The complete mineral analysis for medium size fruit from the 2nd harvest from 12 orchards in the Goulburn Valley in the 2003 seasonOrchard N
%dw1
N%
fw2
P%dw
P%fw
K%dw
K%fw
Ca%dw
Ca%fw
Mg%dw
Mg%fw
S%dw
S%fw
Znppmdw
Znppmfw
Cuppmdw
Cuppmfw
Mnppmdw
Mnppmfw
Bppmdw
Bppmfw
1 0.16 25.9 0.07 10.9 0.60 93.7 0.04 6.10 0.03 5.39 0.03 5.6 80.0 1.22 20.3 0.31 2.88 0.04 27.3 0.43
2 0.19 30.7 0.05 7.9 0.61 96.5 0.03 4.38 0.03 4.60 0.04 6.2 6.8 0.11 0.7 <0.01 2.14 0.03 17.0 0.27
3 0.28 44.1 0.06 9.1 0.65 103.8 0.03 4.55 0.04 5.91 0.04 6.3 5.3 0.08 0.6 0.0 2.97 0.05 19.2 0.30
4 0.18 28.4 0.06 10.2 0.65 100.8 0.03 4.23 0.03 4.96 0.04 6.3 5.6 0.09 0.1 <0.01 2.08 0.03 17.3 0.27
5 0.19 27.7 0.06 9.1 0.58 82.5 0.04 6.12 0.04 5.18 0.03 5.0 6.1 0.09 0.9 0.01 2.85 0.04 21.2 0.30
6 0.23 36.1 0.07 11.9 0.72 114.7 0.04 6.06 0.03 5.47 0.04 6.1 2.2 0.03 0.6 <0.01 2.61 0.04 24.3 0.38
7 0.24 38.8 0.05 7.7 0.59 94.0 0.02 4.08 0.03 4.96 0.03 5.6 7.7 0.12 1.0 0.01 2.35 0.04 21.5 0.34
8 0.20 31.3 0.06 9.9 0.66 103.6 0.03 4.60 0.03 4.38 0.03 5.1 5.0 0.08 0.3 <0.01 2.01 0.03 21.3 0.33
9 0.17 26.0 0.07 10.4 0.56 87.7 0.04 6.53 0.03 4.91 0.03 5.1 94.4 1.53 64.5 1.04 9.92 0.15 23.7 0.37
10 0.14 21.8 0.07 10.7 0.59 92.2 0.04 6.00 0.03 4.53 0.03 4.6 2.2 0.03 <0.0 <0.01 2.41 0.04 22.6 0.35
11 0.21 33.3 0.07 10.7 0.72 114.1 0.03 4.72 0.03 5.25 0.03 5.4 2.7 0.04 0.0 <0.01 2.13 0.03 26.3 0.42
12 0.24 38.0 0.05 8.7 0.64 99.6 0.03 4.72 0.03 5.19 0.05 7.3 7.7 0.12 1.2 0.01 3.31 0.05 22.7 0.35
N = nitrogen, P = phosphorus, K = potassium, Ca = calcium, Mg = magnesium, S = sulphur, Zn = zinc, Mn = manganese and B = boron.1 dw = dry weight, 2 fw = fresh weight.

Tracking Pink Lady apple firmness – AP01036____________________________________________________________________________________________________________________________
___________________________________________________________________________________________________________________________175
DPI-Knoxfield
Table 7. Soil samples were collected from each orchard on the 25th June 2002 and a complete nutrient analysis was done on the samples. Thesamples were taken from a 20 centimeter core sample, located central to two trees on the dripper line. Five samples were collected, one for each fieldreplicate and a composite sample was used for the analysis.
OrchardSoil Analysis1 2 3 4 5 6 7 8 9 10 11 12
pH (H2O) 7 7.6 5.7 7.0 6.3 6.9 6.8 7.5 7.6 6.9 7.3 6.8Ph (CaCL2) 6.6 7.1 5.1 6.2 5.5 6.2 6.3 7.0 6.9 6.3 6.8 6.1Organic matter (%) 1.0 2.8 2.9 2.9 3.7 2.1 2.1 2.9 2.4 2.8 5.1 3.0CEC (meq/100g) 6.1 11.5 8.0 12.6 9.3 8.6 8.6 12.5 11.2 8.4 12.7 12.0EC (dS/m) 0.06 0.10 0.12 0.11 0.10 0.08 0.16 0.15 0.07 0.07 0.27 0.14NO3-N (ppm) 5 4 15 2 7 6 15 4 3 1 48 15Phosphorus [Olsen] (ppm) 25 24 30 14 10 34 7 13 28 7 22 51Potassium (meq/100g) 0.42 0.59 0.5 0.52 0.56 0.59 1.26 0.68 0.42 0.57 0.85 0.84Calcium (meq/100g) 4.04 0.11 6.00 8.79 6.85 6.71 5.73 10.08 9.37 5.93 9.50 9.52Magnesium (meq/100g) 1.333 1.64 1.00 2.75 1.64 1.10 1.35 1.53 1.11 1.56 2.09 1.42Sulphur (ppm) 6 7 8 10 11 6 26 19 6 6 18 15Boron (ppm) 0.5 0.5 1.0 0.4 0.3 0.2 0.6 0.4 0.5 0.5 0.6 0.3Copper (ppm) 3.9 3.6 1.2 2.2 13.4 5.6 8.3 6.4 7.6 1.0 23.5 6.8Iron (ppm) 46 88 75 90 99 73 52 98 74 42 77 80Manganese (ppm) 32 13 25 9 11 25 33 12 19 62 23 34Zinc (ppm) 6.2 9.0 1.9 7.2 2.0 6.0 4.1 2.2 4.4 2.6 16.6 7.3Aluminium (meq/100g) 0.1 0.1 0.1 0.1 0.1 0.1 0.1 0.1 0.1 0.1 0.1 0.1Sodium (meq/100g) 0.2 0.15 0.17 0.47 0.19 0.11 0.16 0.17 0.17 0.22 0.18 0.13Chloride (ppm) 33.0 43.0 52.0 52.0 51.0 39.0 55.0 44.0 4.0 38.0 67.0 49.0Ca base saturation (%) 66.5 78.9 71.2 69.7 73.5 78.1 66.9 80.5 83.8 70.9 74.6 79.4K base saturation (%) 7 5.1 7.5 4.1 6.0 6.9 14.8 5.4 3.8 6.8 6.7 7.0Mg base saturation (%) 22.0 14.2 17.9 21.9 17.6 12.8 15.8 12.2 10.0 18.7 16.4 11.9Na base saturation (%) 3.3 1.3 2.1 3.7 2.0 1.2 1.8 1.3 1.5 2.6 1.4 1.1Ca:Mg ratio 3.0 5.6 4.0 3.2 4.2 6.1 4.2 6.6 8.4 3.8 4.6 6.7Texture Sandy
loamLoam Silty loam Clay Loam Loam Loam Loam Sandy
loamClay Loam Loam
Colour Yellow /brown
Yellow /brown
Brown Brown Yellow /brown
Brown Brown Yellow /brown
Brown Brown Yellow /brown
Brown
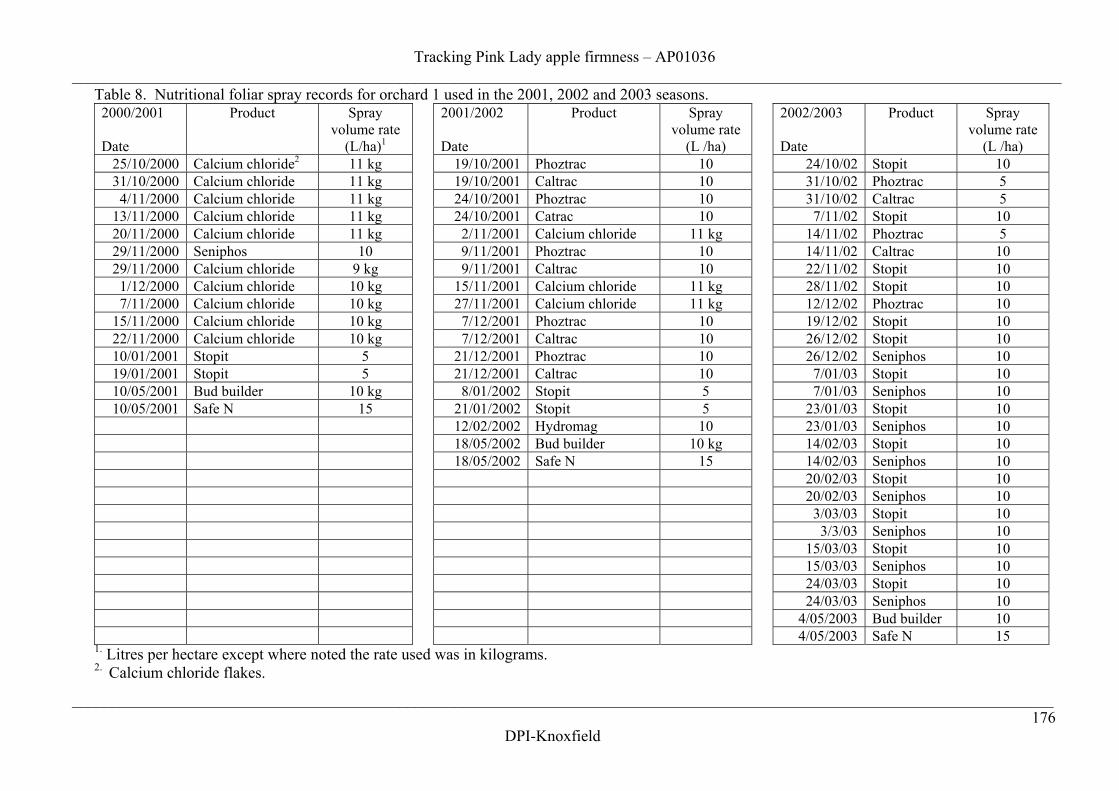
Tracking Pink Lady apple firmness – AP01036____________________________________________________________________________________________________________________________
___________________________________________________________________________________________________________________________176
DPI-Knoxfield
Table 8. Nutritional foliar spray records for orchard 1 used in the 2001, 2002 and 2003 seasons.2000/2001
Date
Product Sprayvolume rate
(L/ha)1
2001/2002
Date
Product Sprayvolume rate
(L /ha)
2002/2003
Date
Product Sprayvolume rate
(L /ha)25/10/2000 Calcium chloride2 11 kg 19/10/2001 Phoztrac 10 24/10/02 Stopit 1031/10/2000 Calcium chloride 11 kg 19/10/2001 Caltrac 10 31/10/02 Phoztrac 54/11/2000 Calcium chloride 11 kg 24/10/2001 Phoztrac 10 31/10/02 Caltrac 5
13/11/2000 Calcium chloride 11 kg 24/10/2001 Catrac 10 7/11/02 Stopit 1020/11/2000 Calcium chloride 11 kg 2/11/2001 Calcium chloride 11 kg 14/11/02 Phoztrac 529/11/2000 Seniphos 10 9/11/2001 Phoztrac 10 14/11/02 Caltrac 1029/11/2000 Calcium chloride 9 kg 9/11/2001 Caltrac 10 22/11/02 Stopit 101/12/2000 Calcium chloride 10 kg 15/11/2001 Calcium chloride 11 kg 28/11/02 Stopit 107/11/2000 Calcium chloride 10 kg 27/11/2001 Calcium chloride 11 kg 12/12/02 Phoztrac 10
15/11/2000 Calcium chloride 10 kg 7/12/2001 Phoztrac 10 19/12/02 Stopit 1022/11/2000 Calcium chloride 10 kg 7/12/2001 Caltrac 10 26/12/02 Stopit 1010/01/2001 Stopit 5 21/12/2001 Phoztrac 10 26/12/02 Seniphos 1019/01/2001 Stopit 5 21/12/2001 Caltrac 10 7/01/03 Stopit 1010/05/2001 Bud builder 10 kg 8/01/2002 Stopit 5 7/01/03 Seniphos 1010/05/2001 Safe N 15 21/01/2002 Stopit 5 23/01/03 Stopit 10
12/02/2002 Hydromag 10 23/01/03 Seniphos 1018/05/2002 Bud builder 10 kg 14/02/03 Stopit 1018/05/2002 Safe N 15 14/02/03 Seniphos 10
20/02/03 Stopit 1020/02/03 Seniphos 10
3/03/03 Stopit 103/3/03 Seniphos 10
15/03/03 Stopit 1015/03/03 Seniphos 1024/03/03 Stopit 1024/03/03 Seniphos 10
4/05/2003 Bud builder 104/05/2003 Safe N 15
1. Litres per hectare except where noted the rate used was in kilograms.2. Calcium chloride flakes.
Tracking Pink Lady apple firmness – AP01036_________________________________________________________________________________________
_________________________________________________________________________________________177
DPI-Knoxfield
17.2 Appendix B
The following fact sheets for minimising firmness loss in Pink Lady apples
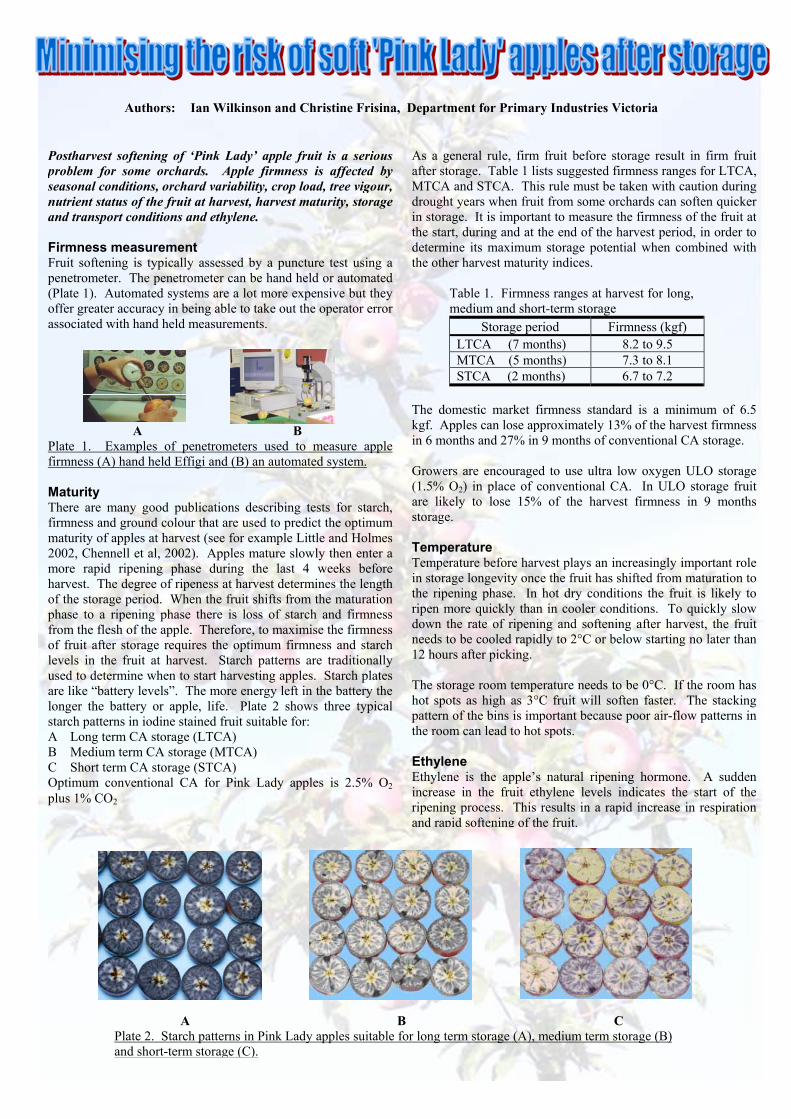
Postharvest softening of ‘Pink Lady’ apple fruit is a seriousproblem for some orchards. Apple firmness is affected byseasonal conditions, orchard variability, crop load, tree vigour,nutrient status of the fruit at harvest, harvest maturity, storageand transport conditions and ethylene.
Firmness measurementFruit softening is typically assessed by a puncture test using apenetrometer. The penetrometer can be hand held or automated(Plate 1). Automated systems are a lot more expensive but theyoffer greater accuracy in being able to take out the operator errorassociated with hand held measurements.
A BPlate 1. Examples of penetrometers used to measure applefirmness (A) hand held Effigi and (B) an automated system.
MaturityThere are many good publications describing tests for starch,firmness and ground colour that are used to predict the optimummaturity of apples at harvest (see for example Little and Holmes2002, Chennell et al, 2002). Apples mature slowly then enter amore rapid ripening phase during the last 4 weeks beforeharvest. The degree of ripeness at harvest determines the lengthof the storage period. When the fruit shifts from the maturationphase to a ripening phase there is loss of starch and firmnessfrom the flesh of the apple. Therefore, to maximise the firmnessof fruit after storage requires the optimum firmness and starchlevels in the fruit at harvest. Starch patterns are traditionallyused to determine when to start harvesting apples. Starch platesare like “battery levels”. The more energy left in the battery thelonger the battery or apple, life. Plate 2 shows three typicalstarch patterns in iodine stained fruit suitable for:A Long term CA storage (LTCA)B Medium term CA storage (MTCA)C Short term CA storage (STCA)Optimum conventional CA for Pink Lady apples is 2.5% O2plus 1% CO2
As a general rule, firm fruit before storage result in firm fruitafter storage. Table 1 lists suggested firmness ranges for LTCA,MTCA and STCA. This rule must be taken with caution duringdrought years when fruit from some orchards can soften quickerin storage. It is important to measure the firmness of the fruit atthe start, during and at the end of the harvest period, in order todetermine its maximum storage potential when combined withthe other harvest maturity indices.
Table 1. Firmness ranges at harvest for long,medium and short-term storage
Storage period Firmness (kgf)LTCA (7 months) 8.2 to 9.5MTCA (5 months) 7.3 to 8.1STCA (2 months) 6.7 to 7.2
The domestic market firmness standard is a minimum of 6.5kgf. Apples can lose approximately 13% of the harvest firmnessin 6 months and 27% in 9 months of conventional CA storage.
Growers are encouraged to use ultra low oxygen ULO storage(1.5% O2) in place of conventional CA. In ULO storage fruitare likely to lose 15% of the harvest firmness in 9 monthsstorage.
TemperatureTemperature before harvest plays an increasingly important rolein storage longevity once the fruit has shifted from maturation tothe ripening phase. In hot dry conditions the fruit is likely toripen more quickly than in cooler conditions. To quickly slowdown the rate of ripening and softening after harvest, the fruitneeds to be cooled rapidly to 2°C or below starting no later than12 hours after picking.
The storage room temperature needs to be 0°C. If the room hashot spots as high as 3°C fruit will soften faster. The stackingpattern of the bins is important because poor air-flow patterns inthe room can lead to hot spots.
EthyleneEthylene is the apple’s natural ripening hormone. A suddenincrease in the fruit ethylene levels indicates the start of theripening process. This results in a rapid increase in respirationand rapid softening of the fruit.
Authors: Ian Wilkinson and Christine Frisina, Department for Primary Industries Victoria
A B C
Plate 2. Starch patterns in Pink Lady apples suitable for long term storage (A), medium term storage (B)and short-term storage (C).
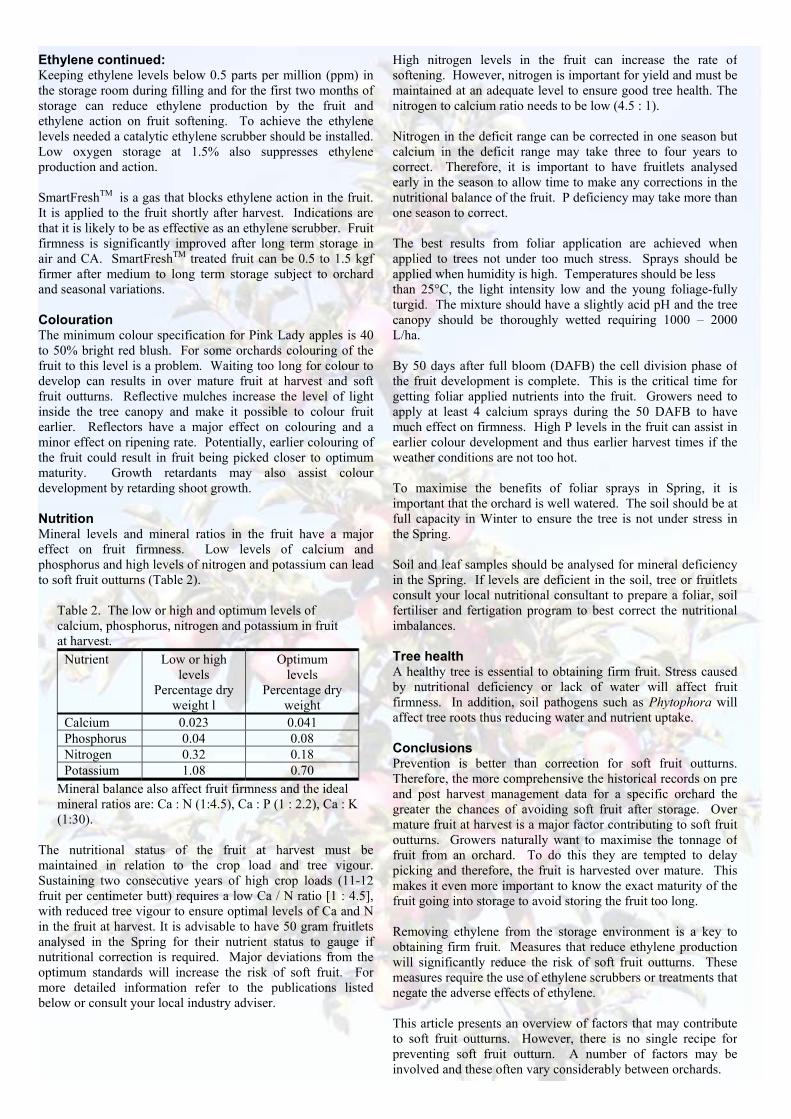
High nitrogen levels in the fruit can increase the rate ofsoftening. However, nitrogen is important for yield and must bemaintained at an adequate level to ensure good tree health. Thenitrogen to calcium ratio needs to be low (4.5 : 1).
Nitrogen in the deficit range can be corrected in one season butcalcium in the deficit range may take three to four years tocorrect. Therefore, it is important to have fruitlets analysedearly in the season to allow time to make any corrections in thenutritional balance of the fruit. P deficiency may take more thanone season to correct.
The best results from foliar application are achieved whenapplied to trees not under too much stress. Sprays should beapplied when humidity is high. Temperatures should be lessthan 25°C, the light intensity low and the young foliage-fullyturgid. The mixture should have a slightly acid pH and the treecanopy should be thoroughly wetted requiring 1000 – 2000L/ha.
By 50 days after full bloom (DAFB) the cell division phase ofthe fruit development is complete. This is the critical time forgetting foliar applied nutrients into the fruit. Growers need toapply at least 4 calcium sprays during the 50 DAFB to havemuch effect on firmness. High P levels in the fruit can assist inearlier colour development and thus earlier harvest times if theweather conditions are not too hot.
To maximise the benefits of foliar sprays in Spring, it isimportant that the orchard is well watered. The soil should be atfull capacity in Winter to ensure the tree is not under stress inthe Spring.
Soil and leaf samples should be analysed for mineral deficiencyin the Spring. If levels are deficient in the soil, tree or fruitletsconsult your local nutritional consultant to prepare a foliar, soilfertiliser and fertigation program to best correct the nutritionalimbalances.
Tree healthA healthy tree is essential to obtaining firm fruit. Stress causedby nutritional deficiency or lack of water will affect fruitfirmness. In addition, soil pathogens such as Phytophora willaffect tree roots thus reducing water and nutrient uptake.
ConclusionsPrevention is better than correction for soft fruit outturns.Therefore, the more comprehensive the historical records on preand post harvest management data for a specific orchard thegreater the chances of avoiding soft fruit after storage. Overmature fruit at harvest is a major factor contributing to soft fruitoutturns. Growers naturally want to maximise the tonnage offruit from an orchard. To do this they are tempted to delaypicking and therefore, the fruit is harvested over mature. Thismakes it even more important to know the exact maturity of thefruit going into storage to avoid storing the fruit too long.
Removing ethylene from the storage environment is a key toobtaining firm fruit. Measures that reduce ethylene productionwill significantly reduce the risk of soft fruit outturns. Thesemeasures require the use of ethylene scrubbers or treatments thatnegate the adverse effects of ethylene.
This article presents an overview of factors that may contributeto soft fruit outturns. However, there is no single recipe forpreventing soft fruit outturn. A number of factors may beinvolved and these often vary considerably between orchards.
Ethylene continued:Keeping ethylene levels below 0.5 parts per million (ppm) inthe storage room during filling and for the first two months ofstorage can reduce ethylene production by the fruit andethylene action on fruit softening. To achieve the ethylenelevels needed a catalytic ethylene scrubber should be installed.Low oxygen storage at 1.5% also suppresses ethyleneproduction and action.
SmartFreshTM is a gas that blocks ethylene action in the fruit.It is applied to the fruit shortly after harvest. Indications arethat it is likely to be as effective as an ethylene scrubber. Fruitfirmness is significantly improved after long term storage inair and CA. SmartFreshTM treated fruit can be 0.5 to 1.5 kgffirmer after medium to long term storage subject to orchardand seasonal variations.
ColourationThe minimum colour specification for Pink Lady apples is 40to 50% bright red blush. For some orchards colouring of thefruit to this level is a problem. Waiting too long for colour todevelop can results in over mature fruit at harvest and softfruit outturns. Reflective mulches increase the level of lightinside the tree canopy and make it possible to colour fruitearlier. Reflectors have a major effect on colouring and aminor effect on ripening rate. Potentially, earlier colouring ofthe fruit could result in fruit being picked closer to optimummaturity. Growth retardants may also assist colourdevelopment by retarding shoot growth.
NutritionMineral levels and mineral ratios in the fruit have a majoreffect on fruit firmness. Low levels of calcium andphosphorus and high levels of nitrogen and potassium can leadto soft fruit outturns (Table 2).
Table 2. The low or high and optimum levels ofcalcium, phosphorus, nitrogen and potassium in fruitat harvest.
Nutrient Low or highlevels
Percentage dryweight l
Optimumlevels
Percentage dryweight
Calcium 0.023 0.041Phosphorus 0.04 0.08Nitrogen 0.32 0.18Potassium 1.08 0.70
Mineral balance also affect fruit firmness and the idealmineral ratios are: Ca : N (1:4.5), Ca : P (1 : 2.2), Ca : K(1:30).
The nutritional status of the fruit at harvest must bemaintained in relation to the crop load and tree vigour.Sustaining two consecutive years of high crop loads (11-12fruit per centimeter butt) requires a low Ca / N ratio [1 : 4.5],with reduced tree vigour to ensure optimal levels of Ca and Nin the fruit at harvest. It is advisable to have 50 gram fruitletsanalysed in the Spring for their nutrient status to gauge ifnutritional correction is required. Major deviations from theoptimum standards will increase the risk of soft fruit. Formore detailed information refer to the publications listedbelow or consult your local industry adviser.
The advice provided in this publication is intended as a source of information only. Always read the label before using any of theproducts mentioned. Horticulture Australia Limited and the State of Victoria and its employees do not guarantee that thepublication is without flaw or is wholly appropriate for your particular purposes and therefore disclaim all liability for error, loss orconsequence which may arise from you relying on any information in this publication.
Further informationFurther information on preharvest and postharvest factors affecting softening of apples can be obtained from:
• Wilkinson R I, Frisina C, Franz P and Brown G (2004). Tracking Pink Lady apple firmness.Horticulture Australia Project HAL AP 01036, Final report.
• Little C R and Holmes R J (2000). Storage technology for apples and pears (Ed. Faragher, J)Department of Primary Industries, Victoria, Highway Press P/L, ISBN 0 7311 4466 X, pp. 112-152
• Chennell A, Bates V and Williams D (2002). Apple Maturity Management Training Workshop Manual.Department of Primary Industries, Victoria, pp. 1-34.
• Johnston J W, Hewett E W and Hertog M L A T (2002). Postharvest softening of apple (Malus domestica) fruit: a review.New Zealand Journal of Crop and Horticultural Science, 30:145-160.
Contacts for further information• Ian Wilkinson and Christine Frisina
DPI, Knoxfield Telephone 03 9210 9222
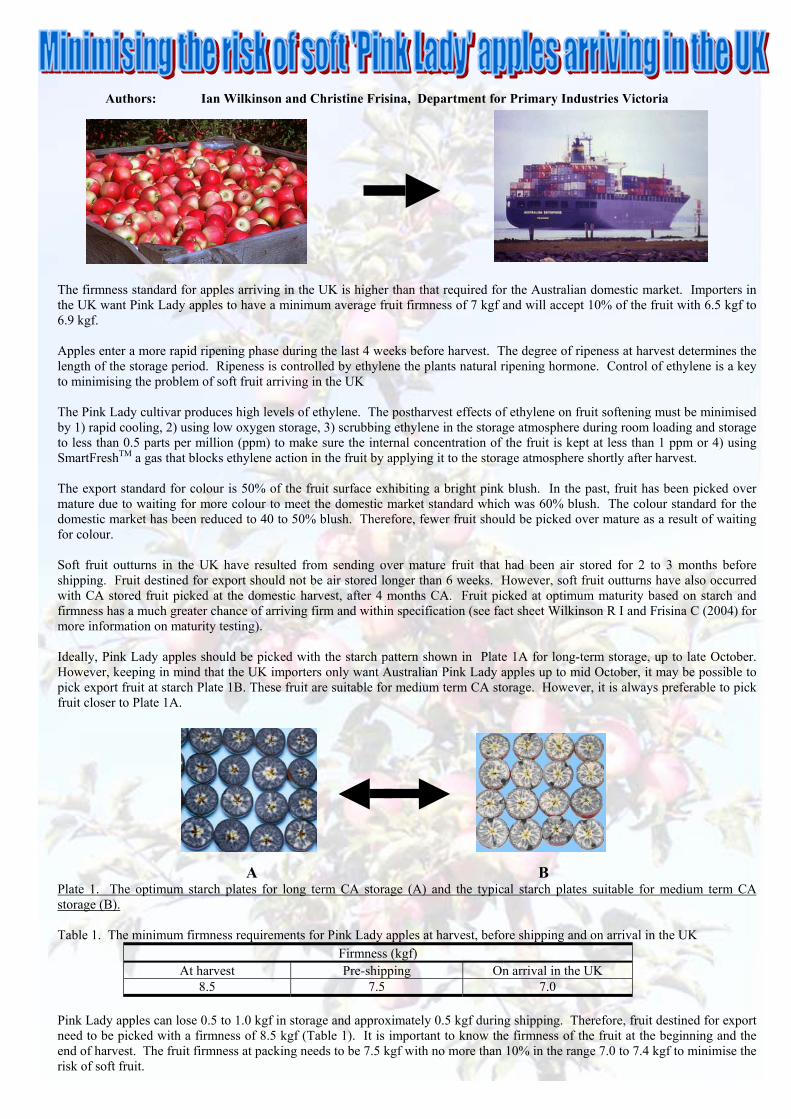
The firmness standard for apples arriving in the UK is higher than that required for the Australian domestic market. Importers inthe UK want Pink Lady apples to have a minimum average fruit firmness of 7 kgf and will accept 10% of the fruit with 6.5 kgf to6.9 kgf.
Apples enter a more rapid ripening phase during the last 4 weeks before harvest. The degree of ripeness at harvest determines thelength of the storage period. Ripeness is controlled by ethylene the plants natural ripening hormone. Control of ethylene is a keyto minimising the problem of soft fruit arriving in the UK
The Pink Lady cultivar produces high levels of ethylene. The postharvest effects of ethylene on fruit softening must be minimisedby 1) rapid cooling, 2) using low oxygen storage, 3) scrubbing ethylene in the storage atmosphere during room loading and storageto less than 0.5 parts per million (ppm) to make sure the internal concentration of the fruit is kept at less than 1 ppm or 4) usingSmartFreshTM a gas that blocks ethylene action in the fruit by applying it to the storage atmosphere shortly after harvest.
The export standard for colour is 50% of the fruit surface exhibiting a bright pink blush. In the past, fruit has been picked overmature due to waiting for more colour to meet the domestic market standard which was 60% blush. The colour standard for thedomestic market has been reduced to 40 to 50% blush. Therefore, fewer fruit should be picked over mature as a result of waitingfor colour.
Soft fruit outturns in the UK have resulted from sending over mature fruit that had been air stored for 2 to 3 months beforeshipping. Fruit destined for export should not be air stored longer than 6 weeks. However, soft fruit outturns have also occurredwith CA stored fruit picked at the domestic harvest, after 4 months CA. Fruit picked at optimum maturity based on starch andfirmness has a much greater chance of arriving firm and within specification (see fact sheet Wilkinson R I and Frisina C (2004) formore information on maturity testing).
Ideally, Pink Lady apples should be picked with the starch pattern shown in Plate 1A for long-term storage, up to late October.However, keeping in mind that the UK importers only want Australian Pink Lady apples up to mid October, it may be possible topick export fruit at starch Plate 1B. These fruit are suitable for medium term CA storage. However, it is always preferable to pickfruit closer to Plate 1A.
A BPlate 1. The optimum starch plates for long term CA storage (A) and the typical starch plates suitable for medium term CAstorage (B).
Table 1. The minimum firmness requirements for Pink Lady apples at harvest, before shipping and on arrival in the UKFirmness (kgf)
At harvest Pre-shipping On arrival in the UK8.5 7.5 7.0
Pink Lady apples can lose 0.5 to 1.0 kgf in storage and approximately 0.5 kgf during shipping. Therefore, fruit destined for exportneed to be picked with a firmness of 8.5 kgf (Table 1). It is important to know the firmness of the fruit at the beginning and theend of harvest. The fruit firmness at packing needs to be 7.5 kgf with no more than 10% in the range 7.0 to 7.4 kgf to minimise therisk of soft fruit.
Authors: Ian Wilkinson and Christine Frisina, Department for Primary Industries Victoria
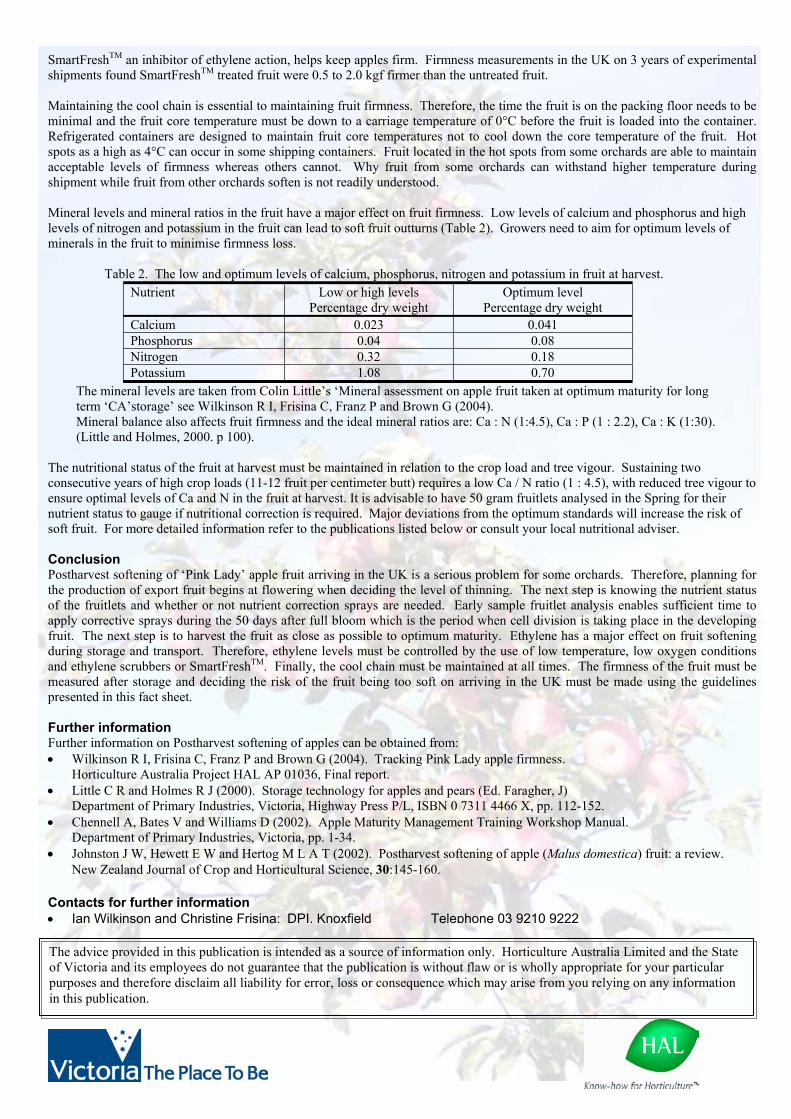
SmartFreshTM an inhibitor of ethylene action, helps keep apples firm. Firmness measurements in the UK on 3 years of experimentalshipments found SmartFreshTM treated fruit were 0.5 to 2.0 kgf firmer than the untreated fruit.
Maintaining the cool chain is essential to maintaining fruit firmness. Therefore, the time the fruit is on the packing floor needs to beminimal and the fruit core temperature must be down to a carriage temperature of 0°C before the fruit is loaded into the container.Refrigerated containers are designed to maintain fruit core temperatures not to cool down the core temperature of the fruit. Hotspots as a high as 4°C can occur in some shipping containers. Fruit located in the hot spots from some orchards are able to maintainacceptable levels of firmness whereas others cannot. Why fruit from some orchards can withstand higher temperature duringshipment while fruit from other orchards soften is not readily understood.
Mineral levels and mineral ratios in the fruit have a major effect on fruit firmness. Low levels of calcium and phosphorus and highlevels of nitrogen and potassium in the fruit can lead to soft fruit outturns (Table 2). Growers need to aim for optimum levels ofminerals in the fruit to minimise firmness loss.
Table 2. The low and optimum levels of calcium, phosphorus, nitrogen and potassium in fruit at harvest.Nutrient Low or high levels
Percentage dry weightOptimum level
Percentage dry weightCalcium 0.023 0.041Phosphorus 0.04 0.08Nitrogen 0.32 0.18Potassium 1.08 0.70
The mineral levels are taken from Colin Little’s ‘Mineral assessment on apple fruit taken at optimum maturity for longterm ‘CA’storage’ see Wilkinson R I, Frisina C, Franz P and Brown G (2004).Mineral balance also affects fruit firmness and the ideal mineral ratios are: Ca : N (1:4.5), Ca : P (1 : 2.2), Ca : K (1:30).(Little and Holmes, 2000. p 100).
The nutritional status of the fruit at harvest must be maintained in relation to the crop load and tree vigour. Sustaining twoconsecutive years of high crop loads (11-12 fruit per centimeter butt) requires a low Ca / N ratio (1 : 4.5), with reduced tree vigour toensure optimal levels of Ca and N in the fruit at harvest. It is advisable to have 50 gram fruitlets analysed in the Spring for theirnutrient status to gauge if nutritional correction is required. Major deviations from the optimum standards will increase the risk ofsoft fruit. For more detailed information refer to the publications listed below or consult your local nutritional adviser.
ConclusionPostharvest softening of ‘Pink Lady’ apple fruit arriving in the UK is a serious problem for some orchards. Therefore, planning forthe production of export fruit begins at flowering when deciding the level of thinning. The next step is knowing the nutrient statusof the fruitlets and whether or not nutrient correction sprays are needed. Early sample fruitlet analysis enables sufficient time toapply corrective sprays during the 50 days after full bloom which is the period when cell division is taking place in the developingfruit. The next step is to harvest the fruit as close as possible to optimum maturity. Ethylene has a major effect on fruit softeningduring storage and transport. Therefore, ethylene levels must be controlled by the use of low temperature, low oxygen conditionsand ethylene scrubbers or SmartFreshTM. Finally, the cool chain must be maintained at all times. The firmness of the fruit must bemeasured after storage and deciding the risk of the fruit being too soft on arriving in the UK must be made using the guidelinespresented in this fact sheet.
Further informationFurther information on Postharvest softening of apples can be obtained from:• Wilkinson R I, Frisina C, Franz P and Brown G (2004). Tracking Pink Lady apple firmness.
Horticulture Australia Project HAL AP 01036, Final report.• Little C R and Holmes R J (2000). Storage technology for apples and pears (Ed. Faragher, J)
Department of Primary Industries, Victoria, Highway Press P/L, ISBN 0 7311 4466 X, pp. 112-152.• Chennell A, Bates V and Williams D (2002). Apple Maturity Management Training Workshop Manual.
Department of Primary Industries, Victoria, pp. 1-34.• Johnston J W, Hewett E W and Hertog M L A T (2002). Postharvest softening of apple (Malus domestica) fruit: a review.
New Zealand Journal of Crop and Horticultural Science, 30:145-160.
Contacts for further information• Ian Wilkinson and Christine Frisina: DPI, Knoxfield Telephone 03 9210 9222
The advice provided in this publication is intended as a source of information only. Horticulture Australia Limited and the Stateof Victoria and its employees do not guarantee that the publication is without flaw or is wholly appropriate for your particularpurposes and therefore disclaim all liability for error, loss or consequence which may arise from you relying on any informationin this publication.