Embed Size (px)
Citation preview
Assessment of sensory firmness and crunchiness of tablegrapesby acoustic and mechanical properties
S. GIACOSA1, G. ZEPPA1, A. BAIANO2, F. TORCHIO1, S. RÍO SEGADE1, V. GERBI1 and L. ROLLE1
1 Dipartimento di Scienze Agrarie, Forestali e Alimentari, Università degli Studi di Torino, Grugliasco (TO), Italia2 Dipartimento di Scienze Agrarie, degli Alimenti e dell’Ambiente, Università degli Studi di Foggia, Foggia, Italia
Corresponding author: Dr Susana Río Segade, email [email protected]
AbstractBackground and Aims: The instrumental measurement of crunchiness in tablegrapes has been the subject of littleresearch in spite of the great relevance of this sensory texture trait to consumer preference. Therefore, our aim wasto evaluate the potential of several mechanical and acoustic properties to assess the perceived firmness andcrunchiness of tablegrape cultivars.Methods and Results: The ripening effect was minimised by densimetric sorting of the berries before testing. Thetextural quality of seven tablegrape cultivars was evaluated by sensory analysis. Furthermore, three mechanical tests(texture profile analysis, cutting and denture) were performed on the berry flesh or on whole berries, and theacoustic emission produced was recorded simultaneously. Correlation studies showed strong and significant rela-tionships between sensory texture attributes and instrumental parameters, particularly for the denture test. Never-theless, satisfactory predictive accuracy for the perceived crunchiness required multivariate linear regressioninvolving both mechanical and acoustic properties resulting from the denture test performed on whole berries. In thiscase, residual predictive interquartile amplitude was higher than 2. Most of the reliable models developed forperceived firmness are fairly recommended not for quantitative purposes but for fast screening (1.6 < residualpredictive interquartile amplitude < 2).Conclusions: The standardised protocol proposed permits more objective and quantitative sensory data to beobtained for firmness and crunchiness of tablegrapes.Significance of the Study: A combined mechanical–acoustic strategy has not previously been used in tablegrapesand represents a powerful tool for a more complete and exhaustive texture characterisation, particularly firmnessand crunchiness, by means of a more objective and standardised protocol.
Keywords: acoustic emission, crunchiness, instrumental texture analysis, sensory analysis, tablegrape
IntroductionThe significant world consumption of tablegrapes attractsmarket interest, and the production of cultivars with sensorycharacteristics greatly appreciated by consumers is a primaryobjective for grape breeding programs. Texture attributes play akey role in perceived quality and overall acceptability of freshfruits (Fillion and Kilcast 2002, Konopacka and Plocharski 2004,Péneau et al. 2006, Ha et al. 2007). According to consumerpreference, crunchiness represents a major sensory quality traitof tablegrapes, and as a result, cultivars with a crisp flesh textureare in demand for tablegrape breeding (Sato and Yamada 2003,Sato et al. 2006). In fresh fruits, crispness and crunchinessdepend on several factors, such as cultivar, ripening stage, envi-ronmental variation, cultural practices and sanitary conditions(Sato et al. 2000, 2004, Jayasena and Cameron 2009, Taniwakiet al. 2009, Zdunek et al. 2010a,b, 2011).
Food textural quality is generally evaluated by descriptivesensory analysis. The within-batch variability in sensory attrib-utes and the subjectivity are important limitations, whichshould be minimised as much as possible to obtain reliableconclusions (Bavay et al. 2013, 2014). Furthermore, the sensoryevaluation of crispness and crunchiness is complex, because ofthe great variability in the definition of descriptors. Chauvin
et al. (2008) developed six standard reference scales for selecteddry and wet crisp, crunch and crackly foods, as a first step inimproving the differentiation among these important texturalconcepts, in order to obtain more reproducible sensory data.These difficulties, together with the time required for and thehigh cost of sensory evaluation, have demanded objective andquantitative measurement of the texture characteristics byinstrumental analysis methods (Chen and Opara 2013).
Because the texture perceived in the mouth largely dependson the behaviour of the food while fracturing the tissues duringmastication, significant effort has been made in the develop-ment of instrumental techniques, which attempt to reproducethe mechanical operations of biting or chewing, for the success-ful assessment of sensory texture attributes. Penetration/puncture and compression tests are widely used to determinequantitatively the mechanical properties of winegrapes andtablegrapes (Rolle et al. 2012), together with the cutting test(Giacosa et al. 2014). In tablegrapes, typical mechanical param-eters instrumentally measured to define the textural quality ofwhole berry and pulp are hardness, cohesiveness, gumminess,springiness, chewiness, resilience, firmness, toughness and stiff-ness, whereas those used to characterise berry skin are hard-ness, stiffness and thickness (Sato et al. 1997, Deng et al. 2005,
Giacosa et al. Tablegrape crunchiness by instrumental properties 213
doi: 10.1111/ajgw.12126© 2015 Australian Society of Viticulture and Oenology Inc.
Rolle et al. 2011a, 2013, Río Segade et al. 2013a,b, Giacosa et al.2014).
In recent years, instrumental acoustic methods haveattracted growing interest for the investigation of the structuralproperties of foods (Saeleaw and Schleining 2011). In fact, crisp-ness and crunchiness are sensory attributes that can be instru-mentally assessed by the recording of the acoustic emissionproduced during the fracturing process of food tissues. Untilnow, most research on the instrumental measurement of crisp-ness has been focused on dry foods, such as cereal flakes,roasted almonds, potato chips and biscuits (Chaunier et al.2005, Chen et al. 2005, Varela et al. 2006, 2009, Salvador et al.2009, Saeleaw and Schleining 2011). Nevertheless, the masti-cation process is different for fresh fruits compared with that ofdry foods, and only a few studies have been published on theapplication of instrumental acoustic methods to characterise thetextural quality of apples and pears (Taniwaki et al. 2009,Zdunek et al. 2010a,b, 2011, Costa et al. 2011). These methodsare based on the placement of a microphone close to the sampleor an acoustic sensor attached to the mechanical device thatcontacts the sample. In contrast, combined mechanical andacoustic strategies provide a better and more realistic evaluationof the sensory perceived crispness/crunchiness than eithermethodology alone, and can bring better understanding of itsperception (Chaunier et al. 2005, Varela et al. 2006, 2009,Salvador et al. 2009, Zdunek et al. 2010a,b, 2011, Costa et al.2011, Saeleaw and Schleining 2011).
The crisp/crunch character of tablegrapes has been thesubject of little research, in spite of its great relevance for accept-ance of tablegrapes by consumers. Only two studies have beenpublished on the application of instrumental texture parametersas indicators of perceived sensory flesh crispness. Sato et al.(1997) used two mechanical properties, which were obtainedfrom the force–deformation curve during a penetration/puncture test performed on a thick flesh section. They definedcrisp texture as easily breakable and firm flesh, correspondinginstrumentally to a combination of small deformation at the firstmajor peak (≤2.5 mm) and large maximum force reached beforesample breakdown (≥0.9 N). Despite the necessity of using twoparameters, the cultivars studied were classified into only twogroups (crisp and non-crisp). More recently, Iwatani et al.(2011) successfully classified nine tablegrape cultivars accordingto flesh texture into three groups – crisp, non-crisp and inter-mediate – using the texture index. This index is based on theenergy density measured between 10 Hz and 3.2 kHz duringdestructive acoustic vibrations produced by the probe penetra-tion in thick flesh slices.
The aim of the present work was to evaluate the potentialof different instrumental texture properties (mechanical andacoustic) to assess sensory firmness and crunchiness of severaltablegrape cultivars. All the texture tests were performed ondensimetrically sorted berries to minimise the possible ripeningeffect and thus to obtain more robust conclusions. Whole berries(peeled and/or unpeeled) were subjected to three mechanicaltests (double compression, cutting and single compression-shearby denture), and the acoustic emission produced during the testwas simultaneously recorded. A combined instrumental strat-egy has not previously been used in tablegrapes and could be apowerful tool for a more complete and exhaustive texturecharacterisation. Furthermore, the relationship between instru-mental texture parameters and sensory descriptors was studiedin order to characterise tablegrape cultivars according tofirmness and crunchiness by means of a more objective andstandardised protocol. The influence of berry size was alsoinvestigated.
Materials and methods
Grape samplesThe study was carried out in 2012 on four red/black (ApirenRoz, Crimson Seedless, Michele Palieri, Red Globe) and threewhite (Pizzutello Bianco, T5, Patagonia) Vitis vinifera L.tablegrape cultivars. Apiren Roz and Crimson Seedless wereseedless cultivars, whereas the remaining cultivars were seeded.All cultivars were grown at the same vineyard located in ApuliaRegion (Foggia province, Southern Italy, 41°27′42″84N15°33′0″36E, 230 m asl). The vines, grafted onto 140 R root-stock, were planted at 2.4 × 2.4 m and trained to the tendonesystem Puglia type. At winter pruning, the vines were canepruned with four canes of 10/12 buds each. All tablegrapecultivars were collected at the same harvest date and in accord-ance with the ripeness requirements of the OrganisationInternationale de la Vigne et du Vin (OIV) resolution VITI1/2008 (Organisation Internationale de la Vigne et du Vin2008a). Twenty bunches were randomly sampled from tenplants (two bunches per vine). Once in the laboratory, all theberries from different parts of each bunch (shoulders, middleand bottom) were sorted according to their density by flotationin saline solutions, ranging from 70 to 160 g/L sodium chloride,which corresponded to density comprised between 1045 and1107 kg/m3 (Rolle et al. 2011b). For each cultivar, the berriesbelonging to each density class were then weighed. The berriesbelonging to the density class of 1081 kg/m3 were used for thetexture study, except that the density class of 1057 kg/m3 wasselected for Michele Palieri, which was characterised by lowsugar content. Berry size was calculated following the methodproposed by Río Segade et al. (2011a) from the measurement,for each single grape berry, of the length between top andbottom sides (L) and the length between both lateral sides at themiddle of berry height (l), using a calliper with an accuracy of0.1 mm. At least 100 intact, sorted grape berries for eachcultivar were randomly selected for sensory and instrumentaltexture measurements. For each cultivar and density class, theremaining berries were used for chemical analysis of the grapemust obtained by manual crushing and centrifugation.
Chemical analysisTotal soluble solids (TSS) concentration (°Brix) was measuredwith an Atago 0–32°Brix temperature compensating re-fractometer (Atago Corporation, Tokyo, Japan), pH wasdetermined by potentiometry using an InoLab 730 pH meter(WTW, Weilheim, Germany), and titratable acidity (TA) (g/Ltartaric acid) was estimated using OIV methods (OrganisationInternationale de la Vigne et du Vin 2008b). Reducing sugars(glucose and fructose) and organic acids (citric acid, tartaric acidand malic acid) (g/L) were determined using a 1260 InfinityHPLC system (Agilent Technologies, Santa Clara, CA, USA)equipped with both a refractive index detector and a diode arraydetector set to 210 nm. The analyses were performed accordingto the method proposed by Giordano et al. (2009). The datawere analysed with the ChemStation software (AgilentTechnologies).
Sensory analysisTasting took place in a standard sensory analysis chamber(International Organization for Standardization 2007) equippedwith individual booths. Noise and distracting stimuli wereabsent during the tasting session. Fifteen assessors aged from 20to 60 years, who were recruited from staff members at theUniversity of Turin (Italy) with experience in sensory analysis offoods, participated initially in this study. Four 2-h preliminary
214 Tablegrape crunchiness by instrumental properties Australian Journal of Grape and Wine Research 21, 213–225, 2015
© 2015 Australian Society of Viticulture and Oenology Inc.
training sessions were conducted to standardise criteria amongassessors on the textural quality of tablegrapes (Cliff et al. 1996,Le Moigne et al. 2008, Olarte Mantilla et al. 2012, 2013). In thefirst session, the assessors defined the sensory attributes andagreed on the need to evaluate separately three berries percultivar. Firmness was defined as the mechanical resistanceexerted by the sample during chewing, crunchiness as theacoustic emission produced during the first chews and juicinessas the perceived release of juice in the mouth space duringmastication. In the following three sessions, the assessors evalu-ated different reference foods characterised as soft and firm[Perle von Csaba and Superior Seedless grapes (OrganisationInternationale de la Vigne et du Vin 2009)], not crunchy andcrunchy [banana and green pepper (Chauvin et al. 2008)], andgelatinous and juicy [Delaware and Gamay grapes (OlarteMantilla et al. 2013)] for firmness, crunchiness and juiciness.The final scale for each attribute was also defined during thetraining sessions by tasting tablegrape samples. The perceivedintensity of five texture attributes (berry firmness, berrycrunchiness, flesh firmness, flesh crunchiness and flesh juici-ness) was scored using a linear and unstructured scale with arange of 0 (low)–100 (high) points. After the training sessions,the final panel was composed of a group of six trained panellists(two females and four males), who were selected according tothe reproducibility of the results and the greater ability to per-ceive differences in these sensory attributes (InternationalOrganization for Standardization 2012). They evaluated thegrape samples by triplicate (total number of samples per cultivarwas 18). All samples were labelled with a three-digit code andpresented in completely randomised order. The results werethen converted to the 0–1 point scale with 0 and corresponding1 to the lowest and highest score, respectively. For this purpose,the following ratio was calculated for each sensory attributeand panellist: (score obtained − minimum score)/(maximumscore − minimum score).
Instrumental texture analysisA Universal Testing Machine TA.XTplus texture analyser (StableMicro Systems, Godalming, England) equipped with a HDP/90platform and a 5 kg load cell was used. All data acquisitionswere made at 500 points per second, and the mechanical andacoustic properties were calculated from the correspondingcurves using the Texture Exponent software package (StableMicro Systems). Before each test session, the instrument wascalibrated for force, distance and acoustic emission.
The mechanical properties of the berry flesh were evaluatedby a texture profile analysis (TPA) test. Each one of the 20 wholeberries of each cultivar was peeled and then individually com-pressed in the equatorial position using a 35 mm P/35 flat cylin-drical probe (Stable Micro Systems; Figure 1a) under 25%deformation, with a waiting time between the two bites of 2 sand a test speed of 1 mm/s (Río Segade et al. 2011b). From theforce–time curve, typical mechanical parameters that define theberry texture characteristics were calculated by the software:hardness (N, as BH), cohesiveness (adimensional, as BCo), gum-miness (N, as BG), springiness (mm, as BS), chewiness (mJ, asBCh) and resilience (adimensional, as BR) (Rolle et al. 2011a).The relative standard error was 6.76, 2.14, 6.49, 2.24, 8.00 and2.65%, respectively. The berry diameter was calculated as thedistance between the berry trigger point and the platform base.Typical force–deformation curve of the TPA test performed ongrape was previously published by Rolle et al. (2012).
The mechanical properties of the flesh were determined bya cutting test with a HDP/BS blade-type probe (Stable MicroSystems; Figure 1b). For each cultivar, 20 whole berries were
manually peeled and then placed individually perpendicular tothe blade. The test was carried out at 10 mm/s, cutting thepeeled berry up to 90% of its minor diameter and acquiringthe force–cutting percentage curve (Giacosa et al. 2014).Cutting hardness of the flesh was assessed by the force (N, asF), toughness was estimated by the energy (mJ, as W),whereas stiffness was evaluated by the resistance to the defor-mation (N/mm, as E), at the first major deformation peak(point 1, first breakdown of the sample), at the maximumpenetration peak under 90% deformation (point 2) and at themaximum breakage peak (max). The force corresponds to theflesh resistance to the blade-type probe penetration, whereasthe energy needed to break the flesh is represented by the areaunder the curve. The third variable is defined as the slope ofthe force–distance curve in the linear section and measures theflesh stiffness. The relative standard error ranged from 8.89 to12.57%, from 7.87 to 15.73% and from 5.19 to 12.63% for F,W and E, respectively.
A third instrumental texture test was carried out on wholeberries, peeled and unpeeled, using dentures (adult male jaw)connected to the texture analyser (Figure 1c), which permitsa better simulation of the deformation occurring duringcompression-shear by teeth. In this case, for each cultivar, 40whole berries (20 peeled and 20 unpeeled) were individuallyplaced in the equatorial position between the upper and lowermolar teeth (Figure 1d), and the mechanical properties of theflesh and berry were determined and defined from the force–distance curve as in the cutting test. The relative standard errorranged from 5.90 to 16.52%, from 7.09 to 8.93% and from 5.43to 16.59% for F, W and E, respectively, in peeled berries andranged from 5.73 to 7.48%, from 5.83 to 9.76% and from 5.04to 7.63%, respectively, in unpeeled berries.
The acoustic emission produced during the cutting and den-tures tests was measured using an acoustic envelope detector(Stable Micro Systems; Figure 1c) equipped with a 12.7 mmdiameter Brüel & Kjær 4188-A-021 microphone (Nærum,Germany). The microphone was positioned at a 10-mm distancefrom the sample at an angle of 45° and connected to the textureanalyser. The recording of the acoustic emission produced wascarried out at an instrumental gain value of 24 dB using abuilt-in 3.125 kHz high-pass filter. The instrument was cali-brated before each measurement session using an acoustic cali-brator Brüel & Kjær type 4231 (94 and 114 dB–1000 Hz). The
Figure 1. Platform, probes and microphone used in texture analysistests. (a) Flat probe (∅ 35 mm); (b) HDP/BS blade-type probe; (c)dentures and microphone linked to acoustic envelope detector; and(d) view from above the denture and microphone showing the posi-tion of a peeled or unpeeled berry on the denture.
Giacosa et al. Tablegrape crunchiness by instrumental properties 215
© 2015 Australian Society of Viticulture and Oenology Inc.
following instrumental acoustic parameters were measured(Torchio et al. 2012): displacement (mm), sound duration (s),acoustic energy (dB × mm, as AE), positive acoustic energy(dB × mm, as positive AE), linear distance (adimensional, asLD), maximum acoustic pressure level (dB), number of acousticpeaks higher than 10 dB (adimensional, as Npk>10 dB), number ofacoustic peaks higher than 5 dB (adimensional, as Npk>5 dB),average acoustic pressure level for peaks with threshold higherthan 10 dB (dB, as AVpk>10 dB) and average acoustic pressure levelfor peaks with threshold higher than 5 dB (dB, as AVpk>5 dB). Therelative standard error ranged from 1.72 to 2.44%, from 1.64 to2.31%, from 2.21 to 2.61%, from 5.91 to 7.96%, from 2.94 to4.40%, from 2.38 to 2.68%, from 7.46 to 11.21%, from 3.83to 5.16%, from 0.95 to 2.36% and from 0.61 to 1.60%,respectively.
Statistical analysisData were analysed with the SPSS Statistics software packageversion 19.0 (IBM Corporation, Armonk, NY, USA). TheTukey-b test at P < 0.05 was used to establish significant differ-ences by one-way analysis of variance in sensory and instru-mental texture data among tablegrape cultivars. Pearson’scorrelation coefficients were calculated to determine significantrelationships between sensory descriptors and instrumentaltexture parameters. The performance of calibration modelsdeveloped by regression analysis by partial least squares (PLS)with full cross-validation (leave-one-out) was assessed from thecorrelation coefficient of calibration (regression coefficient, Rc)and the standard error of cross-validation (SECV). The residualpredictive deviation (RPD) is the most commonly used statisticalindex to account for the model reliability (Bellon-Maurel et al.2010) and was defined as the ratio between the standard devia-tion of the sample set and the SECV value. Another index, theresidual predictive interquartile amplitude (RPIQ) based onquartiles, was calculated as the ratio of the interquartile ampli-tude of the population to the SECV value (Bellon-Maurel et al.2010). The correlation studies were performed and calibrationmodels were developed on three replicates of six/seven berriesfor each cultivar, resulting in 21 samples (but about 140 deter-minations for each test).
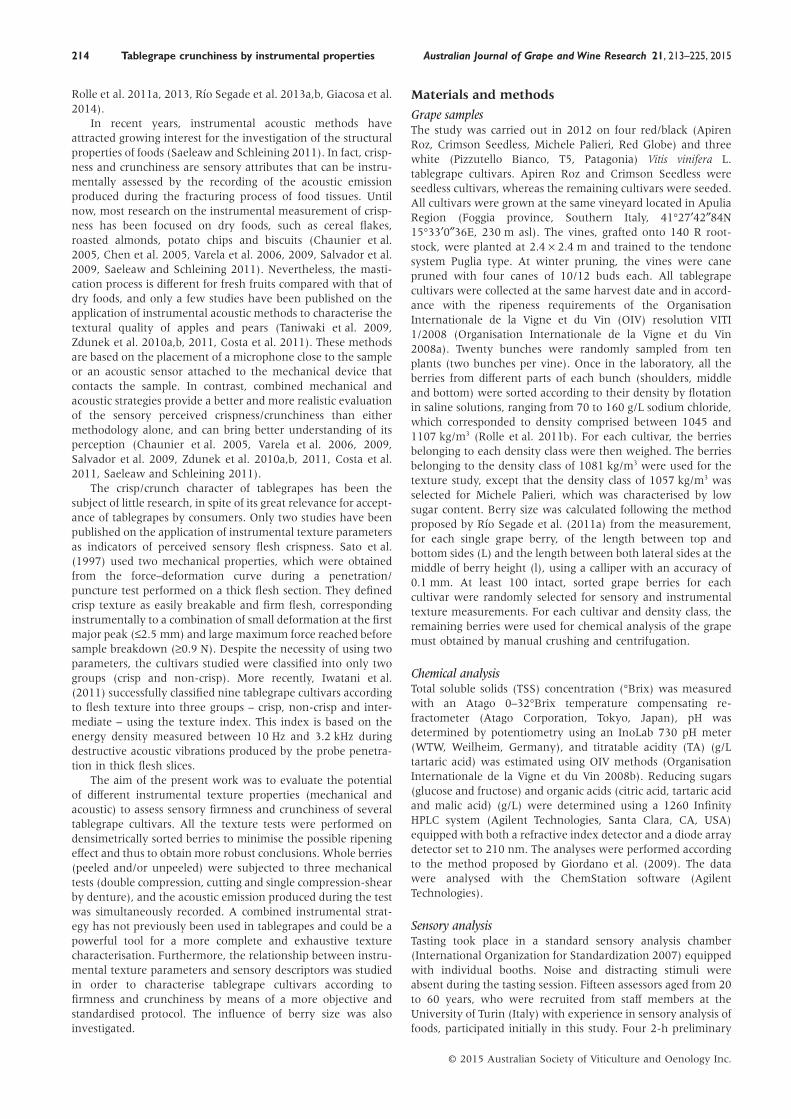
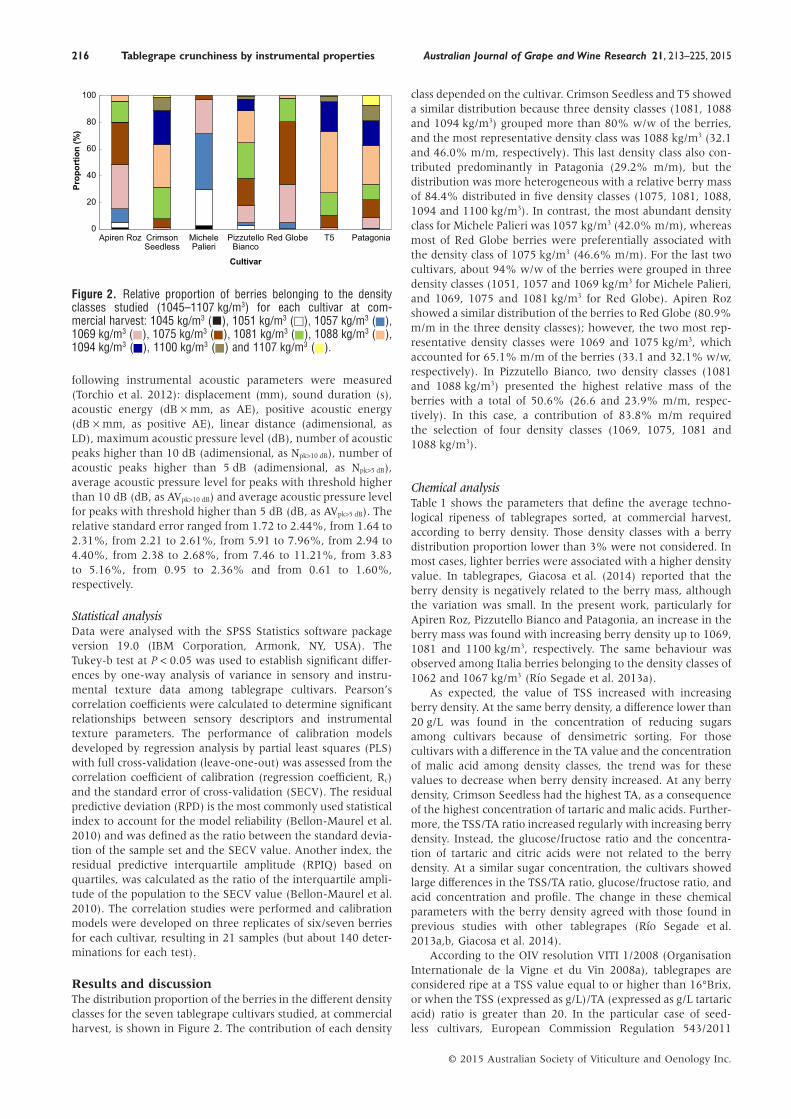
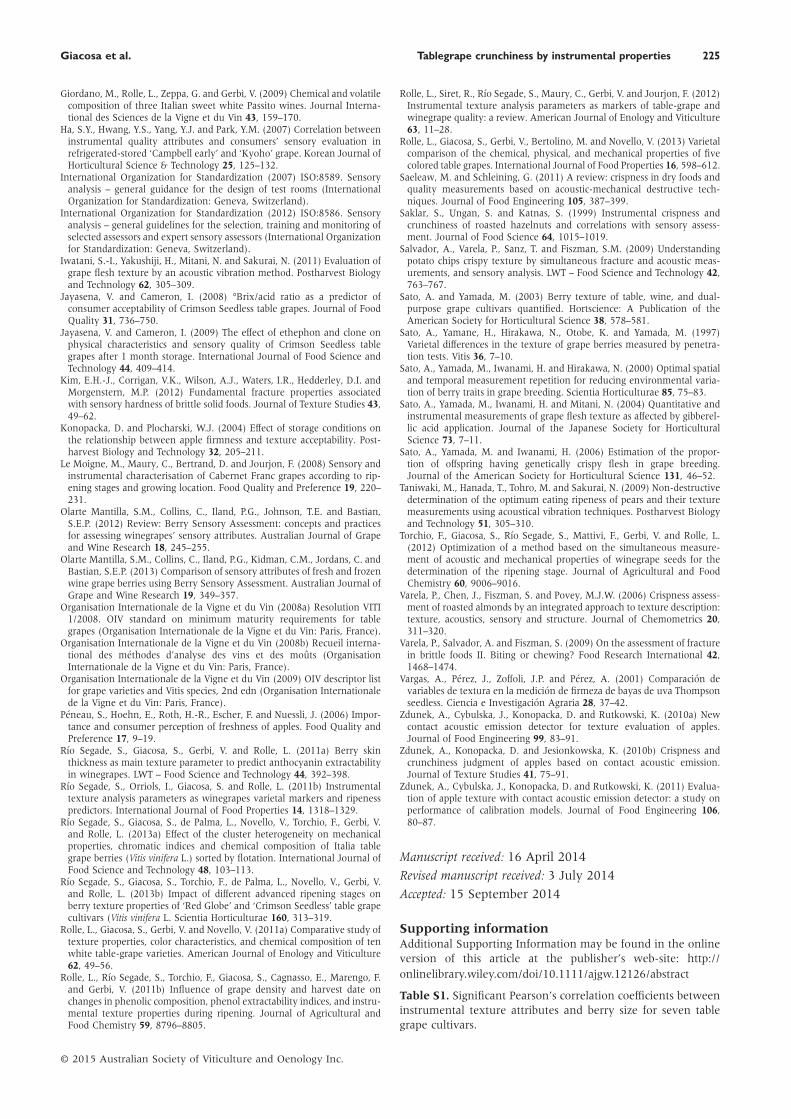
Results and discussionThe distribution proportion of the berries in the different densityclasses for the seven tablegrape cultivars studied, at commercialharvest, is shown in Figure 2. The contribution of each density
class depended on the cultivar. Crimson Seedless and T5 showeda similar distribution because three density classes (1081, 1088and 1094 kg/m3) grouped more than 80% w/w of the berries,and the most representative density class was 1088 kg/m3 (32.1and 46.0% m/m, respectively). This last density class also con-tributed predominantly in Patagonia (29.2% m/m), but thedistribution was more heterogeneous with a relative berry massof 84.4% distributed in five density classes (1075, 1081, 1088,1094 and 1100 kg/m3). In contrast, the most abundant densityclass for Michele Palieri was 1057 kg/m3 (42.0% m/m), whereasmost of Red Globe berries were preferentially associated withthe density class of 1075 kg/m3 (46.6% m/m). For the last twocultivars, about 94% w/w of the berries were grouped in threedensity classes (1051, 1057 and 1069 kg/m3 for Michele Palieri,and 1069, 1075 and 1081 kg/m3 for Red Globe). Apiren Rozshowed a similar distribution of the berries to Red Globe (80.9%m/m in the three density classes); however, the two most rep-resentative density classes were 1069 and 1075 kg/m3, whichaccounted for 65.1% m/m of the berries (33.1 and 32.1% w/w,respectively). In Pizzutello Bianco, two density classes (1081and 1088 kg/m3) presented the highest relative mass of theberries with a total of 50.6% (26.6 and 23.9% m/m, respec-tively). In this case, a contribution of 83.8% m/m requiredthe selection of four density classes (1069, 1075, 1081 and1088 kg/m3).
Chemical analysisTable 1 shows the parameters that define the average techno-logical ripeness of tablegrapes sorted, at commercial harvest,according to berry density. Those density classes with a berrydistribution proportion lower than 3% were not considered. Inmost cases, lighter berries were associated with a higher densityvalue. In tablegrapes, Giacosa et al. (2014) reported that theberry density is negatively related to the berry mass, althoughthe variation was small. In the present work, particularly forApiren Roz, Pizzutello Bianco and Patagonia, an increase in theberry mass was found with increasing berry density up to 1069,1081 and 1100 kg/m3, respectively. The same behaviour wasobserved among Italia berries belonging to the density classes of1062 and 1067 kg/m3 (Río Segade et al. 2013a).
As expected, the value of TSS increased with increasingberry density. At the same berry density, a difference lower than20 g/L was found in the concentration of reducing sugarsamong cultivars because of densimetric sorting. For thosecultivars with a difference in the TA value and the concentrationof malic acid among density classes, the trend was for thesevalues to decrease when berry density increased. At any berrydensity, Crimson Seedless had the highest TA, as a consequenceof the highest concentration of tartaric and malic acids. Further-more, the TSS/TA ratio increased regularly with increasing berrydensity. Instead, the glucose/fructose ratio and the concentra-tion of tartaric and citric acids were not related to the berrydensity. At a similar sugar concentration, the cultivars showedlarge differences in the TSS/TA ratio, glucose/fructose ratio, andacid concentration and profile. The change in these chemicalparameters with the berry density agreed with those found inprevious studies with other tablegrapes (Río Segade et al.2013a,b, Giacosa et al. 2014).
According to the OIV resolution VITI 1/2008 (OrganisationInternationale de la Vigne et du Vin 2008a), tablegrapes areconsidered ripe at a TSS value equal to or higher than 16°Brix,or when the TSS (expressed as g/L)/TA (expressed as g/L tartaricacid) ratio is greater than 20. In the particular case of seed-less cultivars, European Commission Regulation 543/2011
0
20
40
60
80
100
Apiren Roz CrimsonSeedless
MichelePalieri
PizzutelloBianco
Red Globe T5 Patagonia
Prop
ortio
n (%
)
Cultivar
Figure 2. Relative proportion of berries belonging to the densityclasses studied (1045–1107 kg/m3) for each cultivar at com-mercial harvest: 1045 kg/m3 (■), 1051 kg/m3 (□), 1057 kg/m3 ( ),1069 kg/m3 ( ), 1075 kg/m3 ( ), 1081 kg/m3 ( ), 1088 kg/m3 ( ),1094 kg/m3 ( ), 1100 kg/m3 ( ) and 1107 kg/m3 ( ).
216 Tablegrape crunchiness by instrumental properties Australian Journal of Grape and Wine Research 21, 213–225, 2015
© 2015 Australian Society of Viticulture and Oenology Inc.
(European Commission 2011) establishes that the ripeness isachieved at a TSS equal to or greater than 14°Brix. Jayasena andCameron (2008) reported that the degree of consumer satisfac-tion for Crimson Seedless is negatively correlated with theacidity, and that the acceptance increases with increasing TSSfrom 16 to 20°Brix. As reported in Table 1, all tablegrapecultivars reached the ripeness requirements when the berrydensity was equal to or higher than 1057 kg/m3.
In-field grape variability, attributable to physical and envi-ronmental factors, such as soil, topography and climate, has ledto a Gaussian bell-shaped distribution of berries in the differentdensity classes at harvest, as shown in Figure 2. Such heteroge-neity had a strong impact on the chemical composition of theberries. With the aim of minimising differences in the graperipeness grade among cultivars that could affect the texture
characteristics of the berries, the density class of 1081 kg/m3 wasselected for all cultivars for subsequent studies, with the ex-ception of Michele Palieri for which the berry density of1057 kg/m3 was used as being the most abundant one. Thisselection was done on the basis of achieving chemical compo-sition that corresponds to that of the unsorted sample.
Sensory analysisThe scores of the sensory texture attributes evaluated by thetrained panellists are shown in Table 2. There were significantdifferences among tablegrape cultivars in the five attributesevaluated, but the cultivars were differently classified as func-tion of the sensory attribute assessed. The lowest score of allattributes corresponded to cv. Apiren Roz, whereas Patagonia
Table 1. Average composition of densimetric sorted berries of seven tablegrape cultivars at commercial harvest.
Cultivar Density(kg/m3)
Berrymass (g)
TSS(°Brix)
G/F pH TA (g/L astartaric acid)
Tartaricacid (g/L)
Malicacid (g/L)
Citricacid (g/L)
TSS/TA†
Apiren Roz 1051 1.93 14.4 0.86 3.50 4.80 6.68 0.79 0.28 301057 2.23 15.9 0.89 3.54 4.76 6.71 0.97 0.32 321069 2.95 16.8 0.85 3.65 4.05 6.09 0.77 0.24 411075 2.44 18.1 0.86 3.62 4.28 6.63 0.88 0.28 421081 2.06 19.2 0.87 3.62 4.24 6.23 0.93 0.31 441088 1.21 20.7 0.92 3.56 4.95 6.91 0.96 0.44 40
Crimson Seedless 1075 3.75 19.5 0.99 3.58 6.53 6.97 3.10 0.43 291081 3.60 21.3 0.98 3.55 6.41 6.89 2.95 0.44 311088 2.94 21.5 0.98 3.52 6.53 7.04 2.95 0.42 321094 2.76 22.6 0.98 3.54 6.38 6.65 3.04 0.44 341100 2.50 24.5 0.99 3.56 6.45 6.60 3.15 0.46 36
Michele Palieri 1051 8.61 14.9 0.94 3.57 5.51 4.64 1.86 0.28 251057 9.04 16.7 0.98 3.50 6.08 4.63 0.00 0.28 261069 8.53 18.6 0.97 3.77 3.60 4.68 2.18 0.24 511075 5.44 20.9 0.98 3.83 3.71 4.91 2.11 0.21 53
Pizzutello Bianco 1069 4.77 16.9 0.98 3.78 4.35 6.29 2.23 0.18 391075 5.10 18.5 0.98 3.90 4.05 5.70 2.53 0.20 461081 5.67 19.7 0.98 3.95 4.16 5.69 2.43 0.19 471088 5.46 21.2 0.96 4.00 3.11 5.80 2.35 0.17 691094 5.24 23.3 0.96 3.96 3.83 6.19 2.53 0.18 61
Red Globe 1057 8.67 17.0 0.84 3.76 4.61 5.49 2.40 0.52 361069 8.81 17.4 0.85 3.90 4.46 5.69 2.57 0.48 401075 7.88 18.6 0.85 3.77 4.50 5.73 2.33 0.47 411081 5.16 18.6 0.85 3.95 3.30 5.04 1.80 0.35 58
T5 1075 5.21 18.2 0.98 3.71 4.50 5.99 1.93 0.55 391081 5.43 19.3 0.99 3.81 4.46 5.63 2.14 0.63 421088 4.84 20.4 0.98 3.82 4.50 5.62 2.13 0.64 451094 4.39 21.4 0.98 3.84 4.20 5.52 1.90 0.60 511100 3.68 21.6 0.98 3.83 4.13 5.85 1.83 0.53 52
Patagonia 1069 5.93 16.8 0.97 3.82 3.75 5.27 2.09 0.17 461075 5.50 18.3 0.97 3.80 3.83 5.65 1.88 0.18 501081 5.64 19.6 1.00 3.76 3.83 5.34 1.69 0.19 531088 6.62 20.3 1.00 3.72 3.75 5.72 1.43 0.18 551094 7.00 21.9 0.99 3.79 3.68 5.69 1.43 0.17 601100 7.25 23.8 0.99 3.87 3.79 5.95 1.48 0.18 651107 6.23 24.1 0.98 3.87 3.45 6.00 1.34 0.18 74
†TSS/TA, TSS (expressed as g/L)/TA (expressed as g/L tartaric acid). G/F, glucose/fructose; TA, titratable acidity; TSS, total soluble solids.
Giacosa et al. Tablegrape crunchiness by instrumental properties 217
© 2015 Australian Society of Viticulture and Oenology Inc.
berries were characterised by their significantly juicier flesh. Allremaining cultivars showed intermediate scores of flesh juici-ness. Three groups were established for berry firmness, and thehighest score corresponded to Red Globe, T5 and Crimson Seed-less. Higher heterogeneity was observed among cultivars (fivegroups) when berry crunchiness was evaluated: Crimson Seed-less berries were characterised as the crunchiest. Flesh firmnessand crunchiness classified the cultivars quite similarly in fourand three groups, respectively. The highest score of fleshcrunchiness corresponded to Michele Palieri, Crimson Seedlessand Red Globe, but that of flesh firmness was related only to thelast two cultivars.
The relationship between sensory attributes was alsoexplored showing that the sensory perception of firmness wasclosely associated with the perceived crunchiness in tablegrapes(r ≥ 0.790, P < 0.001, data not shown), particularly when peeledberries were tested (r = 0.927, P < 0.001, data not shown).
Instrumental texture analysisA significant difference was found in all TPA attributes of theberry flesh among the seven cultivars (Table 3). According toTukey-b test (P < 0.05), springiness (measurement of the abilityto recover the initial form) was the most discriminant attributebecause the cultivars were classified in five perfectly differenti-ated groups. Hardness (measurement of the force necessary toattain a given deformation) and gumminess (measurement ofthe force necessary to disintegrate a semi-solid food until itis ready for swallowing) also classified the cultivars into fourwell-differentiated groups. Cohesiveness (measurement of thestrength of the internal bonds making up the body of theproduct) and resilience (measurement of how well the productfights to regain its original position) established four interrelatedgroups of cultivars, whereas chewiness (measurement of the
energy necessary to chew a solid food until it is ready forswallowing) was able to differentiate perfectly the cultivars intothree groups.
The peeled berries of Apiren Roz were significantly lesshard, gummy, springy and chewy than that of the other sixcultivars, whereas those of Michele Palieri were significantlyharder, gummier, springier and chewier. In contrast, a signifi-cantly lower value of cohesiveness and of resilience was asso-ciated with T5 grapes, while the highest value was recorded forPizzutello Bianco berries. The results obtained were similar tothose previously reported for peeled berries of other tablegrapecultivars (Giacosa et al. 2014) and generally lower than those ofwhole unpeeled berries (Rolle et al. 2011a, Río Segade et al.2013b).
The mechanical and acoustic attributes obtained from thecutting test on berry flesh are shown in Table 4. The differencein the texture attributes among the cultivars was significant.According to Tukey-b test (P < 0.05), the acoustic traits, suchas displacement, sound duration and acoustic energy (AE),were the most differentiating cutting attributes they classifiedthe cultivars into five completely separated groups. Toughnessat the maximum penetration peak under 90% deformation(W2) and linear distance (LD) also established five groups ofcultivars but not as well differentiated. In contrast, toughnessat the first major deformation peak and at the maximumbreakage peak (W1 and Wmax, respectively), stiffness at themaximum penetration peak under 90% deformation (E2),maximum acoustic pressure level and average acoustic pres-sure level for peaks with a threshold higher than 10 dB and5 dB (AVpk>10 dB and AVpk>5 dB, respectively) classified thecultivars into only two groups. Hardness at the first majordeformation peak and at the maximum penetration peakunder 90% deformation (F1 and F2, respectively) were able to
Table 2. Sensory descriptive analysis of densimetric sorted berries of seven tablegrape cultivars at commercial harvest.
Attribute ApirenRoz
CrimsonSeedless
MichelePalieri
PizzutelloBianco
Red Globe T5 Patagonia Sign
Berry firmness 0.21 ± 0.25a 0.73 ± 0.29c 0.48 ± 0.32bc 0.43 ± 0.30ab 0.77 ± 0.16c 0.76 ± 0.16c 0.55 ± 0.30bc ***
Berry crunchiness 0.26 ± 0.23a 0.82 ± 0.16e 0.32 ± 0.26ab 0.45 ± 0.28abc 0.56 ± 0.29bcd 0.79 ± 0.19de 0.66 ± 0.25cde ***
Flesh firmness 0.18 ± 0.14a 0.77 ± 0.22d 0.58 ± 0.35cd 0.48 ± 0.27bc 0.73 ± 0.26d 0.56 ± 0.19cd 0.31 ± 0.32ab ***
Flesh crunchiness 0.31 ± 0.26a 0.73 ± 0.22c 0.77 ± 0.23c 0.49 ± 0.28ab 0.72 ± 0.21c 0.55 ± 0.27bc 0.34 ± 0.22ab ***
Flesh juiciness 0.25 ± 0.24a 0.53 ± 0.23b 0.43 ± 0.36ab 0.49 ± 0.27ab 0.48 ± 0.31ab 0.58 ± 0.24b 0.83 ± 0.17c ***
***P < 0.001. Average value ± standard deviation (n = 18). Different letters within the same row indicate a significant difference among tablegrape cultivars (Tukey-btest; P < 0.05). Sign, significance.
Table 3. Berry flesh mechanical attributes from the texture profile analysis of densimetric sorted berries of seven tablegrape cultivars atcommercial harvest.
Attribute Apiren
Roz
Crimson
Seedless
Michele
Palieri
Pizzutello
Bianco
Red Globe T5 Patagonia Sign
BH (N) 1.80 ± 0.69a 6.5 ± 1.4c 9.4 ± 3.2d 3.3 ± 1.1b 4.0 ± 1.1b 5.9 ± 1.4c 3.8 ± 1.4b ***
BCo 0.410 ± 0.031cd 0.360 ± 0.023b 0.361 ± 0.037b 0.436 ± 0.058d 0.388 ± 0.030bc 0.311 ± 0.036a 0.390 ± 0.040bc ***
BG (N) 0.72 ± 0.24a 2.34 ± 0.55c 3.5 ± 1.3d 1.40 ± 0.36b 1.55 ± 0.39b 1.80 ± 0.34b 1.49 ± 0.55b ***
BS (mm) 1.50 ± 0.18a 1.85 ± 0.14b 2.78 ± 0.37e 2.20 ± 0.19c 2.51 ± 0.22d 2.10 ± 0.19c 2.18 ± 0.24c ***
BCh (mJ) 1.11 ± 0.47a 4.4 ± 1.3b 10.0 ± 4.8c 3.12 ± 0.95b 3.9 ± 1.2b 3.79 ± 0.94b 3.3 ± 1.5b ***
BR 0.197 ± 0.017cd 0.179 ± 0.013bc 0.185 ± 0.025bc 0.206 ± 0.031d 0.176 ± 0.017b 0.142 ± 0.016a 0.167 ± 0.029b ***
***P < 0.001. Average value ± standard deviation (n = 20). Different letters within the same row indicate a significant difference among tablegrape cultivars (Tukey-b test; P < 0.05).BCh, chewiness; BCo, cohesiveness; BG, gumminess; BH, hardness; BR, resilience; BS, springiness; Sign, significance.
218 Tablegrape crunchiness by instrumental properties Australian Journal of Grape and Wine Research 21, 213–225, 2015
© 2015 Australian Society of Viticulture and Oenology Inc.
differentiate three interrelated groups of cultivars. The remain-ing cutting parameters discriminated the cultivars into fourgroups, which were also interrelated.
Apiren Roz and Crimson Seedless showed the lowest valuefor most of the mechanical and acoustic attributes obtainedfrom the cutting test, with the exception of stiffness at the firstbreakdown of the sample (E1) for Apiren Roz and Patagonia,E2 for Apiren Roz, Crimson Seedless and Patagonia, stiffnessat the maximum breakage peak (Emax) for Apiren Roz andAVpk>10 dB for Crimson Seedless. The results found for displace-ment, sound duration, AE, LD and number of acoustic peakshigher than 5 dB (Npk>5 dB) were significantly lower for ApirenRoz berries. On the contrary, the highest values of the cuttingparameters were associated with Michele Palieri, with theexception of F1, W1, F2 and E2 for which Red Globe berriesachieved higher values although they were significantly differ-ent to those corresponding to Michele Palieri only for W1. Par-ticularly, the parameters W2, displacement, sound durationand AE were significantly higher for Michele Palieri berries.Furthermore, Michele Palieri had similar values to those of theRed Globe berries for Wmax, positive AE, maximum acousticpressure level, AVpk>10 dB and AVpk>5 dB, as well as to those of T5for hardness at the maximum breakage peak (Fmax) and Wmax.The results obtained for the mechanical properties were of thesame order of magnitude as those previously reported forpeeled berries of other tablegrape cultivars (Giacosa et al.2014).
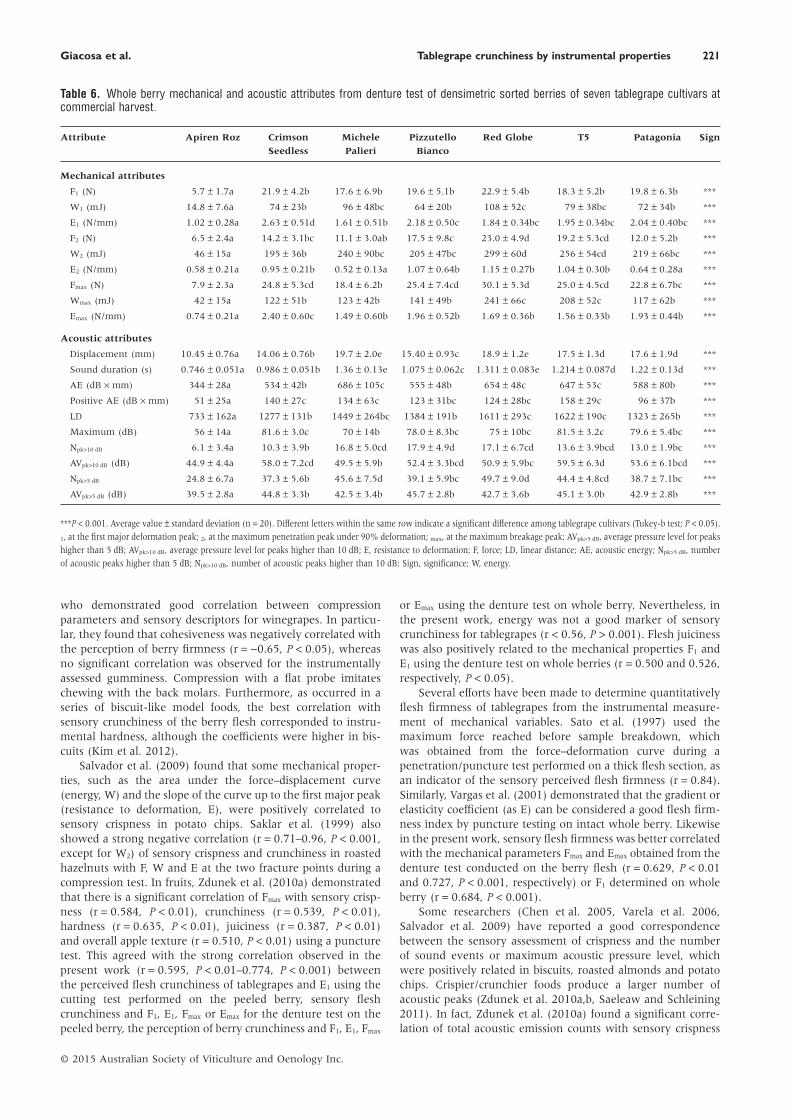
The mechanical and acoustic data obtained from thedenture test on the berry flesh (Table 5) and whole berry(Table 6) indicate that the differences in the texture attributes
among the cultivars studied were significant, with the exceptionof maximum acoustic pressure level and AVpk>10 dB measured inpeeled berries. For the denture test performed on berry fleshand according to Tukey-b test (P < 0.05) (Table 5), the attributesE1, W2, Fmax, Wmax, Emax, LD, displacement, sound duration andAE classified the cultivars studied into five or four groups, whichwere completely differentiated using the last three attributes.The less discriminating texture attributes were W1, F2, E2 andAVpk>5 dB because only two groups of cultivars were established.Regarding the denture test conducted on whole berries andaccording to Tukey-b test (P < 0.05) (Table 6), the attributesE1, F2, W2, Fmax, number of acoustic peaks higher than 10 dB(Npk>10 dB), AVpk>10 dB and Npk>5 dB differentiated the cultivars intofour interrelated groups, whereas displacement and sound dura-tion were the most discriminating texture attributes by classify-ing the cultivars into five completely separated groups. Theparameters F1, E2 and AVpk>5 dB were able to differentiate onlytwo groups of cultivars. The remaining attributes discriminatedthe cultivars into three groups.
Apiren Roz was characterised by the lowest values of alltexture attributes measured by denture testing on the berryflesh or whole berry, with the exception of E2. The cultivarsshowing the highest values of the mechanical and acousticproperties depended on the attribute measured and the testapplied. Michele Palieri showed significantly higher values ofthe attributes W2, displacement, sound duration and AE meas-ured in the berry flesh (Table 5). Furthermore, this last cultivarpresented the highest values of F1 and E1, but the resultsobtained for Fmax, Emax, positive AE and LD, and Npk>10 dB weresimilar to those found for Red Globe, Crimson Seedless, T5
Table 4. Berry flesh mechanical and acoustic attributes from cutting test of densimetric sorted berries of seven tablegrape cultivars atcommercial harvest.
Attribute Apiren Roz Crimson
Seedless
Michele
Palieri
Pizzutello
Bianco
Red Globe T5 Patagonia Sign
Mechanical attributes
F1 (N) 1.39 ± 0.25a 1.46 ± 0.46a 2.5 ± 1.1bc 2.14 ± 0.48ab 3.3 ± 2.4c 2.7 ± 1.2bc 1.92 ± 0.84ab ***
W1 (mJ) 2.20 ± 0.81a 1.9 ± 1.3a 4.4 ± 3.1a 4.7 ± 2.4a 10 ± 12b 5.7 ± 4.3a 4.8 ± 3.0a ***
E1 (N/mm) 0.381 ± 0.061a 0.52 ± 0.12bc 0.67 ± 0.16d 0.441 ± 0.097ab 0.50 ± 0.14b 0.61 ± 0.16cd 0.356 ± 0.076a ***
F2 (N) 1.27 ± 0.63a 1.01 ± 0.19a 3.5 ± 4.9bc 2.2 ± 1.0ab 4.3 ± 2.0c 2.84 ± 0.96abc 2.2 ± 1.3ab ***
W2 (mJ) 12.9 ± 5.2a 17.7 ± 5.4ab 67 ± 25e 29 ± 11bc 53 ± 16d 54 ± 19d 34 ± 13c ***
E2 (N/mm) 0.109 ± 0.053a 0.071 ± 0.013a 0.18 ± 0.26ab 0.144 ± 0.067ab 0.25 ± 0.12b 0.161 ± 0.052ab 0.128 ± 0.071a ***
Fmax (N) 2.07 ± 0.61a 2.03 ± 0.54a 7.5 ± 4.6d 3.7 ± 1.5ab 5.9 ± 2.3cd 6.3 ± 2.0d 4.2 ± 2.6bc ***
Wmax (mJ) 8.4 ± 5.1a 8.0 ± 4.1a 38 ± 21b 15.6 ± 7.4a 35 ± 14b 29 ± 12b 18 ± 11a ***
Emax (N/mm) 0.281 ± 0.061a 0.33 ± 0.16ab 0.62 ± 0.30d 0.40 ± 0.17ab 0.46 ± 0.17bc 0.58 ± 0.14cd 0.39 ± 0.18ab ***
Acoustic attributes
Displacement (mm) 10.1 ± 1.4a 12.0 ± 1.3b 18.3 ± 2.0e 14.0 ± 1.2c 16.3 ± 1.2d 15.9 ± 1.1d 15.7 ± 1.4d ***
Sound duration (s) 1.01 ± 0.14a 1.20 ± 0.13b 1.83 ± 0.20e 1.40 ± 0.12c 1.63 ± 0.12d 1.59 ± 0.11d 1.57 ± 0.14d ***
AE (dB × mm) 305 ± 44a 368 ± 42b 571 ± 69e 439 ± 43c 511 ± 42d 487 ± 42d 479 ± 46d ***
Positive AE (dB × mm) 22 ± 15a 31.6 ± 8.4ab 58 ± 21d 46 ± 10cd 55 ± 17d 40 ± 13bc 40 ± 12bc ***
LD 574 ± 147a 788 ± 155b 1252 ± 324e 1067 ± 152cd 1200 ± 151de 1025 ± 225c 969 ± 173c ***
Maximum (dB) 47.2 ± 5.8a 44.6 ± 2.0a 55.6 ± 9.5b 46.6 ± 3.1a 54.5 ± 7.1b 48.6 ± 5.5a 47.5 ± 4.6a ***
Npk>10 dB 3.2 ± 2.4a 4.8 ± 3.3ab 12.3 ± 5.1d 9.1 ± 4.4c 10.4 ± 3.5cd 8.6 ± 2.8c 7.2 ± 3.5bc ***
AVpk>10 dB (dB) 43.2 ± 2.4ab 41.5 ± 1.1a 44.1 ± 2.6b 41.8 ± 1.1ab 44.0 ± 2.8b 42.4 ± 1.8ab 42.0 ± 1.2ab **
Npk>5 dB 16.3 ± 5.1a 25.1 ± 6.7b 37 ± 10d 33.7 ± 4.8cd 34.1 ± 4.9cd 30.4 ± 8.4bc 29.0 ± 5.7bc ***
AVpk>5 dB (dB) 37.0 ± 1.3a 36.90 ± 0.65a 38.8 ± 1.3b 37.5 ± 1.1a 38.48 ± 0.92b 37.50 ± 0.84a 37.2 ± 1.0a ***
**P < 0.01; ***P < 0.001. Average value ± standard deviation (n = 20). Different letters within the same row indicate a significant difference among tablegrape cultivars (Tukey-b test;P < 0.05). 1, at the first major deformation peak; 2, at the maximum penetration peak under 90% deformation; max, at the maximum breakage peak; AE, acoustic energy; AVpk>5 dB,average pressure level for peaks higher than 5 dB; AVpk>10 dB, average pressure level for peaks higher than 10 dB; E, resistance to deformation; F, force; LD, linear distance; Npk>5 dB,number of acoustic peaks higher than 5 dB; Npk>10 dB, number of acoustic peaks higher than 10 dB; Sign, significance; W, energy.
Giacosa et al. Tablegrape crunchiness by instrumental properties 219
© 2015 Australian Society of Viticulture and Oenology Inc.
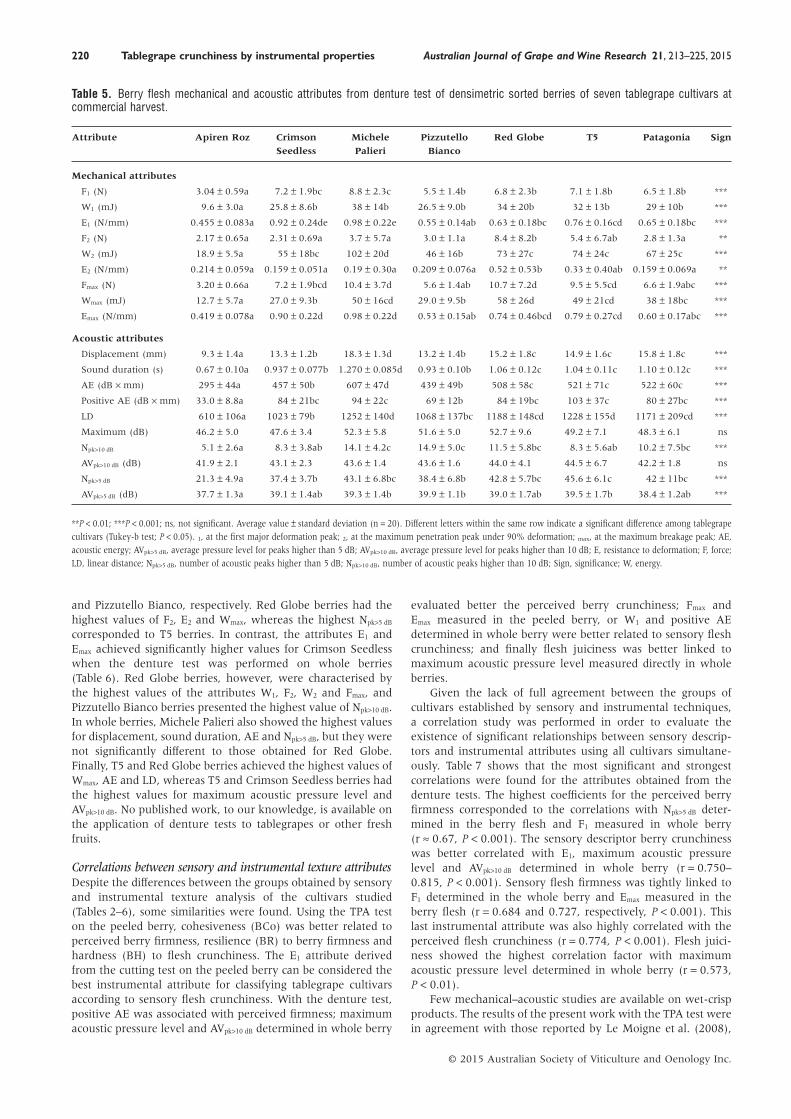
and Pizzutello Bianco, respectively. Red Globe berries had thehighest values of F2, E2 and Wmax, whereas the highest Npk>5 dB
corresponded to T5 berries. In contrast, the attributes E1 andEmax achieved significantly higher values for Crimson Seedlesswhen the denture test was performed on whole berries(Table 6). Red Globe berries, however, were characterised bythe highest values of the attributes W1, F2, W2 and Fmax, andPizzutello Bianco berries presented the highest value of Npk>10 dB.In whole berries, Michele Palieri also showed the highest valuesfor displacement, sound duration, AE and Npk>5 dB, but they werenot significantly different to those obtained for Red Globe.Finally, T5 and Red Globe berries achieved the highest values ofWmax, AE and LD, whereas T5 and Crimson Seedless berries hadthe highest values for maximum acoustic pressure level andAVpk>10 dB. No published work, to our knowledge, is available onthe application of denture tests to tablegrapes or other freshfruits.
Correlations between sensory and instrumental texture attributesDespite the differences between the groups obtained by sensoryand instrumental texture analysis of the cultivars studied(Tables 2–6), some similarities were found. Using the TPA teston the peeled berry, cohesiveness (BCo) was better related toperceived berry firmness, resilience (BR) to berry firmness andhardness (BH) to flesh crunchiness. The E1 attribute derivedfrom the cutting test on the peeled berry can be considered thebest instrumental attribute for classifying tablegrape cultivarsaccording to sensory flesh crunchiness. With the denture test,positive AE was associated with perceived firmness; maximumacoustic pressure level and AVpk>10 dB determined in whole berry
evaluated better the perceived berry crunchiness; Fmax andEmax measured in the peeled berry, or W1 and positive AEdetermined in whole berry were better related to sensory fleshcrunchiness; and finally flesh juiciness was better linked tomaximum acoustic pressure level measured directly in wholeberries.
Given the lack of full agreement between the groups ofcultivars established by sensory and instrumental techniques,a correlation study was performed in order to evaluate theexistence of significant relationships between sensory descrip-tors and instrumental attributes using all cultivars simultane-ously. Table 7 shows that the most significant and strongestcorrelations were found for the attributes obtained from thedenture tests. The highest coefficients for the perceived berryfirmness corresponded to the correlations with Npk>5 dB deter-mined in the berry flesh and F1 measured in whole berry(r ≈ 0.67, P < 0.001). The sensory descriptor berry crunchinesswas better correlated with E1, maximum acoustic pressurelevel and AVpk>10 dB determined in whole berry (r = 0.750–0.815, P < 0.001). Sensory flesh firmness was tightly linked toF1 determined in the whole berry and Emax measured in theberry flesh (r = 0.684 and 0.727, respectively, P < 0.001). Thislast instrumental attribute was also highly correlated with theperceived flesh crunchiness (r = 0.774, P < 0.001). Flesh juici-ness showed the highest correlation factor with maximumacoustic pressure level determined in whole berry (r = 0.573,P < 0.01).
Few mechanical–acoustic studies are available on wet-crispproducts. The results of the present work with the TPA test werein agreement with those reported by Le Moigne et al. (2008),
Table 5. Berry flesh mechanical and acoustic attributes from denture test of densimetric sorted berries of seven tablegrape cultivars atcommercial harvest.
Attribute Apiren Roz Crimson
Seedless
Michele
Palieri
Pizzutello
Bianco
Red Globe T5 Patagonia Sign
Mechanical attributes
F1 (N) 3.04 ± 0.59a 7.2 ± 1.9bc 8.8 ± 2.3c 5.5 ± 1.4b 6.8 ± 2.3b 7.1 ± 1.8b 6.5 ± 1.8b ***
W1 (mJ) 9.6 ± 3.0a 25.8 ± 8.6b 38 ± 14b 26.5 ± 9.0b 34 ± 20b 32 ± 13b 29 ± 10b ***
E1 (N/mm) 0.455 ± 0.083a 0.92 ± 0.24de 0.98 ± 0.22e 0.55 ± 0.14ab 0.63 ± 0.18bc 0.76 ± 0.16cd 0.65 ± 0.18bc ***
F2 (N) 2.17 ± 0.65a 2.31 ± 0.69a 3.7 ± 5.7a 3.0 ± 1.1a 8.4 ± 8.2b 5.4 ± 6.7ab 2.8 ± 1.3a **
W2 (mJ) 18.9 ± 5.5a 55 ± 18bc 102 ± 20d 46 ± 16b 73 ± 27c 74 ± 24c 67 ± 25c ***
E2 (N/mm) 0.214 ± 0.059a 0.159 ± 0.051a 0.19 ± 0.30a 0.209 ± 0.076a 0.52 ± 0.53b 0.33 ± 0.40ab 0.159 ± 0.069a **
Fmax (N) 3.20 ± 0.66a 7.2 ± 1.9bcd 10.4 ± 3.7d 5.6 ± 1.4ab 10.7 ± 7.2d 9.5 ± 5.5cd 6.6 ± 1.9abc ***
Wmax (mJ) 12.7 ± 5.7a 27.0 ± 9.3b 50 ± 16cd 29.0 ± 9.5b 58 ± 26d 49 ± 21cd 38 ± 18bc ***
Emax (N/mm) 0.419 ± 0.078a 0.90 ± 0.22d 0.98 ± 0.22d 0.53 ± 0.15ab 0.74 ± 0.46bcd 0.79 ± 0.27cd 0.60 ± 0.17abc ***
Acoustic attributes
Displacement (mm) 9.3 ± 1.4a 13.3 ± 1.2b 18.3 ± 1.3d 13.2 ± 1.4b 15.2 ± 1.8c 14.9 ± 1.6c 15.8 ± 1.8c ***
Sound duration (s) 0.67 ± 0.10a 0.937 ± 0.077b 1.270 ± 0.085d 0.93 ± 0.10b 1.06 ± 0.12c 1.04 ± 0.11c 1.10 ± 0.12c ***
AE (dB × mm) 295 ± 44a 457 ± 50b 607 ± 47d 439 ± 49b 508 ± 58c 521 ± 71c 522 ± 60c ***
Positive AE (dB × mm) 33.0 ± 8.8a 84 ± 21bc 94 ± 22c 69 ± 12b 84 ± 19bc 103 ± 37c 80 ± 27bc ***
LD 610 ± 106a 1023 ± 79b 1252 ± 140d 1068 ± 137bc 1188 ± 148cd 1228 ± 155d 1171 ± 209cd ***
Maximum (dB) 46.2 ± 5.0 47.6 ± 3.4 52.3 ± 5.8 51.6 ± 5.0 52.7 ± 9.6 49.2 ± 7.1 48.3 ± 6.1 ns
Npk>10 dB 5.1 ± 2.6a 8.3 ± 3.8ab 14.1 ± 4.2c 14.9 ± 5.0c 11.5 ± 5.8bc 8.3 ± 5.6ab 10.2 ± 7.5bc ***
AVpk>10 dB (dB) 41.9 ± 2.1 43.1 ± 2.3 43.6 ± 1.4 43.6 ± 1.6 44.0 ± 4.1 44.5 ± 6.7 42.2 ± 1.8 ns
Npk>5 dB 21.3 ± 4.9a 37.4 ± 3.7b 43.1 ± 6.8bc 38.4 ± 6.8b 42.8 ± 5.7bc 45.6 ± 6.1c 42 ± 11bc ***
AVpk>5 dB (dB) 37.7 ± 1.3a 39.1 ± 1.4ab 39.3 ± 1.4b 39.9 ± 1.1b 39.0 ± 1.7ab 39.5 ± 1.7b 38.4 ± 1.2ab ***
**P < 0.01; ***P < 0.001; ns, not significant. Average value ± standard deviation (n = 20). Different letters within the same row indicate a significant difference among tablegrapecultivars (Tukey-b test; P < 0.05). 1, at the first major deformation peak; 2, at the maximum penetration peak under 90% deformation; max, at the maximum breakage peak; AE,acoustic energy; AVpk>5 dB, average pressure level for peaks higher than 5 dB; AVpk>10 dB, average pressure level for peaks higher than 10 dB; E, resistance to deformation; F, force;LD, linear distance; Npk>5 dB, number of acoustic peaks higher than 5 dB; Npk>10 dB, number of acoustic peaks higher than 10 dB; Sign, significance; W, energy.
220 Tablegrape crunchiness by instrumental properties Australian Journal of Grape and Wine Research 21, 213–225, 2015
© 2015 Australian Society of Viticulture and Oenology Inc.
who demonstrated good correlation between compressionparameters and sensory descriptors for winegrapes. In particu-lar, they found that cohesiveness was negatively correlated withthe perception of berry firmness (r = −0.65, P < 0.05), whereasno significant correlation was observed for the instrumentallyassessed gumminess. Compression with a flat probe imitateschewing with the back molars. Furthermore, as occurred in aseries of biscuit-like model foods, the best correlation withsensory crunchiness of the berry flesh corresponded to instru-mental hardness, although the coefficients were higher in bis-cuits (Kim et al. 2012).
Salvador et al. (2009) found that some mechanical proper-ties, such as the area under the force–displacement curve(energy, W) and the slope of the curve up to the first major peak(resistance to deformation, E), were positively correlated tosensory crispness in potato chips. Saklar et al. (1999) alsoshowed a strong negative correlation (r = 0.71–0.96, P < 0.001,except for W2) of sensory crispness and crunchiness in roastedhazelnuts with F, W and E at the two fracture points during acompression test. In fruits, Zdunek et al. (2010a) demonstratedthat there is a significant correlation of Fmax with sensory crisp-ness (r = 0.584, P < 0.01), crunchiness (r = 0.539, P < 0.01),hardness (r = 0.635, P < 0.01), juiciness (r = 0.387, P < 0.01)and overall apple texture (r = 0.510, P < 0.01) using a puncturetest. This agreed with the strong correlation observed in thepresent work (r = 0.595, P < 0.01–0.774, P < 0.001) betweenthe perceived flesh crunchiness of tablegrapes and E1 using thecutting test performed on the peeled berry, sensory fleshcrunchiness and F1, E1, Fmax or Emax for the denture test on thepeeled berry, the perception of berry crunchiness and F1, E1, Fmax
or Emax using the denture test on whole berry. Nevertheless, inthe present work, energy was not a good marker of sensorycrunchiness for tablegrapes (r < 0.56, P > 0.001). Flesh juicinesswas also positively related to the mechanical properties F1 andE1 using the denture test on whole berries (r = 0.500 and 0.526,respectively, P < 0.05).
Several efforts have been made to determine quantitativelyflesh firmness of tablegrapes from the instrumental measure-ment of mechanical variables. Sato et al. (1997) used themaximum force reached before sample breakdown, whichwas obtained from the force–deformation curve during apenetration/puncture test performed on a thick flesh section, asan indicator of the sensory perceived flesh firmness (r = 0.84).Similarly, Vargas et al. (2001) demonstrated that the gradient orelasticity coefficient (as E) can be considered a good flesh firm-ness index by puncture testing on intact whole berry. Likewisein the present work, sensory flesh firmness was better correlatedwith the mechanical parameters Fmax and Emax obtained from thedenture test conducted on the berry flesh (r = 0.629, P < 0.01and 0.727, P < 0.001, respectively) or F1 determined on wholeberry (r = 0.684, P < 0.001).
Some researchers (Chen et al. 2005, Varela et al. 2006,Salvador et al. 2009) have reported a good correspondencebetween the sensory assessment of crispness and the numberof sound events or maximum acoustic pressure level, whichwere positively related in biscuits, roasted almonds and potatochips. Crispier/crunchier foods produce a larger number ofacoustic peaks (Zdunek et al. 2010a,b, Saeleaw and Schleining2011). In fact, Zdunek et al. (2010a) found a significant corre-lation of total acoustic emission counts with sensory crispness
Table 6. Whole berry mechanical and acoustic attributes from denture test of densimetric sorted berries of seven tablegrape cultivars atcommercial harvest.
Attribute Apiren Roz Crimson
Seedless
Michele
Palieri
Pizzutello
Bianco
Red Globe T5 Patagonia Sign
Mechanical attributes
F1 (N) 5.7 ± 1.7a 21.9 ± 4.2b 17.6 ± 6.9b 19.6 ± 5.1b 22.9 ± 5.4b 18.3 ± 5.2b 19.8 ± 6.3b ***
W1 (mJ) 14.8 ± 7.6a 74 ± 23b 96 ± 48bc 64 ± 20b 108 ± 52c 79 ± 38bc 72 ± 34b ***
E1 (N/mm) 1.02 ± 0.28a 2.63 ± 0.51d 1.61 ± 0.51b 2.18 ± 0.50c 1.84 ± 0.34bc 1.95 ± 0.34bc 2.04 ± 0.40bc ***
F2 (N) 6.5 ± 2.4a 14.2 ± 3.1bc 11.1 ± 3.0ab 17.5 ± 9.8c 23.0 ± 4.9d 19.2 ± 5.3cd 12.0 ± 5.2b ***
W2 (mJ) 46 ± 15a 195 ± 36b 240 ± 90bc 205 ± 47bc 299 ± 60d 256 ± 54cd 219 ± 66bc ***
E2 (N/mm) 0.58 ± 0.21a 0.95 ± 0.21b 0.52 ± 0.13a 1.07 ± 0.64b 1.15 ± 0.27b 1.04 ± 0.30b 0.64 ± 0.28a ***
Fmax (N) 7.9 ± 2.3a 24.8 ± 5.3cd 18.4 ± 6.2b 25.4 ± 7.4cd 30.1 ± 5.3d 25.0 ± 4.5cd 22.8 ± 6.7bc ***
Wmax (mJ) 42 ± 15a 122 ± 51b 123 ± 42b 141 ± 49b 241 ± 66c 208 ± 52c 117 ± 62b ***
Emax (N/mm) 0.74 ± 0.21a 2.40 ± 0.60c 1.49 ± 0.60b 1.96 ± 0.52b 1.69 ± 0.36b 1.56 ± 0.33b 1.93 ± 0.44b ***
Acoustic attributes
Displacement (mm) 10.45 ± 0.76a 14.06 ± 0.76b 19.7 ± 2.0e 15.40 ± 0.93c 18.9 ± 1.2e 17.5 ± 1.3d 17.6 ± 1.9d ***
Sound duration (s) 0.746 ± 0.051a 0.986 ± 0.051b 1.36 ± 0.13e 1.075 ± 0.062c 1.311 ± 0.083e 1.214 ± 0.087d 1.22 ± 0.13d ***
AE (dB × mm) 344 ± 28a 534 ± 42b 686 ± 105c 555 ± 48b 654 ± 48c 647 ± 53c 588 ± 80b ***
Positive AE (dB × mm) 51 ± 25a 140 ± 27c 134 ± 63c 123 ± 31bc 124 ± 28bc 158 ± 29c 96 ± 37b ***
LD 733 ± 162a 1277 ± 131b 1449 ± 264bc 1384 ± 191b 1611 ± 293c 1622 ± 190c 1323 ± 265b ***
Maximum (dB) 56 ± 14a 81.6 ± 3.0c 70 ± 14b 78.0 ± 8.3bc 75 ± 10bc 81.5 ± 3.2c 79.6 ± 5.4bc ***
Npk>10 dB 6.1 ± 3.4a 10.3 ± 3.9b 16.8 ± 5.0cd 17.9 ± 4.9d 17.1 ± 6.7cd 13.6 ± 3.9bcd 13.0 ± 1.9bc ***
AVpk>10 dB (dB) 44.9 ± 4.4a 58.0 ± 7.2cd 49.5 ± 5.9b 52.4 ± 3.3bcd 50.9 ± 5.9bc 59.5 ± 6.3d 53.6 ± 6.1bcd ***
Npk>5 dB 24.8 ± 6.7a 37.3 ± 5.6b 45.6 ± 7.5d 39.1 ± 5.9bc 49.7 ± 9.0d 44.4 ± 4.8cd 38.7 ± 7.1bc ***
AVpk>5 dB (dB) 39.5 ± 2.8a 44.8 ± 3.3b 42.5 ± 3.4b 45.7 ± 2.8b 42.7 ± 3.6b 45.1 ± 3.0b 42.9 ± 2.8b ***
***P < 0.001. Average value ± standard deviation (n = 20). Different letters within the same row indicate a significant difference among tablegrape cultivars (Tukey-b test; P < 0.05).
1, at the first major deformation peak; 2, at the maximum penetration peak under 90% deformation; max, at the maximum breakage peak; AVpk>5 dB, average pressure level for peakshigher than 5 dB; AVpk>10 dB, average pressure level for peaks higher than 10 dB; E, resistance to deformation; F, force; LD, linear distance; AE, acoustic energy; Npk>5 dB, numberof acoustic peaks higher than 5 dB; Npk>10 dB, number of acoustic peaks higher than 10 dB; Sign, significance; W, energy.
Giacosa et al. Tablegrape crunchiness by instrumental properties 221
© 2015 Australian Society of Viticulture and Oenology Inc.
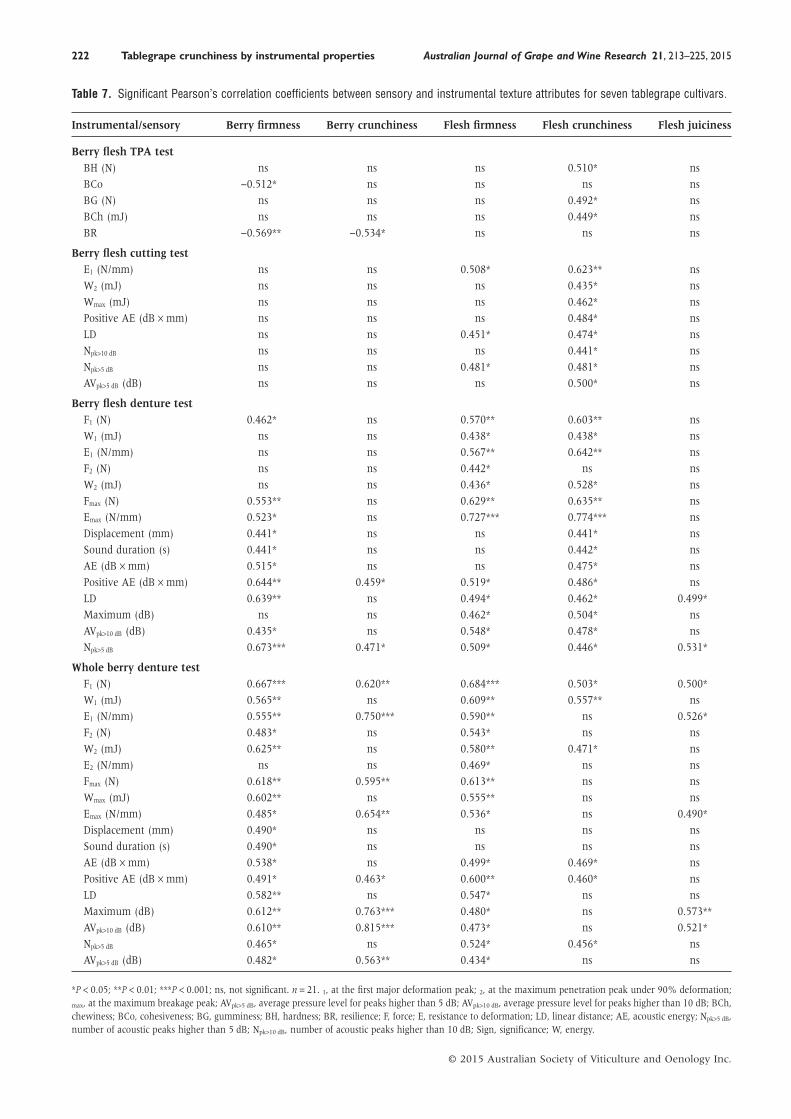
Table 7. Significant Pearson’s correlation coefficients between sensory and instrumental texture attributes for seven tablegrape cultivars.
Instrumental/sensory Berry firmness Berry crunchiness Flesh firmness Flesh crunchiness Flesh juiciness
Berry flesh TPA testBH (N) ns ns ns 0.510* ns
BCo −0.512* ns ns ns ns
BG (N) ns ns ns 0.492* ns
BCh (mJ) ns ns ns 0.449* ns
BR −0.569** −0.534* ns ns ns
Berry flesh cutting testE1 (N/mm) ns ns 0.508* 0.623** ns
W2 (mJ) ns ns ns 0.435* ns
Wmax (mJ) ns ns ns 0.462* ns
Positive AE (dB × mm) ns ns ns 0.484* ns
LD ns ns 0.451* 0.474* ns
Npk>10 dB ns ns ns 0.441* ns
Npk>5 dB ns ns 0.481* 0.481* ns
AVpk>5 dB (dB) ns ns ns 0.500* ns
Berry flesh denture testF1 (N) 0.462* ns 0.570** 0.603** ns
W1 (mJ) ns ns 0.438* 0.438* ns
E1 (N/mm) ns ns 0.567** 0.642** ns
F2 (N) ns ns 0.442* ns ns
W2 (mJ) ns ns 0.436* 0.528* ns
Fmax (N) 0.553** ns 0.629** 0.635** ns
Emax (N/mm) 0.523* ns 0.727*** 0.774*** ns
Displacement (mm) 0.441* ns ns 0.441* ns
Sound duration (s) 0.441* ns ns 0.442* ns
AE (dB × mm) 0.515* ns ns 0.475* ns
Positive AE (dB × mm) 0.644** 0.459* 0.519* 0.486* ns
LD 0.639** ns 0.494* 0.462* 0.499*
Maximum (dB) ns ns 0.462* 0.504* ns
AVpk>10 dB (dB) 0.435* ns 0.548* 0.478* ns
Npk>5 dB 0.673*** 0.471* 0.509* 0.446* 0.531*
Whole berry denture testF1 (N) 0.667*** 0.620** 0.684*** 0.503* 0.500*
W1 (mJ) 0.565** ns 0.609** 0.557** ns
E1 (N/mm) 0.555** 0.750*** 0.590** ns 0.526*
F2 (N) 0.483* ns 0.543* ns ns
W2 (mJ) 0.625** ns 0.580** 0.471* ns
E2 (N/mm) ns ns 0.469* ns ns
Fmax (N) 0.618** 0.595** 0.613** ns ns
Wmax (mJ) 0.602** ns 0.555** ns ns
Emax (N/mm) 0.485* 0.654** 0.536* ns 0.490*
Displacement (mm) 0.490* ns ns ns ns
Sound duration (s) 0.490* ns ns ns ns
AE (dB × mm) 0.538* ns 0.499* 0.469* ns
Positive AE (dB × mm) 0.491* 0.463* 0.600** 0.460* ns
LD 0.582** ns 0.547* ns ns
Maximum (dB) 0.612** 0.763*** 0.480* ns 0.573**
AVpk>10 dB (dB) 0.610** 0.815*** 0.473* ns 0.521*
Npk>5 dB 0.465* ns 0.524* 0.456* ns
AVpk>5 dB (dB) 0.482* 0.563** 0.434* ns ns
*P < 0.05; **P < 0.01; ***P < 0.001; ns, not significant. n = 21. 1, at the first major deformation peak; 2, at the maximum penetration peak under 90% deformation;
max, at the maximum breakage peak; AVpk>5 dB, average pressure level for peaks higher than 5 dB; AVpk>10 dB, average pressure level for peaks higher than 10 dB; BCh,chewiness; BCo, cohesiveness; BG, gumminess; BH, hardness; BR, resilience; F, force; E, resistance to deformation; LD, linear distance; AE, acoustic energy; Npk>5 dB,number of acoustic peaks higher than 5 dB; Npk>10 dB, number of acoustic peaks higher than 10 dB; Sign, significance; W, energy.
222 Tablegrape crunchiness by instrumental properties Australian Journal of Grape and Wine Research 21, 213–225, 2015
© 2015 Australian Society of Viticulture and Oenology Inc.
(r = 0.670, P < 0.01), crunchiness (r = 0.631, P < 0.01), hard-ness (r = 0.659, P < 0.01), juiciness (r = 0.511, P < 0.01) andoverall apple texture (r = 0.618, P < 0.01) during a puncturetest. In the present work, the number of acoustic peaks (Npk)was not an appropriate index of crunchiness for tablegrapes(r < 0.49), whereas maximum acoustic pressure level may beparticularly useful for predicting sensory berry crunchinessfrom the denture test on the whole berry (r = 0.763,P < 0.001). Another commonly used instrumental descriptor ofthe perceived crunchiness is the average amplitude of acousticevents, which also increases with increasing crunchiness(Chaunier et al. 2005, Zdunek et al. 2010b). Chaunier et al.(2005) reported a linear determination coefficient (r2) of 0.63(P = 0.0012) in cornflakes using a compression test. Neverthe-less, this last parameter depends on the stress level in thesource of acoustic emission and on the attenuation of theelastic waves from the source to the sensor. In fact, the hard-ening of the tissue causes the decrease in the attenuation of theelastic waves (Zdunek et al. 2010b). According to Table 7, theacoustic parameter AVpk>10 dB determined by the denture test inwhole berries could be successfully used as an instrumentalindicator of sensory berry crunchiness for tablegrapes(r = 0.815, P < 0.001).
The significance of the mechanical and acoustic attributessuggests a combined methodology wherever possible to predictsensory texture descriptors in tablegrapes. For this, the relation-
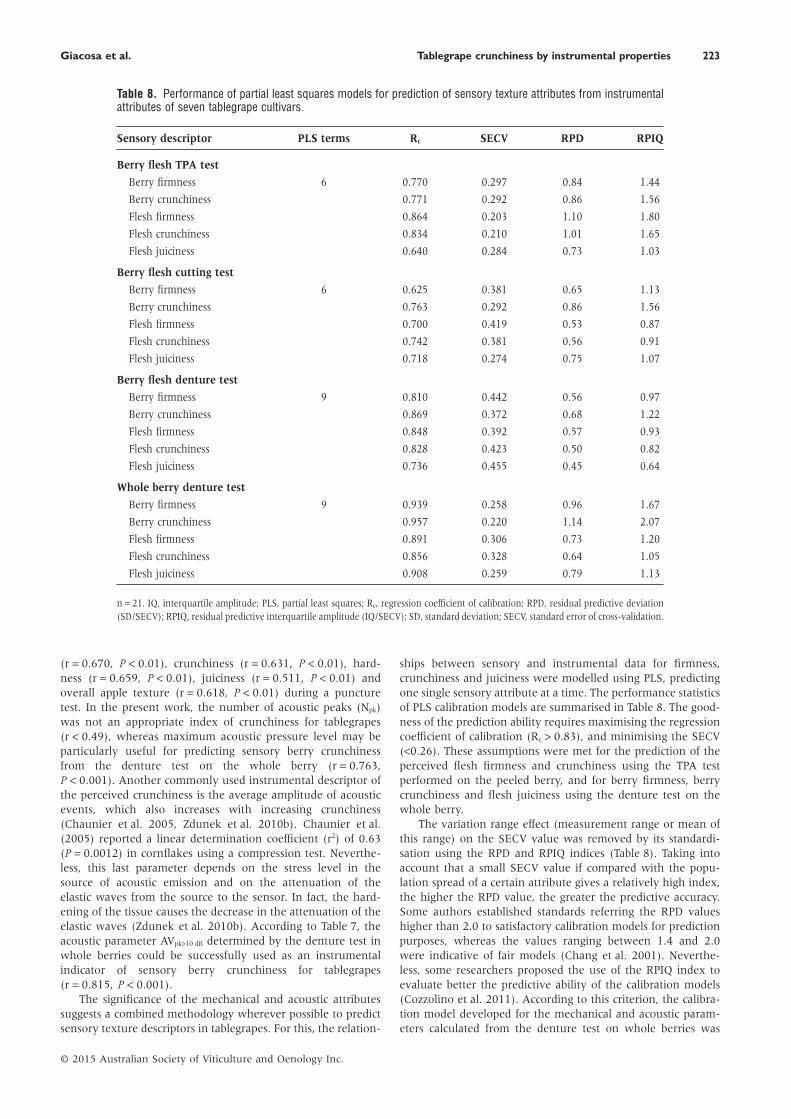
ships between sensory and instrumental data for firmness,crunchiness and juiciness were modelled using PLS, predictingone single sensory attribute at a time. The performance statisticsof PLS calibration models are summarised in Table 8. The good-ness of the prediction ability requires maximising the regressioncoefficient of calibration (Rc > 0.83), and minimising the SECV(<0.26). These assumptions were met for the prediction of theperceived flesh firmness and crunchiness using the TPA testperformed on the peeled berry, and for berry firmness, berrycrunchiness and flesh juiciness using the denture test on thewhole berry.
The variation range effect (measurement range or mean ofthis range) on the SECV value was removed by its standardi-sation using the RPD and RPIQ indices (Table 8). Taking intoaccount that a small SECV value if compared with the popu-lation spread of a certain attribute gives a relatively high index,the higher the RPD value, the greater the predictive accuracy.Some authors established standards referring the RPD valueshigher than 2.0 to satisfactory calibration models for predictionpurposes, whereas the values ranging between 1.4 and 2.0were indicative of fair models (Chang et al. 2001). Neverthe-less, some researchers proposed the use of the RPIQ index toevaluate better the predictive ability of the calibration models(Cozzolino et al. 2011). According to this criterion, the calibra-tion model developed for the mechanical and acoustic param-eters calculated from the denture test on whole berries was
Table 8. Performance of partial least squares models for prediction of sensory texture attributes from instrumentalattributes of seven tablegrape cultivars.
Sensory descriptor PLS terms Rc SECV RPD RPIQ
Berry flesh TPA test
Berry firmness 6 0.770 0.297 0.84 1.44
Berry crunchiness 0.771 0.292 0.86 1.56
Flesh firmness 0.864 0.203 1.10 1.80
Flesh crunchiness 0.834 0.210 1.01 1.65
Flesh juiciness 0.640 0.284 0.73 1.03
Berry flesh cutting test
Berry firmness 6 0.625 0.381 0.65 1.13
Berry crunchiness 0.763 0.292 0.86 1.56
Flesh firmness 0.700 0.419 0.53 0.87
Flesh crunchiness 0.742 0.381 0.56 0.91
Flesh juiciness 0.718 0.274 0.75 1.07
Berry flesh denture test
Berry firmness 9 0.810 0.442 0.56 0.97
Berry crunchiness 0.869 0.372 0.68 1.22
Flesh firmness 0.848 0.392 0.57 0.93
Flesh crunchiness 0.828 0.423 0.50 0.82
Flesh juiciness 0.736 0.455 0.45 0.64
Whole berry denture test
Berry firmness 9 0.939 0.258 0.96 1.67
Berry crunchiness 0.957 0.220 1.14 2.07
Flesh firmness 0.891 0.306 0.73 1.20
Flesh crunchiness 0.856 0.328 0.64 1.05
Flesh juiciness 0.908 0.259 0.79 1.13
n = 21. IQ, interquartile amplitude; PLS, partial least squares; Rc, regression coefficient of calibration; RPD, residual predictive deviation(SD/SECV); RPIQ, residual predictive interquartile amplitude (IQ/SECV); SD, standard deviation; SECV, standard error of cross-validation.
Giacosa et al. Tablegrape crunchiness by instrumental properties 223
© 2015 Australian Society of Viticulture and Oenology Inc.
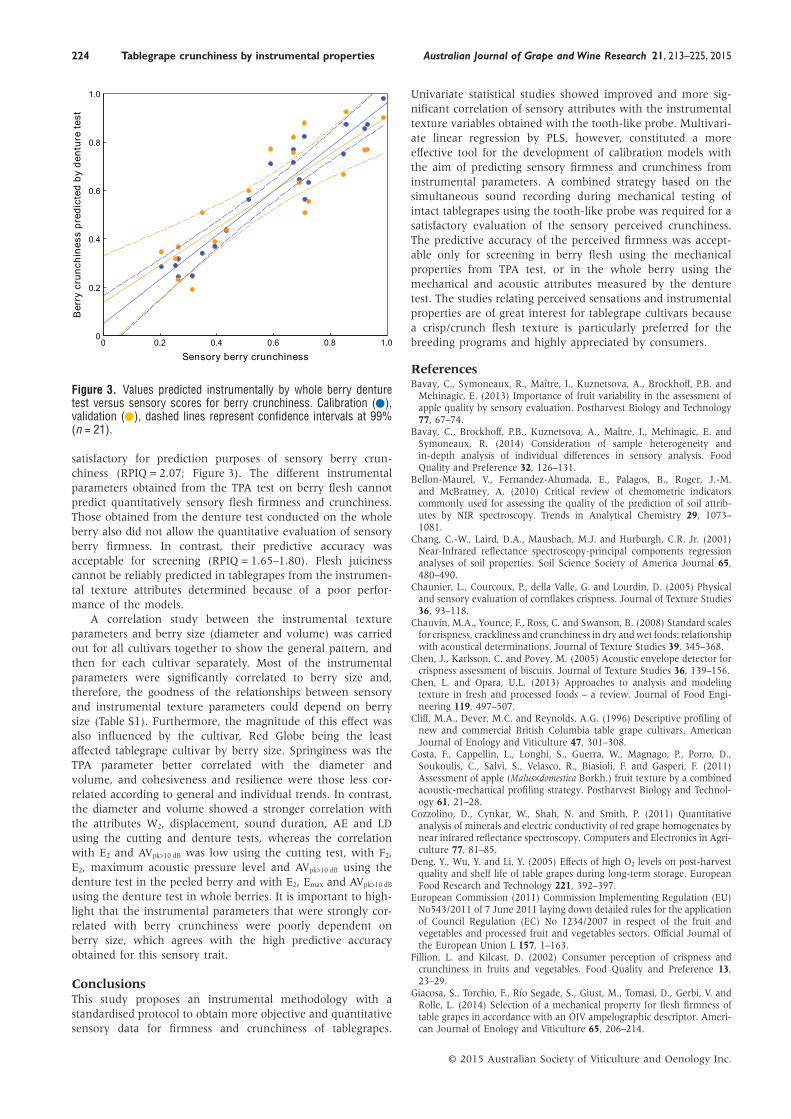
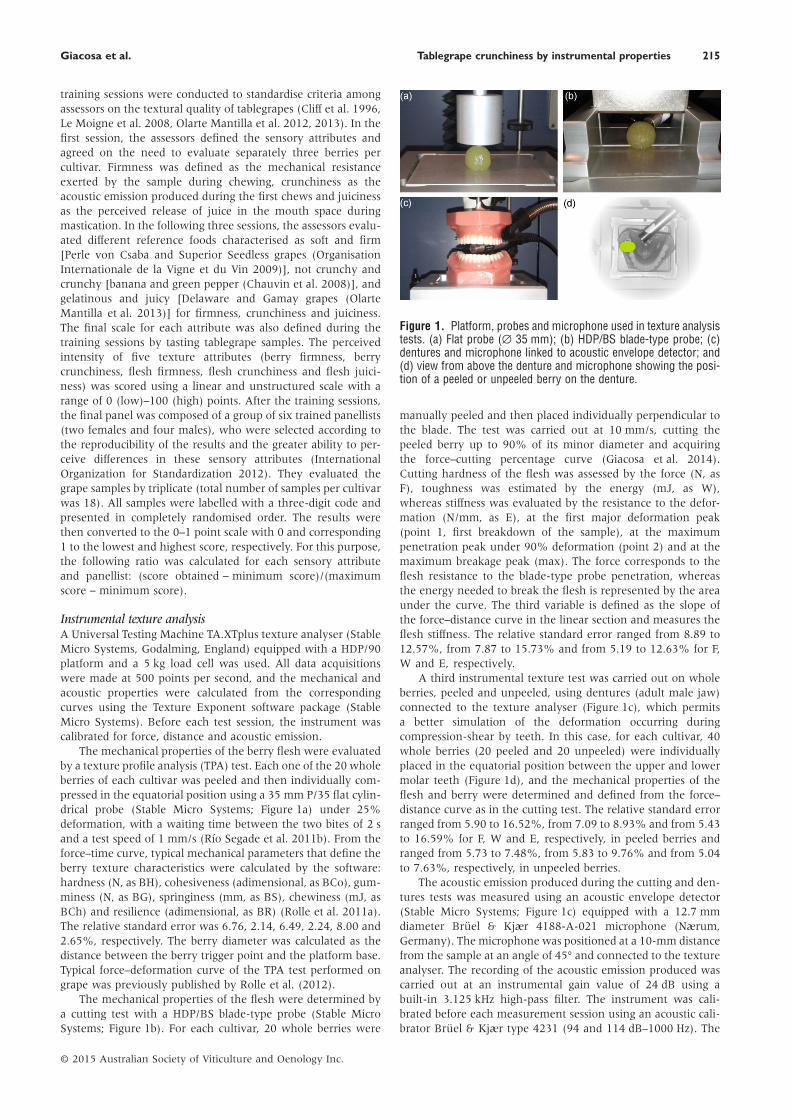
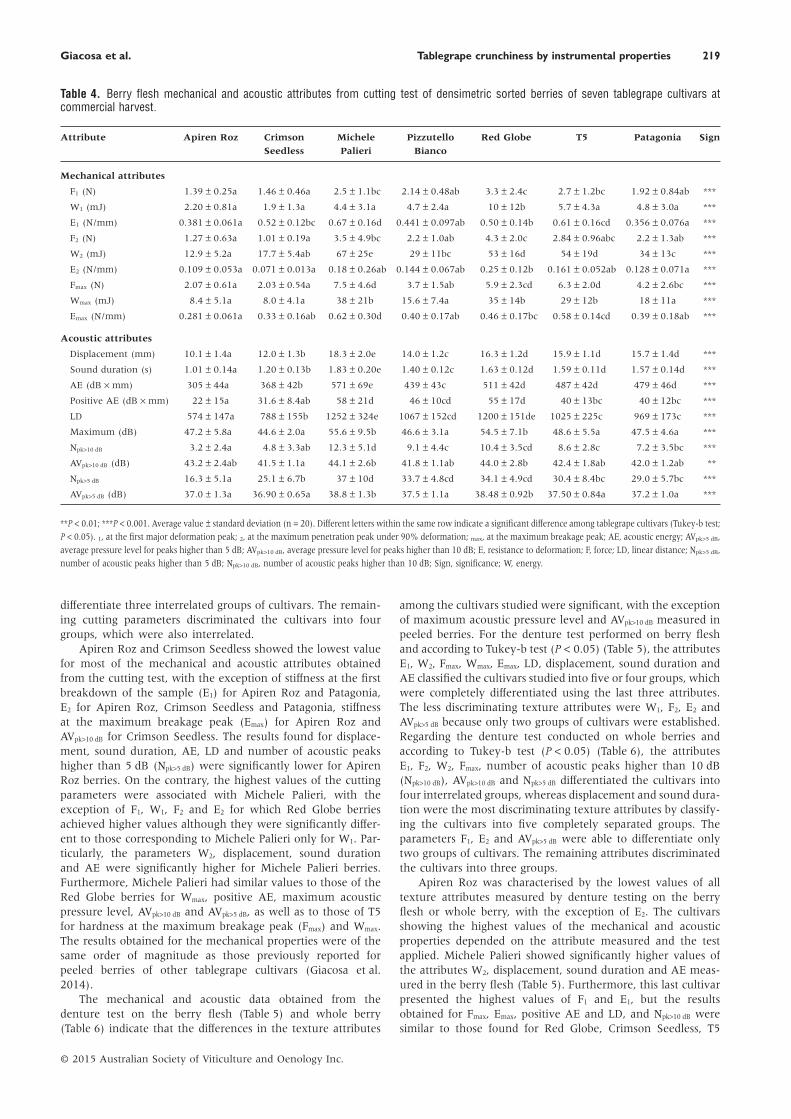
satisfactory for prediction purposes of sensory berry crun-chiness (RPIQ = 2.07; Figure 3). The different instrumentalparameters obtained from the TPA test on berry flesh cannotpredict quantitatively sensory flesh firmness and crunchiness.Those obtained from the denture test conducted on the wholeberry also did not allow the quantitative evaluation of sensoryberry firmness. In contrast, their predictive accuracy wasacceptable for screening (RPIQ = 1.65–1.80). Flesh juicinesscannot be reliably predicted in tablegrapes from the instrumen-tal texture attributes determined because of a poor perfor-mance of the models.
A correlation study between the instrumental textureparameters and berry size (diameter and volume) was carriedout for all cultivars together to show the general pattern, andthen for each cultivar separately. Most of the instrumentalparameters were significantly correlated to berry size and,therefore, the goodness of the relationships between sensoryand instrumental texture parameters could depend on berrysize (Table S1). Furthermore, the magnitude of this effect wasalso influenced by the cultivar, Red Globe being the leastaffected tablegrape cultivar by berry size. Springiness was theTPA parameter better correlated with the diameter andvolume, and cohesiveness and resilience were those less cor-related according to general and individual trends. In contrast,the diameter and volume showed a stronger correlation withthe attributes W2, displacement, sound duration, AE and LDusing the cutting and denture tests, whereas the correlationwith E2 and AVpk>10 dB was low using the cutting test, with F2,E2, maximum acoustic pressure level and AVpk>10 dB using thedenture test in the peeled berry and with E2, Emax and AVpk>10 dB
using the denture test in whole berries. It is important to high-light that the instrumental parameters that were strongly cor-related with berry crunchiness were poorly dependent onberry size, which agrees with the high predictive accuracyobtained for this sensory trait.
ConclusionsThis study proposes an instrumental methodology with astandardised protocol to obtain more objective and quantitativesensory data for firmness and crunchiness of tablegrapes.
Univariate statistical studies showed improved and more sig-nificant correlation of sensory attributes with the instrumentaltexture variables obtained with the tooth-like probe. Multivari-ate linear regression by PLS, however, constituted a moreeffective tool for the development of calibration models withthe aim of predicting sensory firmness and crunchiness frominstrumental parameters. A combined strategy based on thesimultaneous sound recording during mechanical testing ofintact tablegrapes using the tooth-like probe was required for asatisfactory evaluation of the sensory perceived crunchiness.The predictive accuracy of the perceived firmness was accept-able only for screening in berry flesh using the mechanicalproperties from TPA test, or in the whole berry using themechanical and acoustic attributes measured by the denturetest. The studies relating perceived sensations and instrumentalproperties are of great interest for tablegrape cultivars becausea crisp/crunch flesh texture is particularly preferred for thebreeding programs and highly appreciated by consumers.
ReferencesBavay, C., Symoneaux, R., Maître, I., Kuznetsova, A., Brockhoff, P.B. and
Mehinagic, E. (2013) Importance of fruit variability in the assessment ofapple quality by sensory evaluation. Postharvest Biology and Technology77, 67–74.
Bavay, C., Brockhoff, P.B., Kuznetsova, A., Maître, I., Mehinagic, E. andSymoneaux, R. (2014) Consideration of sample heterogeneity andin-depth analysis of individual differences in sensory analysis. FoodQuality and Preference 32, 126–131.
Bellon-Maurel, V., Fernandez-Ahumada, E., Palagos, B., Roger, J.-M.and McBratney, A. (2010) Critical review of chemometric indicatorscommonly used for assessing the quality of the prediction of soil attrib-utes by NIR spectroscopy. Trends in Analytical Chemistry 29, 1073–1081.
Chang, C.-W., Laird, D.A., Mausbach, M.J. and Hurburgh, C.R. Jr. (2001)Near-Infrared reflectance spectroscopy-principal components regressionanalyses of soil properties. Soil Science Society of America Journal 65,480–490.
Chaunier, L., Courcoux, P., della Valle, G. and Lourdin, D. (2005) Physicaland sensory evaluation of cornflakes crispness. Journal of Texture Studies36, 93–118.
Chauvin, M.A., Younce, F., Ross, C. and Swanson, B. (2008) Standard scalesfor crispness, crackliness and crunchiness in dry and wet foods: relationshipwith acoustical determinations. Journal of Texture Studies 39, 345–368.
Chen, J., Karlsson, C. and Povey, M. (2005) Acoustic envelope detector forcrispness assessment of biscuits. Journal of Texture Studies 36, 139–156.
Chen, L. and Opara, U.L. (2013) Approaches to analysis and modelingtexture in fresh and processed foods – a review. Journal of Food Engi-neering 119, 497–507.
Cliff, M.A., Dever, M.C. and Reynolds, A.G. (1996) Descriptive profiling ofnew and commercial British Columbia table grape cultivars. AmericanJournal of Enology and Viticulture 47, 301–308.
Costa, F., Cappellin, L., Longhi, S., Guerra, W., Magnago, P., Porro, D.,Soukoulis, C., Salvi, S., Velasco, R., Biasioli, F. and Gasperi, F. (2011)Assessment of apple (Malus×domestica Borkh.) fruit texture by a combinedacoustic-mechanical profiling strategy. Postharvest Biology and Technol-ogy 61, 21–28.
Cozzolino, D., Cynkar, W., Shah, N. and Smith, P. (2011) Quantitativeanalysis of minerals and electric conductivity of red grape homogenates bynear infrared reflectance spectroscopy. Computers and Electronics in Agri-culture 77, 81–85.
Deng, Y., Wu, Y. and Li, Y. (2005) Effects of high O2 levels on post-harvestquality and shelf life of table grapes during long-term storage. EuropeanFood Research and Technology 221, 392–397.
European Commission (2011) Commission Implementing Regulation (EU)No543/2011 of 7 June 2011 laying down detailed rules for the applicationof Council Regulation (EC) No 1234/2007 in respect of the fruit andvegetables and processed fruit and vegetables sectors. Official Journal ofthe European Union L 157, 1–163.
Fillion, L. and Kilcast, D. (2002) Consumer perception of crispness andcrunchiness in fruits and vegetables. Food Quality and Preference 13,23–29.
Giacosa, S., Torchio, F., Río Segade, S., Giust, M., Tomasi, D., Gerbi, V. andRolle, L. (2014) Selection of a mechanical property for flesh firmness oftable grapes in accordance with an OIV ampelographic descriptor. Ameri-can Journal of Enology and Viticulture 65, 206–214.
1.0
0.8
0.6
0.4
0.2
00.8 1.00.4 0.60 0.2
Sensory berry crunchiness
Ber
ry c
runc
hine
ss p
redi
cted
by
dent
ure
test
Figure 3. Values predicted instrumentally by whole berry denturetest versus sensory scores for berry crunchiness. Calibration ( ),validation ( ), dashed lines represent confidence intervals at 99%(n = 21).
224 Tablegrape crunchiness by instrumental properties Australian Journal of Grape and Wine Research 21, 213–225, 2015
© 2015 Australian Society of Viticulture and Oenology Inc.
Giordano, M., Rolle, L., Zeppa, G. and Gerbi, V. (2009) Chemical and volatilecomposition of three Italian sweet white Passito wines. Journal Interna-tional des Sciences de la Vigne et du Vin 43, 159–170.
Ha, S.Y., Hwang, Y.S., Yang, Y.J. and Park, Y.M. (2007) Correlation betweeninstrumental quality attributes and consumers’ sensory evaluation inrefrigerated-stored ‘Campbell early’ and ‘Kyoho’ grape. Korean Journal ofHorticultural Science & Technology 25, 125–132.
International Organization for Standardization (2007) ISO:8589. Sensoryanalysis – general guidance for the design of test rooms (InternationalOrganization for Standardization: Geneva, Switzerland).
International Organization for Standardization (2012) ISO:8586. Sensoryanalysis – general guidelines for the selection, training and monitoring ofselected assessors and expert sensory assessors (International Organizationfor Standardization: Geneva, Switzerland).
Iwatani, S.-I., Yakushiji, H., Mitani, N. and Sakurai, N. (2011) Evaluation ofgrape flesh texture by an acoustic vibration method. Postharvest Biologyand Technology 62, 305–309.
Jayasena, V. and Cameron, I. (2008) °Brix/acid ratio as a predictor ofconsumer acceptability of Crimson Seedless table grapes. Journal of FoodQuality 31, 736–750.
Jayasena, V. and Cameron, I. (2009) The effect of ethephon and clone onphysical characteristics and sensory quality of Crimson Seedless tablegrapes after 1 month storage. International Journal of Food Science andTechnology 44, 409–414.
Kim, E.H.-J., Corrigan, V.K., Wilson, A.J., Waters, I.R., Hedderley, D.I. andMorgenstern, M.P. (2012) Fundamental fracture properties associatedwith sensory hardness of brittle solid foods. Journal of Texture Studies 43,49–62.
Konopacka, D. and Plocharski, W.J. (2004) Effect of storage conditions onthe relationship between apple firmness and texture acceptability. Post-harvest Biology and Technology 32, 205–211.
Le Moigne, M., Maury, C., Bertrand, D. and Jourjon, F. (2008) Sensory andinstrumental characterisation of Cabernet Franc grapes according to rip-ening stages and growing location. Food Quality and Preference 19, 220–231.
Olarte Mantilla, S.M., Collins, C., Iland, P.G., Johnson, T.E. and Bastian,S.E.P. (2012) Review: Berry Sensory Assessment: concepts and practicesfor assessing winegrapes’ sensory attributes. Australian Journal of Grapeand Wine Research 18, 245–255.
Olarte Mantilla, S.M., Collins, C., Iland, P.G., Kidman, C.M., Jordans, C. andBastian, S.E.P. (2013) Comparison of sensory attributes of fresh and frozenwine grape berries using Berry Sensory Assessment. Australian Journal ofGrape and Wine Research 19, 349–357.
Organisation Internationale de la Vigne et du Vin (2008a) Resolution VITI1/2008. OIV standard on minimum maturity requirements for tablegrapes (Organisation Internationale de la Vigne et du Vin: Paris, France).
Organisation Internationale de la Vigne et du Vin (2008b) Recueil interna-tional des méthodes d’analyse des vins et des moûts (OrganisationInternationale de la Vigne et du Vin: Paris, France).
Organisation Internationale de la Vigne et du Vin (2009) OIV descriptor listfor grape varieties and Vitis species, 2nd edn (Organisation Internationalede la Vigne et du Vin: Paris, France).
Péneau, S., Hoehn, E., Roth, H.-R., Escher, F. and Nuessli, J. (2006) Impor-tance and consumer perception of freshness of apples. Food Quality andPreference 17, 9–19.
Río Segade, S., Giacosa, S., Gerbi, V. and Rolle, L. (2011a) Berry skinthickness as main texture parameter to predict anthocyanin extractabilityin winegrapes. LWT – Food Science and Technology 44, 392–398.
Río Segade, S., Orriols, I., Giacosa, S. and Rolle, L. (2011b) Instrumentaltexture analysis parameters as winegrapes varietal markers and ripenesspredictors. International Journal of Food Properties 14, 1318–1329.
Río Segade, S., Giacosa, S., de Palma, L., Novello, V., Torchio, F., Gerbi, V.and Rolle, L. (2013a) Effect of the cluster heterogeneity on mechanicalproperties, chromatic indices and chemical composition of Italia tablegrape berries (Vitis vinifera L.) sorted by flotation. International Journal ofFood Science and Technology 48, 103–113.
Río Segade, S., Giacosa, S., Torchio, F., de Palma, L., Novello, V., Gerbi, V.and Rolle, L. (2013b) Impact of different advanced ripening stages onberry texture properties of ‘Red Globe’ and ‘Crimson Seedless’ table grapecultivars (Vitis vinifera L. Scientia Horticulturae 160, 313–319.
Rolle, L., Giacosa, S., Gerbi, V. and Novello, V. (2011a) Comparative study oftexture properties, color characteristics, and chemical composition of tenwhite table-grape varieties. American Journal of Enology and Viticulture62, 49–56.
Rolle, L., Río Segade, S., Torchio, F., Giacosa, S., Cagnasso, E., Marengo, F.and Gerbi, V. (2011b) Influence of grape density and harvest date onchanges in phenolic composition, phenol extractability indices, and instru-mental texture properties during ripening. Journal of Agricultural andFood Chemistry 59, 8796–8805.
Rolle, L., Siret, R., Río Segade, S., Maury, C., Gerbi, V. and Jourjon, F. (2012)Instrumental texture analysis parameters as markers of table-grape andwinegrape quality: a review. American Journal of Enology and Viticulture63, 11–28.
Rolle, L., Giacosa, S., Gerbi, V., Bertolino, M. and Novello, V. (2013) Varietalcomparison of the chemical, physical, and mechanical properties of fivecolored table grapes. International Journal of Food Properties 16, 598–612.
Saeleaw, M. and Schleining, G. (2011) A review: crispness in dry foods andquality measurements based on acoustic-mechanical destructive tech-niques. Journal of Food Engineering 105, 387–399.
Saklar, S., Ungan, S. and Katnas, S. (1999) Instrumental crispness andcrunchiness of roasted hazelnuts and correlations with sensory assess-ment. Journal of Food Science 64, 1015–1019.
Salvador, A., Varela, P., Sanz, T. and Fiszman, S.M. (2009) Understandingpotato chips crispy texture by simultaneous fracture and acoustic meas-urements, and sensory analysis. LWT – Food Science and Technology 42,763–767.
Sato, A. and Yamada, M. (2003) Berry texture of table, wine, and dual-purpose grape cultivars quantified. Hortscience: A Publication of theAmerican Society for Horticultural Science 38, 578–581.
Sato, A., Yamane, H., Hirakawa, N., Otobe, K. and Yamada, M. (1997)Varietal differences in the texture of grape berries measured by penetra-tion tests. Vitis 36, 7–10.
Sato, A., Yamada, M., Iwanami, H. and Hirakawa, N. (2000) Optimal spatialand temporal measurement repetition for reducing environmental varia-tion of berry traits in grape breeding. Scientia Horticulturae 85, 75–83.
Sato, A., Yamada, M., Iwanami, H. and Mitani, N. (2004) Quantitative andinstrumental measurements of grape flesh texture as affected by gibberel-lic acid application. Journal of the Japanese Society for HorticulturalScience 73, 7–11.
Sato, A., Yamada, M. and Iwanami, H. (2006) Estimation of the propor-tion of offspring having genetically crispy flesh in grape breeding.Journal of the American Society for Horticultural Science 131, 46–52.
Taniwaki, M., Hanada, T., Tohro, M. and Sakurai, N. (2009) Non-destructivedetermination of the optimum eating ripeness of pears and their texturemeasurements using acoustical vibration techniques. Postharvest Biologyand Technology 51, 305–310.
Torchio, F., Giacosa, S., Río Segade, S., Mattivi, F., Gerbi, V. and Rolle, L.(2012) Optimization of a method based on the simultaneous measure-ment of acoustic and mechanical properties of winegrape seeds for thedetermination of the ripening stage. Journal of Agricultural and FoodChemistry 60, 9006–9016.
Varela, P., Chen, J., Fiszman, S. and Povey, M.J.W. (2006) Crispness assess-ment of roasted almonds by an integrated approach to texture description:texture, acoustics, sensory and structure. Journal of Chemometrics 20,311–320.
Varela, P., Salvador, A. and Fiszman, S. (2009) On the assessment of fracturein brittle foods II. Biting or chewing? Food Research International 42,1468–1474.
Vargas, A., Pérez, J., Zoffoli, J.P. and Pérez, A. (2001) Comparación devariables de textura en la medición de firmeza de bayas de uva Thompsonseedless. Ciencia e Investigación Agraria 28, 37–42.
Zdunek, A., Cybulska, J., Konopacka, D. and Rutkowski, K. (2010a) Newcontact acoustic emission detector for texture evaluation of apples.Journal of Food Engineering 99, 83–91.
Zdunek, A., Konopacka, D. and Jesionkowska, K. (2010b) Crispness andcrunchiness judgment of apples based on contact acoustic emission.Journal of Texture Studies 41, 75–91.
Zdunek, A., Cybulska, J., Konopacka, D. and Rutkowski, K. (2011) Evalua-tion of apple texture with contact acoustic emission detector: a study onperformance of calibration models. Journal of Food Engineering 106,80–87.
Manuscript received: 16 April 2014
Revised manuscript received: 3 July 2014
Accepted: 15 September 2014
Supporting informationAdditional Supporting Information may be found in the onlineversion of this article at the publisher’s web-site: http://onlinelibrary.wiley.com/doi/10.1111/ajgw.12126/abstract
Table S1. Significant Pearson’s correlation coefficients betweeninstrumental texture attributes and berry size for seven tablegrape cultivars.
Giacosa et al. Tablegrape crunchiness by instrumental properties 225
© 2015 Australian Society of Viticulture and Oenology Inc.