Embed Size (px)
Citation preview
Food Structure Food Structure
Volume 9 Number 1 Article 4
1990
Microstructure and Firmness of Processed Cheese Manufactured Microstructure and Firmness of Processed Cheese Manufactured
from Cheddar Cheese and Skim Milk Powder Cheese Base from Cheddar Cheese and Skim Milk Powder Cheese Base
A. Y. Tamime
M. Kalab
G. Davies
M. F. Younis
Follow this and additional works at: https://digitalcommons.usu.edu/foodmicrostructure
Part of the Food Science Commons
Recommended Citation Recommended Citation Tamime, A. Y.; Kalab, M.; Davies, G.; and Younis, M. F. (1990) "Microstructure and Firmness of Processed Cheese Manufactured from Cheddar Cheese and Skim Milk Powder Cheese Base," Food Structure: Vol. 9 : No. 1 , Article 4. Available at: https://digitalcommons.usu.edu/foodmicrostructure/vol9/iss1/4
This Article is brought to you for free and open access by the Western Dairy Center at DigitalCommons@USU. It has been accepted for inclusion in Food Structure by an authorized administrator of DigitalCommons@USU. For more information, please contact [email protected].
FOOD STRUCTURE, Vol. 9 (1990), pp. 23-37 Scanning Microscopy International, Chicago (AMF O'Hare), IL 60666 USA
1046 - 705X /90$3 .00+ . 00
MICROSTRUCTIJRE AND FIRMNESS OF PROCESSED CHEESE MANUFACfURED FROM CHEDDAR CHEESE AND SKJM MILK POWDER
CHEESE BASE
A.Y. Tamime-, M. Kalrib••, G. Davies•, and M.F. Younis•••
• The West of Scotland College, Food Technology Department, Auchincruive, Ayr KA6 5HW Scotland, U.K.
• • Food Research Centre, Research Branch, Agriculture Canada, Ottawa, Ontario, Canada KJA OC6. ••• University of Zagazig, Facu lty of Agriculture, Department of Food Science, Moshtohor, Egypt.
Processed cheese (10 different types) was made from Cheddar cheese and a cheese base produced from reconstituted skim milk powder by blending and melting with
commercial emulsifying salts at 9Q<>C. In one experiment, the cheese base was subjected 10 accelerated cheese ripening by added enzyme. The finished products had 50.1-53.5% total solids, 18.2-19.3% protein, 47.4-49.7% fat in dry matter, and 2.7-3.0% salt in water; pH was 5.3-5.4 afler three months of storage at 10o and 3ooc.
The experimenta l cheeses were markedly firmer than the control cheeses. All processed cheeses exhibited a similar pattern of firmness whereby the samples stored at
lOOC were firmer than the fresh cheeses and the cheeses
stored at 300C were firmest. Only blends containing a large proportion of a cheese base treated with added enzyme were crumbly and were not sa tisfactory.
Electron microscopy revealed differences in the struc~ tures of the raw materials and the processed cheeses. The cheese base, to which a protease was added. had an open structu re compared to a compact structure of the untreated cheese base. The microstructures of all the finished processed cheeses stored at IOOC: were similar to each o ther.
Storage of these cheeses for 3 months at 30°C resulted in the developme nt of irregul arly shaped fat particles, but differences in their dimensions were statistically not significant.
Initial paper received Octob~r 30, 1989 Manuscrip t received March 27, 1990 Direct inquiries t o A . Y. Tamime Telephone number: 44 -292-520 331
Key Wordt;· Accelerated cheese ripening, . .t\nhydrous milk fat, Cheddar cheese, Cheese base, Electron microscopy, Emulsifying salts, Microstructure; Processed cheese, Protein matrix, Skim milk powder.
23
Introduction
Different types of processed cheese have been manufactured successfully on a large scale in Europe and the United States of America since the beginning of this century. Meyer (1973) has provided an excellent historical background of the development of processed cheese, and recently various aspects of the manufac ture of processed cheese have been reviewed by many authors (Kosikowski, 1977; Thomas, 1977, Carie eta/., 1985; Carie a nd Kalab, 1987). In brief, the product is primarily made by ble nding natural cheeses (young, mature, or different types) in the presence of water, colouring matter, emulsifying sal ts and other dairy ingredients, and then heating and agitating to produce a homogenous mixture.
Such products have gained consumer acceptability over the years. They may be classified imo three different types which are referred 10 as block variety, slices, and cheese spread. Jn certain countries, e.g., the United States of America and Canada, the reliance on natural Cheddar cheese for the production of processed cheese (Le., block and slices) is apparent. Prolonged storage of Cheddar cheese is required 10 achieve the nmturation process and this could be a disadvantage to the processed cheese manufacturer because of high costs.
Recently, Ernstrom et a/. (19HO) have achieved the production of cheese base from whole milk which could be used in a processed blend. For example, a blend of 80%
cheese base and 20% matured Cheddar cheese was suitable for the manufacture of processed cheese. A similar method for the production of cheese ba'e in Europe and the United States was reported by Madsen and Bjerre ( 1981} and
Rubin and Bjerre (1983a, 1983b) "ho recommended the use of similar proportions of cheese base and Cheddar cheese as those reported by Ernstrom et a/. ( 1980) or lower, i.e., 50:50 ratio. Other patent applications for the production of cheese have been reported by Jameson and Sutherland (1986) and Moran era/. (1989).
A. Y. Tamime, M. Kalab, G. Davies, M. F. Younis
The method of cheese base production could be briefly de~cribed a.\ follows: (a) standardisation of the fat con tent in milk, (b) ultrafiltration (UF) of the milk to concentrate the protein. (c) diafiltration of the retentate to reduce the lacto e content, (d) acidification or the concentrate (i.e., addition of starter cultu re) to lower the level of calcium content in the casein micelles, and (e) vacuum evaporation to remove the excess moisture. The composition of the resulting product is similar to Cheddar cheese.
In Egypt. large volumes of processed cheese are imported every year. In 1984, the total cheese imports were 42,000 tonne~. of which 10,500 tonnes was processed cheese (IDF, 19H6). In economic terms, the imported cheese was valued at 82 million US $. In order to reduce cheese import~. a collaborative programme of work was estab· lished tWO years ago between the West or Scotland College and University of Zagazig in Egypt for the development of cheese base production from reconsti tuted skim milk powder for Jocul manufacture of proces~ed cheese.
The purpose of this research work was to examine the effect of 2 cheese base~ (one without and the other with added proteolytic enzyme to induce proteoly;i') produced from reconstituted sk1m milk powder on the microstructure and firmness of block type processed cheese.
Materials and Methods
Mate ria ls White Cheddar cheese (young, S months old, and ma
ture. II months old) and medium heat skim milk powder (whey protein index - 4.S mg N/g powder) were obtained [rom Scollish Pride Quality Dairy Foods Ltd., Galloway Creamery, Stranraer, Scotland.
Anhydrou< milk fa t (AMF) (Aberdeen and District Milk Marketing Board, Bucksburn, Aberdeen, Scotland) was added to all processed cheese blends except the control (Table I) in order to maintain a constant fat content in the cheese: this ingredie nt was added to the melting cooker with the other additives.
Pure vacuum-dried sodium chloride (JCI Chlor-Chemicals, Cheshire, UK) was used in the manufacture of the cheese ba~c and in the processed cheese formulation s. Production of cheese base
Chee~e base was produced as reported by Younis (1989) and Tamime e/ a/. (1990). In brief, this process may
be de;cribed as follows: Skim milk powder was reconstituted at 20% total solids
using water at SOOC (total weight 1200 kg) followed by oltrafiltration (U F) (APV Baker Ltd., Preston, UK) to a 2-
fold concentration at SQ<>C by removing 600 L of permeate. Water, equal to the volume of permeate removed, was added to the retentate and diafiltration of the milk was
24
carried out to a 2-fold concentration at 500C b1 ·emoving 600 L of permeate. The retentate was pasteuris!C at 720C for IS s using a plate heat e.<ehanger (APV Ba.<er Ltd.,
Crawley. U K), cooled in it to < IQ<>C, and s10rel overnight in a refrigerator.
On the following day, the rete ntate was varmed to
320C and ripened with a multiple strain mesoplihc cheese starter culture (Streptococcus /actis sub·!ip. facis and Str. fact is sub-sp. cremoris code MAO II C from Eunzyme Ltd., Lundon, UK), which was added at 2 g/10 kg ret< mate until the pH reached 5.8 ± 0.1. The fermented retent ;:te was coagula ted in an ALCURD machi ne MK Ill •Alfa-Laval Eng., Ltd., Middlesex, UK) [or 10-12 min usitg standard calf rennet (Chr. Hanse n's Lab. Ltd., Reading, J K) added at 2.5 mL/ 10 kg retentate. The curd wa~ deli\Cred to an open rop cheese vat, mixed gently with stai nless steel forks
ontil pH of the whey dropped to S.6 :t 0.1, and th! curd and
whey were heated indirectly to 390C in 15 min. Cheese Ba'e I. After draining the whey (1.b., a very
small volume was removed a~ compared with ne conventional cheesemak.ing process), the curd was ~aled at 2.5% (w/w), mixed for IS min, hooped into a 20 kg ·ectangular Cheddar cheese mould, pre-pressed for I h at an air line pressure of 0.27 MPa, (the pressure was acting 111 a 20 em di ameter cylinder) and pressed overnight at 0.9 MPa. On the following day, the pressed curd was divided into 4.S - 5 kg blocks, placed in BB-1 bags (W.R. Grace Ltl., Lundon, UK), vacuumed, hea t-sealed, and shrunk in hn water at
Table 1. Formulations (%) of major ingredients
in processed cheese blends
Processed Cheese Control Exptl.
Cheddar Cheese Base AMF Added M* y~o I 11 Water
19.7 59.2 18.1 42.2 14.1 26.5 14.3
-··-----··------··-----··· ···---···--····---·---····----·· ·····----·--··--··-Blend A 20.5 41 .8 19.9 14.8
B 20 .0 40.0 13.6 6.4 17.1
c 59.7 13.6 6 .3 17.5
D 13.2 ~~.4 4 . ~ 2.1 17.9
A, 20.5 41 .6 19.6 15.3
B, 20.0 39.9 13.6 6.4 17.2
c, 59.7 13.6 6 .3 17.5
o, 13.2 59.3 4.5 2.1 18.0
" M: mature: Y: young; Cheese Base 1· with no addd enzyme; Cheese Base II : with added Savorase-A; AMF anh\".trous milk fat. Sodium chloride, Nisin and emulsifying salts wen added to each blend at 0.44%, 0.0 1%, and 2.50%, respectively.
Processed Cheese Made from Skim Milk Powder Cheese Base
R50C. The cheese b:.t!!e w;.ts stored a1 IOOC until required for
processing. Cheese Ba~e JJ The drained curd was salted with
1.13% (w/ w) of salt and mixed with a dried enzyme preparation from Str. /actis sub-sp. lactis (Savorase-A, marketed
by Imperia l Biotechnology Ltd., London, UK) at a rate of 1.65% (w/ w) (the enzyme preparation was a cell-free extract and contained 50% w/w sodium chloride), and mixed for 15 min. The salted curd was handled afterwards as described above for cheese base I. According to the supplier, the Savorase-A act ivity was expressed as 5.3 flavour amino peptidase (FLAP) units/g. Production of Processed Cheese
Ten different formulations of processed cheese (Ta~le 1) were manufactured as follows: The cheese ingredients were cut into small cubes by hand and blended in a Stephan cooker, type MM SK40E (A. Stephan u. SOhne, Gmhll & Co., Hamelin, West Germa1y) for I min at 750 rpm. Different amount!<! of AMF, sodium chloride, and water were added to each blend including 1.4 g Nisin (Alpin and Barrett Ltd., Wiltshire, UK) which was used as a preservative, and the mixture was blended fo r 1 min at 750 rpm. Joha SE. C, and T (Fibrisol Services Ltd. , London, UK) commercia! emulsifying salts were used at a ratio of 1.25: 1.0: 0.75 at the total level of 3% (w/w). They were blended with the other ingredients for 1 min at 1500 rpm. Direct steam injection was used to heat and melt the cheese ingredients and blending cont inued at 1500 rpm until the temperature
reached R5-90°C. Vacuum was applied for I min to remove air bubble~ and stirring was continued for 2 min. The melted cheese was hot-filled in canons Lined with commercial pouches (Pukkafilm, DRG Flexible Packaging Ltd. , Bristol,
UK), sealed, and cooled in a refrigerator for 3 days at SOC:
the chee~e ~amples were then stored for 6 momhs at 100 and 30 . The m;u,s of each batch was 13.6 kg.
The pouches (185 x 380 mm) had the moisture vapour
transmission rate of 0.8- 1.0 gfm2/24 h at 25°C and 75% relative humidity and the oxygen permeability rate of 20
cm3jm2/24 hat zooc and 0% relative humidity. Chemica l Analysis
Total so lids, fat , sa lt, phosphorus (total), and pl-1 were de1ermined according to British Standards Institution methods (BSI, 1969 and 1976). Calcium and soluble nitrogen were determined by the methods described by Pearce (1977) and Kosikowski (1977, p. 572), respectively.
Casein hydrolysis was determined using polyacrylamide gel electrophoresis according to the method reported by Ridha et al. (1984). Firmness Analvsis
A Stevens LFRA Texture Analyser (C. Stevens & Son
Ltd., Hertford;hire, UK) eqLipped with a type TA26/ TFE-
25
105-524 Y probe was used w ru,se~s firmne~s of the processed cheese. The U-shaped probe. with a wire connection, 0.33 mm in diameter, penetrated the samples into a depth of IS mm at a rate of 0.5 mrr / s. The chart recorder was operated at 500 mV and 30 mm/ min chart speed. The results were expressed in newtons (N).
The firmness measurements were carried out on pro
cessed cheese samples that had been tempered at ?OC for 3 days and cut into blocks of 50 x 20 x 20 mm. Microscopic Analysis
Processed cheese was sampled by cutting a slice about 10 mm thick which was then sectioned into columns 10 mm
wide and 25 mrn long. Sample column3 were fixed in a 2.8% aqueous glutaraldehyde solution and mailed to
Ottawa for electron microscopy (Allan- Wojtas, 1984). After arrival, the samples were cut into prisms, I x I x 15 mm, for scanning electron microscopy (SEM) and into cubes, -0.6 mm on a side, for transmission electron micro~copy (TEM), and placed into a fresh glutaraldehyde solution for 2 h.
For SEM, the cheese prisms, fixed with gluwraldehydc, were washed with water and subsequently dehydrated in a graded (20, 40, 60, 80, 96, and 100%) ethanol series. The prism~ impregnated with absolute ethanol were defatted by extrac tion using 3 changes of chloroform, rewrned into ethanol, frozen in Freon 12 cooled to its freezing point with liquid nitrogen, and placed in liquid nitrogen, where they were fraciUred. The fragments were critical point-dried from carbon dioxide, moumell on aluminium SEM stubs. sputter-coated with gold, and examined at 20 kV in an lSI DS-130 scanning electron microscope equipped with an external oscilloscope (Bond and Kalab, 1988). Micrographs were taken on 35 mm film.
For TEM, the 0.6 mm cubes were washed wilh a 0.05 M
veronal-acetate buffer (pH 6.75) and were pmtfixed for 2 h with a 2% o~mium tetroxide solutio1 in the ' arne veronalacetate buffer. Then, the cubes were embedded in Spurr's low-viscosity embedding medium (J. B. EM Service, Inc., Pointe Claire, Dorval, Quebec), and sectioned. The sections (approx 90 nm thick} were stained with uranyl acetate and lead citrate solutions (Reynolds, 1963) and exa mined in a Philips EM-300 transmission eiCctron microscope operated at60 kV. Micrographs were taken on 35 mm film. Digita l Image Analysis.
TEM micrographs of 9 ,am x 10 ,urn areas, taken at a 20,000x magnification, were evaluued using a Kontron !BAS image analyser (Carl Zeiss Canada, I on Mills. Ontario, Canada} for the dis tribution of fat globule section diameters: in the case of irregularly shaped fat particles,
their section areas were measured and the results expressed as the diameters of circles with equivalen! areas.
A. Y. Tamime, M. Kalab, G. Dav1es, M. F. Younis
Results and Discussion
Chemical Comoosition
Ten different blends of processed cheese under study were mttdc from young and mature Cheddar cheese and cheese base I or II , or a combination of both; the formulations are presented in Table I. In blends A and B, the young Cheddar cheese was replaced by cheese base I at different proportions, and in blends C and D, til e mature
Cheddar cheese was replaced by the same type of cheese base. A similar approach was used for blends At to D1
where cheese base II was used to replace young or mature Cheddar cheese.
Studies of processed cheese samples prepared according
to the formulations shown in Table I were carried out in order to: (a) e>tablish the feasibility of using a cheese base made from reconstituted skim milk powder in the manu·
facture of processed cheese, {b) compare the results obtained with the recommendations for various amounts of a whole-milk cheese base in processed cheese by other authors (Ernstrom eta/., 1980; Madsen and Bjerre, 198 1; Rubin and Bjerre, 1983a, 1983b), and (c) establish appropriate proportions of the developed cheese bases I and II so that they cou ld be recommended for the production of block type processed cheese suitable for the Egyptian market.
Samples of each type of processed cheese were analysed
when fresh and then again after 3 months of storage at 10° and 300C. Chemical composition of these cheeses is presented in Table 2 and data in greater detail have been published elsewhere (Younis, 1989). The total solids contents ranged between 50.1 and 53.5o/o and the fat contents in the dry matter ranged between 47.4 and 49.5% and, thus, met the Egyptian specifications for full-fat processed cheese, i.e ., maximum 50% moisture and
minimum 45% fat in dry matter (Egyptian Standards, 1970).
The level of sodium chloride (1.7%) and pH (5.4) were acceptable for block type processed cheese (Meyer. 1973; Kosikowski, 1977; Thomas, 1977). The calcium and phosphorus contents in Cheddar cheese and cheese bases I and II are shown in Table 3. It can be observed that the c;.ilcium
content in the cheese bases was higher than in heddar
cheese and the cheese bases contained approximately half the amount of phosphorus present in Cheddar cheese.
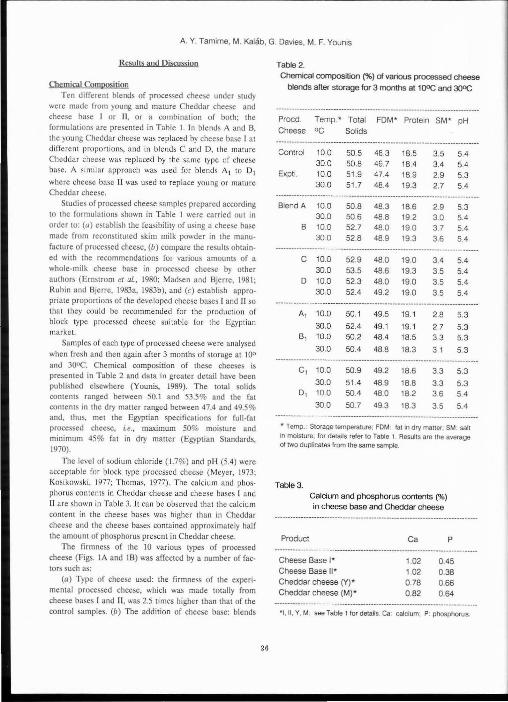
The firmness of the 10 various types of processed cheese (Figs. lA and I B) was affected by a number of factors such as:
(a) Type of cheese used: the firmness of the experimental processed cheese, which was made totally from cheese bases I and II, was 2.5 times higher than that of the control samples. (b) The addition of cheese base: blends
26
Table 2.
Chemical composition (%) of various processed cheese
blends after storage for 3 months at 1 QOC and 300C
Procd. Temp.* Total FDM* Protein SM* pH Cheese oc Solids
---- --------------------------------------------------------------------------Control 10.0 50.5 48.3 18.5 3.5 5.4
30.0 50.8 49.7 18.4 3.4 5.4 Exptl. 10.0 51 .9 47.4 18.9 2.9 5.3
30.0 51 .7 48.4 19.3 2.7 5.4 -------------------------------------------- ----------------------------------Blend A 10.0 50.8 48.3 18.6 2.9 5.3
30.0 50.6 48.8 19.2 3.0 5.4 B 10.0 52.7 48.0 19.0 3.7 5.4
30.0 52.8 48.9 19.3 3.6 5.4 -----------------------------------------------------------------------------
c 10.0 52.9 48.0 19.0 3.4 5.4 30.0 53.5 48.6 19.3 3.5 5.4
D 10.0 52 .3 48.0 19.0 3.5 5.4 30.0 52.4 49.2 19.0 3.5 5.4
------------------------------------------------------------------------------A, 10.0 50.1 49.5 19.1 2.8 5.3
30.0 52.4 49.1 19.1 2.7 5.3 B, 10.0 50.2 48.4 18.5 3.3 5.3
30.0 50.4 48.8 18.3 3.1 5.3 ------------------------------------------------------------------------- -----
c, 10.0 50.9 49.2 18.6 3.3 5.3 30.0 51.4 48.9 18.8 3.3 5.3
o, 10.0 50.4 48.0 18.2 3.6 5.4 30.0 50.7 49.3 18.3 3.5 5.4
----------------------------------------·----------------------------- ----* Temp. · Storage temperature; FDM fat in dry maner. SM. salt in moisture. for details refer to Table 1. Aesulls are the average of two duplicates from the same sample.
Table3.
Calcium and phosphorus contents (%)
in cheese base and Cheddar cheese
Product
Cheese Base I* Cheese Base II* Cheddar cheese M • Cheddar cheese (M)*
Ca
1.02 1.02 0.78 0.82
p
0.45 0.38 0.66 0.64
•t , II , Y. M: see Table 1 for detaRs. Ca calcium: P: phosphorus.
Processed Cheese Made from Skim Milk Powder Cheese Base
A
B Firmness
N
FIRMNESS OF PROCESS CH EESES CONTAINING CHEESE BASE I
FIRMN ESS OF PROCESS CHEESES CONTAINING CHEESE BASE II
Fig. I. Fimtne5S of processed cheeses made with varying amounts of cheese base I (A ) or cheese base II (B) as compared with the control and experimental proce.\~'ied
cheeses. CON: Control; EXP: Experimental; Fr. Fresh; 3M: Storage for 3 months; A, 8, C, D, A /1 B 1, C 1 and D ( Corresponding
processed cheese blends; for dewils refer to Table I.
containing the largest proportion of cheese base I or ll were the firmest but a reduction in firmness was observed as the levels of cheese bases I or II were reduced in blends A-D and At·D 1, respectively. (c) Duration and temperature
of storage: the firmn ess of all the processed cheeses markedly increased during ~wrage and the cheeses became
firmest by storage at JQOC. (d) Change in pH: all the cheeses exhibiled a slight drop in pH from 5.5-5.6 when fresh to 5.3-5.4 after 3 months of storage. This change could be due to the presence of emulsifying salts and may have influenced some imeractions that had increased the firmness of the cheese; it is known that as pH is decreased towards the isoelectric point of casein, the texture of processed cheese may become crumbly (Caricer a/., 1985).
The firmness of the various blends of processed cheese, including the control and experimental samples, found
after 3 months of storage at 100 and 30°C, could be attributed to the interactions between the cheese proteins and the emulsifying salts. According to Carie era/. (1985), emulsifying salts are used in process cheese to remove calcium from the protein system, hydrate. peptise, swell, solubilise, and disperse the proteins, emulsify the fat and
27
stabilise the emulsion, control pH and stabilise it, and contribute to the formation of an appropriate structure of the processed cheese after cooling.
Concerrting the functions of the emulsifying salts listed above, it may be assumed that the differences in firmness of the process cheeses under study were related to a number of factors such as protein-protein interactions and/or reactions of proteins with the SE, C, and T commercial Joha emu lsifying salts. Proteolysis
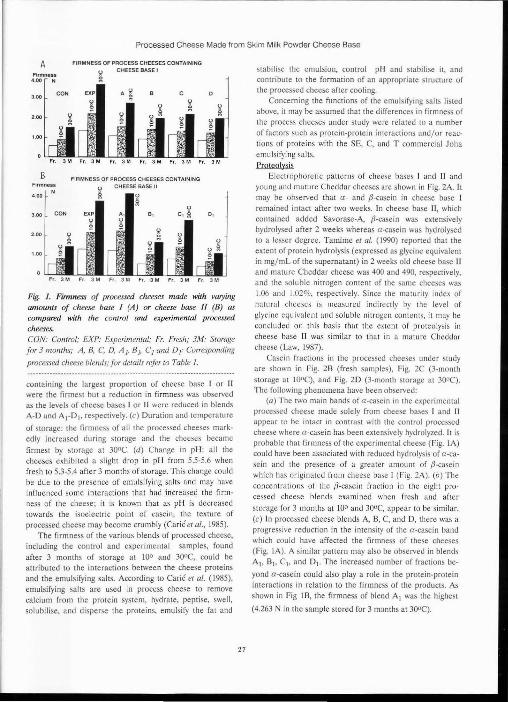
Electrophoretic patterns of cheese bases 1 and 11 and young and mature Cheddar cheeses are shown in Fig. 2A It may be observed that a- and /3-casei n in cheese base I remained intact afte r two weeks. In cheese base II , which contained added Savorase-A, ,8-casein was extensive ly hydrolysed after 2 weeks whereas a-casein was hydrolysed to a lesser degree. Tamime et a/. (1990) reported that the extent of protein hydrolysis (expressed as glycine equivalent in mg/mL of the supernatant) in 2 weeks old cheese base U and mature Cheddar cheese was 400 and 490, respectively, and the soluble nitrogen comem of the same cheeses was 1.06 ami 1.02%, respectively. Since the maturity index of natural cheeses is measured indirectly by the level of glycine equivalent and soluble nitrogen contents, it may be concluded on this basis that the extent of proteolysis in cheese base II was simi lar to that in a mature Cheddar cheese (Law, 1987).
Casein fractions in the processed cheeses under study are shown in Fig. 28 (fresh samples), Fig. 2C (3-month storage at IOOC), and Fig. 20 (3-month storage at 300C). The following phenomena have been observed:
(a) The two main bands of a-casein in the experimental processed cheese made solely from cheese bases I and II appear to be intact in contrast with the control processed cheese where a-casein has been extensively hydrolyzed. It is probable that firmness of the experimental cheese (Fig. !A) could have been associated with reduced hydrolysis of a·ca· sein and the presence of a greater amount of j3-casein which has originated from cheese base I (Fig. 2A). (b) The concentr<~tions of the fi-case in fraction in th e eight processed cheese blends exariDned when fresh and after
storage for 3 months at JQo and 3QoC, appear to be similar.
(c) In processed cheese blends A, 8 , C, and D, there was a progressive reduct ion in the intensitv of the a·casein hand which could have affected the fir~ness of these cheeses (Fig. lA). A similar pattern may also be observed in blends A to Bt, Ct, and D1. The increased number of fractions be·
yond a-casein could also play a role in the protein·protein interactions in relation to the firmness of the products. As
shown in Fig 18, the firmness of blend A 1 was the highest
(4.263 N in the sample stored for 3 months at 300C).
c: ·;; ~ u
" .,_
A. Y. Tamime, M. Kal~b . G. Davies, M. F. Younis
2A
s y M
26
2C
S A 1 B 1 C 0 ICONiEXPI A, 1 B, 1 C, 1 D, 1
28
Fig. 2 Polyacrylamide gel electroplwresir patteTTU of the
cheese brues and Cheddar cheese (A) and proce.rsei cheese
blends analysed when fresh ( 8) wrd after storage for 3 months
at I ()DC (C) and a1 J()OC (D).
S: casein .standard; JV.· week; Y: young Cheddar cheese; M:
mature Cheddar cheese; for letlers A to OJ refer to TaJ/e 1.
It would be difficult tO conclude that the firm1e~s of the processed cheese was attributed only to the degree of casein hydrolysis and the poss ible interactions of the casein fractions. Probably, whey prOle ins also play a role. A yield of protein greater than wou ld be expected fr01r a normal cheese-making process was obtained when a chetse base wa> made from ultrafiltered milk (Ern,trom eta/, 1980). This increased yield has been attributed to the r'!tention of greater amounts of whey proteins in the cheese bL.o;;e. It is assumed that during the melting stage of the chtese in· gredients in the processing kettle at temperan.res above
700C, ,B·Iactoglobulin unfolds due to denaturati<n de Wit, 1985) and readily reacts with K·casein as a resu. t of disul· phide interchange (Walstra and Jenness. 1984) This may explain the consistent difference in finnne"~ berv.een the experimen tal and control proce~sed chee~e!<.. I was also oh~erved that as the amounts of chec~e ha~cs I •J r II in the processed cheese blend were reduced, and, thus, the amount of fJ·lactoglobulin was dccrea~ed, tht products became softer (Fig. I). Effect of Emulsifying SaiLs
Another factor, which may affect firmnes~ o processed cheese, is the type of the emulsifying salt used The exact composition of the SE, C, and T emu lsifying ailS is not known, but according to the supplier in the UK (M. Night· ingale · personal communication). the main c>mponents are !<.odium polyphosphates. Table 4 provides sane specifications of the emulsifying :~alts used. Accordng to the review by Carie eta/. ( 1985), all condensed poly>hosphates hydrolyze partially during cheese melting ::111d the hydrolysis continues in the processed cheese duri ng storage
Table 4.
Some specifications of Joha emulsifying !a~s
ion-Ex· pH P-polym11 (%) Type change Change Creaming P1 P2 P3 P4-P10
SE XXX
C XXX
T X
(+)0.2-0.4 (-)0.4-0.6 (+) 1.0-1 .5
XX 0 0
50 Tr 45 5 95
95 5
0 : nil ; X: slight; XX: medium; XXX: strong; Tr trace. P: phosphate polymer.
Processed Cheese Made lrom Skim M1lk Powder Cheese Base
Firmness of all the processed cheese ~amples under study exhibited a ~imilar pattern. They became firmer after 3 months of storage and the firmness was higher in samples stored at 3()< than in sample~ stored at 1 OOC. It is possible tha t the higher firmness found in samples stored at JOOC may be attributed to a more extensive hydrolysis of the polyphospho.tes at this temperature as compared 10 100 This cou ld lead to a calcium-induced interaction among the proteins and result in a harder product.
Lee eta/. (1979, 1986) concluded that the nunsedimcmable nitrogen (possibly soluble nitrogen) in the supernatant obtained by centrifugation of an aqueous extract of processed cheese was markedly increased when the amount of the emulsifying salts (Joha S4, K, and T ) was increased fro m 0.42 to 3.33%. These results may confirm the effect of emulsifying salts on the peptisation of proteins during the manufacture of processed cheese. The soluble nitrogen content in all the processed cheese blends is shown in Table 5. Using an analytical method different from that used by Lee er at. ( 1979). the followi ng observations were
made: (a) all the processed cheese blends stored at JOOC fo r 3 months contained slightly higher concentrations of soluble nitrogen than the freshly made processed cheeses. and (b) all processed cheese samples stored at JOOC for 3 months had lower solu bl e nitrogen contents. The former finding confirms that a more extensive hydrolys is of con~ densed polyphosphates takes place in processed cheeses
Table 5. Soluble nitrogen content (%) in various types
of processed cheese
Processed
Cheese
Control Experimental
Blend A B
c D
At
B,
c, o,
Fresh
0.538 0.342
0.392 0.498
0.441 0 .539
0.553
0 .576
0.469
0.541
Duration of Storage 3 Months
1QOC 3QOC
0.494 0.269
0.341 0.443
0.414 0.474
0.469
0.480
0.460
0.479
0.576 0.392
0 .398 0.531
0.459 0.550
0.571
0.575
0.478
0 .560
29
during storage, particularly at a higher tcmpcruture. This effect may be considered similar to the effect of an increased amount of emulsifying ~alt in the proccs\ed cheese blend as reported by Lee er at. (1986). Microstructure
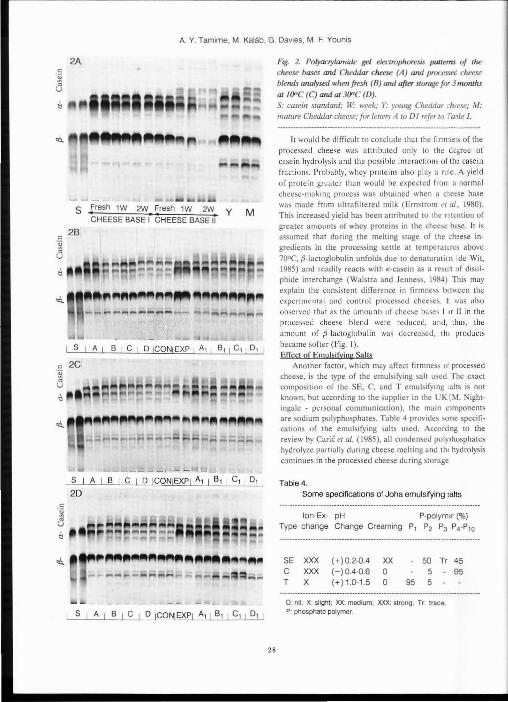
Electron microscopy showed that there were marked differences in the microstructure of the raw m'Herials used to produce the processed cheese samples. Cheddar cheese, which was made from full-fat nonhomogenisecl milk, consisted of a protein matrix in which large fat globu les and their clusters were dispersed (Fig. 3) in agreemen t with the findings of other authors (Green et a/., 1981 ). Because fat was extracted with chloroform from Cheddar cheese samples destined for the SEM examination, void spaces indicate in the micrographs the initial presence of the fat particles and their aggregates in the samples. Residues of the fat globule membranes may usually be see n in the void
Fig. 3. Microstructure of Cheddar cheese.
A: Void spaces in the protein matrix indicate the locations of [m globules (F) and their clusters in young Cheddar cheese. 8 : Mesophilic lactic streptococci (b)i arrows point ro residues of
fat globule membranes which became noticeable after far was extracted from the samples in preparation for SEM.
A. Y. Tamime, M. Kalab, G. Davies, M. F. Younis
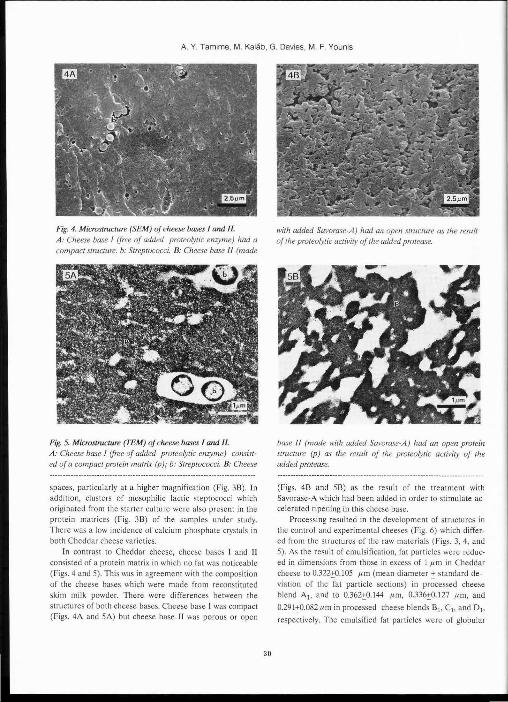
Fig. 4. Microstructure (SEM) of cheese bases I and II.
A: Cheese base I (free of added proteolytic enzyme) had a compact structure. b: Streptococci. 8: Cheese base II (made
Fig. 5. Microstructure (TEM) of cheese bases I and II.
A: Cheese base I (free of added proteolytic enzyme) consist· ed of a compact protein matrix (p); b: Streptococci. 8: Cheese
spaces, particularly at a higher magnification (Fig. 38) . In
addition, clusters of mesophilic lactic steptococci which originated from the starter culture were also prese nt in the protein matrices (Fig. 38) of the samples under study.
There was a low incidence of calcium phosphate crystals in both Cheddar cheese varieties.
In contras t to Cheddar cheese, cheese bases I and II
consisted of a protein matrix in which no fat was noticeable
(Figs. 4 and 5). This was in ag reement with the composit ion
of the cheese bases which were made from reconsti tuted
skim milk powder. There were differences between the structures of both cheese bases. Cheese base I was compact
(Figs. 4A and SA) but cheese base II was porous or open
30
with added Savorase-A ) had an open structure as the result of the proteolytic activity of the added protease.
base If (made with added Savorase-A) had an open protein structure (p) as the result of the proteolytic activity of the added protea~e.
(Figs. 48 and 58) as the result of the treatment with
Savorase-A which had been added in order to stimulate accelerated ripening in this cheese base.
Processing resulted in the developme nt of structures in the control and experimental cheeses (Fig. 6) which differ·
ed from the structures of the raw materials (Figs. 3, 4, and 5). As the result of emulsification, fat pan icles were reduc
ed in dimensions from those in excess of 1 ,urn in Cheddar
cheese to 0.322:+:0.105 ,urn (mean diameter:+: standard de
viation of the fat particle sections) in processed cheese
blend A 1, and to 0.362:+:0.1 44 pm, 0.336:+:0.127 ,urn, and
0.291:+:0.082,um in processed cheese blends 8 1, C 1, and 0 1,
respectively. The emu lsified fat particles we re of globular
Processed Cheese Made from Skim Milk Powder Cheese Base
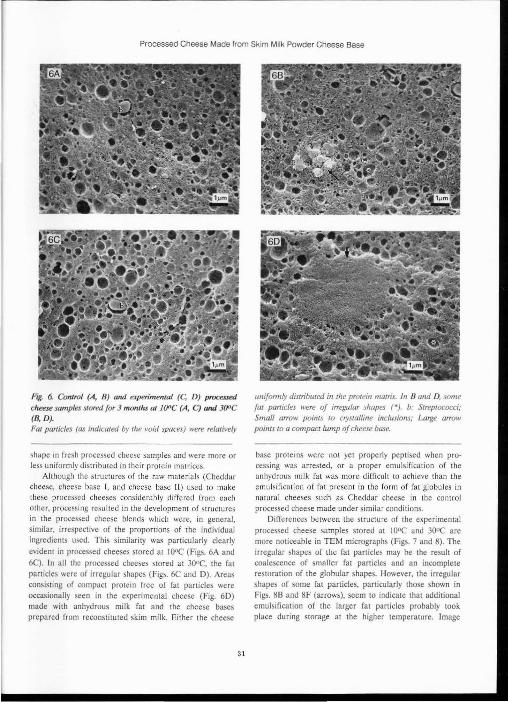
Fig. 6. ConLrol (A, B) turd experimental (C, D) proct=<!d
cheese samples stored for 3 monJirs aJ J()OC (A, C) turd J()OC (B, D). Fat particles (as indicated by the void spaces) were relatively
shape in fresh proce~sed cheese samples and were more or less uniformly distr ibu ted in their protei n matrices.
Although the structu res of the raw materia ls (Cheddar cheese, cheese base I, and cheese base II ) usetl lO make these processed cheeses considerably differed from each
other, processing resulted in the development of st ructures in the processed cheese blends which were, in general, similar, irrespective of the proportions of the individual ingredients used. This similarity was particularly clearly
evident in processed cheeses stored at IOOC (Figs. 6A and
6C). In all the processed cheeses stored at 300C. the fat particle; were of irregular shapes (Figs. 6C and D). Areas consisting of compact protein free of fat particles were occasionally seen in the experimental cheese (Fig. 60) made with anhydrous milk. fat and the cheese bases
prepared from reconstituted skim milk. Either the cheese
31
unifonnly distribured in the protein matrix. In 8 and D, some fat panicles were of i"egular shapes (•). b: Streptococci; Small a"ow points to crystalline inclusions,· Large (liTOW
points ro a compact lump of cheese brue.
base pro teins were not yet properly peptised when processing was arrested, or a proper emulsification of the anhydrous milk fat was more difficult to achieve than the emulsification of fat present in the form of fat globules in
na tural cheeses such as Cheddar cheese in the control processed cheese made under similar conditions.
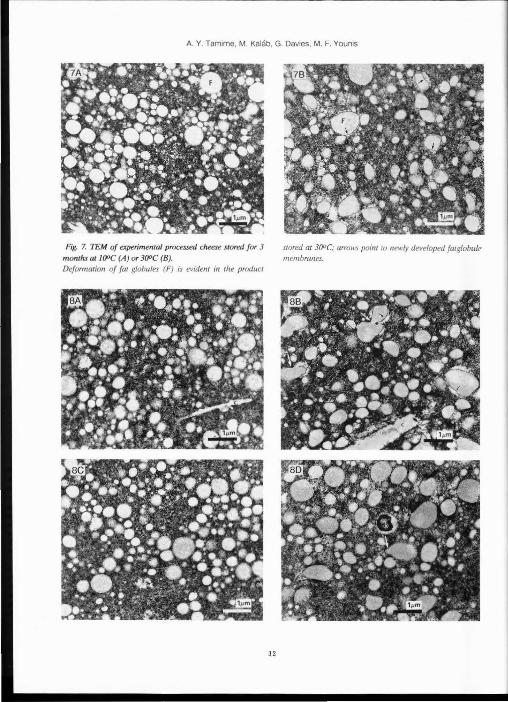
Di fferences between the structure of the experimental
processed cheese samples stored at IOOC and 30°C are more noticeable in TEM micrographs (Figs. 7 and 8). The irregular shapes of the fa t particles may be the result of coalescence of smaller fat particles and an incomplete restoration of the globular shapes. However, the irregular shapes of some fat particles, particu larly tho e shown in Figs. 88 and 8F (arrows), seem to indicate that additional emulsification of the larger fat particles probably took place during storage at the higher tempera ture. Image
A. Y. Tamime, M. Kalab, G. Davies, M. F. Younis
Fig. 7. TEM of experimenJal processed cheese stored for 3
months atJ(}OC (A) or J()OC (B). Deformation of fat globules (F) is evident in tlte product
32
stored at J{)OC; arrows poilll tu newly developed fmr;lobul~ membranes.
Processed Cheese Made from Sk1m Milk Powder Cheese Base
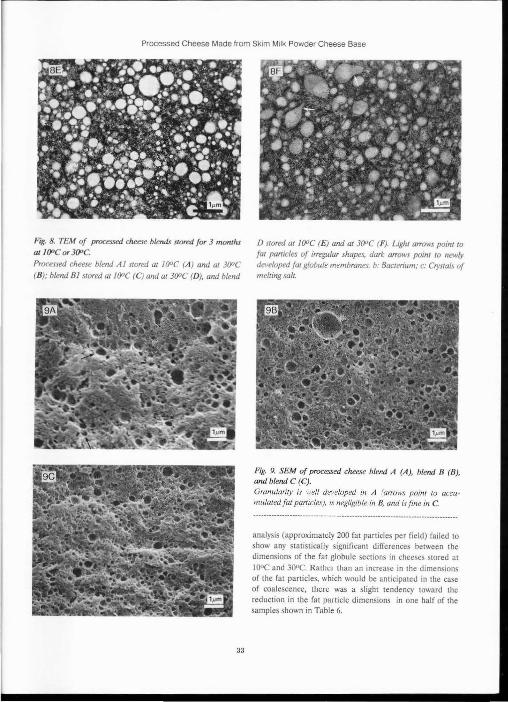
Fig. 8. TEM of processed cheese blends stored for 3 months a1 /(}0Cor 3(}0C
Processed cheese blend A I stored at I (}DC (A ) and at J()OC
(B); blend Bl stored at I (}DC (C) and at J()OC (D), and blend
33
D stored at f(}OC (£ )and at J()OC (F). Light arrowJ point to
fat panicles of i"egular shapes, dark a"ows point to newly de1•eloped fat globule membranes. b: Bactedum; c: Crystals of m elting salt.
Fig. 9. SEM of processed cheese blend A (A), blend B (B), and blend C (C). Gran.u/ariry is well developed in A (arrows poim to accumulated fat particles), is negligible in 8, and t~fjine in C.
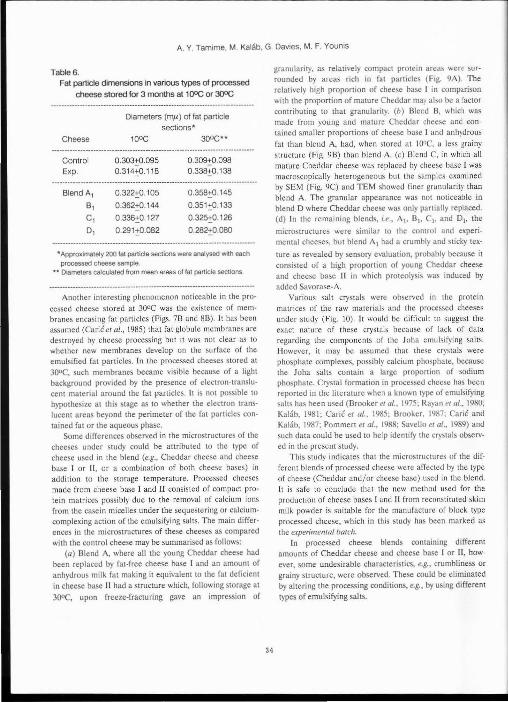
analysis (approximately 200 fat particles per field) failed to show any s tatistically significant differences between the dimensions of the fat globule sections in cheeses s10red at
IOUC and 300C. Rather than an increase in the dimensions of the fat particles, which would be anticipated in the case of coalescence, there was a slight tendency toward the reduction in the fat particle dimensions in one half of the samples shown in Table 6.
A. Y. Tamime, M. Kalab, G. Davies, M. F. Younis
TableS. Fat particle dimensions in various types of processed
cheese stored for 3 months at 1 OOC or 300C
Cheese
Control Exp.
Blend A1
B,
c, o,
Diameters (rT¥') of fat particle sections*
10°C
0.303:+::0.095 0.314+0.118
0.322+0.105
0.362+0. 144
0.336+{).1 27
0.291:+::0.082
0.309:+::0.098 0.338:+::0.138
0.358+0.1 45
0.351:+::0.133
0.325:';0.126
0.282:+::0.080
*Approximately 200 fat particle sections were analysed with each
processed cheese sample. ,.... Diameters calculated from mean areas of fat particle sections.
Another interesting phenomenon noticeable in the processed cheese stored at 300C was the existence of membranes encasing fat particles (Figs. 7B and 8B) . It hHs been assumed (CariC er al., 1985) that fat globule membranes a re destroyed by cheese processing but it was not clear as to whether new membranes develop on the surface of the emulsified fat particles. ln the processed cheeses stored at 300C, such membranes became visible because of a light background provided by the presence of electron-translucent material around the fat panicles. It i not possible to hypothesize at this stage as to whether the electron translucent areas beyond the perimeter of the fat particles contained fat or the aqueous phase.
Some differences observed in the microstructures of the chee;es under study could be attributed to the type of cheese used in the blend (e.g., Cheddar cheese and cheese base l or 11 , or a combination of both cheese bases) in addi tion to the storage temperature. Processed cheeses made from cheese base I and II consisted of compact protein matrices possibly due to the removal of calcium ions from the casein micelles under the sequestering or calciumcomplexing action of the emulsifying salts. The main differences in the microstructures of these cheeses as compared with the control cheese may be summarised as follows:
(a) Blend A, where all the young Cheddar cheese had been replaced by fat-free cheese base I and an amount of anhydrous milk fat making it equivalent to the fat deficient in cheese base 11 had a structure which, following storage at
300C, upon freeze-fracturing gave an impression of
34
granulariry, as relatively compact protein areru, were surrounded by areas rich in fat particles (Fig. 9A) The relatively high proportion of chee~e ba c 1 in comparison with the proponion of mature Cheddar may a lso be a factor contributing to that granularity. (b) Blend B. whie> was made from young and mature Cheddar cheese and contained smaller proportions of chee~e base I and anh)drous fat than blend A, had, when stored at IOOC, a less grainy structure (Fig. 9B) than blend A. (c) Bl end , in whtch all mature Cheddar cheese was replaced by cheese base I was macroscopically heterogeneous but the samples examined by SEM (Fig. 9C) and TEM showed finer granularity than blend A. The granular appearance was not noticeable in blend D where Cheddar cheese was only partially replaced. (d) In the remaining blends, i.e., A1, B1, C1, and D1, the
microstructures were similar to the comrol and experimental cheeses, but blend A 1 had a crumbly and sticky tex
ture as revealed by sensory evaluation, probably because it consisted of a high proportion of young Cheddar cheese and cheese base n in which proteolysis was induced by added Savorase-A.
Various sah crystals were ob~erved in the protein matrices of the raw materials and the processed cheeses under study (Fig. 10). It would be difficult to suggest the exact nature of these crystals because of lack of data regarding the components of the Joha emulsifying salts. However, it may be assumed that these crystals were phosphate complexes, possibly calcium phosphate, because the Joha salts contain a large proportion of sodium phosphate. Crystal formation in proces~ed cheese has been reported in the Literature whe:1 a known type of emulsifying salts has been used (Brooker eta/., 1975; Rayan eta/., 1980; Kaliib, 1981; Carie eta/., 1985: Brooker. 1'187: Carie and Kalab. 1987; Pommert eta/., 1988; Savello eta/., 1989) and such data could be used to help identify the crystals observed in the present study.
This study indicates that the microstructures of the different blends of processed cheese were affected by the type of cheese (Cheddar and/or cheese base) used in the blend. It is safe to conclude that the new method used for the production of cheese bases I and II from reconstituted skim milk powder is suitable for the manufacture of block type processed cheese, which in this study has been marked as the experimental batch.
In processed cheese blends containing different amounts of Cheddar cheese and cheese base I or II , however, some undesirable characteristics, e.g. , crumbliness or grainy structure, were observed. These could be eliminated by altering the processing conditions, e.g., by using different types of emulsifying salts.
Processed Cheese Made from Skcm Milk Powder Cheese Base
Acknowledgments
Mr. M.F. Younis is indebted to the Egyptian Government fo r financia l support. The authors thank Mr. A. Slack (Imperia l Biotechnology Ltd.) for providing the Savorase-A sample, Dr. G . Stanley (Eurozyme Ltd.) for providing the starter culture, Dr. H. W. Moel ler for useful comments, and Mrs. Paula All a n-Wcljtas and Miss Gisele Larocqu e for skillful technical assistance. Image analysis was carried out by Mr. E. F. Bo nd. Elec tron Microscope Centre, Resea rch Branch, Agricul!ure Canada in Ottawa provided fac ilit ies. Contribution 848 from the Food Research Cent re in Ottawa.
Allan-Wojtas P. (1984). Transportation of fragile food specimens such as milk ge ls dest ined for electron microscopy. Food Microstruc. 3 {I), 93.
Bond EF, Ka lab M. (1988). An external oscilloscope improves photography wi th the lSI DS-130 scanning electron microscope. EMSA Bull. 18(1 ), 90-91.
Brooker BE. ( 1987). The crystallization of calcium phosphate aL the surface of mould-ripened cheeses. Food Microstruc. 6, 25-33.
Brooker BE, Hobbs DG, Tu rvey A. (1 975). Observation on the microscopic crystallinic inclusions in Cheddar cheese. J . Dairy Res. 42,341-348.
BSI. (1969). BS:692 Part 2 Gerber method for the determination of fat in milk and ntilk products. British Standards lnstitu lion, London. UK.
BSI. (1976). BS:770 Pan I to 5. The chemical analysis of cheese. Briti sh Standards Institution, London, UK.
Carie M. Ka lab M. (1987). Processed cheese products. In: Cheese: Chemjstry, Physics and Microbiology - M ajor Cheese Groups, Vol. 2, PF Fox (ed.), Elsevier Applied Science Publishers Ltd ., Loodon, UK, 339-383.
Carie M, Gantar M, Kalab M. ( 1985). Effects of emu lsifying agents on th e microst ructure and other characteristics of process cheese - A review. Food Microstruc. 6, 297-3 12.
de Wit J N. ( 1985). Milk Proteins- Proceedings of the Interna tional Congress on Milk Protein 1984, TE Gales loot and BJ Tinbergen (eds.), Centre for Agricultura l Publishing and Documentation, Wageningen, The etherlands, 183- 195.
Egyptian Standards. ( 1970). Specifications of dairy products · MKM 999. Ministry of Agriculture. Cairo, Egypt , 3-5.
Erns trom CA, Sutherland BJ. Jameson, GW. (1980). Cheese base for processing- A high yield production from whole milk by ultrafiltration. J. Dairy Sci. 63, 228-234.
35
Green ML. Turvey A, Hobbs DG. (1981). Development of structu re and texture in Cheddar cheese. J. Dairy Res. 48, 343-355.
Heertje I, Boskamp MJ, van Kleef F, Gortemaker FH. ( 1981). The microstructure of processed cheese. Neth. Milk Dairy J . 35,177-179.
IDF {1986). The World Market of Cheese - Doc 203. International Dairy Federation, Brussels, Belgium, 5·7.
Jameson G W, Sutherland BJ . (1986). Processing dairy products. Australian Patent No. 559 021.
Ka lab M. (1981). Electron microscopy of milk products: A review of techniques. Scanning Electron M icrosc. 1981 ; If! , 453-472.
Kalab M, Yun J, Yiu SH. (1987). Textural properties a nd microstructure of process cheese food rework. Food Microstruc. 6(2), 181-192.
Kosikowski FV. ( 1977). Cheese and Fermented Milk Foods. Kosikowsk:i and Associates, ew York, USA, 382-406.
Law BA. ( 1987). Cheese: Chemistry, Physics a nd Microbiology- General Aspects, Vol. I, PF Fox (ed.). Elsevier Applied Science Publishe rs Ltd., London, UK. 365-392.
Lee BO. Paquet D, Alais C. ( 1979). Et ude biochimique de la fonte des fromages - 1: Mesurc de Ia peptisation. Le Lait 59, 589-596.
Lee BO, Paquet D, Alais C. (1986). Etude biochimique de Ia fonte des fromages- IV: Effet du type de sels de fonte et de Ia nature de Ia matiere prott!ique sur Ia peptisation/ utilisation d'un sys teme model. Lc Lait 66, 257-267.
Madsen RF, Bjerre P. (1981). Production of cheese base. North European Dairy J . 47, 135-139.
Meyer A. (1973). Processed Cheese Manufactu re. Food Trade Press Ltd., London, U.K., 1st ed., 11-29.
Moran JW, Peedal JR, Trecker GW. (1989). Manufacture of curd and cheese from a milk retentate. US Patent No. 4 820 530.
Pearce KN . (1977). The complexomet ric determination of calcium in dairy products. N.Z. J . Dairy Sci. Tecbnol. 12, 113- 11 5.
l'ommert J F, KJaebe A, Perie J, Lcbugle A, Puech J. ( 1988). Observation and analysis of crystalline pbases in processed cheese. J. Food Sci . 53, 1367-1369 and 1447.
Rayan AA, Kalab M, Ernst rom CA. ( 1980). Microwuctu re and rheology of process cheese. Scanning Electron Microsc. 1980; Ill , 635-643.
Reynolds ES. (1963). The use of lead citrate at high pH as an electron·opaque stain in electron microscopy. J. Cell Bioi. 17, 208-212.
Ridha SH, Crawford RJM, Tamime AY. (1984). Comparative studies of casein breakdown in Cheddar
A. Y. Tamime, M. Kalab, G. Dav1es, M. F. Younis
cheese manufactured [rom lactose-hydrolysed milk. J. Food Prot. 47,381-387.
Rubin J, Bjerre P. (1983a). A process for preparing cheesebase. UK Patent No. GB 2 101 866 A.
Rubin J, Bjerre P. (1983b). A process for preparing cheesebase. US Patent No.4 401 679.
Savello PA, Ernstrom CA, Kaliib M. (1989). Microstructure and meltability of model processed cheese made with renne t and acid casein. J. Dairy Sci. 72, 1-11.
Shimp LA. (1983) Basic knowledge simplifies choice. Dairy Field 166( 10}, 116-117.
Tamime AY, Younis MF, Davies G, Bradbury 1, Dawood AH, Abdou SM. (1990). The quality of processed chee ·e made from reconstituted skim milk powder cheese base. Egyptian J . Dairy Sci. 1990 (in press).
Taneya S, Kimura T, lzutsu T, Buchheim W. ( 1980). The submicroscopic structure of processed cheese with different melting properties. Milchwissenschaft 35, 479-481.
Thomas MA. (1977). The Processed Cheese Industry -Bulletin D 44. Department of Agriculture. New South Wales, Australia, 3-49.
Walstra 1', Jenness R. ( 1984). Dairy Chemistry and Physics, John Wiley and Sons Inc., New York, USA, 173- 177.
Younis MF. (1989). Some studies on processed cheese. PhD Thesis. Zagazig University, Moshtohor, Egypt.
Discussion with Reviewers
~What effects had anhydrous milk fat on the texture or microstructure of processed cheese? ~ The overaU impression was that in the processed cheese blends it had no evident effect on the texture or microstructure.
~ What type of mix do you recommend for the manufacture of Egyptian processed cheese? Authors· Practically most of the blends were suitable for the Egyptian market. However, in order to reduce cheese imports to Egypt, the experimental cheese, which was made totally from cheese bases I and II , may be used 10 manufacture processed cheese locally.
0 N Holcomb· Can the authors provide additional information on the emulsifying salts used, e.g., whether phosphates or citrates were used? ~ You have asked a very interesting question because the properties of the processed cheese are influenced by the constituen:s of the emulsifying salts used, e.g., phosphates or citrates. However, Joha SE, C, and T are commercial formulations of emulsifying salts which are
36
widely used in the proce~sed chee~e induMry. The exact formulation and the available technical data are. as a consequence. somewhat limited. The supplier had proYided us with some information as shown in Table 4.
D.N. Holcomb: During the manufacture of chee~e base, the reconstituted skim milk powder was uhrafiltered, diluted with water, and then diafiltered. It might be meful if the authors would explain why these two filtr<llion steps were
both necessary. Authors: The two filtration steps were nece~~ary for the following reasons: (a) the ultrafiltration was carried out primarily to concentrate the protein in milk and (b) the diafiltration process helped to reduce the level of lactose in the retentate.
D.N. Holcomb: Could the authors provide more detail of the staining procedure with uranyl acetate and lead citrate? Authors: Thin sections were stained with a saturated uranyl acetate solution in rnethan I for 5 min, washed in methanol, >tained with alkaline lead citrate (Reynolds, 1963) for 5 min, washed with 0.01 N NaOI-1 ami with water, and dried.
I 1-leertje: Creamjng time is considered to be ;;m important variable in the production of processed cheese. No dear mention is made about the creaming tirne. Was it used to
induce changes in the firmne~s'! If .!o.O, were differences in microstructure observed? Authors: It is a well established fact that creaming time can induce considerable changes in the firmness of processed cheese. In the present study, the creaming time was maintained at a constant period (i.e .• using vacuum for 1 min at
85-900C followed by stirring for 2 min) in order to minimise any variatjon bern•een the proce!<!sing of each hlend.
I Heertje: Can an explanation be offered for the considerable increase in firmness of the products after storage at
300C? Is this reflected in the micro~tructure? Authors: Differences in the firmness of fresh (soft) and stored (firm) cheeses cannot be explained on the basis of the micrographs obtained . The aggregation of fat particles and their fusion led tO an increase in the fat particle dimensions. Large fat particles are usually found in soft processed cheeses (Shimp. 1983). Since the experimental
cheese under study was firmer after storage at 30oc than the fresh cheese, we may assume that its high firmness is most probably associated with changes in the protein
matrix. Excessive heating is known to harden process cheese. It
takes only several hour~ of heating at 820C to severely thicken a processed cheese emul;ion (Kalab ec a/., 1987).
Processed Cheese Made from Sktm Milk Powder Cheese Base
The change in firmness is accompanied by the development of e lectron-dense areas in the heated proces~ed
cheese, but it is not known whether such areas consist of chemically modified proteir or whether the protein is compacted in the~e a reas.
Thinner ~ections and a high-resolution electron microscope would be necessary to reveal differences (if any) in the micro~tructures of the protein mat ri ces of the soft and
firm s"mplcs. Cryofixation of the cheeses fo ll owed by replic::ttion of planes obtained by freeze-fracturing and examination of the replicas by TEM would probably be even more ~uitable.
~ Is there an ind ication in the protein phase for the exi tence of string-like structures a"i observed by others in processed cheese?
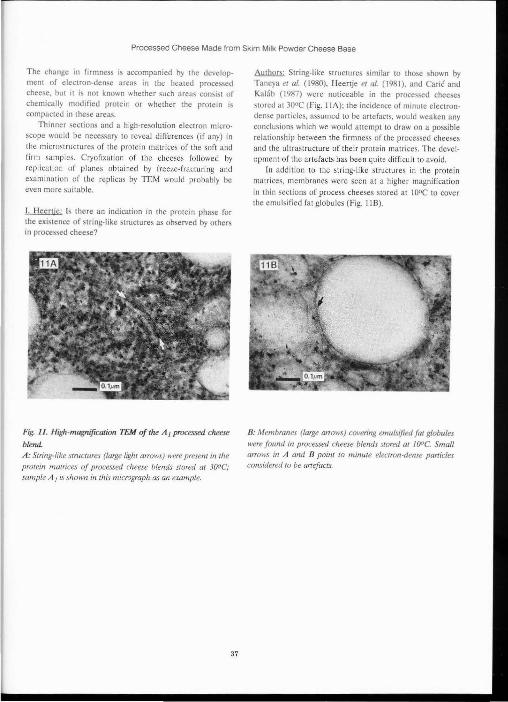
Fig. 11. Higlt-magnificaJion TEM of the A 1 processed cheese
blend.
A: Stn'ng-like stntctures (large ligh t a"ows) were present in the
protein matrices of processed cheese blends stored at JOOC; sample A 1 is shown in this micrograph as an example.
37
~ String-like structures similar to those shown by Taneya et al. (1980), Heenje eta/. (198 1), and Carie and Ka lab (1987) were noticeable in the procc;scd cheeses
stored at 30°C (Fig. 11A); the incidence of minute electrondense panicles, assumed to be artefact3. would "eaken any conclusions which we would attempt to draw on a possible relationship between the firmness of the processed cheeses and the ultrastructure of their protein matrices. The development of the artefacts has been quite difficult to avoid.
In addition to the string- like structu res in the protein matrices , membranes were seen at a higher magnification
in thin sections of process cheeses stored at 10°C to cover the emulsified fat globules (Fig. 118).
8 : Membranes (large arrows) covering emulsified fat globules
were found in processed cheese blends srored at IOOC. Small arrows in A and B point to minute electron-deme panicles considered to be anefacts.


![MICROSTRUCTURE AND MECHANICAL PROPERTIES OF 1050/6061 LAMINATED COMPOSITE PROCESSED BY … · 2013. 2. 13. · materials after ARB are more like a layered composite [5,7,8]. The process](https://img.pdfslide.us/doc/110x75/60e93b9ecf8b6705f7605616/microstructure-and-mechanical-properties-of-10506061-laminated-composite-processed.jpg)