Embed Size (px)
Citation preview

TRACECA EXPERT GROUP TRAINING
Transport Projects Appraisal

Financial analysis
Appraisal optimism
Social analysis
External costs in the transport sector
Economic analysis
Data needs
6/17/2014 IDEA II Project : Transport Dialogue and Networks Interoperability II Project funded by European Union DG DEVCO
2
Overview
Values in the economic analysis
Preparatory steps
General introduction

6/17/2014 IDEA II Project : Transport Dialogue and Networks Interoperability II Project funded by European Union DG DEVCO
3
The project appraisal is a process:
• of investigation and reasoning, designed to assist decision makers for reaching informed and rationale choices:
the task of decision is separate from the task of reasoning, which course of action is more consistent with the objectives, this second task is assigned to the technical advisers.
• made within organisations that are expected to act in the public interests and work out which option is the most consistent, according to their objectives;
• in this respect:
advisers give technical support both on the feasibility of a project and on his consistency with the general objectives. Their work is independent from the political decision making process;
the final decision on, whether or not, proceeding with the project and with which option stays with the decision makers.
General introduction

6/17/2014 IDEA II Project : Transport Dialogue and Networks Interoperability II Project funded by European Union DG DEVCO
4
General introduction
Appraisal is a non-linear process.
It is iterative and requires: continuous fine tuning, refinements and feedbacks from preliminary evaluation, to pre-feasibility and up to the full feasibility (through transport simulation models).
A decision has to be taken at each step of this process, for analysing the project and considering technical solution(s), which should be taken into the view to:
• assess whether it is worthwhile to jump from the preliminary design to a more detailed definition of the project;
• select the most suitable option among the ones identified;
• check whether, after having modified the original project for mitigating the environmental impacts, it is still worthwhile to proceed;
• go for the full final feasibility.

6/17/2014 IDEA II Project : Transport Dialogue and Networks Interoperability II Project funded by European Union DG DEVCO
5
General introduction
Project identification and
alternatives analysis
Environmental analysis
Risk assessment
Financial analysis ECONOMIC ANALYSIS
Social analysis
Time
Transport model
Pre-feasibility
Preliminary evaluation

6/17/2014 IDEA II Project : Transport Dialogue and Networks Interoperability II Project funded by European Union DG DEVCO
6
General introduction
Phases Necessary information and tools Purpose of the appraisal
Preliminary evaluation
• Information still preliminary and thus
uncertain: first demand estimation, costs,
costs for the users.
• No models available.
• Eliminating those proposals that are clearly
expensive, when compared to the potential
benefits.
• Avoiding that clearly “poor”, management-type,
and “partial solutions” proposals are not
considered, etc.
Pre-feasibility
• Aggregate demand, approximate investment
and management costs, better estimation time
savings, operational costs, etc.
• Environmental costs even without
Environmental Impact Assessment (EIA).
• Simplified modelling approach.
• Identifying the most promising solutions.
• Verifying the available technological
alternatives: new infrastructure, or better
functioning of the existing ones, capacity, etc.
• Analysis of impacts related to pricing policies.
• Support decision on management and
organisation (PPP for instance), etc.
Full feasibility
• Disaggregate demand, including other modes
and routes, final data for: investment and
management costs, tariffs, operating costs,
shadow prices, etc.
• Inputs from EIA available.
• Multi-modal modelling approach.
• Verifying the profitability of the set of options.

6/17/2014 IDEA II Project : Transport Dialogue and Networks Interoperability II Project funded by European Union DG DEVCO
7
Preparatory steps
Financial and Economic appraisals
Financial appraisal
• The point of view of the analysis is the one of the agency that will build and operate the project;
• It considers only remarkable effects for the agency;
• Either it maximises the agency’s financial surplus, or minimises its net subsidy requirements.
Economic appraisal
• The point of view is the one of the community, as a whole;
• It considers all the effects of the project on the individual welfare of all members of the community and measures these effects in some common unit;
• It maximises the community welfare.

6/17/2014 IDEA II Project : Transport Dialogue and Networks Interoperability II Project funded by European Union DG DEVCO
8
Preparatory steps
Financial and Economic appraisals
EXAMPLE
A railway line links a small country town A, with the regional capital C;
The service between A and C runs a financial loss.
It is proposed to:
• close the service and the intermediate station in B;
• replace the service with a new bus line.
continue →
C
A
B

6/17/2014 IDEA II Project : Transport Dialogue and Networks Interoperability II Project funded by European Union DG DEVCO
9
Preparatory steps
EXAMPLE
What are the consequences?
The fare charged would be the same, but in this case revenues would cover the costs, as buses are cheaper to operate, compared to railways;
The trip would take considerable longer time by bus compared to train;
Part of the demand that is currently using the train will not choose the bus, because of the higher travel time → half of this trips would be made by car and half would not be made at all;
The financial analysis carried out for the railway operator states that, even with a diminished demand, the revenues will cover the costs of the bus services, therefore the project is financially viable.
continue →

6/17/2014 IDEA II Project : Transport Dialogue and Networks Interoperability II Project funded by European Union DG DEVCO
10
Preparatory steps
EXAMPLE
The economic appraisal would take into account not only the revenues for the operator but also:
• the additional time for the users of the new bus line;
• the disbenefit for the modal shifters and the people giving up travelling;
• the environmental impacts of the additional cars and buses travelling on the road network connecting A with C.
REMARK
• All these issues are not considered in the financial analysis.
• They are part only of the economic analysis.

6/17/2014 IDEA II Project : Transport Dialogue and Networks Interoperability II Project funded by European Union DG DEVCO
11
Preparatory steps
Principles of Cost-Benefit Analysis (CBA)
• Quantifying the project’s impacts on the community;
• Assess the set of options considered;
• Identify:
the best feasible alternative;
project winners and losers;
the project’s risks and its economic implications.
6/17/2014 IDEA II Project : Transport Dialogue and Networks Interoperability II Project funded by European Union DG DEVCO
12
Preparatory steps
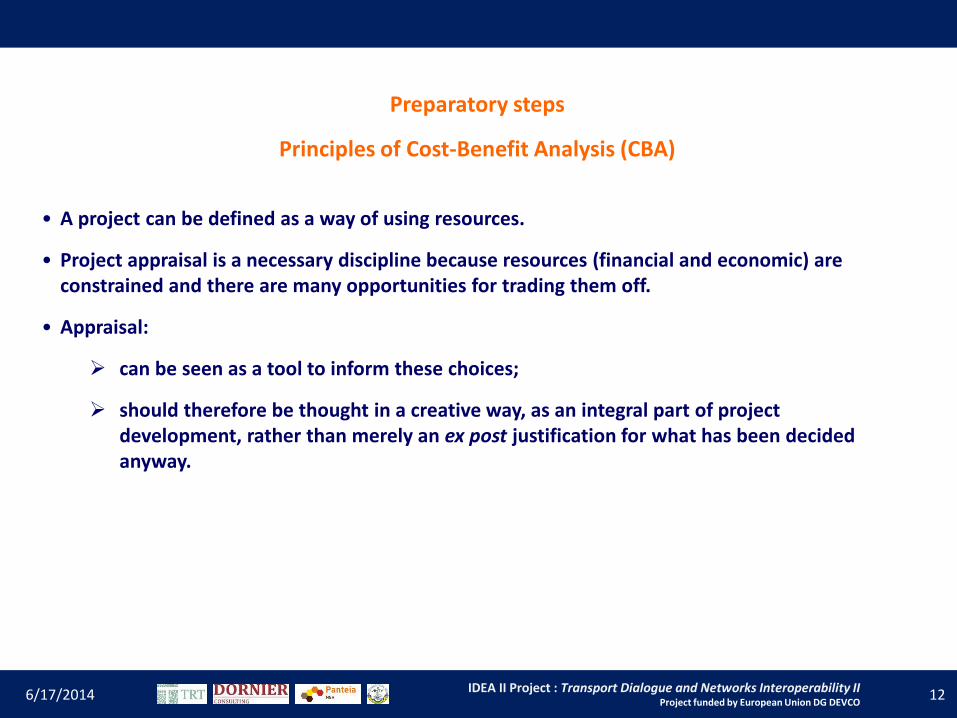
Principles of Cost-Benefit Analysis (CBA)
• A project can be defined as a way of using resources.
• Project appraisal is a necessary discipline because resources (financial and economic) are constrained and there are many opportunities for trading them off.
• Appraisal:
can be seen as a tool to inform these choices;
should therefore be thought in a creative way, as an integral part of project development, rather than merely an ex post justification for what has been decided anyway.

6/17/2014 IDEA II Project : Transport Dialogue and Networks Interoperability II Project funded by European Union DG DEVCO
13
Preparatory steps
• Step 1 – Define project’s objectives and scope:
Why is the project proposed?
What are its objectives?
• Step 2 – Identify the options:
What are the options for achieving the objectives?
What is the baseline scenario?
• Step 3 – Identify impacts:
What are the impacts of the project?

6/17/2014 IDEA II Project : Transport Dialogue and Networks Interoperability II Project funded by European Union DG DEVCO
14
Preparatory steps
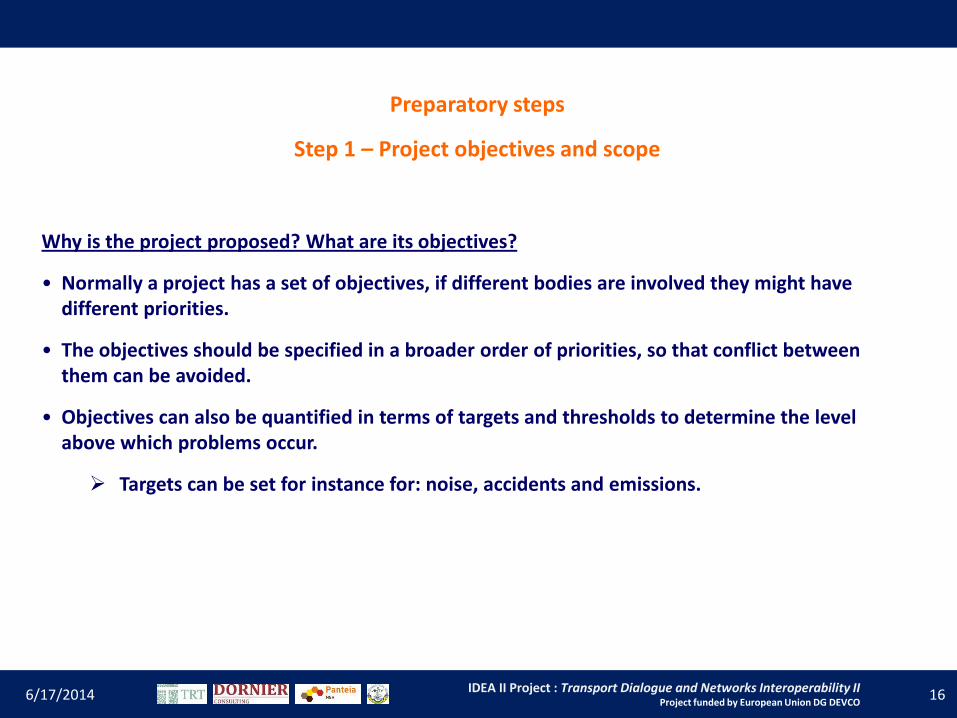
Step 1 – Project objectives and scope
Why is the project proposed? What are its objectives?
• A transport project aims firstly at reducing costs and/or travel times, but the policy objectives could also include:
improved quality of the environment;
increased safety;
reduced energy consumption;
increased accessibility and fostered economic development and regional cooperation.

6/17/2014 IDEA II Project : Transport Dialogue and Networks Interoperability II Project funded by European Union DG DEVCO
15
Preparatory steps
Step 1 – Project objectives and scope
Why is the project proposed? What are its objectives?
• It is important to distinguish between objectives and strategies.
• Build a new railway line is not an objective, it is a preferred strategy either to increase accessibility, or to improve the quality of the environment.
• Mixing strategies and objectives can lead to other effective solutions to be overlooked.
6/17/2014 IDEA II Project : Transport Dialogue and Networks Interoperability II Project funded by European Union DG DEVCO
16
Preparatory steps
Step 1 – Project objectives and scope
Why is the project proposed? What are its objectives?
• Normally a project has a set of objectives, if different bodies are involved they might have different priorities.
• The objectives should be specified in a broader order of priorities, so that conflict between them can be avoided.
• Objectives can also be quantified in terms of targets and thresholds to determine the level above which problems occur.
Targets can be set for instance for: noise, accidents and emissions.

6/17/2014 IDEA II Project : Transport Dialogue and Networks Interoperability II Project funded by European Union DG DEVCO
17
Preparatory steps
Step 2 – Identify the options
There is always more than one possible solution to the same transport problem.
• For instance, if the objective is to reduce the congestion on a road link, possible options could be:
increase the capacity of the road;
increase the capacity of other routes;
foster modal shift by improving the performance of competing transport modes (rail, air, sea, etc.);
toll the existing road again for shifting demand to other routes.
• Options to be considered:
other transport modes;
other routes;
other technologies and/or other policies (access regulation, pricing, etc.).

6/17/2014 IDEA II Project : Transport Dialogue and Networks Interoperability II Project funded by European Union DG DEVCO
18
Preparatory steps
Step 2 – Identify the options
• Is the project a national, or a regional one? Or, is it international?
• Will the direct effects concern users in other countries?
• It is important to correctly identify the border of the project.
• The definition of the area of influence should be large enough to capture properly the effects of the project.
What is the geographical area of the project?

6/17/2014 IDEA II Project : Transport Dialogue and Networks Interoperability II Project funded by European Union DG DEVCO
19
A critical risk of distorting the appraisal is to neglect some relevant alternatives, in particular low-cost solutions (e.g., soft measures).
All possible actions that could be taken to change the transport system with a view of solving the problems identified and meeting the objectives, should be considered.
In this respect, it is always recommended to have more than one “do something” scenario.
It should always be reminded that projects are not only infrastructures, but also: regulation, pricing, operating measures and policies.
All these components have to be considered in combination with: future demand, revenues and costs.
Preparatory steps
Step 2 – Identify the options

6/17/2014 IDEA II Project : Transport Dialogue and Networks Interoperability II Project funded by European Union DG DEVCO
20
The cost-benefit analysis:
• is a comparative tool;
• trades-off the difference between alternative states of the world, namely:
a realistic do-nothing scenario “without the project”;
a do-something scenario “with the project”, in which it is included in the transport network.
Preparatory steps
Step 2 – Identify the options

6/17/2014 IDEA II Project : Transport Dialogue and Networks Interoperability II Project funded by European Union DG DEVCO
21
REMARK
• As mentioned for the project options, the “without project” scenario should include also policies for: regulation, pricing, operating measures and policies.
• The benefits of a project are determined comparing reference and project solutions, therefore the worse the reference scenario is, the more overestimated the benefits are, thus distorting the appraisal.
Referring to the “without project” scenario:
• the “do-nothing” is the option, when changes are not foreseen to the current scenario, beyond those already committed;
• the “do-minimum” option includes all the necessary and realistic changes for maintaining an acceptable level of service (with the lower cost).
Preparatory steps
Step 2 – Identify the options

6/17/2014 IDEA II Project : Transport Dialogue and Networks Interoperability II Project funded by European Union DG DEVCO
22
• The project should be well defined;
• When a project is composed of two or more separable projects, but only one with a positive performance, if they are considered as the whole, it could happen that the result is an average positive performance implying the realisation of the entire project.
• The projects should be “complete”;
• All the necessary and complementary works for making a project fully operative must be embodied (e.g. the realisation of an access road to a seaport), otherwise the “incomplete” project could result more profitable, than it should be in reality.
Referring to the “with project” scenario:
• It is necessary to take into account two important issues, when planning a project.
Preparatory steps
Step 2 – Identify the options

6/17/2014 IDEA II Project : Transport Dialogue and Networks Interoperability II Project funded by European Union DG DEVCO
23
Demand analysis
The estimation of the demand in the “without project” scenario and in the “with project” options is critical for the results of the appraisal:
→ It affects most of the impacts of a transport project.
Moreover, the transport sector has specific characteristics, namely:
• Transport supply is multi-modal;
• Transport supply is made of networks;
• Travel demand is a derived demand.
Preparatory steps
Step 3 – Identify the impacts

6/17/2014 IDEA II Project : Transport Dialogue and Networks Interoperability II Project funded by European Union DG DEVCO
24
Preparatory steps
Step 3 – Identify the impacts
• socio-economic scenario design;
• transport models;
• behavioural models in order to estimate present and future elasticities, modal shift, etc.
Demand analysis
As a consequence, the estimate of present and future travel demand is a complex task, which requires both appropriate tools and methodologies:

6/17/2014 IDEA II Project : Transport Dialogue and Networks Interoperability II Project funded by European Union DG DEVCO
25
Preparatory steps
Step 3 – Identify the impacts
Demand analysis
• Most commonly used drivers are:
GDP rate and/or other macroeconomic variables (Added Value, employment, etc.);
per capita income;
motorisation rate;
import and export;
• Scenarios are normally based on:
a mix of past trends of the drivers;
assumptions on future evolution;
• Significant deviations from observed economic trends in the area of interest must be motivated and explained.

6/17/2014 IDEA II Project : Transport Dialogue and Networks Interoperability II Project funded by European Union DG DEVCO
26
Preparatory steps
Step 3 – Identify the impacts
• A new project affects the transport network, also outside the improved link, due to:
route changes;
modal shift;
change of destination;
induced new trips as a consequence of increased accessibility.
• The competition framework ought to be considered, as the operators of other modes react to the increased competitiveness of the enhanced mode (adapting pricing strategies, increasing the level of services, etc).
• As a result, in the project scenarios, the entire transport supply might look different.

6/17/2014 IDEA II Project : Transport Dialogue and Networks Interoperability II Project funded by European Union DG DEVCO
27
The appraisal period should be appropriate for matching:
• maximum years of future forecasts (from travel demand simulation model);
• the useful life of the project (i. e. assets of the design);
• most likely mid/long term impact.
EU guidelines on projects appraisal recommend: 30 years for railways and 25 for roads, seaports and airports.
When the useful life is expected to overcome the forecasts time span a Residual Value (RV) should be introduced to consider further impacts, beyond the reference time horizon.
EXAMPLE
Useful life (UL) of the assets: 50 years
Forecasts time Span (FS): 30 years 0,40
50
3050
UL
FSULRV
Preparatory steps
Step 3 – Appraisal period

6/17/2014 IDEA II Project : Transport Dialogue and Networks Interoperability II Project funded by European Union DG DEVCO
28
Preparatory steps
Step 3 – Price and currency
A choice must be made between current and constant prices:
→ Constant prices are recommended.
In cross border projects, conversions among countries currencies is a necessary step.

6/17/2014 IDEA II Project : Transport Dialogue and Networks Interoperability II Project funded by European Union DG DEVCO
29
Identifying costs and benefits requires to:
• quantify all project impacts;
• attribute a monetary value that reflects a social value to all impacts, that have both market and non-market prices, like: time, emissions, noise, safety, etc.
REMARK
Money in CBA is just a convenient welfare metric, that allows to compare different impacts (investment costs, time savings, environmental effects, etc.).
Values in the Economic Analysis

6/17/2014 IDEA II Project : Transport Dialogue and Networks Interoperability II Project funded by European Union DG DEVCO
30
Values in the Economic Analysis
Different approaches exist to monetise non-market impacts:
• evaluation techniques, hedonic prices, contingent valuation and stated preferences.
These allow to estimate site specific ad hoc values, but are expensive.
• pro: less time and cost consuming;
• con: less precise.
Otherwise, adapt values from literature to a specific scenario (sometimes quite difficult):
Value transfer: use of a good value of a site, as proxy for values of the same good in other sites.

6/17/2014 IDEA II Project : Transport Dialogue and Networks Interoperability II Project funded by European Union DG DEVCO
31
The amount and the type of data needed for the appraisal vary according to the phases of the project.
In the preliminary assessment phase, only aggregated data are required.
As long as the appraisal is refined, more data and more disaggregated are required.
A part from the degree of aggregation and preciseness, the type of data are the same along all the phases, from preliminary appraisal through pre-feasibility, up to the full feasibility (the more data demanding).
Data needs
6/17/2014 IDEA II Project : Transport Dialogue and Networks Interoperability II Project funded by European Union DG DEVCO
32
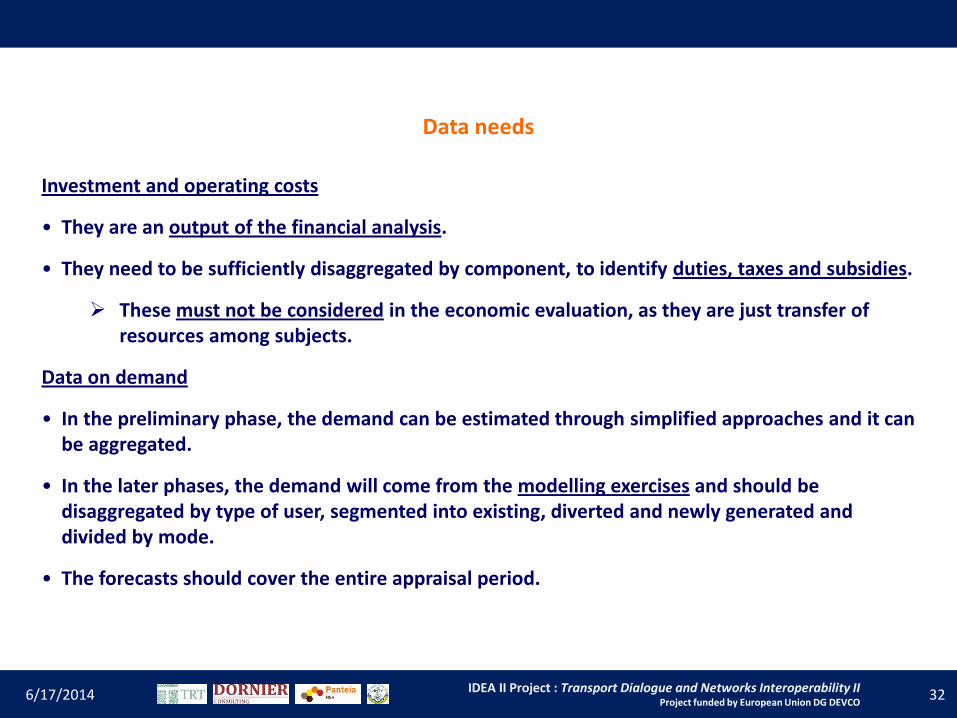
Investment and operating costs
• They are an output of the financial analysis.
• They need to be sufficiently disaggregated by component, to identify duties, taxes and subsidies.
These must not be considered in the economic evaluation, as they are just transfer of resources among subjects.
Data on demand
• In the preliminary phase, the demand can be estimated through simplified approaches and it can be aggregated.
• In the later phases, the demand will come from the modelling exercises and should be disaggregated by type of user, segmented into existing, diverted and newly generated and divided by mode.
• The forecasts should cover the entire appraisal period.
Data needs

6/17/2014 IDEA II Project : Transport Dialogue and Networks Interoperability II Project funded by European Union DG DEVCO
33
Data needs
Data on generalised cost of travel
• These data are normally an output of modelling exercises.
Data on operating costs
• Some of these data can come from the financial analysis, whilst others have to be calculated ad hoc.
Values to be applied
• The other values needed for completing the evaluation are:
the project useful life period;
the social discount rate;
the monetary values on: value of time savings and externalities.

6/17/2014 IDEA II Project : Transport Dialogue and Networks Interoperability II Project funded by European Union DG DEVCO
34
Intermediate Wrap-up
Project objectives
Project technical alternatives
Identify the alternatives
Define an appraisal period
Demand analysis
Values and data
“With project” scenario
“Without project” scenario

6/17/2014 IDEA II Project : Transport Dialogue and Networks Interoperability II Project funded by European Union DG DEVCO
35
First intermediate check list
Clearly state the project objectives;
Separate objectives from strategies;
Focus on the project relevant options;
Don’t forget low cost solutions;
Define an appropriate “without project” scenario;
Do not forget policy measures (pricing, regulation, etc);
Identify the project area of influence;
Consider the competition framework;
Look at the key assumptions for demand drivers;
Check the critical variables (VOT, user’s fares and costs).

6/17/2014 IDEA II Project : Transport Dialogue and Networks Interoperability II Project funded by European Union DG DEVCO
36
Economic Analysis
Evaluation scheme
Changes of surplus of Users and Producers
Change of external
costs
USERS Travellers and freights
PRODUCERS Operators GOVERNMENT NON-USERS
Change of fiscal
revenues
Fuel taxes Environment
Safety Global Warming
Change of Generalised Cost
Operating costs and revenues
Infrastructure investment and
maintenance costs
ECONOMIC PERFORMANCE
Appraisal period Discount rate

6/17/2014 IDEA II Project : Transport Dialogue and Networks Interoperability II Project funded by European Union DG DEVCO
37
Economic Analysis
User surplus
The willingness to pay (WTP) is the maximum amount that a buyer would pay for a good.
Different buyers have different WTP, over the same good.
This enables to construct the demand curve about that good.
In transport projects appraisal the buyer is the user.
The benefits gained are measured through users surplus.
Users surplus is the difference between their WTP and the perceived cost of travel, namely the Generalised Cost (GC) of travel.
Volume of travelsO
A
GCD
q
Ge
ne
rali
sed
cost
pe
r tra
vel
Users surplus
Demand curve

6/17/2014 IDEA II Project : Transport Dialogue and Networks Interoperability II Project funded by European Union DG DEVCO
38
Economic Analysis
Generalised Cost (GC) of travel
These GC is perceived by the users (both passengers and freights).
• The GC is computed:
between each pair of origins (i) and destinations (j) and for each mode (m);
as sum of all perceived costs: travel time (through the Value of Time), charges, vehicle operating costs (VOCs).
ijmijmijmijmVOCschargestimeGC

6/17/2014 IDEA II Project : Transport Dialogue and Networks Interoperability II Project funded by European Union DG DEVCO
39
Economic Analysis
Change of Users surplus (DS)
The benefit is the difference of surplus with and without the project is GC1BDGC2, or otherwise:
DS = Swith – Swithout
If the volume of travels without the project is q1,
the users surplus is the triangle AGC1B (Swithout).
With the project GC1 lowers to GC2 and the users surplus increases to AGC2D (Swith).
Volume of travelsO
A
GC2
D
q2
Ge
ne
rali
sed
cost
pe
r tra
vel
Users surplus with the project
Volume of travels
GC1
q1O
B
A
GC2
D
q2
Ge
ne
rali
sed
cost
pe
r tra
vel
Change in users surplus (DS)
Reduction of generalised
cost
Increase of travels
Volume of travels
GC1
q1O
B
A
Ge
ne
rali
sed
cost
pe
r tra
vel
Users surplus without the
project

6/17/2014 IDEA II Project : Transport Dialogue and Networks Interoperability II Project funded by European Union DG DEVCO
40
The change in the users surplus generated by the project is therefore:
This formula is the so-called “rule of a half”.
The same result can be obtained through the following calculation:
(ii)(i)
2q1q2GC1GC2
11q2GC1GCΔS
The formula makes apparent that the surplus is the sum of two components:
• pre-existing demand (i);
• additional demand (ii) → new users + diverted users.
2q1q2GC1GC2
1ΔS
Economic Analysis
Change of Users surplus (DS)

6/17/2014 IDEA II Project : Transport Dialogue and Networks Interoperability II Project funded by European Union DG DEVCO
41
Economic Analysis
Change of Users surplus (DS)
In multimodal transport appraisal, the users surplus must be computed with respect to each mode, where a benefit occurs.
Consider an upgraded railway parallel to a congested road.
The investment determines a reduction of trains travel time.
When upgraded, the railway will induce a modal shift of a part of the road users.
Total benefits arising must be calculated summing the benefits for:
• pre-existing rail users → DS1;
• diverted users from road to rail → DS2.

6/17/2014 IDEA II Project : Transport Dialogue and Networks Interoperability II Project funded by European Union DG DEVCO
42
Economic analysis
New modes and closures
• There are certain circumstances where the rule of a half breaks down entirely. These are:
introduction of completely new modes in the do-something scenario (e.g., high speed rail, or urban light rapid transit);
closure of existing modes.
• If any of these circumstances should arise, an alternative approach is required.

6/17/2014 IDEA II Project : Transport Dialogue and Networks Interoperability II Project funded by European Union DG DEVCO
43
Economic analysis
• When a new mode is introduced, the volume of travels and GC are known in the do-something scenario from the transport model outputs, but in the do-nothing scenario travels on the new mode cannot exist (= 0). Therefore the rule of a half can not be applied.
• The users’ benefit is always the difference between the surplus with and without the project, but since demand is zero without the project, users benefit is equivalent to the whole users surplus with the project.
Introduction of completely new modes.
Volume of travelsO
A
GCD
qG
en
era
lise
d co
st p
er t
rave
l
Users surplus with the project

6/17/2014 IDEA II Project : Transport Dialogue and Networks Interoperability II Project funded by European Union DG DEVCO
44
Economic analysis
Closure of existing modes.
• In this case, the volume of travels and GC are known in the do-nothing scenario from the transport model outputs, but in the do-something scenario, the travels on the closed mode no longer exist (= 0).
• Without the closure, users would have a surplus AGCD. But it also measures the loss that is borne by users if they lose the opportunity to travel on that mode.
continue →
Volume of travelsO
A
GCD
qG
en
era
lise
d co
st p
er t
rave
l
Users surplus lost

6/17/2014 IDEA II Project : Transport Dialogue and Networks Interoperability II Project funded by European Union DG DEVCO
45
Economic analysis
Closure of existing modes.
• Closing a mode increases the demand and the consumer surplus of the substitute modes.
• However it would be wrong to interpret this increase as a social benefit attributable to the mode closure. This would be a double counting.
Volume of travelsO
A
GCD
q2G
en
era
lise
d co
st p
er t
rave
lq1
d1 d2

6/17/2014 IDEA II Project : Transport Dialogue and Networks Interoperability II Project funded by European Union DG DEVCO
46
Economic Analysis
Change of producer surplus (DP)
• network managers, train operating companies, freight forwarders, etc.
TCTRP
withoutwithwithoutwithTCTRTCTR PPDP
Therefore, the change in producer surplus amongst scenarios (DP) is the difference of TR and TC, with and without the project:
The producers are transport providers, both with respect to infrastructures and services:
The changes in both transport production costs and prices lead to variations in producer’s surplus.
The producer surplus (P) is the excess of total revenues (TR) over the total operating costs (TC):

6/17/2014 IDEA II Project : Transport Dialogue and Networks Interoperability II Project funded by European Union DG DEVCO
47
Economic Analysis
Government fuel tax revenues (FR)
A project can lead to changes in Government fuel tax revenues.
where:
• p is the unit fuel price without taxes;
• t is the fuel tax.
12
qqptpFR
Variations of the fuel tax revenues (FR) arise when a project leads to a shift in demand between road and other transport modes.
p+t
Volume of travels
GC1
q1O
B
A
GC2
D
q2
p
Ge
ne
ralis
ed
co
st p
er
trav
el
Additionalgovernmentaltax revenues
12
qqtFR

6/17/2014 IDEA II Project : Transport Dialogue and Networks Interoperability II Project funded by European Union DG DEVCO
48
Economic Analysis
Treatment of non-perceived VOCs
Road users and produces also borne the non-perceived VOCs, namely vehicles’ variable costs that do not affect a travel decision.
They do not determine, neither travel demand, nor changes of surplus.
Nevertheless, when a project modifies the vehicles’ travels, the variations of non-perceived VOCs must be calculated and added to the results got through the previous methodology.
Vehicle’s non-perceived VOCs are:
• tyres → fully depending on the distance travelled;
• maintenance and depreciation → partially depending on the distance travelled.

6/17/2014 IDEA II Project : Transport Dialogue and Networks Interoperability II Project funded by European Union DG DEVCO
49
Economic Analysis
Investment and maintenance costs
• the costs should be net of VAT and of all other indirect taxes (according to country-specific tax regulations, but with the exception of fuel taxes):
these elements are monetary transfers among the players involved and they balance each other, without influencing the results of the economic appraisal;
• sometimes the financial costs do not reflect the true economic value of an inputs because of market distortions). In these cases:
in order to truly represent the social value of project inputs, appropriate “shadow prices” should be applied to the financial costs;
“shadow prices” are usually provided by national authorities.
Investment and maintenance costs are derived from engineering design and estimates.
However, for the purposes of the economic appraisal some adjustments are required:

6/17/2014 IDEA II Project : Transport Dialogue and Networks Interoperability II Project funded by European Union DG DEVCO
50
Economic Analysis
Flow of costs and benefits – An example
Phase Year Costs Benefits
Invest. Mainten. Users Producer Government Non-perc.
VOCs
Investment
0 1 2 3 4
Operating
5 6 7 8 9 … … …
29 30
- 40.5 - 60.8 - 80.2 - 40.0 -30.0
0.0 0.0 0.0 0.0 0.0
… … …
0.0 75.5
0.0 0.0 0.0 0.0 0.0
- 5.8 - 5.8 - 5.8 - 7.5 - 7.5
… … …
- 10.0 - 10.0
12.0 8.5 - 4.0 5.0 14.0 9.0 - 5.0 5.5 16.0 12.0 - 5.5 6.2 18.0 13.8 - 6.5 7.1 21.0 15.8 - 8.0 8.3
… … … … … … … … … … … …
25.0 18.5 - 9.5 8.3 25.0 18.5 - 9.5 8.3
0.0 0.0 0.0 0.0 0.0 0.0 0.0 0.0 0.0 0.0 0.0 0.0 0.0 0.0 0.0 0.0 0.0 0.0 0.0 0.0
Investment cost and residual value
Infrastructure maintenance costs
Flow of benefits with growth rate
Benefits at the opening year

6/17/2014 IDEA II Project : Transport Dialogue and Networks Interoperability II Project funded by European Union DG DEVCO
51
Economic Analysis
Social Discount Rate
Discounting reflects the social view on the value of future costs and benefits, compared to the present ones.
An high Social Discount Rate means that a community assigns a greater weight to costs and benefits close to present time, rather than the ones that will occur in the future.
On the other hand, when lower values are used, benefits and costs arising in different years have more comparable values, therefore the time is not so underlying.
Discounting requires:
• to define the project time horizon, consistent with the economically useful life of the project (for transport investments time horizon is equal to 25-30 years, while for policies is usually much shorter);
• to introduce a suitable Social Discount Rate reflecting the social view on how the future weighs;
• the discount rate is a country-specific parameter and thus an input to the evaluator.

6/17/2014 IDEA II Project : Transport Dialogue and Networks Interoperability II Project funded by European Union DG DEVCO
52
Economic Analysis
Social Discount Rate
Country Value [%] Project Source
Austria, Denmark, France, Italy, Germany, Sweden, The Netherlands
3,5 Major projects EU DG Regio Guide, 2008.
Czech Republic, Hungary, Poland, Slovakia
5,5 Major Projects EU DG Regio Guide, 2008.
Turkey 8,0 Road rehabilitation Turkish General Directorate of Highways, 2010.
Armenia 12,0 Highway improvement Asian Development Bank, 2010.
Azerbaijan 12,0 Highway improvement World Bank, 2010.
Georgia 12,0 Highway improvement Padeco Co., 2008.
Moldova 12,0 Road extension and rehabilitation
Universinj Chisinau, 2010.
Kyrgyz Republic 12,0 Road rehabilitation World Bank, 2009.
Tajikistan 12,0 Water resources management
World Bank, 2005.
Uzbekistan 12,0 Logistics Centre World Bank, 2010.

6/17/2014 IDEA II Project : Transport Dialogue and Networks Interoperability II Project funded by European Union DG DEVCO
53
Economic Analysis
Performance indicators
Finally, alternative performance indicators can be calculated:
• Net Present Value (NPV);
• Internal Rate of Return (IRR);
• the Benefit-Cost ratio (B/C).
The NPV represents the discounted flow of the difference between social benefits and costs.
T
0t
t
s
tt
i1
CBNPV
When the NPV > 0, the project generates a net benefit.
Where:
• Bt is the benefit yielded at year t;
• Ct is the cost borne at year t;
• is is the country’s social discount rate;
• T is the economic life of the project.

6/17/2014 IDEA II Project : Transport Dialogue and Networks Interoperability II Project funded by European Union DG DEVCO
54
Economic Analysis
Performance indicators
IRR is the discount rate that zeroes the NPV.
The B/C ratio is the value of benefits divided by the value of costs.
0
IRR1
CBNPV
T
0t
ttt
T
0t
t
s
t
T
0t
t
s
t
i1
C
i1
B
C
B

6/17/2014 IDEA II Project : Transport Dialogue and Networks Interoperability II Project funded by European Union DG DEVCO
55
Economic Analysis
Performance indicators
EXAMPLE
Consider a project with a flow of costs and benefits as in the table below.
Determine the NPV, when the social discount rate is is 5%.
Year Costs Benefits Net benefit Present value
0 - 10.000 0
1 - 8.000 12.000
2 - 8.000 12.000
NPV
The project should not be undertaken, as NPV < 0.
ttCB
ts
tt
i1
CB
- 10.000,00
3.809,52
3.628,12
- 2.562,36
- 10.000
4.000
4.000
Difference of Costs and Benefits per year
Present value of net
benefit per year

6/17/2014 IDEA II Project : Transport Dialogue and Networks Interoperability II Project funded by European Union DG DEVCO
56
Second intermediate check list
Check consistency between consumer’s WTP and Generalised Costs.
Check consistency in revenues calculation between economic, financial and demand analysis.
Eliminate all transfers such as taxes, duties, subsidies and charges, but not fuel taxes.
Include all relevant investment, operating and management costs.
Highlight critical variables, that affect the final result.
Check for double counting.

6/17/2014 IDEA II Project : Transport Dialogue and Networks Interoperability II Project funded by European Union DG DEVCO
57
External costs and benefits
Definition of externality
An externality:
• is a cost, or a benefit, determined by an action of an agent, that affects a third agent who did not influence the action causing the cost, or the benefit;
• is not perceived through market prices;
• can be:
Negative: industrial production, by burning fossil fuels, causes damages to health, crops and historical buildings;
Positive: immunisation prevents an individual from getting a disease and his action has the effect of the individual not being able to spread the disease to others.

6/17/2014 IDEA II Project : Transport Dialogue and Networks Interoperability II Project funded by European Union DG DEVCO
58
External costs and benefits
Negative externalities in the transport sector
Negative externalities are:
• Environment pollutants: Nitrogen Oxides (NOx), Carbon Monoxides (CO), Sulphur Dioxides (SO2), Lead (Pb), Particulate Matter (PM2,5 and PM10) and NMVOC (Non-Methane Volatile Organic Compounds);
• Noise (depending on emission’s location);
• Global warming: Carbon dioxides (CO2), Methane (CH4) and Nitrous Oxide (N2O);
• Safety (accidents, fatalities and injured people);
• Congestion;
• Nature and landscape damages;
• Up and down streaming processes (production of energy, vehicles and transport infrastructures).

6/17/2014 IDEA II Project : Transport Dialogue and Networks Interoperability II Project funded by European Union DG DEVCO
59
External costs and benefits
External costs calculation methodology
Appraisers should focus on the most relevant categories of environmental effects, namely: air pollution, noise and global warming.
The recommended four steps when calculating the total external costs are:
1. Quantify changes in:
• pollutants and noise emissions, according to the EIA;
• greenhouse gases (GHGs) emissions;
• accident rates (depending on their severity).
2. Apply country-specific values. Whether country-specific data are lacking, it is recommended to transfer their marginal values from countries with similar characteristics, compared to the site of interest.
continue →

6/17/2014 IDEA II Project : Transport Dialogue and Networks Interoperability II Project funded by European Union DG DEVCO
60
External costs and benefits
External costs calculation methodology
3. Increase values over time (whether necessary);
4. Estimate of the overall economic impact by multiplying the variations of emissions and accident rates through the country-specific values.
REMARK
• About pollutants and noise, it is also important distinguish with respect to both modes and locations where these emissions take place, therefore:
data are required on vehicles fleet characteristics (composition, ages, fuel type, average distance travelled, etc.);
harm extent depends on people exposure to pollutants and noise (e.g., it is higher in densely populated areas and lower in rural ones).
6/17/2014 IDEA II Project : Transport Dialogue and Networks Interoperability II Project funded by European Union DG DEVCO
61
External costs and benefits
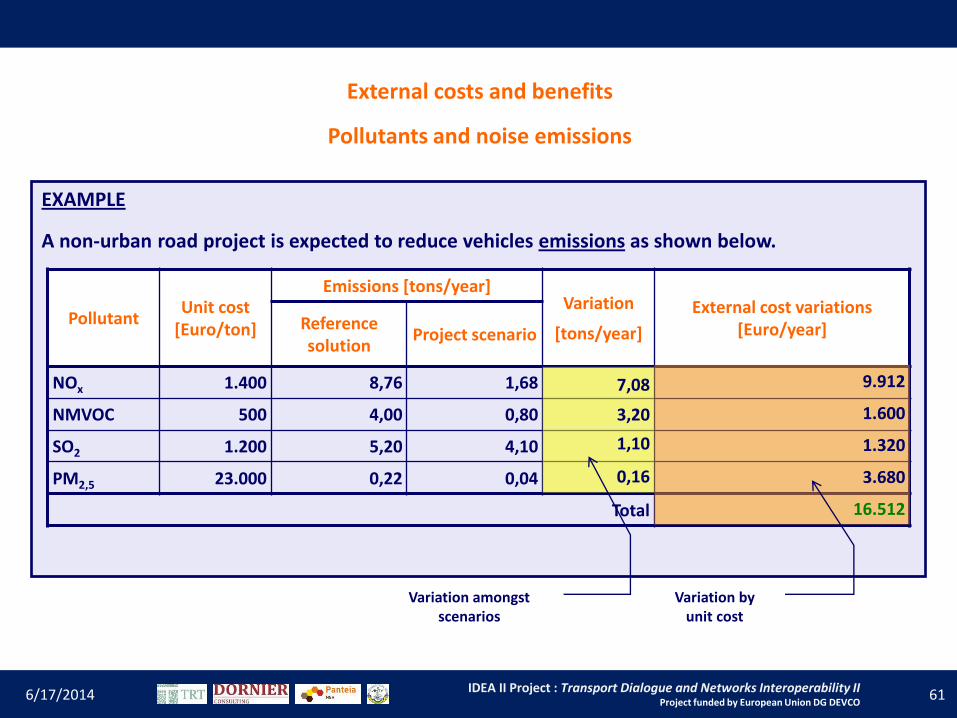
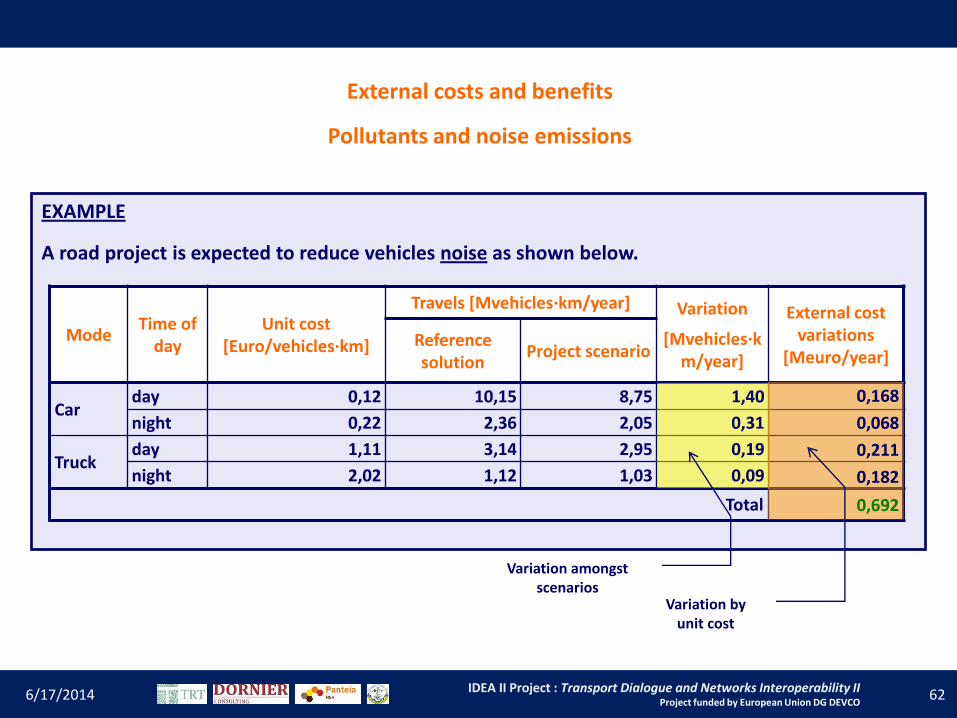
Pollutants and noise emissions
EXAMPLE
A non-urban road project is expected to reduce vehicles emissions as shown below.
Pollutant Unit cost
[Euro/ton]
Emissions [tons/year] Variation
[tons/year]
External cost variations [Euro/year] Reference
solution Project scenario
NOx 1.400 8,76 1,68
NMVOC 500 4,00 0,80
SO2 1.200 5,20 4,10
PM2,5 23.000 0,22 0,04
Total
7,08
3,20
1,10
0,16
Variation amongst scenarios
9.912
1.600
1.320
3.680
16.512
Variation by unit cost
6/17/2014 IDEA II Project : Transport Dialogue and Networks Interoperability II Project funded by European Union DG DEVCO
62
External costs and benefits
Pollutants and noise emissions
EXAMPLE
A road project is expected to reduce vehicles noise as shown below.
Mode Time of
day Unit cost
[Euro/vehicles·km]
Travels [Mvehicles·km/year] Variation
[Mvehicles·km/year]
External cost variations
[Meuro/year] Reference solution
Project scenario
Car day 0,12 10,15 8,75
night 0,22 2,36 2,05
Truck day 1,11 3,14 2,95
night 2,02 1,12 1,03
Total
1,40
0,31
0,19
0,09
0,168
0,068
0,211
0,182
0,692
Variation amongst scenarios
Variation by unit cost

EXAMPLE
A project is expected to increase GHGs emissions are shown below.
GHGs CO2 equivalent
factor Unit cost [Euro/
ton CO2] Emissions
[tons] Equivalent
emissions [tons] External cost
[Euro]
CO2 1
26
10.514
CH4 23 256
N2O 296 22
Total
6/17/2014 IDEA II Project : Transport Dialogue and Networks Interoperability II Project funded by European Union DG DEVCO
63
External costs and benefits
Global warming from GHGs
10.514
5.888
6.512
273.364
153.088
169.312
595.764
GHG emission by CO2 equivalent factor
Emission by unit cost
REMARK
Climate change is a global issue, GHGs impact is independent from the location.

6/17/2014 IDEA II Project : Transport Dialogue and Networks Interoperability II Project funded by European Union DG DEVCO
64
External costs and benefits
Safety
First step is forecasting the number of accidents (and their severity).
This is a complex task because accidents depend on many factors. Accident prediction models require extensive data to support them.
A more practical solution is to estimate the accident rates, on the basis of the distances covered (number of accidents per million of vehicle·km travelled within a year, by transport mode).
Assessing the cost of a casualty, country-specific values are recommended. If country-specific values for accidents cost are lacking, the marginal values should be transferred from countries where data are already available.
Changes of values over time should be considered as well.

6/17/2014 IDEA II Project : Transport Dialogue and Networks Interoperability II Project funded by European Union DG DEVCO
65
External costs and benefits
Safety
EXAMPLE
A road project is expected to reduce casualties as shown below.
Casualty type Unit cost
[Euro/cas.]
Casualties per year Variation
[cas./year]
External cost variations [Euro/year] Reference
solution Project
scenario
Fatality 1.930.598 5 3
Severe injury 256.154 20 14
Slight injury 19.217 52 39
Total
2
6
13
3.861.196
1.536.924
249.821
5.647.941
Variation amongst scenarios
Variation by unit cost

6/17/2014 IDEA II Project : Transport Dialogue and Networks Interoperability II Project funded by European Union DG DEVCO
66
Value transfer
Methodology
When estimates of the economic value of non-market goods (environmental goods, noise, travel time and accidents) are not available, the value transfer approach can be applied.
Since income per capita influences individuals preferences on WTP, the unknown parameter can be calculated through the ratio between the income per capita of the two countries.
known
known
unknownunknown
vI
Iv
Where:
• vunknown is the value to be calculated in a country where the parameter lacks;
• vknown is the value of the parameter in a country where the parameter is known;
• I are the per capita incomes in the countries where the parameters are respectively known and unknown.
known
unknown
known
unknown
I
I
v
vk →
6/17/2014 IDEA II Project : Transport Dialogue and Networks Interoperability II Project funded by European Union DG DEVCO
67
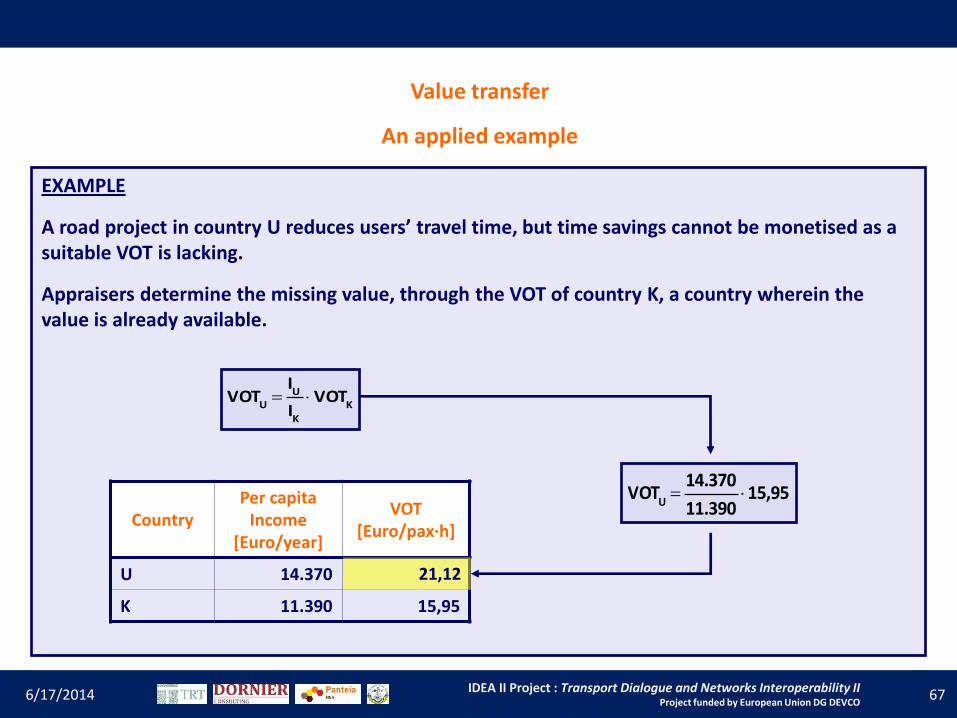
Value transfer
An applied example
EXAMPLE
A road project in country U reduces users’ travel time, but time savings cannot be monetised as a suitable VOT is lacking.
Appraisers determine the missing value, through the VOT of country K, a country wherein the value is already available.
Country Per capita
Income [Euro/year]
VOT [Euro/pax·h]
U 14.370
K 11.390 15,95
K
K
UU
VOTI
IVOT
15,9511.390
14.370VOT
U
21,12

6/17/2014 IDEA II Project : Transport Dialogue and Networks Interoperability II Project funded by European Union DG DEVCO
68
Social analysis
The performance indicators provide an aggregate result, by stating whether a society is better-off, independently on who is bearing the costs and who is taking advantage of the benefits.
The scope of the social analysis is to describe how costs and benefits of a specific transport project are distributed amongst the stakeholders involved.
The most straightforward approach is to yield a matrix, wherein costs and benefits are re-aggregated with respect to: users, producers, Government and non-users.
Other stakeholders’ classifications are obviously possible. Nevertheless, it is important to identify the most appropriate, according the project specific characteristics.
For cross-border projects, the analysis should take into consideration also the different geographical areas.

6/17/2014 IDEA II Project : Transport Dialogue and Networks Interoperability II Project funded by European Union DG DEVCO
69
Social analysis
Investment cost
Maintenance cost
Users Producer Fuel tax
revenues Environment
Global warming
Total
- 200 - 10 250 - 50 - 35 75 30 60
Item Stakeholders
Total Users Producer Government Non-users
Costs
Benefits
Total
The Government bears the investment costs.
The infrastructure is managed by an undertaking responsible for maintenance and operations.
Costs and benefits yielded (and with the proper sign) are shown in the table below.
0
250
250
- 60
0
- 60
- 235
0
- 235
0
105
105
- 295
355
60

6/17/2014 IDEA II Project : Transport Dialogue and Networks Interoperability II Project funded by European Union DG DEVCO
70
Calculate external costs as regards local pollutants, global warming and safety.
Introduce the value transfer methodology, whether necessary.
Perform a social analysis to inform on the distribution of costs and benefits within the community.
Third intermediate check list

6/17/2014 IDEA II Project : Transport Dialogue and Networks Interoperability II Project funded by European Union DG DEVCO
71
Appraisal optimism
The over-optimism issue
Why does exist a tendency to be over-optimistic about the estimation of key parameters, as:
• investment costs;
• operating costs;
• works duration;
• and benefits?
Because of different reasons, like:
• technical, new, or even unproven technologies;
• psychological, tendency to favour optimism;
• political, powers and institutions interests (lobbies);
• economic, construction sector and industrial interests.

6/17/2014 IDEA II Project : Transport Dialogue and Networks Interoperability II Project funded by European Union DG DEVCO
72
Appraisal optimism
Possible causes in the transport sector
1. Prior political commitment.
2. Overestimation of:
existing travel volumes;
population and economic growth rates;
new transport facility performance;
assets lives.
3. Full range of low cost “do-something else” options omitted performance of base case unrealistically poor.
4. Subsequent gold plating of the “do-something” option.
5. Underestimation of the reaction of rival transport operators and infrastructure owners.
6. Failure taking into account the slow build-up in demand.
7. Quantifiable cost excluded.
8. High valuation attached to scheme benefits.
9. Benefits counted twice, or even three times, in different parts of the appraisal.

6/17/2014 IDEA II Project : Transport Dialogue and Networks Interoperability II Project funded by European Union DG DEVCO
73
Appraisal optimism
Antidotes
• Acknowledge that a substantial risk of cost overrun exists;
• Take with grain of salt any traffic forecast, that does not explicitly take into account the risk of being very wrong;
• Expose projects to open scrutiny at public inquires;
• Sensitivity and risk analysis;
• Spend a lot more on ex-post evaluation.

6/17/2014 IDEA II Project : Transport Dialogue and Networks Interoperability II Project funded by European Union DG DEVCO
74
Appraisal optimism
Risk assessment
In order to achieve a reliable appraisal, it is important to assess what are the risks of the project under examination.
The risk assessment aims to identify the risks associated with a project.
It estimates the potential impacts of such risks and suggests measures that should be undertaken for preventing and mitigating them.
The methodology encompasses the following steps:
• sensitivity analysis (variable-by-variable changes of critical inputs, switching values);
• critical variables probability distribution (likelihood of occurrence of the values that a variable can assume);
• calculation of performance indicators’ distribution and evaluation of acceptable risk levels;
• risk mitigation and identification of strategies to lower them.

6/17/2014 IDEA II Project : Transport Dialogue and Networks Interoperability II Project funded by European Union DG DEVCO
75
Wrap-up framework
Environmental analysis (EIA)
Risk Assessment (sensitivity)
Investment and management
costs
ECONOMIC ANALYSIS
Social analysis (distribution)
Demand analysis and forecasts (modelling)
6/17/2014 IDEA II Project : Transport Dialogue and Networks Interoperability II Project funded by European Union DG DEVCO
76
Financial analysis
Overview
• the financial analysis is made on behalf of a single subject (individual, or organisation).
The analysis may be conducted from the viewpoint of the infrastructure manager, the transport service providers, etc. Clearly, the monetary flows to be considered vary according to the subjects involved.
• the purpose of the financial analysis is to evaluate the financial profitability of an investment in a project and its sustainability.
profitability: a project is profitable if it generates enough revenues to recover the investment and operating costs.
sustainability: the sustainability analysis aims to assess whether the project has any risk of running out of cash in the future.

6/17/2014 IDEA II Project : Transport Dialogue and Networks Interoperability II Project funded by European Union DG DEVCO
77
Financial analysis
Profitability analysis
The financial profitability analysis requires a project cash flow calculated on the basis of the differences in the costs and revenues between the scenario with the project and the scenario without the project.
The first step is the assessment of the project costs and revenues that should be considered during the reference period.
• in the investment costs evaluation, appraisers have to consider the overall sum of the components required to build transport infrastructures, the non-routine maintenance and replacement costs.
• the operating costs encompass the direct production costs (consumption of materials and services, personnel, ordinary maintenance, and general production costs), administrative and general expenditures, sales and distribution expenditures.

6/17/2014 IDEA II Project : Transport Dialogue and Networks Interoperability II Project funded by European Union DG DEVCO
78
Financial analysis
Profitability analysis
• For the calculation of the investment and operating costs the following elements should be excluded from the analysis:
any depreciation and amortisation;
any reserve for future replacement costs, or contingencies;
interest and debt reimbursements;
income, or other direct taxes;
VAT, where it is recoverable on costs.
• with regard to the cash inflows, transport projects may generate their own revenues from the sale of goods and services (for example, charges on railways and tolls on highways).
• revenues will be based on the demand forecasts for the services provided. For the sake of simplicity, prices are generally kept fixed over the years.

6/17/2014 IDEA II Project : Transport Dialogue and Networks Interoperability II Project funded by European Union DG DEVCO
79
Financial analysis
REMARK
It is important to remember that generally demand and price of a good or service are strictly interrelated and normally an increase in prices will result in a decrease in demand and vice versa.
Therefore whenever a new pricing scheme is considered in the financial analysis, it is necessary to go back to the demand forecast and estimate the new expected demand.
Not considering how changes of the prices affect the demand level is a common mistake in project appraisal that significantly distorts the results of the analysis.

6/17/2014 IDEA II Project : Transport Dialogue and Networks Interoperability II Project funded by European Union DG DEVCO
80
Financial analysis
Profitability analysis
For the calculation of the cash inflows the following elements should be excluded from the analysis:
• transfers or subsidies from the Government, as they are proceeds which are not strictly generated by the project;
• VAT on revenues, because this does not usually constitute an earning but is paid back to the Government;
• interest and debt reimbursements.

6/17/2014 IDEA II Project : Transport Dialogue and Networks Interoperability II Project funded by European Union DG DEVCO
81
Financial analysis
Profitability analysis: outflows, inflows and excluded items
• Outflow:
investment costs: land, buildings, equipment, extraordinary maintenance, licenses, patents, other pre-production expenses;
operating costs: raw materials, labour, electric power, maintenance, administrative costs, other operating outflows.
• Inflow:
total operating revenues and residual value.
• Excluded items:
Cost of financing: interests, loans and dividends;
Sources of financing: national public contribution, national private equity, loans, other resources (e.g., operating subsidies).

6/17/2014 IDEA II Project : Transport Dialogue and Networks Interoperability II Project funded by European Union DG DEVCO
82
Financial analysis
Profitability analysis
Example of cash flow
Items Years
1 2 3 4 5 6 7 8 9 10 Total operating revenues 20 30 40 40 50 50 50 Residual value 10 Total inflows 20 30 40 40 50 50 60 Operating costs - 8 - 14 - 18 - 18 - 20 -20 -20 Investment costs - 50 - 70 - 60 Total outflows - 50 - 70 - 60 - 8 - 14 - 18 - 18 - 20 -20 -20 Net cash flow - 50 - 70 - 60 12 16 22 22 30 30 40

6/17/2014 IDEA II Project : Transport Dialogue and Networks Interoperability II Project funded by European Union DG DEVCO
83
Financial analysis
Profitability analysis
• Once all costs and revenues have been valued, a decision criterion has to be applied. The indicators used for evaluating the financial performance of a project are:
the Financial Net Present Value (FNPV), and
the Financial Internal Rate of Return (FIRR).
• Cash flows occur during different years: in order to compare future and present cash flows it is necessary to discount back future cash flows, since one euro today has a higher value than one euro in the future;
• The FNPV is defined as the difference between the discounted value of the expected proceeds and the expected costs of the project.

6/17/2014 IDEA II Project : Transport Dialogue and Networks Interoperability II Project funded by European Union DG DEVCO
84
Financial analysis
Profitability analysis
It is possible to discount future monetary items and calculate their presents value multiplying such items by the discount factor:
at = (1 + r) – t
where t is the time and r is the discount rate applied.
Assuming the cash flow of the previous example, the following table applies the discounting methodology in obtaining the FNPV.
Items
Years
1 2 3 4 5 6 7 8 9 10
Time
0 1 2 3 4 5 6 7 8 9
Net cash flow - 50,0 - 70,0 - 60,0 12,0 16,0 22,0 22,0 30,0 30,0 40,0
at 1,00 0,95 0,91 0,86 0,82 0,78 0,75 0,71 0,68 0,64
Present cash flow (r = 5%) - 50,0 - 66,7 - 54,4 10,4 13,1 17,2 16,4 21,3 20,3 25,8
FNPV and FIRR - 46,5 and – 0,8%
6/17/2014 IDEA II Project : Transport Dialogue and Networks Interoperability II Project funded by European Union DG DEVCO
85
Financial analysis
Profitability analysis
In the framework of a profitability analysis attention is focused on the financial return on investment, measuring the capacity of the revenues to repay the investment and operating costs.
More specifically, the FNPV and the FIRR measure the performance of the investment independently of the sources or methods of financing.
Therefore, the results of the performance indicators do not constitute a definitive criterion for deciding whether to proceed with the project implementation or not.
They are useful for the next step, i.e. the analysis of the financial sustainability.

6/17/2014 IDEA II Project : Transport Dialogue and Networks Interoperability II Project funded by European Union DG DEVCO
86
Financial analysis
Sustainability analysis
A project is financially sustainable when it does not incur the risk of running out of cash in the future.
The crucial issue here is the timing of cash proceeds and payments.
• The condition for the financial sustainability of a project is that the cumulated net cash flow, i.e. the sum of the cash flows year by year, is never negative for all the years considered.
• All the cash flows related to the project implementation have to be considered for the financial sustainability and therefore also the sources of financing, debts reimbursements, interests, dividends and taxes.

6/17/2014 IDEA II Project : Transport Dialogue and Networks Interoperability II Project funded by European Union DG DEVCO
87
Financial analysis
Sustainability analysis: outflows and inflows
• Outflow:
investment costs: land, buildings, equipment, extraordinary maintenance, licenses, patents, other pre-production expenses;
operating costs: raw materials, labour, electric power, maintenance, administrative costs, other operating outflows;
cost of financing: interests, loans and dividends;
taxes.
• Inflow:
total operating revenues and residual value;
sources of financing: national public contribution, national private equity, loans and other resources (e.g., operating subsidies).

6/17/2014 IDEA II Project : Transport Dialogue and Networks Interoperability II Project funded by European Union DG DEVCO
88
Financial analysis
Sustainability analysis
• The main financing sources that can be considered are:
national public contribution (grants or capital subsidies at central, regional and local government level);
private capital;
other resources (e.g., IFI loans, loans from other lenders).
• For the sustainability analysis, a simple table should be produced showing the flow of project costs and their covering through a suitable combination of revenues and sources of financing.

6/17/2014 IDEA II Project : Transport Dialogue and Networks Interoperability II Project funded by European Union DG DEVCO
89
Financial analysis
Sustainability analysis
Example of cash flow
Items Years
1 2 3 4 5 6 7 8 9 10 National public contribution 40,0 20,0 30,0 0,0 0,0 0,0 0,0 0,0 0,0 0,0 National private capital 10,0 40,0 20,0 0,0 0,0 0,0 0,0 0,0 0,0 0,0 Loans 0,0 10,0 10,0 0,0 0,0 0,0 0,0 0,0 0,0 0,0 Other loans 0,0 0,0 0,0 0,0 0,0 0,0 0,0 0,0 0,0 0,0
Total financial resources 50,0 70,0 60,0 0,0 0,0 0,0 0,0 0,0 0,0 0,0 Total operating revenues 0,0 0,0 0,0 20,0 30,0 40,0 40,0 50,0 50,0 50,0 Residual value 0,0 0,0 0,0 0,0 0,0 0,0 0,0 0,0 0,0 10,0
Total inflow 50,0 70,0 60,0 20,0 30,0 40,0 40,0 50,0 50,0 60,0 Total operating costs 0,0 0,0 0,0 - 8,0 - 14,0 - 18,0 - 18,0 - 20,0 - 20,0 - 20,0 Total investment costs 50,0 70,0 60,0 0,0 0,0 0,0 0,0 0,0 0,0 0,0 Interests 0,0 0,0 0,0 - 0,6 - 0,5 - 0,4 - 0,2 - 0,1 0,0 0,0 Loans reimbursement 0,0 0,0 0,0 - 4,0 - 4,0 - 4,0 - 4,0 - 4,0 0,0 0,0 Taxes 0,0 0,0 0,0 - 3,0 - 4,0 - 6,0 - 6,0 - 9,0 - 9,0 - 9,0
Total outflows 50,0 70,0 60,0 -15,6 - 22,5 - 28,4 -28,2 - 33,1 - 29,0 - 29,0 Total cash flow 0,0 0,0 0,0 4,4 7,5 11,6 11,8 16,9 21,0 31,0 Cumulated cash flow 0,0 0,0 0,0 4,4 11,9 23,5 35,3 52,2 73,2 104,2

6/17/2014 IDEA II Project : Transport Dialogue and Networks Interoperability II Project funded by European Union DG DEVCO
90
Reference
Experts can consolidate knowledge on these topics reading through the TRACECA Appraisal Manual.
• Theory
• Exercises
• Case studies.

Getting more chances: 10 golden rules
• Projects attractive to investors are:
• Well documented • Mature • Reasonable execution times • Financially profitable
6/17/2014 IDEA II Project : Transport Dialogue and Networks Interoperability II Project funded by European Union DG DEVCO
91
What to do?
1. Increase the quality of projects’ description: investors need complete and accurate information to justify their decision. Provide them with it.

Getting more chances: 10 golden rules
2. Increase the quality of projects’ presentation and promotion: your project will be in competition with others. Presenting and promoting it at the best could make the difference. Exercise an elevated level of cooperation and mandate your institutions to take on a promotional role.
3. Stimulate the interest in the private sector: involve the private investors from the appraisal stage to implementation.
6/17/2014 IDEA II Project : Transport Dialogue and Networks Interoperability II Project funded by European Union DG DEVCO
92

Getting more chances: 10 golden rules
4. Look not only at major projects, but consider also smaller interventions with high regional potential (e.g. border crossings enhancing, bottlenecks removal etc.)
5. Concentrate on projects of regional value: the TIF is a TRACECA initiative, emphasizing the TRACECA approach (regional multimodal etc.) makes projects more attractive.
6. Put more emphasis on environmental aspects: more and more investors take into account environmental risks in their investment strategies. Increase the attractiveness of your project with a qualified EIA study.
6/17/2014 IDEA II Project : Transport Dialogue and Networks Interoperability II Project funded by European Union DG DEVCO
93

Getting more chances: 10 golden rules
7. Put more emphasis on clarifying the legal and regulatory framework for the realization of intervention: investors need to have a clear knowledge of the legal and regulatory environment they will operate in.
8. If needed, start preparing regulatory and legal frameworks to enable the realization of your project as soon as possible.
9. Strengthen the relationship with stakeholders in your country: investors are more favourable to projects with a strong support and national commitment.
6/17/2014 IDEA II Project : Transport Dialogue and Networks Interoperability II Project funded by European Union DG DEVCO
94

Getting more chances: 10 golden rules
… and
10. Ask the IDEA team!
6/17/2014 IDEA II Project : Transport Dialogue and Networks Interoperability II Project funded by European Union DG DEVCO
95
The IDEA team is at your disposal for
supporting your successful preparation in
view of the next TIF2015.

6/17/2014 IDEA II Project : Transport Dialogue and Networks Interoperability II Project funded by European Union DG DEVCO
96
THANK YOU FOR YOUR ATTENTION
Contacts [email protected]