Embed Size (px)
Citation preview

I
-
., • • - ..
•
, .
-
-
•
. .
. .
,
-
•
. '
. ,.
,
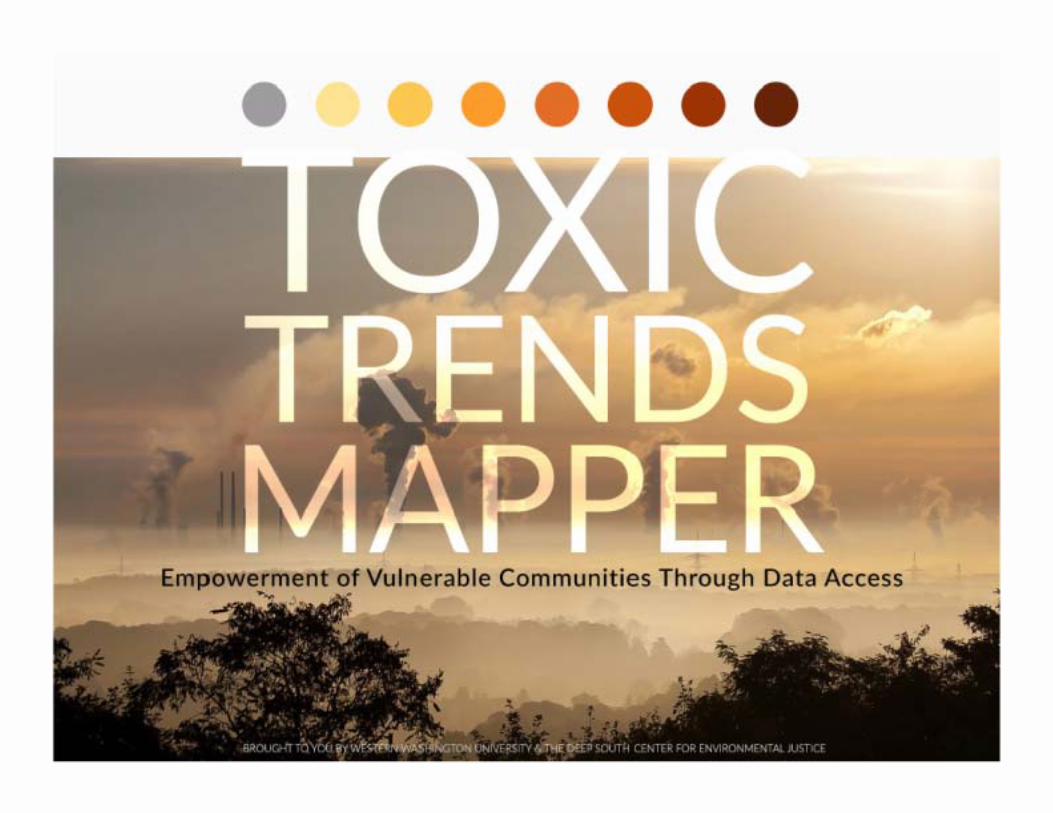
TOXIC TRENDS MAPPER THERE ARE CURRENTLY 17.000 FACILITIES REPORTING TO TRI AND VIEWABLE IN THE WEB MAP
..
This web map visually represents industrial air pollution information to citizens across the United States by mapping
the relative risk from air pollution that industrial facilities pose to the human health of their communities and how
those risks might change over time. Facility pollution information comes from the Toxic Release Inventory (TRI).
an inventory by the United States Environmental Protection Agency (EPA) and the States to collect data annually on releases and transfers of certain toxic chemicals from industrial facilities.
To allow residents living in vulnerable communities access to a data source that will help monitor chemical releases. assess health impacts. communicate potential risks.
and help residents advocate for improved local. state. and national policies.
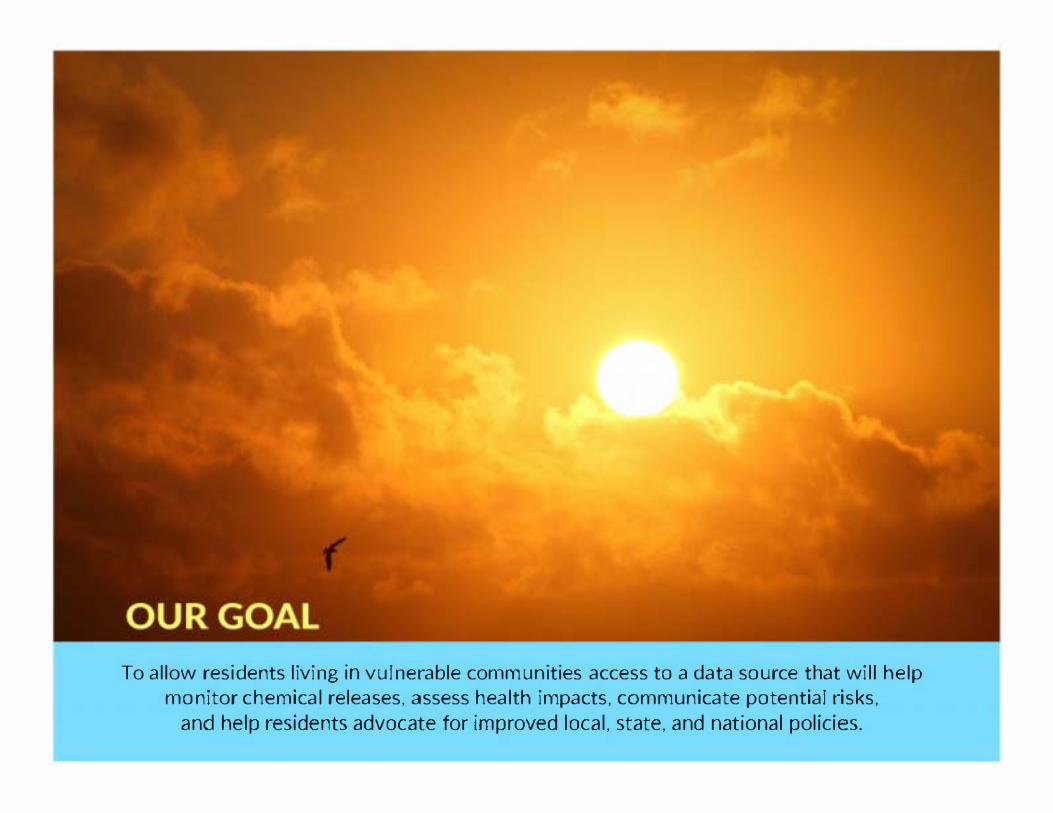
The Earth's climate has changed throughout history. Just in the last 650,000 years there have been seven cycles of glacial advance and retreat. with the abruPt end of the last ice age about 7,000 years ago marking the beginning of the
modern climate era - and of human civilization?
"
rvv
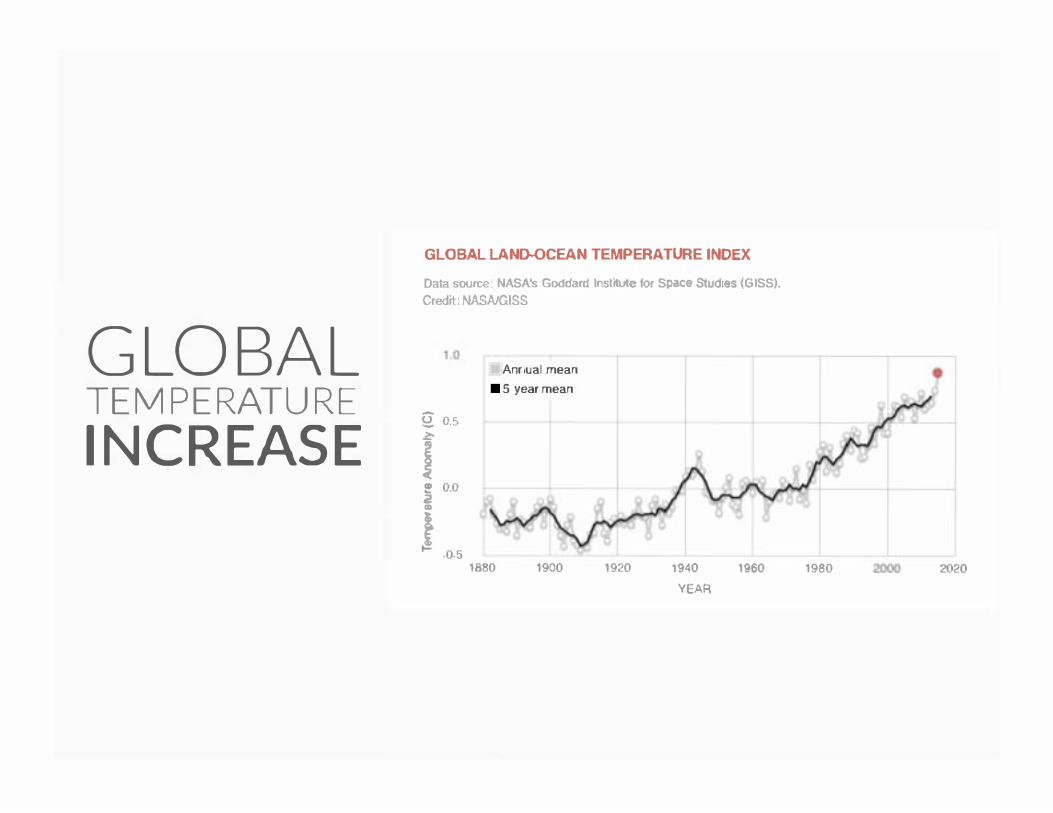
• GLOBAL TEMPERATURE
INCREASE
GLOBAL LAN()'()cEAN TEMPERATURE INDEX
Data source. NASA'$ Goddard InslrtUl8lor Space StudoeIIGISS). Credd NASAIGISS
AIvlual mean •S year mean
Q: 0.5
I ! 0.0
i t= .{).5
, "'" "'" 1940 >EM
''''' "'" """
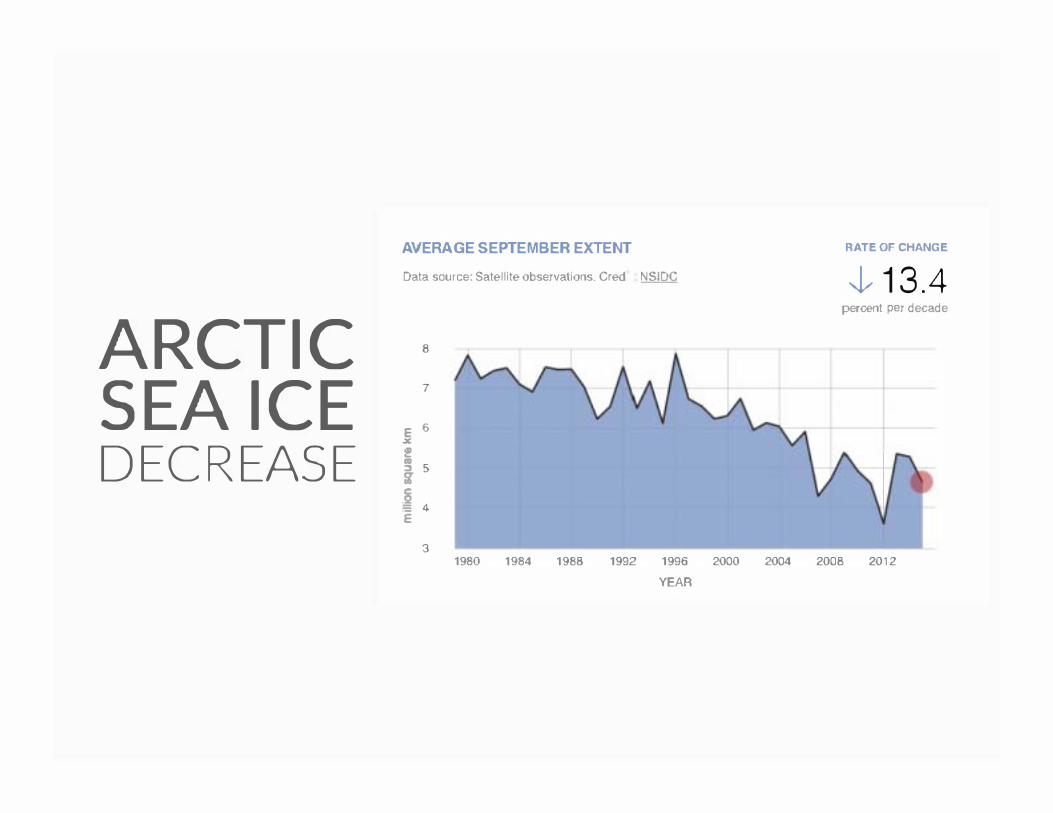
AVERAGE SEPTEMBER EXTENT
Data source: Satel te observations_ CredIt
,ARCTIC SEA ICE
,
•
DECREASE ;
I
,
' i , ,
,
RATE OF CHANGE
+ 13.4 percent f>l!r decade
.oM ,, ,, 1992 ,,% """ """ "'''
"A'
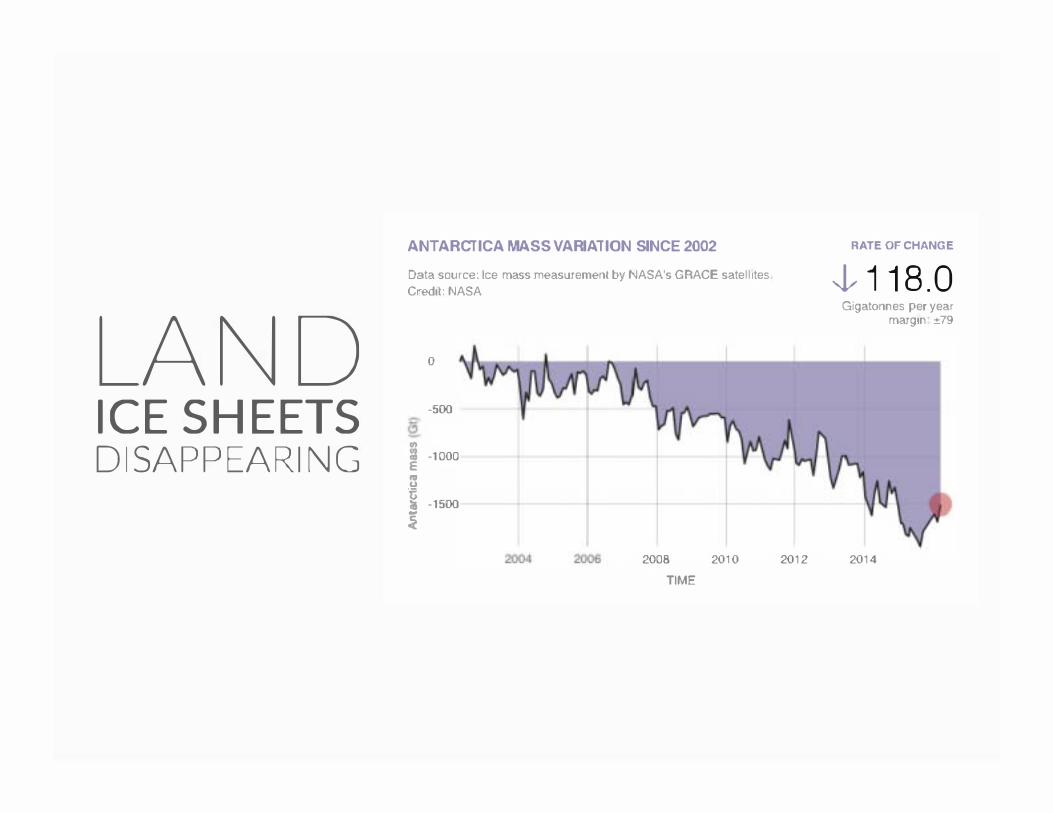
LAND ICE SHEETS DISAPPEARI NG
ANTARCTICA MASS VARIATION SINCE 2002
Data source: Ice mass measurement by NASA's GRACE satellotes
Credo' NASA
•
• ,
i
0
.
. ,=
.,
-
TIME
"''' "'''
RATE OF CHANGE
+ 1 18.0 Gigatonnes per year
marg'" .,79
"'''
t !OO
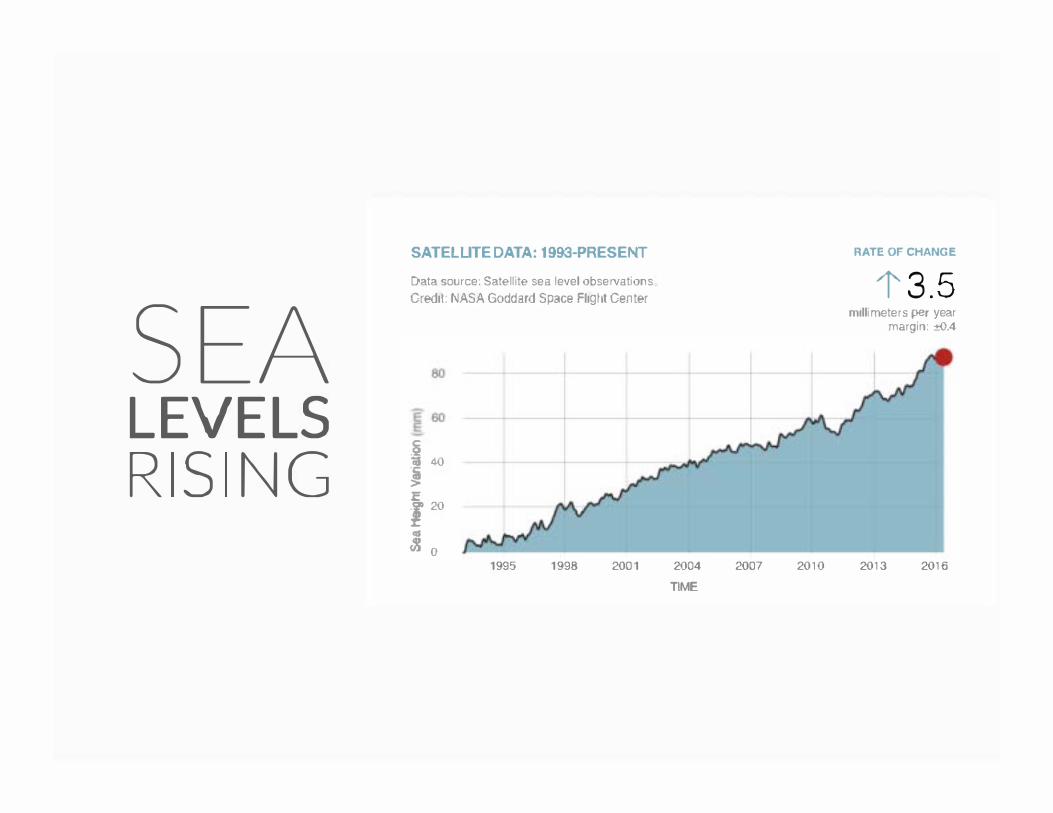
+ SEA LEVELS RS NG
SATELLITE DATA: 1993-PRESENT
Data source: SatelUte sea level observations
Credit NASA Goddard Space Flight Center
I>
f ro
•
, 1995 1998 , """ , row
TIME
RATE OF CHANGE
l'3.5 millimeter" per year
m3fgin: ±O.4
roB ro"

•
AVAILABILITY HEURISTICS
A mental shortcut that relies on immediate examples that come
to mind. When making a decision, a number of related events
or situations might immediately spring to the forefront
of your thoughts,
OUR CURRENT GLOBAL ENVIRONMENTAL PROBLEM HAS NO PRECEDENCE OR RELATED SITUATION MAKING
IT DIFFICULT TO SOLVE
HEURISTICS CHANGE THE WORLD
SMOKE SIGNALS" DIGITAL SIGNALS
..... "
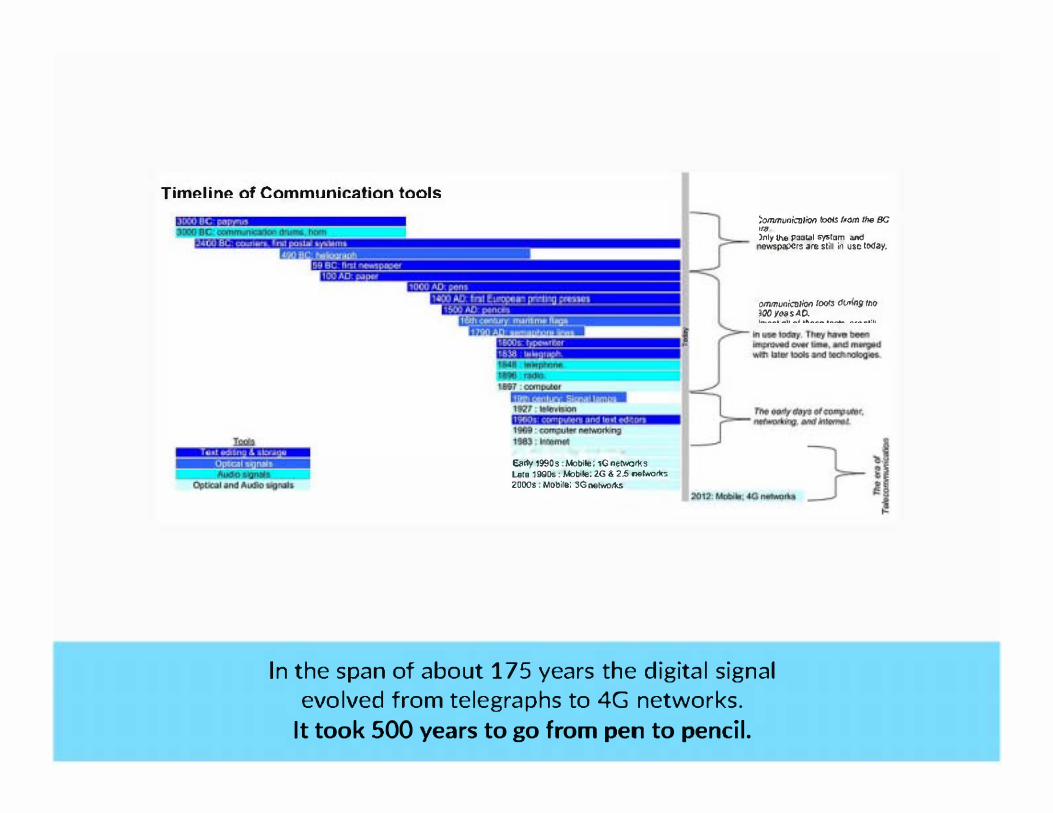
Timeline of Communication tools
,,,,,,,,,,,-:'G_Eo<ty,m.,_,'G_.'--' ,_:2<,l&2-" .. _
2«IOs: "-: :IG_
""'" ,""" "'" Be -"",,,'" poo,," .,.,om ...
........... ,,- .
""", ,.. ,goo,.... -.0. _.<11 ...._ ......
In the span of about 175 years the digital signal
evolved from telegraphs to 4G networks.
It took 500 years to go from pen to pencil.
ebY -
lee;:;;,
Om;j\fu armtzon -• Coogle
d HOtrnaa
amazon
YDuD
flickr
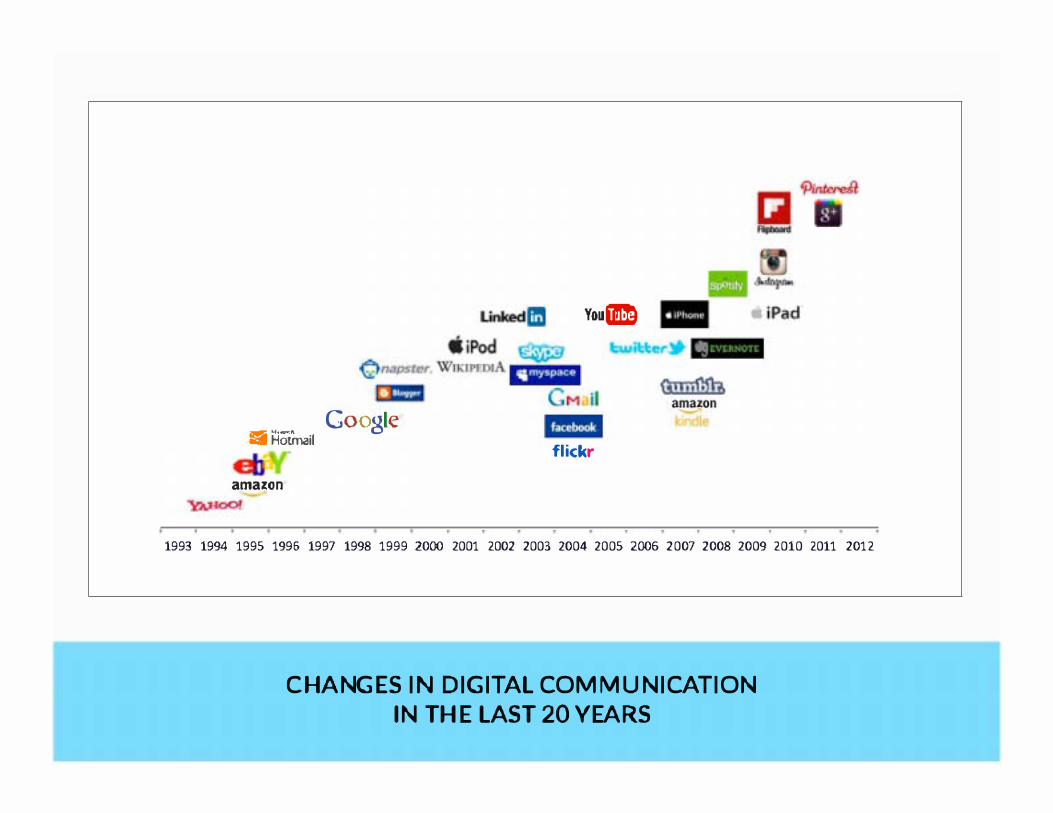
1993 1994 1995 1996 1997 1998 1999 2000 2001 2002 2003 2004 2005 2006 2007 2008 2009 2010 2011 2012
CHANGES IN DIGITAL COMMUNICATION
IN THE LAST 20 YEARS
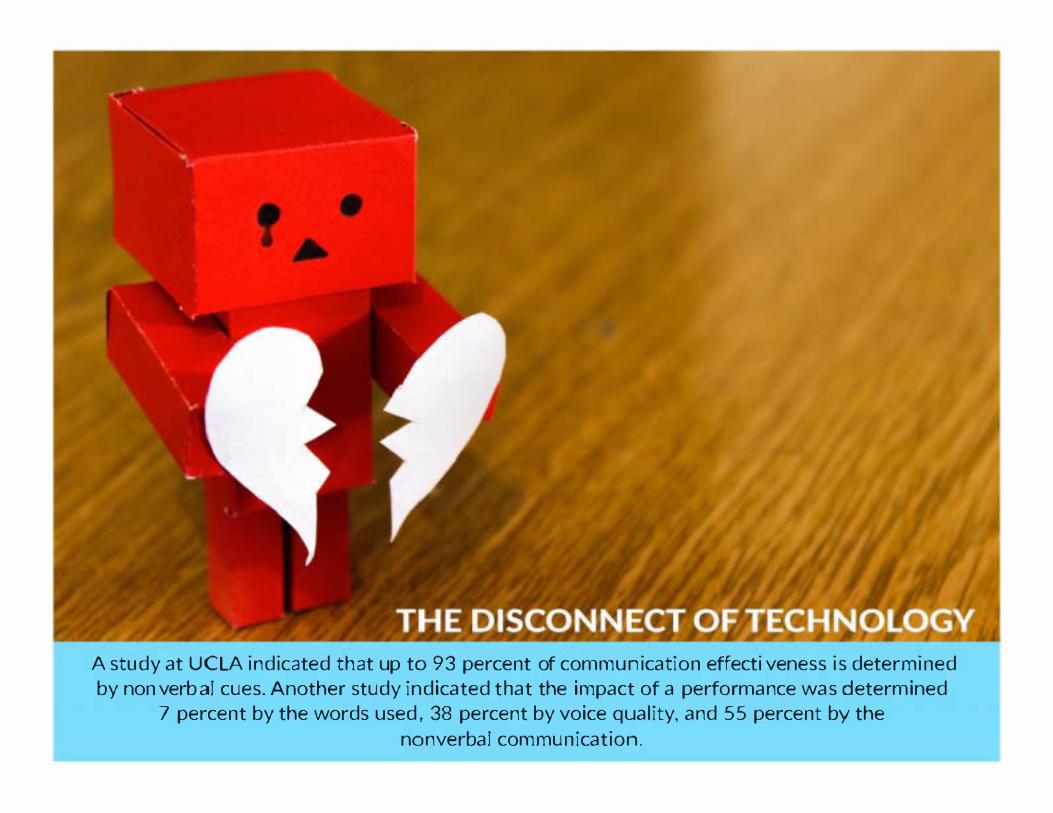
A study at UCLA indicated that up to 93 percent of communication effectiveness is determined by nonverbal cues. A nother study indicated that the impact of a performance was determined
7 percent by the words used, 38 percent by voice quality, and 55 percent by the
nonverbal communication.


.CX:1GL£
Consumer behavior has changed forever. Today's battle for hearts, minds, and dollars
is won (or lost) in micro-moments-intent-driven moments of decision-making and preference-shaping that occur throughout the entire consumer journey.
[· £Df1 KH ,-,r< 2016


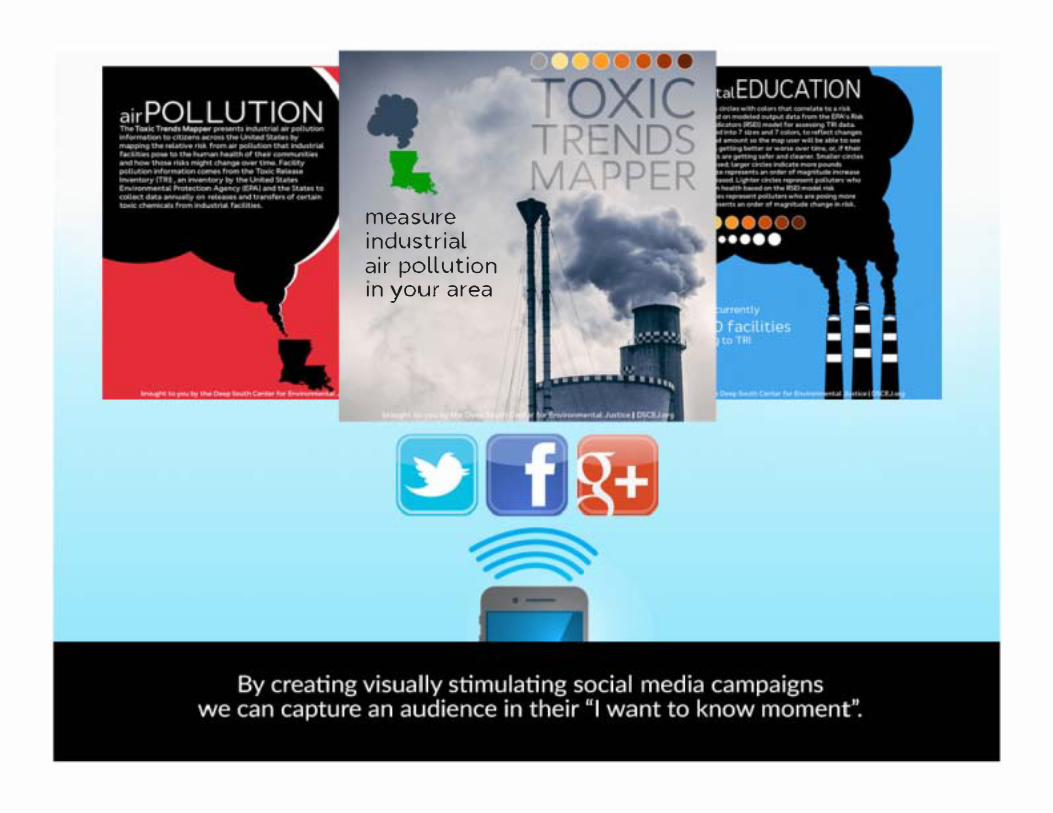
measure industrial air pollution In your area


![Bayesian estimations of strong toxic signals [compatibility mode]](https://img.pdfslide.us/doc/110x75/559f6e811a28ab0c068b4603/bayesian-estimations-of-strong-toxic-signals-compatibility-mode.jpg)