Embed Size (px)
Citation preview
RESEARCH Open Access
Topoisomerase II beta interacts withcohesin and CTCF at topological domainbordersLiis Uusküla-Reimand1,2†, Huayun Hou1,3†, Payman Samavarchi-Tehrani4, Matteo Vietri Rudan5, Minggao Liang1,3,Alejandra Medina-Rivera1,13, Hisham Mohammed6,10, Dominic Schmidt6,11, Petra Schwalie7,12, Edwin J. Young1,Jüri Reimand8,9, Suzana Hadjur5, Anne-Claude Gingras3,4 and Michael D. Wilson1,3*
Abstract
Background: Type II DNA topoisomerases (TOP2) regulate DNA topology by generating transient double strandedbreaks during replication and transcription. Topoisomerase II beta (TOP2B) facilitates rapid gene expression andfunctions at the later stages of development and differentiation. To gain new insight into the genome biology ofTOP2B, we used proteomics (BioID), chromatin immunoprecipitation, and high-throughput chromosomeconformation capture (Hi-C) to identify novel proximal TOP2B protein interactions and characterize the genomiclandscape of TOP2B binding at base pair resolution.
Results: Our human TOP2B proximal protein interaction network included members of the cohesin complex andnucleolar proteins associated with rDNA biology. TOP2B associates with DNase I hypersensitivity sites, allele-specifictranscription factor (TF) binding, and evolutionarily conserved TF binding sites on the mouse genome. Approximatelyhalf of all CTCF/cohesion-bound regions coincided with TOP2B binding. Base pair resolution ChIP-exo mapping ofTOP2B, CTCF, and cohesin sites revealed a striking structural ordering of these proteins along the genome relative tothe CTCF motif. These ordered TOP2B-CTCF-cohesin sites flank the boundaries of topologically associating domains(TADs) with TOP2B positioned externally and cohesin internally to the domain loop.
Conclusions: TOP2B is positioned to solve topological problems at diverse cis-regulatory elements and its occupancyis a highly ordered and prevalent feature of CTCF/cohesin binding sites that flank TADs.
Keywords: Topoisomerase II beta, CTCF, Cohesin, BioID, ChIP-seq, ChIP-exo, Hi-C, Comparative genomics, Proteomics,Topological associated domains, DNA supercoiling, Genome organization
BackgroundThe type II topoisomerase (TOP2) enzymes resolve DNAtopology problems in core biological processes such astranscription, replication, recombination, DNA repair,chromatin remodeling, chromosome condensation, andsegregation [1–3]. TOP2 enzymes catalyze and rejointransient DNA double-stranded breaks (DSB) by allowingone of the duplex DNA strands to pass through the other
[1–3]. Vertebrates possess two TOP2 genes, TOP2A andTOP2B, that originate from an ancestral gene duplicationevent [4, 5]. TOP2A and TOP2B are not functionally re-dundant despite their structural and catalytic similarities[6]. TOP2A is expressed in proliferating cells [7, 8] andknocking out Top2a in mice leads to defects in nucleardivision and early embryonic lethality [9–11]. In contrast,TOP2B is ubiquitously expressed and is upregulatedduring cellular differentiation [7].The full knockout of Top2b in mice leads to perinatal
lethality mediated by defects in neuronal differentiation[12]. Conditional Top2b mouse knockout studies havedemonstrated TOP2B’s importance during retinal devel-opment [13] and ovulation [14]. Studies using TOP2
* Correspondence: [email protected]†Equal contributors1Genetics and Genome Biology Program, SickKids Research Institute, Toronto,ON, Canada3Department of Molecular Genetics, University of Toronto, Toronto, ON,CanadaFull list of author information is available at the end of the article
© 2016 The Author(s). Open Access This article is distributed under the terms of the Creative Commons Attribution 4.0International License (http://creativecommons.org/licenses/by/4.0/), which permits unrestricted use, distribution, andreproduction in any medium, provided you give appropriate credit to the original author(s) and the source, provide a link tothe Creative Commons license, and indicate if changes were made. The Creative Commons Public Domain Dedication waiver(http://creativecommons.org/publicdomain/zero/1.0/) applies to the data made available in this article, unless otherwise stated.
Uusküla-Reimand et al. Genome Biology (2016) 17:182 DOI 10.1186/s13059-016-1043-8
poisons have implicated TOP2B in spermatogenesis[15–17] and lymphocyte activation [18]. In contrast tothese functional insights, the conditional ablation ofTOP2B in the adult heart resulted in few significantgene expression changes [19]. Despite the growing num-ber of tissues and developmental processes that requireTOP2B, the mechanisms by which this ubiquitous pro-tein facilitates tissue-specific developmental processesare still not well understood.It has been proposed that TOP2B’s role in develop-
ment involves the activation or repression of specific de-velopmental genes [20, 21]. Human TOP2B is requiredfor the activation of hormone sensitive genes throughthe generation of transient double-stranded DNA breaksat the promoter region [20, 22]. Most recently, TOP2B-generated DSBs have been shown to be essential for theactivation of early response genes by neurotransmitters[23]. Moreover, TOP2B has also been implicated in theexpression of long genes, presumably through its abilityto resolve positive supercoiling that arises during tran-scription [24].TOP2B is also actively studied in the context of can-
cer. For example, TOP2B-mediated cleavage occurs atknown chromosomal breakpoints in prostate cancer [25]and has been observed near translocation breakpoints inleukemia [26]. TOP2 proteins are prominent targets ofmany widely used chemotherapy agents including doxo-rubicin, etoposide, and mitoxantrone [27]. However,these chemotherapeutic agents can cause secondary ma-lignancies in non-neoplastic tissues (reviewed in [28]).Whereas TOP2A is the intended target of these widelyused chemotherapeutic agents, mechanistic studies incell lines and animal models show that TOP2B-mediatedDNA cleavage is an important player in treatment-related malignancies [19, 25, 29]. Intriguingly, heart-specific ablation of TOP2B significantly reduced thecardiotoxicity that normally occurs from doxorubicintreatment [19].Identifying the protein–protein and protein–DNA in-
teractions of TOP2B is essential for understanding itsroles in development, transcription, and cancer. Here wereport a comprehensive proximal protein interactionnetwork for TOP2B that includes several members of thecohesin complex. Using ChIP-seq and ChIP-exo in com-bination with high-throughput chromosome conform-ation capture (Hi-C) data, we find that TOP2B interactswith CTCF and the cohesin complex with a distinct spatialorganization at the borders of long-range chromosomaldomain structures.
ResultsTOP2B interacts with CTCF and the cohesin complexWe first set out to characterize a TOP2B protein–pro-tein interaction network. Topoisomerases are large and
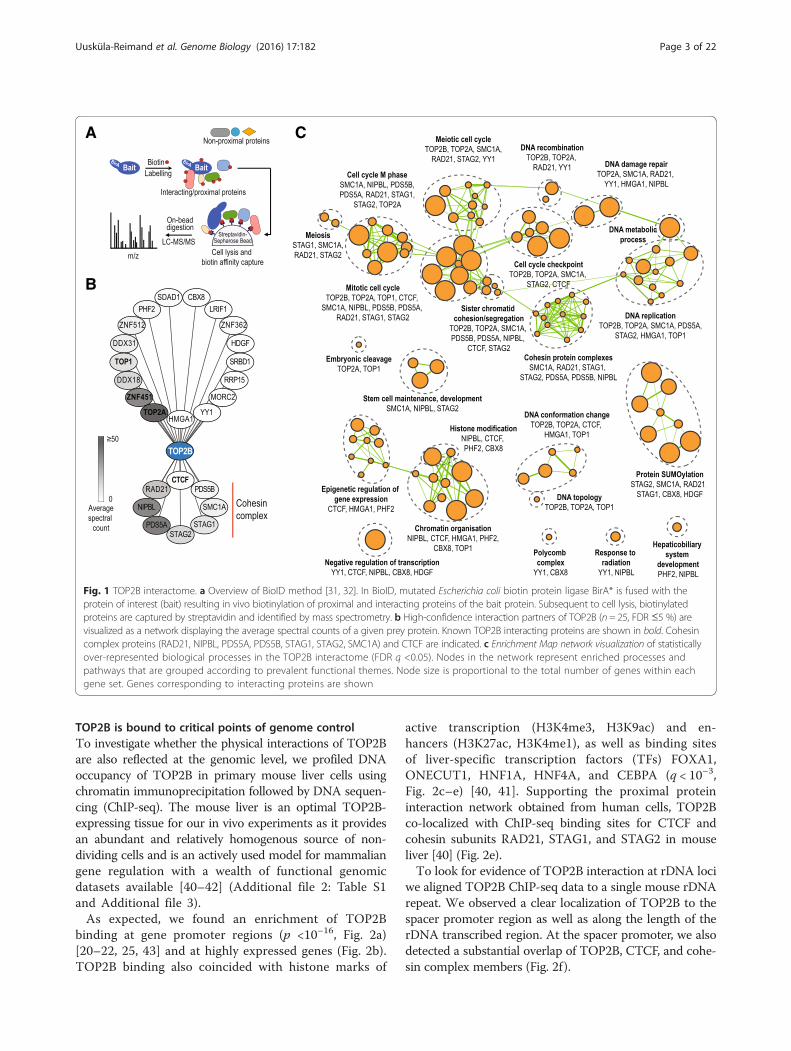
relatively insoluble proteins [30] that present challengesfor classical affinity purification. To circumvent theseproblems, we employed BioID, an in vivo interactionmapping approach in which a bait protein of interest isfused to a modified biotin ligase enzyme (BirA*) that leadsto covalent biotinylation of proteins in close proximity tothe expressed proteins (Fig. 1a). Biotinylated proteins canbe recovered under high stringency lysis and washes con-ditions (detergents, salt, DNA shearing) that would notnormally be compatible with native purification (Fig. 1a).BioID also provides increased sensitivity over standard pu-rifications by enabling recovery of both the direct physicalinteraction partners of the protein of interest as well as itsvicinal proteins in live cells and has been used previouslyto detect novel chromatin associated complexes [31, 32]).We performed BioID in HeLa cells with a TOP2B bait
protein tagged with a N-terminal BirA*-FLAG tag (n = 6).Control experiments involved parental cells (no BirA*), aBirA*-FLAG fused to green fluorescent protein (GFP-bait), and a BirA*-FLAG tag fused to a nuclear localizationsignal (NLS-bait) (see “Methods”). Mass spectrometryrevealed 737 proteins with at least two unique peptidesfor the TOP2B bait (Additional file 1). We detected 25high confidence interaction partners for TOP2B (SAINTBayesian false discovery rate (FDR) ≤5 %); Fig. 1b,Additional file 1).Supporting the sensitivity of the BioID method, we re-
covered several previously known interaction partners ofTOP2B: TOP2A forms active heterodimers with TOP2Bin HeLa cells [33]; TOP1 forms the DNA synthesomecomplex with TOP2B during DNA replication [34]; CTCFhas been previously shown to interact with TOP2B in hu-man breast cancer cell lines [35]; and ZNF451, a Smad3/4transcriptional co-repressor [36] has been previously co-purified with TOP2B using tandem affinity purificationmass-spectrometry [37]. Although we did not detect sig-nificant interactions with HMGB1 (FDR = 17 %) impli-cated in TOP2B-mediated transcriptional regulation [22],we identified a canonical high mobility group (HMG) fam-ily member HMGA1 and an HMG-like protein HDGF[38], as well as additional 19 novel TOP2B interactingproteins (FDR ≤5 %; Fig. 1b). TOP2B is known to localizeto the nucleolus [39] and our BioID experiments revealednovel interactions of TOP2B with known nucleolar pro-teins involved in rDNA gene regulation (DDX18, DDX31,SDAD1, RRP15). Also among the novel TOP2B interac-tions were several cohesin subunits (RAD21, STAG1,STAG2, SMC1A) and cohesin-associated proteins (NIPBL,PDS5A, PDS5B; Fig. 1b, c, Additional file 1). The specifi-city of the CTCF and cohesin enrichments in TOP2Bover the controls were confirmed by repeating thebiotin labeling and capture experiments followed bywestern blot using antibodies against RAD21 and CTCF(Additional file 2: Figure S1).
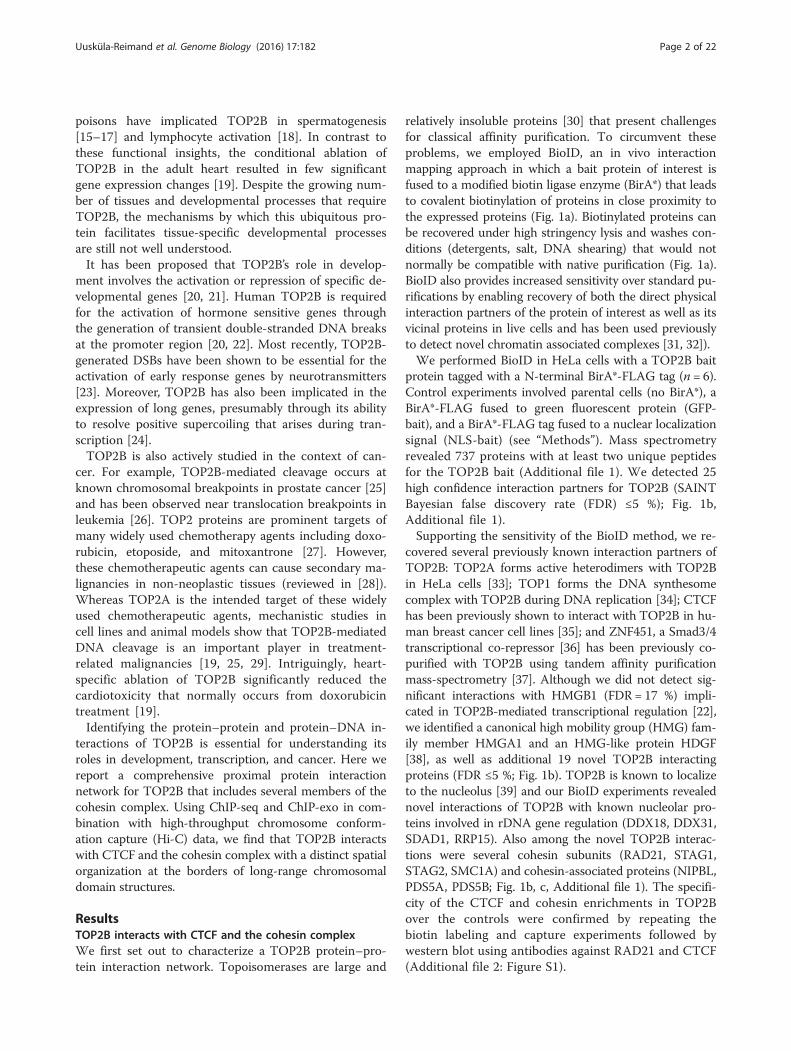
Uusküla-Reimand et al. Genome Biology (2016) 17:182 Page 2 of 22
TOP2B is bound to critical points of genome controlTo investigate whether the physical interactions of TOP2Bare also reflected at the genomic level, we profiled DNAoccupancy of TOP2B in primary mouse liver cells usingchromatin immunoprecipitation followed by DNA sequen-cing (ChIP-seq). The mouse liver is an optimal TOP2B-expressing tissue for our in vivo experiments as it providesan abundant and relatively homogenous source of non-dividing cells and is an actively used model for mammaliangene regulation with a wealth of functional genomicdatasets available [40–42] (Additional file 2: Table S1and Additional file 3).As expected, we found an enrichment of TOP2B
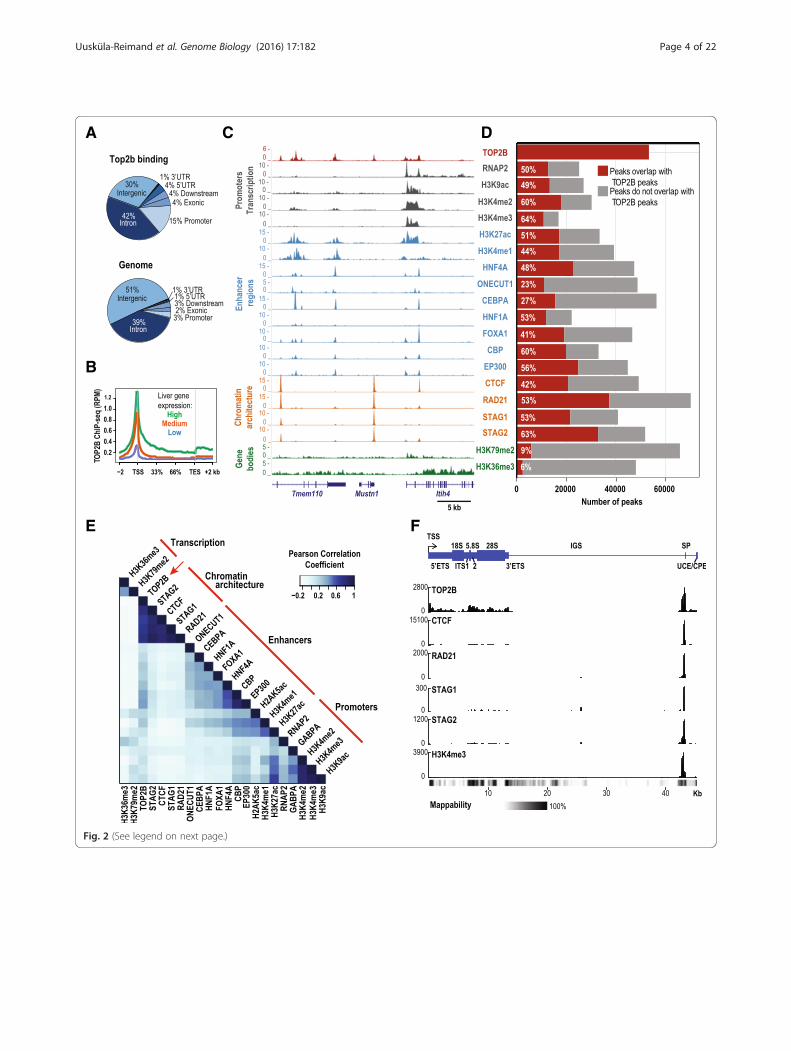
binding at gene promoter regions (p <10–16, Fig. 2a)[20–22, 25, 43] and at highly expressed genes (Fig. 2b).TOP2B binding also coincided with histone marks of
active transcription (H3K4me3, H3K9ac) and en-hancers (H3K27ac, H3K4me1), as well as binding sitesof liver-specific transcription factors (TFs) FOXA1,ONECUT1, HNF1A, HNF4A, and CEBPA (q < 10–3,Fig. 2c–e) [40, 41]. Supporting the proximal proteininteraction network obtained from human cells, TOP2Bco-localized with ChIP-seq binding sites for CTCF andcohesin subunits RAD21, STAG1, and STAG2 in mouseliver [40] (Fig. 2e).To look for evidence of TOP2B interaction at rDNA loci
we aligned TOP2B ChIP-seq data to a single mouse rDNArepeat. We observed a clear localization of TOP2B to thespacer promoter region as well as along the length of therDNA transcribed region. At the spacer promoter, we alsodetected a substantial overlap of TOP2B, CTCF, and cohe-sin complex members (Fig. 2f).
A
B
C
Fig. 1 TOP2B interactome. a Overview of BioID method [31, 32]. In BioID, mutated Escherichia coli biotin protein ligase BirA* is fused with theprotein of interest (bait) resulting in vivo biotinylation of proximal and interacting proteins of the bait protein. Subsequent to cell lysis, biotinylatedproteins are captured by streptavidin and identified by mass spectrometry. b High-confidence interaction partners of TOP2B (n = 25, FDR ≤5 %) arevisualized as a network displaying the average spectral counts of a given prey protein. Known TOP2B interacting proteins are shown in bold. Cohesincomplex proteins (RAD21, NIPBL, PDS5A, PDS5B, STAG1, STAG2, SMC1A) and CTCF are indicated. c Enrichment Map network visualization of statisticallyover-represented biological processes in the TOP2B interactome (FDR q <0.05). Nodes in the network represent enriched processes andpathways that are grouped according to prevalent functional themes. Node size is proportional to the total number of genes within eachgene set. Genes corresponding to interacting proteins are shown
Uusküla-Reimand et al. Genome Biology (2016) 17:182 Page 3 of 22
A
B
E F
C D
Fig. 2 (See legend on next page.)
Uusküla-Reimand et al. Genome Biology (2016) 17:182 Page 4 of 22
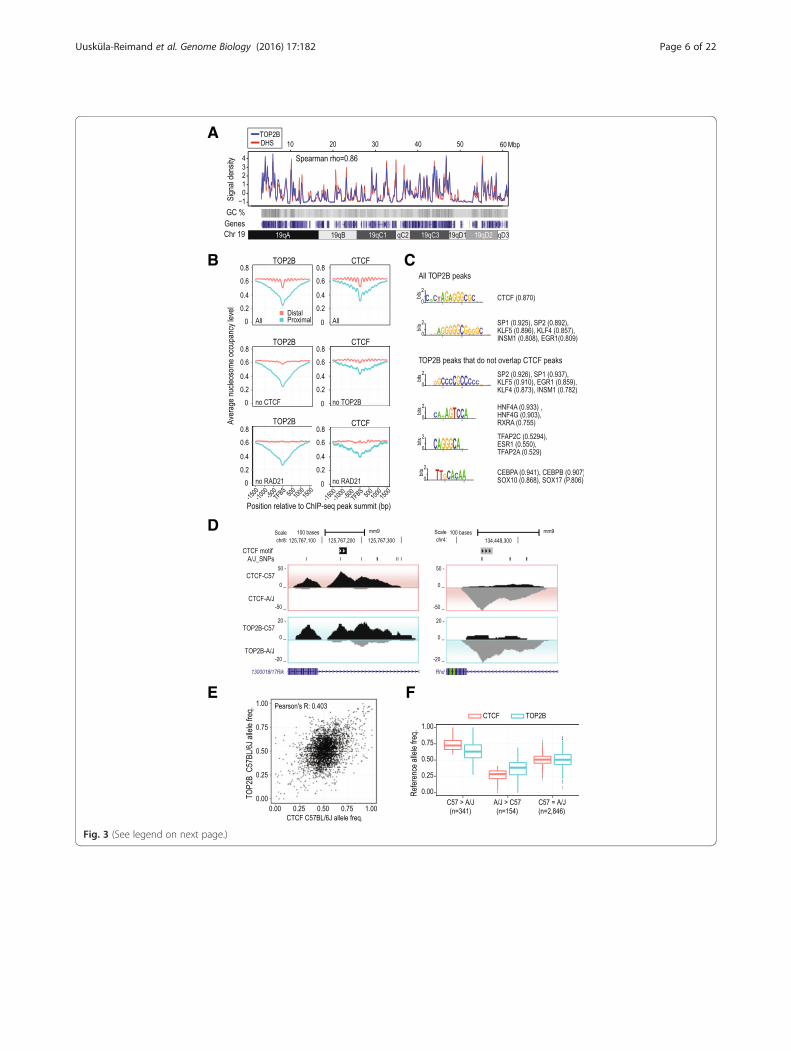
Given its broad correlation with several actively regu-lated epigenetic marks and TF binding sites, we askedwhether TOP2B’s occupancy at gene promoters, en-hancers, and CTCF sites generally reflects its bindingpreference for open chromatin. Using deeply sequencedmouse liver DNase I hypersensitivity (DHS) data [44],we found a strong correlation of TOP2B binding andDHS signal profiles (Spearman ρ = 0.8, p <10–16; Fig. 3a,Additional file 2: Table S2). This correlation of DHS andTOP2B ChIP-seq signal was stronger than observed forany of the 20 factors we tested (Additional file 2: Table S2).Consistent with its preference for DHS regions, we
find that TOP2B occupancy is enriched at nucleosome-free regions delineated by MNase-seq experimentsperformed in mouse liver [45]. Specifically, nucleosomepositioning relative to TOP2B peak summits found atproximal promoters (<1 kb from nearest TSS) is similarto what we observed for several TFs (Fig. 3b, Additionalfile 2: Figure S2). At distal TOP2B binding summits(>1 kb from nearest TSS), we found a periodic nucleo-some occupancy pattern that closely resembled the nu-cleosome profiles around CTCF and RAD21 summits(Fig. 3b, Additional file 2: Figure S2). As CTCF stronglyinfluences nucleosome positioning [46, 47], we analyzednucleosome positioning around distal CTCF peak sum-mits that did not overlap TOP2B peaks. The amplitudeof periodic nucleosome occupancy around these non-TOP2B CTCF sites was clearly reduced suggesting thatTOP2B occupancy is a biochemical feature of CTCFbinding sites showing strong nucleosomal positioning(Fig. 3b).
TOP2B DNA occupancy is influenced by TF bindingNext, we characterized the sequence properties ofTOP2B bound regions using de novo motif discovery(see “Methods”). The most abundant motif recoveredclosely resembled the CTCF motif and was identified at~17 % of TOP2B binding sites (Fig. 3c, Additional file 4).
Two recent studies also identified an enrichment of CTCFmotifs at TOP2B binding sites in mouse neurons [23] andin human MCF7 cells [48] demonstrating that CTCFmotifs are a common feature of TOP2B occupied re-gions in multiple tissues. In addition, we repeated thede novo motif discovery after excluding joint bindingsites of TOP2B and CTCF. We also recovered motifssimilar to tissue-enriched factors HNF4A and CEBPA,as well as ESR1 which was previously reported as beingenriched in MCF7 TOP2B ChIP-seq [48] data. These datacollectively show that motifs of tissue-enriched TFs arealso a common feature of TOP2B binding (Fig. 3c,Additional file 4).To gain insight into whether changes in sequence spe-
cific TF binding correlate with the binding of TOP2B,we analyzed the allele-specific binding of CTCF, HNF4A,and TOP2B obtained from ChIP-seq experiments inlivers from F1 mice (C57BL6/J female × A/J male) (Fig. 3d).We found that the ratio of allele-specific TOP2B ChIP-seqreads (shown as C57BL6/J allele frequency) correlates withthe ratio of allele-specific CTCF ChIP-seq reads (r = 0.403,p <10–16) (Fig. 3e). We identified 495 CTCF/TOP2B co-bound sites with significant allele-specific bias of CTCFreads (binomial p value <0.05, see “Methods” for details)(Fig. 3f). At these sites, TOP2B and CTCF showed prefer-ence for the same allele and the allelic ratios of CTCFand TOP2B ChIP-seq reads were significantly skewedcompared to CTCF/TOP2B sites with no allele specificCTCF binding (p <10–16, one-sided Wilcoxon rank sumtest; Fig. 3f ). Similarly, the allele specificity of TOP2Band HNF4A was also correlated at HNF4A/TOP2Bbound sites (r = 0.546, p <10–16) (Additional file 2:Figure S3). In summary, although TOP2B has previ-ously been suggested to have a DNA binding motif[49], we instead propose a model where TOP2B inter-acts with DNA that is actively bound by a variety ofsequence-specific TFs without the need for specific motifrecognition sequences.
(See figure on previous page.)Fig. 2 Genomic annotation of TOP2B binding sites in mouse liver. a Genome-wide distribution of TOP2B binding sites compared to the generaldistribution of mouse genomic regions. Promoter regions were defined as 3 kb upstream from transcription start site (TSS); downstream is definedas 3 kb from transcription end site (TES). b Aggregate TOP2B liver ChIP-seq read density (x-axis) across liver-expressed genes separated into high,medium, and low expression categories (y-axis). ChIP-seq read density is shown as reads per million mapped reads (RPM). c Genome browserview for ChIP-seq signal tracks for TOP2B and a variety of liver-enriched TFs, members of the cohesin complex and histone modifications (y-axis,RPM). d Fraction of peaks for various factors that overlap TOP2B peaks (red bars) (p values <10–16). e Hierarchical clustering of genome-wide bindingintensities (reads per kilobase per million mapped reads (RPKM)) for TOP2B and a variety of factors. Color intensity represents pair-wise Pearsoncorrelation coefficients. Red lines indicate the main clusters: actively transcribed regions (i.e. H3K36me3, H3K79me2), genome architecturalregions (i.e. RAD21), enhancers (i.e. ONECUT1), and promoters (i.e. H3K4me3). f TOP2B localizes to rDNA loci in mouse liver. The top panelshows a schematic representation of a single mouse rDNA repeat relative to the transcription start site of the rDNA repeat (x-axis; based off of GenBankBK000964). Normalized ChIP-seq read counts of TOP2B, CTCF, RAD21, STAG1, STAG2, and H3K4me3 are shown on the y-axis. rDNA mappability trackfrom Zentner GE et al. [78] is plotted as a heatmap below the genome tracks with black representing bases that are 100 % mappable.The TSS is labeled with an arrow. The 18S, 5.8S, and 28S coding regions are shown as large rectangles. The external transcribed spacer;(ETS), internal transcribed spacer (ITS), spacer promoter (SP), upstream control element (UCE), and core promoter element (CPE), are shown as narrowrectangles. The intergenic spacer (IGS) is shown as a thin line
Uusküla-Reimand et al. Genome Biology (2016) 17:182 Page 5 of 22
A
B
D
E F
C
Fig. 3 (See legend on next page.)
Uusküla-Reimand et al. Genome Biology (2016) 17:182 Page 6 of 22
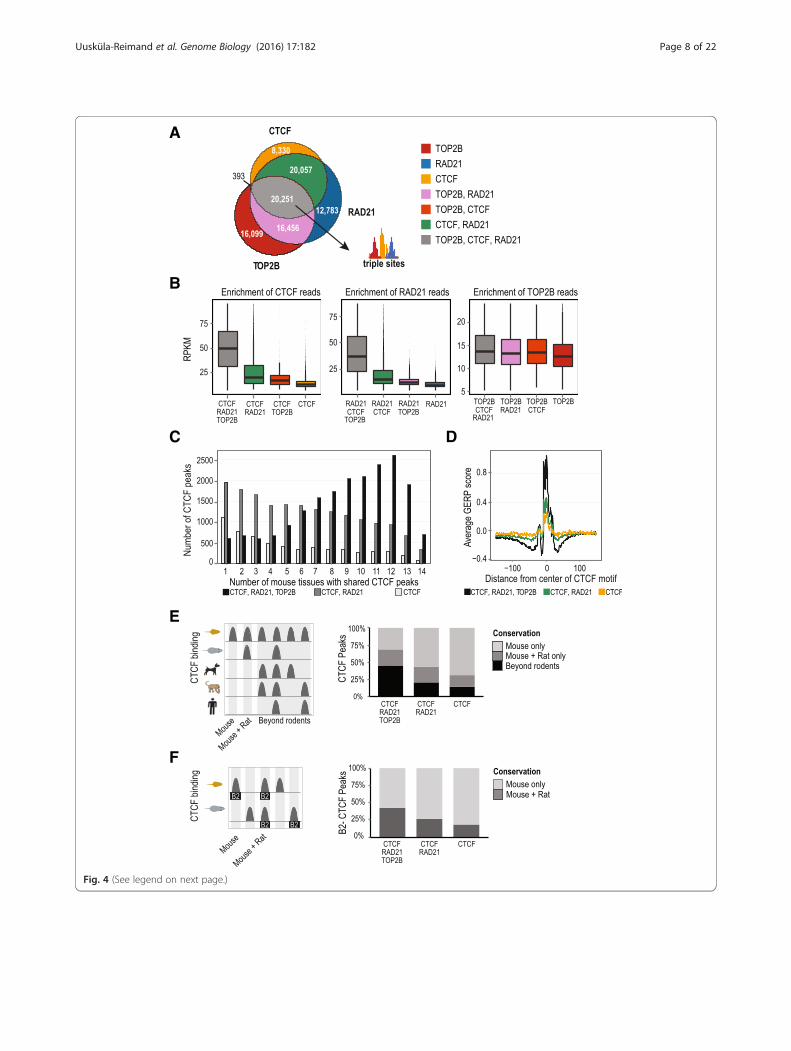
TOP2B co-localizes with evolutionarily conserved CTCF/cohesin binding sitesTo investigate whether CTCF and cohesin sites occupiedby TOP2B possess unique biochemical and evolutionaryfeatures, we first explored the genomic co-occupancy ofthese proteins. TOP2B was found at approximately half ofthe CTCF/RAD21 sites (20,251 TOP2B, CTCF, and RAD21triple sites versus 20,057 CTCF/RAD21 double sites(Fig. 4a). In contrast, we identified only 393 TOP2B/CTCFsites, indicating that TOP2B/CTCF interactions occuralmost exclusively in the context of cohesin occupancy.In order to gain insight into functional properties
imparted directly or indirectly by TOP2B occupancy atCTCF/cohesin sites, we compared several genomic fea-tures between TOP2B/CTCF/RAD21 “triple sites” andCTCF/RAD21 “double sites.” Triple sites have signifi-cantly higher CTCF and RAD21 ChIP signal comparedto CTCF/RAD21 double sites (fold change >2, one-sidedWilcoxon rank sum test, p <10–16; Fig. 4b). Triple sitesare also more likely to be occupied by CTCF in multipletissues. For example, 68 % of triple sites overlap withCTCF binding sites shared in seven or more tissues [41],in contrast to only 37 % of CTCF/RAD21 double sites(p <10–16, one-sided Fisher’s exact test; Fig. 4c).Evolutionary conservation of gene regulatory regions is
frequently used as a proxy for functional importance.We asked whether CTCF sites classified as triple sites inmouse were more evolutionarily conserved than CTCF/RAD21 double sites. Using genomic evolutionary rateprofiling (GERP) [50] to measure DNA constraint, wefound that triple sites were more conserved than CTCF/RAD21 double sites (Fig. 4d). We confirmed that thepeak of DNA constraint over the region upstream of theCTCF core motif corresponds to the previously de-scribed CTCF upstream motif [42, 51]. We found thatthe upstream motif is present in a minority (~13 %) ofour CTCF peaks, which is consistent with previously re-ported results [42, 51]. We observed that the “core + up-stream CTCF motif” containing triple sites have a clearincrease in DNA constraint at the upstream motif loca-tion compared to the “CTCF core motif only” triple sites
(Additional file 2: Figure S4a). We also observed thatHNF4A binding sites that co-occur with TOP2B bindingsites show higher ChIP-seq signal and DNA constraintthan sites without TOP2B binding (Additional file 2:Figure S4b–d).We then asked whether TOP2B binding at CTCF/
RAD21 binding sites corresponds to shared orthologousCTCF sites using CTCF ChIP-seq data previously ascer-tained for human, macaque, rat, and dog liver tissue[42]. We found that 45 % of CTCF peaks in triple siteswere shared in at least one non-rodent species (see“Methods”) in contrast to 21 % of CTCF/RAD21 doublesites (Fisher’s exact test, p <10–16; Fig. 4e; Additional file 2:Table S3). In addition, we also found that mouse HNF4A/TOP2B co-bound sites are more likely to be shared in anon-rodent species compared to HNF4A-only sites (26 %and 11 %, respectively, Fisher’s exact test, p <10–16;Additional file 2: Table S4; Additional file 2: Figure S4e).Since rodent-specific transposable B2 SINE (Short In-
terspersed Element) sequences are a source of lineage-specific CTCF binding sites in rodent genomes [42, 52],we asked whether TOP2B binding enriched for recentlyevolved CTCF binding events derived from B2 elementsthat have been fixed in the rodent lineage. Indeed, wefound that B2 SINE-derived CTCF sites that occur inthe context of triple sites were more likely to be shared be-tween mouse and rat (42 %) compared to CTCF/RAD21double sites (26 %) (Fisher’s exact test, p <10–16; Fig. 4f;Additional file 2: Table S3). Thus TOP2B genomic occu-pancy appears to be a distinguishing feature of functionallyrelevant TF binding events.
TOP2B and RAD21 are spatially organized around CTCFpeaksCTCF binds an asymmetric DNA motif with orientationdependent activities [40, 53–56]. To investigate the bind-ing of TOP2B and RAD21 relative to CTCF, we charac-terized the relative order of TOP2B, CTCF, and RAD21ChIP-seq binding sites in a ±100 bp region around theCTCF motif. Peak summits were used as proxies forbinding sites and genomic distances between the binding
(See figure on previous page.)Fig. 3 TOP2B preferentially interacts with open chromatin. a Correlation of TOP2B ChIP-seq and DNase I hypersensitivity sequencing signal densitiesacross mouse chromosome 19 (Spearman rho = 0.86). Gene density and GC content are also shown. b Nucleosome occupancy profiles for all TOP2Band CTCF peaks (All) centered on the peak summit are shown for proximal (≤1 kb from TSS, red lines) and distal peaks (>1 kb from TSS, blue lines).Profiles for TOP2B peaks not overlapping CTCF peaks (no CTCF), CTCF peaks not overlapping TOP2B peaks (no TOP2B), TOP2B and CTCF peaks notoverlapping RAD21 peaks (no RAD21) are also shown. c De novo motif discovery using all TOP2B peaks (50 bp upstream/downstream of the summit)and TOP2B peaks not overlapping CTCF peaks. d Genome browser view of example CTCF bound regions that show allele-specific bias towards theC57BL/6J genome (left panel) and A/J genome (right panel) (y-axis, number of allelic reads). e Correlation of C57BL/6J allele frequencies for CTCF (x-axis)versus TOP2B (y-axis) at TOP2B/CTCF co-occupied regions. f TOP2B (blue) and CTCF (red) C57BL/6J allele frequencies (blue) at TOP2B/CTCF co-occupiedregions, categorized based on CTCF allelic binding preference (see “Methods”). C57 > A/J indicates sites with CTCF preference for the C57BL/6J allele,A/J > C57 indicates preference for the A/J allele, and C57 ~ A/J indicates sites with no significant allelic-specific bias. The TOP2B allelic frequencies forboth C57BL/6J and A/J enriched CTCF binding sites were significantly different than the TOP2B allelic frequencies in C57 ~ A/J category (p <10–6;one-sided Wilcoxon rank-sum test)
Uusküla-Reimand et al. Genome Biology (2016) 17:182 Page 7 of 22
A
B
C
E
F
D
Fig. 4 (See legend on next page.)
Uusküla-Reimand et al. Genome Biology (2016) 17:182 Page 8 of 22
sites and the center of CTCF motif were calculated, cor-recting for orientation of the motif (Fig. 5a). We foundthat TOP2B and RAD21 were spatially organized on op-posite sides of the G-rich CTCF binding motif. TOP2Bwas positioned 5′ of the motif, with the median distanceto the motif center being 15 bp, and RAD21 was posi-tioned 3′ of the motif center, with a median distance of12 bp. This spatial organization was apparent in the ma-jority of triple sites (53.6 %, p <10–16, Fisher’s exact test)(Fig. 5b; Fig. 5c). This order also holds true when exam-ining the binding of other cohesin complex subunits,STAG1 and STAG2 (Additional file 2: Figure S5a, b).Additionally, the motif of YY1 [57], an established co-factor of CTCF [58], and one of our significant TOP2Binteracting proteins (Fig. 1b) was found 3′ of the G-richCTCF motif (Additional file 2: Figure S5c). In contrast,no significant orientation bias was apparent in the bind-ing of TOP2B and RAD21 around the binding motif ofHNF4A (Additional file 2: Figure S5d).To determine the precise spatial organization of triple
sites, we performed ChIP-exo experiments [59] forTOP2B, CTCF, and RAD21 in mouse liver cells (Fig. 5d, e).ChIP-exo recovered the majority of CTCF peaks identifiedwith ChIP-seq (76 %) (Additional file 2: Figure S6a). ChIP-exo for TOP2B and RAD21 recovered fewer peak regionsthan was obtained by ChIP-seq (16 % and 17 %, respect-ively (Additional file 2: Figure S6a)), as would be expectedfor factors that do not bind to specific DNA motifs. Im-portantly, the majority of the identified TOP2B andRAD21 ChIP-exo peaks overlapped with CTCF ChIP-exopeaks (82 % and 92 %, respectively) (Additional file 2:Figure S6b).In order to obtain insights into the exonuclease protec-
tion signal of TOP2B and RAD21 relative to the CTCFmotif at single base pair resolution, we plotted an averagenumber of 5′ nucleotides of ChIP-exo reads aligned toeach base pair around oriented CTCF motifs (Fig. 5e). Weanalyzed ChIP-exo signals separately at CTCF/RAD21double sites and CTCF-only sites. Due to the correlationwe observed for TOP2B binding and DNase I hypersensi-tivity signal, we also plotted mouse liver DNase I signal[41] alongside our ChIP-exo data. We recapitulated knownexo-nuclease protection patterns for CTCF [51]. We alsodetected distinct patterns for TOP2B and RAD21. Relative
to triple sites, the RAD21/CTCF double sites and CTCF-only sites showed less exo-nuclease protection signal andless DNase I hypersensitivity signal. Importantly, CTCFChIP-exo protection profiles can be seen within ourTOP2B ChIP-exo and RAD21 ChIP-exo protection pro-files. These results indicate that, similar to what has beenreported for CTCF and cohesin interactions [60], TOP2Bcan bind directly with DNA and also cross-link to DNA-bound CTCF.Our ChIP-exo protection signal further confirmed the
orientation-specific binding of RAD21 and TOP2B rela-tive to CTCF (Fig. 5e). Specifically, ChIP-exo for RAD21showed exonuclease protection at positions +13 to +26(13–26 bp downstream) of the center of CTCF coremotif (Fig. 5e). TOP2B ChIP-exo revealed a protectionsignal within positions –13 to –27 (13–27 bp upstream)of the center of the CTCF core motif. This TOP2BChIP-exo protection signal was primarily observed onthe reverse strand directly adjacent to the previously re-ported DNase I cleavage site located at –12 to –13 fromthe center of CTCF core motif that occurs on the posi-tive strand (Fig. 5e; [61]). This raises the possibility thatCTCF binding promotes DNA strand-specific interac-tions for TOP2B and DNase I enzymes.Since the TOP2B ChIP-exo protection signal overlaps
with the location of the upstream CTCF motif, whichcan be bound by CTCF zinc fingers 9–11 [51], we askedwhether the presence of CTCF upstream motif wouldresult in a distinct TOP2B ChIP-exo protection signal.We found that the upstream motif is present in a minority(~13 %) of our CTCF peaks, which is consistent with pre-viously reported results [42, 51]. Our CTCF ChIP-exoprofile within the “core plus the upstream CTCF motif”peaks showed the previously reported increase in ChIP-exo protection signal at positions –16 (reverse strand) and–25 (forward strand) [51] (Additional file 2: Figure S7).We also observed the previously reported decrease inDNase I signal at the –17 position [61]. Interestingly, wefound that TOP2B ChIP-exo protection signal that we ob-served using all CTCF peaks (between positions –13 and–27) was less pronounced within the “core plus the up-stream CTCF motif” peaks (Additional file 2: Figure S7). Anotable exception was the specific increase in signals atthe –16 position (reverse strand) and the –25 position
(See figure on previous page.)Fig. 4 Genomic features of combinatorial TOP2B, CTCF, and RAD21 binding. a Overlap of TOP2B, CTCF, and RAD21 ChIP-seq binding regionsdefines seven different categories of peaks. b Comparison of CTCF, RAD21, and TOP2B ChIP-seq reads (RPKM) for each of the categories definedin (a). Outliers (>95th percentile) are not shown. c Pan-tissue analysis of CTCF binding for triple sites (black), double sites (dark gray), and CTCF-onlysites (white). d DNA sequence constraint of triple (black), double (green), and CTCF only sites (yellow) as determined by average GERP score (y-axis).CTCF peaks were oriented based on the direction of CTCF motif (G-rich orientation is shown). e Cross-species comparison of mouse triple (n = 20,381),double (n = 20,049), and CTCF-only sites (n = 8301) with CTCF ChIP-seq peaks mapped in human, macaque, rat, and dog. Stacked bar plots show theproportion of peaks based on the degree of conservation (mouse only, mouse and rat only, and mouse plus one non-rodent (beyond rodents)).f Conservation of mouse triple (n = 1329), double (n = 6582), and singleton (n = 2957) CTCF sites that contain rodent-specific B2 SINE elements
Uusküla-Reimand et al. Genome Biology (2016) 17:182 Page 9 of 22
A
C
D E
B
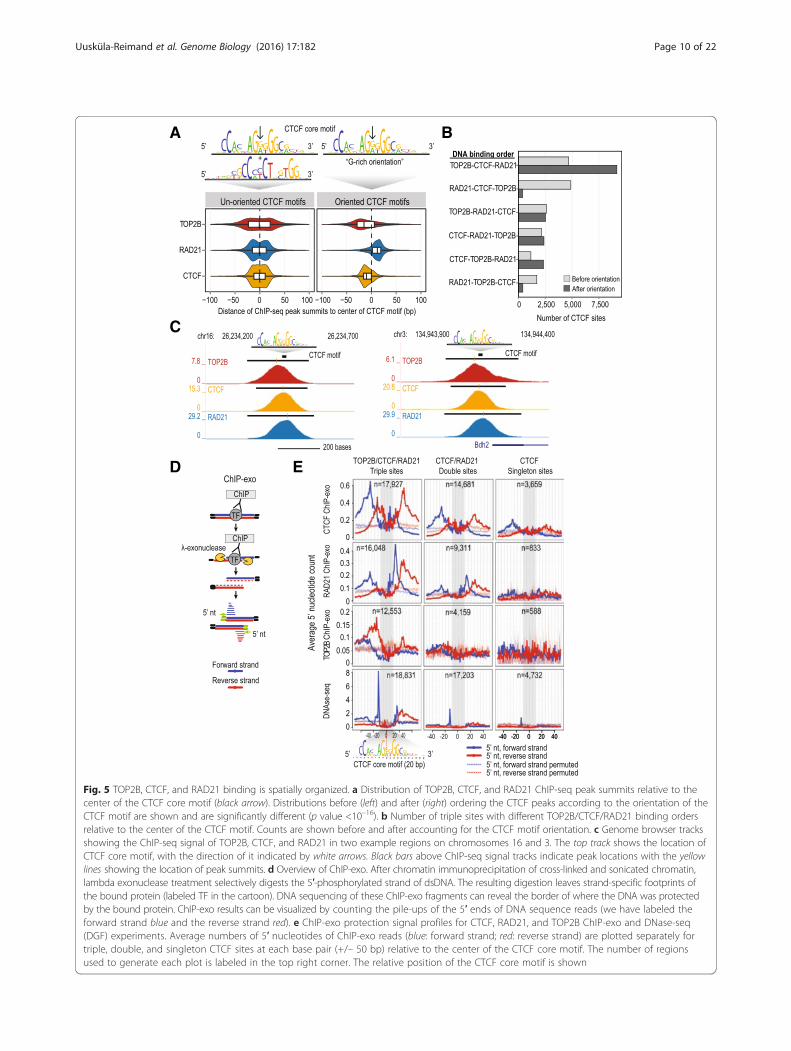
Fig. 5 TOP2B, CTCF, and RAD21 binding is spatially organized. a Distribution of TOP2B, CTCF, and RAD21 ChIP-seq peak summits relative to thecenter of the CTCF core motif (black arrow). Distributions before (left) and after (right) ordering the CTCF peaks according to the orientation of theCTCF motif are shown and are significantly different (p value <10–16). b Number of triple sites with different TOP2B/CTCF/RAD21 binding ordersrelative to the center of the CTCF motif. Counts are shown before and after accounting for the CTCF motif orientation. c Genome browser tracksshowing the ChIP-seq signal of TOP2B, CTCF, and RAD21 in two example regions on chromosomes 16 and 3. The top track shows the location ofCTCF core motif, with the direction of it indicated by white arrows. Black bars above ChIP-seq signal tracks indicate peak locations with the yellowlines showing the location of peak summits. d Overview of ChIP-exo. After chromatin immunoprecipitation of cross-linked and sonicated chromatin,lambda exonuclease treatment selectively digests the 5′-phosphorylated strand of dsDNA. The resulting digestion leaves strand-specific footprints ofthe bound protein (labeled TF in the cartoon). DNA sequencing of these ChIP-exo fragments can reveal the border of where the DNA was protectedby the bound protein. ChIP-exo results can be visualized by counting the pile-ups of the 5′ ends of DNA sequence reads (we have labeled theforward strand blue and the reverse strand red). e ChIP-exo protection signal profiles for CTCF, RAD21, and TOP2B ChIP-exo and DNase-seq(DGF) experiments. Average numbers of 5′ nucleotides of ChIP-exo reads (blue: forward strand; red: reverse strand) are plotted separately fortriple, double, and singleton CTCF sites at each base pair (+/– 50 bp) relative to the center of the CTCF core motif. The number of regionsused to generate each plot is labeled in the top right corner. The relative position of the CTCF core motif is shown
Uusküla-Reimand et al. Genome Biology (2016) 17:182 Page 10 of 22
(forward strand), both of which correspond to the enhancedCTCF protection signal observed when the upstream motifis present. Overall, this analysis confirms the close associ-ation between TOP2B and CTCF and raises the possibilitythat TOP2B-DNA interactions are affected by the bindingof CTCF zinc fingers 9–11 to the upstream CTCF motif.
Triple sites are enriched at chromosomal domain bordersCTCF and cohesin proteins are key architectural compo-nents of the genome that anchor long-range interactionsthat structure chromosomal domains [62–64]. Multi-species comparisons of chromosomal structure haveidentified an enrichment of evolutionarily conservedCTCF binding sites at chromosomal domain borders[56]. Given our observation that TOP2B co-localizeswith CTCF and cohesin in a specific orientation, weasked whether triple sites are enriched at the boundariesof orientation-specific chromosomal domains.Using recently published mouse liver Hi-C datasets [56],
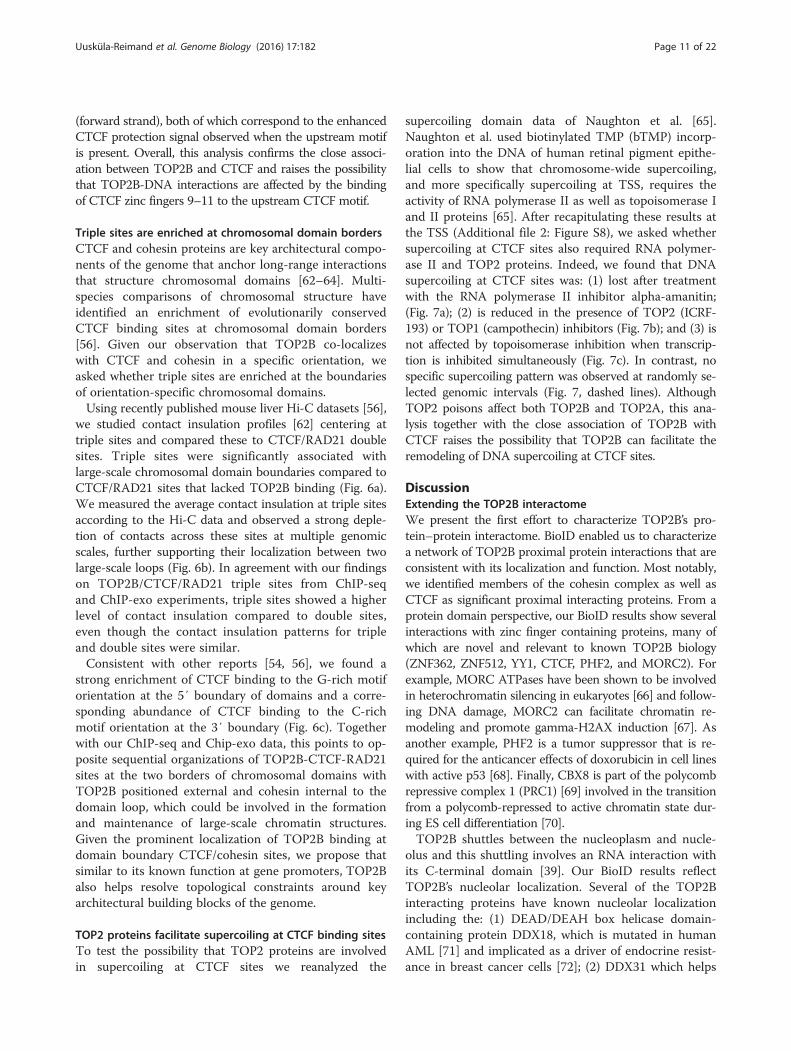
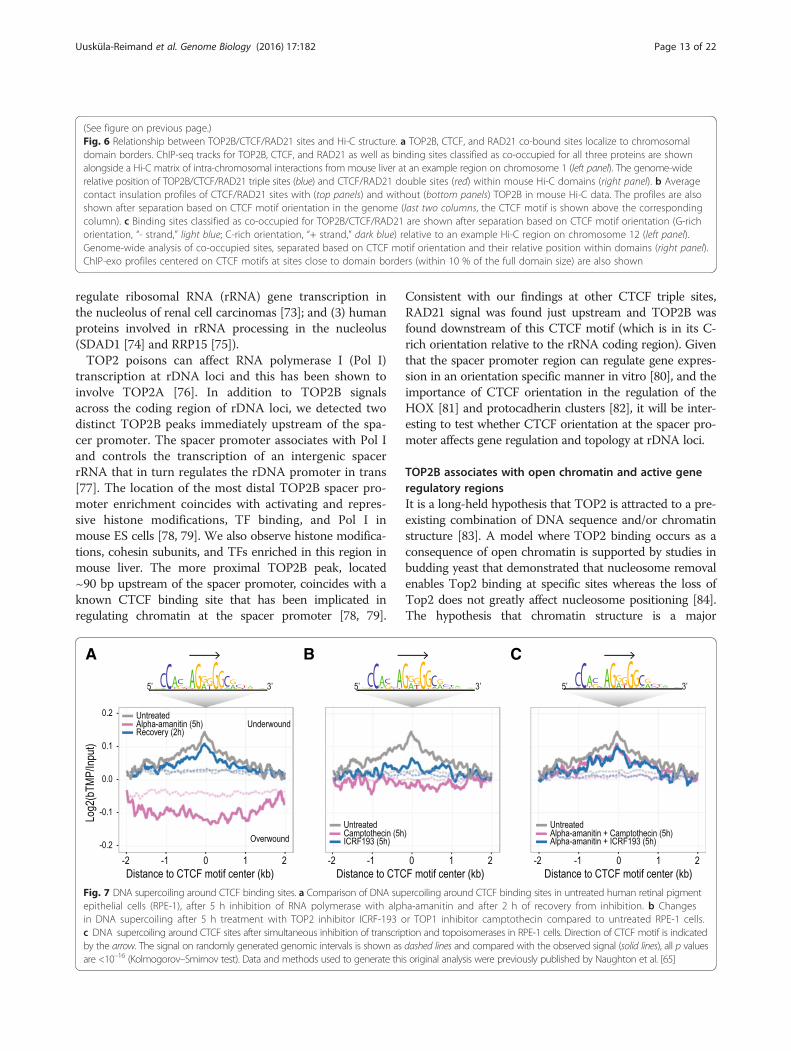
we studied contact insulation profiles [62] centering attriple sites and compared these to CTCF/RAD21 doublesites. Triple sites were significantly associated withlarge-scale chromosomal domain boundaries compared toCTCF/RAD21 sites that lacked TOP2B binding (Fig. 6a).We measured the average contact insulation at triple sitesaccording to the Hi-C data and observed a strong deple-tion of contacts across these sites at multiple genomicscales, further supporting their localization between twolarge-scale loops (Fig. 6b). In agreement with our findingson TOP2B/CTCF/RAD21 triple sites from ChIP-seqand ChIP-exo experiments, triple sites showed a higherlevel of contact insulation compared to double sites,even though the contact insulation patterns for tripleand double sites were similar.Consistent with other reports [54, 56], we found a
strong enrichment of CTCF binding to the G-rich motiforientation at the 5′ boundary of domains and a corre-sponding abundance of CTCF binding to the C-richmotif orientation at the 3′ boundary (Fig. 6c). Togetherwith our ChIP-seq and Chip-exo data, this points to op-posite sequential organizations of TOP2B-CTCF-RAD21sites at the two borders of chromosomal domains withTOP2B positioned external and cohesin internal to thedomain loop, which could be involved in the formationand maintenance of large-scale chromatin structures.Given the prominent localization of TOP2B binding atdomain boundary CTCF/cohesin sites, we propose thatsimilar to its known function at gene promoters, TOP2Balso helps resolve topological constraints around keyarchitectural building blocks of the genome.
TOP2 proteins facilitate supercoiling at CTCF binding sitesTo test the possibility that TOP2 proteins are involvedin supercoiling at CTCF sites we reanalyzed the
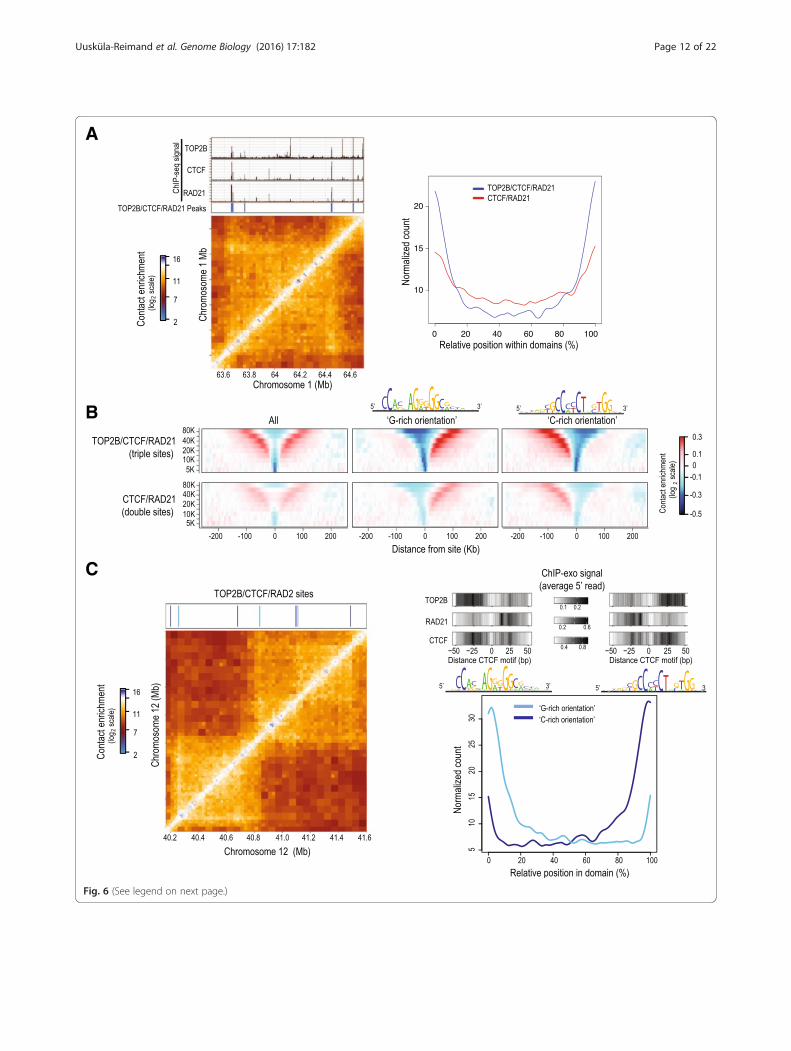
supercoiling domain data of Naughton et al. [65].Naughton et al. used biotinylated TMP (bTMP) incorp-oration into the DNA of human retinal pigment epithe-lial cells to show that chromosome-wide supercoiling,and more specifically supercoiling at TSS, requires theactivity of RNA polymerase II as well as topoisomerase Iand II proteins [65]. After recapitulating these results atthe TSS (Additional file 2: Figure S8), we asked whethersupercoiling at CTCF sites also required RNA polymer-ase II and TOP2 proteins. Indeed, we found that DNAsupercoiling at CTCF sites was: (1) lost after treatmentwith the RNA polymerase II inhibitor alpha-amanitin;(Fig. 7a); (2) is reduced in the presence of TOP2 (ICRF-193) or TOP1 (campothecin) inhibitors (Fig. 7b); and (3) isnot affected by topoisomerase inhibition when transcrip-tion is inhibited simultaneously (Fig. 7c). In contrast, nospecific supercoiling pattern was observed at randomly se-lected genomic intervals (Fig. 7, dashed lines). AlthoughTOP2 poisons affect both TOP2B and TOP2A, this ana-lysis together with the close association of TOP2B withCTCF raises the possibility that TOP2B can facilitate theremodeling of DNA supercoiling at CTCF sites.
DiscussionExtending the TOP2B interactomeWe present the first effort to characterize TOP2B’s pro-tein–protein interactome. BioID enabled us to characterizea network of TOP2B proximal protein interactions that areconsistent with its localization and function. Most notably,we identified members of the cohesin complex as well asCTCF as significant proximal interacting proteins. From aprotein domain perspective, our BioID results show severalinteractions with zinc finger containing proteins, many ofwhich are novel and relevant to known TOP2B biology(ZNF362, ZNF512, YY1, CTCF, PHF2, and MORC2). Forexample, MORC ATPases have been shown to be involvedin heterochromatin silencing in eukaryotes [66] and follow-ing DNA damage, MORC2 can facilitate chromatin re-modeling and promote gamma-H2AX induction [67]. Asanother example, PHF2 is a tumor suppressor that is re-quired for the anticancer effects of doxorubicin in cell lineswith active p53 [68]. Finally, CBX8 is part of the polycombrepressive complex 1 (PRC1) [69] involved in the transitionfrom a polycomb-repressed to active chromatin state dur-ing ES cell differentiation [70].TOP2B shuttles between the nucleoplasm and nucle-
olus and this shuttling involves an RNA interaction withits C-terminal domain [39]. Our BioID results reflectTOP2B’s nucleolar localization. Several of the TOP2Binteracting proteins have known nucleolar localizationincluding the: (1) DEAD/DEAH box helicase domain-containing protein DDX18, which is mutated in humanAML [71] and implicated as a driver of endocrine resist-ance in breast cancer cells [72]; (2) DDX31 which helps
Uusküla-Reimand et al. Genome Biology (2016) 17:182 Page 11 of 22
A
B
C
Fig. 6 (See legend on next page.)
Uusküla-Reimand et al. Genome Biology (2016) 17:182 Page 12 of 22
regulate ribosomal RNA (rRNA) gene transcription inthe nucleolus of renal cell carcinomas [73]; and (3) humanproteins involved in rRNA processing in the nucleolus(SDAD1 [74] and RRP15 [75]).TOP2 poisons can affect RNA polymerase I (Pol I)
transcription at rDNA loci and this has been shown toinvolve TOP2A [76]. In addition to TOP2B signalsacross the coding region of rDNA loci, we detected twodistinct TOP2B peaks immediately upstream of the spa-cer promoter. The spacer promoter associates with Pol Iand controls the transcription of an intergenic spacerrRNA that in turn regulates the rDNA promoter in trans[77]. The location of the most distal TOP2B spacer pro-moter enrichment coincides with activating and repres-sive histone modifications, TF binding, and Pol I inmouse ES cells [78, 79]. We also observe histone modifica-tions, cohesin subunits, and TFs enriched in this region inmouse liver. The more proximal TOP2B peak, located~90 bp upstream of the spacer promoter, coincides with aknown CTCF binding site that has been implicated inregulating chromatin at the spacer promoter [78, 79].
Consistent with our findings at other CTCF triple sites,RAD21 signal was found just upstream and TOP2B wasfound downstream of this CTCF motif (which is in its C-rich orientation relative to the rRNA coding region). Giventhat the spacer promoter region can regulate gene expres-sion in an orientation specific manner in vitro [80], and theimportance of CTCF orientation in the regulation of theHOX [81] and protocadherin clusters [82], it will be inter-esting to test whether CTCF orientation at the spacer pro-moter affects gene regulation and topology at rDNA loci.
TOP2B associates with open chromatin and active generegulatory regionsIt is a long-held hypothesis that TOP2 is attracted to a pre-existing combination of DNA sequence and/or chromatinstructure [83]. A model where TOP2 binding occurs as aconsequence of open chromatin is supported by studies inbudding yeast that demonstrated that nucleosome removalenables Top2 binding at specific sites whereas the loss ofTop2 does not greatly affect nucleosome positioning [84].The hypothesis that chromatin structure is a major
A CB
Fig. 7 DNA supercoiling around CTCF binding sites. a Comparison of DNA supercoiling around CTCF binding sites in untreated human retinal pigmentepithelial cells (RPE-1), after 5 h inhibition of RNA polymerase with alpha-amanitin and after 2 h of recovery from inhibition. b Changesin DNA supercoiling after 5 h treatment with TOP2 inhibitor ICRF-193 or TOP1 inhibitor camptothecin compared to untreated RPE-1 cells.c DNA supercoiling around CTCF sites after simultaneous inhibition of transcription and topoisomerases in RPE-1 cells. Direction of CTCF motif is indicatedby the arrow. The signal on randomly generated genomic intervals is shown as dashed lines and compared with the observed signal (solid lines), all p valuesare <10–16 (Kolmogorov–Smirnov test). Data and methods used to generate this original analysis were previously published by Naughton et al. [65]
(See figure on previous page.)Fig. 6 Relationship between TOP2B/CTCF/RAD21 sites and Hi-C structure. a TOP2B, CTCF, and RAD21 co-bound sites localize to chromosomaldomain borders. ChIP-seq tracks for TOP2B, CTCF, and RAD21 as well as binding sites classified as co-occupied for all three proteins are shownalongside a Hi-C matrix of intra-chromosomal interactions from mouse liver at an example region on chromosome 1 (left panel). The genome-widerelative position of TOP2B/CTCF/RAD21 triple sites (blue) and CTCF/RAD21 double sites (red) within mouse Hi-C domains (right panel). b Averagecontact insulation profiles of CTCF/RAD21 sites with (top panels) and without (bottom panels) TOP2B in mouse Hi-C data. The profiles are alsoshown after separation based on CTCF motif orientation in the genome (last two columns, the CTCF motif is shown above the correspondingcolumn). c Binding sites classified as co-occupied for TOP2B/CTCF/RAD21 are shown after separation based on CTCF motif orientation (G-richorientation, “- strand,” light blue; C-rich orientation, “+ strand,” dark blue) relative to an example Hi-C region on chromosome 12 (left panel).Genome-wide analysis of co-occupied sites, separated based on CTCF motif orientation and their relative position within domains (right panel).ChIP-exo profiles centered on CTCF motifs at sites close to domain borders (within 10 % of the full domain size) are also shown
Uusküla-Reimand et al. Genome Biology (2016) 17:182 Page 13 of 22
determinant of TOP2B binding is supported by the fol-lowing observations: (1) TOP2B occupancy is stronglycorrelated with DNase I hypersensitive sites; (2) TOP2Boccupancy is correlated with allele-specific binding ofvarious TFs; and (3) TOP2B binds to nucleosome-freeregions at both proximal and distal promoter sites.TOP2B-bound open chromatin regions have distinct
functional properties. For example, while it is known thatCTCF and cohesin play major roles in genomic regulation,CTCF/cohesin sites co-bound by TOP2B showed strongerChIP-seq signal, are more likely to be evolutionarily con-served, and are enriched at chromatin domain boundariescompared to CTCF/cohesin only sites. HNF4A bindingsites co-bound with TOP2B are also enriched forconserved orthologous HNF4A binding. Thus TOP2Bco-occupancy not only occurs at chromatin regions thatexhibit topological stress induced by genome regulatoryfunction (e.g. promoters and enhancers), but also includesregions of the genome that are fundamentally importantfor chromatin architecture.Positioning of TOP2B at promoter, enhancer, and
topologically associating domain (TAD) boundaries sug-gests mechanisms by which tissue-specific DNA damagecould be imparted. If TOP2B-induced DSBs are notfaithfully re-ligated, adjacent genomic regions are poten-tially susceptible to genome rearrangements [85], whichcan give rise to fusion genes and oncogenesis [26, 86].Interestingly, CTCF/cohesin sites are frequently mutatedin cancer [60] and somatic substitutions accumulate im-mediately adjacent to the CTCF core motif (10–14 bpupstream of center of the G rich CTCF motif ). Thisposition overlaps with both the DHS signal and TOP2BChIP-exo signal near the CTCF motif (Fig. 5c). DNAmutations in cancer cells strongly correlate with DHSsites from the tissue of origin (r = 0.8) [87]. While thereare many possible explanations for how DNA damagecould be biased towards DHS and cohesin/CTCF sites,it is intriguing to speculate whether TOP2B occupancycould influence tissue-specific mutational processes be-yond chromosomal rearrangements.
Spatial organization of TOP2B/CTCF/RAD21 atchromosomal domain bordersCTCF/cohesin sites anchor both chromosomal domains(also known as TADs) [88, 89] as well as local gene loops[62, 64, 90]. Directional CTCF binding is a prominentand evolutionarily conserved feature of chromosomaldomain borders [54, 56, 91]. Collectively our proteomicsand ChIP data clearly reveal the close association be-tween TOP2B, cohesin, and CTCF, raising the questionof whether TOP2B contributes to the long-range contactnetworks anchored by these architectural proteins. Indeed,using Hi-C datasets from mouse liver samples [56], weshow an enrichment of triple sites at borders of
chromosomal domains. Our ChIP-seq and ChIP-exo ana-lyses (Fig. 5) show a striking spatial organization of triplesites relative to the G-rich CTCF motif. This organizationplaces TOP2B at the base of the domain loop, with cohesinbeing inside the domain loop.TADs contain supercoiling domains whose borders
are also enriched for CTCF binding sites [65]. Based onTOP2B/CTCF protein–protein and protein–DNA in-teractions and our analysis of DNA supercoiling atCTCF binding sites in the presence of TOP2 poisons[65] (Fig. 7), we suggest that TOP2B can facilitate DNAsupercoiling at CTCF binding sites in a transcription-dependent manner.
ConclusionsWe only have a basic understanding of how the ubiqui-tously expressed TOP2B selectively regulates gene ex-pression in vivo. Detailed information about protein–protein and DNA–protein interactions of TOP2B is im-portant for understanding its role in development, rapidgene expression, and chemotherapeutic responses. Weidentified cohesin and several other chromatin proteinsthat are in close proximity to TOP2B in vivo. We dem-onstrated that TOP2B binding occurs at evolutionarilyconserved TF binding sites and topological domainboundaries. The prevalent occupancy of TOP2B at con-served gene regulatory and chromatin architectural re-gions indicates that TOP2B is intrinsically positioned tofunction at actively utilized points of genome control.
MethodsConstruct and stable HeLa cell culture generationConstruct for TOP2B gene was generated via Gatewaycloning into pDEST 5′ BirA*-FLAG-pcDNA5-FRT-TO. TOP2B (accession #NM_001068) was cloned intopDONR223 entry vector using pooled human cDNAand sequence verified. TOP2B bait protein tagged with aN-terminal BirA*-FLAG tag (n = 6 replicates) was stablyexpressed in Flp-In T-REx HeLa cells as described [31].Parental Flp-In T-REx HeLa cells (n = 6) and stable cellsexpressing BirA*-FLAG fused to a green fluorescentprotein (GFP; n = 3) or to a nuclear localization se-quence (NLS; n = 3) were used as negative controlsfor the BioID experiments and processed in parallelto the TOP2B bait expressing cells. Stable cell lineswere grown to 80 % confluence before expression was in-duced via 1 μg/mL tetracycline and biotinylation by theaddition of 40 μM biotin for 24 h. Subsequently, cells werewashed and harvested in ice-cold PBS and frozen at −80 °Cuntil purification.
Proximity biotinylation coupled with mass-spectrometryEqual quantities of starting material were used for eachBioID experiment. HeLa cell pellets were thawed in
Uusküla-Reimand et al. Genome Biology (2016) 17:182 Page 14 of 22
1.5 mL ice-cold modified RIPA buffer (50 mM Tris–HCl(pH 7.4), 150 mM NaCl, 1 % NP-40, 1 mM MgCl2,1 mM EGTA, 0.1 % SDS, and 0.4 % sodium deoxcycho-late). Sigma protease inhibitor cocktail (P8340, 1:500)and PMSF (1 mM) were added prior to use. The lysateswere sonicated at 4 °C using three 5 s bursts at 35 %amplitude with 3 s pauses. Samples were treated with250 U of TurboNuclease (BioVision) for 15 min followedby removal of insoluble material by centrifugation at20,000 g. The supernatant was transferred to a new tubeand 30 μL of pre-washed streptavidin-sepharose beadslurry (GE Healthcare, Cat 17-5113-01) was added. Bio-tinylated proteins were captured on the beads for 4 h at4 °C with rotation. The beads were washed once with1 mL of 2 % SDS in 25 mM Tris (pH 7.4), once with1 mL of standard RIPA buffer, once with 1 mL of TNNE(50 mM Tris-HCl (pH 7.4), 150 mM NaCl, 0.1 % NP-40,1 mM EDTA). Lastly, the beads were washed three timeswith 1 mL of 50 mM ammonium bicarbonate, pH 8.0(ABC). Following the final wash, the beads were pelletedand any excess liquid was aspirated off. The proteinscaptured on the beads were resuspended in ABC, re-duced with 5 mM DTT at 50 °C for 30 min, and alky-lated using 50 mM iodoacetamide for 20 min at roomtemperature in the dark. The proteins were digestedovernight with gentle rotation at 37 °C with 1 μg of tryp-sin (Sigma, T7575) in a total volume of 50 μL. In the fol-lowing morning, an additional 0.5 μg of trypsin wasadded for an additional incubation of 2–4 h. The beadswere pelleted and the peptide supernatant was trans-ferred to a fresh tube. The beads were rinsed twice with75 μL HPLC-grade water and the wash fraction wascombined with the supernatant. The peptide solutionwas acidified with 50 % formic acid to a final concentra-tion of 5 % and the samples were dried in a centrifugalevaporator. Tryptic peptides were re-suspended in 15 μL5 % formic acid and stored at −80 °C until analyzed bymass spectrometry. Mass spectrometry and data analysiswere carried out as described previously [31]. Briefly,using an Eksigent Autosampler, 5 μL of the tryptic pep-tides were loaded at 400 nl/min on to a 75 μm× 12 cmfused silica capillary tubing packed with 3 μm-C18(ReproSil-PurC18-AQ). Peptides were subjected tonano-LC-ESI-MS/MS, using a 90 min reversed phase(5–35 % acetonitrile, 0.1 % formic acid) buffer gradient,delivered at 200 nl/min and analyzed on a TripleTOF5600 (AB SCIEX). The instrument performed a 250 msMS1 TOF survey scan from 400–1300 Da followed by20 100 ms MS2 candidate ion scans from 100–2000 Dain high sensitivity mode.
MS data analysisRaw mass spectrometry files were stored, searched, andanalyzed using the ProHits laboratory information
management system (LIMS) [92]. The WIFF data fileswere converted to MGF format using WIFF2MGF andsubsequently converted to an mzML format using Pro-teoWizard (3.0.4468) [93] and the AB SCIEX MS DataConverter (V1.3 beta). The mzML files were searchedusing Mascot (v2.3.02) and Comet (2014.02 rev.2) [94],essentially as described by Lambert et al. [31].Briefly, the spectra were searched against a total of
72,230 proteins consisting of the NCBI human andadenovirus complements of the RefSeq database (v57,forward and reverse sequences), supplemented with“common contaminants” from the Max Planck Institute(http://maxquant.org) and the Global Proteome Machine(GPM; http://www.thegpm.org/crap/index.html).The database parameters were set to search for tryptic
cleavages, allowing up to two missed cleavage sites perpeptide, MS1 mass tolerance of 40 ppm with charges of2+ to 4+, and an MS2 mass tolerance of +/− 0.15 amu.Carbamidomethylation on cysteine was selected as afixed modification and deamidated asparagine/glutam-ine and oxidized methionine were selected as variablemodifications.The results from each search engine were analyzed
through TPP (the Trans-Proteomic Pipeline, v4.7) [95]via the iProphet pipeline [96]. SAINTexpress version 3.3[97] was used with default parameters to calculate statis-tical significance of each potential protein–protein inter-action relative to control samples. Only proteins identifiedwith minimally two unique peptides ions and a minimumiProphet probability of 0.95 were considered. The bait rep-licates (n = 6) were compressed to three samples, meaningthat after SAINTexpress was run on each sample indi-vidually, the three highest SAINTexpress scores were av-eraged for the final scoring and Bayesian FDR assessment.To increase the stringency in the identification of truepositives, the 12 controls were also compressed to four;in this case, the compression is performed before run-ning SAINTexpress by selecting the four highest spec-tral counts for each prey protein for modeling [98]. Allcontrol samples were deposited in the ContaminantRepository for Affinity Purification (www.crapome.org)[98] and assigned the following identifiers: CC831,CC834, CC835, CC838, CC842 (BirA*-FLAG-GFP),CC837, CC840, CC841 (BirA*-FLAG-NLS) and CC832,CC833, CC836, CC839 (parental cells). For western blotconfirmation of BioID results, we carried out the BioIDprotocol as described above. After the last wash, thestreptavidin beads were re-suspended in 60 uL of Laemmlisample buffer containing 200 uM Biotin and boiled for5 min then resolved on 8 % SDS-PAGE. Twenty mi-croliters of sample was loaded for each western blotlane. The membranes were probed for RAD21 (ab992,Abcam), STAG1 (ab4457, Abcam), and CTCF (07-729, Millipore) and developed using BioRad Gel Doc
Uusküla-Reimand et al. Genome Biology (2016) 17:182 Page 15 of 22
XR system. For each immunoprecipitation the equalamount of material collected from 10-cm tissue cul-ture dishes was used.
Functional enrichment and data visualizationSignificantly enriched pathways were computed withthe g:Profiler software [99], using ordered enrich-ment analysis on significance-ranked proteins andcustom filtering (3–1000 proteins in the pathway, atleast two interacting proteins per pathway, FDR cor-rected q <0.05; Additional file 1). Biological pro-cesses from Gene Ontology, pathways from theKEGG and Reactome databases, and protein com-plexes from the CORUM database were included inthe analysis and other functional annotations werefiltered. Pathways were visualized using Cytoscapesoftware using the Enrichment Map plugin [100].
Mouse tissue materialMouse liver material for ChIP-seq and ChIP-exoPost-mortem liver material from male C57BL/6 × A/Jmice (aged ~6–8 weeks) were kindly provided by Dr.Duncan Odom (Cambridge Research Institute). C57BL/6J mice (aged ~6–8 weeks) post-mortem livers used forChIP-seq and ChIP-exo were kindly provided by Dr.Jayne Danska. Fresh liver tissue was fixed for 20 min in1 % formaldehyde as described previously [101].
ChIP-seqChIP-seq experiments were performed as describedpreviously [101]. The following antibodies were used:anti-TOP2B (sc-13059, Santa Cruz Biotechnology; n = 5),anti-CTCF (07-729, Millipore; n = 4), anti-RAD21 (ab992,Abcam; n = 2), anti-H3K36me3 (13C9 monoclonal kindlyprovided by Hitoshi Kimura; n = 1), anti-H3K4me3(ab8580, Abcam; n = 1), anti-H3K4me2 (07-030, Millipore;n = 1). The DNA was end-repaired, dA-tailed, ligatedto the sequencing adapters, PCR amplified by 16 cy-cles using multiplexing index primers (NebNext),size selected (200–350 bp, PippinPrep, Sage Science),quantified with 2100 Bioanalyzer (Agilent), and50 bp reads were sequenced with the HiSeq2500(Illumina).
ChIP-exoWe used an Illumina ChIP-exo protocol [102] adaptedfrom the original protocol described by [59, 102]. ChIPwas performed as described previously until and includingthe RIPA buffer washes at step 38 [101]. Seven micro-grams of antibody against the TOP2B, CTCF, and RAD21was used for each biological replicate. Two biological rep-licates for TOP2B and RAD21 ChIP-exo experiments andone biological replicate for CTCF were used for down-stream analysis.
Public data resourcesPublicly available datasets used in this study include:mouse liver ChIP-seq of multiple liver expressed regula-tory factors and histone modifications (Data accession:E-MTAB-941) [40], mouse liver ChIP-seq of histonemodifications from mouse ENCODE (Data accession:GSM1000153, GSM1000140) [41], mouse liver DHS-seq(dccAccession: wgEncodeEM002906) [103], mouse liverRNA-seq (Data accession: GSM1015152) [104], and nu-cleosome occupancy data (Data accession: GSM717558)[45], CTCF ChIP-seq data of mouse, human, rat, anddog liver tissues (Data accession: E-MTAB-437) [42], andsupercoiling profiling data (Data accession: E-GEOD-43450) [65]. CTCF binding regions in multiple adult mousetissues were obtained from the mouse ENCODE database[41]. Published CTCF peaks from human retinal pigmentepithelial cells (HRPEpiC) [105] were obtained from(GSM749673). Data quality control results and a full list oflinks to processed files are available (Additional file 3).
Read alignment and quality control of ChIP-seq dataChIP-seq sequencing reads were trimmed to 36 bpand aligned to the reference mouse genome assembly(mm9, GRCh37) available at UCSC genome browserdatabase using the Burrows-Wheeler Aligner (http://bio-bwa.sourceforge.net/) [106] with default parame-ters. To remove sequencing and mapping artifacts, wediscarded all reads mapping to regions of the ENCODEblacklist (https://sites.google.com/site/anshulkundaje/projects/blacklists). Only uniquely mapped reads wereused for further analysis.Quality of the datasets processed from the raw se-
quencing reads was assessed following the ENCODEChIP-seq guidelines [107]. Quality control informationwith references and accession numbers are available(Additional file 3). Peak calling for quality control wasperformed using MACS2 software [108] without inputand with significance cutoff q = 0.01.Validation of TOP2B antibodies was performed using
RIME (rapid immunoprecipitation mass spectrometry ofendogenous proteins) [109]. RIME assay was performedas previously described using mouse liver tissue from8-week-old mice. Fifteen micrograms of antibody (TOP2Bsc-13059 (n = 2) or IgG sc-2027 (n = 1)) was used for eachChIP (Additional file 2: Figure S9).
Peak callingThe reads of biological replicates and corresponding in-put samples were merged for peak calling. Read countsand peak numbers used in our analyses are listed inAdditional file 2: Table S1. Peaks from ChIP-seq datawere called using the MACS2 method [108] with thesignificance cutoff of q = 0.01 and fold change cutoffof 5. The “–keep-dup” option was set to “all” to keep
Uusküla-Reimand et al. Genome Biology (2016) 17:182 Page 16 of 22
duplicated reads. For histone modifications and RNApolymerase II binding, peaks were called with add-itional “—broad –broad-cutoff 0.05” options. To com-pare ChIP-seq and ChIP-exo peaks, the SWEMBL(www.ebi.ac.uk/~swilder/SWEMBL) peak caller wasused with parameter “-R 0.005.”
Genomic annotation of TOP2B bindingThe genomic distribution of TOP2B binding wasannotated using the cis-regulatory element annota-tion system (CEAS) [110]. p values were calculatedwith R using the one-sided binomial test. The over-lap of TOP2B ChIP-seq binding sites with bindingsites of other factors was calculated using bedtoolsintersect [110]. The significance of the overlaps wasaccessed using Genomic Association Test (GAT)[111] with 1000 simulations. All q values weresmaller then 10–3.Using pairwise Pearson correlation coefficients as a
distance measurement, we clustered multiple ChIP-seqexperiments using hierarchical clustering and visualizedthe result as a heatmap with the R bioconductor packageDiffBind [112]. Peak regions for all factors were firstmerged to a consensus peak set. Read counts per millionmapped reads (RPKM) of each factor across this consen-sus peak set were computed.
Profiling TOP2B ChIP-seq signal over gene bodiesProcessed RNA-seq gene expression values for mouseliver (GSM1015152) [104] were log transformed andseparated into three groups based on the mean ± SD ofthe values (high, medium, and low expression). TOP2BChIP-seq signal (RPM, normalized to regions length)was plotted across gene bodies of the three groups ofgenes using the NGSplot package [113].
Profiling TOP2B ChIP-seq signal on rDNATo analyze the binding of TOP2B and other factorsat rDNA loci, we constructed a customized mousegenome with the single rDNA repeat sequence in-cluded as an extra chromosome. Mouse rDNA se-quence and structure were obtained from GenBankaccession no. BK000964. Reads were aligned to thiscustomized genome using bwa with default parame-ters. Only uniquely mappable reads were used fordownstream analysis. Reads were extended to 150 bpprior to plotting. After normalizing to the number ofmapped reads for each ChIP-seq and input experi-ment, input reads were subtracted from ChIP-seqreads at each base pair of the rDNA repeat. Plottingwas performed using R package “Sushi” [114]. Mapp-ability data was obtained from Zentner et al. and dis-played as a heatmap below the tracks with blackrepresenting 100 % mappability [78].
Comparing ChIP-seq with DHS, gene density and GCcontentAligned Dnase I Digital Genomic Footprinting (DGF)data for mouse liver were obtained from the ENCODEdatabase (see Additional file 3). Only uniquely mappedreads were used and ENCODE blacklist regions were ex-cluded from the genome. For both the DGF data andChIP-seq data, numbers of reads in every 10 kb acrossthe whole genome were counted. Pairwise Spearmancorrelation between DGF and ChIP-seq data was calcu-lated based on these values. Similarly, gene density andGC content was calculated for all 10 kb windows acrossthe genome. For visualization, values larger than 99.5 %percentiles were removed and a smoothing spline curvewas fit to the data using R. Finally, smoothed valueswere scaled and centered on 0 before plotting.
Nucleosome occupancy profileCoordinates of nucleosomes previously mapped inmouse liver were used [45]. Nucleosome regionsmapped to the mouse reference genome mm8 werelifted over to mm9 using liftOver tool and chain filesfrom UCSC database [115]. ChIP-seq peak summitsof each factor were separated into two categories:proximal (< ±1 kb) and distal (> ±1 kb) relative tothe TSS of transcripts annotated in Ensembl database(build 37). Each summit was extended to 1.5 kb towardsboth 5′ and 3′ directions. The extended proximal summitregions were ordered based on the direction of the nearesttranscript so that the direction of transcription alwayspointed to the right. The nucleosome positions weremapped to the extended regions around the summits andthe average number of nucleosomes mapped to each pos-ition was plotted separately for proximal and distal bind-ing regions of each factor.
De novo motif discoveryRegions 50 bp upstream and downstream of TOP2Bpeak summits were extracted and used for de novo motifdiscovery (Fig. 3c) using the RSAT peak-motifs methodwith default settings [116].
Detection and analysis of triple sitesAt least 1 bp overlapping binding regions of TOP2B,CTCF, and RAD21 were determined with bedtoolsmerge function [117]. Merged regions were then anno-tated according to the co-occupying factors. Numbers ofoverlapping peaks of these three factors are shown inthe three-way Venn diagram. The merged regions co-occupied by the three factors were referred as “triplesites.” For each factor, the binding intensity (RPKM ofeach peak region) of the original peaks annotated by dif-ferent overlapping patterns was calculated and plotted asboxplots. p values were calculated with Wilcoxon rank
Uusküla-Reimand et al. Genome Biology (2016) 17:182 Page 17 of 22
sum test followed by multiple testing corrections usingthe Benjamin–Hochberg method.
Comparing CTCF peaks across multiple tissuesAll mouse liver CTCF peaks identified in this study wereoverlapped with the CTCF peaks identified in 14 tissuesof 8-week-old adult mice (bone marrow, bone marrowderived microphage, cerebellum, cortex, heart, kidney,liver, lung, MEF, olfactory bulb, small intestine, spleen,testis, thymus) by the Ren lab as part of the mouse EN-CODE release (Additional file 3). Each peak was anno-tated by the tissues in which it overlapped with least oneENCODE CTCF peaks. If the peaks were shared in morethan seven tissues, it would be defined as “constitutive”across tissues. Fisher’s exact test was applied to deter-mine if the triple site CTCF peaks are more likely to beconstitutive compared to other CTCF peaks.
Evolutionary conservation of triple sitesCTCF peak regions were scanned for the CTCF coremotif using the RSAT matrix-scan method [116] withthe command “matrix-scan -v 1 -quick -i -m -matrix_-format transfac -origin start -bginput -markov 1 -2str-uth pval 0.0001 -return pval.” A window of 150 bp up-stream and downstream of the motif center was then ex-tracted and ordered based on the motif direction.Average GERP score of each bp around the motif sum-mits were then calculated and plotted. We used themouse GERP score track available in the UCSC GenomeBrowser Database: ftp://hgdownload.cse.ucsc.edu/gbdb/mm9/bbi/All_mm9_RS.bw.Conservation analysis was based on the detection of
the CTCF ChIP-seq peaks found in mouse in the ortho-logous regions in human, rat, and dog using EnsemblCompara API (build 70). In order to match the genomeassembly used in Ensembl 70, CTCF peaks identified inmm9 were lifted over to mm10 using the liftOver tooland the chain file provided by UCSC Genome BrowserDatabase [115]. Triple sites, CTCF-RAD21 double sites,and CTCF singleton sites were divided into threephylogenetic categories: Mouse only; shared in mouseand rat (Rodents only); and shared in mouse and/or ratand at least in one non-rodent species (dog, human)(Beyond rodents). Fisher’s exact test was used to test ifnumbers of deeply conserved sites (Beyond rodents)were significantly different between different categoriesof CTCF peaks.
B2 SINE element analysisThe Repeatmasker method (Smit AFA, Hubley R: Repeat-Modeler Open-1.0.2008-2010; http://www.repeatmasker.org)was run on the genome sequences of CTCF peaks. Onlypeaks having the B2 SINE repeat overlapping their peaksummits were included in the analysis.
Directionality analysis of triple sitesTriple site regions were scanned for the CTCF coremotif using the RSAT matrix-scan method [116] as de-scribed above. If multiple motifs were found within onepeak region, only the motif with the highest weight wasused. The genomic distances between CTCF core motifcenter and nearest peak summits of CTCF, RAD21, andTOP2B in triple sites were calculated. The distributionsof distances were visualized as violin plots before andafter orienting all CTCF motifs to the G-rich direction.Wilcoxon rank sum tests were used to compare betweenthe distances before and after orientating CTCF motif.The orders of CTCF motif center, RAD21 and TOP2Bpeak summits were listed according to the distances calcu-lated before and after correcting for CTCF motif direction,and plotted as bar plots. Fisher’s exact tests were used tocompare the likelihood of observing peaks with certain or-dering before and after orientating CTCF motif.
ChIP-exo analysisSequencing reads for ChIP-exo experiments werealigned without trimming. All reads were used in theanalysis. ChIP-seq of the same factors was performed inparallel for comparison. We applied the SWEMBL peakcaller algorithm that is sensitive for point-source data(http://www.ebi.ac.uk/~swilder/SWEMBL/). Peak over-laps were performed and plotted using DiffBind [112].The ChIP-exo Profiler method [118] was used to gener-ate TOP2B, CTCF and RAD21 ChIP-exo-seq and DGFsequencing read profiles around the CTCF bindingmotif. Specifically, CTCF binding regions identified pre-viously by the triple site analysis were scanned with theCTCF core motif. Next, flanking regions of 50 bp up-stream and downstream from the center of CTCF coremotif were retrieved and ordered based on the motif dir-ection. Regions with less than ten mapped ChIP-exoreads were discarded. To calculate the average 5′ coverageat each nucleotide position around the CTCF motif, num-bers of first 5′ nucleotides of ChIP-exo reads mapped toeach position were counted and divided by total numberof regions. Reads from forward and reverse strands weremapped separately. To control for the effect of sequencecomposition, the CTCF core motif was permuted tentimes using RSAT permute-matrix function [119]. Motifscanning and read profiling were also performed for eachof the permuted matrices to build a random background(shown as shaded polygons on Fig. 5e).
Allele-specific binding analysisChIP-seq data from an F1 mouse (C57BL/6 female ×A/Jmale) were used to investigate the allele-specific bindingpreferences of TOP2B at locations bound by specific TFsin mouse liver. Single nucleotide polymorphisms (SNPs)obtained from the Sanger Mouse Genomes Project version
Uusküla-Reimand et al. Genome Biology (2016) 17:182 Page 18 of 22
2 were used to acquire a list of SNPs between the A/J andreference (C57BL6/J) genomes [120]. Aligned reads wereprocessed with the WASP pipeline [121] to remove readswith potential alignment bias between parental genomesand remove duplicate reads. Reads overlapping SNP po-sitions (allelic reads) were then separated based on theirparent of origin using the ALEA pipeline [122]. Indoing so, we considered only reads that overlapped aninformative allele and that could be mapped unambigu-ously to one parent.Considering only the overlapping regions of the TOP2B
and the TF in question, we counted the number of allelicreads mapped to each parental genome to determine anallele frequency. Peaks showing significantly biased allelicread distribution (binomial p <0.05) were annotated basedon the mouse strain possessing TF-preferred allele. Aone-sided Wilcoxon ranked sum test was used to comparethe allele frequency of each factor between allelic biasedregions and non-biased regions.
Hi-C data analysisThe Hi-C data were obtained from Vietri Rudan et al.(GSE65126) [56]. Please refer to that work for detailsabout the Hi-C libraries, normalization methods, andcontact insulation analysis. The relative distribution ofCTCF within TADs was calculated as the distance ofeach CTCF site from the center of its domain. Half thesize of the domain was added to convert it to a measureof distance from the edge of the domain and this valuewas subsequently divided by the size of the domain.
DNA supercoiling analysisProcessed files containing DNA microarray probe inten-sities were obtained from ArrayExpress (E-GEOD-43450).Data were processed as previously described with normal-ized bTMP incorporation calculated as log2(bTMP cell/bTMP input) – log2(bTMP genomic DNA – bTMP in-put) [65]. GENCODE hg19 gene annotation was used toextract TSS positions. CTCF sites from human retinal pig-ment epithelial cells (HRPEpiC) [105] were used. For eachprobe, the nearest TSS or CTCF motif center within aCTCF peak was found, the distance from the probe to thefeature was calculated with regard to the direction of tran-scription or the CTCF motif. Distances were binned by100 bp and median intensity of the binned probes wascalculated. Finally, a rolling mean method with a slidingwindow of size = 10, step = 2 was applied prior to plottingdata. Same number of genomic regions was randomlygenerated and probe intensity around these regions werecalculated in the same manner. The random selection wasperformed 10 times and an average value was used as therandom background, which is plotted as a dashed linewith corresponding colors. The Kolmogorov–Smirnov testwas used to compare between the random background
and the actual profile (dashed versus solid lines of samecolors in each panel of Fig. 7 and Additional file 2:Figure S6. All p values were smaller than 10–16.
Additional files
Additional file 1: TOP2B interactome, and statistically over-representedbiological processes in the TOP2B interactome. (XLSX 158 kb)
Additional file 2: Supplementary tables and figures. (XLSX 193 kb)
Additional file 3: Overview of the genomic datasets used. (DOCX 2034 kb)
Additional file 4: List of de novo motif discovery results. (PDF 363 kb)
AcknowledgementsWe would like to thank: Duncan Odom and Paul Flicek for their support andhelpful feedback; David Bazett-Jones for providing critical comments;Morgane Collier for advice on ChIP-exo analysis; James Hadfield and DaxTorti from the Cambridge Institute and Donnelly sequencing core facilities,respectively, for DNA sequencing; and Clive de Santos from the CambridgeInstitute proteomics facility.
FundingThis work was supported by: the SickKids Foundation (MDW); the NaturalSciences and Engineering Research Council of Canada (NSERC) grant436194-2013 (MDW); the Canadian Institutes of Health Research throughFoundation grant 143301 (ACG); and tier II Canada Research Chairs toMDW and ACG. LU is supported by The Estonian Research Council (PUTJD145),AM was supported by Consejo Nacional de Ciencia y Tecnología Fellowship,ML is supported by Restracomp Hospital for Sick Children Foundation StudentScholarship Program, and SH is supported by the Wellcome Trust.
Availability of data and materialsThe datasets generated during and/or analyzed during the current study areavailable in the:
1) MassIVE repository (MSV000079188), ftp://massive.ucsd.edu/MSV0000791882) ProteomeXchange repository (PXD002522), http://proteomecentral.
proteomexchange.org/cgi/GetDataset?ID=PXD0025223) ArrayExpress repository (E-MTAB-3587), https://www.ebi.ac.uk/arrayexpress/
experiments/E-MTAB-3587/
Authors’ contributionsConception and study design: MDW, LU, HH, PST, ACG, and SH; acquisitionof data: LU, PST, HM, EJY, DS, and MDW; analysis and interpretation of data:HH, LU, MVR, PST, PS, ML, JR, AM, SH, ACG, and MDW; MDW, LU, and HHwrote the manuscript and all authors assisted with drafting and revision ofthe manuscript. All authors read and approved the final manuscript.
Competing interestsThe authors declare that they have no competing interests.
Consent for publicationNot applicable.
Ethics approval and consent to participatePost-mortem liver material from C57BL/6J mice was kindly provided byDr. Jayne Danska. Mice were maintained in specific pathogen-free conditionsat the Hospital for Sick Children Laboratory Animal Services according to anapproved animal use protocol. Post-mortem liver material from C57BL/6Jand C57BL/6 × A/J mice was also kindly provided by Dr. Duncan Odom(Cambridge Institute) under Home Office license PPL 80/2197).
Author details1Genetics and Genome Biology Program, SickKids Research Institute, Toronto,ON, Canada. 2Department of Gene Technology, Tallinn University ofTechnology, Tallinn, Estonia. 3Department of Molecular Genetics, Universityof Toronto, Toronto, ON, Canada. 4Lunenfeld-Tanenbaum Research Institute,Mount Sinai Hospital, Toronto, ON, Canada. 5Research Department of Cancer
Uusküla-Reimand et al. Genome Biology (2016) 17:182 Page 19 of 22
Biology, Cancer Institute, University College London, London, UK. 6CancerResearch UK, Cambridge Institute, University of Cambridge, Cambridge, UK.7European Molecular Biology Laboratory, European Bioinformatics Institute,Cambridge, UK. 8Ontario Institute for Cancer Research, Toronto, ON, Canada.9Department of Medical Biophysics, University of Toronto, Toronto, ON,Canada. 10Present address: The Babraham Institute, Cambridge, UK. 11Presentaddress: Syncona Partners LLP, London, UK. 12Present address: Laboratory ofSystems Biology and Genetics, Lausanne, Switzerland. 13Present address:International Laboratory for Research in Human Genomics, UniversidadNacional Autónoma de México, Juriquilla, Querétaro, Mexico.
Received: 9 September 2015 Accepted: 10 August 2016
References1. Champoux JJ. DNA topoisomerases: structure, function, and mechanism.
Annu Rev Biochem. 2001;70:369–413.2. Chen SH, Chan NL, Hsieh TS. New mechanistic and functional insights into
DNA topoisomerases. Annu Rev Biochem. 2013;82:139–70.3. Nitiss JL. DNA topoisomerase II and its growing repertoire of biological
functions. Nat Rev Cancer. 2009;9:327–37.4. Sng JH, Heaton VJ, Bell M, Maini P, Austin CA, Fisher LM. Molecular cloning
and characterization of the human topoisomerase IIalpha and IIbeta genes:evidence for isoform evolution through gene duplication. Biochim BiophysActa. 1999;1444:395–406.
5. Lang AJ, Mirski SE, Cummings HJ, Yu Q, Gerlach JH, Cole SP. Structuralorganization of the human TOP2A and TOP2B genes. Gene. 1998;221:255–66.
6. Grue P, Grasser A, Sehested M, Jensen PB, Uhse A, Straub T, et al. Essentialmitotic functions of DNA topoisomerase IIalpha are not adopted bytopoisomerase IIbeta in human H69 cells. J Biol Chem. 1998;273:33660–6.
7. Capranico G, Tinelli S, Austin CA, Fisher ML, Zunino F. Different patterns ofgene expression of topoisomerase II isoforms in differentiated tissues duringmurine development. Biochim Biophys Acta. 1992;1132:43–8.
8. Thakurela S, Garding A, Jung J, Schubeler D, Burger L, Tiwari VK. Generegulation and priming by topoisomerase IIalpha in embryonic stem cells.Nat Commun. 2013;4:2478.
9. Akimitsu N, Adachi N, Hirai H, Hossain MS, Hamamoto H, Kobayashi M, et al.Enforced cytokinesis without complete nuclear division in embryonic cellsdepleting the activity of DNA topoisomerase IIalpha. Genes Cells. 2003;8:393–402.
10. Carpenter AJ, Porter AC. Construction, characterization, andcomplementation of a conditional-lethal DNA topoisomerase IIalpha mutanthuman cell line. Mol Biol Cell. 2004;15:5700–11.
11. Dovey M, Patton EE, Bowman T, North T, Goessling W, Zhou Y, et al.Topoisomerase II alpha is required for embryonic development and liverregeneration in zebrafish. Mol Cell Biol. 2009;29:3746–53.
12. Yang X, Li W, Prescott ED, Burden SJ, Wang JC. DNA topoisomerase IIbetaand neural development. Science. 2000;287:131–4.
13. Li Y, Hao H, Tzatzalos E, Lin RK, Doh S, Liu LF, et al. Topoisomerase IIbeta isrequired for proper retinal development and survival of postmitotic cells.Biol Open. 2014;3:172–84.
14. Zhang YL, Yu C, Ji SY, Li XM, Zhang YP, Zhang D, et al. TOP2beta is essentialfor ovarian follicles that are hypersensitive to chemotherapeutic drugs. MolEndocrinol. 2013;27:1678–91.
15. Leduc F, Maquennehan V, Nkoma GB, Boissonneault G. DNA damageresponse during chromatin remodeling in elongating spermatids of mice.Biol Reprod. 2008;78:324–32.
16. Meyer-Ficca ML, Lonchar JD, Ihara M, Meistrich ML, Austin CA, Meyer RG.Poly(ADP-ribose) polymerases PARP1 and PARP2 modulate topoisomerase IIbeta (TOP2B) function during chromatin condensation in mousespermiogenesis. Biol Reprod. 2011;84:900–9.
17. Yamauchi Y, Shaman JA, Ward WS. Topoisomerase II-mediated breaks inspermatozoa cause the specific degradation of paternal DNA in fertilizedoocytes. Biol Reprod. 2007;76:666–72.
18. Daev E, Chaly N, Brown DL, Valentine B, Little JE, Chen X, et al. Role oftopoisomerase II in the structural and functional evolution of mitogen-stimulated lymphocyte nuclei. Exp Cell Res. 1994;214:331–42.
19. Zhang S, Liu X, Bawa-Khalfe T, Lu LS, Lyu YL, Liu LF, et al. Identification of themolecular basis of doxorubicin-induced cardiotoxicity. Nat Med. 2012;18:1639–42.
20. Lyu YL, Lin CP, Azarova AM, Cai L, Wang JC, Liu LF. Role of topoisomeraseIIbeta in the expression of developmentally regulated genes. Mol Cell Biol.2006;26:7929–41.
21. Tiwari VK, Burger L, Nikoletopoulou V, Deogracias R, Thakurela S, WirbelauerC, et al. Target genes of Topoisomerase IIbeta regulate neuronal survivaland are defined by their chromatin state. Proc Natl Acad Sci U S A.2012;109:E934–43.
22. Ju BG, Lunyak VV, Perissi V, Garcia-Bassets I, Rose DW, Glass CK, et al. Atopoisomerase IIbeta-mediated dsDNA break required for regulatedtranscription. Science. 2006;312:1798–802.
23. Madabhushi R, Gao F, Pfenning AR, Pan L, Yamakawa S, Seo J, et al. Activity-induced DNA breaks govern the expression of neuronal early-responsegenes. Cell. 2015;161:1592–605.
24. King IF, Yandava CN, Mabb AM, Hsiao JS, Huang HS, Pearson BL, et al.Topoisomerases facilitate transcription of long genes linked to autism.Nature. 2013;501:58–62.
25. Haffner MC, Aryee MJ, Toubaji A, Esopi DM, Albadine R, Gurel B, et al.Androgen-induced TOP2B-mediated double-strand breaks and prostatecancer gene rearrangements. Nat Genet. 2010;42:668–75.
26. Cowell IG, Sondka Z, Smith K, Lee KC, Manville CM, Sidorczuk-Lesthuruge M,et al. Model for MLL translocations in therapy-related leukemia involvingtopoisomerase IIbeta-mediated DNA strand breaks and gene proximity.Proc Natl Acad Sci U S A. 2012;109:8989–94.
27. Nitiss JL. Targeting DNA, topoisomerase II in cancer chemotherapy. Nat RevCancer. 2009;9:338–50.
28. Ashour ME, Atteya R, El-Khamisy SF. Topoisomerase-mediated chromosomalbreak repair: an emerging player in many games. Nat Rev Cancer.2015;15:137–51.
29. Azarova AM, Lyu YL, Lin CP, Tsai YC, Lau JY, Wang JC, et al. Roles of DNAtopoisomerase II isozymes in chemotherapy and secondary malignancies.Proc Natl Acad Sci U S A. 2007;104:11014–9.
30. Meller VH, Fisher PA. Nuclear distribution of Drosophila DNA topoisomeraseII is sensitive to both RNase and DNase. J Cell Sci. 1995;108:1651–7.
31. Lambert JP, Tucholska M, Go C, Knight JD, Gingras AC. Proximitybiotinylation and affinity purification are complementary approaches for theinteractome mapping of chromatin-associated protein complexes. J Proteomics.2015;118:81–94.
32. Roux KJ, Kim DI, Raida M, Burke B. A promiscuous biotin ligase fusionprotein identifies proximal and interacting proteins in mammalian cells.J Cell Biol. 2012;196:801–10.
33. Biersack H, Jensen S, Gromova I, Nielsen IS, Westergaard O, Andersen AH.Active heterodimers are formed from human DNA topoisomerase II alphaand II beta isoforms. Proc Natl Acad Sci U S A. 1996;93:8288–93.
34. Coll JM, Sekowski JW, Hickey RJ, Schnaper L, Yue W, Brodie AM, et al. Thehuman breast cell DNA synthesome: its purification from tumor tissue andcell culture. Oncol Res. 1996;8:435–47.
35. Witcher M, Emerson BM. Epigenetic silencing of the p16(INK4a) tumorsuppressor is associated with loss of CTCF binding and a chromatinboundary. Mol Cell. 2009;34:271–84.
36. Feng Y, Wu H, Xu Y, Zhang Z, Liu T, Lin X, et al. Zinc finger protein 451 is anovel Smad corepressor in transforming growth factor-beta signaling. J BiolChem. 2014;289:2072–83.
37. Hutchins JR, Toyoda Y, Hegemann B, Poser I, Heriche JK, Sykora MM, et al.Systematic analysis of human protein complexes identifies chromosomesegregation proteins. Science. 2010;328:593–9.
38. Zhou Z, Yamamoto Y, Sugai F, Yoshida K, Kishima Y, Sumi H, et al.Hepatoma-derived growth factor is a neurotrophic factor harbored in thenucleus. J Biol Chem. 2004;279:27320–6.
39. Onoda A, Hosoya O, Sano K, Kiyama K, Kimura H, Kawano S, et al. Nucleardynamics of topoisomerase IIbeta reflects its catalytic activity that isregulated by binding of RNA to the C-terminal domain. Nucleic Acids Res.2014;42:9005–20.
40. Faure AJ, Schmidt D, Watt S, Schwalie PC, Wilson MD, Xu H, et al. Cohesinregulates tissue-specific expression by stabilizing highly occupied cis-regulatory modules. Genome Res. 2012;22:2163–75.
41. Yue F, Cheng Y, Breschi A, Vierstra J, Wu W, Ryba T, et al. Acomparative encyclopedia of DNA elements in the mouse genome.Nature. 2014;515:355–64.
42. Schmidt D, Schwalie PC, Wilson MD, Ballester B, Goncalves A, Kutter C, et al.Waves of retrotransposon expansion remodel genome organization andCTCF binding in multiple mammalian lineages. Cell. 2012;148:335–48.
43. Perillo B, Ombra MN, Bertoni A, Cuozzo C, Sacchetti S, Sasso A, et al. DNAoxidation as triggered by H3K9me2 demethylation drives estrogen-inducedgene expression. Science. 2008;319:202–6.
Uusküla-Reimand et al. Genome Biology (2016) 17:182 Page 20 of 22
44. Hesselberth JR, Chen X, Zhang Z, Sabo PJ, Sandstrom R, Reynolds AP, et al.Global mapping of protein-DNA interactions in vivo by digital genomicfootprinting. Nat Methods. 2009;6:283–9.
45. Li Z, Schug J, Tuteja G, White P, Kaestner KH. The nucleosome map of themammalian liver. Nat Struct Mol Biol. 2011;18:742–6.
46. Wang J, Zhuang J, Iyer S, Lin XY, Greven MC, Kim BH, et al. Factorbook.org:a Wiki-based database for transcription factor-binding data generated bythe ENCODE consortium. Nucleic Acids Res. 2013;41:D171–6.
47. Fu Y, Sinha M, Peterson CL, Weng Z. The insulator binding protein CTCFpositions 20 nucleosomes around its binding sites across the humangenome. PLoS Genet. 2008;4:e1000138.
48. Manville CM, Smith K, Sondka Z, Rance H, Cockell S, Cowell IG, et al.Genome-wide ChIP-seq analysis of human TOP2B occupancy in MCF7breast cancer epithelial cells. Biol Open. 2015;4:1436–47.
49. Spitzner JR, Muller MT. A consensus sequence for cleavage by vertebrateDNA topoisomerase II. Nucleic Acids Res. 1988;16:5533–56.
50. Cooper GM, Stone EA, Asimenos G, Program NCS, Green ED, Batzoglou S,et al. Distribution and intensity of constraint in mammalian genomicsequence. Genome Res. 2005;15:901–13.
51. Nakahashi H, Kwon KR, Resch W, Vian L, Dose M, Stavreva D, et al. Agenome-wide map of CTCF multivalency redefines the CTCF code.Cell Rep. 2013;3:1678–89.
52. Bourque G, Leong B, Vega VB, Chen X, Lee YL, Srinivasan KG, et al. Evolutionof the mammalian transcription factor binding repertoire via transposableelements. Genome Res. 2008;18:1752–62.
53. Du M, Beatty LG, Zhou W, Lew J, Schoenherr C, Weksberg R, et al. Insulatorand silencer sequences in the imprinted region of human chromosome11p15.5. Hum Mol Genet. 2003;12:1927–39.
54. Rao SS, Huntley MH, Durand NC, Stamenova EK, Bochkov ID, Robinson JT,et al. A 3D map of the human genome at kilobase resolution revealsprinciples of chromatin looping. Cell. 2014;159:1665–80.
55. Tanimoto K, Liu Q, Bungert J, Engel JD. Effects of altered gene order ororientation of the locus control region on human beta-globin geneexpression in mice. Nature. 1999;398:344–8.
56. Vietri Rudan M, Barrington C, Henderson S, Ernst C, Odom DT, Tanay A,et al. Comparative Hi-C reveals that CTCF underlies evolution ofchromosomal domain architecture. Cell Rep. 2015;10:1297–309.
57. Schwalie PC, Ward MC, Cain CE, Faure AJ, Gilad Y, Odom DT, et al. Co-binding by YY1 identifies the transcriptionally active, highly conserved setof CTCF-bound regions in primate genomes. Genome Biol. 2013;14:R148.
58. Donohoe ME, Zhang LF, Xu N, Shi Y, Lee JT. Identification of a Ctcf cofactor,Yy1, for the X chromosome binary switch. Mol Cell. 2007;25:43–56.
59. Rhee HS, Pugh BF. Comprehensive genome-wide protein-DNA interactionsdetected at single-nucleotide resolution. Cell. 2011;147:1408–19.
60. Katainen R, Dave K, Pitkanen E, Palin K, Kivioja T, Valimaki N, et al.CTCF/cohesin-binding sites are frequently mutated in cancer. NatGenet. 2015;47:818–21.
61. Boyle AP, Song L, Lee BK, London D, Keefe D, Birney E, et al. High-resolutiongenome-wide in vivo footprinting of diverse transcription factors in humancells. Genome Res. 2011;21:456–64.
62. Sofueva S, Yaffe E, Chan WC, Georgopoulou D, Vietri Rudan M, Mira-Bontenbal H, et al. Cohesin-mediated interactions organize chromosomaldomain architecture. EMBO J. 2013;32:3119–29.
63. Zuin J, Dixon JR, van der Reijden MI, Ye Z, Kolovos P, Brouwer RW, et al.Cohesin and CTCF differentially affect chromatin architecture and geneexpression in human cells. Proc Natl Acad Sci U S A. 2014;111:996–1001.
64. Seitan VC, Faure AJ, Zhan Y, McCord RP, Lajoie BR, Ing-Simmons E, et al.Cohesin-based chromatin interactions enable regulated gene expressionwithin preexisting architectural compartments. Genome Res. 2013;23:2066–77.
65. Naughton C, Avlonitis N, Corless S, Prendergast JG, Mati IK, Eijk PP, et al.Transcription forms and remodels supercoiling domains unfolding large-scale chromatin structures. Nat Struct Mol Biol. 2013;20:387–95.
66. Moissiard G, Cokus SJ, Cary J, Feng S, Billi AC, Stroud H, et al. MORC familyATPases required for heterochromatin condensation and gene silencing.Science. 2012;336:1448–51.
67. Li DQ, Nair SS, Ohshiro K, Kumar A, Nair VS, Pakala SB, et al. MORC2signaling integrates phosphorylation-dependent, ATPase-coupled chromatinremodeling during the DNA damage response. Cell Rep. 2012;2:1657–69.
68. Lee KH, Park JW, Sung HS, Choi YJ, Kim WH, Lee HS, et al. PHF2 histonedemethylase acts as a tumor suppressor in association with p53 in cancer.Oncogene. 2015;34:2897–909.
69. Gao Z, Zhang J, Bonasio R, Strino F, Sawai A, Parisi F, et al. PCGF homologs,CBX proteins, and RYBP define functionally distinct PRC1 family complexes.Mol Cell. 2012;45:344–56.
70. Creppe C, Palau A, Malinverni R, Valero V, Buschbeck M. A Cbx8-containingpolycomb complex facilitates the transition to gene activation during EScell differentiation. PLoS Genet. 2014;10:e1004851.
71. Payne EM, Bolli N, Rhodes J, Abdel-Wahab OI, Levine R, Hedvat CV, et al.Ddx18 is essential for cell-cycle progression in zebrafish hematopoietic cellsand is mutated in human AML. Blood. 2011;118:903–15.
72. Redmond AM, Byrne C, Bane FT, Brown GD, Tibbitts P, O’Brien K, et al. Genomicinteraction between ER and HMGB2 identifies DDX18 as a novel driver ofendocrine resistance in breast cancer cells. Oncogene. 2015;34:3871–80.
73. Fukawa T, Ono M, Matsuo T, Uehara H, Miki T, Nakamura Y, et al. DDX31regulates the p53-HDM2 pathway and rRNA gene transcription through itsinteraction with NPM1 in renal cell carcinomas. Cancer Res. 2012;72:5867–77.
74. Babbio F, Farinacci M, Saracino F, Carbone ML, Privitera E. Expression andlocalization studies of hSDA, the human ortholog of the yeast SDA1 gene.Cell Cycle. 2004;3:486–90.
75. Chauvin C, Koka V, Nouschi A, Mieulet V, Hoareau-Aveilla C, Dreazen A, et al.Ribosomal protein S6 kinase activity controls the ribosome biogenesistranscriptional program. Oncogene. 2014;33:474–83.
76. Ray S, Panova T, Miller G, Volkov A, Porter AC, Russell J, et al. TopoisomeraseIIalpha promotes activation of RNA polymerase I transcription by facilitatingpre-initiation complex formation. Nat Commun. 2013;4:1598.
77. Santoro R, Schmitz KM, Sandoval J, Grummt I. Intergenic transcriptsoriginating from a subclass of ribosomal DNA repeats silence ribosomalRNA genes in trans. EMBO Rep. 2010;11:52–8.
78. Zentner GE, Balow SA, Scacheri PC. Genomic characterization of the mouseribosomal DNA locus. G3 (Bethesda). 2014;4:243–54.
79. van de Nobelen S, Rosa-Garrido M, Leers J, Heath H, Soochit W, Joosen L,et al. CTCF regulates the local epigenetic state of ribosomal DNA repeats.Epigenetics Chromatin. 2010;3:19.
80. Paalman MH, Henderson SL, Sollner-Webb B. Stimulation of themouse rRNA gene promoter by a distal spacer promoter. Mol CellBiol. 1995;15:4648–56.
81. Narendra V, Rocha PP, An D, Raviram R, Skok JA, Mazzoni EO, et al. CTCFestablishes discrete functional chromatin domains at the Hox clustersduring differentiation. Science. 2015;347:1017–21.
82. Guo Y, Xu Q, Canzio D, Shou J, Li J, Gorkin DU, et al. CRISPR inversion ofCTCF sites alters genome topology and enhancer/promoter function. Cell.2015;162:900–10.
83. Muller MT, Mehta VB. DNase I hypersensitivity is independent ofendogenous topoisomerase II activity during chicken erythrocytedifferentiation. Mol Cell Biol. 1988;8:3661–9.
84. Sperling AS, Jeong KS, Kitada T, Grunstein M. Topoisomerase II bindsnucleosome-free DNA and acts redundantly with topoisomerase I to enhancerecruitment of RNA Pol II in budding yeast. Proc Natl Acad Sci U S A.2011;108:12693–8.
85. Gomez-Herreros F, Schuurs-Hoeijmakers JH, McCormack M, Greally MT,Rulten S, Romero-Granados R, et al. TDP2 protects transcription fromabortive topoisomerase activity and is required for normal neural function.Nat Genet. 2014;46:516–21.
86. Haffner MC, De Marzo AM, Meeker AK, Nelson WG, Yegnasubramanian S.Transcription-induced DNA double strand breaks: both oncogenic force andpotential therapeutic target? Clin Cancer Res. 2011;17:3858–64.
87. Polak P, Karlic R, Koren A, Thurman R, Sandstrom R, Lawrence MS, et al.Cell-of-origin chromatin organization shapes the mutational landscape ofcancer. Nature. 2015;518:360–4.
88. Dixon JR, Selvaraj S, Yue F, Kim A, Li Y, Shen Y, et al. Topological domains inmammalian genomes identified by analysis of chromatin interactions.Nature. 2012;485:376–80.
89. Nora EP, Lajoie BR, Schulz EG, Giorgetti L, Okamoto I, Servant N, et al. Spatialpartitioning of the regulatory landscape of the X-inactivation centre. Nature.2012;485:381–5.
90. Phillips-Cremins JE, Sauria ME, Sanyal A, Gerasimova TI, Lajoie BR, Bell JS,et al. Architectural protein subclasses shape 3D organization of genomesduring lineage commitment. Cell. 2013;153:1281–95.
91. Gomez-Marin C, Tena JJ, Acemel RD, Lopez-Mayorga M, Naranjo S, de laCalle-Mustienes E, et al. Evolutionary comparison reveals that divergingCTCF sites are signatures of ancestral topological associating domainsborders. Proc Natl Acad Sci U S A. 2015;112:7542–7.
Uusküla-Reimand et al. Genome Biology (2016) 17:182 Page 21 of 22
92. Liu G, Zhang J, Larsen B, Stark C, Breitkreutz A, Lin ZY, et al. ProHits:integrated software for mass spectrometry-based interaction proteomics.Nat Biotechnol. 2010;28:1015–7.
93. Kessner D, Chambers M, Burke R, Agus D, Mallick P. ProteoWizard: opensource software for rapid proteomics tools development. Bioinformatics.2008;24:2534–6.
94. Eng JK, Jahan TA, Hoopmann MR. Comet: an open-source MS/MS sequencedatabase search tool. Proteomics. 2013;13:22–4.
95. Deutsch EW, Mendoza L, Shteynberg D, Farrah T, Lam H, Tasman N, et al. Aguided tour of the Trans-Proteomic Pipeline. Proteomics. 2010;10:1150–9.
96. Shteynberg D, Deutsch EW, Lam H, Eng JK, Sun Z, Tasman N, et al. iProphet:multi-level integrative analysis of shotgun proteomic data improves peptideand protein identification rates and error estimates. Mol Cell Proteomics.2011;10:M111.007690.
97. Teo G, Liu G, Zhang J, Nesvizhskii AI, Gingras AC, Choi H. SAINTexpress:improvements and additional features in Significance Analysis ofINTeractome software. J Proteomics. 2014;100:37–43.
98. Mellacheruvu D, Wright Z, Couzens AL, Lambert JP, St-Denis NA, Li T, et al.The CRAPome: a contaminant repository for affinity purification-massspectrometry data. Nat Methods. 2013;10:730–6.
99. Reimand J, Arak T, Vilo J. g:Profiler–a web server for functional interpretationof gene lists (2011 update). Nucleic Acids Res. 2011;39:W307–15.
100. Merico D, Isserlin R, Stueker O, Emili A, Bader GD. Enrichment map: anetwork-based method for gene-set enrichment visualization andinterpretation. PLoS One. 2010;5:e13984.
101. Schmidt D, Wilson MD, Spyrou C, Brown GD, Hadfield J, Odom DT. ChIP-seq: using high-throughput sequencing to discover protein-DNAinteractions. Methods. 2009;48:240–8.
102. Wang L, Chen J, Wang C, Uuskula-Reimand L, Chen K, Medina-Rivera A, et al.MACE: model based analysis of ChIP-exo. Nucleic Acids Res. 2014;42:e156.
103. Stamatoyannopoulos JA, Snyder M, Hardison R, Ren B, Gingeras T, GilbertDM, et al. An encyclopedia of mouse DNA elements (Mouse ENCODE).Genome Biol. 2012;13:418.
104. Barbosa-Morais NL, Irimia M, Pan Q, Xiong HY, Gueroussov S, Lee LJ, et al.The evolutionary landscape of alternative splicing in vertebrate species.Science. 2012;338:1587–93.
105. Wang H, Maurano MT, Qu H, Varley KE, Gertz J, Pauli F, et al. Widespreadplasticity in CTCF occupancy linked to DNA methylation. Genome Res.2012;22:1680–8.
106. Li H, Durbin R. Fast and accurate short read alignment with Burrows-Wheeler transform. Bioinformatics. 2009;25:1754–60.
107. Landt SG, Marinov GK, Kundaje A, Kheradpour P, Pauli F, Batzoglou S, et al.ChIP-seq guidelines and practices of the ENCODE and modENCODEconsortia. Genome Res. 2012;22:1813–31.
108. Zhang Y, Liu T, Meyer CA, Eeckhoute J, Johnson DS, Bernstein BE, et al.Model-based analysis of ChIP-Seq (MACS). Genome Biol. 2008;9:R137.
109. Mohammed H, D’Santos C, Serandour AA, Ali HR, Brown GD, Atkins A, et al.Endogenous purification reveals GREB1 as a key estrogen receptorregulatory factor. Cell Rep. 2013;3:342–9.
110. Ji X, Li W, Song J, Wei L, Liu XS. CEAS: cis-regulatory element annotationsystem. Nucleic Acids Res. 2006;34:W551–4.
111. Heger A, Webber C, Goodson M, Ponting CP, Lunter G. GAT: a simulationframework for testing the association of genomic intervals. Bioinformatics.2013;29:2046–8.
112. Ross-Innes CS, Stark R, Teschendorff AE, Holmes KA, Ali HR, Dunning MJ,et al. Differential oestrogen receptor binding is associated with clinicaloutcome in breast cancer. Nature. 2012;481:389–93.
113. Shen L, Shao N, Liu X, Nestler E. ngs.plot: Quick mining and visualization ofnext-generation sequencing data by integrating genomic databases. BMCGenomics. 2014;15:284.
114. Phanstiel DH, Boyle AP, Araya CL, Snyder MP. Sushi.R: flexible, quantitativeand integrative genomic visualizations for publication-quality multi-panelfigures. Bioinformatics. 2014;30:2808–10.
115. Rosenbloom KR, Armstrong J, Barber GP, Casper J, Clawson H, Diekhans M,et al. The UCSC Genome Browser database: 2015 update. Nucleic Acids Res.2015;43:D670–81.
116. Thomas-Chollier M, Herrmann C, Defrance M, Sand O, Thieffry D, vanHelden J. RSAT peak-motifs: motif analysis in full-size ChIP-seq datasets.Nucleic Acids Res. 2012;40:e31.
117. Quinlan AR, Hall IM. BEDTools: a flexible suite of utilities for comparinggenomic features. Bioinformatics. 2010;26:841–2.
118. Starick SR, Ibn-Salem J, Jurk M, Hernandez C, Love MI, Chung HR, et al. ChIP-exo signal associated with DNA-binding motifs provides insight into thegenomic binding of the glucocorticoid receptor and cooperatingtranscription factors. Genome Res. 2015;25:825–35.
119. Medina-Rivera A, Defrance M, Sand O, Herrmann C, Castro-Mondragon JA,Delerce J, et al. RSAT 2015: Regulatory Sequence Analysis Tools. NucleicAcids Res. 2015;43:W50–6.
120. Keane TM, Goodstadt L, Danecek P, White MA, Wong K, Yalcin B, et al.Mouse genomic variation and its effect on phenotypes and generegulation. Nature. 2011;477:289–94.
121. van de Geijn B, McVicker G, Gilad Y, Pritchard JK. WASP: allele-specificsoftware for robust molecular quantitative trait locus discovery. NatMethods. 2015;12:1061–3.
122. Younesy H, Moller T, Heravi-Moussavi A, Cheng JB, Costello JF, Lorincz MC,et al. ALEA: a toolbox for allele-specific epigenomics analysis. Bioinformatics.2014. doi:10.1093/bioinformatics/btt744.
• We accept pre-submission inquiries
• Our selector tool helps you to find the most relevant journal
• We provide round the clock customer support
• Convenient online submission
• Thorough peer review
• Inclusion in PubMed and all major indexing services
• Maximum visibility for your research
Submit your manuscript atwww.biomedcentral.com/submit
Submit your next manuscript to BioMed Central and we will help you at every step:
Uusküla-Reimand et al. Genome Biology (2016) 17:182 Page 22 of 22