Embed Size (px)
Citation preview

Chapter 3 Review APSTATS - Solutions
Chapter 3 – Describing Relationships
INTRODUCTION
1. Describe why it is important to investigate relationships between variables. It is important to investigate relationships between variables in order to learn the behavior of the relationship. Does explanatory variable cause the response? How confident can we be? Exploring and interpreting the correlation, R2, the standard deviation of the residuals helps to determine whether a linear model is a good fit for the data. Then, we can use the statistics from the sample to make inferences about the parameters of the population.
3.1 EXPLANATORY/RESPONSE VARIABLES, DISPLAYING/INTERPRETING RELATIONSHIPS (SCATTERPLOTS)
2. Identify explanatory and response variables in situations where one variable helps to explain or influences the other.
PRACTICE: In each of the following situations. Is it more reasonable to simply explore the relationship between the two variables or to view one of the variables as an explanatory variable and the other as a response variable? Is the latter case, which is the explanatory variable and which is the response variable?
(a) The amount of time a student spends studying for a statistics exam and the grade of the exam.
Time spent studying is explanatory; the grade is the response variable.
(b) The weight and height of a person.
Explore the relationship; there is no reason to view one or the other as explanatory.
(c) The amount of yearly rainfall and the yield of a crop.
Rainfall is explanatory; crop yield is the response variable.
(d) A student’s grade in statistics and in French.
Explore the relationship.
(e) The occupational class of a father and of a son.
The father’s class is explanatory; the son’s class is the response variable.
3. Make scatter plot to display the relationship between two quantitative variables.

4. Describe the direction, form, and strength of the overall pattern of a scatterplot.
PRACTICE: Describe the direction, form, and strength of the overall pattern of each scatterplot using the following words;Direction Form StrengthPositive Linear StrongNegative Curved Moderate/FairlyNone Cluster Weak
(a) r = 0.32
Positive, weak linear correlation
(b)
(c)

(d)
(e)
5. Recognize Outliers in a scatter plot.
PRACTICE: Identify the outlier in each scatterplot using coordinate notation. Explain why it is an outlier in context.
(a)
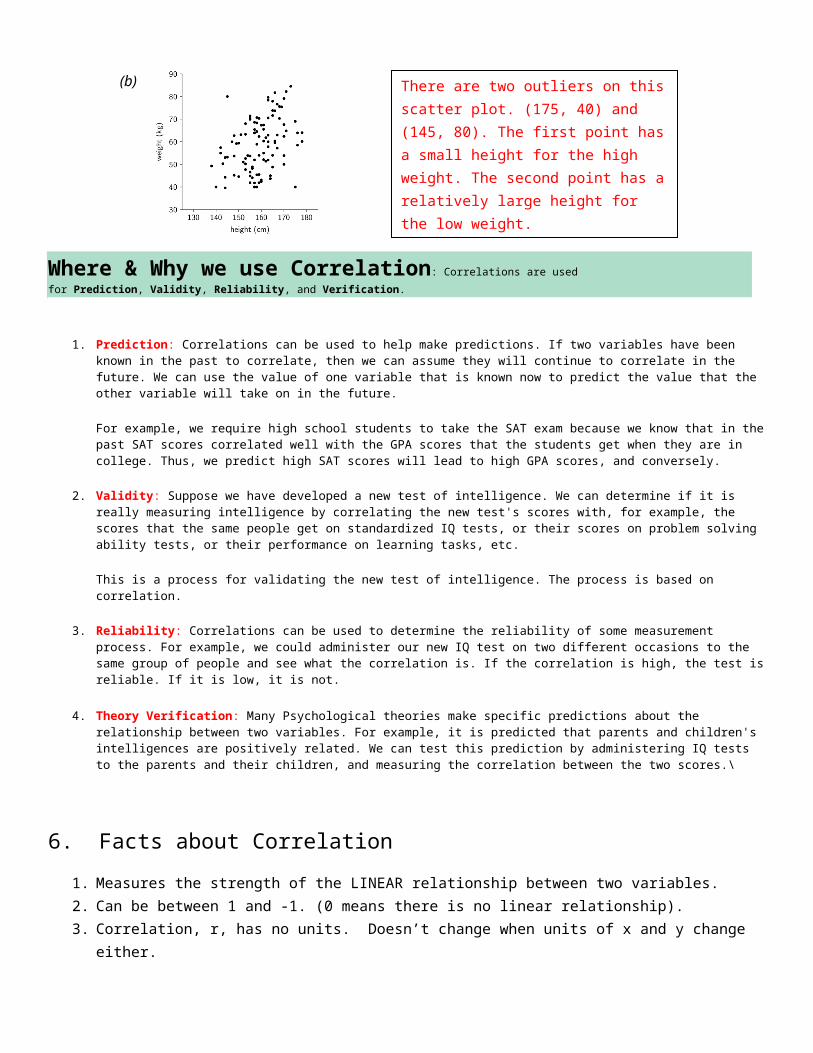
(b)
The outlier is the point (7.2, 1.8). The point is located in the bottom right corner of the graph. It is an outlier because it has a larger x and a small y.
There are two outliers on this scatter plot. (175, 40) and (145, 80). The first point has a small height for the high weight. The second point has a relatively large height for the low weight.

Where & Why we use Correlation: Correlations are used for Prediction, Validity, Reliability, and Verification.
1. Prediction: Correlations can be used to help make predictions. If two variables have been known in the past to correlate, then we can assume they will continue to correlate in the future. We can use the value of one variable that is known now to predict the value that the other variable will take on in the future.
For example, we require high school students to take the SAT exam because we know that in the past SAT scores correlated well with the GPA scores that the students get when they are in college. Thus, we predict high SAT scores will lead to high GPA scores, and conversely.
2. Validity: Suppose we have developed a new test of intelligence. We can determine if it is really measuring intelligence by correlating the new test's scores with, for example, the scores that the same people get on standardized IQ tests, or their scores on problem solving ability tests, or their performance on learning tasks, etc.
This is a process for validating the new test of intelligence. The process is based on correlation.
3. Reliability: Correlations can be used to determine the reliability of some measurement process. For example, we could administer our new IQ test on two different occasions to the same group of people and see what the correlation is. If the correlation is high, the test is reliable. If it is low, it is not.
4. Theory Verification: Many Psychological theories make specific predictions about the relationship between two variables. For example, it is predicted that parents and children's intelligences are positively related. We can test this prediction by administering IQ tests to the parents and their children, and measuring the correlation between the two scores.\
6. Facts about Correlation
1. Measures the strength of the LINEAR relationship between two variables.2. Can be between 1 and -1. (0 means there is no linear relationship).3. Correlation, r, has no units. Doesn’t change when units of x and y change either. 4. Does not matter which variable is the explanatory or the response, correlation will remain the same between
two variables. 5. Both variables must be quantitative to find a correlation. 6. Correlation does not describe the strength of a curved relationship. 7. Correlation is not resistant to spread and so is influenced by extreme values.
7. Interpreting Slope and Y-Intercept of a Regression Line
PRACTICE: Identify the slope and y-intercept in each situation. Describe what the slope and y-intercept mean in context.
(a) Predicted highway mpg = 4.62 + 1.109(city mpg)The slope is 1.109. We predict that highway mileage will increase by 1.109 mpg for each 1 mpg increase in city mileage. The y-intercept is 4.62 mpg. This is not statistically meaningful because this would represent the highway mileage for a car that gets 0 mpg in the city.
(b) Predicted reading score = -33.4 + 0.882(IQ score) The slope is 0.882. We predict that reading scores will increase by 0.882 for each one-point in IQ. The y-intercept is -33.4. This would be statistically meaningful only if a child could have an IQ score of 0.
(c) Predicted pH = 5.43 – 0.0053(weeks)The slope is -0.0053; the pH decreases by 0.0053 units per week on average. The y-intercept is 5.43, and it provides an estimate for the pH level at the beginning of the study.
(d) Predicted gas consumed = 1425 – 19.87(temperature F)The slope is -19.87. We predict the amount of gas consumed by Joan’s home to decrease by 19.87 cubic feet for every degree the average monthly temperature increase. The y-intercept is 1425 which means that when the temp is 0*F the predicted gas consumption would be 1425 cubic feet.
8. Use the regression line to predict a y given an x.
9. Explain the dangers of EXTRAPOLATION.
10. Calculate and Interpret Residuals
a. actual – predicted = residual (pos. – under predicted, neg. – over predicted) b. Use the standard deviation of the residuals to determine if a residual is larger or small.
11. Explain the concept of a “Least-Squares Regression Line”This line minimizes the square of the vertical distance between the points and the line.
12. Use technology to calculate the Least-Squares Regression Line
13. Find the slope and y-intercept of a least-squares regression line from the means and standard deviations of x and y and their correlation.
b = r sysx the slope is equal to the correlation times the standard deviation of y divided by the standard
deviation of x.
y – intercept a = y – bx mean of y minus the slope times the mean of x.
*See Chapter 3 Test #4 question for example of what a problem covering this objective looks like.
14. Construct and Interpret residual plots to assess if a linear model is appropriate.
15. Use the standard deviation of the residuals to assess how well the line fits the data.

16. Use r2 to assess how well the line fits the data.
“______% of the variation on the variable y is accounted for by the least-squares regression line.”
17. Identify the equation of the least-squares regression line from computer output.
18. Explain why associate doesn’t imply causation.
PRACTICE: Explain why the association does not imply causation in this situation.
In the National Basketball Association, there is a strong positive association between the number of turnovers a player has and the number of points that he scores. A turnover is when a player loses the ball to the other team. Could a player increase his point totals by turning the ball over more frequently?
No! Turning the ball over to the other team doesn’t cause a player to score more points. Instead, there is an important lurking variable that influences both variables, playing time. Players who are on the court more often tend to score more points and have more turnovers than players who don’t get much playing time.
19. Recognize how slope, y-intercept, standard deviation of the residuals, and r2 are influenced by extreme observations.
PRACTICE: Is it possible to predict battery life of a new netbook? Is battery life related to the weight of a netbook?
Battery Life (hours) Weight (pounds) Cost (dollars)6.00 2.8 3707.75 2.9 3507.25 2.8 3305.50 2.4 3708.25 2.9 3609.50 2.9 4007.75 2.9 3407.75 2.7 3408.00 2.8 3507.00 2.8 3506.50 3.2 3606.26 2.7 3105.25 2.9 3305.00 2.7 3203.75 2.6 3804.50 2.8 3352.75 2.4 3502.75 2.4 3002.50 2.6 2802.50 2.5 5002.00 2.5 2902.75 2.5 500
L1-xL2-y

DETAILS!!!!!!!! (Phrasing, every word counts, order matters, labels!, answer all parts, use your words)
(a) Create a scatter plot.
(b) Write the line of the least-squares regression line.Ŷ = -16.045 + 7.944x
(c) Identify and explain the slope and y-intercept in context. The slope is 7.944 hours per pound. This means that for every increase in 1 pound the battery life will increase 7.944 hours.
The y-intercept is -16.045 which means that when the battery weights zero pounds the battery life is -16.045. This does not make sense because of Extrapolation.
(d) What is the correlation and r2. Interpret both in context. Correlation: r = 0.7227 means there is a fairly strong, positive, linear relationship
R2 = 52% meaning that 52% of the variation of battery life is accounted for by the least-squares regression line.
(e) Create a residual plot. What is the standard deviation of the residuals?
(f) Based on your answers from (d), how well does a line fit this data? Provide evidence.A line is a good fit for this data set because the residual plot shows a random scatter, the correlation is 0.7 which means there is a fairly strong linear relationship, and R2 is
Battery Life (hours)
Weight (pounds)
Weight (pounds)
Residuals (hours)

52% which means more than half of the variation on Battery Life (hours) is accounted for by the regression line.
(g) Are there any outliers? If so, identify it/them. Explain what is unusual about it/them. (3.2, 6.5) The netbook with a weight of 3.2 and a battery life of 6.5 is unusual because it has less battery life than other netbooks with a similar weight.
(h) How do these outliers affect the data? (Find the least-squares regression line, correlation, and r2 both with and without the outliers.) Without the outlier, the regression line is: predicted battery life = -21.9 + 10.17(weight)This increased the slope by more than 2 and increased R2 from 52% to 63%. The correlation only increases by about a 7 hundredths of a point from 0.72 to 0.79.

See Ms. Golis for Answers.
Chapter 3 - HOMEWORK Retake Practice Test
1. Multiple Choice: There is a strong negative correlation between latitude above the equator and number of hours of daylight on December 21. (1pt)
A. Explanatory: Time of year Response: Daylight hours
B. Explanatory: Latitude Response: Daylight hours
C. Explanatory: Daylight hours Response: Latitude
D. Explanatory: Latitude Response: Average temperature
2. Open-ended Response: Write your solutions to the following tasks.
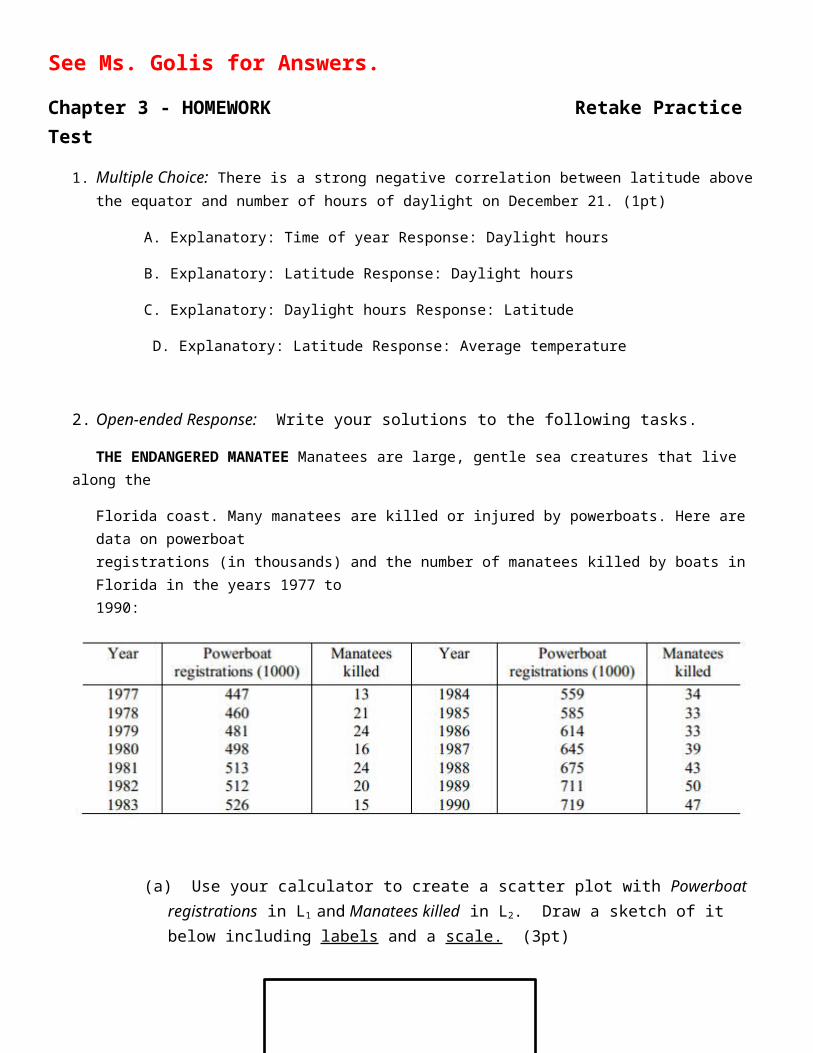
THE ENDANGERED MANATEE Manatees are large, gentle sea creatures that live along the
Florida coast. Many manatees are killed or injured by powerboats. Here are data on powerboat registrations (in thousands) and the number of manatees killed by boats in Florida in the years 1977 to 1990:
(a) Use your calculator to create a scatter plot with Powerboat registrations in L1 and Manatees killed in L2. Draw a sketch of it below including labels and a scale. (3pt)


(b) Circle the correct description(s) of the scatter plot for each (3pts):i. Direction: positive negative none
ii. Form(s): linear curved clusters
iii. Strength: none weak fairly strong strong
(c) Use your calculator to find the least-squares regression line and write it below. Be sure to define your variables. (2pts)
(d) Use the least-squares regression line to find the predicted number of manatee deaths for 614 power boat registrations. Show your work!!!! Then, find the residual for this point; explain what it means. (4pts)
(e) Use your calculator to find the correlation of the least-squares regression line. Explain what this means. (2pts)
(f) What is R2? Explain what this means. (2pts)
(g) Calculate the standard deviation of y and the standard deviation of x. (b = r sysx ) Which is larger? Explain. (4pts)
(h) Is a line a good model for this data? Use evidence to support your claim.
Extra Credit: Make a residual plot for this data. Sketch is below. Explain why it supports your claim in (h). (3pts)
Chapter 3 Review APSTATS
Chapter 3 – Describing Relationships
INTRODUCTION
1. Describe why it is important to investigate relationships between variables. ____________________________________________________________________________________________________________________________________________________________________________________________________________________________________________________________________________________________________________________________________________________________________________
3.1 EXPLANATORY/RESPONSE VARIABLES, DISPLAYING/INTERPRETING RELATIONSHIPS (SCATTERPLOTS)
2. Identify explanatory and response variables in situations where one variable helps to explain or influences the other.
PRACTICE: In each of the following situations. Is it more reasonable to simply explore the relationship between the two variables or to view one of the variables as an explanatory variable and the other as a response variable? Is the latter case, which is the explanatory variable and which is the response variable?
(a) The amount of time a student spends studying for a statistics exam and the grade of the exam.
(b) The weight and height of a person.
(c) The amount of yearly rainfall and the yield of a crop.
(d) A student’s grade in statistics and in French.
(e) The occupational class of a father and of a son.
3. Make scatter plot to display the relationship between two quantitative variables.

4. Describe the direction, form, and strength of the overall pattern of a scatterplot.
PRACTICE: Describe the direction, form, and strength of the overall pattern of each scatterplot using the following words;Direction Form StrengthPositive Linear StrongNegative Curved Moderate/FairlyNone Cluster Weak
(f) r = 0.32
(g)
(h)

(i)
(j)
5. Recognize Outliers in a scatter plot.
PRACTICE: Identify the outlier in each scatterplot using coordinate notation. Explain why it is an outlier in context.
(c)
(d)

Where & Why we use Correlation: Correlations are used for Prediction, Validity, Reliability, and Verification.
1. ________________ Correlations can be used to help make predictions. If two variables have been known in the past to correlate, then we can assume they will continue to correlate in the future. We can use the value of one variable that is known now to predict the value that the other variable will take on in the future.
For example, we require high school students to take the SAT exam because we know that in the past SAT scores correlated well with the GPA scores that the students get when they are in college. Thus, we predict high SAT scores will lead to high GPA scores, and conversely.
2. _________________ Suppose we have developed a new test of intelligence. We can determine if it is really measuring intelligence by correlating the new test's scores with, for example, the scores that the same people get on standardized IQ tests, or their scores on problem solving ability tests, or their performance on learning tasks, etc.
This is a process for validating the new test of intelligence. The process is based on correlation.
3. __________________Correlations can be used to determine the reliability of some measurement process. For example, we could administer our new IQ test on two different occasions to the same group of people and see what the correlation is. If the correlation is high, the test is reliable. If it is low, it is not.
4. _________________: Many Psychological theories make specific predictions about the relationship between two variables. For example, it is predicted that parents and children's intelligences are positively related. We can test this prediction by administering IQ tests to the parents and their children, and measuring the correlation between the two scores.\
6. Facts about Correlation
1. Measures the strength of the LINEAR relationship between two variables.2. Can be between 1 and -1. (0 means there is no linear relationship).3. Correlation, r, has no units. Doesn’t change when units of x and y change either. 4. Does not matter which variable is the explanatory or the response, correlation will remain the same between
two variables. 5. Both variables must be quantitative to find a correlation. 6. Correlation does not describe the strength of a curved relationship. 7. Correlation is not resistant to spread and so is influenced by extreme values.
7. Interpreting Slope and Y-Intercept of a Regression Line
PRACTICE: Identify the slope and y-intercept in each situation. Describe what the slope and y-intercept mean in context.
(a) Predicted highway mpg = 4.62 + 1.109(city mpg)
(b) Predicted reading score = -33.4 + 0.882(IQ score)

(c) Predicted pH = 5.43 – 0.0053(weeks)
(d) Predicted gas consumed = 1425 – 19.87(temperature F)
8. Use the regression line to predict a y given an x.
9. Explain the dangers of EXTRAPOLATION.
10. Calculate and Interpret Residuals
a. actual – predicted = residual (pos. – under predicted, neg. – over predicted) b. Use the standard deviation of the residuals to determine if a residual is larger or small.
11. Explain the concept of a “Least-Squares Regression Line”____________________________________________________________________________________________________________________________________________________________________________________________________________________________________________________________________________________________________________________________________________________________________________________________________
12. Use technology to calculate the Least-Squares Regression Line
13. Find the slope and y-intercept of a least-squares regression line from the means and standard deviations of x and y and their correlation.
b = r sysx the slope is equal to the correlation times the standard deviation of y divided by the standard
deviation of x.
y – intercept a = y – bx mean of y minus the slope times the mean of x.
*See Chapter 3 Test #4 question for example of what a problem covering this objective looks like.
14. Construct and Interpret residual plots to assess if a linear model is appropriate.
15. Use the standard deviation of the residuals to assess how well the line fits the data.

16. Use r2 to assess how well the line fits the data.
“______% of the variation on the variable y is accounted for by the least-squares regression line.”
17. Identify the equation of the least-squares regression line from computer output.
18. Explain why associate doesn’t imply causation.
PRACTICE: Explain why the association does not imply causation in this situation.
In the National Basketball Association, there is a strong positive association between the number of turnovers a player has and the number of points that he scores. A turnover is when a player loses the ball to the other team. Could a player increase his point totals by turning the ball over more frequently?
_______________________________________________________________________________________________________________________________________________________________________________________________________________________________________________________________________________________________________________________________________________________________________________________________________________________________________________________________________
19. Recognize how slope, y-intercept, standard deviation of the residuals, and r2 are influenced by extreme observations.
PRACTICE: Is it possible to predict battery life of a new netbook? Is battery life related to the weight of a netbook?
Battery Life (hours) Weight (pounds) Cost (dollars)6.00 2.8 3707.75 2.9 3507.25 2.8 3305.50 2.4 3708.25 2.9 3609.50 2.9 4007.75 2.9 3407.75 2.7 3408.00 2.8 3507.00 2.8 3506.50 3.2 3606.26 2.7 3105.25 2.9 3305.00 2.7 3203.75 2.6 3804.50 2.8 3352.75 2.4 3502.75 2.4 3002.50 2.6 2802.50 2.5 5002.00 2.5 2902.75 2.5 500

DETAILS!!!!!!!! (Phrasing, every word counts, order matters, labels!, answer all parts, use your words)
(a) Create a scatter plot.
(b) Write the line of the least-squares regression line.
(c) Identify and explain the slope and y-intercept in context.
(d) What is the correlation and r2. Interpret both in context.
(e) Create a residual plot. What is the standard deviation of the residuals?
(f) Based on your answers from (d), how well does a line fit this data? Provide evidence.________________________________________________________________________________________________________________________________________________________________________________________________________________________________________________________________________________________________________________________________________________
(g) Are there any outliers? If so, identify it/them. Explain what is unusual about it/them. ________________________________________________________________________________________________________________________________________________________________________
(h) How do these outliers affect the data? (Find the least-squares regression line, correlation, and r2 both with and without the outliers.)________________________________________________________________________________________________________________________________________________________________________________________________________________________________________________________________________________________________________________________________________________
(i) Calculate the standard deviation of y and standard deviation of x using the following
formula: b = rSySx

Name: ______________________________________________________________ Period: _____ Date: _________
Chapter 3 Revive for Re-take
3. Multiple Choice: There is a strong negative correlation between latitude above the equator and number of hours of daylight on December 21. (1pt)
A. Explanatory: Time of year Response: Daylight hours
B. Explanatory: Latitude Response: Daylight hours
C. Explanatory: Daylight hours Response: Latitude
D. Explanatory: Latitude Response: Average temperature
4. Open-ended Response: Write your solutions to the following tasks.
THE ENDANGERED MANATEE Manatees are large, gentle sea creatures that live along the
Florida coast. Many manatees are killed or injured by powerboats. Here are data on powerboat registrations (in thousands) and the number of manatees killed by boats in Florida in the years 1977 to 1990:
(i) Use your calculator to create a scatter plot with Powerboat registrations in L1 and Manatees killed in L2. Draw a sketch of it below including labels and a scale. (3pt)


(j) Circle the correct description(s) of the scatter plot for each (3pts):i. Direction: positive negative none
ii. Form(s): linear curved clusters
iii. Strength: none weak fairly strong strong
(k) Use your calculator to find the least-squares regression line and write it below. Be sure to define your variables. (2pts)
(l) Use the least-squares regression line to find the predicted number of manatee deaths for 614 power boat registrations. Show your work!!!! Then, find the residual for this point; explain what it means. (4pts)
(m)Use your calculator to find the correlation of the least-squares regression line. Explain what this means. (2pts)
(n) What is R2? Explain what this means. (2pts)
(o) Calculate the standard deviation of y and the standard deviation of x. (b = r sysx ) Which is larger? Explain. (4pts)
(p) Is a line a good model for this data? Use evidence to support your claim.
Extra Credit: Make a residual plot for this data. Sketch is below. Explain why it supports your claim in (h). (3pts)
![Vermont telegraph. (Brandon, Vt) 1838-06-20 [p 155]....Tobacco. It has been ascertained that one hundred million pounds of tobacco are annually consumed in the TJ. States, and it is](https://img.pdfslide.us/doc/110x75/5e921e4edaae267a6e0d1bfe/vermont-telegraph-brandon-vt-1838-06-20-p-155-tobacco-it-has-been-ascertained.jpg)
![Tom&Jerry-Katalog WEB draft0 rev4-small - TJ Labels sticky notes ppp tj-cherry zez tj-bird tj-car tj-fruit model flags t]-garden tj-candy tj-sea](https://img.pdfslide.us/doc/110x75/5ae5d4947f8b9a9e5d8cec91/tomjerry-katalog-web-draft0-rev4-small-tj-sticky-notes-ppp-tj-cherry-zez-tj-bird.jpg)