Embed Size (px)
Citation preview
Titan Operation Manual
Pete Eschbach
Linus Pauling Science Center
Oregon State University
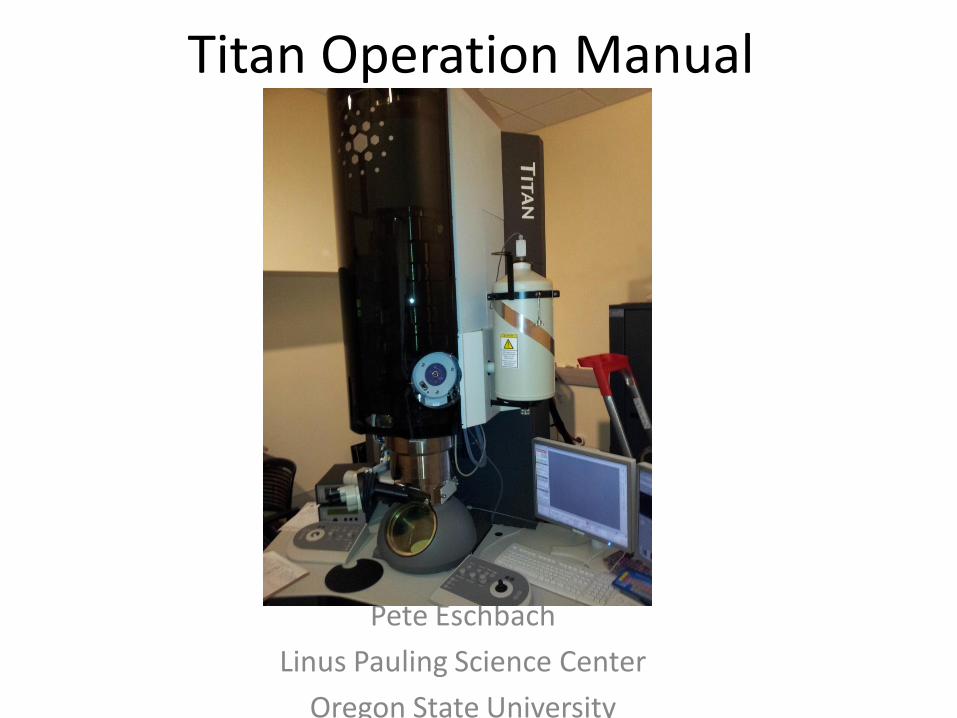
Put Rod to first position and open the vacuum overview page

After Airlock Cycle Times Out, 5 minutes, Insert Sample Rod by turning CCW, Don’t
delay!
When time reaches 0, insert rod by turning Counter Clockwise and letting it gently into the Titan.
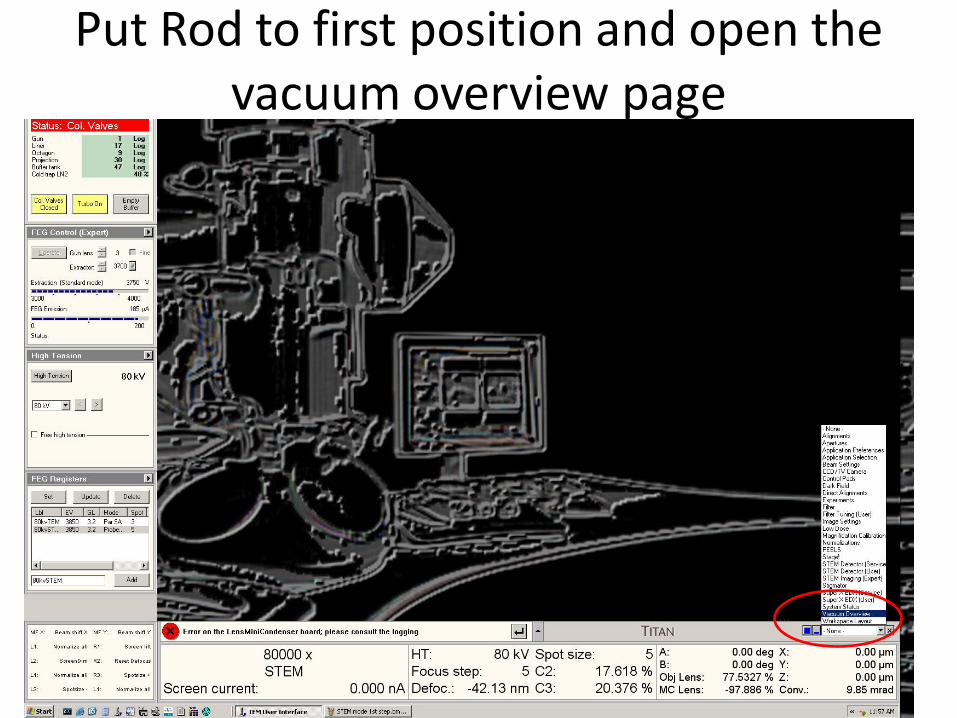
After inserting Octagon Pressure should be less than 25.
Now click on Col Valves Closed to turn on Beam!
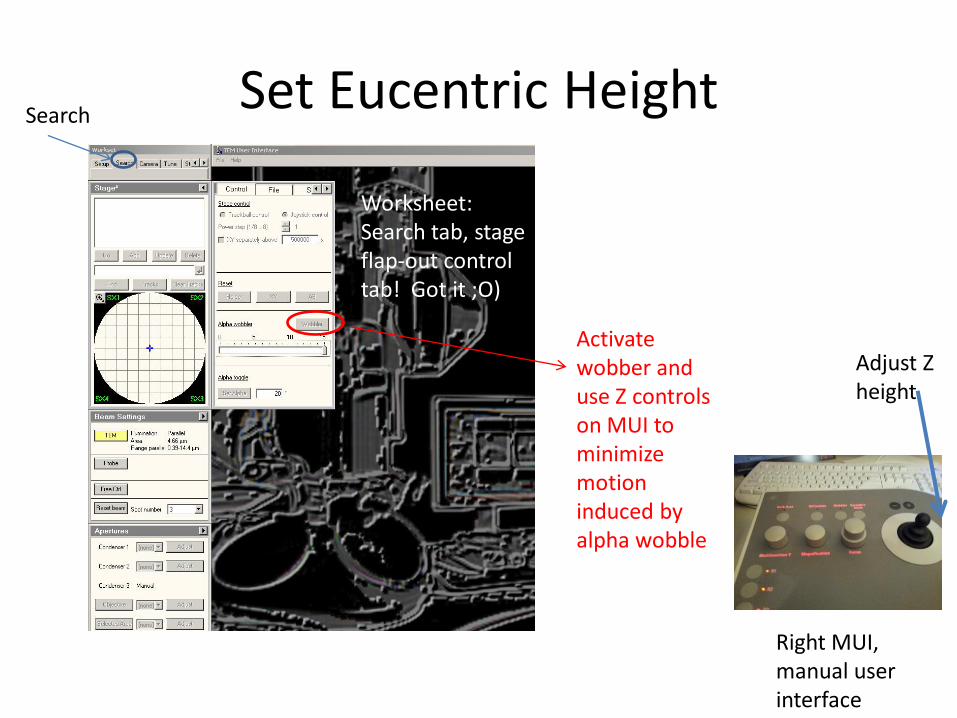
Set Eucentric Height
Activate wobber and use Z controls on MUI to minimize motion induced by alpha wobble
Right MUI, manual user interface
Worksheet: Search tab, stage flap-out control tab! Got it ;O)
Search
Adjust Z height
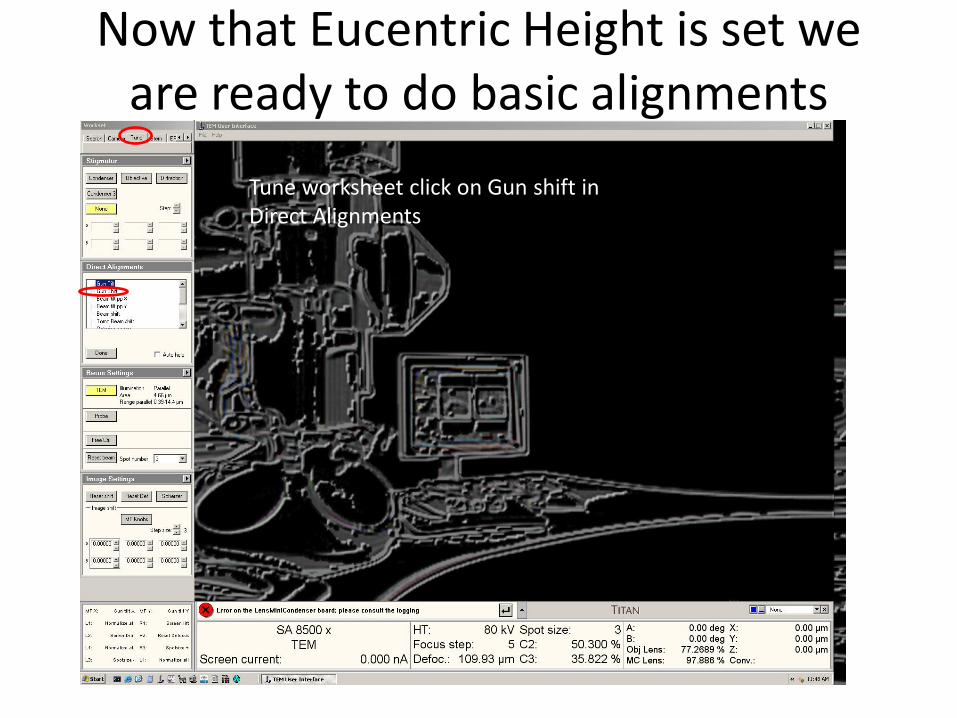
Now that Eucentric Height is set we are ready to do basic alignments
Tune worksheet click on Gun shift in Direct Alignments
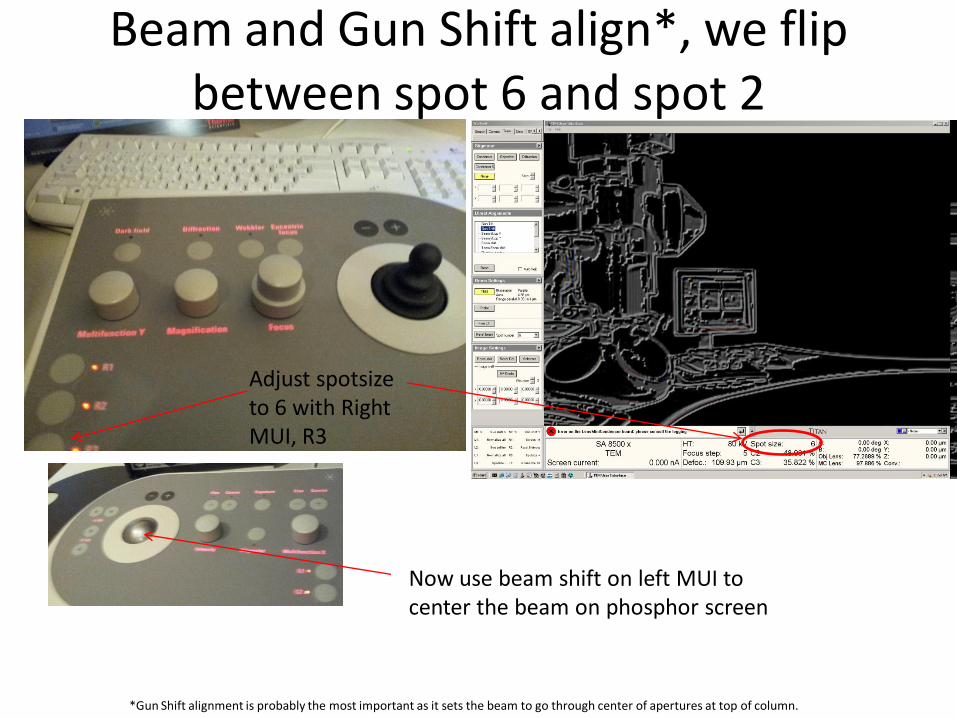
Beam and Gun Shift align*, we flip between spot 6 and spot 2
*Gun Shift alignment is probably the most important as it sets the beam to go through center of apertures at top of column.
Adjust spotsize to 6 with Right MUI, R3
Now use beam shift on left MUI to center the beam on phosphor screen
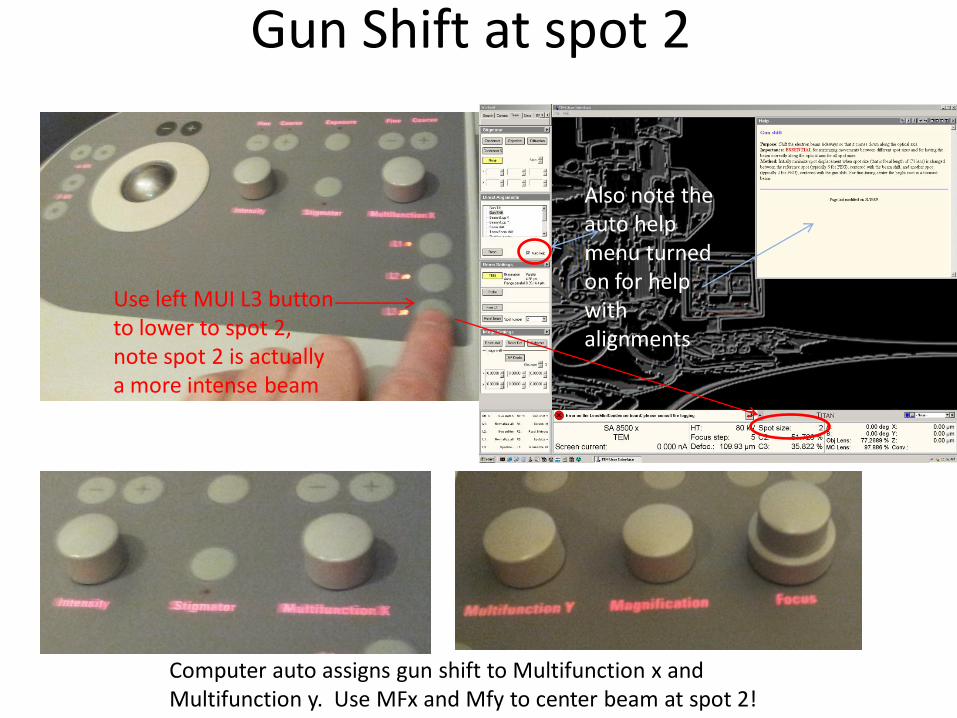
Gun Shift at spot 2
Use left MUI L3 button to lower to spot 2, note spot 2 is actually a more intense beam
Also note the auto help menu turned on for help with alignments
Computer auto assigns gun shift to Multifunction x and Multifunction y. Use MFx and Mfy to center beam at spot 2!
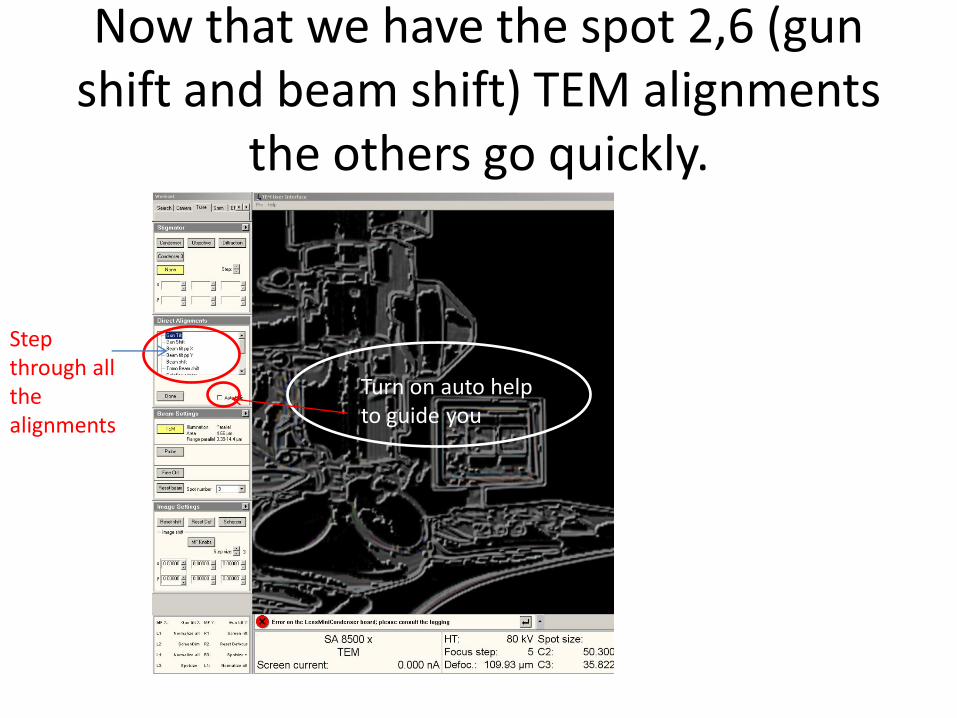
Now that we have the spot 2,6 (gun shift and beam shift) TEM alignments
the others go quickly.
Step through all the alignments
Turn on auto help to guide you
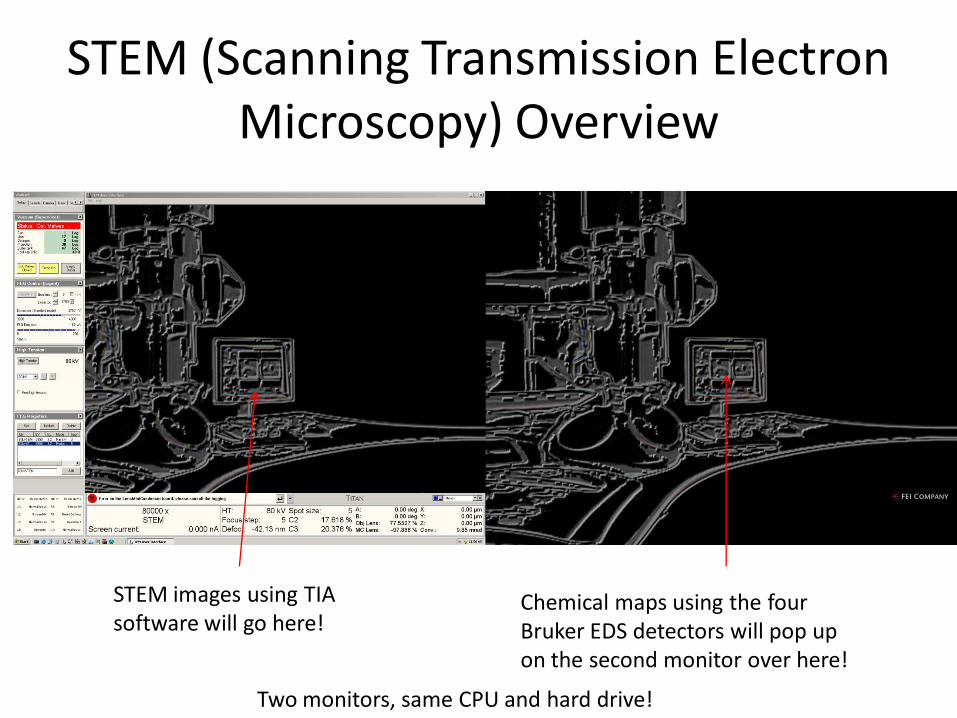
STEM (Scanning Transmission Electron Microscopy) Overview
STEM images using TIA software will go here!
Chemical maps using the four Bruker EDS detectors will pop up on the second monitor over here!
Two monitors, same CPU and hard drive!

TEM to STEM steps 1, 2, 3
Step 1, set STEM register
2) Go to STEM worksheet
3) Click on STEM
Mode at bottom of screen now says STEM!
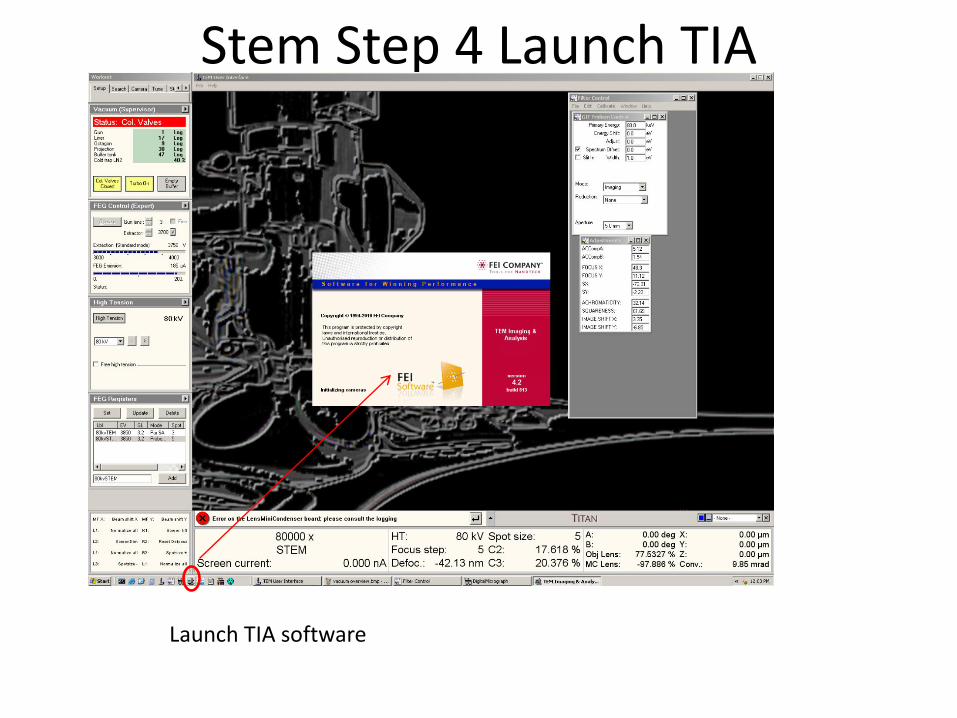
Stem Step 4 Launch TIA
Launch TIA software

STEM Step 5 Insert detectors, 6 click search
TIA software
STEM Image area
5
6
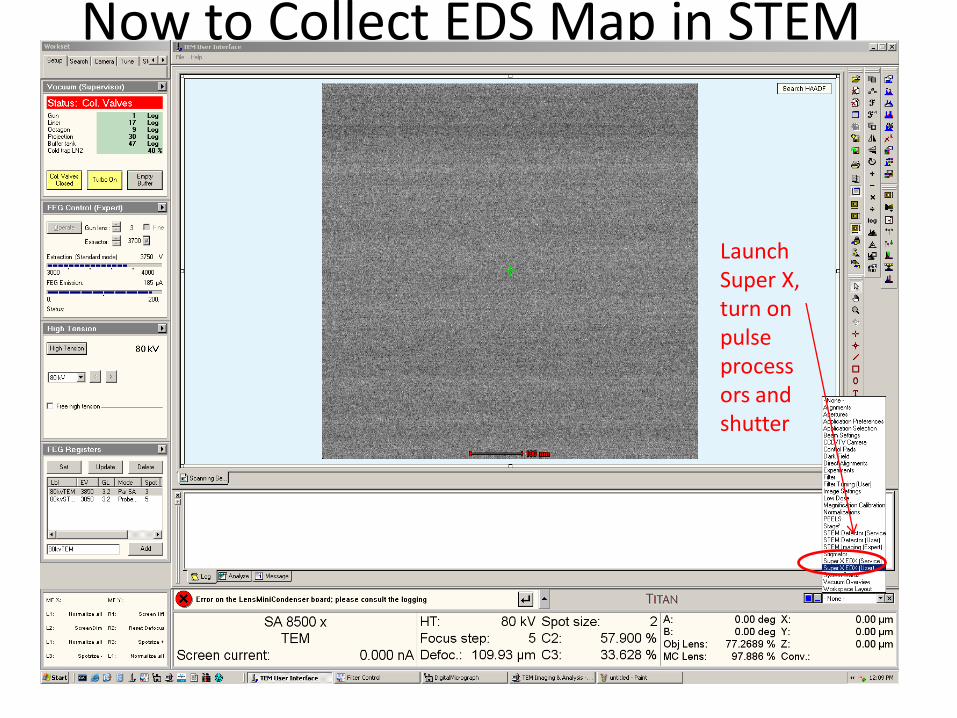
Now to Collect EDS Map in STEM
Launch Super X, turn on pulse processors and shutter
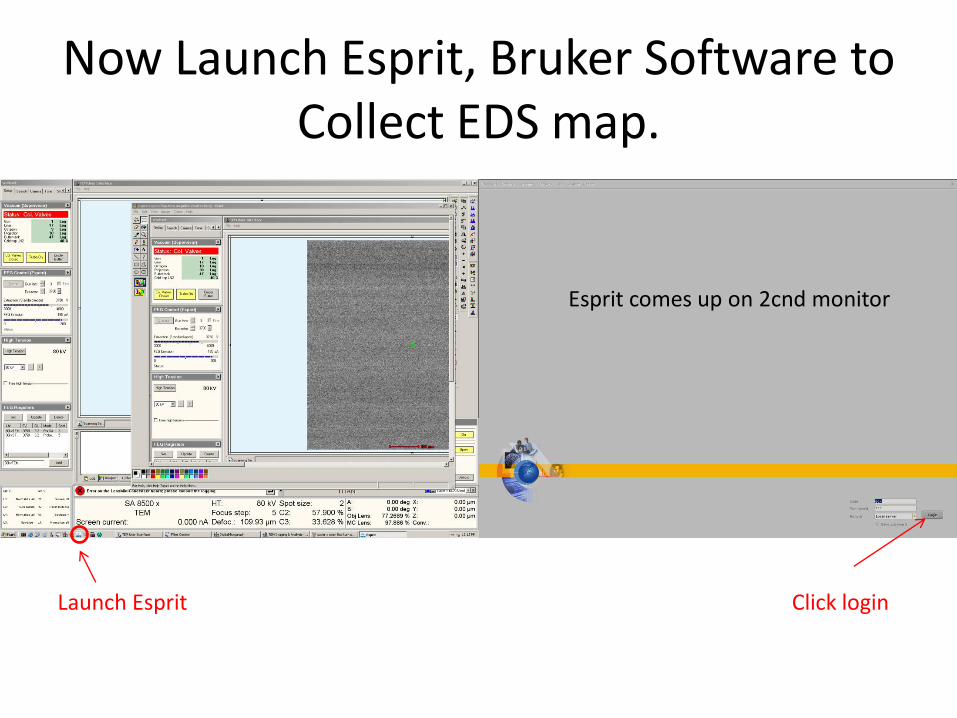
Now Launch Esprit, Bruker Software to Collect EDS map.
Esprit comes up on 2cnd monitor
Click login Launch Esprit
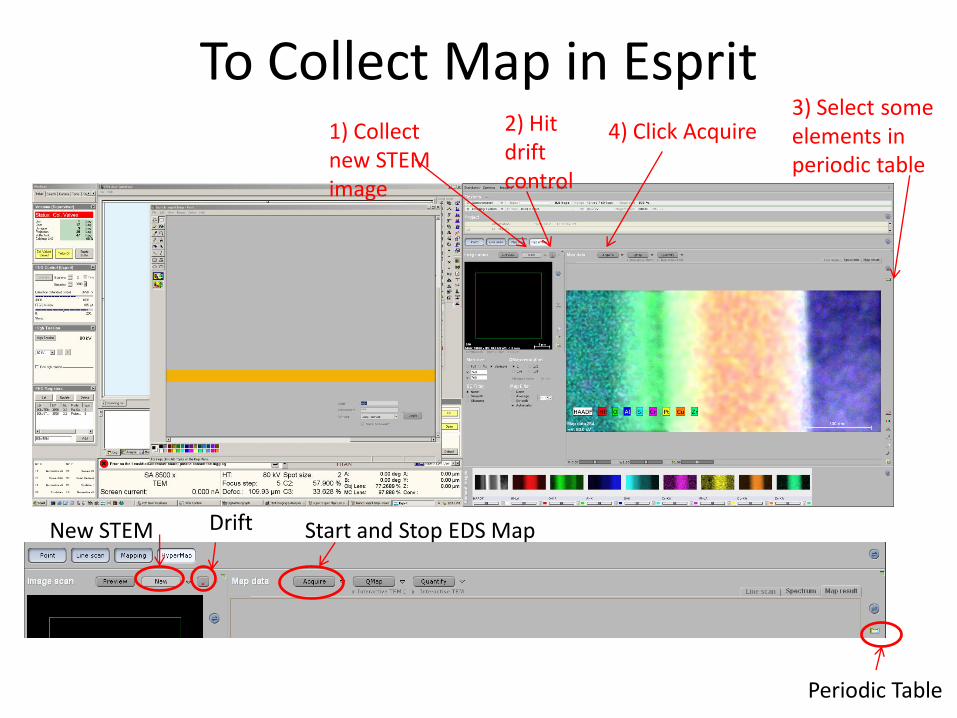
To Collect Map in Esprit 1) Collect new STEM image
2) Hit drift control
4) Click Acquire 3) Select some elements in periodic table
Drift New STEM
Periodic Table
Start and Stop EDS Map
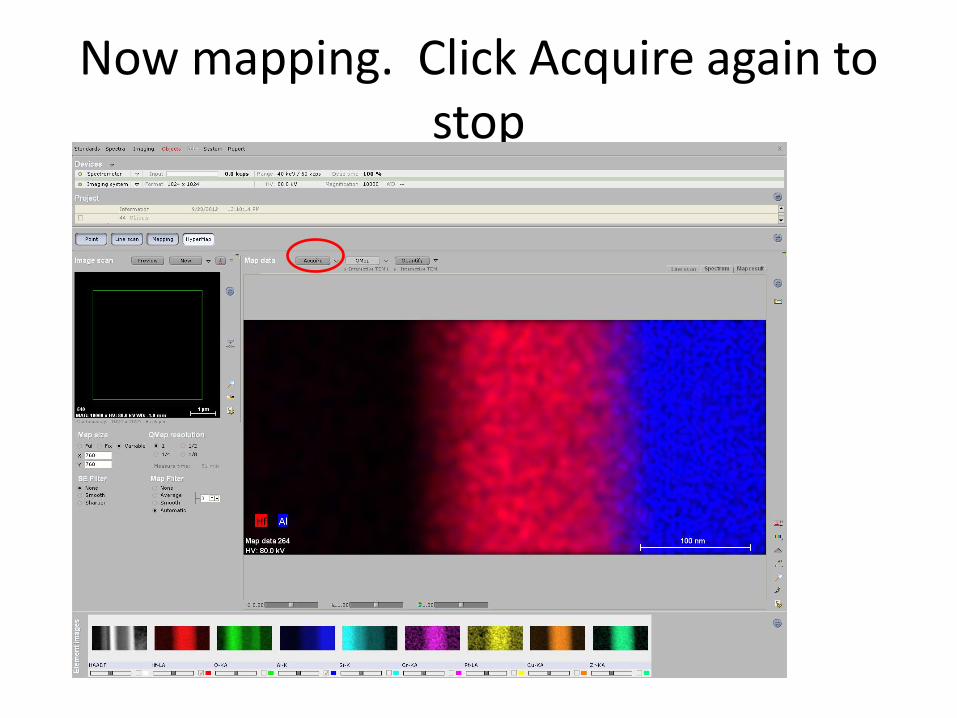
Now mapping. Click Acquire again to stop
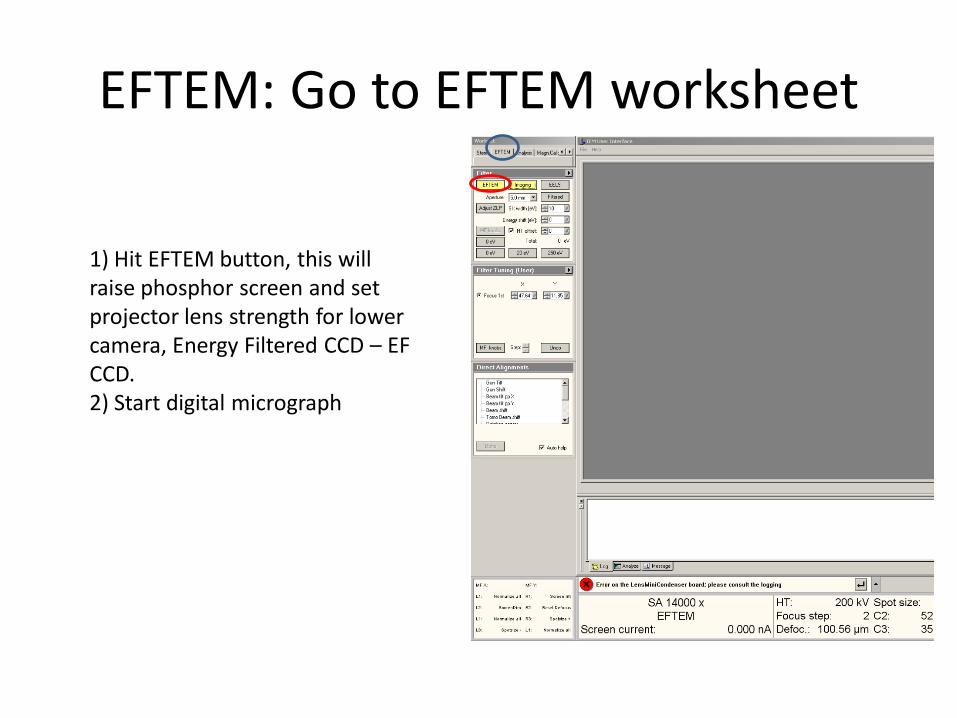
EFTEM: Go to EFTEM worksheet
1) Hit EFTEM button, this will raise phosphor screen and set projector lens strength for lower camera, Energy Filtered CCD – EF CCD. 2) Start digital micrograph
EFTEM Steps
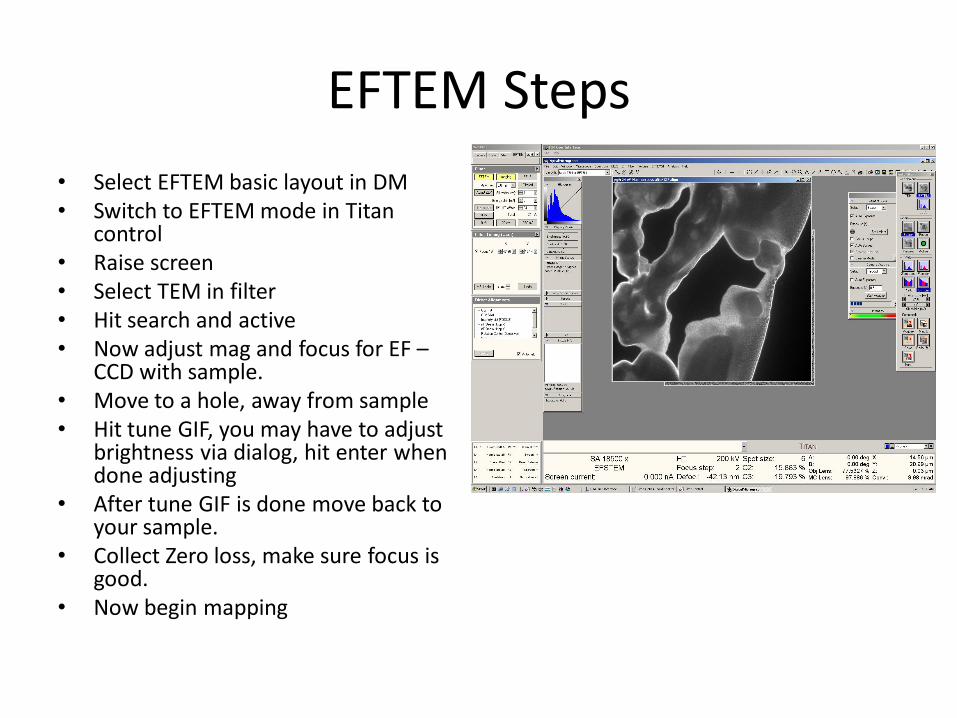
• Select EFTEM basic layout in DM • Switch to EFTEM mode in Titan
control • Raise screen • Select TEM in filter • Hit search and active • Now adjust mag and focus for EF –
CCD with sample. • Move to a hole, away from sample • Hit tune GIF, you may have to adjust
brightness via dialog, hit enter when done adjusting
• After tune GIF is done move back to your sample.
• Collect Zero loss, make sure focus is good.
• Now begin mapping
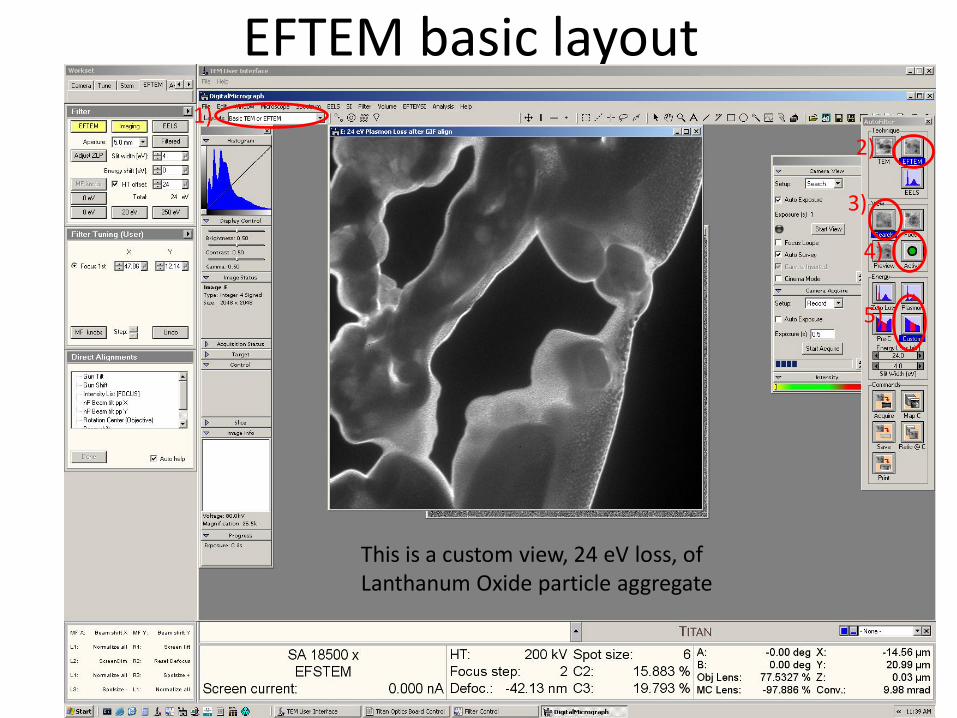
EFTEM basic layout 1)
2)
3)
4)
5)
This is a custom view, 24 eV loss, of Lanthanum Oxide particle aggregate
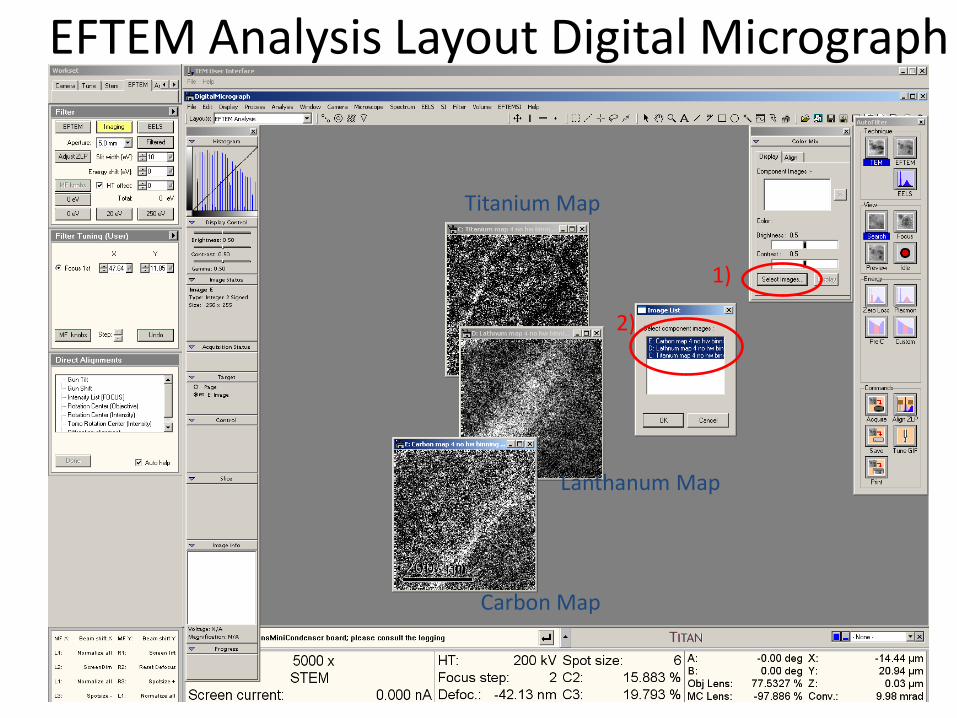
EFTEM Analysis Layout Digital Micrograph
1)
2)
Titanium Map
Lanthanum Map
Carbon Map
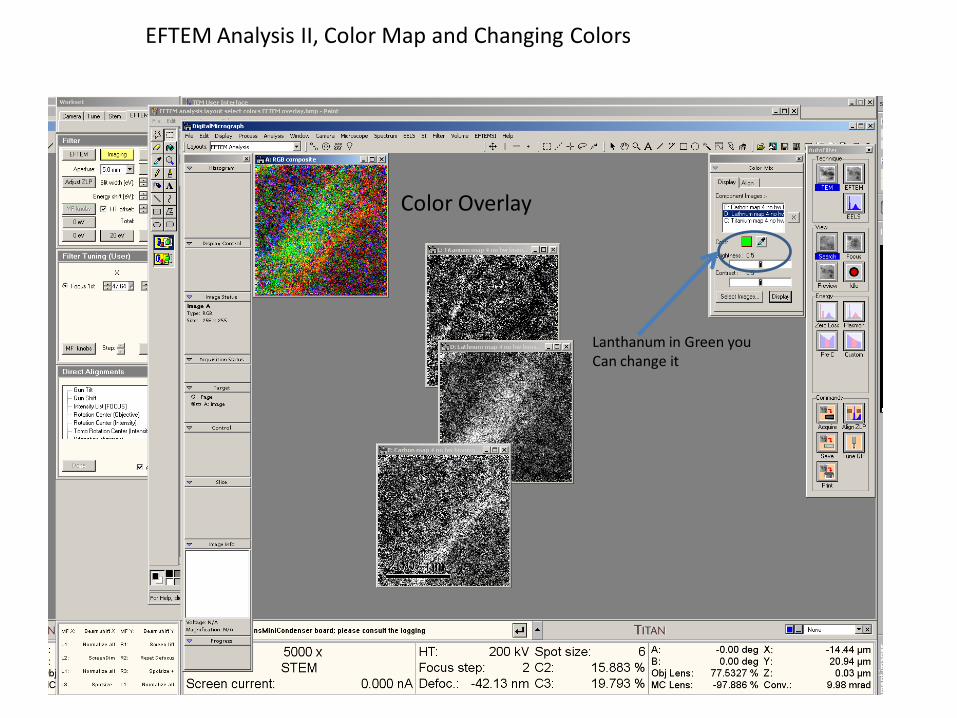
EFTEM Analysis II, Color Map and Changing Colors
Color Overlay
Lanthanum in Green you Can change it
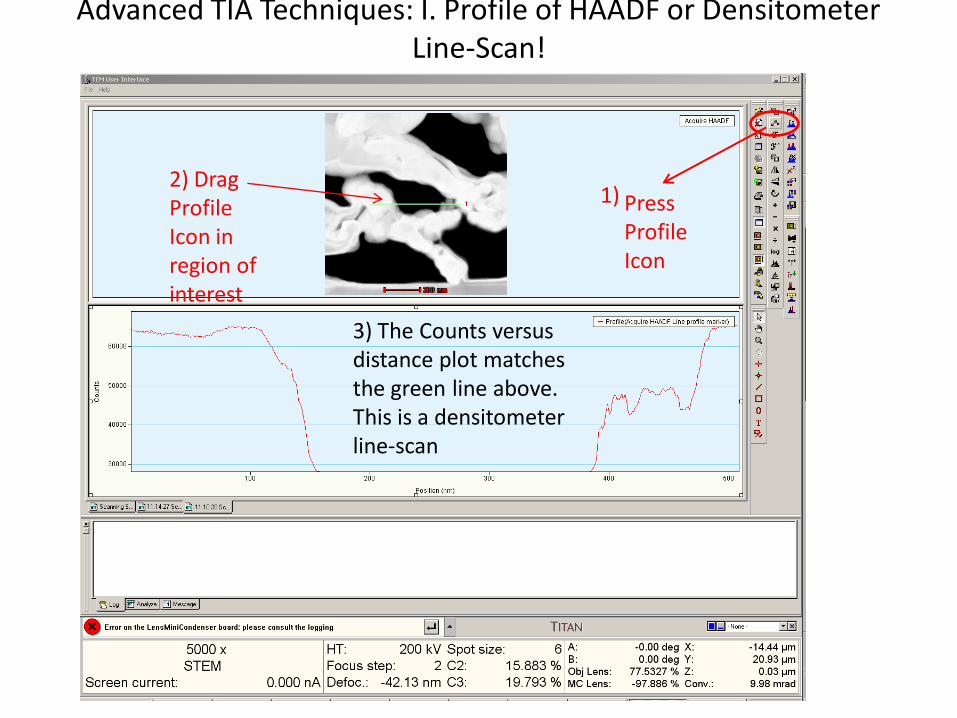
Advanced TIA Techniques: I. Profile of HAADF or Densitometer Line-Scan!
Press Profile Icon
1) 2) Drag Profile Icon in region of interest
3) The Counts versus distance plot matches the green line above. This is a densitometer line-scan

Advanced TIA Technique: II simultaneous EDX and EELS line-scan
2) Select Spectrum Collection and Spectrum Profile in Experiments dialog
1) Analysis Tab of EM Worksheet
3) Click flap out on the Experiments dialog and set the number of points in the PEELS spectra and the dwell time
3 2
1
The HAADF detector has a hole in it and so we collect the energy loss electrons below while the EDX x-rays are collected above near the sample!
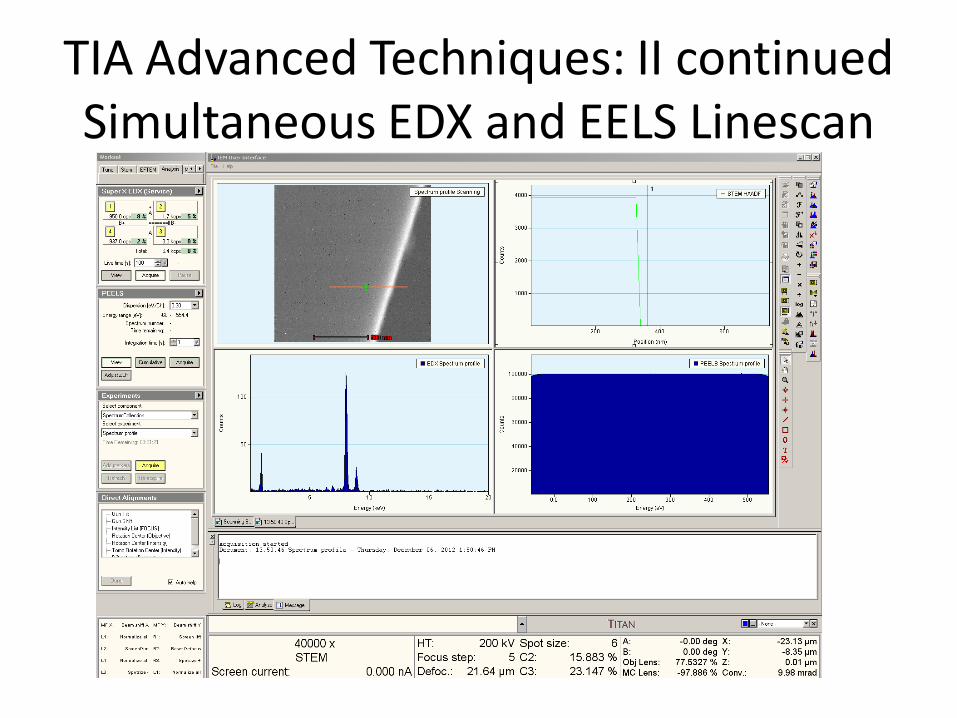
TIA Advanced Techniques: II continued Simultaneous EDX and EELS Linescan
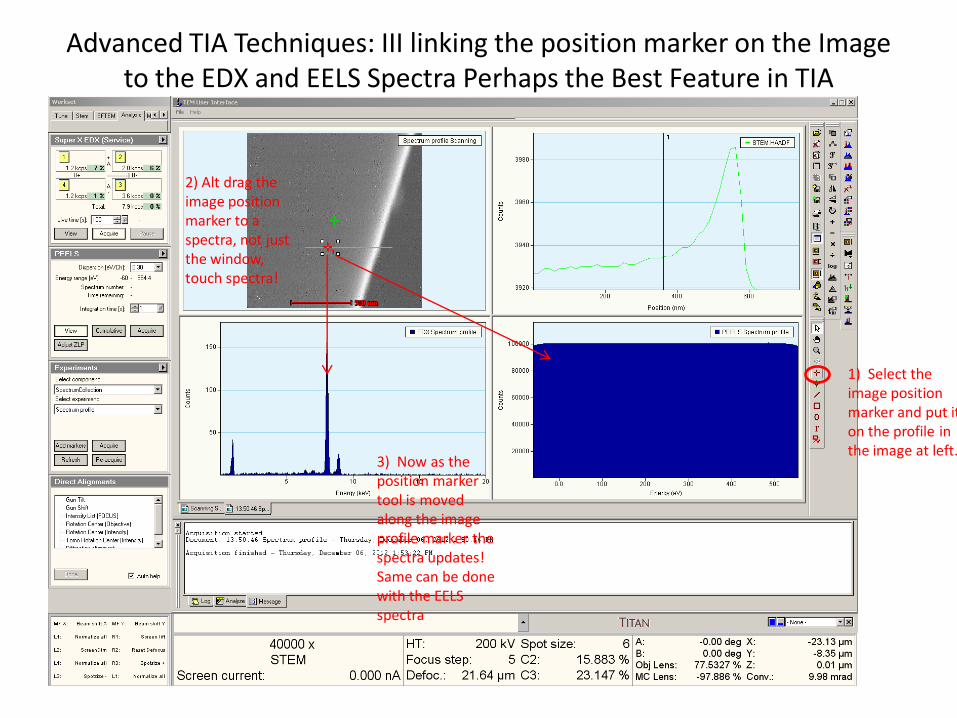
Advanced TIA Techniques: III linking the position marker on the Image to the EDX and EELS Spectra Perhaps the Best Feature in TIA
2) Alt drag the image position marker to a spectra, not just the window, touch spectra!
1) Select the image position marker and put it on the profile in the image at left.
3) Now as the position marker tool is moved along the image profile marker the spectra updates! Same can be done with the EELS spectra

Advanced TIA Techniques: IV Switching TIA modes
This icon switches between acquire and analytical modes
Now in Analysis Mode
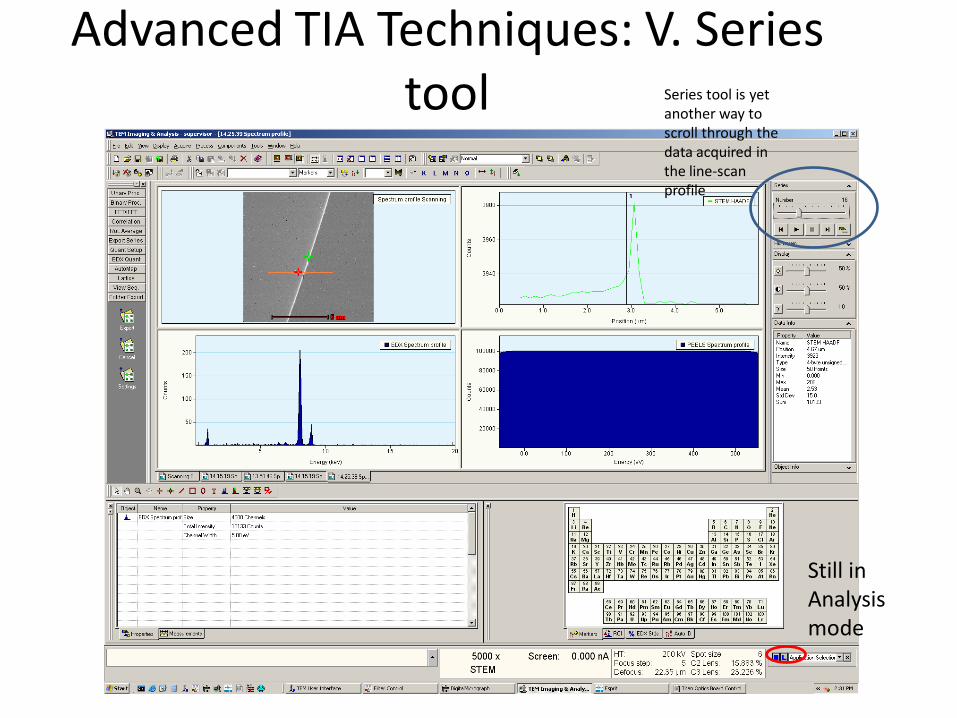
Advanced TIA Techniques: V. Series tool Series tool is yet
another way to scroll through the data acquired in the line-scan profile
Still in Analysis mode
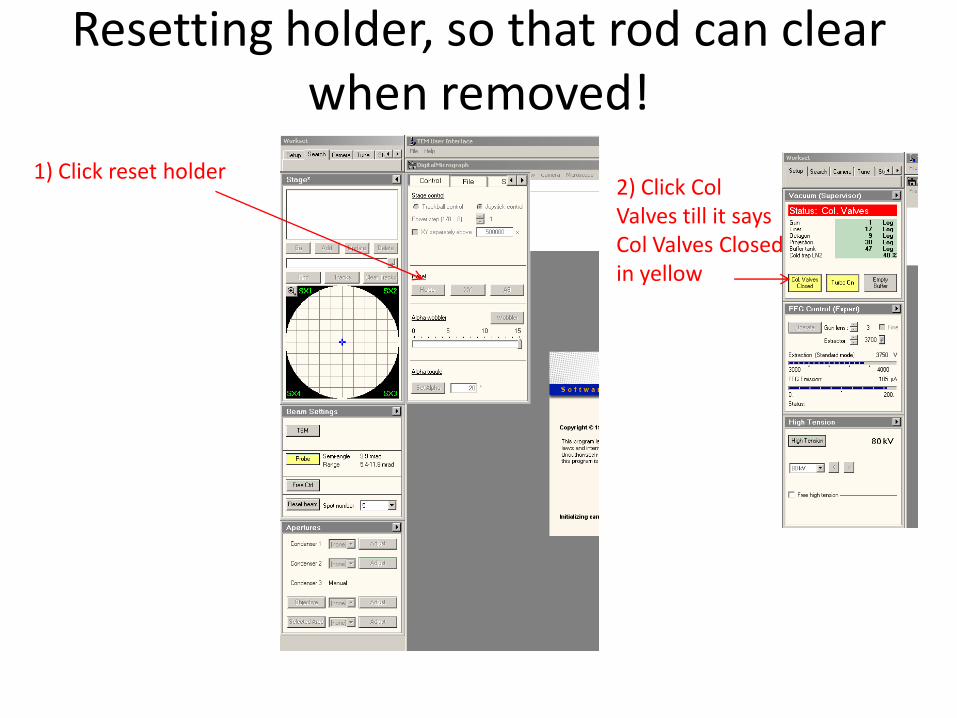
Resetting holder, so that rod can clear when removed!
1) Click reset holder 2) Click Col Valves till it says Col Valves Closed in yellow

To shutdown
• Save database if using EDS mapping, this saves the hyperspectal data cube for post processing.
• Close EDS shutters
• Click off STEM Insert
• Set back to TEM with registry, make sure TEM beam comes back
• Reset holder, see previous page
• Shutdown column valves, previous page
• Remove specimen rod

The End