Embed Size (px)
Citation preview

TIP FOCUS GROUP ON ENERGY INNOVATION SYSTEM COUNTRY REPORT UPSTREAM OIL AND GAS IN NORWAY Aslaug Mikkelsen, Stavanger University College/Rogaland Research Kari Jøsendal, Rogaland Research Jon Moxnes Steineke, Nordregio Antje Rapmund, Norwegian Institute for Studies in Research and Higher Education

2
TABLE OF CONTENT
1 Government institutions and regulatory bodies................................................................... 8
Main government institutions........................................................................................................ 8
Natural resource conditions and regulatory framework .............................................................. 9
Globalization and market conditions.......................................................................................... 10
2 Private sector drivers of innovation in upstream oil and gas ........................................... 10
Trends in private sector R&D expenditures ............................................................................... 11
3 Public research organizations active in oil and gas exploration and production............ 12
Trends in public sector R&D expenditures................................................................................. 13
Publicly funded research programmes ....................................................................................... 13
4 Upstream oil and gas: knowledge creation, diffusion and exploitation ........................... 15
Private and national oil companies ............................................................................................ 15
Trends in the oil companies’ procurement of R&D................................................................... 16
Institutions of higher education (HEIs) and the production of graduates in petroleum technologies ................................................................................................................................ 18
Suppliers and integrated service companies............................................................................... 19
5 Public policies for developing the innovation system in upstream oil and gas................ 21
Tax reduction schemes for increased R&D in SMEs.................................................................. 21
IPRs............................................................................................................................................. 21
Environmental sustainability issues and innovation................................................................... 22
Health and safety issues and innovation..................................................................................... 23
Other innovation support structures ........................................................................................... 24
6 Innovation performance in upstream oil and gas: new assessments using bibliometric and patenting data ........................................................................................................................ 25
Case 1: 3D and 4D visualization technologies........................................................................... 26
Case 2: horizontal drilling.......................................................................................................... 27
Case 3: subsea production and deepwater systems .................................................................... 28
Prior surveys of R&D collaboration and networking in upstream oil and gas in Norway ........ 28
A bibliometric analysis of scientific publications in selected technology sub-fields .................. 30
Patenting analysis of upstream oil and gas ................................................................................ 32
7 Conclusions and policy implications ................................................................................... 34

3
Preface
This study is the first part of part of a larger project funded by the Norwegian Research Council called: Knowledge flows and organizational dynamics: identifying the factors that enable or inhibit knowledge spillovers from the Norwegian oil and gas industry. The maintenance of corporate dynamism in technological change requires the reproduction and renewal of research personnel, as well as the continuous infusion of new ideas and opportunities. Universities and research institutions are traditional providers of knowledge and competence. Today other specialized institutions concerned with for example finance and intellectual property clearly influence the incentives to produce and diffuse knowledge. The determinants of innovation, however, may vary between branches, and the knowledge transfer might be determined both by technological innovation and the market demand and market situation for key actors in the field. Innovation results from increasingly complex interactions at the local, national and global levels. More and more often we see that it is not necessarily the universities and research institutions that do the research and create the knowledge in the field, but also private sector companies and individuals within these. The first phase of the project is a country report in Technological Innovation Case Study prepared for the OECD. The research questions, methodology and deliveries from this part of the project are in line with the implementation guidelines for these case studies in innovation. Results from this case study are presented in this report. For their helpful comments and useful suggestions on different parts of the manuscript we have to thank senior researcher Ole Andreas Engen, Rogaland Resesarch, and director Rolf Wiborg, The Norwegian Petroleum Directorate. Ole Andreas Engen has served as a critical but fair internal quality assurance, and Rolf Wiborg has in a very supportive manner taken the role an external adviser and quality provider. Any shortcomings are the responsibility of the authors.

4
Introduction This report presents an in-depth analysis of the innovation system in upstream oil and gas sector in Norway. We will especially provide a unique assessment of the performance of the innovation system in three technological subfields; 3D/4D visualisation technology, horizontal drilling and sub-sea production facilities. Energy innovation systems operate in a complex world where both private and public actors must consider variables of great uncertainty in their decision taking. This aspect is of vital importance when analysing different issues concerning innovation. In the following we provide a brief overview of some core points influencing stakeholders in the oil and gas sector. Overall framework The headlines on the news were clear and loud. Descriptions of the development in the international crude oil marked were many and divers. Concepts like chaos, breakdown, crisis and drama were employed. On the stage OPEC stood firm and kept the audience – the whole world – waiting and in excitement with their play about power, dominance and money. This description is a picture of one period in early 1986 when crude oil prices declined at high speed from 27 dollars (in 1986 prices) to 10 dollars in just a few months. This sudden decline was caused by the fact that OPEC changed its strategy during fall 1985 from one defending price to a strategy that implied defending market share. Volatility in the international crude oil marked and thus vulnerable income situations in oil producing countries is a crucial and decisive aspect when implementing policies concerning depletion of petroleum resources. This is one of the hard facts Norway as a significant supplier of oil must cope with. Within this context the key goals for Norwegian oil and gas policies since the early 1970s have been national management and control, building a Norwegian oil community and state participation. Norwegian oil and gas production has increased substantially over recent decades, and Norway ranks today as the world’s third largest exporter of crude after Saudi Arabia and Russia. History reveals influential instability in the oil price level. This serves as an explanation of why there is considerable interest in models of oil prices and the forecast that such models elicit. In this light both oil producers and oil consumers have an interest in the possible evolution of oil prices over time. However, the uncertainty around the price forecast may seem to be just as important as the forecast itself. The future price path requires expectations regarding the resource base, backstop fuel prices, discount rates, price elasticities of demand and economic growth (Griffin & Teece, 1982). Changes in any one of the five factors can cause substantial shifts in the price path. World oil demand is relatively inelastic in the short run. Due to heavy technology investments there are ex post minor possibilities to substitute capital equipment. The need for energy is thus normally decided ex ante. As a consequence new investments and technological change will to a great extent depend on expectations of oil price development and oil price relative to price on alternative energy. This explains the importance of oil price forecasts and development of energy substitutes. In 2002 oil consumption was broadly flat as in 2001, but natural gas consumption recovered strongly to grow by 2.8 % in 2002 (BP 2002). Energy demand was especially weak in Europe and Japan, where consumption fell by 1 %, and in South and Central America, where consumption was flat compared with 2001. Economic conditions explain much of this weakness. Apart from South and Central America, energy consumption growth in the emerging economies was relatively robust in 2002. Non-OECD Asia Pacific (excluding Japan, South Korea and Australasia) experienced growth of almost 11.5 %, reflecting very strong growth in China, while Africa and the Middle East saw rises of 2.2 % and 1.6 % respectively.

5
Three different projections of total primary energy use in 20201 indicate that oil share falls compared to gas, coal and nuclear energy (Mitchell et al. 2001). Oil remains nevertheless the larges single source of primary energy, between 35 percent and 40 percent of the total. Most uncertainties and greatest inconsistencies within the projections concern the role of natural gas in the energy mix and, connected with that, the price of natural gas relative to other fuels. When we are analysing world oil demand three factors are of special importance; i) overall economic activity in the world, ii) price- and income elasticities and iii) development of substitutes. Gross domestic product (GNP) is an indicator of economic activity. Higher GDP per head and higher energy consumption per head are strongly linked. There are also significant differences between countries. The demand for oil will be affected by regional differences in economic growth through the different degree of competition from other fuels in each region and through the different weight of transport fuel demand in energy consumption. Crude oil demand is also based on long run elasticities. The long run price elasticity is assumed to vary from -.375 to -.6., and the elasticity of demand for oil with respect to world economic activity is in some projections estimated to be 0.75 (Griffin and Teece). That is, a doubling of world economic activity would increase energy demand 75 percent at unchanged real oil prices. Using such estimates decisionmakers can ask whether their assumptions about price elasticity of demand, economic growth and other relevant variables are consistent with their assumptions about the future price of oil. Development of substitutes will to a great extent depend on estimated oil price. We are witnessing technological change aiming at using alternative energy. World consumption of natural gas grew by a relatively strong 2.8 percent in 2002 (BP 2002), and world coal consumption increased by 6.9 percent. However, this was almost entirely a Chinese phenomenon. Excluding China, world oil consumption grew by just 0.6 percent. Consumption of nuclear power rose modestly in 2002, expanding by 1.5 percent globally. The fasters increase in nuclear power occurred in Asia. Structure of the report The report is structured in the following way:
• First, we present the main government institutions and regulatory bodies affecting the upstream oil and gas industry. The regulatory framework is described.
• Second, we go on to display the private drivers of innovation in upstream oil and gas. We touch
upon the making of the upstream innovation system in Norway, and present an overview of total R&D expenditures in the Norwegian upstream oil and gas industry.
• In the third part, we target the public research organisations conducting research in oil and gas
exploration and production. We survey the public sector R&D expenditures, the make-up of the public R&D sector and present the relevant publicly funded research programmes.
• In the fourth part, we go into the finer details of knowledge creating, diffusion and exploitation.
We identify the composition of various R&D networks, corporate and institutional units involved both nationally and internationally and relate the extent of R&D collaboration within the private oil companies, the HEIs and the supplier industry and the integrated service companies.
1 Energy Information Agency, USA, International Energy Agency, The European Commission

6
We then discuss briefly some of the characteristics of the innovation support infrastructure in the Norwegian upstream oil and gas industry. We identify the strategic significance of the legal and information system (IPRs) in the industry, the general business support system (including science parks, incubators and NTBF tax reduction schemes aimed at stimulating R&D), and the relevance of industry standards and norms of corporate behaviour (in promoting HES and environmental sustainability) for innovation efforts in upstream oil and gas. Before presenting conclusion and some policy implications, we provide a unique assessment of the innovation performance of the innovation system in three technological sub-fields. We provide analyses of patent data, bibliometric data as well as secondary data to identify the national champions in the development of 3D/4D visualisation technologies, horizontal drilling and sub-sea production facilities in offshore oil and gas exploration and production. This enables us to fine-tune the more general insights provided so far. National innovation system We now provide a summary of the industry as a national innovation system. In the display below, the main actors and relationships of the innovation system are illustrated. The impact of the national regulatory framework is identified by the actors and institutions on which it has the most significant influence – the oil companies, the large suppliers and the institutions of the national education and research system. While the regulatory framework is affecting the whole upstream oil and gas industry, the impact of the (innovation) infrastructure appears meagre in comparison. The drivers of innovation and knowledge generators are identified in boldness of the outline as well as the colour of the boxes. The colouring refers to the knowledge flows of the innovation system with major knowledge generating and transforming agents and institutions identified as green, knowledge transforming agents as yellow and bodies and institutions comparatively marginal to the upstream oil and gas innovation processes identified as orange. The large suppliers (construction companies, integrated service companies) are taking on an increasingly important role as knowledge producers in the national innovation system. Thus their box is tiled in both green and yellow. The boldness of the borders of the boxes relate to the absolute amounts investments made in R&D by the different national actors and institutions, while the arrows indicate the extent by which the different agents and sectors co-operate (formally or informally) in innovation efforts in upstream oil and gas.

7
Figure 1: The Norwegian upstream oil and gas innovation system
The remainder of the report is devoted to motivate the display above, presenting first the different actor groups and the R&D institutions involved. We then continue with analyses of the relationships between the different actors in term of knowledge creation, knowledge diffusion and knowledge exploitation. While the general make-up of the upstream oil and gas is presented in general terms, we perform a more detailed case study of innovation activities within three technological sub-fields in order to identify individual main private corporations and R&D institutions currently involved in upstream oil and gas technology development. This allows us to identify the hard core of the national innovation system in
Oil companies
National Global
Intermediaries
Private R&D institutes
Prof. knowledge
brokers
Education and Research System
Professional
education and training
Higher education and research
Public sector research
institutions Mature SMEs
New
Technology-based Firms
Infrastructure Banking, venture capital
Legal and information system (IPRs) Innovation and business support system (science parks, incubators, skatteFUNN)
Industry standards and norms of corporate behaviour (NORSOK, INTSOK)
National regulatory framework
Ministries, directorates, research councils and -programmes
Large suppliers
Construction companies,
Integrated service companies
8
upstream oil and gas - the oil companies, R&D institutes and New Technology-based Firms (NTBFs) that function as nodes in current R&D collaborations. 1 Government institutions and regulatory bodies Main government institutions According to figure 1 government institutions are important parts of the innovation system. The Ministry of Oil and Energy (MOE) was established in 1978 and has had enormous influence on petroleum-related research in Norway, and on improving the innovation capabilities of related industries through establishing criteria implemented when giving concessions for oil exploration to foreign and national offshore firms (Solum, Ørstavik and Hauknes 1999). This concerns in particular the establishment of ‘Goodwill agreements’, a policy approach introduced in 1978. Under this policy, the international oil companies were informed they would acquire ‘goodwill points’ by contracting oil and gas related research and development to Norwegian research institutions in order to be regarded as a serious contender for obtaining concessions on offshore oil and gas exploration and production on the Norwegian continental shelf. The goodwill agreements gave the institutional research sector a significant boost (Hauknes and Wicken 2003). In 1993 MOE was integrated into a new Ministry of Industry and Energy that was disassembled four years later. Neither the fusion nor the merger of the oil and energy portfolio with industry and the 1997 return to the former Ministerial structure had any practical consequences in terms of the division of administrative responsibilities. The oil and gas division of the MOE has an environmental section that is responsible of ensuring that the MOE comply with the international climate treaties of which Norway is a signee (the Kyoto Protocol etc.).
The Ministry of Oil and Energy (MOE) represents the Norwegian authorities’ interest towards the major oil companies, the upstream suppliers and service companies and the industrial associations engaged in offshore oil and gas exploration and production. The MOE effectuates the prevailing industrial policy in petroleum production, and also ensures the financial interest of the Norwegian state by constituting the Statoil general assembly. The MOE administers the legal and regulative framework of industrial development on the Norwegian Continental Shelf, and also takes part in the funding of government-sponsored R&D programmes. Ministry of Administrative Affairs is presently charged with the health, safety and work environment responsibilities. They delegate a lot their power to the NPD, from January 2004 the new Petroleum Safety Board. The Norwegian Petroleum Directorate`s (NPD) responsibility has been both resource management and health, environment and safety issues, ensuring that exploration and production activities take place in accordance with the national legislation, instructions and concession laws, and to control that these are in accordance with guidelines laid down by the law, rules and regulations. The directorate is also the advisory agency for the MOE. The NPD has purely advisory responsibilities with respect to the MOE, and the Ministry is the funding body with respect to the Norwegian Research Council. As such, NPD representatives are only yet frequently engaged in publicly funded R&D programme activities through holding advisory board memberships etc. In White Paper no. 17 (2002-2003) the government argues for a separation of the Norwegian Petroleum Directorate into two units. It was decided on June 6 2003 by the government that this separation will take place January 1 2004. The new unit, Petroleumstilsynet, will be in charge of issues concerning health and safety. The Norwegian Research Council (NRC) operates various R&D programmes aimed at the upstream oil and gas industry. The proportion of petroleum-related research financed by the Norwegian Research Council has been reduced since the latter part of the 1990s both in absolute and relative terms. Funds

9
devoted to applied research have in particular taken a heavy toll, while NRC funding instead have been funnelled toward new strategic initiatives. Table 1: NRC financing of petroleum-related research 1995-2003 (MNOK; nominal) Year Strategic R&D Applied R&D Technology demonstration programmes* Total 1995 63,7 88,2 151,9 1996 71,0 71,3 142,3 1997 64,7 67,0 131,7 1998 69,5 62,0 131,5 1999 67,7 49,2 100 216,9 2000 76,5 47,6 80 204,1 2001 75,2 43,1 20 138,3 2002 86,1 34,6 20 140,7 2003 76 58 29 163 Sources: Karlsen ed. (2002); table 4.1.1; NRC *: DEMO2000 In 2003, the NRC established a system of new Centres of Excellence in thirteen selected academic fields. A Centre of Excellence in Integrated Petroleum Research was set up at the University of Bergen. With a total personnel of some 40 researchers, the objective of the centre is a) to combine geology, chemistry, physics and mathematics to obtain improved understanding of multiphase flow phenomena in porous media, b) to develop reservoir models that provide faster and more reliable reservoir simulations, with emphasis on heterogeneous reservoirs, and c) to contribute to increased oil recovery by improved understanding of oil recovery mechanisms. Centre of excellence operation costs would be defined as strategic R&D in table 1. Natural resource conditions and regulatory framework Large quantities of undiscovered oil and gas resources remain on the Norwegian shelf. The North Sea is the most explored part of the Norwegian shelf. A natural trend in this area is a declining growth in resources and size of offshore discoveries. However, the frequency of new discoveries is still high viewed in an international context, and new production licences continues to be awarded. The regulatory framework for the petroleum industry refers to the conditions and requirements governing licensees when pursuing petroleum operations. This framework is established by the Parliament and government, and enshrined in statutes, regulations and agreements. Parts of the framework will be same as the regulatory regime, which applies to land-based industry. The award of production licences and the scope of such allocations represent an important element in the framework conditions governing the industry and the regulatory system applied by the authorities to the Norwegian continental shelf. The government has in 2002 – 2004 made the award of new production licences in mature areas more efficient by establishing fixed, pre-defined exploration areas in mature parts of the shelf, both the North Sea, the Norwegian Sea, and in 2004 the Barents Sea. It is no longer necessary to announce blocks in connection with the annual offer of predefined blocks.. About 60 percent of the Norwegian continental shelf has been opened for exploration. Nine per cent of the open area is currently allocated in the form of production licences. From the summer of 1966 until 2002, a total of 620 exploration wells have been drilled. Discoveries have been made by 254 of these. That provides an average discovery frequency of 40 percent, a very good performance by international standards. This frequency also includes non-commercial discoveries. If we look at the past 10 years, the discovery frequency has increased. One important reason for the increase is new developments in exploration technology. There have been significant improvements in the collection, processing and

10
interpretation of seismological data. The most important improvement in the exploration phase has been the change from 2D to 3D technology. Faster computers and software innovations have contributed to better interpretation and decisions prior to decisions to drill for oil and gas. Globalization and market conditions A governing principle of Norwegian policies on petroleum sales is that these will be made by commercial companies on the basis of commercial criteria within a general framework determined by the authorities. This means that producers on the Norwegian continental shelf sell crude oil on market terms. Oil is piped to terminal on land or loaded offshore into ships. Its price will depend on the situation in the oil market and the quality in the spot market. Oil from Britain`s Brent field serves as a reference crude for the North Sea basin. Daily Norwegian offshore production averaged 3.3 mill barrels of oil, including natural gas liquids (NGL) in 2002, and Norway ranked seventh among the world`s leading oil producers. Norway`s net exports of crude oil and petroleum products totalled about 3.1 mill b/d. This puts Norway in third place after Saudi Arabia and Russia among the world`s leading net crude exporters.
In 2001, the petroleum sector accounted for about 23 per cent of Norway`s gross domestic product. Petroleum operations provided roughly 45 per cent of Norwegians exports (Statistics Norway). The International Energy Agency estimates that global energy consumption could rise by about 50 per cent over the next 20 years. Growth is expected to be particularly strong in the developing countries, where economic progress and efforts to reduce poverty will require a substantial increase in energy use. The global market for deliveries to the oil and gas sector is substantial. The offshore market should total USD 80-100 bn annually over the next four years. Deepwater technology is the biggest growth area, while the most important growth markets are expected to lie in West Africa, the Gulf of Mexico and Brazil. In cooperation with the domestic petroleum industry, the government established the INTSOK – Norwegian Oil and Gas Partners foundation - in 1997 to promote deliveries to the international market. Currently embracing 90 companies, INTSOK aims to boost exports to NOK 50 bn by 2005, compared with the current level of just under NOK 30 bn. INTSOK is financed by both the industry and the Ministry of Oil and Energy by approximately 50 percent each. INTSOK partners are active in most of the important markets, and the Norwegian industry has shared its expertise and skills at workshops and seminars attended by clients and international business partners. The partner companies represent the entire oil and gas supply chain, which encourages active dialogue between oil companies, technology suppliers, service companies and governments. The INTSOK secretariat works with the partner companies, helping them to assess market opportunities and enhance their ability to compete in the global marketplace. It also assists them in developing their international relationships through close networks with government agencies at home and abroad. The INTSOK secretariat provides customers and government authorities around the world with information about Norway's oil and gas technology innovations, research and development achievements, cost reduction strategies and HSE measures. 2 Private sector drivers of innovation in upstream oil and gas During the 1980s the Norwegian industrial policy was characterised by attempts to reconstruct industrial structures. The most complex policy effort in the 1990s was put in the ICT sector, where a number of initiatives were taken to improve education, research and use of ICTs. The Norwegian upstream oil and gas sector quickly became a very advanced user of new ICTs (Karlsen et al. 2002). The oil and gas sector was one of the technological fields that became the subject of efforts to improve public/private co-ordination as well as an increase in R&D funding. Throughout the 1980s and 1990s public funding remained significant for industrial R&D. It was only by the mid 1990s that privately funded R&D came to account for more than 50% of overall R&D expenditures. The table displays a dramatic structural shift that has affected the R&D performance of the Norwegian innovation system. Up to 1986 R&D funded by oil and gas companies showed a rapid increase and came to dominate substantial parts of industrially oriented R&D.

11
During the late 19080s, oil and gas companies alone funded around 12% of total R&D expenditures (public and private) in Norway. Following the collapse of the crude oil prices in 1987 and again in 1999, the expected profitability of a range of offshore oil and gas fields declined. As a consequence, R&D related to exploration and production of offshore oil and gas was rapidly scaled down in absolute and relative terms (Hauknes in Koch and Oksanen eds. 2003: 175-176). During the 1990s the oil companies on average have funded around 7% of total R&D expenditures in Norway (public and private). The oil and gas companies’ reduction from a 12% to a 7% average of total R&D expenditures from the 1980s to the 1990s can be attributed to the termination of the goodwill agreements.
Table 2: R&D funding by sources private/public 1983-2001 (mill. NOK, nominal)
Trends in private sector R&D expenditures The innovation costs of the oil companies totalled some 3,69 billion NOK in 1997. Some 38,1 per cent of the costs were investments in capital goods, while the remainder, 2,28 billion NOK were devoted to innovation operations. The bulk of operational costs were used on R&D both intramurally and extramurally. In 2000, the Norwegian upstream oil and gas industry spent US$ 150 millions on R&D, down from US $ 250-300 millions per year in the early 1990s. Exceeded only by the category ‘ICT-related business services’, oil companies made the 2nd largest R&D investments in the country. Industry R&D dominates the technological field with more than 2/3 of total research and development expenditures. Investments in offshore technology R&D have deteriorated further in the public sector since 2000, both in terms of absolute and relative R&D spending.
Table 3: Current expenditures on R&D in the offshore technology sector 1999 and 2001. Million NOK
R&D performing sector 1999 2001 Industry 1185 1390 Institute sector 465 450 Higher education sector 110 80 TOTAL 1760 1920
Source: NIFU/Statistics Norway 2003
0
5000
10000
15000
20000
25000
30000
1983 1987 1991 1995 1997 1999 2001
Public sourcesOil companiesOther industriesOther sources

12
Due to a rather strict definition of upstream oil and gas (defined as firms in the ‘offshore technology sector’) applied for statistical purposes, the real research and development spending of the oil companies and petroleum-dependent suppliers and services is significantly greater, perhaps making the oil and gas industry the largest R&D investor in Norway. In terms of the orientation of R&D activities in the offshore technology industry, Statistics Norway (2002) indicate that 3% of total R&D is devoted to basic research, 76% to applied research and the remaining 21% to technology development. 21% of offshore R&D expenditures in 2001 were product-oriented, while some 4/5 (79%) was process-oriented. The difference between basic and applied research may be illustrated by the following: Much of geology research is basic in the sense that the science may be put to use to develop theories of the properties of different types of sandstone as reservoir rock and the flow of water and oil in sediment basins. Such insights provide oil companies with a basis on which to calculate their production capacity if they discover oil or gas. Such calculations are examples of applied research. The development of new drilling procedures is examples of subsequent technology development. 3 Public research organizations active in oil and gas exploration and production While the annual oil industry spending on innovations are in the billions of NOK, the annual public funding of upstream oil and gas R&D is measured by the millions. Since 1985, the public funds earmarked for R&D in upstream oil and gas has oscillated between MNOK 125 and MNOK 150 annually. The current trend is that public R&D funds are on the wane since hitting a high of MNOK 162 in 2001. Figure 2: Public R&D expenditures (nominal MNOK) in the Norwegian national budget 1985-2004. Oil and gas exploration and production.
*: preliminary. Source: NRC 2003, National Budget proposal (2004). Traditionally, applied R&D institutes have held a strong position in the Norwegian R&D landscape, holding the French IFP as something of a ‘rôle model’ (Karlsen et al. 2000). The total number of research personnel employed by Norwegian public research institutes specializing in technology development in oil
0
25
50
75
100
125
150
175
1985
1986
1987
1988
1989
1990
1991
1992
1993
1994
1995
1996
1997
1998
1999
2000
2001
2002
2003
2004
*

13
and gas exploration and production amounted to some 440 man-years in 2001. Since 1995, this represents a net reduction in manpower by some 25%-30%. At the same time, the tasks have taken on traits of more fragmented consultancy work task, reflecting the reduction in calls for R&D tenders from the oil companies (Karlsen et al. 2002).
Table 4: Number of research scientists at public R&D institutes 2000 Institution Number of petroleum researchers Christian Michelsen Research
26
IE (Institute for Energy Technology) 75 RF (Rogaland Research)
85
SINTEF Petroleum 60 Sintef, other oil & gas 191 TOTAL 437
Source: L. Lunde 2001 The number of researchers in the public R&D sectors corresponds in absolute numbers with the number of researchers employed by the oil companies. Trends in public sector R&D expenditures A consequence for the public institutes has also been a reduction in absolute R&D turnover, as the oil companies increasingly choose to perform their R&D internally, or outsource these activities to R&D institutions abroad. Other factors combine to increase the overall effect: firstly, the oil companies acquire the same competencies by entering into technology development agreements with suppliers in the private petroleum services sector, but the oil companies are also able to reap synergies following from the major industrial mergers that took place in 1997-2000. The public R&D institutes have also taken blows following the phasing out of the goodwill agreements that were introduced to the Norwegian petroleum industry in the 1980s, and by the reduction in public funding. Publicly funded research programs Against this backdrop, the few publicly funded research programmes introduced in the oil and gas sector in the last decade have taken on a significant role. The four major programmes are RUTH, FORCE, OFFSHORE 2010 and DEMO 2000.
The RUTH research programme (Reservoir Utilization through advanced Technological Help) was initiated in 1991 as a co-operation involving the Norwegian research Council, the Norwegian Petroleum Directorate and several oil companies and public research institutes. The programme produced several significant results in a short time period, attracting industry attention and new business participants (Karlsen et al. 2000). The two most important technologies to come out of the RUTH effort were gas injection and combined water and gas (WAG) technologies, whereby water and gas are pumped alternatingly into the reservoir to improve recovery rates. When the programme came to an end in 1996, 18 oil companies had participated. In the course of the RUTH programme period, the average planned recovery rate for oil from existing oil fields increased from 34% to 41%. This corresponds to two average size North Sea oil fields. Compared to the moderate R&D investment of MNOK 105 this amounts to a very good return on R&D.
The FORCE R&D programme was initiated by the Norwegian Petroleum Directorate and several of the major oil companies as a complement to the RUTH programme. It received no public funding, but was aimed at stimulating increased co-operation between the oil companies The overall impact of the FORCE initiative has proved to be relatively meagre, as the main activities taking place have been less committed

14
experience transfer and general knowledge diffusion in the context of industry seminars and informal meetings.2
From the late 1990s,the applied R&D programme OFFSHORE 2010 has aimed at being the main R&D endeavour of the local suppliers and oil services industries. With limited funding, the bulk of the R%D performance is located in the education and research sector (35% of total programme expenditures) and in the offshore supplier and services industry (65% of total expenditures). The main funding has come from from the NRC (30% ) and the upstream oil and gas industry, including oil companies (70%). By the end of 2001 a total of MNOK 316,3 had been allocated to the programme. The main R&D institutions involved so far have been NTNU, IFE, SINTEF, Rogaland Research and Christian Michelsen Research (NRC 2001). Some 60 offshore companies had by the end of 2001 participated in Offshore 2010 R&D projects. The main technology areas covered are subsea production, drilling technologies and well/fluid transportation technologies. SMEs figure prominently as project participants.
The DEMO 2000 programme was initiated in 1999 with the aim of developing new oil and gas fields on the Norwegian Continental Shelf through new technology, improved security of execution within budget and planning and new industry products for the global market. In addition to receiving public funding that currently stands at a total of some 250 million NOK in nominal value, the programme has also ensured funding from private sector companies and R&D institutions of twice this amount. Current DEMO 2000 partners include the Ministry of Oil and Energy, four public R&D institutes, six oil companies and a handful of specialised oil and gas suppliers. The current trend of a weakening in amounts of public funding made available for the programme puts the future of the DEMO 2000 R&D programme in some doubt.
The many government petroleum research programmes co-funded with oil companies and firms in the offshore services and supply industry of the last 15 years is something of a Norwegian speciality in upstream oil and gas. At present, this joint effort is surviving only in the Offshore 2010 programme. The most successful organisational forms are currently being explored in Demo 2000, where the supplier industry is taking a much more active part - in part as a consequence of the global restructuring of the offshore oil industry (Karlsen, 2000). In addition, the NRC initiated a new oil and gas innovation programme (OG) in 2002 with a total anticipated funding of some MNOK 100 for the first two years. The aim of the programme is to support R&D projects that improve competence development in technology fields such as ‘smart wells’, subsea production, multiphase transports and natural gas conversion. The OG innovation programme is aimed at a wide audience, namely the oil companies, the supplier industry, HEIs and R&D institutes. OG is being coordinated to some extent with similar initiatives, such as DEMO 2000 and Petroforsk (see below). With an eight-year programme period (2002-2010), OG may prove to be the most significant governments-funded innovation initiative in the immediate future. Although the age of grand government-funded R&D programmes may be over in Norwegian upstream oil and gas, a state-funded basic research programme (PETROFORSK) still remain in operation along with numerous SIPs and SUPs (multi-year strategic research programmes aimed at R&D institutes and HEIs, respectively). These research initiatives are intended to address long-term research requirements and issues related to the oil and gas industry. In 2000, the total budget for such initiatives amounted to less than $ 5 million, with the main deliverables being made in terms of PhD’s and post-graduate candidates.
2 See www.force.org for a detailed presentation.

15
4 Upstream oil and gas: knowledge creation, diffusion and exploitation Being an industry whose activities fluctuates with the world price of oil, the number of private firms in the Norwegian upstream oil and gas sector vary between some 800 to 1400 firms. A 2000 study revealed that some 600 firms were petroleum-dependent suppliers to the upstream oil and gas industry, defined by having more than 25% of total turnover from sales to the oil and gas industry (Heum et al. 2000). Regular surveys of the offshore industry labour markets puts the total number of economic institutions (both public and private) to some 800. According to the Directorate of Labour about 81 700 people were employed by the Norwegian petroleum sector in August 2002. Table 5 gives an overview of employment by functional area. The industry has great macro-economic significance in Norway. Big regional variations exist in the significance of the industry for employment. Most of the jobs have so far been concentrated on and near the coast of Rogaland and Hordaland counties. In a recent survey (Fossum et al. 2003), the 2002 population of private sector offshore suppliers was determined to amount to some 1250 companies. These could be complemented with a population of almost 90 oil companies.3 As table 5 indicates employment varies significantly from one year to another and causes instability in the industry. Table 5: Employment by functional area – upstream and downstream oil and gas Group 1995 1996 1997 1998 1999 2000 2001 2002 Exploration, drilling, production etc.
25 678
25 469
27 861
30 270
30 130
26 372
29 642
30 316
Bases, logistics, catering, administration etc.
10 635
11 522
12 480
13 652
13 285
13 469
14 204
15857
Construction and maintenance of platforms and vessels
29 693
30 160
34 200
43 535
41 032
27 633
28 892
31 917
Construction and operation of processing and landing facilities
6 522
6 020
5 161
5164
5 072
3961
3 590
3 617
Total 72 582 73 171 79 702 92 621 89 519 71 435 76 328 81 707 Source: Norw. Directorate of Labour Private and national oil companies There are currently two major national oil operators operating on the Norwegian Continental Shelf. Partly privatised in 2001, Statoil remains under the control of the Ministry of Oil and Energy and as such it could be identified as a governmental body. Statoil has been instrumental in developing a Norwegian upstream oil and gas industry for some thirty years. The Norwegian government also maintains a 46% minority stake in the other major oil operator, Norsk Hydro. Initially only peripherally engaged in oil and gas, Norsk Hydro has refocused on petroleum exploration and production as a main industrial area in the 1980s and 1990s. The privately owned Saga Petroleum was acquired by and split between Statoil and Norsk Hydro in 1999. The international oil companies are engaged in operatorships and participate in production licence alliances. Most of their institutional presence is assured through Norwegian subsidiaries companies. The
3 The numbers were obtained by taking all companies registered under the NACE codes 111000, 112000, 351140,
351150, 516530, 603000 and 742094, and complementing these with firms identifiable in various industry-specific, private databases such as Achilles, www.oilinfo.no, www.norwayonline.no and www.subsea.org.

16
exception is ConocoPhillips, who in 2003 relocated their European and African regional headquarters to Norway. Statoil, Norsk Hydro and the major international oil companies have traditionally been the dominant players on the NCS. This has been a natural consequence of the technically and financially demanding character of petroleum operations. Since great differences in maturity and level of exploration now exist on the NCS, it would be appropriate to reflect this in the range of players involved. The big players who can undertake demanding and capital-intensive projects are still required, but it is important at the same time to bring in companies which focus on small projects and tail end production. In that connection, the Ministry has established a system for prequalifying licensees and operators. This system offers companies an evaluation of their suitability for participation on the NCS before they devote resources to considering commercial opportunities. Table 6: The largest oil companies on the Norwegian continental shelf ranked by 2002 turnover and employment
Company 2002 turnover (billion NOK)
No. of employees
Statoil 244,14 16900 Norsk Hydro oil & gas* 51,74 4039 Exxon Mobil 30,14 - Total E&P Norway AS 28,31 306 Norske Shell AS 22,17 913 ConocoPhillips 19,56 1694 BP Norway AS 8,13 - Norske Agip 6,45 82 Fortum Petroleum AS 2,89 40 Idemitsu Petroleum AS 2,79 22 RWE-DEA Norway AS 2,13 66
Source: Dagens Næringsliv June 19th 2003 * : from NH annual report 2002
The number of employees indicate which of the oil companies that perform R&D activities in Norway. While many of the oil companies are pure sales organisations, Shell and ConocoPhillips are the most significant foreign contributors to offshore technology R&D in Norway. Trends in the oil companies’ procurement of R&D While oil companies on the North Sea spend significant amounts on R&D, it is often difficult to disentangle such expenditures from accounting items such as exploration costs and engineering. The oil companies’ funding of R&D budgeted in current and new production licenses issued in offshore oil and gas production has seen a marginal reduction in absolute terms during the late 1990s. The oil companies’ procurement of R&D services from offshore suppliers, R&D institutes and HEIs have also been reduced in real terms:
17
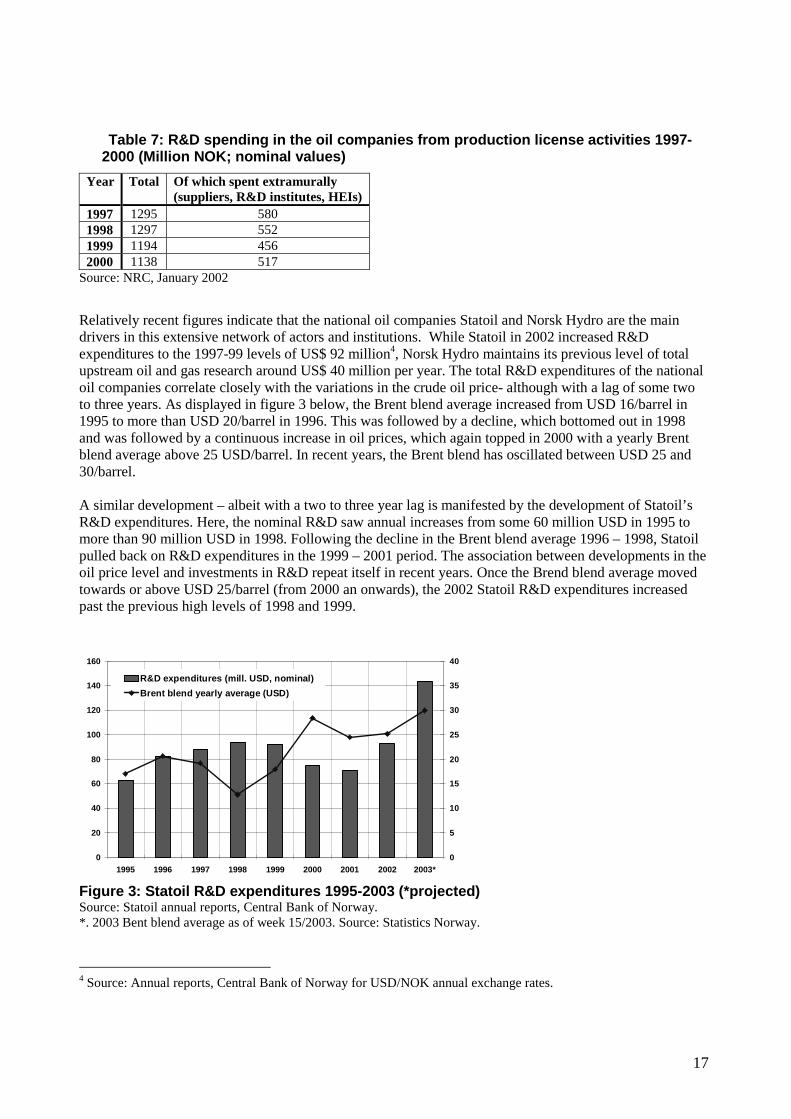
Table 7: R&D spending in the oil companies from production license activities 1997-2000 (Million NOK; nominal values)
Year Total Of which spent extramurally (suppliers, R&D institutes, HEIs)
1997 1295 580 1998 1297 552 1999 1194 456 2000 1138 517
Source: NRC, January 2002
Relatively recent figures indicate that the national oil companies Statoil and Norsk Hydro are the main drivers in this extensive network of actors and institutions. While Statoil in 2002 increased R&D expenditures to the 1997-99 levels of US$ 92 million4, Norsk Hydro maintains its previous level of total upstream oil and gas research around US$ 40 million per year. The total R&D expenditures of the national oil companies correlate closely with the variations in the crude oil price- although with a lag of some two to three years. As displayed in figure 3 below, the Brent blend average increased from USD 16/barrel in 1995 to more than USD 20/barrel in 1996. This was followed by a decline, which bottomed out in 1998 and was followed by a continuous increase in oil prices, which again topped in 2000 with a yearly Brent blend average above 25 USD/barrel. In recent years, the Brent blend has oscillated between USD 25 and 30/barrel. A similar development – albeit with a two to three year lag is manifested by the development of Statoil’s R&D expenditures. Here, the nominal R&D saw annual increases from some 60 million USD in 1995 to more than 90 million USD in 1998. Following the decline in the Brent blend average 1996 – 1998, Statoil pulled back on R&D expenditures in the 1999 – 2001 period. The association between developments in the oil price level and investments in R&D repeat itself in recent years. Once the Brend blend average moved towards or above USD 25/barrel (from 2000 an onwards), the 2002 Statoil R&D expenditures increased past the previous high levels of 1998 and 1999.
Figure 3: Statoil R&D expenditures 1995-2003 (*projected) Source: Statoil annual reports, Central Bank of Norway. *. 2003 Bent blend average as of week 15/2003. Source: Statistics Norway.
4 Source: Annual reports, Central Bank of Norway for USD/NOK annual exchange rates.
0
20
40
60
80
100
120
140
160
1995 1996 1997 1998 1999 2000 2001 2002 2003*0
5
10
15
20
25
30
35
40
R&D expenditures (mill. USD, nominal)
Brent blend yearly average (USD)
18
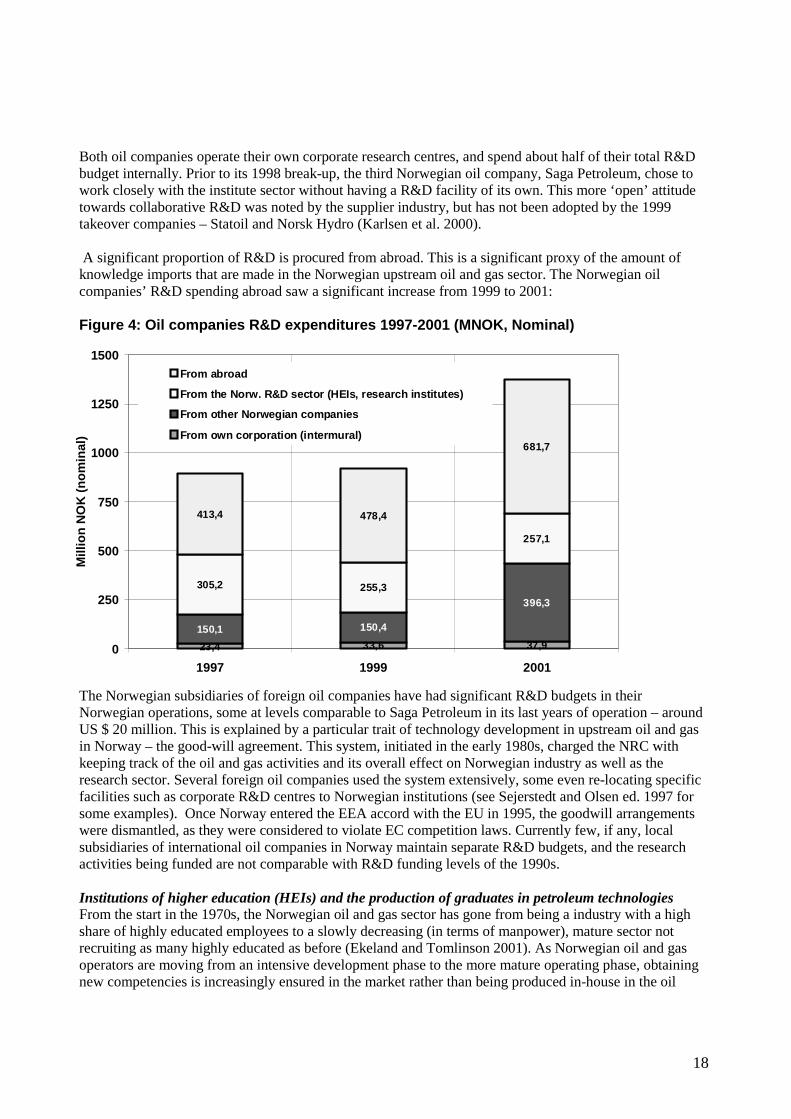
Both oil companies operate their own corporate research centres, and spend about half of their total R&D budget internally. Prior to its 1998 break-up, the third Norwegian oil company, Saga Petroleum, chose to work closely with the institute sector without having a R&D facility of its own. This more ‘open’ attitude towards collaborative R&D was noted by the supplier industry, but has not been adopted by the 1999 takeover companies – Statoil and Norsk Hydro (Karlsen et al. 2000). A significant proportion of R&D is procured from abroad. This is a significant proxy of the amount of knowledge imports that are made in the Norwegian upstream oil and gas sector. The Norwegian oil companies’ R&D spending abroad saw a significant increase from 1999 to 2001: Figure 4: Oil companies R&D expenditures 1997-2001 (MNOK, Nominal)
The Norwegian subsidiaries of foreign oil companies have had significant R&D budgets in their Norwegian operations, some at levels comparable to Saga Petroleum in its last years of operation – around US $ 20 million. This is explained by a particular trait of technology development in upstream oil and gas in Norway – the good-will agreement. This system, initiated in the early 1980s, charged the NRC with keeping track of the oil and gas activities and its overall effect on Norwegian industry as well as the research sector. Several foreign oil companies used the system extensively, some even re-locating specific facilities such as corporate R&D centres to Norwegian institutions (see Sejerstedt and Olsen ed. 1997 for some examples). Once Norway entered the EEA accord with the EU in 1995, the goodwill arrangements were dismantled, as they were considered to violate EC competition laws. Currently few, if any, local subsidiaries of international oil companies in Norway maintain separate R&D budgets, and the research activities being funded are not comparable with R&D funding levels of the 1990s. Institutions of higher education (HEIs) and the production of graduates in petroleum technologies From the start in the 1970s, the Norwegian oil and gas sector has gone from being a industry with a high share of highly educated employees to a slowly decreasing (in terms of manpower), mature sector not recruiting as many highly educated as before (Ekeland and Tomlinson 2001). As Norwegian oil and gas operators are moving from an intensive development phase to the more mature operating phase, obtaining new competencies is increasingly ensured in the market rather than being produced in-house in the oil
23,4 33,6 37,9
150,1 150,4
396,3
305,2 255,3
257,1
413,4 478,4
681,7
0
250
500
750
1000
1250
1500
1997 1999 2001
Mill
ion
NO
K (
no
min
al)
From abroad
From the Norw. R&D sector (HEIs, research institutes)
From other Norwegian companies
From own corporation (intermural)

19
companies. The human capital implications of this transition are also significant for the HEIs specialising in producing graduated for upstream oil and gas. The production of petroleum technology graduates at the masters and doctoral level is distributed amongst all the Norwegian universities and some of the university colleges. At the national level, the domestic production of graduates at the master’s level oscillates around 200 graduates per year. The number of doctorates issued in the same technological fields amount to a mere 10-20 PhDs per year. This does not account for candidates obtaining similar academic degrees abroad. Traditionally, there has been a higher domestic demand for such studies than the places available at the universities, so the number of university graduates abroad is also of some significance. Overall, the Norwegian University of Technology and the University College of Stavanger have produced the highest number of graduates in these fields. Table 8: Graduates in petroleum technological fields at Norwegian HEIs 1997-2001
1997 1998 1999 2000 2001* University of Oslo - masters of science 10 10 10 10 10 - doctores 1 2 2 2 1 University of Bergen - masters of science 12 18 11 6 13 - doctores 0 2 2 1 3 Norw. University of Technology - masters of science 98 118 98 95 45 - doctores 6 10 10 4 10 Stavanger University College - masters of science 106 83 85 133 71 - doctores 2 5 1 2 2 TOTAL CANDIDATES 235 248 219 253 155
Source: Karlsen et al. (2002); tables 4.2.2-3 *: preliminary The table incorporate only candidates in geosciences, offshore and/or petroleum technologies. Suppliers and integrated service companies Global service companies such as Schlumberger and Halliburton constitute a first tier of well-service and drilling companies, with a second-tier of smaller national and international supplier firms that mainly operate in the North Sea. In the offshore engineering segment of the industry, the competitive advantage of the smaller companies often resides with the personal expertise that has been obtained through hands-on experience at one of the major engineering or oil companies. The innovative capability is usually manifested in continual incremental innovations (Skogli 1998). There are two main suppliers of offshore engineering services on the Norwegian Continental Shelf – AkerKvaerner and ABB. AkerKvaerner is a global provider of engineering and construction services and integrated solutions. In 2002, some 45 per cent of the AkerKvaerner turnover came from the oil and gas industry business area (AkerKvaerner Annual Report 2002). In table 9, ABB Holding AS incorporate the activities related to the ABB business area offshore systems, a provider of upstream oil and gas headquartered in Oslo, Norway.

20
Table 9: the largest oil and gas suppliers and integrated services companies by 2002 turnover and employment
Company 2002 turnover (billion NOK)
No. of employees
AkerKvaerner 43,64 32863 ABB Holding AS 12,36 8441 Petroleum Geo-Services ASA 7,92 4830 Smedvig ASA 3,35 3100 Fred Olsen Energy ASA 2,99 1278 Prosafe 2,89 1790 FMC Kongsberg Subsea AS 2,55 860 Baker Hughes AS 2,47 860 Heerema Tønsberg AS 2,32 281 Odfjell Drilling AS 2 1400
Source: Dagens Næringsliv June 19th 2003 Bourgeois and Jacquier-Roux (2002) argues that in terms of technical change, the global upstream oil and gas industry is in fact being transformed from a science–based to a supplier-based sector. In Norway, upstream oil and gas still remain science-based largely due to the strategic impact of collaborative, government-funded research initiatives. In 1997 Rogaland Research performed a survey of research alliances and technology development consortia arrangements in the Norwegian oil and gas supplier industry 1993-1996 (ref.). Out of a total of 168 respondents, some 41% reported to have established technology development agreements with customers in the petroleum industry. Suppliers in such partnerships were also more prone to put new patents or production licenses into use than suppliers not engaged in such innovative activities. In terms of the suppliers’ location on the value chain, technology development agreements were most common in the construction of offshore installations, while less so in sub-sea exploration and drilling. The oil and gas suppliers that actively sought IPR protection were on average larger establishments. On average, they had almost 300 employees while the oil and gas suppliers without such patenting/licensing activities had only half that number of employees on average. Thus, the survey of innovation activities in offshore SMEs displayed that research alliances and formalized technology development networks primarily benefited larger firms serving offshore engineering, construction and operations. . This is echoed in a similar survey of innovation and inter-firm collaboration amongst SMEs in UK upstream oil and gas (Cumbers, Mackinnon and Chapman 2003). Here, oil operators and major service contractors were identified as the most important collaboration partners, indicating that for most SMEs in upstream oil and gas collaborative technology development is performed within ‘demand-related networks’ sentered on requirements identified by key customers. The collaboration relationships are described as relatively one sided, with “the onus falling upon SMEs to prove their reliability, with larger contractors and operators having few incentives to build high-trust relationships” (Cumbers et al. op.cit.: 1699). The barriers to collaborative technology development may have been reinforced by the recent restructuring of the Norwegian upstream oil and gas following the government-industry NORSOK initiative.5
5 NORSOK was an attempt to reduce operating costs by 40-50% from the 1993 levels in offshore petroleum
production on the Norwegian continental shelf in the 1994-2000 period. In the process, technology development in upstream oil and gas became less of a task for the oil companies, who outsourced major technology development tasks to offshore engineering companies, integrated service companies and NTBFs (see Engen 2002 for a thorough analysis).
21
To what extent have strategic shifts in the upstream oil and gas industry lead to supplementary or complementary innovations in the oil companies and service firms? Creusen and Minne (op.cit.) display that the oil companies and the specialised major service corporations such as Schlumberger and Halliburton are developing supplementary technologies. Oil engineering firms and drilling firms are specializing in product development for the upstream part of the oil industry. 3D and 4D visualisation technologies may be just one case in point. By concentrating their R&D on separate fields, upstream oil and gas suppliers have to differentiate on separate markets. 5 Public policies for developing the innovation system in upstream oil and gas Tax reduction schemes for increased R&D in SMEs The Norwegian Tax Reduction Scheme for R&D Costs (SkatteFUNN) was put into operation in October 2002. By this, companies that perform legitimate R&D and innovation activities are entitled to a tax reduction of <20% of documented R&D outlays in approved R&D projects. If the R&D project is performed on a stand-alone basis or in collaboration with customers, suppliers or other companies, the ceiling of total R&D costs are put at NOK 4 million. If the company cooperates with an R&D institution (research institute or academic), the ceiling of R&D expenditures is put at NOK 8 million. A formal requirement for funding is that the R&D may lead to new technologies that may be patented.
By the end of 2002, SkatteFUNN had received 51 applications for R&D projects in upstream oil and gas (Rønneberg 2003). This amounted to some 1.9% of all SkatteFUNN business R&D applications, whereas the upstream oil and gas project cost totaled 2.4% of all applicants’ eligible project costs for 2002. IPRs The main external factor explaining the industry-wide drop in R&D expenditure levels in upstream oil and gas are related to the low expected profit to risk ratio of R&D investments (Creusen and Minne 2000). In addition, the maturity of oil fields may be a reason for few new technical opportunities being sought in the Norwegian upstream oil and gas industry. Low expected profits of R&D investments has clearly led to a reduction of the overall R&D expenditure level, In terms of patenting activities this drop is real. Aspects of the intellectual property regimes of the oil and gas industry are also of relevance, as oil companies may regard R&D as too risky an endeavour if aimed at new energy sources. As Acha and others have displayed in a series of recent studies (Acha 2000, Acha and Cusmano 2001, Bloch and Voola 2002, Bourgeois and Jacquier-Roux 2002), the major oil companies refrain from leading-edge or pioneering R&D strategies while instead choosing to copy or mainstream the more sparing or conservative R&D strategies. In a relatively mature industry technological leadership is of less strategic value. Instead, common expectations shared by the major oil companies tend to lead to R&D races since the companies hardly benefit from knowledge spillovers but instead must rely on in-house knowledge production and innovations. Yet, when knowledge spillovers occur in innovating firms in the upstream petroleum industry, they are likely to be non-trivial (Acha 2000). The 2001 Norwegian innovation study displays that upstream oil and gas companies are more prone to protect their intellectual property rights by ways of secrecy or by increasing the complexity of technological systems and designs than the Norwegian industry in general:

22
Table 10: Measures used to protect IPRs 1999-2001
Industry No. of innovative companies
Filing for patent protection
Strategic secrecy
Strategically complex systems design
Time advantages
Upstream oil and gas
36 67% 62% 27% 29%
Total private sector
3416 18% 31% 19% 25%
Source: Statistics Norway Innovation Survey 2001 (rev. July 2003) The upstream petroleum industry is characterised by frequently shared asset ownership, an extensive international supplier industry dominated by a handful multinationals and an information-hungry regulatory framework. Most companies seek to maximise lead time advantages rather than to increase the efficiency of technology appropriation procedures (Acha 2000). Consequently, patents and publications created by a company are not determining factors in innovation processes in upstream petroleum, but rather the knowledge about where and how to apply particular technologies. Rather than sourcing technologies in-house, the major oil companies choose to by innovate by leveraging resources in collaboration with other organisation (Bourgeois and Jacquier-Roux 2001). And rather than developing proprietary knowledge, the majors aim at gaining know-how through innovative technology applications. The knowledge to integrate technologies such as those described in the case studies is clearly a core technological and organisational capability for the major oil companies. Statoil and Norsk Hydro are the dominant agents in terms of international patent shares among Norwegian multinationals. A 1999 study displayed that these two state companies alone held almost 25 per cent of all patents assigned to Norwegian corporations in the US in the 1990- 1996 period. Half of the top 10 companies on this list were in petroleum-related industries (geological surveying, offshore construction) a clear indication of the significance of IPRs in the global petroleum industry. To what extent have strategic shifts in the upstream oil and gas industry lead to supplementary or complementary innovations in the oil companies and service firms? Creusen and Minne (op.cit.) display that the oil companies and the specialised major service corporations such as Schlumberger and Halliburton are developing supplementary technologies. Oil engineering firms and drilling firms are specializing in product development for the upstream part of the oil industry. 3D and 4D visualisation technologies may be just one case in point. By concentrating their R&D on separate fields, upstream oil and gas suppliers have more opportunities to differentiate on separate markets. Some of the main observations made this far on the Norwegian innovation system in oil and gas are that
• R&D expenditures are dominated by the private petroleum industry. A major part of these expenditures are spent abroad.
• Public R&D expenditure has been nominally stable from 1987 to 2003. • The oil companies are mainstreaming their R&D strategies. They are increasingly following a
cost-driven approach searching for opportunities to succeed in new oil provinces. • As a complementary move, oil engineering and drilling firms operating in the North Sea are
currently specialising in product development for the upstream part of the oil and gas industry. Environmental sustainability issues and innovation Norway outlawed burning of gas to produce oil already in 1971. Towards the end of 1970-ies the amount of oil allowed in the water discharge was set as low as 25 ppm, long before intentional agreements were introduced. So upstream oil and gas, together with aquaculture, have been in the intentional forefront of identifying improved environmental sustainability in production as a driver of innovation in their particular industry. For both of theses industries, this may to a large extent be a response to the imposition of new
23
environmental regulations both nationally and internationally. The aquaculture industry is regulated by spills permits as outlined in the Norwegian Pollution Control Act. In upstream oil and gas, oil spills are regulated by the same Act. In addition, the North Sea is identified as a special protected area under the MARPOL 73/78 convention, which calls for additional awareness in terms of spills. Increased energy consumption in the offshore production facilities requires augmented consumption of natural gas in order to produce electricity. Norway is blessed with hydropower, so the upstream oil and gas production is a major source of greenhouse gas emissions, in particular of CO2 and NOX.Offshore oil and gas production alone contributed with 19 per cent of the total Norwegian greenhouse emissions as measured in CO2-equivalents in 2001. Since 1990 such offshore emissions have increased almost 50% (Statistics Norway, 2003), almost solely to increase the amount of natural gas we deliver to Europe so the can reduce their emissions from coal and oil fired plants.
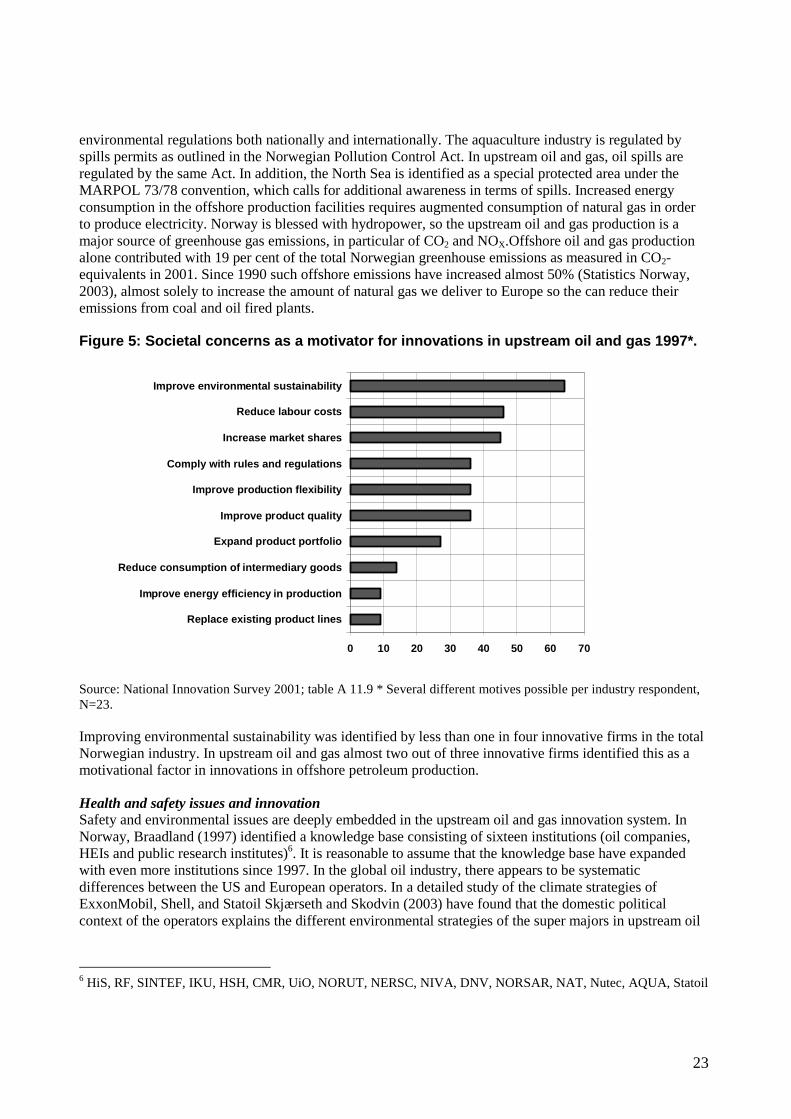
Figure 5: Societal concerns as a motivator for innovations in upstream oil and gas 1997*.
0 10 20 30 40 50 60 70
Replace existing product lines
Improve energy efficiency in production
Reduce consumption of intermediary goods
Expand product portfolio
Improve product quality
Improve production flexibility
Comply with rules and regulations
Increase market shares
Reduce labour costs
Improve environmental sustainability
Source: National Innovation Survey 2001; table A 11.9 * Several different motives possible per industry respondent, N=23.
Improving environmental sustainability was identified by less than one in four innovative firms in the total Norwegian industry. In upstream oil and gas almost two out of three innovative firms identified this as a motivational factor in innovations in offshore petroleum production.
Health and safety issues and innovation Safety and environmental issues are deeply embedded in the upstream oil and gas innovation system. In Norway, Braadland (1997) identified a knowledge base consisting of sixteen institutions (oil companies, HEIs and public research institutes)6. It is reasonable to assume that the knowledge base have expanded with even more institutions since 1997. In the global oil industry, there appears to be systematic differences between the US and European operators. In a detailed study of the climate strategies of ExxonMobil, Shell, and Statoil Skjærseth and Skodvin (2003) have found that the domestic political context of the operators explains the different environmental strategies of the super majors in upstream oil
6 HiS, RF, SINTEF, IKU, HSH, CMR, UiO, NORUT, NERSC, NIVA, DNV, NORSAR, NAT, Nutec, AQUA, Statoil

24
and gas. While the European oil companies work with the Kyoto protocol, ExxonMobile has chosen to confront Kyoto in the rivaling Global Climate Coalition.
The development of human resources and skills in the Norwegian oil & gas activities is supported by extensive laws and regulations as to health, environment and safety (HES) and the responsibility for the companies to develop the knowledge and skills of their employees. Included in these regulations is an obligation to develop the human skills of the employees and the work environment. The laws are built on a principle to HSE regulations. Zero accidents is the philosophy in safety management. The Norwegian Petroleum Directorate (NPD) sets the premises for the level of efforts done in the human resource and HES field. During the history of the Norwegian oil and gas activity the NPD has initiated and run several meeting places with the aim to further develop the safety and work environment in the North Sea. The Safety Forum is one example of an arena for dialogue between the authorities, the unions and the companies. In recent years the NPD had also initiated several inter-organizational projects with the aim to increase the competence and improve the safety and HES culture. One of these projects is the Risk level on the Norwegian Continental Shelf and several projects on the development of risk indicators. Similarly the Ministry of Administrative Affairs motivated the Norwegian Research Council to initiate a research program for the period 2002-2006 called HES- offshore with a total budget of 20NOK. The vision of this is program is improved work environment in the oil and gas industry and to integrate HES considerations in the decision and management tools in the industry. The program has four thematic pillars: 1. HES culture, 2. Organization, work place democracy and regulations, 3) Risk analyses and measurement 4) Physical work environment, aging and health. The research is multi-disciplinary and is carried out in collaboration with the industry. The three event types in 2002 that have made by far the greatest contribution to loss of life in major accidents are hydrocarbon leaks, well-kicks and structural failure. Together these made up more than 70% of the total risk indicator (OD-03-08). On the basis of data from the project risk levels on the Norwegian Continental Shelf, it is documented that the increase in levels of risk in 1999 and 2000 would seem to be further strengthened in 2002, after a temporary improvement in 2001. The frequency of serious injuries on the installations is on the same level as the average over the last then years (OD-03-08). The companies in the oil & gas industry hold a high level on their human resource management, and ideas and principles from the oil sector are copied and used outside the industry. This is the case for the Norwegian electric industry that was deregulated in 1992. The deregulation created a need for new performance standards in human resource management. On health and safety the electric energy branch hold the same high level as in the oil industry.
Other innovation support structures Norway has had science parks in operation since the mid 1980s. By 2002, some ten parks have been established. New technology-based firms (NTBFs) aimed at serving upstream oil and gas markets have been established in several of the Norwegian science parks. Only in Stavanger, where Rogaland Knowledge Park is located on the Stavanger University College campus, and in Trondheim small industrial milieux serving the petroleum industry have remained on the premises of the local science parks. In Trondheim several Science Parks and incubators serve the Norwegian University of Science and Technology. None of these companies have demonstrated significant growth in terms of turnover and employment, and the patenting activities of the science park companies remains low (Askevold et al. 2003). The lack of venture capital remains a prime concern for the establishment of NTBFs in upstream oil and gas.

25
6 Innovation performance in upstream oil and gas: new assessments using bibliometric and patenting data
Norwegian R&D statistics are prepared every second year on commission from the Norwegian Research Council (NRC). The Norwegian Institute for Studies in Research and Higher Education, NIFU, is responsible for assembling the statistics on the Higher Education sector (HEIs) and the Institute sector (public and private R&D institutes), while Statistics Norway is responsible for the Industry sector. The survey of R&D activities in the industry sector contains all companies with 50 or more employees. In addition, it includes a selection of smaller companies with a minimum of ten employees. Data on the innovation inputs and outputs of individual enterprises throughout Norway are collected, measuring the introduction of new or improved products and processes whilst taking into account innovations arising from industrial design and investment in new equipment, as well as those based on R&D. The HEIs are thoroughly surveyed. Each individual department or corresponding unit are included, as well as university hospitals. Supplementary sources of information include information on expenditures from the central administration of each unit, the NRC and medical foundations. Complete surveys are used to cover the large Norwegian institute sector, with questionnaires being sent to research institutes and other institutions that are assumed to perform some R&D activities. In this paper the terms R&D Statistics and National Innovation Survey will be used interchangeably. The Norwegian Innovation Study provides information on the organisations involved in developing specific oil and gas exploration and production technologies. Although the sample of enterprises interviewed in oil and gas exploration and production is limited (usually with some 40 respondents in total) and highly skewed with large organisations being significantly over-represented, the NIS data on cooperation in innovations and sources of information in R&D collaboration efforts yield some insights on the topography of the upstream oil and gas innovation system.
Table 11: Co-operation in innovations 1997. Oil and gas exploration and production compared all industries/services
Proportion of enterprises who have co-operated on innovations with …
Oil and gas All industry and services
Other business units within the same corporation
74% 45%
Competitors 61% 18%
Customers 52% 49%
Consultancies 61% 34% Suppliers 74% 62% HEIs 74% 28% R&D institutes 70% 33%
Source: Norwegian Research Council 2002, rev. 2003
The table above displays that firms in oil and gas E&P co-operate in innovations more frequently that firms in the Norwegian industry as a whole independent of partner choice. In the oil and gas industry, co-operation in innovation is significantly more intensive with other units within the same corporation (74%

26
vs. 45%), with competitors (61% vs. 18%), with consultancies (61% vs. 34%), HEIs (74% vs. 28%) and R&D institutes (70% vs. 33%). Oil and gas exploration and production companies are more selective in their choice of information sources than industry and services in general. While oil and gas E&P companies mainly seek out such information within the same corporation, firms in general obtain such information in contacts with customers. In oil and gas, industry events and patenting documents play an insignificant role as information source in innovations. See table 12: Table 12: Sources of information in innovations 1997. Oil and gas exploration and production
Proportion of enterprises who have co-operated on innovations with …
Within the company 73% Customers 36% Suppliers 36% Competitors 18% Within the same corporation 55% Industry events/ exhibitions/ conferences - Scientific conferences 14% Consultancies 14% Internet 9% HEIs 14% R&D institutes 28% Patenting documents -
Source: NRC 2002 When mapping R&D collaboration and networking in upstream oil and gas in Norway, three technology sub-fields in upstream oil and gas have been assessed and prepared for a more detailed study. Case 1: 3D and 4D visualization technologies The theoretical principles of 3D seismology have been known for decades, and applications of the technology were used as early as in the 1970s. Commercial success was not assured until the parallel computing became available. With increased computing power, it became feasible to consider better ways of recording and collecting seismic data as well as modelling the geophysical inputs. The integration of high performance computing is in fact a major aspect of petroleum exploration and production. Applications of 3D imaging have also found industrial applications in PC games, medical imaging, geophysical research and meteorology. While the adoptions of 3D and 4D visualisation technologies within the oil and gas industry are inversely correlated with the cost of using the technology, they are also directly related to the benefits gained as revealed from benefit experience (Bohi 1998). In maturing offshore oil fields, these benefits are reaped as visualisation technologies are applied to identify marginal fields that may still be economically feasible to extract. Bloch and Voola (2002) suggest that the introduction of new seismic technologies may stimulate a more non-cooperative and aggressive strategic behaviour among the upstream oil companies, as they increase exploration expenditures in response to the new technology.
27
The oil companies have outsourced the 3D and 4D software competencies to specialised suppliers, whilst retaining seismic interpretation as a core competency. In this way, the oil majors have outsourced specialised ICT competencies to the upstream oil and gas suppliers, and in particular to the global engineering and drilling service companies such as Halliburton and Schlumberger. The two Norwegian oil majors apply competing technological solutions when implementing 3D visualisation. Norsk Hydro implements technological solutions developed by Schlumberger Information Solutions and the Christian Michelsen Research Institute, while Statoil rely on Landmark Graphics, a Halliburton company, to obtain the same services in developing 3D visualisation tools. Statoil has also invested in specialised ICT companies, such as Voxelvision of Trondheim, to secure their technological interests even further. Key informants in the Norwegian national companies and the suppliers of advanced ICT services provided us with some coherent views on the evolution of 3D/4D visualisation technologies in upstream oil and gas in Norway in the spring of 2003 (see box)
Box: implementing 3D visualisation technologies in Norwegian upstream oil and gas The initiative to implement visualisation technologies in upstream oil and gas does not come from corporate management, but rather form key expert employees who come across such technologies more or less by accident. These individuals take the lead in introducing visualisation technologies to the corporation. Participation at scientific conferences and collaborations with R&D institutions appear to be essential for the successful knowledge diffusion process. By introducing 3D as a work tool to improve the interpretations of seismological data, the oil companies have been able to increase the economic returns on oilfield development. A more unforeseen effect has been that by applying visualisation technologies in the decision-making process, organisational changes has also been brought about. The technology calls for increased teamwork where various specialist professions collaborate in the interpretation of large amounts of data. Working with this technology has made it easier to communicate across disciplines. The uptake of 3D visualisations technologies in upstream oil and gas has come from other natural sciences such as medicine, meteorology and astronomy. While the oil companies may be the initiators of technological advances in the fields, they rely on co-operation with specialised service companies (ICT specialists) and R&D institutions to be able to probe new applications and perform incremental innovations on the available technology formats. While the major 3D technology development milieux in upstream oil and gas are located abroad, some innovation effort is made in Norway as well. The main institutions involved in Norwegian University of Technology (NTNU) and some public R&D institutes. The main users of 3D are found amongst the oil and gas majors. Case 2: horizontal drilling Experiments with horizontal drilling techniques are also several decades old, and the feasibility of this approach to oil and gas production depends on 3D seismic information as a complementary technology. Only by using this input will drillers know where to place a borehole. In addition, horizontal drilling success depends on steerable motor assemblies so that drillers can guide drillstrings to precise targets, and on downhole sensoring technologies so that the drillers continuously know where the drillstring is located relative to the target. Many current applications of horizontal drilling involve small or thin deposits and high quality 3D information is essential for locating them. In addition, 3D surveys over time (also known as 4D
28
visualisation technologies) enable the oil and gas producers to determine the economic efficiency of extraction strategies or enhancing recovery applications. The speed with which horizontal drilling techniques have been adopted in the global petroleum industry is company-specific, region-specific and oil-specific (Bohi 1998). The advantages of horizontal drilling are greater for oil than for gas deposits. Reservoir characteristics determine the locations which make horizontal drilling particularly advantageous. In general, access to horizontal drilling techniques and the skills to use them are retained in drilling service companies. Many of them work under contract to offshore operators. New knowledge, that is insights about the efficacy of horizontal drilling in new geological situations, is slowed down by corporate unwillingness of big oil to explore new technological approaches. Instead, in the North Sea, horizontal drilling has been readily adopted as the advantages are easily recognised. Norway`s larges oil producer in 2002 and 2003 was the Troll field. Originally considered only a gas giant, it was developed stretching technology and horizontal wells to the extreme. Case 3: subsea production and deepwater systems What makes deepwater systems different from other offshore oil production activities is the slower pace of imitation and diffusion of technologies. The capability to produce oil and gas from deposits located under deep water have developed gradually the last 50 years, as the upstream oil and gas industry’s capability to operate in deep water hinges in innovations made both in 3D seismology, development of new users and dynamic positioning as well as directional (horizontal) drilling (Bohi 1998). The additional depths achieved by advanced floating production vessels have also helped to narrow the gap between water depth capability of exploratory drilling and the water depth of development (e.g. production) drilling. Petrobras, Shell and BP have been pioneers in deep water development, while the Norwegian national oil company Statoil still remains a laggard in this field, particularly with respect to provinces other than those in the North Sea (Acha and Finch 2003). Oil majors are increasingly demonstrating the viability of deep-water exploration and production to the drilling companies who, in turn, offer their services to small independent oil companies engaged in tail production in maturing offshore oilfields. Prior surveys of R&D collaboration and networking in upstream oil and gas in Norway Braadland (1997) has mapped the institutional knowledge base of the Norwegian oil and gas sector. He has defined offshore oil and gas exploration, development and production as a complex industry involving eight major sequences of production activity, nineteen major technological fields and 30 main knowledge fields. In terms of the research institutions involved in the three technological fields identified as case studies above (broadly defined), Braadland confirms the centrality of a small set of research institutions.
He demonstrates that the Norwegian knowledge base is constituted not only by national and international oil operators, but also by some 26 publicly financed research institutes and a total of 24 university departments. Statoil and Stavanger University College were identified as R&D nodes in the technological fields of subsea technology, drilling and analysing geological data. A total of seventeen academic institutions, research institutes and private companies were found to be engaged in R&D in these three technological sub-fields in the mid 1990s.The largest R&D milieu was devoted to drilling, while sub-sea production catered to the smallest R&D network. In the figure, the colour code displays HEIs as green, private oil companies as orange and public research institutes as white.
29
Figure 6: institutional R&D network in upstream oil and gas in selected technological sub-fields 19977
Source: Modified from Braadland 1997 The volume of R&D in private sector firms devoted to technology development in upstream oil and gas are not easily disclosed due to confidentiality reasons. Some insights on the organisational networks of firms and institutions engaged in R&D cooperation in upstream oil and gas on the Norwegian Continental Shelf is provided by Acha and Cusmano (2001) in their probe of the INFOIL/SESAME database on Norwegian, British and other EEC research and development projects within the offshore oil and gas, hydrocarbon technology and other petroleum related fields. The database includes projects from 1980 to 1998, and was searched for records of publicly funded research projects described with terms such as ‘joint research’, ‘joint industry project’ and ‘collaborative research’. The resulting dataset included a total of 73 projects and 146 upstream oil and gas organisations, who could be identified in an ‘affiliation network’ where the set of actors (economic institutions) were classified with respect to their attendance to a set of events (co-operative R&D projects). The network analysis displays
7 HiS = Stavanger University College, NTNU=Norwegian University of Science and Technology, UiB=University of
Bergen, UiO=University of Oslo, NORSAR=Norwegian Seismic Array; NGU=Geological Survey of Norway; DNV=Det Norske Veritas Research; Nutec=Norwegian Underwater Technology Centre; FFI=Norwegian Defence Research Establishment; MARINTEK=Norwegian Marine Technical Research Centre; RF=Rogaland Research; MBS=Norwegian Institute for Masonry and Concrete Research; NORUT=NORUT IT; NP=Norwegian Polar Institute; IKU=Continental Shelf and Petroleum Technology Research; SINTEF=Foundation for Scientific and Industrial Research
Analyzing geological data
Subsea technology
Drilling
SINTEF
UiO
UiB
IKU
NP
MARINTEK
NTNU
HiS
Statoil
NOR-SAR
NGU
DNV Nutec
FFI RF
MBS NORUT
30
the centrality along with other network dimensions of different HEIs, government bodies and private enterprises in upstream oil R&D co-operation. GRTH, a mixed institution which was in fact a joint research venture between Total SA, Elf Aquitaine and the IFP stand out as the most active entity, followed by the oil operator ELF, research centres such as EFI and government agencies such as NPD. Det Norske Veritas stands out as the most active contractor of the R&D network, while only three oil companies are among the institution with the highest degree of centrality. Oil operators and integrated service suppliers were nexus nodes of the R&D network, linking HEIs and governmental bodies to separate sub-groups of interaction. Acha and Cusmano also organised the research projects into eight broad thematic areas, including seismic data and processing, offshore systems design and reservoir flow and dynamics. Few projects were dedicated to areas of technology in which the oil operators maintained core competencies. The actors at the centre of activity between the themes – the knowledge brokers in this part of the Norwegian upstream oil and gas innovation system – were predominantly oil operators with a few R&D institution and governmental agencies completing the picture. The most significant bridging institutions were the operators ELF Aquitaine, Shell and Statoil. In addition to the network analyses summarised above, complementary bibliometric analyses based on statistics on patents and scientific publications within a selection of technological fields of strategic relevance to the development of the Norwegian oil and gas industry have been performed. The main benefits of such analyses are that they allow us to
• identify relevant actors involved in the scientific and technological activities put under scrutiny, • determine the scientific and technological output of the different actors identified, • identify scientific and technological co-operations between actors at both the national and
international level, and • characterise in much greater detail the way oil and gas industry actors (countries, sectors,
institutions) interact as a collective system of knowledge production and diffusion A bibliometric analysis of scientific publications in selected technology sub-fields For the bibliometric analysis a data set was compiled from various data bases. Thematic experts in the research field selected the references. We identified Norwegian papers for the period 1991-2002. We followed a keyword approach and keywords were identified by experts. Keywords to the following technological sub-fields in upstream oil and gas were chosen: 3D/4D visualisation, horizontal drilling and deep water systems (sub sea production). The publications are concentrated in the following subject fields: earth sciences, computer science & engineering and chemical engineering & applied physics. Not all publications included had received a prior peer review, as they include conference proceedings, notes, editorials, abstracts and book chapters as well as scientific articles. On average, between 10 and 20 scientific contributions were identified for a given year, totalling 205 papers.
Based on the number of published papers (P = 205), a number of bibliometric indicators were calculated, such as the numbers of citations received by those papers (C), the average number of citations per paper (CPP), the expected citation rate for papers chosen (XCR), and the share of non-cited papers (%Pnc). The indicators were compared with similar indicators taken from a publication and citation analysis of three other contemporary research fields 1993-2000 – biotech, marine sciences and economics (Hinze 2001). Publications in oil and gas came out favourably when compared with economics, but was found to have lesser international impact than biotech and marine sciences. The relative lack of impact of Norwegian scientific publications in upstream oil and gas may be due to the choice of search terms used. In oil and gas search terms were delimited to the three technological sub-fields (3D/4D visualisation, horizontal drilling,

31
sub-sea production), while the search terms used in the biotech, marine sciences and economics were much more general.
Table 13: Bibliometric indicators in various technological fields
INDICATOR OIL&GAS (1991-2002)
BIOTECH (1993-2000)
MARINE SCIENCE (1993-2000)
ECONOMICS (1993-2000)
Number of published papers (P) 205 1962 3358 320 Numbers of citations received by those papers (C)
761 19960 18213 663
Average number of citations per paper (CPP)
3,71 10,17 5,42 2,07
Expected citation rate for papers chosen (XCR)
3,40 9,20 4,63 1,99
Share of non-cited papers (%Pnc) 44,88 21,92 30,02 55,00 Sources: Rapmund (2003), Hinze (2001)
Rapmund (2003) has complemented the bibliometric analysis by creating a network map of the national co-authorship in the three sub-fields of petroleum research. In this way, the institutional affiliation of the different authors could easily be identified. In the display, universities and colleges are coloured green, private corporations yellow and specialised public R&D institutions. Public R&D institutions that are not specialised in upstream oil and gas are coloured light blue. The size of the circles displays the relative number of scientific papers identified.
Figure 7: Norwegian institutions active in the chosen sub-fields of petroleum research 1991-2002 (N=205)
University of
Bergen
Saga Petrol
ABB
ELF
Aker Geo
NTNU Geolog. Survey
NHH
Roxar
Shell
CMR
Uni Coll Bergen
IFE
Norw comp
PETEC
NGI
NPD
Norsk Hydro
Rogaland Research
Forus Phillips Petrol
BP A
HI
Techn AS
Uni C Molde
Uni C Agder
Nor-sar
Aer Hess
Glow
CMI
Veri-tas
EB
Esso
FFI
Glob. Marit.
BI
Infor Strat
Kongsberg
Metro-nor
PGS
Plugg Spec.
Safe-tec
Veri-tec
IBM
Statoil
University of
Oslo
SINTEF Group
University college of Stavanger
Ånde-rå Inst

32
Source: Rapmund (2003); figure 13
A preliminary bibliometric analysis of publications and research co-operation made by Norwegian scientists in these three technology fields from 1991-2002 illustrates the structure of R&D co-operation in upstream oil and gas in greater detail (Rapmund 2003). The bibliometric (publications and citations) analysis surveys the scientific publications related to the three technological sub-fields described in the three cases above. The analysis was made following a keyword approach, and data were compiled from various data bases.8 The main Norwegian actors in these three fields proved to be some of the major HEIs, some public R&D institutes and the three national oil companies, that is the University of Bergen, NTNU – Norwegian University of Science and Technology, the University of Oslo, the SINTEF Group, Rogaland Research, Statoil, Norsk Hydro and Saga Petroleum. The business sector and the HEIs were almost equally strong with respect to representation in the data set, while the R&D institutes had a more marginal position. In total, 51 different Norwegian actors (firms, institutions) were found to have published in the three technological sub-fields of 3D/4D visualisation, horizontal drilling and deep water systems. In total volume, Statoil was found not only to be the most productive private enterprise in the field(s), but also the main Norwegian actor altogether. The figure below displays the Norwegian actors active in publishing R&D findings in the three technological fields 1991-2002. The size of the circles indicate the relative number of publications, while the colour indicate the type of actor involved. Private sector companies (oil companies, engineering contractors, integrated service or supplier industry firms) are indicated in yellow, HEIs in green and R&D institutions in orange. Private sector actors far outnumber the two other categories of actors. In a separate analysis, Norwegian authors were found to co-operate successfully with foreign colleagues. 32.3% of the ISI-indexed publications in the dataset were internationally co-authored with the main co-authoring countries being the USA, Great Britain and France. This corresponds well with the presence of international oil majors and supermajors on the Norwegian Continental Shelf. Patenting analysis of upstream oil and gas Cohen, Nelson and Walsh (1997) found patenting to be an important and effective appropriation tool in the petroleum industry. However, recent theoretical and empirical studies have demonstrated that firms may use patenting for purposes other than appropriating economic returns. As indicated by Langinier (2003), there is ample evidence that firms use ´decoy patents’ to direct competitors into unprofitable fields of research. Bluff patenting is a part of the game, and the filing of decoy patents are common to mislead competitors and mislead them to believe that the company filing for patent protection is doing research in particular technological areas. In the oil and gas industry, it is common practice to ‘patent numerous inventions, with only one good in a flood of bad inventions’ (Langinier op.cit.: 3-4).
Knowledge spillovers are a much broader concept than what is captured by patent citations alone. Patents are in fact, as argued by Criscuolo et al. 2002, the ultimate example of codified knowledge, as they require an exact description of technological findings according to legally defined methods. Patenting documents leave no trail of tacit knowledge flows involved. Nevertheless we did search in Delphion databases9 in addition to Norwegian granted patents and applications for patent applications and patents granted 1990-2002 in the offshore technology fields of 8 Data bases used were ISI Web of Science, ISI Proceedings, INSPEC, ETDE World Energy Base of the International
Energy Agency, the ISI national Citation Report for Norway and ISI Journal Performance Indicators on Diskette. 9 US granted patents and applications (US), European granted patents and applications (EPO), WIPO PCT
publications and INPADOC.
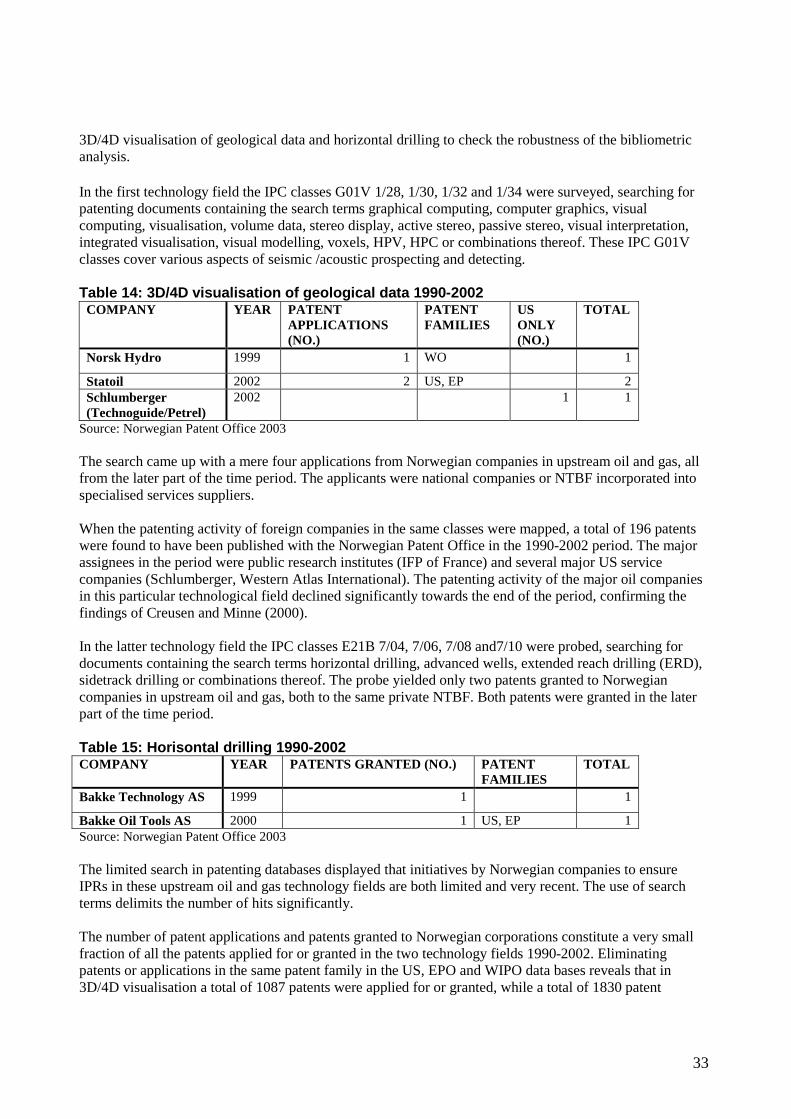
33
3D/4D visualisation of geological data and horizontal drilling to check the robustness of the bibliometric analysis. In the first technology field the IPC classes G01V 1/28, 1/30, 1/32 and 1/34 were surveyed, searching for patenting documents containing the search terms graphical computing, computer graphics, visual computing, visualisation, volume data, stereo display, active stereo, passive stereo, visual interpretation, integrated visualisation, visual modelling, voxels, HPV, HPC or combinations thereof. These IPC G01V classes cover various aspects of seismic /acoustic prospecting and detecting. Table 14: 3D/4D visualisation of geological data 1990-2002
COMPANY YEAR PATENT APPLICATIONS (NO.)
PATENT FAMILIES
US ONLY (NO.)
TOTAL
Norsk Hydro 1999 1 WO 1
Statoil 2002 2 US, EP 2 Schlumberger (Technoguide/Petrel)
2002 1 1
Source: Norwegian Patent Office 2003 The search came up with a mere four applications from Norwegian companies in upstream oil and gas, all from the later part of the time period. The applicants were national companies or NTBF incorporated into specialised services suppliers. When the patenting activity of foreign companies in the same classes were mapped, a total of 196 patents were found to have been published with the Norwegian Patent Office in the 1990-2002 period. The major assignees in the period were public research institutes (IFP of France) and several major US service companies (Schlumberger, Western Atlas International). The patenting activity of the major oil companies in this particular technological field declined significantly towards the end of the period, confirming the findings of Creusen and Minne (2000). In the latter technology field the IPC classes E21B 7/04, 7/06, 7/08 and7/10 were probed, searching for documents containing the search terms horizontal drilling, advanced wells, extended reach drilling (ERD), sidetrack drilling or combinations thereof. The probe yielded only two patents granted to Norwegian companies in upstream oil and gas, both to the same private NTBF. Both patents were granted in the later part of the time period. Table 15: Horisontal drilling 1990-2002 COMPANY YEAR PATENTS GRANTED (NO.) PATENT
FAMILIES TOTAL
Bakke Technology AS 1999 1 1
Bakke Oil Tools AS 2000 1 US, EP 1 Source: Norwegian Patent Office 2003 The limited search in patenting databases displayed that initiatives by Norwegian companies to ensure IPRs in these upstream oil and gas technology fields are both limited and very recent. The use of search terms delimits the number of hits significantly. The number of patent applications and patents granted to Norwegian corporations constitute a very small fraction of all the patents applied for or granted in the two technology fields 1990-2002. Eliminating patents or applications in the same patent family in the US, EPO and WIPO data bases reveals that in 3D/4D visualisation a total of 1087 patents were applied for or granted, while a total of 1830 patent

34
applications or grants were made in horizontal drilling. Thus, those of Norwegian origin represented a mere 0,2 % . Combining the results of the bibliometric and patenting analysis, we may produce a temporal impression of the time profile of knowledge production and IPR activities in the selected upstream oil and gas technology sub-fields. In figure 8, the columns refer to the number of Norwegian publications in the field of 3D/4D visualisation, horisontal drilling and deep water systems. The line displays the number of patent applications filed with the Norwegian Patent Office in one of the three technological fields (3D/4D visualisation) by both foreign and domestic companies. Figure 8: Historical development of petroleum publications and patenting in Norway in selected offshore technology sub-fields 1991-2002
Source: Rapmund (2003), Norwegian Patenting Office (2004) Surveys of the patent applications filed with the Norwegian Patenting Office in the fields of horizontal drilling and deep water systems 1991-2002 have not been performed. 7 Conclusions and policy implications In the introduction, we presented a stylised display of the components and linkages in the Norwegian upstream oil and gas innovation system. The direction and significance of knowledge flows between various institutions and actor groups were identified. In terms of R&D financing in upstream oil and gas, oil companies were identified as the drivers of the innovation system. Corporate funding dominates the innovation system. The national oil companies, Statoil and Norsk Hydro, are core actors. Some foreign operators, in particular ConocoPhillips and Total, have also invested significantly in R&D oil and gas exploration and production in the Norwegian continental shelf. Significant knowledge import is taking place within the international oil industry as there is a strong tradition for local subsidiaries to procure R&D services from various divisions of their mother companies.

35
The main contributions to innovations in the upstream oil and gas in the Norwegian education research system in terms of manpower and funding are made by public sector research institutions. In Norway, public funding for industrial R&D has given a handful of public research institutes an edge in comparison with the HEIs, who play a more peripheral role in applied research and technology development. The relations between the R&D institutions and the oil companies have traditionally remained close (see Isaksen 2003 for a corresponding analysis). While the public R&D institutions are struggling to uphold their somewhat favoured position in the national innovation system, the large suppliers (construction companies, global integrated service companies) are taking on a broader role in the innovation system. Through mergers and acquisitions of new technology-based firms, the large suppliers are becoming more significant for knowledge development and –diffusion in offshore exploration and production. As the global oil engineering and oil services firms operating in the North Sea are specialising in product development for the upstream part of the oil and gas industry, the specialised public R&D institutes (Christian Michelsen Research, the Norwegian Institute for Energy Technology, SINTEF and Rogaland Research) are experiencing some erosion of their position in the national innovation system. While the global oil companies operating in the North Sea invested in joint research with public R&D institutions, the outsourcing of oil and gas R&D from the oil industry to the supplier industry has so far led to an increase in the outsourcing of R&D tasks to research milieux abroad. The analysis of patenting activities in the field of 3D/4D visualisation technologies is a case in point. As the oil companies are reducing their patenting activity both absolutely and relatively, they are increasingly being replaced by the global service companies such as Schlumberger and Halliburton – companies with only marginal R&D investments in Norway. Currently, it remains to be seen how the offshore service companies choose to develop their relations with institutions in the public R&D sector. In the current industry setting, only few R&D alliances such as joint ventures or other cooperative efforts have been set up involving Norwegian HEIs, public R&D institutes or any of the global majors in the supplier industry. This may become a challenge to the innovation activities of these mainly publicly funded agents of the oil and gas innovation system. Intermediaries, such as private R&D institutes and professional knowledge brokers are peripheral to this national innovation system. Given the dominance of major oil companies and large suppliers in the corporate sector of upstream oil and gas, the national public infrastructure for innovation and business support has so far had little impact on the performance of the oil and gas innovation system. Main policy recommendations Given the structure of the national innovation system in upstream oil and gas, the number of policy instruments available for national authorities are rather limited. In an innovation system dominated by the corporate sector, and with significant knowledge imports from abroad, instruments aimed at stimulating R&D and commercialisation efforts in SMEs and HEIs will have marginal effects on the performance of the upstream oil and gas system as a whole. However, at the level of the individual oil company, supplier or NTBF policy changes may be of significance. Measures targeting the corporate sector: so far, there are few signs that the restructuring of the international oil and gas industry has led to a systemic failure in terms of R&D. As the operators are leaving technology development in many fields of exploration and production, the large suppliers have taken on an increased R&D responsibility. Upholding tax reduction schemes such as SkatteFUNN and R&D support to new

36
technology-based firms should remain a prime concern both in innovation and industrial policy, as the initial finding display such initiative to be relevant to SMEs in upstream oil and gas. Measures targeting the institute sector: the main challenge currently facing the Norwegian R&D institute sector is the strong increase in R&D costs, in particular among the industrial and technology-oriented R&D institutions. Since the mid 1990s, public funding of applied research in upstream oil and gas has remained stable, although the knowledge base required for increased oil and gas recovery on the continental shelf calls for a focussed R&D effort. As the global oil and gas industry is being transformed, national initiatives to strengthen the relations between the R&D institutes and the supplier industry needs to be explored. Measures aimed at improving policy learning: the Norwegian university and colleges have recently undergone IPR reforms. The effect of the reforms should be monitored closely. Currently the Norwegian Research Council funds a single Centre of Excellence serving the petroleum industry. The need to establish additional centres should be assessed.

37
REFERENCES Acha, V. (2000), “The role of technological capabilities in determining performance: the case of the
upstream petroleum industry”, Paper presented at the DRUID Winter Conference, Hillerød January 6-8.
- (2002), Framing the Past and Future: The Development and Deployment of Technological Capabilities by the Oil Majors in the Upstream Petroleum Industry, Academic dissertation SPRU, University of Sussex.
Acha, V. and L. Cusmano (2001), “Sharing capabilities: patterns of R&D cooperation in the upstream
petroleum industry”, Paper presented at the Future of Innovation Studies conference, Eindhoven September 20-23.
Acha, V. and J. Finch (2003), “Paths to deepwater in the international petroleum industry”, Paper presented at the DRUID 2003 Summer Conference, Copenhagen June 12-14.
Askevold, E.O., T. Laudal, J.M. Steineke and T. Halvorsen (2003). Norske forskningsparker: mot en bedre organisert nyskaping? Report RF-2003/169. Rogaland Research, Stavanger.
Bloch, H. and J. Voola (2002), “Strategic interactions and industry dynamics: a case study of the effects of
advanced upstream seismic technologies in the petroleum industry”, Paper presented at the DRUID Summer Conference, Copenhagen 6-8 June.
Bohi, D.R. (1998), “Changing productivity in US petroleum exploration and development”, Discussion paper 98-38, Resources for the Future, Washington D.C.
Bourgeois, B. and V. Jacquier-Roux (2001), “L’internationalisation des activités technologiques dans les industries énergétiques”, IEPE Report, Grenoble.
BP Statistical Review of World Energy June 2003
Braadland, T.E. (1998). Knowledge bases in the offshore sector. STEP-group, Oslo (unpubl. mimeo.) Cumbers, A., D. MacKinnon and K. Chapman (2003). Innovation, collaboration, and learning in regional
clusters: a study of SMEs in the Aberdeen oil complex. Environment and Planning (A) 35.9; 1689-1706.
- (2002), “New networks of technological creation in energy industries: reassessment of the roles of
equipment suppliers and operators”, Technology Analysis and Strategic Management vol. 14, 399-417.
Creusen, H. and B. Minne (2000), “Falling R&D but stable investments in oil companies: why?” CPB Research Memo no. 164, Central Planbureau, den Haag (April).
Dinnie, N.C. and J.H. Finch (2002), ”Reshaping the connections between corporate routines, know-how and know-that. The case of companies operating in the upstream oil and gas industry”, Paper presented at the DRUID Summer Conference, Copenhagen 6-8 June.
Ekeland, A. and M. Tomlinson (2001), “The supply and demand of high technology skills in United Kingdom, Norway and Netherlands”, Report from the European Science and Technology Observatory (ESTO), Seville (October).
38
Engen, O.A. (2002), Rhetoric and realities – the NORSOK programme and technical and organisational change in the Norwegian petroleum industrial complex, Doctoral Dissertation (Sociology), University of Bergen.
Finch, J.H. and N.C. Naughton (2002), “Reshaping the connections between corporate routines, know-how and know-that. The case of companies operating in the upstream oil and gas industry”, Paper presented at the DRUID Summer Conference Industrial Dynamics of the New and Old Economy June 6-8 Copenhagen.
Fossum, A. et al. (2003), “Kartlegging av olje- og gassnæringens betydning for norske regioner” [A survey of the regional significance of the Norwegian oil and gas industry], Centre for Value Creation Report, Norwegian School of Management, Oslo.
Frøslev Christensen, J. (1995), “Asset profiles for technological innovation”, Research Policy vol. 24, 727-745.
Hauknes, J. (1998), “Norwegian input-output clusters and innovation patterns”, STEP-report no. 15-98, STEP-group, Oslo.
Heum, P. Et al. (2000),”Internasjonalisering av norsk petrorettet næringsliv” [The internationalisation of Norwegian petroleum-oriented firms], SNF-report 32/2000, Institute for Research in Economics and Business Administration (SNF), Bergen.
Hinze, S. (2001), “Bibliometric Analysis of Norwegian Research Activities” Background report no. 2 in the evaluation of the Norwegian Research Council. ISI Fraunhofer, Karlsruhe/NRC , Oslo.
Isaksen, A. (2003), “’Lock-in’ of regional clusters: the case of offshore engineering in the Oslo region”, in Fornal and Brenner eds. Cooperation, networks and institutions in regional innovation systems, Cheltenham: Edward Elgar.
Iversen, E.J. (1999), ”A patent share and citation analysis of knowledge bases and interactions in the Norwegian innovation system” STEP Working Paper 07/99 Step-group. Oslo.
Karlsen, J.E. ed. (2000) ” VERTEKS. Kontinentalsokkelen – verdiskaper i verdensklasse?” Report RF-2000/217, Rogaland Research, Stavanger.
Karlsen, J.E. ed. (2002), ”Olje- og gassklyngens relaterte virksomheter” [Activities related to the oil and gas cluster], Report RF-2002/001, Rogaland Research, Stavanger.
Mitchell, J., Morita, K., Selley, N., Stern, J., (2001) “The new economy of oil. Impacts on Business, Geopolitics and Society”, Earthscan Publications Ltd, London.
Norwegian Research Council (var. years), Statictics and indicators of the Norwegian research and innovation system, NRC/NIFU, Oslo.
- (2001) Offshore 2010 - final report, Norwegian Research Council, Oslo.
Norwegian Petroleum Directorate (2003), Faktahefte norsk petroleumsvirksomhet 2003 [Facts about the Norwegian oil and gas industry 2003], NPD, Stavanger.
OECD (2002), Dynamising National Innovation Systems, OECD, Paris.

39
Pavitt, K. (1984), “Sectoral patterns of technical change: towards a taxonomy and a theory”, Research Policy vol. 13, 343-373.
Rapmund, A. (2003), “Bibliometric analysis of Norwegian petroleum research 1991-2002”, NIFU memorandum U5-2003, Norwegian Institute for Studies in Research and Higher Education, Oslo.
Rønneberg, R. (2003), SkatteFUNN Annual Report 2002. Norwegian Research Council, Oslo (April). Sejersted, F. and O.E. Olsen eds. (1997), Oljevirksomhet som teknologiutviklings-prosjekt [Upstream oil
and gas as a technology development project], Ad Notam, Oslo.
Skjærseth, J.B. and T. Skodvin (in press), Climate change and the oil industry: common problem, varying strategies, Manchester: Manchester University press.
Skogli, E. (1998), ”Offshore engineering, consulting and innovation”, STEP Working paper A-04/98, Studies in technology, innovation and economic policy (STEP)/SINTEF, Oslo.
Steineke, J.M. (2002). Oil be there for you …: en sammenligning av regionale næringsklynger i Stavanger og vennskapsbyene Aberdeen, Esbjerg og Houston [A comparison of the oil and gas clusters in Stavanger, Aberdeen, Esbjerg and Houston]. Working paper RF-2002/055. Rogaland Research, Stavanger
White Paper no. 38 (2001-2002), Om olje- og gassvirksomheten, Ministry of Oil and Energy, Oslo.