Embed Size (px)
Citation preview

Country Case Study: United Kingdom with a
focus on England
Learning from promising primary care practice models for the USA
Andy Pennington and Margaret Whitehead
Department of Public Health and Policy, University of Liverpool
for Training and Research Support Centre
July 2014Support for this research was provided by a grant from the Robert Wood
Johnson Foundation through Charities Aids Foundation America
Cite as: Pennington A, Whitehead M (2014) ‘Learning from Promising Primary Care Practice Models for the USA: Country Case Study UK: with a focus on England’, University of Liverpool, UK, for Training and Research Support Centre, July 2014
Acknowledgements: Thanks for country-level internal peer review by Mark Gabbay, University of Liverpool, and Graham Watt, Glasgow University, Scotland. Thanks for US external peer review from Patrick Conway, MD, Chief Medical Officer, Dr Laura Sessums, CMS / CMMI USA, and Alexandra Nolen University of Texas Medical Branch.
Thanks to Rene Loewenson and Sarah Simpson (TARSC) for internal peer review on draft and final reports and for the technical edit of the report.
Cover photo credits: Neil Parekh/SEIU Healthcare, Neighborhood Centers Inc, myfuture.com, Christiana Care, MCSA Joshua Adam Nuzzo (all used under the Creative Commons Attribution license).
The report has been copy edited by Virginia Curtin Knight. Design and layout by Blue Apple Projects.
This programme is being implemented by Training and Research Support Centre. It is funded by the Robert Wood Johnson Foundation (RWJF) through Charities Aids Foundation America. For more than 40 years RWJF (www.rwjf.org) has worked to improve health and healthcare, to build a national culture of health that will enable all Americans to live longer, healthier lives now and for generations to come. Follow RWJF on Twitter at www.rwjf.org/twitter or on Facebook at www.rwjf.org/facebook.
Redistribution of the material is encouraged by the publisher, provided that the original text is not altered, thatthe original source is properly and fully acknowledged and that the objective of the redistribution is not commercial gain. This creative commons attribution-non commercial-share alike license does not apply to figures and tables for which specific permissions have been obtained for use in this document as stated under them. These figures and tables are protected by the terms of their own copyright license.
Training and Research Support Centre 2014ISBN: 978-0-7974-609703

Country Case Study:
United Kingdom with a focus
on England
Learning from promising primary care practice models for the USA
Andy Pennington and Margaret Whitehead
Department of Public Health and Policy
University of Liverpool for Training and Research Support Centre
July 2014Support for this research was provided by a grant from the
Robert Wood Johnson Foundation through Charities Aids Foundation America

Table of ContentsExecutive summary ....................................................................................................................................1
1. Introduction .............................................................................................................................................3
2. Methods ...................................................................................................................................................4
3. Findings ...................................................................................................................................................5
3.1 The context for the PC system in England ..........................................................................................................53.2 PC service delivery .............................................................................................................................................63.3 Social roles in PC .............................................................................................................................................103.4 Patient experiences of PC: Diabetes care from patient’s perspective .............................................................113.5 Health status outcomes from primary care ......................................................................................................13
4. Promising PC initiatives ......................................................................................................................16
4.1 The Quality and Outcome Framework (QOF) ...................................................................................................164.2 Improving standards and effectiveness of care: NICE .....................................................................................184.3 Promoting the training and status of Expert Generalists ..................................................................................224.4 Initiatives to improve access and quality of PC in disadvantaged areas ..........................................................23
5. Managing and sustaining change in PC ............................................................................................28
6. Discussion and conclusions ...............................................................................................................31
6.1 Essential ingredients of the NHS and PC .........................................................................................................316.2 Lessons from promising PC initiatives .............................................................................................................32
7. References ............................................................................................................................................34
Appendices ...............................................................................................................................................37

1
Executive summary
T he project ‘Learning from Promising Primary Care Practice Models for the USA’, being implemented by the Training and Research Support Centre (TARSC)
in association with Robert Wood Johnson Foundation (RWJF), seeks to identify and describe promising primary care practice models and approaches in countries with better health outcomes at lower costs than in the United States of America (USA) that have relevance to US application. This is to inform policy and practitioner dialogue on models and measures that could be adapted or adopted in the USA. This paper identifies features of primary care (PC) practice models within the UK, with a specific, though not exclusive, focus on England that show positive health outcomes in terms of access, equity, quality and efficiency and that are associated with effective use of resources to improve health outcomes, especially for those with highest health needs.
We reviewed published and grey literature from 1990 onwards on PC systems and on specific, promising PC system innovations. A total of 112 published and grey literature documents/information sources were included. Key informant interviews were conducted with ten policy, management and professional level informants and representatives of civil society organisations. The interviews explored the underlying strategies and mechanisms for achieving the system-wide results in promising practice areas. The informants were identified by experts on the review team and during the rapid review of published and grey literature.
Essential ingredients. The English PC system must be understood within the context of a long-standing, publicly and politically popular universal healthcare system, the National Health Service (NHS). The NHS was designed from the outset to be more equitable, efficient and effective than the patchwork of services it replaced (Section 3.1). The building blocks of universal entitlement, equitable financing, services free at the point of use, comprehensive healthcare coverage, equality of geographic access, high standards of care for all, selection on the basis of need and the encouragement of a non-exploitative ethos underpin the policies and specific models that maintain and enhance primary care in the NHS.
The NHS has a strong PC base in comparison to other OECD countries (Section 3.2). Over 90% of healthcare interactions take place in PC, despite a PC budget of under 10% of the total NHS budget of approximately £105 billion/$178 billion annually. More than 99% of the 52 million people living in England are registered with a general practitioner (GP). Patient satisfaction with PC is high and satisfaction with the NHS in general is high, although it has fallen since 2010. Section 3.5 details some impressive outcomes and impacts of the English NHS in comparison with other high-income countries, in terms of access, efficiency and equity.
Important components of the infrastructure for PC, described in this case study, help make it strong. The common GP contract, support for common information systems and the use of those systems to establish professional norms all help it function as a unified system. The information systems and patient records also support the oversight of PC services and the management of change.
The near universal registration of the population with a general practice is another asset, coupled with the fact that two-thirds of the population have a GP consultation every year, rising to 90% over five years. This provides levels of contact, coverage and continuity between PC and the general public achieved by few other public services.
Another important aspect is the role of GPs as gatekeepers to specialist care and beyond. Gatekeeping is seen as an essential, structural component of the system, reducing unnecessary and expensive access to specialists and containing health problems within the community where they can be more appropriately treated. It also helps protect patients against over-treatment and excessive exposure to radiation during diagnostic tests, for example.
The case study identifies a somewhat intangible aspect that nonetheless makes the system work – the status of the GPs and respect for their expertise (Section 4.3). Public perceptions of GPs have been enhanced by general practice being treated as a specialism, requiring the depth of training approaching secondary care specialties. Also, continued attempts have been made to raise the income levels of GPs to that of hospital consultants.

2
Relationships between PC providers and the public may have been enhanced in recent years through greater patient and public involvement (PPI), now operating at all levels of the NHS, described in Section 3.3. Voluntary sector support networks and organisations can play a key role in helping individuals navigate complex health systems, particularly during periods of change. Practice health champions have the potential to enhance patient access to decision making and may assist patients, particularly those from disadvantaged backgrounds, in understanding complex health issues and health systems. The extent of PPI is not uniform across PC, however, and can be tokenistic. The experience of the PC system from the patient’s perspective is outlined in Section 3.4.
Promising PC initiatives. A number of PC policy initiatives are outlined in the case study that may be of particular interest for the US system. The first is the Quality and Outcomes Framework (QOF), introduced at a cost of more than £1 billion/$1.7 billion per annum, as a ‘payment for performance’ scheme to incentivise GPs to make improvements in secondary prevention and quality of care for chronic conditions (Section 4.1). Active monitoring in the QOF has contributed to its impacts on quality and outcomes. The case study points to the potential for QOF to reduce inequalities by ensuring systematic management of chronic conditions, but also the potential to increase inequalities by diverting attention from non-incentivised areas. Thresholds may act as a ‘quality ceiling’, preventing further improvements. This points to the need for careful selection and regular management of the indicators and related quality thresholds to avoid negative effects, and professional buy-in to minimise ‘gaming’ of the system.
The second is the introduction of the National Institute for Health and Clinical Excellence (NICE) (Section 4.2). NICE has standardised care in many areas across the NHS and helped to ensure equitable access to new health technologies. It has played a key role in balancing the costs and benefits of healthcare technologies (value for money). The strength of NICE is the imposition of national-level standards; the weakness is the inflexibility of those standards, which may undermine a doctor’s discretion to tailor treatment to the individual patient. It provides a method and evidence that may be used and adapted in other countries.
The third policy initiative is the promotion of the training and status of GPs as ‘Expert Generalists’, the term the Royal College of General Practitioners uses to characterise the specialist nature of the profession (Section 4.3). It adds to the acceptability and trust that patients need to have in general practice if they are to accept the gatekeeping role of their GP.
Finally, a series of experiments over the years to improve access to, and delivery of, PC services to disadvantaged groups and areas of the country are outlined in Section 4.3. Some have proved relatively ineffectual, while others, such as the ‘GPs at the Deep End’ initiative in Scotland and the PC services adapted to serve the needs of homeless people in the North West of England, provide inspiration on how to reverse the Inverse Care Law.
A note of warning is sounded about current NHS reforms that may undermine many aspects of the unified system that is described in this case study.

3
1. Introduction
T he project ‘Learning from Promising Primary Care Practice Models for the USA’, coordinated by Training and Research Support Centre, seeks
to identify and describe promising primary care (PC) practice models and approaches in countries with better health outcomes at lower costs than in the United States of America (USA) that have relevance to US application. This is to inform policy and practitioner dialogue on models and measures that could be adapted or adopted in the USA. This paper presents a country case study for the project on UK, with a focus on England. As set out in the protocol, it aims to identify features of PC practice models within UK, with a specific, though not exclusive, focus on England that show positive health outcomes in terms of access, equity, quality and efficiency and that are associated with effective use of resources to achieve improved health outcomes, especially for those with highest health need.
Towards this it presents evidence on: (i) the general and health system context; (ii) the PC system and service delivery models; (iii) social roles and interactions and other factors that support improved health and healthcare outcomes; and (iv) on how these policies and practices were introduced and sustained. This evidence is used to inform discussions about whether there may be promising features of the PC system in the UK that could hold useful lessons for application in the USA. The evidence was gathered and is reported within the areas of a conceptual framework for the programme (Loewenson and Simpson 2014).
i. Section 1 locates PC in the context of the universal healthcare system as a whole.
ii. In Section 2, PC service delivery is explained, including the services available in a typical health centre from the patient’s perspective, and the way the system works from the point of view of the general practitioner (GP).
iii. Section 3 presents evidence on particular policy initiatives in the UK PC system that could hold lessons for application in the USA, including initiatives to:
ᵒ Incentivise quality improvement and preventive activities in PC (Quality and Outcomes Framework (QOF));
ᵒ Improve standards and effectiveness of care for patients (the National Institute for Health and Care Excellence (NICE) innovation);
ᵒ Promote the specialist training and status of Expert Generalists in PC;
ᵒ Improve access and quality of PC in disadvantaged areas; and
ᵒ Promote public and patient involvement in decisions about PC and in the NHS as a whole.

4
2. Methods
D ocument review: A rapid review of published and grey literature identified key government/policy documents, statements and reviews; relevant
operational documents from health authorities and systems; and reports and evaluations of specific reforms, innovations or practices. To account for long-term changes in PC services, influenced for example by changing political, economic and demographic landscapes, this included documents from 1990 onwards and important antecedent documents. Published literature on specific, promising PC system innovations, for example, the pay-for-performance QOF and the establishment of the NICE, were located through focused searches of the following electronic databases: MEDLINE, EconLit and HMIC. Searches of Google Scholar were also carried out to locate publications by identified experts. Publications were also identified by experts during key informant interviews and through manually searching the reference lists of included studies.
Grey literature was identified through searches of relevant organisational websites, including government departments and National Health Service (NHS) bodies (such as NICE) professional standard-setting organisations (such as the Royal College of Physicians), patient and public involvement bodies (such as INVOLVE), relevant research groups/foundations (such as The King’s Fund), and international bodies (such as OECD). A search of the grey literature database OpenGrey was also conducted. The searches focused on policy documents describing the component parts of the system and any relevant changes to the system, together with assessments of the impact of any system changes relating to: mechanisms and measures to ensure quality, universalism and equity in PC; cost-effectiveness; and changes that help achieve high levels of public satisfaction with PC and to ensure access to high quality PC for disadvantaged populations/areas. A total of 112 published and grey literature documents/information sources were included.
Key informant interviews. Key informant interviews were conducted with a mix of policy, management and professional informants and representatives of civil society organisations to explore the underlying strategies and mechanisms for achieving the system-wide results in relation to the identified promising practice areas. The informants were identified by experts on the review team and during the rapid review of published and grey literature. Ten key informants were interviewed with specialist knowledge and experience of:
• Public involvement and accountability in the way PC services are run;
• Equitable resource allocation strategies;
• The operation and impact of NICE and the QOF;
• The Royal College of General Practitioners (RCGP) on the system and impact of GP specialist training and standards;
• Promising initiatives to ensure access to effective PC services for disadvantaged groups and areas; and
• Initiatives in PC to tackle the wider social determinants of health.
To ensure full and frank discussion of the strengths and limitations of the PC initiatives, the identities of the key informants have been anonymised within the results. Ethical approval for the study was obtained from the University of Liverpool, Institute of Psychology Health and Society Research Ethics Committee (8 April 2014). Limitations include the small and highly selective sample of key informants who could not provide a comprehensive perspective on all aspects of the English PC system. On the other hand, the purposive sampling directed us to informants who had extensive experience of the specific, promising initiatives and could provide historical and strategic insights.
5
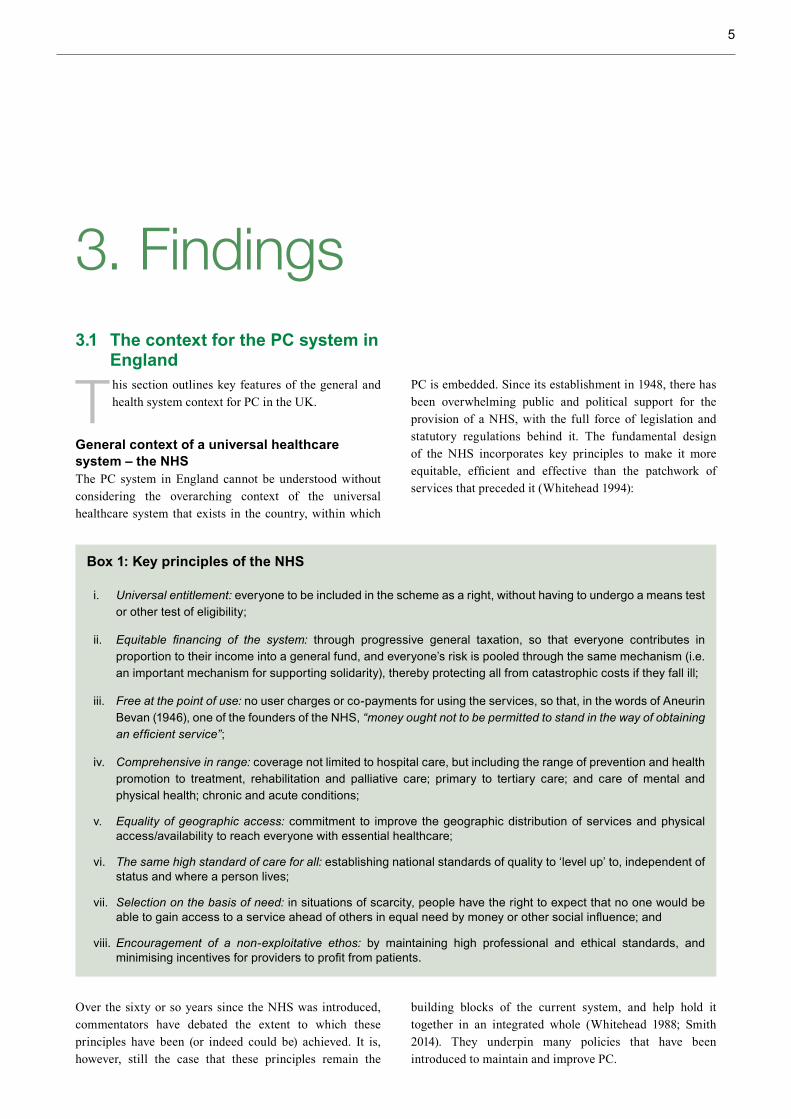
3. Findings3.1 The context for the PC system in
England
T his section outlines key features of the general and health system context for PC in the UK.
General context of a universal healthcare system – the NHSThe PC system in England cannot be understood without considering the overarching context of the universal healthcare system that exists in the country, within which
PC is embedded. Since its establishment in 1948, there has been overwhelming public and political support for the provision of a NHS, with the full force of legislation and statutory regulations behind it. The fundamental design of the NHS incorporates key principles to make it more equitable, efficient and effective than the patchwork of services that preceded it (Whitehead 1994):
Box 1: Key principles of the NHS
i. Universal entitlement: everyone to be included in the scheme as a right, without having to undergo a means test or other test of eligibility;
ii. Equitable financing of the system: through progressive general taxation, so that everyone contributes in proportion to their income into a general fund, and everyone’s risk is pooled through the same mechanism (i.e. an important mechanism for supporting solidarity), thereby protecting all from catastrophic costs if they fall ill;
iii. Free at the point of use: no user charges or co-payments for using the services, so that, in the words of Aneurin Bevan (1946), one of the founders of the NHS, “money ought not to be permitted to stand in the way of obtaining an efficient service”;
iv. Comprehensive in range: coverage not limited to hospital care, but including the range of prevention and health promotion to treatment, rehabilitation and palliative care; primary to tertiary care; and care of mental and physical health; chronic and acute conditions;
v. Equality of geographic access: commitment to improve the geographic distribution of services and physical access/availability to reach everyone with essential healthcare;
vi. The same high standard of care for all: establishing national standards of quality to ‘level up’ to, independent of status and where a person lives;
vii. Selection on the basis of need: in situations of scarcity, people have the right to expect that no one would be able to gain access to a service ahead of others in equal need by money or other social influence; and
viii. Encouragement of a non-exploitative ethos: by maintaining high professional and ethical standards, and minimising incentives for providers to profit from patients.
Over the sixty or so years since the NHS was introduced, commentators have debated the extent to which these principles have been (or indeed could be) achieved. It is, however, still the case that these principles remain the
building blocks of the current system, and help hold it together in an integrated whole (Whitehead 1988; Smith 2014). They underpin many policies that have been introduced to maintain and improve PC.

6
The position of PC within the NHS: In international comparisons, the NHS is considered to have a strong PC base, one of the strongest of the OECD countries (Starfield et al. 2014). The NHS in England serves a population of 52 million people and spends about 8.4% of gross domestic product. The vast majority of the population (more than 99%) are registered with a GP (ONS 2012). There is universal registration with a single practice of the patient’s choice, and GPs provide all primary medical care (Roland et al. 2012). An estimated 90% of all healthcare interactions are dealt with at PC level (with only 9% going on to outpatient secondary care and only 1% to inpatient hospital care). Although PC deals with the bulk of healthcare needs in England, in 2011/12 it did so on less than 10% of the total NHS budget of £105 billion ($178.5 billion at an exchange rate of £1 to $1.70 in June 2014) falling to 8.5% of the budget by 2014 (House of Commons Library 2012). One reason is that it is more efficient to treat people in PC, where it is less expensive than hospital care, and more effective to treat disease early, before acute episodes develop. Another reason is that GPs occupy a gatekeeping role in the system: patients gain access to NHS hospital care, community nursing services and prescription medicines only through their GP, with the exception of Accident and Emergency (A&E) services that have direct access.
In 2011, about 11% of the UK population (about 6.9 million people) had private medical insurance in addition to their eligibility for the NHS. Two-thirds of the insurance policies were funded by employers as an employee benefit, and only one third were self-funded (Pollard, 2012). However, all people with private medical insurance are also covered by the NHS, and nearly all use NHS services to the full extent. They use NHS PC, emergency care and non-elective secondary and tertiary care. Use of private medical insurance is overwhelming restricted to elective hospital care, such as to shorten waiting times for elective surgery.
The NHS from the public’s perspective: All residents in the country finance the NHS through their taxes. On average, the budget allocated to the NHS from general taxation equated in 2011 to an average contribution of about £2,000 ($3,400) per person per year, although with contributions income related (Davis et al. 2014). Given this prepayment, services are free at point of care, for primary and community care, hospital inpatient and outpatient care and emergency treatment. Charges for prescription medicines are capped, but exceptions mean that more than 90% of prescriptions are free.
Regular surveys show high patient satisfaction and reasonably high staff satisfaction, discussed further in Section 3.5. Overall trust in the NHS UK fell from 70% in 2010, following a long period of investment, to 61% in 2012 after reforms introduced by the new government, (NatCen 2013).
Current reforms: Currently, the public health and PC systems have been the subject of radical reforms introduced by the incoming coalition government in 2010, in the White Paper ‘Liberating the NHS’ (DoH 2010). As part of these reforms, which came into effect fully in April 2013, Primary Care Trusts (PCTs), discussed in Section 3.2 have been dissolved and their functions transferred to newly formed Clinical Commissioning Groups (CCGs) for the commissioning of community and secondary care services; to NHS England for the commissioning of PC services; to local government organisations (such as city councils) for the health improvement aspects of the public health services (so these public health services have moved out of the NHS altogether). A new body, Public Health England, an executive agency of the national Department of Health, not part of the NHS, is responsible for overseeing both health improvement and health protection aspects of public health (including absorbing the Health Protection Agency). Following the abolition of (regional) Strategic Health Authorities (SHAs) which oversaw the work of the former PCTs, NHS Commissioning Boards (NHS CBs) operating at national, regional and local levels (the latter named NHS CB Local Area Teams [NHS CB LATs]) were established to provide leadership to the NHS, hold CCGs to account for delivering their statutory responsibilities, and to commission services such as primary care, specialised services, prison health and military health (BMA 2012).
It is too early to judge what the effect of these reforms will be, but grave concerns have been expressed concerning these and other aspects of the NHS reforms brought in under the Health and Social Care Act (Whitehead et al. 2010; Walshe 2010, 2012; Hunter 2012; McKee 2012; Pollock and Price 2011; Pollock 2012; Pollock et al. 2012a, 2012b 2012c, 2012d) These and other strong critiques warn that the reforms were introduced without debate or public mandate, to address a non-existent problem and would undermine or dismantle many fundamental building blocks described throughout this case study − the structures that make the NHS efficient, effective and equitable. This eventuality is being fought at all costs (Smith 2014), and will be further discussed in the final section.
3.2 PC service deliveryPC services in the NHS are delivered through general practices (GPs), community nursing services (including district nursing and health visiting, school nursing), dentistry and community pharmacy, together with a range of professions allied to medicine working in the community (as opposed to in hospitals).
Patient registration and records: The system is designed for general practice to be the first point of contact for PC and for gaining access to the rest of the NHS system

7
Table 1: Population registered with GP by sex – England in 2011 (000s rounded)
All persons All males All femalesPopulation mid-2010 (rounded) 52,234 25,753 26,476Population registered with a GP* 52,010 25,562 26,449Percent population registered with a GP** 99.57 99.24 99.89
* Registration figures were adjusted by the ONS to account for double registrations. **Percentage calculations based on non-rounded figures. Source: ONS 2012
Patients only have to register once, when they join the list of a particular GP (as opposed to annually as in some other systems), and it is the norm for patients to stay with their chosen practice for long periods, typically only changing if they move out of the area. Patients living within (a defined) catchment area of a practice that is accepting new patients complete a form to register formally with the practice. A local NHS Commissioning Board (twenty seven of which cover the whole country) coordinates registration, arranging for the patient’s medical records, from all levels of care, to be transferred and kept by their GP practice. All NHS
IT systems can identify the practice a patient is registered to through a NHS identification number or personal information (name, address, date of birth).
PC workforce and facilities: As Table 2 shows, approximately 36,000 whole-time equivalent GPs are working in 8,000 GP practices in England. Only 11.8% are solo practices. The majority, more than 88% of practices, consist of a group of several GPs working in partnership, some of whom may be salaried (paid by the practice).
Table 2: Staff working in general practice in England in 2013
Staff type Number – Full- time equivalent (FTE) 2013
Average number of registered patients per GP
Number of GP practices
Average number of FTE GPs per GP practice
GPs* 36,294 1,500 8,000 5Nurses** 14,943Other practice staff 72,201
*All GPs (providers, salaried/other). A proportion of GPs work part time, so the numbers are given in whole-time equivalents. **All nurses employed by general practices. Source: HSCIC 2014
The average number of GPs in a practice is five, though the range is wide. Group practices work out of health centres or primary medical centres in which a wide range of community health services are provided. GPs directly employ general practice nurses and specialist nurses for specific disease-based clinics, nursing assistants, health promotion workers and administrative staff. Other parts of the NHS employ community health workers who work out of the GP health centres, covering the patients of that practice. This includes most notably district nurses (6,000 in England in 2012, reduced from more than 10,000 in 2002) who visit patients in their homes to dress wounds, provide aftercare after discharge from hospital and terminal care.
It also includes health visitors (about 8,000 whole time equivalent [wte] in England in 2012) who provide a universal preventive service for every new mother and child, visiting mothers in their homes as well as seeing them at the health centre. Both district nurses and health visitors are fully trained as state-registered nurses (SRNs) with additional specialist training qualifications in their areas of expertise. Social workers, employed by the local council, may also be attached to health centres. Appendix A1 illustrates an example of the range of PC services that patients registered with a fairly typical group practice health centre have access to, free at the point of use.
through referral by GPs. PC therefore needs to be local and accessible. Every one of England’s 52 million citizens has the right to be registered with a GP, and the vast majority are registered (see Table 1). Registration is slightly lower
for certain groups, such as young adults moving for college or work and disadvantaged families living in temporary accommodation.

8
How GPs are paid for their services: GP practices in England are essentially small, physician-owned businesses that independently contract with the NHS (Roland et al. 2012). There are two types of contracts: One is a nationally directed contract between NHS England and a practice, known as the General Medical Services (GMS) contract, introduced in April 2004, with about 60% of practices on this type of contract. The other is the Personal Medical Services (PMS) contract, covering about 40% of GP practices. The contracts are locally negotiated, but heavily influenced by the GMS in form and content) (KI:GP). The GMS contract covers three main areas (major funding streams):
1. The global sum (otherwise known as core funding), which covers the cost of running general practices and includes some essential GP services.
2. The Quality and Outcomes Framework, which covers clinical and public health. Practices are able to choose to provide these services.
3. Enhanced services, which cover additional services that practices can choose to provide (NHS Employers 2014a).
Each of the three areas has its own funding stream, as follows.
Funding stream 1: The global sum component is largely determined by a weighted capitation formula (the Carr-Hill formula). It contributes up to 60% of a typical practice’s income. Payments are made according to the needs of a practice’s patients and the cost of providing PC services, based on patient list size, age and sex profile of the registered patients and additional ‘need’ indicators, such as mortality, morbidity and deprivation of the practice locality. It covers diagnoses and treatment of patients for treatable and chronic conditions and non-specialist management of patients who are terminally ill. Practices have a preferential right to provide additional services, and normally do, including such services as cervical screening, contraceptive services, vaccinations and immunisations, child health surveillance, maternity and minor surgery services (NHS Employers 2013, 2014a, 2014b). Under regulations (e.g. the Health Act 2009) that have existed since World War I, GPs can provide pharmaceutical services to patients in any locality who satisfy the ‘serious difficulty’ test (inability to obtain drugs or equipment from an NHS pharmacist because of distance or communication difficulties) or who live in a controlled locality (at a distance of more than one mile from a pharmacy premise) – typically in remote rural areas (DoH 2012a; Dispensing Doctors’ Association 2014).
Funding stream 2: The Quality and Outcomes Framework (QOF) component was introduced by the NHS in 2004 as part of the GMS, in what was described at the time as a radical experiment in healthcare (Roland 2004). It now accounts for an average of 15% of a practice’s income. It was designed as a payment-for performance (P4P) incentive to improve quality of care for chronic disease and to reduce variation in care between practitioners (Doran 2006; Whitehead et al. 2009). Although voluntary, almost all GP practices in England take part. The original system was based on weighted indicators related to ten chronic conditions chosen because of their prevalence and/or importance in terms of the burden of disease (Roland 2004). The indicators and weightings have been developed over time. In 2012/2013 there were 148 evidence-based indicators in four domains: clinical, organisational, patient experience and additional services. They are listed in more detail in Appendix A2. Practices generate points, which lead to payments according to the percentage of patients meeting each individual indicator/target. Appendix A2 shows examples of the 2014 indicators for diabetes mellitus. The points are awarded on a sliding scale. For each indicator, practices must achieve a minimum percentage before receiving points and related payments, which increase up to the maximum of the threshold. The QOF payment received by a practice is adjusted to take into account the practice list size and number of patients on each of the disease registers (NICE 2014).
The QOF allows for ‘exception reporting’, which ensures that practices are not penalised when, for example, patients fail to attend for review after three invitations from the GP, or where a medication cannot be prescribed due to a contraindication or side effect (HSCIC 2013a).
Funding stream 3: Payments for enhanced services is for the provision of optional enhanced services for which practices receive additional funding. Previously, the secondary care sector provided many of these services. This typically contribute up to 15% of a practice’s income, for services that currently include:
• Specific schemes: alcohol-related risk reduction; learning disabilities health check; patient participation schemes; extended hours access;
• Specific areas of clinical practice: timely assessment of patients at risk of dementia; identification and management of patients identified as seriously ill or at risk of emergency hospital admission; and
• Organisational changes: Enabling patients to utilise electronic communications for booking an

9
appointment or obtaining repeat prescriptions; introduction of remote care monitoring for patients (NHS Employers 2014a).
Practices also receive additional income (minor funding streams), for example, from NHS CB LATs for costs associated with premises, waste collection and maternity/paternity leave (NHS Employers et al. 2010).
PC - public health links and referral continuityFrom the early 2000s to March 2011, Primary Care Trusts (PCTs) were responsible for commissioning and monitoring PC services in England. Public health directorates sat within PCTs and were an integral part of the organisation’s function. The 152 PCTs in England were set up as NHS trusts, responsible for commissioning primary, community and secondary care services for all the residents within a defined geographical area – each covering a population of about 330,00, on average. In addition, PCTs provided public health services and some community health services directly. They were collectively responsible for spending 80% of the total NHS budget. Each PCT had a director of public health (crucially with a right to speak out on matters affecting the health of the public in the locality, independent of the views of the PCT) and a public health team focusing on health improvement, assessment of the needs of the local population, strategic planning to meet identified needs, contributing to the assessment of commissioned services, and working in partnership with other agencies inside and outside the NHS to tackle social determinants of health and health inequalities.
Over the same period, disease control aspects of public health were the responsibility of a separate Health Protection Agency (HPA), set up in 2003 as a special health authority within the NHS to tackle threats from infectious diseases and environmental hazards. Local offices of the HPA and the public health teams within local PCTs worked closely together, but had separate lines of accountability. All GPs had statutory duties for the notification of infectious diseases to the HPA and other relevant public health bodies.
PCTs also commissioned the range of referral services for which GPs were the referring entry point (or gatekeepers). These services included secondary and community-level care, viz: elective hospital care; rehabilitation care; urgent and emergency services; most community health services and mental health and learning disability services. PCTs commissioned care for all residents in their area, irrespective of whether they were registered with a GP.
As noted earlier, CCGs took over this role from PCTs in 2013 and now commission these referral services for which GPs are the gatekeepers. They have a budget of £65 billion ($110.6 billion) in 2013/4, or 60% of the NHS budget (The King’s Fund 2014). There are 211 CCGs altogether, each
commissioning care for an average of 226,000 people, with about 27 GP practices in each specific CCG area. Resources for CCGs are allocated by NHS England from a central ‘pot’ by a weighted capitation formula, which takes into account not only the number of patients registered with practices in the CCG, but also the age and sex profile of the patients, the differing unavoidable costs of delivering the commissioned services under local housing and labour market contexts (market forces factor), the extra costs incurred in delivering services to disadvantaged patients and a factor for unmet need (the health inequalities factor) (DoH 2013). All GP groups in a geographic area now belong to one of these CCGs, with the stated aim of giving all GPs a say in decisions on commissioning these referral services for their patients.
It remains to be seen how far CCGs take collective responsibility for the population in their area, and not just the registered patients. It also remains to be seen how potential conflicts of interest for GPs managing practice budgets and commissioning external services can be avoided.
Prescription charging and exceptionsPrescription drugs are currently subject to a co-payment of £8.05 ($13.70) per item but, in 2012, about 91% of all prescriptions were dispensed free of charge because most patients were exempt from these charges (HSCIC 2013b). People entitled to exemptions from charges include: all people age 60 or older; people with low income; children under the age of 16 years or in full-time education aged 16–18 years; pregnant women and those who have had a baby in the past 12 months; people with cancer; and people with certain long-term conditions, and/or disabilities (such as permanent fistula, certain forms of hypoadrenalism, diabetes insipidus, diabetes mellitus treated by medication, hypoparathyroidism, myasthenia gravis, certain forms of hypothyroidism, certain forms of epilepsy and people with continuing physical disabilities that cannot go out without assistance) (NHS Business Services Authority 2014). A further 4.2% of prescriptions are paid for with pre-payment certificates (cost saving subscriptions for non-exempt patients taking regular medication) that cost £29.10 ($49.52) for three months and £104 ($176.98) for 12 months with no limits to the number of prescriptions/items (HSCIC 2013c; NHS Business Services Authority 2012). Less than 5.2% of prescriptions therefore incur a charge at the point of dispensing.
In 2012 just over 1 billion items were dispensed in the community, a 62% increase from 2002, amounting to 2.7 million items daily. The net ingredient cost of £8.5 billion ($14.47 billion) in 2012 was similar to that of 2009 and marginally (3.2%) less than in 2011. The average annual cost of prescribed medicine to the NHS per head of the

10
population thus fell to £159.33 ($271.14) in 2012 from its 2010 peak of £167.80 ($285.56) (HSCIC 2013b).
The fall in cost may be partly due to the expiry of patents for several leading medicines and the use of less expensive generic alternatives. The proportion of prescribed items dispensed in PC using generics has been increasing in the past decade (largely due to the patents expiring for commonly used medicines): from 53% in 2002 to 72.7% in 2012 (HSCIC 2013b). National NHS campaigns encourage PC staff and patients to prevent unnecessary prescribing of certain drugs, such as antibiotics.
3.3 Social roles in PCPatient and Public Involvement (PPI) in PC functions within a wider NHS PPI context. The NHS constitution states that: The NHS will actively encourage feedback from the public, patients and staff, welcome it and use it to improve services (NHS 2013:3). PPI strategies and systems exist within all NHS policy, commissioning and delivery organisations from national to local level, including:
• National level: Department of Health; NHS England; Public Health England;
• Local level: Local Healthwatch; Local Authority/CCG Health and Wellbeing boards; Clinical Commissioning Groups; and general practices.
PPI systems also exist within the healthcare quality and economic regulatory bodies: the Care Quality Commission and Monitor (see www.cqc.org.uk/content/get-involved). NICE also has a PPI system (see http://tinyurl.com/4jklwu2). The key PPI bodies at local PC level are local Healthwatch and GP-enhanced service patient participation schemes.
Local Healthwatches: The Health and Social Care Act 2012 created statutory responsibilities for local authorities to establish and fund Local Healthwatches from April 2013. They replaced Local Involvement Networks (LINks) and are independent organisations that recruit their own staff and volunteers. Government regulation (UK Government 2012) dictated that they had to be social enterprises, but did not stipulate the forms this should take. Local authorities therefore took different approaches to their establishment and funding, including open competitive tender, tender waiver and grant aid, encouraging consortium bids from the local voluntary and social enterprise sector, and transitioning former LINks to new health watches, with support from existing voluntary sector hosts. Local voluntary sector organisations are either members of their local healthwatch or they are involved through stakeholder forums (McLeod 2013). The main functions of a local healthwatch are:
• Gathering views and understanding experiences of service users, carers and community;
• Making people’s views known to service providers;
• Promoting and supporting people’s involvement in the commissioning and provision of local healthcare services and how they are scrutinised;
• Recommending investigation or special review of services via Healthwatch England or directly to the Care Quality Commission (CQC) (a statutory body);
• Providing information and advice about access to services to support informed choice; and
• Making the views and experiences of people known to Healthwatch England and direction for it to carry out its role as national champion (McLeod 2013).
Local Healthwatch bodies have a statutory place on local Health and Wellbeing boards, which have formally operated since April 2013. Health and Wellbeing boards were set up in every local authority with responsibilities for adult and children’s services. Their role is to join up NHS and local authority decision making and the commissioning of certain services. Their minimum statutory members are: elected councillors, a representative of each CCG in the area; the directors of Adult Social Services; of Children’s Services and of Public Health and a representative of the local Healthwatch (Regional Voices 2013) The boards develop a Joint Health and Wellbeing Strategy (JHWS) and a Joint Strategic Needs Assessment (JSNA) that aim to improve health and wellbeing in the local community and to reduce health inequalities. These form the basis of the commissioning plans of CCGs and the local authority (DoH 2012b) (Further information can be found at http://tinyurl.com/nhab7hd).
General practice patient participation schemes. General practices are entitled to receive additional funding to pay for Patient Participation Groups (PPGs) under the Local Enhanced Services funding arrangements, although key informants indicate there may be changes to this later in 2014. To receive payment the practice is required to:
i. Develop and maintain a PPG that elicits the views of patients and carers and feedback from the practice population (through virtual or face-to-face interaction or both). PPGs generally include volunteers and regular face-to-face meetings;
ii. Review patient feedback received by the practice from sources such as a general practice patient survey, complaints and suggestions received, local voluntary or community groups attached to the

11
practice, Healthwatch, practice champions and peer support groups, other local surveys conducted by CCGs or Commission Support Units and Care Quality Commission reports. The PPG and practice staff review feedback at a frequency agreed with the PPG;
iii. Work with the PPG to develop and agree on an action plan, based on three key priority areas, and agree how the practice will implement improvements; and
iv. Publicise actions taken that affect the practice population, including updating the PPG on progress and assessment of subsequent achievements within agreed timescales (NHS Confederation 2014).
The practice and PPG are required to complete and make publicly available a reporting template on actions taken during the year, on PPG involvement and outputs achieved showing how patients and carers benefited from improvements (NHS Confederation 2014). An example of this practice is outlined in Appendix 1.3
Voluntary sector support networks. regional networks, such as the Voluntary Sector North West (www.vsnw.org.uk) support local voluntary sector networks and organisations (such as Merseyside Disability Federation, Bolton Society for the Blind). They help people understand and navigate complex health systems and identify opportunities for PPI in decision making. The networks provide key information and contacts for the voluntary sector, particularly during periods of change such as the recent reorganisation of the NHS in England. They also provide opportunities for engagement in national level PPI and health policy consultations through Regional Voices (www.regionalvoices.org), a voluntary sector strategic partner of the Department of Health, NHS England and Public Health England (http://tinyurl.com/p6obw2e).
There are various initiatives reaching out to disadvantaged/vulnerable populations:
Practice health champions. Some practices have specific measures relevant to local culture to reach out to disadvantaged groups within their catchment areas. One example of this is detailed in Appendix 1.4. Such organisations, as in the example, train and support local people to work with others in their communities to improve health. Drawing on relevant expertise, they use simple culturally relevant methods to bring local people together to participate and work with general practice staff, including personalised text and email messages, notices in practices and face-to-face contact at school gates, community centres, and other local social meeting points. The voluntary organisations facilitate contact with the PC practices to allow for meaningful participation by the community. They explain to other patients how to
make best use of the practice, how to use the Appointment Guide, improving access for those whose first language is not English. They are being treated as peers by the practice staff and have shown themselves to be a key contributor to NHS improvements. Key informants report that their work has led to service and quality improvements and service redesign (KI: Health Champion Group).
3.4 Patient experiences of PC: Diabetes care from patient’s perspective
The hypothetical case study character Bob, his wife and named healthcare staff are entirely fictional and have been created to depict the experience of care from the perspective of a patient with a complex chronic health condition. The green text highlights Bob’s experience of the system, the black text explains it. Appendix 1.5 presents evidence on type 2 diabetes in the UK as background to the case.
Bob is a 58-year-old man living in a socio-economically deprived area in the North East of England. He works as a labourer for a local construction firm but, despite the physical nature of his work, he has been overweight since his mid-thirties as a result of a poor diet and higher than recommended alcohol consumption.
When Bob began displaying some typical symptoms of diabetes, e.g. increasing fatigue, thirst and waking at night to urinate, his wife Carol encouraged him to see ‘his doctor’. He made an appointment with his GP Dr Tom whom Bob had known since he was in his thirties.
General practice patients in the UK traditionally have long-standing relationships with their GP. This helps to foster trust and can reduce consultancy times as GPs are familiar with patient histories.
Bob visited his local practice (free of charge) during the afternoon after making an appointment via telephone that morning. General practice appointments (face-to-face or telephone appointments) can be made within 48 hours, typically for the same day, or as advance appointments.
He wasn’t a regular visitor to the practice, so at the start of his consultation his doctor spent a little time catching up with Bob. This reflects a UK GP’s training to consider the psychological and social aspects of people’s lives.
They then talked about his symptoms and discovered that he was suffering from mood swings, low energy, dry mouth, frequent urination, and more recently hunger after eating and headaches. Dr Tom told Bob he suspected he had type 2 diabetes and asked him to come back the following day for a fasting plasma glucose test (and for other blood samples). Bob’s blood samples would be taken at the practice (free of

12
charge) before being sent to a hospital laboratory for analysis. Tests results requested as urgent are available in a couple of days and non-urgent results after two weeks (prioritisation by medical need/urgency prevents resources being wasted on tests that are not urgent). The results are entered into an IT system that sends them to the general practice and makes them available to NHS healthcare professionals for future use.
The tests confirmed the diagnosis, and the practice contacted Bob to come in for another appointment.
Diagnostic tests are informed by NICE guidelines. Practices contact patients when results are positive.
Dr Tom arranged for Bob to be put on the practice’s diabetic register and for a practice-based diabetic specialist nurse to contact Bob; she would arrange for him to attend the practices diabetic clinic.
His care would be informed by the NICE pathway and national care standards. His inclusion on the register entered him into the QOF system to ensure appropriate monitoring and management of his condition.
Dr Tom also referred Bob to a specialist diabetic team at his local hospital and encouraged Bob to take Carol along with him.
People with type 1 diabetes are routinely referred to hospital-based consultants. However, referral for people with type 2 diabetes depends on the severity of their condition and the resources available at their general practice (e.g. specialist diabetes nurses, clinics etc.). Referral is used in the case study to illustrate integration of NHS services. His first appointment with the hospital-based team would be made through the Choose and Book appointment system, an electronic referral system that allows patients to choose the time, date and place of their first appointment. Appointments can be made, or changed, via telephone or over the Internet. All appointments and tests would be free of charge. Subsequent appointments are arranged at the clinic. Family involvement in the management of complex conditions is encouraged. In the UK diabetes care is very much multidisciplinary (Beresford 2011). Bob would come into contact with a range of professionals in an integrated diabetic team working across primary, secondary and tertiary care, that he would see as one entity ‘the NHS’. The team would include his GP, a practice-based diabetes nurse, hospital-based diabetes consultant and nurse, a diabetes specialist dietician and podiatrist, a local optician for eye screening and local pharmacists. An electronic summary of his medical records would be available to all appropriate healthcare staff.
At his first appointment at the local hospital Bob and Carol met his new diabetes specialist consultant and diabetes
specialist nurse. They talked to Bob and Carol about his symptoms and how they were feeling about the diagnosis, and advised that they would receive support during this difficult time. They performed some further checks on his body mass index (BMI), blood pressure, urine sample and then sent him to the phlebotomy department for some blood samples for further tests. They explained what the tests were for and talked about the results that were available from all the tests they had received (including from his GP). Management of his condition would be informed by NICE guidelines (see Appendix 1.5). Test results and information from the consultation (e.g. on prescribed drugs, treatment plans) would be sent to his GP and the practice would contact Bob about these if necessary.
Bob’s consultant explained that the results showed that he was borderline obese (BMI = 29.8), his blood pressure was high (144/92), his blood cholesterol was high for a type 2 diabetic (total cholesterol 6.2 mmol/l) and his HbA1c was also high (55 mmol/mol). She explained that they would try to reduce his blood sugar levels/HbA1c and blood pressure at first by improving his diet and increasing his physical activity (following NICE guidance), and that he’d be supported to do this. If his blood sugar and blood pressure remained high he might need to take tablets. In accordance with NICE guidance, Bob was prescribed Simvastatin to reduce his cholesterol and the chances of heart disease or stroke. He would be exempt from prescription charges because of his condition (if treated by regular medication).
He was given a three-month follow-up appointment for his consultant; later follow-ups would depend on how well he managed with support from his general practice. Bob’s general practice runs its own (free) nurse-led clinics to monitor patients with diabetes. The clinic would become Bob’s regular point of contact for monitoring and management of his condition to improve his quality of life and reduce the chance of complications.
In addition to core funding, practices receive QOF performance-based funding, which helps them to provide monitoring and management services for chronic conditions such as diabetes. The specific services provided within each general practice vary, however. During the next year Bob would (annually, as a minimum and free of charge):
• Set management targets for and have his blood glucose and blood pressure checked to review them against the targets.
• Have his eyes screened, at his local opticians, using specialised digital photography to identify signs of retinopathy. (NICE guidance recommends that all people with type 1 and 2 diabetes are screened for retinopathy on diagnosis and annually thereafter. The NSF for diabetes introduced a national screening

13
programme based on digital retinal photography. Local opticians are private businesses who also receive funding from the NHS for screening and for free sight tests to certain groups (see: http://tinyurl.com/kn8g4xb).
• Have his feet, kidney function and BMI checked.
• If he was a smoker, he would have received support to quit.
• Attend a diabetes educational course.
• Get specialist psychological support (Diabetes UK 2012), and
• Received annual flu and pneumococcal immunisations.
Bob managed to lose some weight by improving his diet, giving up alcohol and taking some exercise (with the help of a free NHS Exercise on Prescription referral service). His BMI, blood pressure and cholesterol fell somewhat. His blood pressure was monitored at his GP practice every three months. He continued taking Simvastatin but was not put on medication for his blood pressure. His HbA1c also improved, although it remained above the recommended limit so he was put on Metformin and given directions to gradually increase his dose to minimise risk of gastro-intestinal side effects (in-line with NICE guidance).
He was provided with free self-testing equipment (for finger prick blood tests) by his hospital-based clinic and received test strips via free prescriptions. His use of self-monitoring reduced over time, and he struggled to know how to respond to high readings. Bob and Carol also struggled with the complexity of his condition and following all the guidance they received, although they appreciated the help they received from his diabetic team.
To address issues of health literacy, the complexity of his condition and the integrated health system, Bob and Carol may have benefited from additional support from a health trainer or practice health champion.
Bob still received care from specialist diabetic professionals even when he was later admitted to hospital for a (non-diabetes related; free) hip replacement (in accordance with national standards).
In later life, and because of the adverse impacts of his hip problem on his diabetic control (difficulty taking exercise), Bob’s optician detected a low/background level of diabetic retinopathy. Bob’s (free) screening programme was administered by his local hospital. He was referred
to their specialist eye department for more regular and in-depth tests when signs of retinopathy were detected. The frequency and nature of the tests intensified with the severity of his condition. He received (free) laser treatment during the more advanced stages of retinopathy. The treatment and closer control of his diabetes, with the support of his integrated, multidisciplinary diabetes team, prevented further progression of the retinopathy and loss of his eyesight.
3.5 Health status outcomes from primary care
This section outlines evidence on outcomes of the English PC system (with international comparison where available). More detailed charts and evidence in the areas covered in this section, and particularly on international comparisons, are provided in Appendix 1.6.
Mortality amenable to healthcare: A death is classed as ‘amenable’ (treatable) if, in the light of medical knowledge and technology at the time of death, all or most of that cause (subject to age limits if appropriate) could be avoided through good quality healthcare (ONS 2014). Figure 1 shows the pattern of mortality from these amenable causes across England in 2012, ranging from 51/100,000 to 178/100,000. In general, amenable mortality rates increase with increasing deprivation, with the deprived areas within the north of England experiencing some of the highest levels in the country.
Mortality amenable to healthcare has been falling dramatically in recent years in England. This is explained by a number of different factors. These include increased investment in healthcare, improvements in treatment and reductions in risk factors such as smoking (Nolte and McKee 2011). In England these improvements in mortality amenable to healthcare have been greatest in the more deprived parts of the country, as a result of which the mortality gap between deprived local authorities and those in the rest of England has narrowed slightly over the past decade, particularly for men (Barr et al. 2014). Barr et al. (2014) attributed the observed narrowing in inequalities in amenable causes to the government policy (which operated from 1999 to 2010) of allocating an increasing proportion of NHS resources to deprived areas for the explicit purpose of “making a contribution to the reduction in avoidable health inequalities” (DoH 1999).

14
Figure 1: Mortality amenable to healthcare (death under 75 / 100,000 population) 2012
An international comparative study of trends in amenable mortality in sixteen high-income countries from 1997/98 to 2006/07 found that this remained an important contributor to premature mortality in all the countries, accounting for about 24% of deaths under age 75. The USA had the highest rate of the sixteen countries, with rates almost double those of France, which had the lowest levels. Between 1997/98 and 2006/07, amenable mortality also fell more slowly in the USA - by 20.5% - compared with a 34.7% improvement in the UK and 42.1% in Ireland (Nolte and McKee 2011). The authors concluded that the USA was lagging increasingly behind other high-income countries on this measure (Nolte and McKee 2011).
Cancer survival: Data on five-year cancer survival by socio-economic status show a social gradient in survival for some cancers in England, with decreasing survival with decreasing socio-economic position. Steeper gradients are evident for cervical and breast cancer, but not for short-survival sites such as lung cancer (Coleman et al. 2001; Rachet et al. 2008; Cancer Research UK, 2005). International comparisons of cancer survival after diagnosis may be complicated, inter alia, by missing data on poorer socio-economic groups in some countries (an example of a speculated problem with the US data).
Secondary prevention and therapies for coronary heart disease: A recently published study analysed secular trends between 1999 and 2007 in the use of key medical therapies in the UK (NHS stratified by socio-economic circumstances across a broad spectrum of coronary disease presentations, including coronary syndromes, secondary prevention, and clinical angina). Use of all therapies increased in all patient groups, both men and women. Improvements were most marked in PC, where use doubled for beta blockers, statins, and angiotensin-converting enzyme inhibitors or angiotensin receptor blockers for secondary prevention and treatment of angina (Hawkins et al. 2013). Small age gradients persisted for some therapies, but there were no consistent socio-economic gradients or sex differences for hard diagnoses. The study concluded that the UK NHS is delivering equitable treatment independently of socio-economic circumstances across a broad range of therapies, especially in relation to PC prescribing. There is no room for complacency, however, as treatment level still falls short of national targets and best-practice cohorts (Hawkins et al. 2013).
> 10090-10070-90<70No data
Source: HSCIC (2013c) Copyright © 2014, Re-used with the permission of the Health and Social Care Information Centre. All rights reserved

15
Quality, access and efficiency of care: The Commonwealth Fund conducts regular comparisons of health services in the USA and the UK and nine other high-income countries (Australia, Canada, France, Germany, the Netherlands, New Zealand, Norway, Sweden, Switzerland) (Davis et al. 2014), as follows:
• In the Fund’s overall ranking of health services, the UK ranked first (best), despite spending the least ($3,405), and the US ranked last (worst), despite spending the most per capita on healthcare ($8,508).
• Cost-related problems accessing care: Patients in the UK reported the lowest levels of cost-related access concerns in terms of the cost of and timeliness of accessing care (4% and 6%, respectively).
• Timeliness of care: The UK ranked highly on all timeliness of care measures, with patients in the UK receiving rapid access (same or next day) to PC, reporting the lowest level of difficulty in accessing care out-of-hours without visiting a hospital- based emergency department and short (under two hours) waiting times when they did.
• Efficiency of care: Based on a consideration of total national expenditures on health as a percent of gross domestic product (GDP), as well as on the percentage spent on health administration and insurance, the UK ranked top (best) and the US bottom (worst) in terms of overall efficiency of health systems. In addition, in the UK only 7% of respondents reported receiving unnecessary duplicate tests in the previous two years (ranked third), compared to 17% in the USA (ranked last); and only 16% of UK respondents had visited an emergency department for a condition that could have been treated by a regular doctor had they been available (ranked first), compared to 40% in the USA (ranked tenth). However, more adults reported rehospitalisation, or a need to visit an emergency department after discharge, in the UK (ranked tenth) than the USA (ranked fifth).
• Quality of care: In summary, the UK ranked top (best) on all four areas of quality of care: effective care; safe care; coordinated care; and patient-centred care. The USA ranked third, seventh, sixth and fourth (respectively) for these measures.
• Equity of access to health services: the UK ranked second highest (best) in the overall equity ranking for health services, with relatively small differences between adults on below and above average incomes for most measures. The US ranked lowest (worst) in the overall equity ranking with low-income adults at particular risk of experiencing poor service.
NHS waiting times – targets: Each year the NHS carries out approximately: 250 million GP consultations; 14.2 million first outpatient attendances; 31.1 million subsequent outpatient attendances; 644 million diagnostic tests; 1.6 million elective ordinary admissions; 4.2 million day-case admissions and 4.7 million emergency hospital admissions (Goff 2009). All NHS patients have:
• A legal right to start NHS (hospital-based) specialist/consultant-led treatment within a maximum of 18 weeks from referral, unless patients choose to wait longer or it is clinically appropriate to do so.
• A legal right to be seen by a cancer specialist within a maximum of two weeks from GP referral for urgent referrals where cancer is suspected (UK Government 2012a).
In July 2009, 93.6% of admitted patients and 97.7% of non-admitted patients were treated within 18 weeks across England. The 90% (admitted) standard at the national level was achieved for the first time in August 2008 and has been sustained in every month since. The 95% (non-admitted) standard at the national level was achieved for the first time in July 2008 and has been sustained in every month since (Goff 2009). More recent (adjusted) referral-to-treatment data show that targets have continued to be met – although (median) waiting times have increased since January 2013 to a (post-2007) record low of 90.5% in February 2014. The targets for non-admitted patients began to slip in 2013 with April 2013 being the first time the 95% target was missed (94.9% in April 2013). Performance also fell short of the same target during eight months between May 2013 and May 2014, with a (post-2007) record low of 94.2% in January 2014 (data from NHS England 2014).
Patient satisfaction with GP services: Surveys show high patient satisfaction levels, especially for those who have used the service recently (past 12 months), with 87% of GP users satisfied overall. In the NHS England GP Patient Satisfaction survey 2011-2012 (Ipsos MORI 2013): 86% of patients responded that the GP was good in terms of giving them enough time; 88% of patients responded that the GP was good at listening to them; 88% of patients responded that the GP was good at explaining tests and treatments; 75% of patients responded that the GP was good at involving them in decisions about their care, and 83% of patients responded that the GP was good at treating them with care and concern; 64% definitely had, and 28% had some, confidence and trust in the last GP they saw. Overall rates of satisfaction with the NHS in the general population are lower, but still reached a high of 70% in 2010 following a long period of investment in the NHS. Latest figures (2012) show, however, that general satisfaction has fallen to 61% following a period of disinvestment in the NHS (NatCen 2013).
16
4. Promising PC initiatives
A number of PC policy and practice initiatives merit further detail. Those selected have been associated with improved health outcomes and could hold
lessons for application in the US. They include initiatives to:
i. Incentivise quality improvement and preventive activities in PC (Quality and Outcomes Framework);
ii. Improve standards and effectiveness of care for patients (the NICE innovation);
iii. Promote the specialist training and status of Expert Generalists (GPs);
iv. Improve access and quality of PC in disadvantaged areas; and
v. Promote public and patient involvement in decisions about PC and the NHS as a whole.
4.1 The Quality and Outcome Framework (QOF)
The Quality and Outcome Framework (QOF), when introduced into the new national general medical contract in 2004, was seen as one of the largest and most radical experiments in pay-for-performance for GPs in the world. It focuses on prevention, early detection and management of chronic non-communicable diseases. It was funded with new money as part of the new contract which was, amongst other things, designed to improve GPs’ pay and conditions relative to hospital-based consultants:
In 2002/2003 when they were putting this contract together there was a bit of a crisis in primary care in terms of recruitment and retention… and part of that crisis was obviously related to the fact that GPs’ pay had fallen behind pay for hospital consultants (KI: health policy analyst).
The indicators and payment system was discussed in Section 3.2 and the indicators outlined in Appendix 1.2. There is no regular review, but the QOF indicators are currently under review and a public consultation is underway (http://tinyurl.com/738dzro). As a measure to incentivise and support
quality of care and health outcomes, the QOF is monitored in a number of ways:
• Self-monitoring – the QOF IT system automatically identifies areas where performance is falling short of targets and notifies practice staff, giving them the opportunity to concentrate on performance in certain areas. Payments, or potential loss of them, incentivise practices to self-monitor. Practice managers monitor and coordinate responses (e.g. arranging diabetic clinics) by relevant staff, including GPs and specialist nurses. Integration between the QOF software and electronic patient records also alerts healthcare professionals if a patient requires QOF-related tests during a consultation.
• CCG monitoring of practices – the performance information is sent to a central hub and the payments are worked out automatically. At the same time, the information was also sent via the PCTs, now CCGs, to the practices, giving the PCTs the opportunity to monitor activities. The PCTs also used to be monitored by the [now abolished, regional] Strategic Health Authorities: PCTs were the statutory body that had the responsibility for ensuring quality of care on their patch and now that’s moved to the CCGs… So they would say look our PCT compares with this one in Cambridge we’re… 5% below on average… is there anything we can do to help you, any additional training you need. Buy nursing time to send particular nurses round to practice to help them hit the QOF targets and so on (KI: health policy analyst). As previously mentioned, CCGs are now monitored by NHS CB LATs (see section 3.1).
• Public reporting – the fact that the performance is public is in the public domain and can be looked at is actually quite a strong reputations spur for practices (KI: health policy analyst).
Most practices reported high levels of achievement for the quality indicators in the first year of the scheme (2004-05), and levels of achievement generally increased in the

17
second and third years, before reaching a plateau for most indicators in the fourth year (2007-08) (Doran 2009). Levels of achievement were related to the type of activity, baseline achievement pre-QOF and the maximum payment threshold for the activity (i.e. the level of achievement required to earn the maximum payment, which varies from 50% to 90%). In 2007/8 the average practice earned more than £120,000 ($204,212) from the QOF, at a total cost to the NHS of £1.1 billion ($1.87 billion).
The success of general practices in achieving the QOF targets in the first year was underestimated. The cost of performance payments, approximately £1 billion ($1.7 billion), was also around £250 million ($425.7 million) greater than expected. Additional costs, from the provision of IT infrastructure may have brought additional benefits to the health system (such as avoiding duplication of work) and patients requiring complex, integrated care (KI: health policy analyst). Other benefits were noted by Whitehead et al. (2009), who reported that although the QOF was not designed to address inequalities, by incentivising care for chronic conditions, it has the potential to do so. Conditions with particularly high prevalence in low socio-economic groups, such as type 2 diabetes, may see the greatest improvements if improved care is translated into long-term improvements in health outcomes. However these benefits are not inevitable and Whitehead et al. (2009) also reported that improvements in quality of care were not as rapid for some ethnic minority groups, warning that the QOF has the potential to increase inequalities by diverting attention away from other areas of care.
In a review of studies of the QOF in the UK, Steel and Willems (2010) found that achievement of the standards was high when the framework was introduced and continued to increase. For example, improvements were reported in diabetes care, and in coronary heart disease, stroke, transient ischaemic attacks and blood pressure after the introduction of the QOF as well as in indicators relating to smoking. However, they also caution that improvements may be explained to some extent by pre-existing improvements in chronic disease management, a concern others also raised (Doran et al. 2006; Eijkenaar et al. 2013). Some studies took these underlying trends into consideration and show small improvements for some outcomes (such as those related to diabetes) (Campbell et al. 2007; Millet et al. 2009; Langdown and Peckham 2013).
In general, the QOF has had some positive impacts, including on health inequalities and their monitoring:
• Practices that performed worst at the introduction of the QOF (concentrated in the most deprived areas) improved at the fastest rate. Gaps in the quality of PC for conditions including coronary heart disease,
asthma and diabetes have therefore quickly narrowed under the QOF scheme. This may have been facilitated by the use of progressive payments that motivate practices with a range of baseline achievements to improve.
• The provision to exception report preserves the clinical autonomy of practitioners, safeguards against inappropriate treatment of patients, and ameliorates perverse incentives to deny care to ‘difficult’ patients. Practices in deprived areas, exception report more patients than practices in more affluent areas, but the difference is marginal and rates of exception reporting have generally been low.
• A comprehensive information technology system was established to support the QOF, and most practices now use computerised patient records. Disease prevalence and quality of care at the practice level can now be monitored and linked to a range of patient and practice characteristics. However, data are not routinely collected at the patient level, and it is therefore difficult to measure quality of care by patient age, sex and other socio-demographic characteristics (Doran 2006).
The QOF may also have had negative impacts, including on health inequalities:
• Prevalence of QOF conditions recorded by practices is lower than prevalence estimates provided by national surveys, a gap that may be greater in more deprived areas. Quality of care for ‘missed’ patients is not known. Some practices appear to have removed from disease registers patients who are unlikely to meet a QOF target.
• Quality improvements have not been as rapid for some ethnic minority groups.
• Quality of care was already improving before introduction of the QOF, and for many QOF activities there was only marginal and short-term improvement in quality above the underlying trend. Evidence on whether improvements in QOF scores are associated with improved outcomes for patients is equivocal. Given the level of investment in the scheme, the opportunity costs in terms of interventions foregone need to be considered when analysing the impact of the QOF on health inequalities.
• Quality of care for some non-incentivised activities was improving before 2004, but does not appear to have done so after the introduction of the QOF. There is also less training, education and use of guidelines for non-QOF conditions. Gaps in quality care may therefore be developing between patients with QOF conditions
18
and those with non-QOF conditions, particularly in practices that had low baseline achievement for QOF-incentivised activities. Quality is more difficult to monitor for non-QOF activities, because data are not routinely collected as it is for QOF activities.
• Primary preventive activities may have been neglected to some extent in favour of the secondary preventive activities prioritised in the QOF.
• The QOF payment system scaled payments according to the square root of disease prevalence, rather than actual prevalence. Practices with high disease prevalence – concentrated in deprived areas – therefore received less pay per patient than those with low prevalence. This inequitable payment system was corrected in 2009.
• Although practices achieve the QOF targets corporately, practice partners - usually the most senior physicians, distribute QOF payments. Generally, these payments have not been equitably distributed among all GPs. Practice staff behaviour and the nature of the relationship between health professional and patient has changed under the QOF, with data gathering for quality targets becoming a priority in consultations. It is argued to have had limited impact on improved health outcomes due to its focus on process-based indicators (Langdown and Peckham 2013).
• The nature of the QOF scheme, and the proportion of practice income that is tied to performance on the QOF indicators, creates a risk that care will become more fragmented, efficiency prioritised over genuine quality, and professionalism eroded.
• There is a risk of ‘gaming’ of the exception reporting system: … it doesn’t matter what system you have, people will game it… if you are going to offer a financial incentive for doing something within medicine you absolutely need to make sure that it accords with professional values…. (KI: health policy analyst)
• There is also a danger that targets can act as a ceiling on continued quality improvement, for example: … control of HbA1c [a diabetes management indicator] increased quite rapidly and then from 2004 onwards it stopped and you can argue that… there’s no financial incentive for them to improve because they’d already hit the target…. (KI: health policy analyst)
In summary: The QOF costs the NHS over £1 billion ($1.7 billion) per annum, with a substantial proportion of the money it brings into practices invested in senior, general practitioner income. It was funded with additional money intended to increase
GPs’ pay relative to hospital-based doctors (key informants suggest that the differential between the two is now on average £40,000). There have been substantial additional costs relating to the provision of IT infrastructure, although its introduction may bring additional benefits.
The QOF was not designed to address health inequalities, but by incentivising higher quality, systematic care for common chronic diseases it has the potential to do so. Its success in this regard is dependent on whether the apparent improvements in the quality and equity of delivered care under the QOF translate into long-term health gains for patients. The QOF also has the potential to increase health inequalities by diverting attention away from non-incentivised areas of care, particularly for practices with sicker and more deprived populations that generally have greater difficulty achieving QOF targets.
In the first five years of the QOF, payments to practices did not fully reflect the level of morbidity in the practice population. The payment formula was corrected in 2009, so that resources would be better matched to need. To prevent QOF thresholds acting as quality ceilings, the NHS raised the thresholds for certain indicators in 2013. Without professional buy-in and sensitively designed and implemented monitoring systems, gaming of the QOF exception system may increase.
4.2 Improving standards and effectiveness of care: NICE
The National Institute for Clinical Excellence (NICE) was originally established in 1999 to improve standards of care for patients and reduce inequalities in access to innovative treatments (DoH 1999). The initiative was in response to evidence of variability in quality of care across the NHS and the perception that there was a certain arbitrariness (so-called ‘post-code’ lottery) in what medicines were available and prescribed in different parts of the country. The remit of NICE was expanded to public health in 2005 and then to social care in 2013 (now named the National Institute for Health and Care Excellence – still NICE).
Until 2013, NICE was a statutory Special Health Authority within the NHS, and as such was independent of government. It became a statutory Non Departmental Public Body from April 2013, which is still operationally independent of government, although it is funded and accountable to the national Department of Health. NICE’s overall goal is stated to be: “To improve outcomes for people using the NHS and other public health and social care services while ensuring value for money” (www.nice.org.uk/about/what-we-do), which it addresses through three main centres:
i. Centre for Health Technology Evaluation: technology appraisals and interventional procedures, leading

19
to recommendations on the use of new and exciting medicines and treatments within the NHS. Technology appraisal guidance covers medicines, medical devices, tests to identify diseases, surgical procedures and health promotion activities. Based on review of evidence on clinical effectiveness and economic evidence, which, when combined, leads to an assessment of value for money for the NHS in England and Wales.
ii. Centre for Clinical Practice: development of clinical guidelines on appropriate treatment and care of people with specific diseases and conditions within the NHS in England and Wales based on the best available evidence. The Guidelines (which are recommendations, not binding regulations) are used to:
ᵒ Improve the quality of healthcare for specific conditions;
ᵒ Develop standards to assess the clinical practice of individual health professionals;
ᵒ Aid the education and training of health professionals; and
ᵒ Help patients make informed decisions, and improve communication between the patient and health professional.
iii. The Centre for Public Health Excellence: develops guidance on the promotion of good health and the prevention of ill health in England. The guidance is not restricted to the NHS, but encompasses those working in local authorities and the wider public, private and voluntary sectors. In all the work of NICE, special emphasis is placed on rigorous and transparent methods and developing multiple ways of involving patients and the public at every stage of the assessment (NICE 2005).
The impact of NICE health technology assessments and clinical guidelines on specific conditions or procedures has been assessed over the fifteen or so years since it was established. In the early years of operation, impacts appeared to be somewhat variable and modest in PC if not accompanied by other supportive actions, including impacts on GP prescribing (Wathen and Dean 2004). It also depended on whether NICE guidance was implemented in practice (Sheldon et al. 2004). More promising results were obtained by the twin approach of introducing NICE guidelines on Coronary Obstructive Pulmonary Disease (COPD) and inclusion of COPD in the new Quality and Outcomes Framework (QOF) for GPs, which led to a large increase in spirometry data and prescriptions for combination inhalers. This represented significant progress
for people with COPD (Smith et al. 2008). Evaluation of single conditions, however, only gives a narrow picture and fails to capture system-wide impacts, which arguably have been far reaching in some cases.
Wider achievements over past fifteen years: The range of system-wide effects of NICE as an institution, as well as its products, are impressively wide, and include:
• NICE has standardised care in many areas across the NHS – unifying decisions that in the past were made in a rather scattered approach;
• Ensured to some extent equity of access to new technologies across the health service (though health authorities still try to wiggle their way around this in one form or another): less now than in the early years;
• Changed the game around making value for money, rather than cost of technologies, being seen as the prime driver; and
• Helped to change the face of public and patient involvement (KIs: GP; evidence-based medicine specialist; health policy analyst).
In the past, PC was particularly at the mercy of decisions made by individual practitioners and by individual health authorities (PCTs). To some extent, NICE, by setting standards in a transparent way and by using these as benchmarks against which practice can be audited, has inevitably improved practice in many areas. These include the use of statins in the UK, where the UK is now the second highest user in the world after the United States, and general markers of cardiovascular benefit, cardiovascular treatment, with benefit from that showing a marked improvement.
The negative issues are that the proliferation of NICE guidance has, to some extent, removed thinking from medical practice. The argument about what is appropriate practice has now been superseded by the latest set of NICE guidelines, and those are often applied in a rather unthinking way:
That’s the frustration because GPs often feel ‘I’m not using my judgement in caring for people because I’m doing all this bureaucracy on ticking boxes because somebody says they’ve read NICE and therefore I must do it that way – they haven’t understood that it is guidance not rules’. So you have the arguments about how do you control the blood sugar in people with diabetes? Well the target says it has to be at this level and you think, well, actually I think this person is having more side effects than they are getting benefits if I manage them that tightly…. (KI: GP)

20
In addition, NICE recommendations sometimes, in part, drive NHS practice and NHS spending into areas that are of lower priority. NICE appraisal committees approve approximately 90% of all new technologies eventually, with considerable cost to the NHS, which may not reflect the priorities of a particular area in terms of the disease states. Nevertheless, these now become audit standards against which all practices are judged and sometimes against which practice payments are made. So, the strength of NICE is the imposition of national-level standards, the weakness is the inflexibility of those standards at times, which may not allow a doctor to tailor treatment to the individual patient and can often be applied in a very unthinking way.
NICE has brought about these wider impacts in a number of ways:
i. Establishing credibility: The body had to establish its credibility and in the first instance, one of NICE’s early key decisions was refusing the use of Relenza. Up until then, there was considerable concern that NICE would be seen as being in the pockets of the pharmaceutical industry. The rejection of Relenza caused a huge political storm, but it also played greatly to the independence of NICE as a body – demonstrating that it was not simply a rubber-stamping exercise on the part of government for increased pharmaceutical spending: … it has to have credibility, it has to have the support of the professionals and the support of government and the support of managers and I think one of the great triumphs of NICE has been that its achieved all those. I guess it’s done it by the quality of its work, by its transparency and by being seen not to be in the pocket of any one of those groups. (KI: evidence-based medicine specialist)
ii. Making NICE decisions a statutory obligation: A pivotal step was the decision by the then Secretary of State for Health in 2001 that NICE’s decisions with regard to availability of technologies were statutory obligations on health authorities. So, if NICE approved a device or drug then health authorities had to make it available within three months of NICE’s approval to any suitable patient residing within its boundary. That is a statutory obligation. In the early days, health authorities were all testing the water, trying to find loopholes in the law. There was a fundamental contradiction in the law around the responsibilities of health authorities - they may not unjustifiably be asked to provide something that they can’t pay for at all because they don’t have the money - because at the end of the day they have a statutory obligation to balance their books, as well as to pay for new technologies. There was a tendency for health authorities to try to delay or fudge the issue around the availability of
something approved by NICE. This is less common nowadays but it still goes on to some extent (KIs: evidence-based medicine specialist; GP).
iii. NICE guidelines becoming audit standards: Another important aspect of NICE’s work is the development of guidelines for the care of a variety of conditions: currently amounting to some 170 or so odd different guidelines. Even though these guidelines are not backed by a statutory obligation, they have been seen as authoritative, to such an extent that they have become an audit standard for practice: health authorities are expected to use them as audit standards as are individual practices. In effect, NICE guidelines have become benchmarks against which practices are judged.
iv. Playing on professional obligation: NICE guidelines have become audit standards, even if not compulsory due to the paradigm of evidence-based practice that has been growing in the UK since about 1990. Arising from that is the development of evidence-based guidelines or, in the absence of complete evidence, the best consensus that can be achieved using the evidence available. In the UK in the 1990s, there were a large variety of guideline providers, sometimes using competing guidelines and that’s still the case today. But NICE has established itself as the main producer of evidence-based and quality guidelines within the UK, strongly supported by government ministers. It would be considered a professional obligation. It is open to practitioners to argue a particular case if the NICE guideline was wrong or not to follow it at all, but the doctor who does that really leaves himself open to managerial criticism and possibly to medical legal challenge. … and services have increasingly been configured to deliver NICE guidelines so, for instance, if NICE guidelines recommend that a patient be seen within two weeks, health authorities start to move their services to meet that criteria. (KI: evidence-based medicine specialist)
Influence on prescribing, generics and the medicines bill: NICE cannot be credited with reducing prescribing or the switch to generics, as these trends had been well established in the UK since the early 1990s. The transition to generic prescribing was essentially complete by 2000 and arose out of a range of government schemes that all pre-date NICE, starting with the indicative prescribing scheme (see Bligh and Walley 1992) of 1990 onwards and its various derivatives. NICE would not give opinions on generic drugs because it only looks at new drugs. There are other cultural drivers, though, in addition to the various government schemes:
21
There is an inherent conservatism in use of new drugs in the UK. Practitioners are loathed to use new drugs and that’s based on bitter experience over many years - new drugs not fulfilling the benefits they’ve been claimed to have and subsequently demonstrating substantial adverse effects. So there’s a strong memory of that which predicates UK practice and makes us reluctant to leap onto new drugs for the most part. That has existed since the 1960s, so it’s not a new phenomenon in the UK (KI: evidence-based medicine specialist).
The main reason the national medicine bill has decreased is that many of the major blockbuster drugs have now come off patent. Back in the early 1990s, the medicine bill was rising by 10-15% per year, with effective new medicines coming on the market like statins. Twenty years on, these medicines are coming off patent and the rate of pharmaceutical innovation has declined substantially, making that kind of mass use blockbuster medicine rare nowadays. There are numerous expensive medicines in particular areas but the vast bulk of prescribed medicines are not novel, most are off patent, which lend themselves to generic prescribing as well.
The UK experience contrasts with that in many countries, in which the practice of generic prescribing has never taken off, so that drugs are prescribed by brand name. There hasn’t been the same culture of hesitancy on the part of doctors in those countries to prescribe new drugs, though a shift in this hesitancy may also be building in the UK:
There has been a shift in the UK in the past 20 years in the willingness of patients to take drugs. We’ve certainly seen a large increase in volume of prescribing in the UK in the past 20 or 30 years, in part driven by all kinds of investment, increase in numbers of GPs and emphasis on evidence-based medicine, a rise of the paradigm of preventive rather than treatment. In particular in primary care, so the volume of prescribing has increase enormously in the UK but because the drugs being used are relatively inexpensive the costs have not risen to the same extent. (KI: evidence-based medicine specialist)
Cultural differences are also evident: Dutch people are notoriously reluctant to take drugs and drug use is relatively low in Holland, prescribed drug use at least. Whereas the French are notoriously keen to take drugs…drug use is hugely variable in the States because of course many patients in the United States will have to make co-payments of one kind or another far more than in Europe or far more than in the UK for instance. (KI: evidence-based medicine specialist)
As noted in previous sections, in the UK the prescription charge is levied on less than 10% of all prescriptions, so
the vast majority of prescriptions have almost no co-payment. In a relatively disadvantaged city, only about 2-3 % of prescriptions actually carry a co-payment of any kind. Economic pressures on the use of medicines are therefore less evident in the UK than they are in the United States.
Culture and the principle of ‘free at the point of use’: Because all NHS services are free at the point of use and under 10% actually pay for any prescriptions, economic theory would predict over-use, so why isn’t that the case?
I think we should explore culture a bit more as an issue because I think the national service was founded at a time when the sense of national unity was probably much stronger than it is now and the paradigm of free at the point of delivery, which was established then, has been maintained. But I think it is creaking in the face of rising consumerism. So one finds quite different patterns amongst older patients for instance, who talk about being embarrassed at occupying a hospital bed that other people might need, whereas younger patients see it as their right. So they’re very generational differences and slippages between responsibilities and rights as consumerism is on the rise and I’m not sure how well the model of being free at point of delivery will actually survive the rise of consumerism if people see it as their right to demand services. So I think that’s going to change over the course of the next 20 years in the UK, so I think that culture of national unity is still quite strong. You know there is a sense as one politician has commented that the NHS is Britain’s national religion and cannot be criticised and everyone must bow to it in one form or another in contrast to other countries. (KI: evidence-based medicine specialist)
NICE’s influence on equity of access: NICE’s aim is to improve geographic equity by improving the spread and reach of new, effective technologies around the country. If NICE decrees that a specific technology will be available everywhere in the country, that may be relatively easy for most drugs, but for other technologies, it may not help at all and may generate other inequalities:
You simply can’t provide the services to someone in the Western Isles that are available to someone in London, that’s never going to happen and the same is true to some extent of the availability of new technologies. There is more to it than geographic equity. There’s also knowledge, understanding, education on the part of the patient about what’s available, what they can ask for and by putting money into expensive technologies that perhaps inevitably are used more by better educated and
22
more well-healed elements of society, they are actually decreasing equity across society. (KI: evidence-based medicine specialist)
International influence: The pharmaceutical industry’s main concerns with NICE are less around its influence on the UK market and more around its visibility internationally. The UK has around 3% of the world pharmaceutical market. If a company doesn’t get a foothold in that market, 3% doesn’t matter in the grand scheme of things. But the influence of NICE and its appraisals go round the world and have a huge influence internationally on what the potential market for a product is. Companies are very aware of that influence. Why NICE has that influence is an intriguing question:
I think the British model, particularly in relation to drugs, is one that’s been widely admired internationally in relation to the quality, for instance, drug regulation and drug licencing initially and then as the paradigm has shifted more towards regulation of availability and regulation of price. NICE’s approach has become very influential internationally because of its transparency and quality of its work. Perhaps less because of hard evidence it has actually made a difference to how much you spend on things. But I think countries all over the world suffer and struggle with this….So NICE has been influential, not in making national decisions in other countries, but certainly something that everyone looks to before they make a decision in most countries. (KI: evidence-based medicine specialist)
Instead of setting up its own NICE, a country may use the work of NICE adapted to their own local circumstances, by using the data it provides, for instance, and factoring in local patterns of disease and care. Most European countries look at NICE very carefully in this way.
4.3 Promoting the training and status of Expert Generalists
One of the features of the UK PC system is that general practice is treated as a specialism, requiring the depth of training of secondary care specialties. There have been continued attempts to raise the income levels of GPs to that of hospital consultants. These and other features of the system have raised the status of general practice and facilitated favourable public attitudes to PC and its trusted role as entry point to the referral system.
Explanations for this go back to a model of PC that derived from the national insurance scheme before World War I, strengthened after that war and then, in 1948, the NHS that promised that each person would have their own named doctor who was responsible for him or her all the time.
That ideal has been watered down over the years, and it is now the general practice, rather than the individual GP, that has responsibility for each registered patient, with concern raised by a key informant from PC practice that there is a loss of personalised care (KI: GP). At the same time the general principle remains of a long-term doctor-patient relationship and continuity of care, one that was also noted to demand a higher level of training (KI: GP).
Issues of training clearly play a part in acceptability and trust in general practice. Training to become a GP in the UK takes a total of ten years. All medical schools offer GP specialty training programmes (The National Recruitment Office for GPs 2012a). GP training involves:
• A five-year undergraduate medical degree – studying at a medical school attached to a university, with clinical placements in hospitals and the community. For the initial medical training, the NHS allocates a specific number of places to each medical school to meet national workforce requirements for all specialties. Prospective students apply to the medical schools of their choice and are selected on their academic record and assessment of aptitude.
• A two-year foundation programme (F1 and F2) of general medical training that must be completed by all medical graduates before further training.
• Three years of specialist training in general practice to gain membership in the RCGP. The standard route for most trainees is via a Certificate of Completion of Training that is awarded to doctors who have successfully completed a General Medical Council approved programme (RCGP 2014).
• Then there are schemes whereby young, qualified GPs continue to learn together in groups and run their required continuing professional development (CPD), supported by senior people in the practice and from the RCGP (NHS Careers 2014).
The NHS funds the specialist training of GPs, as with other medical specialities. GP trainees are selected through a national GP selection system (described by The National Recruitment Office for GPs [2012b] here: http://tinyurl.com/ou44ajf). As with other UK students, medical undergraduates pay tuition fees (£9,000/$15,300 a year), although their education is heavily subsidised by the government and (as with other disciplines) students receive loans to cover tuition fees so that no upfront fees have to be paid. Students from disadvantaged backgrounds may also apply for bursaries to cover tuition fees. The NHS pays medical trainees a salary during the F1 and F2 foundation years after graduation with a medical degree. Once a trainee has been accepted by the national GP training scheme, the
23
NHS pays them a salary for the duration of the training (KI: medical education).
NHS workforce planning, which covers 101,000 general practice staff (of 1.3 million NHS staff – based on 2011 data), is supported by Health Education England, a national body that provides system-wide leadership and oversight of workforce planning, education and training of all healthcare staff (Health Education England 2014). Long-term workforce planning is designed to ensure that the correct proportion of GPs, relative to other specialities, are trained and recruited at national and local levels; the same applies to other PC professionals. In recent years, as a result of a drive towards healthcare in community/PC settings, the numbers of GP training vacancies have increased. In 2013, 98% of the 3,921 declared vacancies in 2013 were filled (The National Recruitment Office for GPs 2013).
Specialist training has been characterised as fundamentally about managing uncertainty: learning how to make informed decisions about whether a condition is minor and self-limiting, minor and long-term, major but getting better and major but dangerous:
It’s the major and dangerous that you have to make sure you haven’t missed, as well as a potential cancer or a potential serious heart disease or whatever else it might be, and so we’re having to sort of balance those things. Managing uncertainty is what the training is about. (KI: GP and trainer)
GP training is designed to encourage practitioners to consider care as a whole, from health promotion and prevention to palliative care. Expert Generalists is the term the RCGP uses to characterise the specialist nature of the profession.
This depth of training has encouraged a high level of trust of PC as the first port of call for someone seeking care and as respected entry point for referral to secondary care, as gatekeeper. With the 90% of healthcare contacts in the NHS dealt with in PC, as noted earlier, this gatekeeper role could not function effectively if people did not believe that GPs had the necessary expertise to help them get the care they need.
GPs’ expertise in managing uncertainty is also argued to reduce unnecessary medical investigations and diagnostic tests, as they use their clinical judgement to a fuller extent (KI: GP). Professional values and public service ethos are further pieces in the jigsaw puzzle, fitting together to influence affordability, efficiency and effectiveness of the system as a whole:
It’s the individual moral beliefs of the practitioner that make this work or not work. We do this work because we want to provide good quality care.
If you have a financially driven model, to use the technical term, you’re screwed. Because I think then you have people that say no, it’s 5 o’clock, my shift is over, sorry I’m not seeing any extras, rather than “have you seen how busy it is the waiting room? It’s heaving. I’d better stay an extra half hour.” … that’s how you have to be able to work. You have to believe that what you’re doing is about caring for people. (KI: GP)
How far this ethos can be transplanted into a different culture, and how much longer it can be maintained in the UK in the face of privatisation, are critical questions in the current climate.
4.4 Initiatives to improve access and quality of PC in disadvantaged areas
Before the establishment of the NHS in 1948, there were great differences in the density of GPs, with three- to fourfold differences between affluent and poorer areas (House of Commons Debates 1945-1946). One of the successes of the NHS is argued to be the achievement of a much fairer distribution of GPs, which corresponds much more closely to the size of the local communities (Benzeval and Judge 1996). These distribution problems have not been entirely solved and progress may have stalled or inequalities widened in recent decades (Benzeval and Judge 1996; Gravelle and Sutton 2001; Hann and Gravelle 2004; Goddard et al. 2010). The maldistribution of GPs has been a continuing national policy concern for decades, made famous by Julian Tudor Hart, a longstanding GP in disadvantaged mining valleys of Wales, who coined the Inverse Care Law from his experiences in general practice throughout the 1960s:
The availability of good medical care tends to vary inversely with the need for the population served. This inverse care law operates more completely where medical care is most exposed to market forces, and less so where such exposure is reduced (Hart 1971).
Three main policy instruments were used to encourage a fairer distribution of PC practices around the country: controlling where doctors can set up new practices; offering incentives to work in disadvantaged areas; and increasing the supply of GPs overall in the country. The experiments have had varying success.
i. Entry control: From 1948 to 2002, the English Department of Health, through the Medical Practices Committee, restricted entry by GPs into areas classified as over-doctored. In 2002, the controls were abolished in England, followed by Scotland in 2003, thus providing a natural policy experiment.

24
Impact assessments conclude that such entry controls had a weak but positive impact on reducing the maldistribution of GPs, particularly in the early decades of the NHS, with a sharp deterioration in equity after they were abolished (Goddard et al. 2010). Entry controls were found to be insufficient in themselves to prevent the deterioration in equity that was observed between mid-1990s and the abolition of controls in 2002 and to be a blunt instrument to achieve improved outcomes (Goddard et al. 2010).
ii. Targeted incentives to practice in under-doctored areas. From 1990 to 2004, through the General Medical Contract for GPs, capitation payments for registered patients from deprived areas were increased relative to those for patients from other areas (known as the underprivileged area, UPA 8, payments) (Carr-Hill and Sheldon 1991). While the payments increased the GPs’ income in disadvantaged areas with the same number of registered patients, its overall effect in attracting GPs to under-doctored areas is uncertain (Gosden et al. 2001), possibly due to the interaction with the entry controls in over-doctored areas over the same time. Some of the GPs attracted into under-serviced areas by incentives may have come from other under-served areas, exacerbating, rather than improving, the maldistribution (Goddard et al. 2010).
iii. Increasing the total supply of GPs. From 2002 to 2005, England experienced an unprecedented increase in the supply of GPs, with an increase of 12.7% GP whole-time equivalents per capita, compared with a decrease of 0.1% in the preceding four years. Scotland’s supply grew more slowly over the same period. This increase in per capita supply between 2002 and 2006 in England was not significantly associated with changes in health or facility outcomes (Goddard et al. 2010). However, the widening inequalities after the 2002 abolition of entry controls was less rapid in England than in Scotland, possibly because England had a sharper increase in the rate of growth of GP supply after abolition than that experienced in Scotland (Goddard et al. 2010).
Overall, it appears that GPs’ motivations for re-location need to be more fully understood to design effective remedies for their maldistribution. There is some evidence that GPs in England prefer to locate in areas with lower deprivation levels, a more pleasant environment and higher levels of amenities (Goddard et al. 2010). Push factors
from areas of higher deprivation may not solely relate to personal income, but also to the stress of working in deprived areas, and the extra workload from dealing with more severe illness, early onset of chronic disease and higher prevalence of multimorbidity in more disadvantaged practice populations. Two initiatives that have tried to take account of the complexities faced by PC in disadvantaged areas are described below with further detail and further key informant quotes provided in Appendix 1.7.
Delivery of PC in the most deprived areas – GPs at the Deep End (Scotland):GPs at the Deep End comprise about 360 GPs working in general practices serving the 100 most deprived populations in Scotland. Before the group was established in 2009:
…they had never been convened or consulted by anyone since the start of the NHS. Since then, it has established a strong identity for this group, a coherent statement of the problems faced by primary care in very deprived communities and a strong and consistent message, expressed via reports and lobbying, for what is required to improve health in very deprived areas. (KI: Deep End GP)
The initiative is based on the premise that the best people to know how to improve PC services in disadvantaged areas are the people living and working in these circumstances. Deep End practices have identified multiple supply and demand issues within the most deprived practices, which include: higher demand on services; shorter time availability; greater GP stress; less enablement reported by patients with problems and a higher prevalence of physical, psychological and co-morbidities/multimorbidity, with these problems concentrated within families, practices and areas (GPs at the Deep End 2009; Watt 2002). Tudor Hart’s cartoon (Figure 2) presents Graham Watt’s Deep End swimming pool analogy. While the prevalence of health problems rises 2.5-3-fold across the socio-economic spectrum, the distribution of GPs is almost flat. In severely deprived areas this results in a major mismatch of need and resource, with insufficient time to get to the bottom of problems – hence GPs at the Deep End struggle to tread water. GPs in affluent areas are standing in the shallow end with their feet on the bottom. This analogy does not imply that GPs at the shallow end are not busy, or that they do not have demanding patients, but their patients generally live much longer and present less complex burdens of need (Watt 2012).
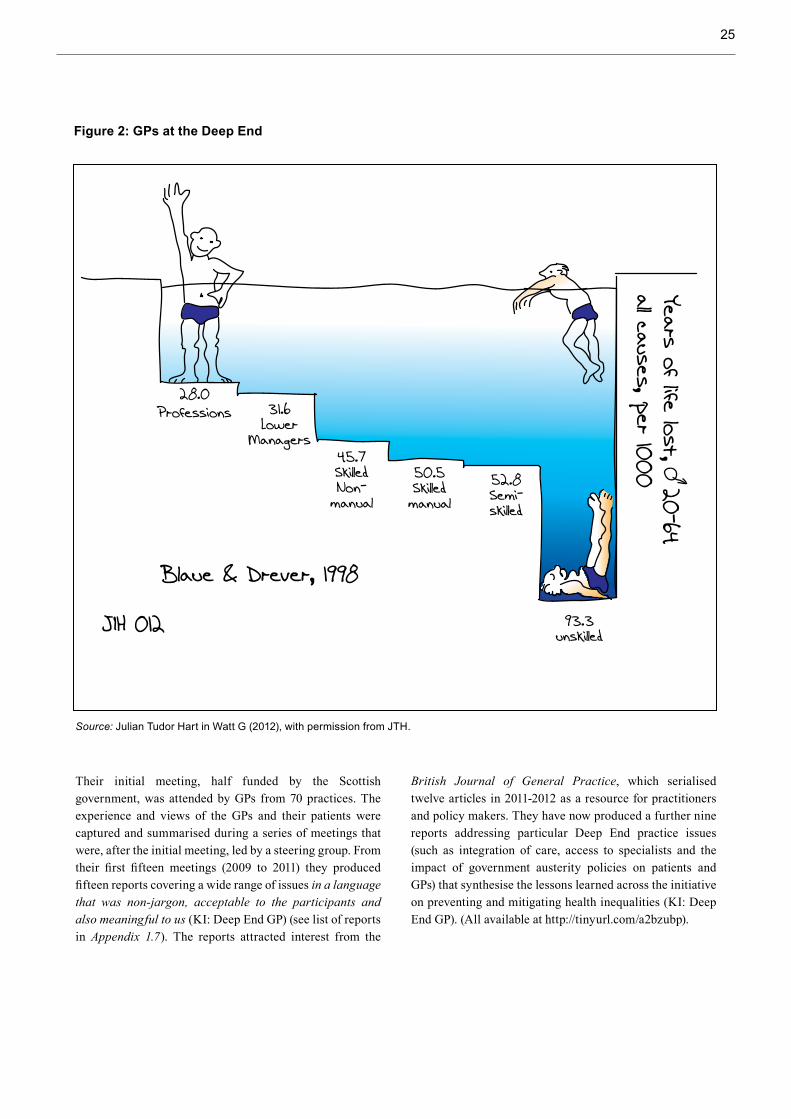
25
28.0Professions 31.6
LowerManagers
45.7SkilledNon-
manual
50.5Skilledmanual
52.8Semi-skilled
93.3unskilled
Blaue & Drever, 1998
JIH 012
Years of life lost, 20-64all causes, per 1000
Figure 2: GPs at the Deep End
Source: Julian Tudor Hart in Watt G (2012), with permission from JTH.
Their initial meeting, half funded by the Scottish government, was attended by GPs from 70 practices. The experience and views of the GPs and their patients were captured and summarised during a series of meetings that were, after the initial meeting, led by a steering group. From their first fifteen meetings (2009 to 2011) they produced fifteen reports covering a wide range of issues in a language that was non-jargon, acceptable to the participants and also meaningful to us (KI: Deep End GP) (see list of reports in Appendix 1.7). The reports attracted interest from the
British Journal of General Practice, which serialised twelve articles in 2011-2012 as a resource for practitioners and policy makers. They have now produced a further nine reports addressing particular Deep End practice issues (such as integration of care, access to specialists and the impact of government austerity policies on patients and GPs) that synthesise the lessons learned across the initiative on preventing and mitigating health inequalities (KI: Deep End GP). (All available at http://tinyurl.com/a2bzubp).
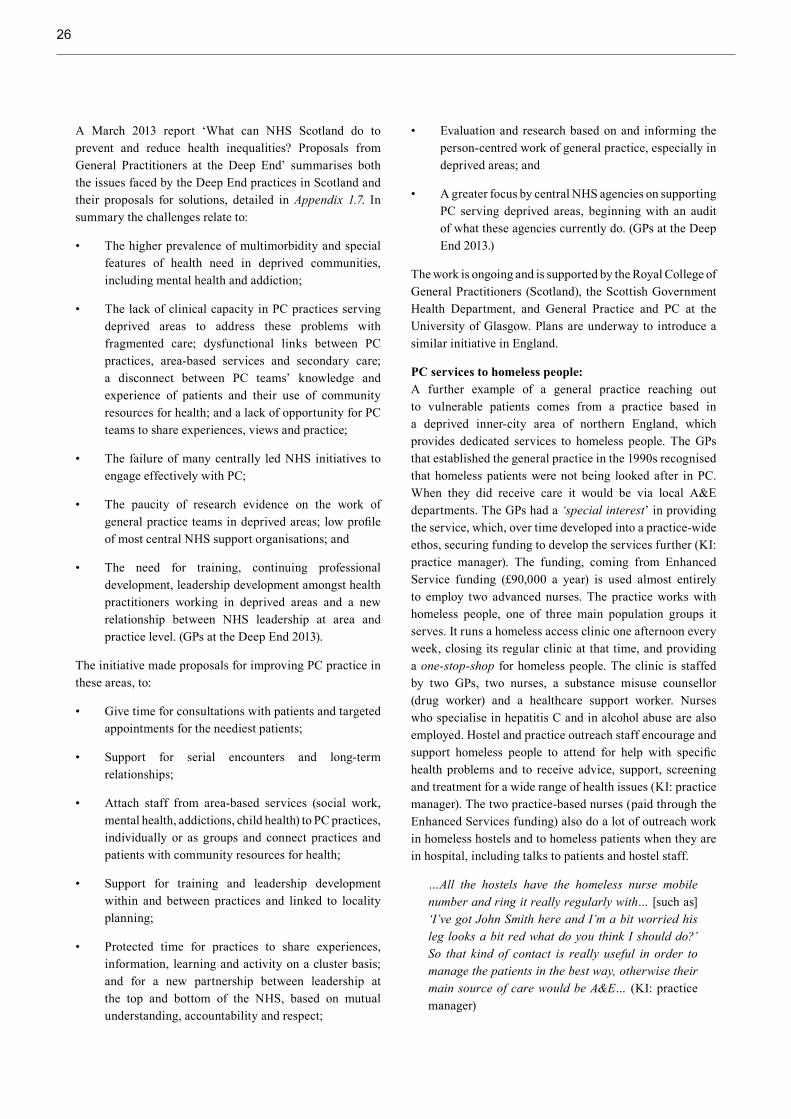
26
A March 2013 report ‘What can NHS Scotland do to prevent and reduce health inequalities? Proposals from General Practitioners at the Deep End’ summarises both the issues faced by the Deep End practices in Scotland and their proposals for solutions, detailed in Appendix 1.7. In summary the challenges relate to:
• The higher prevalence of multimorbidity and special features of health need in deprived communities, including mental health and addiction;
• The lack of clinical capacity in PC practices serving deprived areas to address these problems with fragmented care; dysfunctional links between PC practices, area-based services and secondary care; a disconnect between PC teams’ knowledge and experience of patients and their use of community resources for health; and a lack of opportunity for PC teams to share experiences, views and practice;
• The failure of many centrally led NHS initiatives to engage effectively with PC;
• The paucity of research evidence on the work of general practice teams in deprived areas; low profile of most central NHS support organisations; and
• The need for training, continuing professional development, leadership development amongst health practitioners working in deprived areas and a new relationship between NHS leadership at area and practice level. (GPs at the Deep End 2013).
The initiative made proposals for improving PC practice in these areas, to:
• Give time for consultations with patients and targeted appointments for the neediest patients;
• Support for serial encounters and long-term relationships;
• Attach staff from area-based services (social work, mental health, addictions, child health) to PC practices, individually or as groups and connect practices and patients with community resources for health;
• Support for training and leadership development within and between practices and linked to locality planning;
• Protected time for practices to share experiences, information, learning and activity on a cluster basis; and for a new partnership between leadership at the top and bottom of the NHS, based on mutual understanding, accountability and respect;
• Evaluation and research based on and informing the person-centred work of general practice, especially in deprived areas; and
• A greater focus by central NHS agencies on supporting PC serving deprived areas, beginning with an audit of what these agencies currently do. (GPs at the Deep End 2013.)
The work is ongoing and is supported by the Royal College of General Practitioners (Scotland), the Scottish Government Health Department, and General Practice and PC at the University of Glasgow. Plans are underway to introduce a similar initiative in England.
PC services to homeless people: A further example of a general practice reaching out to vulnerable patients comes from a practice based in a deprived inner-city area of northern England, which provides dedicated services to homeless people. The GPs that established the general practice in the 1990s recognised that homeless patients were not being looked after in PC. When they did receive care it would be via local A&E departments. The GPs had a ‘special interest’ in providing the service, which, over time developed into a practice-wide ethos, securing funding to develop the services further (KI: practice manager). The funding, coming from Enhanced Service funding (£90,000 a year) is used almost entirely to employ two advanced nurses. The practice works with homeless people, one of three main population groups it serves. It runs a homeless access clinic one afternoon every week, closing its regular clinic at that time, and providing a one-stop-shop for homeless people. The clinic is staffed by two GPs, two nurses, a substance misuse counsellor (drug worker) and a healthcare support worker. Nurses who specialise in hepatitis C and in alcohol abuse are also employed. Hostel and practice outreach staff encourage and support homeless people to attend for help with specific health problems and to receive advice, support, screening and treatment for a wide range of health issues (KI: practice manager). The two practice-based nurses (paid through the Enhanced Services funding) also do a lot of outreach work in homeless hostels and to homeless patients when they are in hospital, including talks to patients and hostel staff.
…All the hostels have the homeless nurse mobile number and ring it really regularly with… [such as] ‘I’ve got John Smith here and I’m a bit worried his leg looks a bit red what do you think I should do?’ So that kind of contact is really useful in order to manage the patients in the best way, otherwise their main source of care would be A&E… (KI: practice manager)

27
They work together with hostel staff to identify new patients who have not engaged with health services to encourage and support them to attend the clinic. The GPs and nurses also go out to patients who are reluctant to engage with health services to provide services directly, and to encourage future engagement. Using money from the Enhanced Service funding, the practice contracted a local homeless charity to provide a waiting room mentor who has personal experience of being homeless and who supports the interaction in various ways, including to manage conflict or advise on services:
… he engages with these patients on a level that we would never be able to engage in because we’ve not got that lived experience and he’ll direct them. So he has one-to-ones with patients in terms of… supporting them, offering interventions, offering advice, linking patients in with different services. (KI: practice manager)
The patients’ circumstances mean that the practice has to provide a flexible patient registration process, given that clients have no fixed abode, liaising with other homeless services that they connect with for their contacts and dedicating substantial resources to case management (KI: practice manager). Staff receive specialist training for this, including customer care and social communication.
The key informant described an analysis (conducted two years previously by the former PCT) of the health service resources that the practice’s homeless patients used. Before the clinic, despite there only being 800 homeless patients compared to 28,000 non-homeless patients, the homeless accounted for 21% of emergency care admittance, largely for conditions that should be managed effectively in PC,
raising the costs of care to the NHS and to themselves. The full costs and benefits are yet to be assessed, but, as an indication of the financial protection, the support by an alcohol nurse reduced the costs to the NHS for one patient by £34,000 ($57,800) by preventing the need for hospital emergency care (KI: practice manager).
Rigid/inflexible performance targets designed for the general population cannot be applied to this population group: [the group of patients] messes up our targets something awful so… we get measured on the percent of patients with those conditions who go to, who are admitted to hospital and we’re red on… 4 out of 8 targets. (KI: practice manager)
There is, however, sufficient discretion in the current performance target and funding systems. All general practices are funded to provide an enhanced service (the GP specification) that provides top-up funding, on top of core funding, to ensure that every practice gets the same level of funding per patient. They have to meet ten key performance indicators (such as A&E attendance, in-hours attendance, flu vaccinations, out-patient referrals) to access the full funding. The system gives the practice the opportunity to provide evidence annually to the GP spec’s validation committee so they can demonstrate their efforts and why they may be missing certain targets. This has helped to protect their income (KI: practice manager). National performance and QOF payment systems, as noted earlier, also provide some room for discretion based on the needs of particular patients. Using this space depends in part on the practice finding innovative ways of providing services, while meeting targets and reducing the need for exception reporting (KI: practice manager). Further information is contained in Appendix A7.2.

28
5. Managing and sustaining change in PC
S everal mechanisms for managing and sustaining change in PC have been built into the processes and systems described in this paper, including:
i. Monitoring and oversight of ‘payment for performance’ incentives to improve quality and secondary prevention in PC, through the Quality and Outcomes Framework (QOF) - see Section 3.6.
ii. Monitoring of referral rates of PC practices and setting targets for change where appropriate.
iii. Fulfilling statutory obligations on PCTs/CCGs to make available to any suitable patient within their boundary any device or drug approved by NICE, within three months of approval. This is a mechanism for improving geographic access to effective technologies, but it also acts as a brake on the prescribing of drugs or other therapies that have not been approved by NICE, as the PCT/CCG has no obligation to authorise payment for non-approved items (see Section 3.7).
iv. Monitoring and holding to account for the meeting of national targets on a range of outcomes, including on efficiency savings, waiting times, prevention, health promotion and health inequalities improvements. Some of the targets have carried financial penalties for failure to achieve targets, while others have attracted
additional resources to help achievement. PCTs themselves, for example, were allocated additional resources from the central NHS budget, based on the level of mortality and deprivation within their resident population, to assist in meeting health inequalities reduction targets (see section 3.2, How GPs are paid for their services).
v. Parliamentary scrutiny: Several parliamentary committees and independent auditing bodies operating at national level scrutinise the operation of parts of the NHS and public health function fairly regularly. These include the House of Commons Committee of Public Accounts, which investigated ‘Tackling inequalities in life expectancy in areas with the worst health and deprivation’ in the 2010-11 session; the Parliamentary Health Select Committee, which investigated what the NHS was doing about health inequalities in 2006 and 2010 and on resource allocation to PC in 2012; and the National Audit Office. The bodies under investigation take seriously the findings of all such investigations.
This paper also gives an insight into the ideas, individual, institutional factors and the interests (professional, social, political and other) that have supported PC innovation or sustained promising PC practice. These are summarised in Table 4:

29
Table 4. Factors that promote, sustain, or act as barriers to PC innovation
Factors that promote and sustain or act as barriers to change in primary care systemsInstitutional (policy/ system or practice level) Ideas Interests External events
Facilitators Policy legacies: Fundamental design of the NHS universal healthcare system within which PC is embedded: universal entitlement, financing through general taxation (progressive), services free at the point of use, comprehensive healthcare coverage, equality of geographic access, high standards of care for all, selection on the basis of need and the encouragement of a non-exploitative ethos.
Policies and systems: Comprehensive patient registration and information systems.
Common resource allocation and GP contract (core, QOF and enhanced services funding).
Statutory duty on health authorities to make available health technologies approved by NICE.
Making GP a specialty and increasing remuneration of GPs.
National system of workforce planning and NHS funding of specialist training of GPs (as it does for other specialties).
PPI systems involve public in system redesigns.
Culture & ethos: Public and political support for NHS since founded in 1948.
General ethos that patients should not be exploited for profit.
High GP status.
High patient satisfaction and trust.
Government introduction in 1999 of additional objective for NHS resource allocation “to contribute to reduction in inequalities in health status”.
Evidence-based medicine movement gaining pace in the in 1990s – played a role in stimulating the setting up of NICE.
Acknowledgement in early 2000s of evidence that GPs’ income had slipped behind doctors in secondary and tertiary care.
Acknowledgment amongst the public health/health inequalities movement of the inverse care law and need for equity of access to healthcare.
Improved fiscal climate during early 2000s providing funding for increased NHS investment.
Evidence from international comparisons showing lower percentage of UK GDP being spent on NHS in comparison with other EU members - leading to government commitment in early 2000s to increased funding for NHS towards European average.
Ageing population and increasing prevalence of chronic health conditions.
Increasing costs of health technologies driving need for efficiency.
Evidence of substantial socio-economic inequalities in health status affecting need for additional services and driving search for equitable resource allocation.

30
Factors that promote and sustain or act as barriers to change in primary care systemsInstitutional (policy/ system or practice level) Ideas Interests External events
Barriers UK treasury resistance to increased spending on healthcare.
Unanticipated financial cost of QOF.
Pharmaceutical industry resistance to NICE Influence on NHS decisions.
GPs seeing QOF and NICE as threats to their professional autonomy.
NHS reforms from 2010 serve as a barrier to sustaining equitable, efficient components of NHS.
The economic recession of 2008-
Promising practices
• Implementation of the new GP contract in 2004, including QOF, raised the income of GPs, which made general practice more attractive as career and expanded the PC team as more nurses and other health professionals were employed by GPs to provide QOF and enhanced services through GP contract. Increased secondary prevention activity by GPs.
• NICE helped to standardise care across the NHS, ensure equitable access to new health technologies and value for money.
• Specialist training to become a GP has added to the acceptability and trust that patients need to accept the gatekeeping role of GPs and enhanced the status of general practice as a professional career choice.
• Purposeful initiatives to improve access and quality of PC in disadvantaged areas have provided examples of approaches to reversing the Inverse Care Law.
Source: Authors
Table 4. Factors that promote, sustain, or act as barriers to PC innovation (continued)

31
6. Discussion and conclusions
A t first sight, the British and the US healthcare arrangements are so fundamentally different that it is difficult to identify which features of the British
system would be of interest and potentially transferable to the US context. This case study attempts to tease out useful lessons for further consideration by:
i. identifying the essential ‘ingredients’ that make the British NHS in general and the PC in particular function efficiently, effectively and equitably as a whole system and
ii. singling out some distinct/more self-contained policy initiatives that show potential for application to solve problems that other systems, including the USA, face.
Some aspects of the NHS vary slightly in the four countries of the UK, so for the purposes of simplicity, this case study describes the situation in England, though with some reference to initiatives in Scotland.
6.1 Essential ingredients of the NHS and PC
The English PC system must be understood within the context of a long-standing, publicly and politically popular universal healthcare system, the NHS, which was designed from the outset to be more equitable, efficient and effective than the patchwork of services it replaced. The building blocks of universal entitlement, equitable financing, services free at the point of use, comprehensive healthcare coverage, equality of geographic access, high standards of care for all, selection on the basis of need and the encouragement of a non-exploitative ethos underpin the policies and specific models that maintain and enhance NHS PC.
The NHS has a strong PC base in comparison to other OECD countries. As outlined in this paper, more than 90% of healthcare interactions take place in PC, despite a PC budget of under 10% of the total NHS spending of approximately £105 billion/$175 billion annually. More than 99% of the 52 million people living in England are registered with a general practitioner. Patient satisfaction with PC is very high and satisfaction with the NHS in general is high,
although it has fallen since 2010. Section 3.5 details some impressive outcomes and impacts of the English NHS in comparison with other high-income countries, in terms of access, efficiency, and equity.
There are important components of the infrastructure for PC, described in this case study, that help make it strong: the common GP contract, support for common information systems and the use of those systems to establish professional norms that all help it function as a unified system. The information systems and patient records also supported the oversight of PC services by PCTs (responsibilities now partially taken over by the CCGs). As described in Section 5, this monitoring and support, and the strategic role of the public health services within PCTs, were part of the mechanisms for managing change. The English experience of setting national targets for local services, however, including for PC, had both positive and negative effects and certainly generated resentment in some quarters.
The near universal registration of the population with a general practice is another asset, coupled with the fact that two-thirds of the population have a GP consultation every year, rising to 90% over five years. This provides levels of contact, coverage and continuity between PC and the general public achieved by few other public services.
Another important aspect is the role of GPs as gatekeepers to specialist care and beyond. Gatekeeping is seen as an essential, structural component of the system, reducing unnecessary and expensive access to specialists, and containing health problems within the community when they can be more appropriately treated. It also helps protect patients against over-treatment and excessive exposure – to radiation during diagnostic tests, for example. The gatekeeping role, however, could not function as intended without a high degree of trust by patients that GPs are making referral decisions in the their patients’ best interests, and not based on financial or other gain. The system for paying GPs has been such that GPs’ income is not dependent on how much or how little they refer (described in Section 3.2). In addition, conflict of interest rules apply (at least until the latest reforms) which mean that GPs should not have a

32
financial interest in specialist services to which they may refer patients. That high degree of trust does in the main exist, not least because the system does not allow patients to be exploited for profit.
The case study identifies a somewhat intangible aspect that nonetheless makes the system work – the status of GPs and respect for their expertise. Public perceptions of GPs have been enhanced by general practice being treated as a specialism, requiring the depth of training approaching secondary care specialties. Also there have been continued attempts to raise the income levels of GPs to that of hospital consultants. These and other features of the system have raised the status of general practice and facilitated favourable public attitudes to PC and the trusted role of the gatekeeper in the system. How far the ethos of the NHS can be transplanted into a different culture is a matter for debate.
Relationships between PC providers and the public may have been enhanced in recent years through greater patient and public involvement (PPI) that is now operating at all levels of the NHS, described in Section 3.3. Voluntary sector support networks and organisations can play a key role in helping individuals navigate complex health systems, particularly during periods of change. Practice health champions have the potential to enhance patient access to decision making and may assist patients, particularly those from disadvantaged backgrounds, in understanding complex health issues and health systems. There is some indication of positive benefits from patient participation in decision making, on patients and the PC system and on reduction of costs, through ensuring that services are designed to meet the needs of local communities and increasing the quality and appropriateness of services. The extent of PPI is not uniform across PC, however, and can be tokenistic.
6.2 Lessons from promising PC initiatives
A number of PC policy initiatives are outlined in the case study. These have been selected as they have been associated with improved health, or service or equity outcomes and hold some interest for application in the US. The first is the Quality and Outcomes Framework (QOF), introduced at a cost of more than £1billion/$1.7 billion per annum, with the use of new money designed to address pay inequalities between GPs and hospital-based specialists to achieve additional benefits for the healthcare system. While other costs associated with its introduction (such as IT infrastructure) may be substantial, they bring additional benefits. The ability of practices to meet targets in the first year was underestimated and this increased costs over estimates considerably. Active monitoring in the QOF contributes to its impacts on quality and outcomes: through self-monitoring when practice staff are notified
(automatically) by the QOF IT system where performance is falling short of targets; through monitoring of practices and feedback on their relative positioning vis à vis other practices by commissioning authorities and by public reporting, using reputation and accountability to spur practice improvements. The case study points to the potential for QOF to reduce inequalities by ensuring systematic management of chronic conditions, but also to increase inequalities by diverting attention from non-incentivised areas. Thresholds may act as a ‘quality ceiling’, preventing further improvements. This points to the need for careful selection and regular management over time of the indicators and related quality thresholds to avoid negative effects. Professional buy-in is also required to minimise gaming of the system.
The second is the introduction of NICE, which has standardised care in many areas across the NHS and helped to ensure equitable access to new health technologies. It has played a key role in balancing the costs and benefits of healthcare technologies (value for money). The strength of NICE is the imposition of national-level standards; the weakness is the inflexibility of those standards, which may undermine a doctor’s discretion to tailor treatment to individual patients. It provides a method and evidence potentially useful for other countries.
The third policy initiative is the promotion of the training and status of GPs as Expert Generalists. Specialist training has been characterised as fundamentally about managing uncertainty: learning how to make informed decisions about whether a condition is minor and self-limiting, minor and long-term, major but getting better and major but dangerous. It is also about encouraging practitioners to consider care as a whole, from health promotion and prevention to palliative care and about the psychological, the social and the biological aspects of people’s lives. Expert Generalists is the term the Royal College of GPs uses to characterise the specialist nature of the profession and, as mentioned above, it adds to the acceptability and trust that patients need to have in general practice that their GP has the necessary expertise to help them get the care they need.
Finally, there have been a series of experiments over the years to improve access to, and delivery of, PC services to disadvantaged groups and areas of the country, as outlined in Section 4.4. Some have proved relatively ineffectual – entry control and targeted incentives to increase supply of GPs in under-doctored areas could be seen as blunt instruments to bring about the desired shifts. Others, such as the GPs at the Deep End initiative in Scotland and the PC services adapted to serve the needs of homeless people in the North of England, provide inspiration on how to reverse the Inverse Care Law. Such initiatives are based on the premise that the best people to know how to improve PC services in disadvantaged areas are the people living and working

33
in these circumstances. These may be of particular interest to those working on similarly challenging circumstances in the USA.
It seems ironic that this case study, which set out to identify the strengths of the English PC system and what other countries might learn from it, is being written at a time when the NHS as a whole is under the greatest threat that it has
faced in its 60-year history. How much longer the NHS as we know it can be maintained in the UK in the face of the fragmentation and commercialisation introduced in the 2012 reforms are critical questions taxing the minds of the British public and professionals alike. Perhaps the most valuable lessons this case study can offer are for British politicians!

34
7. References1. Bajekal M, Scholes S, O’Flaherty M, Raine R, Norman
P, Capewell S (2010) ‘Trends in CHD mortality by socioeconomic circumstances, England 1982-2006’, J epidemiol community health 64(S1):PA2.
2. Bajekal M, Scholes S, Love H, Hawkins N, O’Flaherty M, Raine R, Capewell S (2012) ‘Analysing recent socioeconomic trends in coronary heart disease mortality in England, 2000-2007: A population modelling study,’ Plos med 0(6):e1001237. (Available at: http://tinyurl.com/p8mkr84)
3. Banks J, Marmot M, Oldfield Z, Smith J (2006) ‘Disease and disadvantage in the United States and in England’, JAMA 295(17):2037-45. Available at: http://tinyurl.com/79jj5le.
4. Barr B, Bambra C, Whitehead M (2014) The impact of NHS resource allocation policy on health inequalities in England 2001-11: longitudinal ecological study. BMJ; 348:g3231.
5. Benzeval M and Judge K (1996) ‘Access to health care in England: Continuing inequalities in the distribution of GPs’, Journal of public health 18(1):33-40.
6. Beresford C (2011) ‘Patients’ perspectives of type 2 diabetes care by practice nurses: A qualitative study’, Journal of diabetes nursing 15(10):391-97.
7. Bevan A (1946) ‘National Health Service Bill’, House of Common Debate 30th April 1946. Hansard 422:cc43-142. House of Commons: London. (Available at: http://tinyurl.com/k8klgps)
8. Bligh J and Walley T (1992) ‘The UK indicative prescribing scheme’, PharmacoEconomics; 2(2):137-52. (Available at: http://tinyurl.com/omlbohj)
9. BMA (2012) ‘What we know so far…The NHS Commissioning Board’, British Medical Association Health Policy and Economic Research Unit: London. (Available at: http://tinyurl.com/o9v35t5)
10. BMA (2014) 2014/15 General Medical Services (GMS) Contract Quality and Outcomes Framework (QOF) - Guidance for GMS Contract. British Medical Association: London. (Available at: http://tinyurl.com/k52dtb2)
11. Campbell S, Reeves D, Kontopantelis E, Middleton E, Sibbald B, Roland M (2007) ‘Quality of primary care in England with the introduction of pay for performance’, New England journal of medicine 357:181–90.
12. Carr-Hill R and Sheldon T (1991) ‘Designing a deprivation payment for general practitioners - the UPA(8) wonderland’, BMJ 302(6773):393-96.
13. Coleman M, Babb P, Sloggett A, Quinn M, De Stavola B (2001) Socioeconomic inequalities in cancer survival in England and Wales. Cancer: 91(S1):208-16.
14. Cancer Research UK (2005) CancerStats: Cancer survival and deprivation statistics. Cancer Research UK: London.
15. Davis K, Stremikis K, Squires D, Schoen C (2014) ‘Mirror, mirror on the wall - How the performance of the U.S. healthcare system compares internationally’, Commonwealth Fund: New York. (Available at: http://tinyurl.com/pacv7o5).
16. Diabetes UK (2009) ‘Prescription charges review - Full written evidence from Diabetes UK’, Diabetes UK: London. (Available at: http://tinyurl.com/q8uyofa)
17. Diabetes UK (2012) ‘The care you should receive’, Diabetes UK: London. (Available at: http://tinyurl.com/3c3d7hk
18. Dispensing Doctors’ Association (2014) ‘About dispensing practice – dispensing practice facts’ (Available at: http://tinyurl.com/lxun38l).
19. DoH (1999) ‘Faster access to modern treatment’, Department of Health: London.
20. DoH (2010) ‘Equity and excellence: Liberating the NHS: The 2010 NHS white paper’, Department of Health: London. (Available at: http://tinyurl.com/mk4m6hd.
21. DoH (2012a) ‘Regulations under the Health Act 2009: Market entry by means of pharmaceutical needs assessments’, Department of Health: London. Available at: http://tinyurl.com/m768doq)
22. DoH (2012b) ‘Health and Social Care Act 2012: Fact sheets’ Department of Health: London. (Available at: http://tinyurl.com/pj3j4v3)
23. Doran T, Fullwood C, Gravelle H, Reeves D, Kontopantelis E, Hiroeh U, Roland M (2006) ‘Pay-for-performance programs in family practices in the United Kingdom’, N Engl j med; 355:375-84.
24. Doran T (2009) ‘Case study on an experiment in altering the system dynamic – The Quality and Outcomes Framework (QOF) initiative’ in: Whitehead M, Doran T, Exworthy M, Richards S, Matheson D (2009) ‘Final report of Task Group 7: Delivery systems and mechanisms for reducing inequalities in both social determinants and health outcomes’, Marmot Review of Health Inequalities in England Post-2010. (Available at: http://tinyurl.com/oxjruom)
25. Eijkenaar F, Emmert M, Scheppach, Schöffski O (2013) ‘Effects of pay for performance in health care: A systematic review of systematic reviews’, Health policy 110:115-30.
26. Fischer M (2013) ‘Improving consultations from the inside out’, Health Service Journal (online). (Available at: https://tinyurl.com/ohnucjl)
27. Goddard M, Gravelle H, Hole A, Marini G (2010) ‘Where did all the GPs go?: Increasing supply and geographical equity in England and Scotland’, J Health Serv Res Policy 1(15):28-35.
28. Goff C (2009) ‘Equality impact assessment - 18 weeks referral to treatment standard’, DoH Elective Care and Diagnostics Team. (Available at: http://tinyurl.com/pgalgus)
29. Gosden T, Forland F, Kristiansen I, Sutton M, Leese B, Giuffrida A Sergison M, Pedersen L (2001) ‘Impact of payment method on behaviour of primary care physicians: A systematic review’. J Health Serv Res Policy:6(1):44-55.

35
30. GPs at the Deep End (2009) ‘General practitioners at the deep end’, Final report of a special meeting held on 16 September 2009 at Erskine Bridge Hotel: Glasgow. (Available at: http://tinyurl.com/mbe43wk)
31. GPs at the Deep End (2013) ‘What can NHS Scotland do to prevent and reduce health inequalities? Proposals from General Practitioners at the Deep End’, General Practitioners at the Deep End: Glasgow. (Available at: http://tinyurl.com/ng6lyqd)
32. Gravelle H and Sutton M (2001) ‘Inequality in the geographical distribution of general practitioners in England and Wales 1974-1995’, J health serv res policy 6(1)6-13. (Available at: http://tinyurl.com/q9dw32l)
33. Hann M and Gravelle H (2004) ‘The maldistribution of general practitioners in England and Wales: 1974–2003’, British journal of general practice 54(509)894-98. (Available at: http://tinyurl.com/pro3gud)
34. Hart J (1971) ‘The health of coal mining communities’, Journal of the Royal College of General Practitioners 21:517-28.
35. Hawkins N, Scholes S, Bajekal M, Love H, O’Flaherty M, Raine R, Capewell S (2013) ‘The UK National Health Service: Delivering equitable treatment across the spectrum of coronary disease’, Circ cardiovasc qual outcomes 6:208-16. www.ncbi.nlm.nih.gov/pubmed/23481523
36. HSCIC (Health and Social Care Information Centre) (2013a) ‘Quality and Outcomes Framework Achievement, prevalence and exceptions data, 2012/13’, - Technical Annex.
37. HSCIC (Health and Social Care Information Centre) (2013b) ‘Prescriptions dispensed in the community’, Statistics for England - 2002-2012. (Available at: http://tinyurl.com/mgng5o8)
38. HSCIC (Health and Social Care Information Centre) (2013c) Mortality from causes considered amenable to health care. (Available at: http://tinyurl.com/bureapr)
39. HSCIC (Health and Social Care Information Centre) (2014) ‘General and personal medical services’, England 2003-13. (Available at: http://tinyurl.com/qcfkl8c)
40. Health Education England (2014) ‘/Workforce planning and information’. (Available at: http://tinyurl.com/lqngmge)
41. House of Commons Library (2012) ‘NHS funding and expenditure. House of Commons: London. (Available at: www.nhshistory.net/parlymoney.pdf)
42. Hunter D (2012) ‘NHS “reform” in England: Where is the public interest?’ BMJ 344:e2014. (Available at: http://www.bmj.com/content/344/bmj.e2014 )
43. Ipsos MORI (2013) The GP Patient Survey 2011-2012. Ipsos MORI and NHS England: London. (Available at: www.gp-patient.co.uk)
44. The King’s Fund (2014) ‘The new NHS: clinical commissioning groups’. The King’s Fund: London. (Available at: ttp://tinyurl.com/kun5msz)
45. Langdown C and Peckham S (2013) ‘The use of financial incentives to help improve health outcomes: Is the quality and outcomes framework fit for purpose? A systematic review’, Journal of public health 36(2):251-58. (Available at: http://tinyurl.com/nrjzzdk)
46. Loewenson R and Simpson S (2014) ‘Framework for analysis of primary care contexts, systems and models and their adaptation’, Training and Research Support Centre: Harare.
47. McKee M (2012) ‘Does anyone understand the government’s plan for the NHS?’ BMJ 344:e399. (Available at: http://tinyurl.com/nhoj37d)
48. McLeod M (2013) ‘Healthwatch – guidance for the voluntary and community sector’, Voluntary Sector North West: Manchester. (Available at: http://tinyurl.com/ond8olp)
49. Millett C, Bottle A, Ng A, Curcin V, Molokhia M, Saxena S, Mejeed A (2009) ‘Pay for performance and the quality of diabetes management in individuals with and without co-morbid medical conditions’, Journal of the royal society of medicine 102:369–77.
50. NatCen (2013) ‘British Social Attitudes Survey 30’, NatCen Social Research: London. (Available at: www.bsa-30.natcen.ac.uk)
51. The National Recruitment Office for GPs (2012a) ‘GP specialty training programmes to start in 2014’.,The National Recruitment Office for GP Training: Birmingham. (Available at. http://tinyurl.com/l837jsk)
52. The National Recruitment Office for GPs (2012b) ‘Research and evaluation of the GP selection system’, The National Recruitment Office for GP Training: Birmingham. (Available at: http://tinyurl.com/ou44ajf)
53. The National Recruitment Office for GPs (2013) ‘GP recruitment facts and figures’, The National Recruitment Office for GP Training: Birmingham.
54. Nwaneri C, Cooper H, Bowen-Jones D (2013) Mortality in type 2 diabetes mellitus: magnitude of the evidence from a systematic review and meta-analysis. The British Journal of Diabetes & Vascular Disease 13(4):192-207.)
55. National Health Service (NHS) (2013) ‘The NHS constitution belongs to us all’, Department of Health: London. (Available at: http://tinyurl.com/d2zubyk)
56. NHS (2014) Competition Ratios. NHS London, (Available at: http://tinyurl.com/oa8gxh7.
57. NHS Business Services Authority (2012) ‘Prescription prepayment certificates’. NHS: London. (Available at: www.nhsbsa.nhs.uk/1127.aspx)
58. NHS Business Services Authority (2014) ‘Medical exemption certificates’. NHS: London. (Available at: www.nhsbsa.nhs.uk/1126.aspx).
59. NHS Careers (2014) ‘Run-through, specialty and GP training’. NHS: London. (Available at: http://tinyurl.com/pjybplc)
60. NHS Choices (2011) ‘National services frameworks and strategies’. NHS: London. (Available at: http://tinyurl.com/l5n3cf3)
61. NHS Confederation (2014) ‘General Medical Services’. NHS: London. (Available at: www.nhsconfed.org/gms)
62. NHS Employers, British Medical Association, General Practitioners Committee, Pharmaceutical Services Negotiating Committee (2012) The GP Practice – a guide for community pharmacists and pharmacy staff. NHS Employers: London. (Available at http://tinyurl.com/mjwjc6s).
63. NHS Employers (2013) ‘GMS Finance. NHS Employers: London. (Available at: http://tinyurl.com/mcsw7ar)
64. NHS Employers (2014a) ‘General medical services’. NHS Employers: London. (Available at: http://tinyurl.com/prf8da8)
65. NHS Employers (2014b) Enhanced Services 2013/14. NHS Employers: London. (Available at: http://tinyurl.com/msnypye)
66. NHS England (2013) National Institute for Health and Care Excellence (NICE). NHS: London. (Available at: www.nhs.uk/NHSEngland/thenhs/healthregulators/Pages/nice.aspx)
67. NHS England (2014) ‘Consultant-led referral to treatment waiting times data 2014-15. NHS: London. (Available at: http://tinyurl.com/q57mrvk)
68. NICE (2005) ‘A guide to NICE’. National Institute for health and Clinical Excellence: London (Available at: www.nice.org.uk/nicemedia/pdf/NewguidetoNICEApril2005.pdf.
36
69. NICE (2011) ‘NICE Pathways – diabetes’. National Institute for health and Clinical Excellence: London. (Available at: http://pathways.nice.org.uk/pathways/diabetes).
70. NICE (2013) ‘About NICE’. National Institute for health and Clinical Excellence: London www.nice.org.uk/aboutnice/about_nice.jsp.
71. NICE (2014) ‘About the Quality and Outcomes Framework (QOF)’. National Institute for health and Clinical Excellence: London (Available at: www.nice.org.uk)
72. Nolte E and McKee (2011) ‘Variations in amenable mortality – Trends in 16 high-income nations’, Health policy 103(2011):47-52. (Available at: http://tinyurl.com/mzq9qfm)
73. OECD (2013) ‘Health at a glance 2013: OECD Indicators’, OECD Publishing: Paris. http://dx.doi.org/10.1787/health_glance-2013-en.
74. ONS (2012) ‘Attribution data set GP-registered populations scaled to ONS population estimates – 2011’, Office for National Statistics: London. (Available at: www.hscic.gov.uk/pubs/gpregpop11)
75. ONS (2014) ‘Life expectancies’, Office for National Statistics: London. (Available at: http://tinyurl.com/m6fvhup)
76. Pollard K (2012) ‘Private healthcare: Key facts’. Private Healthcare UK: Berkhamsted (Available at: http://tinyurl.com/pu78ond)
77. Pollock A and Price D (2011) ‘How the secretary of state for health proposes to abolish the NHS in England’, BMJ 342:800-03. (Available at: http://tinyurl.com/q698ejo).
78. Pollock A (2012) ‘NHS franchising: the toxic world of globalised healthcare is upon us. The Guardian. http://tinyurl.com/ksssc4z.
79. Pollock A, Macfarlane A, Godden S (2012a) ‘Dismantling the signposts to public health? NHS data under the Health and Social Care Act 2012’, BMJ 344:e2364. (Available at: http://tinyurl.com/mz397zt)
80. Pollock A, Price D, Roderick P (2012b) ‘Health and Social Care Bill 2011: A legal basis for charging and providing fewer health services to people in England’, BMJ 344:e1729. (Available at: http://tinyurl.com/7rm8gyy)
81. Pollock A, Price D, Roderick P, Treuherz T, McCoy D, McKee M, Reynolds L (2012c) ‘How the Health and Social Care Bill 2011 would end entitlement to comprehensive health care in England’, Lancet 379:387–9. (Available at: http://tinyurl.com/lt4bpzu).
82. Pollock A, Price D, Roderick P, Treuherz T (2012d) ‘A flawed bill with a hidden purpose’, Lancet 379:999. (Available at: http://tinyurl.com/l9gqdz3)
83. Rachet B, Woods L, Mitry M, Cooper N, Quinn M, Steward J, Brenner H, Esteve J, Sullivan R, Coleman M (2008) Cancer survival in England and Wales at the end of the 20th century. British Journal of Cancer 99:S2-S10.
84. Roberts S (2006) Turning the Corner: Improving Diabetes Care (2006). Department of Health:, London. (Available at: http://tinyurl.com/loe3c5l).
85. Roland M (2004) ‘Linking physicians’ pay to the quality of care - A major experiment in the United Kingdom’, N Engl J Med 351:1448-54)
86. Roland M, Guthrie B, Thome D (2012) ‘Primary medical care in the United Kingdom’, JABFM 25:S6-S11. (Available at: http://tinyurl.com/qjuex89)
87. Regional Voices (2013) ‘Influencing local commissioning for health and care - Guidance for the voluntary and community sector’, Regional Voices: Leeds. (Available at http://tinyurl.com/cuv44l9)
88. Sheldon T, Cullum N, Dawson D, Lankshear A, Lowson K, Watt I, West P, Wright D, Wright J (2004) ‘What’s the evidence that NICE guidance has been implemented?’ BMJ 329:999.
89. Smith H (2014) Harry’s Last Stand – How the world my generation built is falling down, and what we can do to save it. Icon Books: London. (Available at: http://tinyurl.com/op72by4)
90. Smith P (2008) ‘Resource allocation and purchasing in the health sector: The English experience’, Bulletin of the World Health Organisation 86(11):884-88. (Available at: http://tinyurl.com/p6epuhl.
91. Smith C, Smith J, Gribbin K, Challen K, Hubbard R (2008) ‘The impact of the 2004 NICE guidance and 2003 General Medical Services contract on COPD in primary care in the UK’, QJ Med 101:145-153.
92. Steel N and Willems S (2010) ‘Research learning from the UK quality and outcomes framework: A review of existing research’, Quality in primary care 18(2):117–25.
93. Starfield B, Shi L, Macinko J (2005) Contribution of primary care to health systems and health. Milbank Q; 83:457–502.
94. UK Government (2012) ‘The NHS bodies and local authorities (partnership arrangements, care trusts, public health and local healthwatch) Regulations 2012’. House of Commons: London. (Available at: http://tinyurl.com/aysbto4)
95. UK Government (2012a) ‘Part 9 of the National Health Service commissioning board and clinical commissioning groups Regulations. House of Commons: London. (Available at: http://tinyurl.com/pkf3osv)
96. Wathen B and Dean T (2004) ‘An evaluation of the impact of NICE guidance on GP prescribing’, BJGP 54:103-07.
97. Watt G (2002) ‘The inverse care law today’, Lancet 360:252-54. (Available at: http://tinyurl.com/ked86nm)
98. Watt G (2012) General Practitioners at the Deep End. The experience and views of general practitioners working in the most severely deprived areas of Scotland. Occasional Paper 89. Royal College of General Practitioners: London.
99. Walshe K (2010) ‘Reorganisation of the NHS in England’, BMJ 341:c3843. http://tinyurl.com/p4n67x9.
100. Walshe K (2012) ‘Lansley’s legacy: How not to do health reform’, BMJ 345:e6109. (Available at: http://tinyurl.com/pwdaq8o)
101. Whitehead M (1988) National health success, Association of Community Health Councils for England and Wales: London.
102. Whitehead M (1994) ‘Who cares about equity in the NHS?’ BMJ 308:1284-87. (Available at http://tinyurl.com/q8fhem4)
103. Whitehead M, Hanratty B, Popay J (2010) ‘NHS reform: Untried remedies for misdiagnosed problems?’ Lancet 376:1373-75. (Available at http://tinyurl.com/nmg3zvp)
104. Whitehead M, Doran T, Exworthy M, Richards S, Matheson D (2009) ‘Final report of Task Group 7: Delivery systems and mechanisms for reducing inequalities in both social determinants and health outcomes’, Marmot review of health inequalities in England Post-2010. (Available at http://tinyurl.com/oxjruom)

37
AppendicesAppendix A1. Example of PC services available to registered patientsTable A1 outlines a real example of the PC services available to registered patients of a fairly typical group general practice (North West of England), 2014.
Table A1 – Example of PC services available to registered patients
Practice staff and patients:
• GP partners: 6 (4 wte)
• Salaried GPs: 4 (2 wte)
• Nursing team: 3 senior practice nurses; 1 staff nurse; 2 healthcare assistants
• Practice manager and administrative staff (all employed by the general practice).
• Other NHS staff working from health centre (but not employed by the general practice): district nurses; health visitors, community midwives
• Registered patients: 7,500
Services Services normally provided byMedical consultations: personal, telephone and, occasionally home visits, prescribing, minor surgery (from some specifically trained GPs only).
GPs.
Practice nurse consultations: all childhood immunisations (delivery of national system); cervical cancer screening (delivery of national system); flu/pneumonia vaccination (delivery of national scheme for all patients classed as at higher risk); minor nursing procedures; health checks (national scheme).
Nursing team.
Phlebotomy: diagnostic and monitoring blood tests. Nursing team or other NHS staff (phlebotomists).District nursing services: for treatment in the patient’s home, arranged through the GP.
Other NHS staff (district nurses).
Chronic disease clinics: asthma and COPD, patients invited to attend at least annually.
Nursing team, with GP and other NHS staff involvement as appropriate.
Diabetes clinic: patients invited to attend every 6 months routinely.
Nursing team, with GP and other NHS staff involvement as appropriate.
Cardiovascular clinic: patients who have had a heart attack of stroke or angina invited to attend at least annually.
Nursing team, with GP and other NHS staff involvement as appropriate.
Family planning clinic: twice weekly Nursing team, GPs.Maternity: shared care plan between GPs and hospital midwives. Community midwives hold clinics in the health centre weekly.
Other NHS staff (midwives).
Health and welfare of babies and young children: health visitors offer advice to every new mother and their child in the practice and run the Child Development Clinics at the health centre.
Other NHS staff (health visitors).
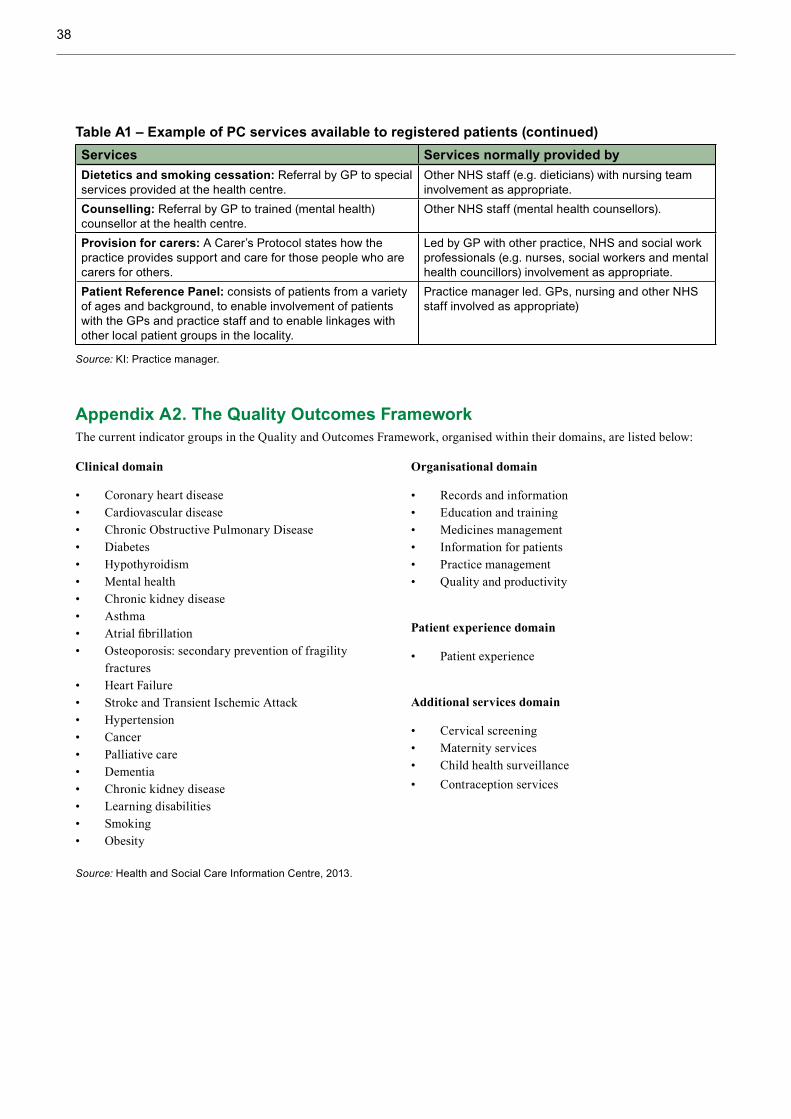
38
Services Services normally provided byDietetics and smoking cessation: Referral by GP to special services provided at the health centre.
Other NHS staff (e.g. dieticians) with nursing team involvement as appropriate.
Counselling: Referral by GP to trained (mental health) counsellor at the health centre.
Other NHS staff (mental health counsellors).
Provision for carers: A Carer’s Protocol states how the practice provides support and care for those people who are carers for others.
Led by GP with other practice, NHS and social work professionals (e.g. nurses, social workers and mental health councillors) involvement as appropriate.
Patient Reference Panel: consists of patients from a variety of ages and background, to enable involvement of patients with the GPs and practice staff and to enable linkages with other local patient groups in the locality.
Practice manager led. GPs, nursing and other NHS staff involved as appropriate)
Source: KI: Practice manager.
Appendix A2. The Quality Outcomes FrameworkThe current indicator groups in the Quality and Outcomes Framework, organised within their domains, are listed below:
Source: Health and Social Care Information Centre, 2013.
Table A1 – Example of PC services available to registered patients (continued)
Clinical domain
• Coronary heart disease• Cardiovascular disease• Chronic Obstructive Pulmonary Disease• Diabetes• Hypothyroidism• Mental health• Chronic kidney disease• Asthma• Atrial fibrillation• Osteoporosis: secondary prevention of fragility
fractures• Heart Failure• Stroke and Transient Ischemic Attack• Hypertension• Cancer• Palliative care• Dementia• Chronic kidney disease• Learning disabilities• Smoking• Obesity
Organisational domain
• Records and information• Education and training• Medicines management• Information for patients• Practice management• Quality and productivity
Patient experience domain
• Patient experience
Additional services domain
• Cervical screening• Maternity services• Child health surveillance• Contraception services

39
As an example, the QOF indicators, points and achievement thresholds for Diabetes Mellitus are shown in Table A2
Table A2 QOF Diabetes mellitus (DM) indicators
Indicator Points Achievement thresholds
RecordsDM017. The contractor establishes and maintains a register of all patients aged 17+ yrs with diabetes mellitus, with the type of diabetes if diagnosis has been confirmed
0-6
Ongoing managementDM002. % patients with diabetes, on the register, in whom the last blood pressure reading (measured in the preceding 12 months) is 150/90 mmHg or less
0-8 53-93%
DM003. % patients with diabetes, on the register, in whom the last blood pressure reading (measured in the preceding 12 months) is 140/80 mmHg or less
0-10 38-78%
DM004. % patients with diabetes, on the register, whose last measured total cholesterol (measured within the preceding 12 months) is 5 mmol/l or less
0-6 40-75%
DM006. % patients with diabetes, on the register, with a diagnosis of nephropathy (clinical proteinuria) or micro-albuminuria currently treated with an ACE-I (or ARBs)
0-3 57-97%
DM007. % patients with diabetes, on the register, in whom the last IFCC-HbA1c is 59 mmol/mol or less in the preceding 12 months NICE 2010 menu
0-17 35-75%
DM008. % patients with diabetes, on the register, in whom the last IFCC-HbA1c is 64 mmol/mol or less in the preceding 12 months
0-8 43-83%
DM009. % patients with diabetes, on the register, in whom the last IFCC-HbA1c is 75 mmol/mol or less in the preceding 12 months
0-10 52-92%
DM012. % patients with diabetes, on the register, with record of a foot examination and risk classification: 1) low risk (normal sensation, palpable pulses), 2) increased risk (neuropathy or absent pulses), 3) high risk (neuropathy or absent pulses plus deformity or skin changes in previous ulcer) or 4) ulcerated foot in past 12 mths
0-4 50-90%
DM014. % patients newly diagnosed with diabetes, on the register, in the preceding 1 April to 31 March who have a record of being referred to a structured education programme within 9 mths after entry on to the diabetes register
0-11 40-90%
DM018. % patients with diabetes, on the register, who have had influenza immunisation in the preceding 1 August to 31 March
0-3 99-95%
Source: BMA, 2014.
Appendix A3. A patient participation group/patient reference panelAn example practice identified for this study already had a face-to-face patient reference group (PRG) before additional funding from the Enhanced Services element of the (GMS or PMS) medical services contract was available. They currently use three approaches to participation and feedback from patients.
i. Active promotion of a face-to-face patient participation group through adverts in the practice waiting room and using Facebook and Twitter, but uptake is low and membership is limited to about 10 core patients:… that’s not really representative of our practice at all (KI: practice manager). Meetings are organised and delivered by one member of staff. Other members
of the practice team and CCG staff participate when meetings are likely to inform their work or members request input on specific matters.
ii. Conducting virtual surveys (an Enhanced Service) to reach a wider group of patients, and to allow anonymous feedback. … that’s much more representative and it’s anonymous as well, so you do get some real frank feedback that you probably wouldn’t get in a face-to-face meeting, which is useful (KI: practice manager). Participants are invited to participate in online surveys through text messages that are sent to all patients who have mobile phones. The face-to-face group help to design the online surveys. The survey tool captures some information on representativeness in terms of the age, sex and ethnicity of participants.
40
iii. They also capture the views of one of their three key population groups through one of their specialist nurses who “links into” a (group specific) local charities through regular “peer group” meetings. The potential benefits to the patients and to the practice include: … it saves on time doesn’t it, because if we set up a service that isn’t used, or a patient thinks it’s a complete waste of time, then that’s a method that we don’t need to do, if we get it right first-time that’s brilliant really (KI: practice manager).
Changes to funding arrangements later in 2014 may have an impact on the money that is available to practices for PRG enhanced services (by diverting resources to a new Friends and Family Test/questionnaire). However, this practice seems determined to continue using their current approach: I’m not sure that’s going to stop us… we’ve had the face-to-face PRG group for about 8 years or more and that was way before the PRG [funding] came along. So I don’t think… the reduction is going to have an impact on that and we actually find the texts and asking patients to fill in the survey monkey really useful. We get loads of really rich feedback there so that’s something that… we don’t do because we get funding for it, we do that because we want to be on the mark in regards to what services patients will access and how we design them. We’re only going to be a successful practice if we design services that our patients will use. So that’s for us as practice to benefit from to be honest (KI: practice manager).
Appendix A4. An example of practice health championsThis is an anonymised example of a non-state organisation, the ‘Health Champion Group’. It was established in 2008 with the aim of recruiting, engaging, training and supporting local people as health champions to work with others in their communities to improve health and wellbeing. The group received around £7 million ($12 million) of funding from the Big Lottery Health and Wellbeing fund to deliver flagship projects in the north of England over five years. They initially worked with a University to develop an evidence based community health champion model and an evidence summary of the value of community health champions. By the end of the project in 2013 they had recruited over 17,000 champions to deliver health initiatives to over 100,000 people. They originally started by working in 3 general practices within 3 former PCTs in a northern city to establish prototypes. The Group now work with 13 CCGs with practice health champions embedded in, delivered and paid for by general practices (KI: Health Champion Group). In 2013 they received a second stage of Big Lottery Health and Wellbeing funding money to develop their champion model in new 6 new locations and to engage and train local people to become Practice Health Champions, Youth
Health Champions and Pregnancy and Early Parenthood Champions.
The Group worked with linguistic analysts to produce simple effective invitations for local people to participate and work with general practice staff as peers or equals to improve local health and wellbeing. They sent personalised text and email messages seeking participation and put up simple notices in practices that stood out from corporate/glossy posters and asked people to either talk to named receptionists or call named individuals (KI: Health Champion Group). They also went to where people are [including] school gates, community centres, cafes, and within practices and got practice staff such as receptionists to invite people directly. The initial/induction meetings were used to develop build relationships/teams, motivate and develop capacity – find out what people are interested in, to get to know people and simple work on ‘what is health, what are the determinants of health and what are inequalities in health? (KI: Health Champion Group). This included information on their local areas in comparison to other areas to draw attention to local level inequalities/issues. They report participation from “a truly diverse group of people” including a broad and locally representative range of socioeconomic, ethnic and age groups. Key ways of getting a broad group of people involved include:
• Inviting … people to work as peers or equals, paying particular attention to language, which is really important.
• They work with fun and excitement and lots of good cake… not [formal] agendas, chairs, note takers… and that’s what keeps people coming back and keeps people connected.
• They apply the things that work in their personal lives; they don’t leave their humanity in the car when they come to work (KI: Health Champion Group).
Health Champion Group then arrange a whole practice meeting with community health champions and practice staff (GPs, nurses, receptionists, practice managers) with the aims of:
• Establishing a group approach: how we are going to be together and come up with a contract about how they will work together. They resist talking about what they will do at first.
• Establishing what’s important to us (why are we in the room today, what brought us to this place, what really matters to us).

41
• Starting to identify overlaps/commonalities between practice staff and the community health champions, and then work out what they are going to do together (KI: Health Champion Group).
Their work varies across practices/localities, with practice champions and practice staff co-producing priorities for their local practice and developing different ways of working and providing new solutions together. They focus on what’s needed and what people are passionate about in the community – people need to be able to choose – they have no energy when they are told what to do and they are chasing other peoples’ priorities (KI: Health Champion Group).
Health Champion Group support the champions for at least a year to work with the practice: what works well is about a one hour meeting every fortnight with the champions, the practice manager and the [Health Champion Group] project leads – and that’s where the work happens. They need to have the practice involved so that the champions aren’t developing something that the practice doesn’t want. In the bigger practices they may get 2 or 3 staff involved in these meetings (KI: Health Champion Group). During the support meetings they model how they work with citizens and manage other volunteers. The … things that they do together are remarkable, in terms of the outcomes, they’ve seen service improvements, quality improvements, service redesign and they are really interested in commissioning improvements (KI: Health Champion Group).
The key informant gave an example of: Champions in every one of a CCG’s practices – so champions in 44 practices, so with a minimum of only 20 in each practice that’s 880 people – so you’ve got a commissioning voice, an authorising environment, a place to legitimatise commissioning decisions. The people who are there [the practice health champions] are not lobbyists – there because they just want better services for people with diabetes or because they are parents of children with special needs – they are a really, really diverse range of ordinary citizens, and there’s lots of them. So it’s really different proposition what’s been used in the past (KI: Health Champion Group).
Fischer (2013 no page number) identifies examples of their work and its impacts as: a social group for young mothers, setting up a support group for people with chronic obstructive pulmonary disease, and speaking to patients in local communities and in the surgery waiting rooms to improve the uptake of immunisations and screening. They are also beginning to explain to other patients how to make best use of the practice, including how to use the Appointment Guide, thereby improving access for those whose first language is not English. By providing support to patients before the consultation, and a new range
of options for patients after the consultation, Practice Health Champions are beginning to be treated as peers by the practice staff and have shown themselves to be a key contributor to NHS improvement that grows outward from the [GP] consultation and its context. Their local understanding may help to overcome problems relating to health literacy and representative engagement in deprived communities. They bring culturally specific, local networks, knowledge and experience (that health professionals may lack) together with the healthcare knowledge and resources of the practice (that the champions may lack) and together they can produce something that they could not do before… it’s about mobilising the resources in the community and within the practice (KI: Health Champion Group).
Appendix A5: Type 2 Diabetes in UKType 2 diabetes mellitus is a common form of diabetes that 90% of all diabetics in the UK have (Diabetes UK, 2010). Certain individuals are believed to have a genetic susceptibility to Type 2 diabetes, although it’s preventable in most cases. Poor diet, lack of exercise and increasing age reduce the pancreases efficiency in producing insulin and the body’s fat, liver and muscle cells efficiency in utilising it to produce energy (Medline Plus, 2013). It is generally treated through diet, exercise and tablets (for more serious cases) designed to increase the body’s efficiency in utilising insulin. In the UK, there is a greater prevalence of diabetes amongst males in all age groups ≥35 years of age. Prevalence rates increase with age from less than 1% in 16 to 24 year old up to 15.7% for males and 10.4% for females for the age group 65 to 74, after which they decrease for males as the result of higher mortality rates relative to the general population.
There are a range of serious complications and co-morbidities associated with diabetes that include heart disease, eye disease, kidney disease, nerve damage and depression. People with diabetes are twice as likely to be admitted to hospital compared to the general UK population (Diabetes UK, 2009). Diabetes is associated with higher mortality rates. For example, in a systematic review Nwaneri et al (2013) found 33 studies that reported increased mortality risks for people with Type 2 diabetes. In their meta-analysis, type 2 diabetes was associated with an 85% increased risk of mortality in comparison with non-diabetics (all-cause mortality RR = 1.85, 95% CI 1.79-1.92). 11.6% of deaths of 20 to 79 year olds in England are related to diabetes (Diabetes UK, 2010). Life expectancies of people with diabetes are reduced on average by over 15 years for Type 1 and between 5 and 7 years for Type 2 diabetics (Roberts, 2006).
The costs associated with diabetes are considerable. For the financial year 2010/2011 Hex et al (2012) estimated the direct costs to the health service in the UK (for diagnosis, treatment/

42
management, lifestyle interventions, and complications) of Type 1 and Type 2 diabetes at £9.8/$16.68 billion (£1/$1.7 billion for Type 1 diabetes and £8.8/$14.98 billion for Type 2 diabetes and this represented approximately 10% of total health resource expenditure. They predicted this could rise to approximately 17% of health resource expenditure in 2035/2036. Diabetes related complications increase NHS costs more than fivefold (Diabetes UK, 2009).
There is strong evidence of associations between socioeconomic status and type 2 diabetes. For example, The Whitehall II prospective cohort study of (n=7237) adults without diabetes at baseline found, over a follow-up of 14.2 years, that participants in the lowest occupational category had an 86% increased risk of developing diabetes compared to those in the highest occupational category (OR = 1.86, 95% CI = 1.48 to 2.32). In a systematic review, Agardh et al (2011) found relationships between multiple measures of socioeconomic status and incidence of Type 2 diabetes. In a comparison with high levels (reference group RR = 1.0), they found that low educational level [relative risk (RR) = 1.41, 95% CI: 1.28-1.51, P<0.001], low income level (RR= 1.40, 95% CI: 1.04-1.88, P=0.002) and low occupational status (RR =1.31, 95% CI: 1.09-1.57, P<0.02) were associated with increased risk of Type 2 diabetes.
Standards of care for diabetes were originally established by the diabetes National Service Framework (NSF) in 2001 with
the aims of developing a patient centred service, improving health outcomes for people with diabetes, raising the quality of services and reducing inequalities (NHS Choices, 2011). In 2011 NICE produced new Quality Standards for Diabetes to support the NSF (See: http://guidance.nice.org.uk/QS6). They contain quality standards for key areas of care such as: structured education; nutritional and physical activity advice; care planning; glycaemic control; medication and insulin therapy. The quality standards are publicly available and have an intended audience of commissioners, service providers, healthcare professionals and people with diabetes/carers; this allows people with diabetes, carers and other interested bodies to measure the care an individual receives against the standards. NICE also provides a pathway for diabetes. The pathway, part of which is illustrated in Figure A1 is supported by publicly available, evidenced based clinical guidance on prevention (of type 2) and management of diabetes and related complications (such as http://tinyurl.com/kx24jnw). NICE guidance recommends that all people with Type 1 and 2 diabetes are screened for retinopathy on diagnosis and annually thereafter. The NSF for diabetes introduced a national screening programme based on digital retinal photography. Local opticians are private businesses who also receive funding from the NHS for screening and for free sight tests to certain groups (see: http://tinyurl.com/kn8g4xb).
Figure A1. Illustration of NICE Pathway for diabetes
Source: Author adapted from NICE (2011)
Diabetes
Preventing type 2pathway
Managing type 1 Managing type 2
Foot care for people with diabetes

43
Appendix A6. Ranking of health system performance in high income countriesTable A6 Overall ranking of health system performance in 11 high-income countries
AUS CAN FRA GER NETH NZ NOR SWE SWIZ UK USA
OVERALL RANKING (2013) 4 10 9 5 5 7 7 3 2 1 11
Quality Care 2 9 8 7 5 4 11 10 3 1 5
E�ective Care 4 7 9 6 5 2 11 10 8 1 3
Safe Care 3 10 2 6 7 9 11 5 4 1 7
Coordinated Care 4 8 9 10 5 2 7 11 3 1 6
Patient-Centered Care
5 8 10 7 3 6 11 9 2 1 4
Access 8 9 11 2 4 7 6 4 2 1 9
Cost-Related Problem 9 5 10 4 8 6 3 1 7 1 11
Timeliness of Care 6 11 10 4 2 7 8 9 1 3 5
4 10 8 9 7 3 4 2 6 1 11
Equity 5 9 7 4 8 10 6 1 2 2 11
Healthy Lives
4 8 1 7 5 9 6 2 3 10 11
Health Expenditures/Capita, 2011** $3,800 $4,522 $4,1 18 $4,495 $5,099 $3,182 $5,669 $3,925 $5,643 $3,405 $8,508
COUNTRY RANKINGS
Top 2*
Middle
Bottom 2*
Efficiency
Notes: * Includes ties. ** Expenditures shown in $US PPP (purchasing power parity); Australian $ data are from 2010. Source: Reproduced with permission from the Commonwealth Fund from Exhibit ES-1. OVERALL RANKING.in Davis et al, (2014) Mirror, Mirror On The Wall. How the Performance of the U.S. Health Care System Compares Internationally © The Commonwealth Fund, 2014.
Appendix A7 Delivery of PC in the most deprived areasA7.1 GPs at the Deep End
During their first 15 meetings (2009 to 2011) GPs at the Deep End prepared the following reports:
1. General practitioners at the deep end
2. Coping with needs, demands and resources
3. The GP role in working with vulnerable families
4. Experience and views of Keep Well and ASSIGN
5. Single-handed general practice
6. Patient encounters in very deprived areas: what can be achieved?
7. General practitioner training in very deprived areas
8. Social prescribing
9. Learning journeys
10. Care of elderly patients
11. Alcohol problems in adults under 40
12. Working together for vulnerable children and families
13. The Access Toolkit: views of Deep End GPs
14. Reviewing progress in 2010 and plans for 2011
15. Palliative care in the deep end
The issues faced by the Deep End practices in Scotland and their proposals for solutions are outlined in Section 4.4, noting that the proposals are intended to be applied together as a demonstration of integrated care for patients with multimorbidity, an antidote to health service fragmentation and a model for NHS Scotland in the future (GPs at the Deep End 2013:3).
44
A7.2 Further information on general practice services to homeless peopleWhile the practice’s work with homeless people, one of three main population groups served by the practice, is not economically viable in terms of the direct funding it brings into the practice, they describe other benefits and the importance of the work to the practice: … now we’re funded about £90,000 a year, obviously… we’re able to invest in our team and provide lots more of these services, but it’s never really to be honest been about the money it’s been about the ethos of the practice and that’s definitely just comes from a special interest… (KI: Practice Manager).
… from a financial point of view it’s not economically viable to do that, but from a practice ethos point of view the practice has always been interested in this vulnerable group of patients… and we think it probably helps us to recruit really excellent clinical staff because our populations [are] so diverse so you don’t know what’s going to walk through the door, and that’s exciting to the clinic team… and these patients deserve the same as you or I deserve… so that’s why were interested in it. (KI: Practice Manager).
The waiting room mentor’s work benefits both the patients and the practice:
…he has numerous roles, one… that is really valuable is the waiting room manager. So on a Thursday afternoon… there can be a fight in the waiting room… there can be all kinds going on and he’s just very good at calming situations down, splitting situations up and actively managing what’s going on really and… in a non-police like way. So… in the past we’ve had to call security or we’ve had to call the police because we’re not set up to manage that kind of chaos and… he manages that in a supportive way… after he’s spoken to them they know they are not allowed to fight in the waiting room. …he manages that situation often just splits groups of patients up to be honest, generally just fighting with each other he will split them up and then link in with them at a different time and find out what’s going on, if there’s any support [required] (KI: Practice Manager).
The specialist nurses, employed and specialising in hepatitis C and in alcohol abuse have made care, normally only available in a hospital setting, more accessible contributing to improved diagnosis, treatment and prevention of these conditions: …one of the services that we are really proud of is, there’s two… we employ a hepatitis C nurse within the practice who is now able to treat hep C patients in primary care. So we were the first practice… to do that and we have people presenting at conferences, won awards... We’re really proud of that, the reason that we do it is because patients won’t go into hospital so we thought we need to
bring the service to them… because this is a preventable disease and in primary [care], we’ve treated about 70 patients now over the 5 years we would never have engaged in hospital services. The other one is the alcohol outreach nurse so in [their area] we’ve got [a local alcohol] treatment service. But you have to go to the clinic to get access to the service and these patients don’t use that place [because]: it’s the bus fare; they don’t have the mobile phone to make an appointment - they don’t engage like that (KI: Practice Manager).
Specialist training is important part of the investment and has been done using innovative approaches: We invest a lot of time and effort in our team in training for this group of patients as well, so… once a year we’ll have… hot topics related to this, the last one we had at the [name of local venue] non-alcohol bar place we held it there and had like public health come in and we did alcohol training we had different services like [a substance missus recovery service] and different… [providers] come in and showcase their service to us and so our team aware of what services are out there that we can link these patients into (KI: Practice Manager).
In the past we’ve had… a drama group drama training provider [who] provided training on customer care training really on how to manage these different groups of patients and ‘how they are feeling and what did you think about that, how do you think so and so felt, how do you think that could have been done differently?’ So we invest heavily in that… (KI: Practice Manager).
In terms of costs and benefits to the wider NHS the homeless patients represented just 2.7% of the practice’s registered patients, but were accounting for 21% of emergency admissions and 34% of Ambulatory Care Sensitive admissions, with large costs to NHS primary and secondary care.
[ACS] Ambulatory Care Sensitive admissions are the measure that primary care have so its things like angina, asthma, cellulitis, COPD, CHD, convulsions, epilepsy, diabetes, ENT, flu and pneumonia and they’re conditions that you should manage effectively in primary care, so if your patients are admitted with one of those ACS conditions it’s a bit like a black mark against you. They think patients should be managed effectively before they get… admitted with those things but that’s one of the measures that the CCG have for practices, and in that same period with that same mix of patients 34% of them were homeless, so that’s the kind of resource they use… (KI: Practice Manager).
When the full costs and benefits to the NHS are considered, the provision of services to homeless people in PC may represent excellent value for money. (KI: Practice Manager).