Embed Size (px)
Citation preview
ASEAN – German Technical Cooperation
Clean Air for Smaller Cities in the ASEAN Region
Indonesia Country Profile:
Focus on Smaller Cities
Prepared by
Clean Air Initiative for Asian Cities (CAI-Asia) Center
July 2009
Indonesia Country Profile
CONTENTS
ABBREVIATIONS ............................................................................................................................................ 2
ACKNOWLEDGMENTS ................................................................................................................................... 3
1. INTRODUCTION ..................................................................................................................................... 4
2. STATE OF THE AIR ................................................................................................................................. 5
2.1 General Information ..................................................................................................................... 5
2.2 Sources of Air Pollution ................................................................................................................. 6
2.3 Status of Air Quality ...................................................................................................................... 7
2.4 Impacts of Air Pollution ............................................................................................................... 12
3. LEGAL FRAMEWORK FOR AIR QUALITY MANAGEMENT .................................................................... 14
3.1 Air Quality Management ............................................................................................................. 14
3.2 Clean Air Action Plans in Smaller Cities ...................................................................................... 23
4. STAKEHOLDERS ................................................................................................................................... 26
5. FINDINGS ............................................................................................................................................ 29
ANNEXES ..................................................................................................................................................... 30
About CAI-Asia
The Clean Air Initiative for Asian Cities (CAI-Asia) was established as a joint initiative by the Asian Development Bank, World
Bank, and the United States – Asia Environmental Partnership (a project of USAID) in 2001.
CAI-Asia promotes and demonstrates innovative ways to improve the air quality of Asian cities through sharing experiences and
building partnerships. Since 2007, this multi-stakeholder initiative is divided into
• The CAI-Asia Center, a regional, Philippine-based non-profit organization as the implementing arm of CAI-Asia
• The CAI-Asia Partnership, a United Nations Type II Partnership, with over 160 member organizations
• CAI-Asia Country Networks in China, India, Indonesia, Nepal, Pakistan, Philippines, Sri Lanka, and Viet Nam.
Indonesia Country Profile
2
ABBREVIATIONS
ADB Asian Development Bank
ADEKSI Indonesian Municipal Councils Association
ADKASI Association of Indonesian Regency Parliament
AEB Clean Emission Association
ADO Automotive Diesel Oil
ASEAN Association of Southeast Asian Nations
APBN State Revenue and Expenditure
APEKSI Indonesian Municipalities Association
APPSI Association for Provincial Government of Indonesia
AQMS Air Quality Monitoring network system
APKASI Indonesian Governmental Regencies Association
BAPPENAS National Development Planning Agency
BATAN National Atomic Board
BKMG Climatological, Meteorological and Geophysical Board
BRT Bus Rapid Transit
BTKL Environmental Health Laboratories
CAI-Asia Clean Air Initiative for Asian Cities
CDM Clean Development Mechanism
CFD Car Free Day
CH4 Methane
CO Carbon Monoxide
CO2 Carbon Dioxide
CNG Compressed natural gas
DAU General allocation fund
DAK Special allocation fund
DANIDA Danish International Development Agency
DKI Special Capital Region
DNA Designated National Agency
GDP Gross domestic product
EIA Environmental Impact Assessment
EST Environmentally sustainable transport
GPUB Generation for Clean Air
GTZ German Technical Cooperation
HC Hydrocarbons
IDR Indonesian Rupiah
I&M Inspection and Maintenance
ITB Bandung Institute of Technology
JICA Japan International Cooperation Agency
Komnas MPB National Commission for Clean Development Mechanism
LAPAN National Aeronautical Board
LPG Liquefied petroleum gas
μg/m3 microgram per cubic meter
MoE Ministry of Environment
MRT Mass rapid transit
NAAQS National Ambient Air Quality Standards
NAP National Action Plan
Indonesia Country Profile
3
ACKNOWLEDGMENTS
The Indonesia Country Profile was prepared with support from the ASEAN – German Technical Cooperation
Project on “Clean Air for Smaller Cities in the ASEAN Region.” The authors, Atty. Glynda Bathan of the Clean
Air Initiative for Asian Cities (CAI-Asia) Center and Dr. Dollaris Suhadi of Swisscontact Indonesia Foundation,
thank those who provided information, technical research support and advice for the Indonesia Country
Profile:
Mr. Ade Palguna, Assistant Deputy for Mobile Sources Pollution Control, Indonesia Ministry of Environment
Mr. Hari Wahyudi, Assistant Deputy for Manufacture Pollution Control, Indonesia Ministry of Environment
Mrs. Dr. Elly Sinaga, Director of Urban Transport System Development, Directorate General of Land Transportation,
Indonesia Ministry of Transport
Mayor Ir. H. Eddy Santana Pura, Mayor of Palembang City and Head of the Association of Indonesian Municipalities
Mrs. Halimah Syafrul, Head, Environmental Management Center (Pusarpedal), Indonesia Ministry of Environment
Mrs. Peni Susanti, Head of Environmental Board, Province of Jakarta
Mr. KMS. H. Abubakar, Head of Environment Agency, City of Palembang
Mrs. Hilda Zulkifli, Head of Urban Planning Development Board, City of Palembang
Mr. Togar Arifin Silaban, Head of Environmental Agency, City of Surabaya
Head of Environment Agency, City of Bandung
Head of Environment Agency, City of Semarang
Mrs. Purnama Dewi, Head of Environment Agency, City of Medan
Head of Environment Agency, City of Pekanbaru
Head of Environment Agency, City of Pontianak
Mr. Syahrial, Head of Air Laboratory, Environmental Agency, City of Pekanbaru
Mr. Dien Ranying, Head of Environment Agency, City of Palangkaraya
Mr. Dr. Esrom Hamonangan, Head, Division for Monitoring, Indonesia Ministry of Environment
Technical Team for Central and Regional Continuous Ambient Air Quality Monitoring Network, Pusarpedal, Indonesia
Ministry of Environment
Ms. Sri Parwati, Head of Division for Chemical Industry, Manufacture Pollution Control, Indonesia Ministry of
Environment
Ms. Linda Krisnawati, Head, Sub-Division for Alternative Fuel Development, Mobile Sources Pollution Control, Indonesia
Ministry of Environment
Ms. Fitri Harwati, Head of Sub-Division for Mobile Sources, Mobile Sources Pollution Control, Indonesia Ministry of
Environment
Mr. Andono Warih, Head of Environment Laboratory, Environmental Board, Province of Jakarta
Mrs. Indah Wahyutrimurindah, Subdivision Head of Laboratory, Environmental Agency, City of Semarang
Mrs. Ayu Sukenjah, Division Head of Environmental Rehabilitation, Environmental Agency, City of Bandung
Mr. Budi Chairudin, Manager, Environment and Infrastructure, Association of Indonesia Municipalities (APEKSI)
Mrs. Tri Utari, Manager, Advocacy, APEKSI
Mr. Ahmad Suhijriah, Assistant Manager, Capacity Building and Cooperation, APEKSI
Mr. Klaus Duenzkofer, Consultant, APEKSI
Mr. Bambang Trisulo, Chairman, Association of Indonesian Automotive Industries (Gaikindo)
Mr. Khoirunurrofik, Researcher, Institute for Economic and Social Research, Faculty of Economics, University of Indonesia
Mr. Andi Ikhwan, Senior Consultant, Regional economy and financial analysis
Mr. Ahmad Safrudin, Executive Director of Joint Committee for Lead Phase-out (KPBB)
Ms. Teresa W.Y. Fung, Air Quality Specialist, CAI-Asia Center
Ms. May Ajero, Air Quality Program Manager, CAI-Asia Center
Mr. Alvin Mejia, Air Quality Researcher, CAI-Asia Center
Ms. Mariana Nuradi Sam, Project Management Support, Swisscontact Indonesia Foundation
Ms. Gracia Emerentiana, Consultant, Swisscontact Indonesia Foundation
Mr. Roland Haas, Principal Advisor, ASEAN-German Technical Cooperation Project “Clean Air for Smaller Cities”
Ms. Napaporn Yuberk, Project Manager, ASEAN-German Technical Cooperation Project “Clean Air for Smaller Cities”
Ms. Dudsadee Munpakdee, Thailand Country Coordinator, ASEAN-German Technical Cooperation Project “Clean Air for
Smaller Cities”
Indonesia Country Profile
4
1. INTRODUCTION
Air pollution levels in the megacities of Asia show a stabilizing trend but still exceed World Health
Organization guidelines.1 Studies also show poor air quality, not only in the megacities of Asia, but also in
smaller cities with populations of 200,000 to 1.5 million. While megacities often receive support for
improving air quality; similar assistance seldom reaches smaller cities.2
Responding to the need to strengthen air quality management in smaller cities, the Association of Southeast
Asian Nations (ASEAN) – German Technical Cooperation Project on “Clean Air for Smaller Cities in the ASEAN
Region” is being implemented starting 2009. The Project aims to empower smaller cities to develop and
implement “Clean Air Action Plans” with stakeholder participation. In its initial phase, up to fourteen cities
with 200,000 to 1.5 million inhabitants in the ASEAN region will receive assistance. Preparation of country
profiles, national workshops to sensitize stakeholders on clean air issues, set up of a sustainable regional
training system, and conferences for dissemination of city experiences are among the project activities to
support action plan development and implementation.
Country Profiles focusing on smaller cities are being prepared for several ASEAN countries. These provide
background information and findings on:
• State of the Air (Chapter 2): What is the air quality in smaller cities? Which of the smaller cities in
the country are experiencing air pollution challenges or will soon enter into this situation?
• Legal framework for air quality management (Chapter 3): What is the air quality management
system in place in smaller cities? What is the legal framework for air quality management in the
country and in smaller cities? What power and resources are available to smaller cities to develop
and implement clean air action plans?
• Stakeholders (Chapter 4): Do stakeholders take an active part in air quality management for smaller
cities? How do smaller cities engage stakeholders in air quality management?
1 CAI-Asia Center. Air Quality in Asian Cities. 2008
2 CAI-Asia Center. Compendium of Air Quality Management and Sustainable Urban Transport Projects in Asia. 2007
Indonesia Country Profile
5
2. STATE OF THE AIR
Understanding the air pollution problem of a country requires an examination of its geography and climate,
the drivers (urbanization, industry and economy, energy, and transport), sources, status, and impacts of air
pollution. This Chapter provides an overview of the air pollution challenge in Indonesia.
2.1 General Information
Indonesia is considered the world’s largest archipelago with 17,504 islands of which 6,000 are inhabited. 3,4
With a land area of about 1.9 million square kilometers, Indonesia is slightly smaller than Mexico.5 Its largest
islands are: Kalimantan, Sumatra, Papua, Sulawesi, and Java. About fifty-eight percent of Indonesia’s
population lives on Java.6 The capital, Jakarta, is located in the northeast coast of Java island and covers
661.52 square kilometers.
The archipelago is almost entirely tropical in climate, with the coastal plains averaging 28°C, the inland and
mountain areas averaging 26°C, and the higher mountain regions, 23°C. The area’s relative humidity ranges
between 70–90%. There are extreme variations in rainfall linked with the monsoons: dry season (June to
September) and a rainy season (December to March). Prevailing wind patterns interact with local topographic
conditions to produce significant variations in rainfall throughout the archipelago with the western and
northern parts of Indonesia generally experiencing the most precipitation. The city of Bogor, near Jakarta,
lays claim to having the world’s highest number of rainstorms at 322 per year. The islands closest to Australia
and the eastern tip of Java tend to be dry.7
In 2008, it was estimated that Indonesia had about 228.5 million people.8 As of June 2005, there were at least
26 municipalities in Indonesia with a population of between 200,000 to 1.5 million.9 For purposes of this
Country Profile, the term “smaller cities” refers to cities with a population of 200,000 to 1.5 million.
Population densities of a sample of 22 cities range from 821 to 41,348 inhabitants per square kilometer;
Jakarta is the fifth most dense with 13,474 inhabitants per square kilometer in 2005 (Annex 1). In terms of
urbanization, Jakarta is considered fully urbanized. Forecasts show Lampung province will have the highest
rate of urbanization from the year 2000 to 2025 (Annex 2). In 2025, it is expected that a large percentage of
the population in the provinces of DI Yogyakarta (82.8%), Banten (81.5%), West Java (81.4%), and Bali (79.6%)
will be living in urban areas.10
Air quality would be most important to attain in the densest and most
populated cities and provinces of Indonesia.
3 Badan Pusat Statistik (BPS). Trends of the Selected Socio-Economic Indicators of Indonesia, 2008
4 Embassy of the Republic of Indonesia, Washington, D.C. 2008
5 UN Statistics Division. Demographic Statistics. http://data.un.org/Data.aspx?d=POP&f=tableCode%3a19#POP
6 BPS. Trends of the Selected Socio-Economic Indicators of Indonesia, 2008
7 CAI-Asia. Indonesia Country Synthesis Report on Urban Air Quality Management. 2006
8 BPS. Trends of the Selected Socio-Economic Indicators of Indonesia, 2008
9 City Population (citing Badan Pusat Statistik). http://www.citypopulation.de/Indonesia.html#Stadt_alpha
10 BPS, BAPPENAS, UNPF. Indonesia Population Projection 2000-2005. 2005
Indonesia Country Profile
6
Indonesia’s gross domestic product (GDP) grew by 6.32% from 2006 to 2007.11
The recently re-elected
President Yudhoyono set a target of 4 to 4.5% economic growth in 2009.12
The importance of the
manufacturing industry in Indonesia’s economy is evident from its contribution to GDP. In 2006, it
contributed 27.5% to GDP. Three other industries each contributed less than 20% to GDP in 2006 (Trade,
hotel and restaurants at 15%; Agriculture, livestock, forestry and fishery at 13%; and Mining and quarrying at
11%).13
Growth in the manufacturing and other industries must be balanced with the need for clean air in
Indonesia’s provinces and cities.
Indonesia ranked eleventh among the world’s major natural gas producing countries in 2006 and twenty-first
among crude oil producing countries in 2007. The main coal deposit is located in Sumatra (50.1%) and
Kalimantan (49.6%).14
In 2007, coal, crude oil and gas accounted for about 75% of primary energy supply in
Indonesia. Biomass, geothermal and hydro power accounted for the remaining energy production.15
In 2007, petroleum fuel and coal comprised a large part of Indonesia’s final energy consumption. In the final
energy mix, petroleum fuel amounted to 52.2%, followed by coal (including briquette) at 20.3%, gas at 13.3%,
electricity at 12.4% and LPG at 1.8%.16
In 2025, coal is expected to take 33% share of energy consumption, an
increase by 65% from the current share.17
The industry sector, the largest energy consumer, accounted for
44.8% followed by the transportation (31.1%), household (15.2%), commercial (4.6%), and other sectors
(4.3%) in 2007.18
Vehicle ownership in Indonesia is growing rapidly. In 1990, the total number of registered vehicles was 6
million, in 2007 this was 57 million, and in 2030 this is expected to reach 93 million. Two-wheelers are
growing fastest and are the largest in number.19
Passenger cars, buses, trucks and motorcycles are the main
types of transportation in Indonesia. The vehicle fleet is composed of 14.4% passenger cars, 3.1% buses, 7.7%
trucks and 74.8% motorcycles.20
The continued increase in motor vehicle use if unaccompanied by measures
to tighten vehicle emission standards, provide cleaner fuels, manage travel demand, and promote non-
motorized transport modes will adversely affect air quality.
2.2 Sources of Air Pollution
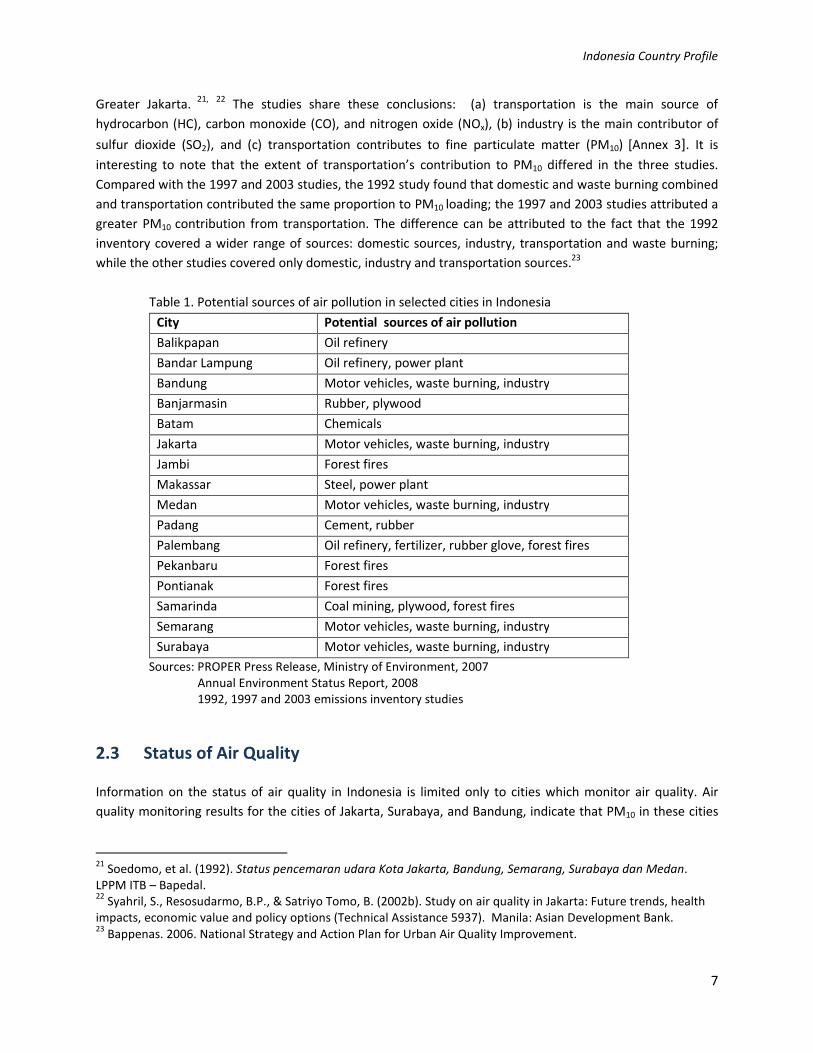
Potential air pollution sources differ for each province or city (Table 1). Very few cities in Indonesia have
conducted an emission inventory of air pollution sources. Jakarta is one of these cities; it has three emission
inventory studies (1992, 1997 and 2003) and will begin a new study this year. The 1992 study included the
cities of Jakarta, Surabaya, Medan, Bandung and Semarang while the 1997 and 2003 studies focused only on
11
Handbook of Energy and Economic Statistics of Indonesia 2008 12
Coordinating Ministry for Economic Affairs. http://www.ekon.go.id/content/view/453/1/ 13
BPS. Statistics Indonesia. http://www.bps.go.id/sector/nra/gdp/table4.shtml 14
Key indicator of Indonesia and Mineral Resources, 2008. http://www.esdm.go.id/publikasi/statistik.html 15
Handbook of Energy and Economic Statistics of Indonesia 2008 16
Key indicator of Indonesia and Mineral Resources, 2008. http://www.esdm.go.id/publikasi/statistik.html 17
Presidential Regulation No. 5/2006 concerning National Energy Policy 18
Handbook of Energy and Economic Statistics of Indonesia 2008 19
CAI-Asia. Indonesia Country Report 2008 20
BPS. Statistics Indonesia. http://www.bps.go.id/sector/transpor/land/yearly/table3.shtm
Indonesia Country Profile
7
Greater Jakarta. 21,
22
The studies share these conclusions: (a) transportation is the main source of
hydrocarbon (HC), carbon monoxide (CO), and nitrogen oxide (NOx), (b) industry is the main contributor of
sulfur dioxide (SO2), and (c) transportation contributes to fine particulate matter (PM10) [Annex 3]. It is
interesting to note that the extent of transportation’s contribution to PM10 differed in the three studies.
Compared with the 1997 and 2003 studies, the 1992 study found that domestic and waste burning combined
and transportation contributed the same proportion to PM10 loading; the 1997 and 2003 studies attributed a
greater PM10 contribution from transportation. The difference can be attributed to the fact that the 1992
inventory covered a wider range of sources: domestic sources, industry, transportation and waste burning;
while the other studies covered only domestic, industry and transportation sources.23
Table 1. Potential sources of air pollution in selected cities in Indonesia
City Potential sources of air pollution
Balikpapan Oil refinery
Bandar Lampung Oil refinery, power plant
Bandung Motor vehicles, waste burning, industry
Banjarmasin Rubber, plywood
Batam Chemicals
Jakarta Motor vehicles, waste burning, industry
Jambi Forest fires
Makassar Steel, power plant
Medan Motor vehicles, waste burning, industry
Padang Cement, rubber
Palembang Oil refinery, fertilizer, rubber glove, forest fires
Pekanbaru Forest fires
Pontianak Forest fires
Samarinda Coal mining, plywood, forest fires
Semarang Motor vehicles, waste burning, industry
Surabaya Motor vehicles, waste burning, industry
Sources: PROPER Press Release, Ministry of Environment, 2007
Annual Environment Status Report, 2008
1992, 1997 and 2003 emissions inventory studies
2.3 Status of Air Quality
Information on the status of air quality in Indonesia is limited only to cities which monitor air quality. Air
quality monitoring results for the cities of Jakarta, Surabaya, and Bandung, indicate that PM10 in these cities
21
Soedomo, et al. (1992). Status pencemaran udara Kota Jakarta, Bandung, Semarang, Surabaya dan Medan.
LPPM ITB – Bapedal. 22
Syahril, S., Resosudarmo, B.P., & Satriyo Tomo, B. (2002b). Study on air quality in Jakarta: Future trends, health
impacts, economic value and policy options (Technical Assistance 5937). Manila: Asian Development Bank. 23
Bappenas. 2006. National Strategy and Action Plan for Urban Air Quality Improvement.
Indonesia Country Profile
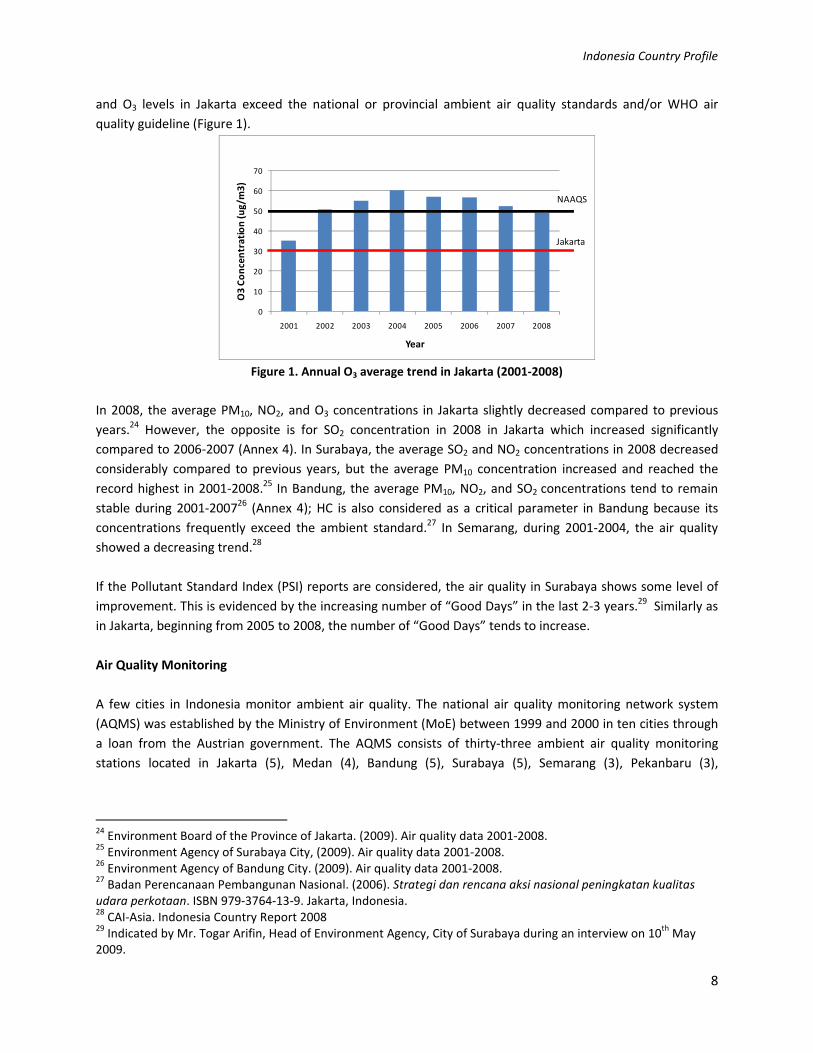
8
and O3 levels in Jakarta exceed the national or provincial ambient air quality standards and/or WHO air
quality guideline (Figure 1).
0
10
20
30
40
50
60
70
2001 2002 2003 2004 2005 2006 2007 2008
O3
Co
nce
ntr
ati
on
(u
g/m
3)
Year
NAAQS
Jakarta
Figure 1. Annual O3 average trend in Jakarta (2001-2008)
In 2008, the average PM10, NO2, and O3 concentrations in Jakarta slightly decreased compared to previous
years.24
However, the opposite is for SO2 concentration in 2008 in Jakarta which increased significantly
compared to 2006-2007 (Annex 4). In Surabaya, the average SO2 and NO2 concentrations in 2008 decreased
considerably compared to previous years, but the average PM10 concentration increased and reached the
record highest in 2001-2008.25
In Bandung, the average PM10, NO2, and SO2 concentrations tend to remain
stable during 2001-200726
(Annex 4); HC is also considered as a critical parameter in Bandung because its
concentrations frequently exceed the ambient standard.27
In Semarang, during 2001-2004, the air quality
showed a decreasing trend.28
If the Pollutant Standard Index (PSI) reports are considered, the air quality in Surabaya shows some level of
improvement. This is evidenced by the increasing number of “Good Days” in the last 2-3 years.29
Similarly as
in Jakarta, beginning from 2005 to 2008, the number of “Good Days” tends to increase.
Air Quality Monitoring
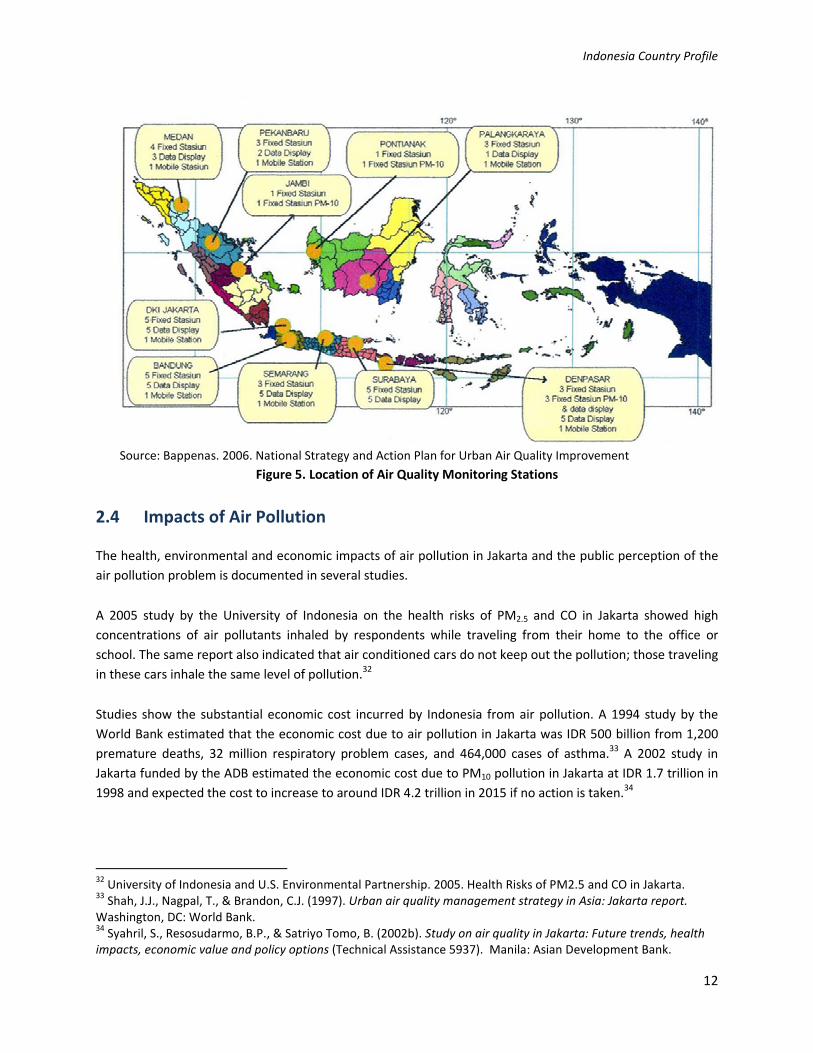
A few cities in Indonesia monitor ambient air quality. The national air quality monitoring network system
(AQMS) was established by the Ministry of Environment (MoE) between 1999 and 2000 in ten cities through
a loan from the Austrian government. The AQMS consists of thirty-three ambient air quality monitoring
stations located in Jakarta (5), Medan (4), Bandung (5), Surabaya (5), Semarang (3), Pekanbaru (3),
24
Environment Board of the Province of Jakarta. (2009). Air quality data 2001-2008. 25
Environment Agency of Surabaya City, (2009). Air quality data 2001-2008. 26
Environment Agency of Bandung City. (2009). Air quality data 2001-2008. 27
Badan Perencanaan Pembangunan Nasional. (2006). Strategi dan rencana aksi nasional peningkatan kualitas
udara perkotaan. ISBN 979-3764-13-9. Jakarta, Indonesia. 28
CAI-Asia. Indonesia Country Report 2008 29
Indicated by Mr. Togar Arifin, Head of Environment Agency, City of Surabaya during an interview on 10th
May
2009.
Indonesia Country Profile
9
Palangkaraya (3), Denpasar (3), Jambi (1) and Pontianak (1) (Figure 5). The system monitors CO, SO2, NOx,
O3, and PM10.
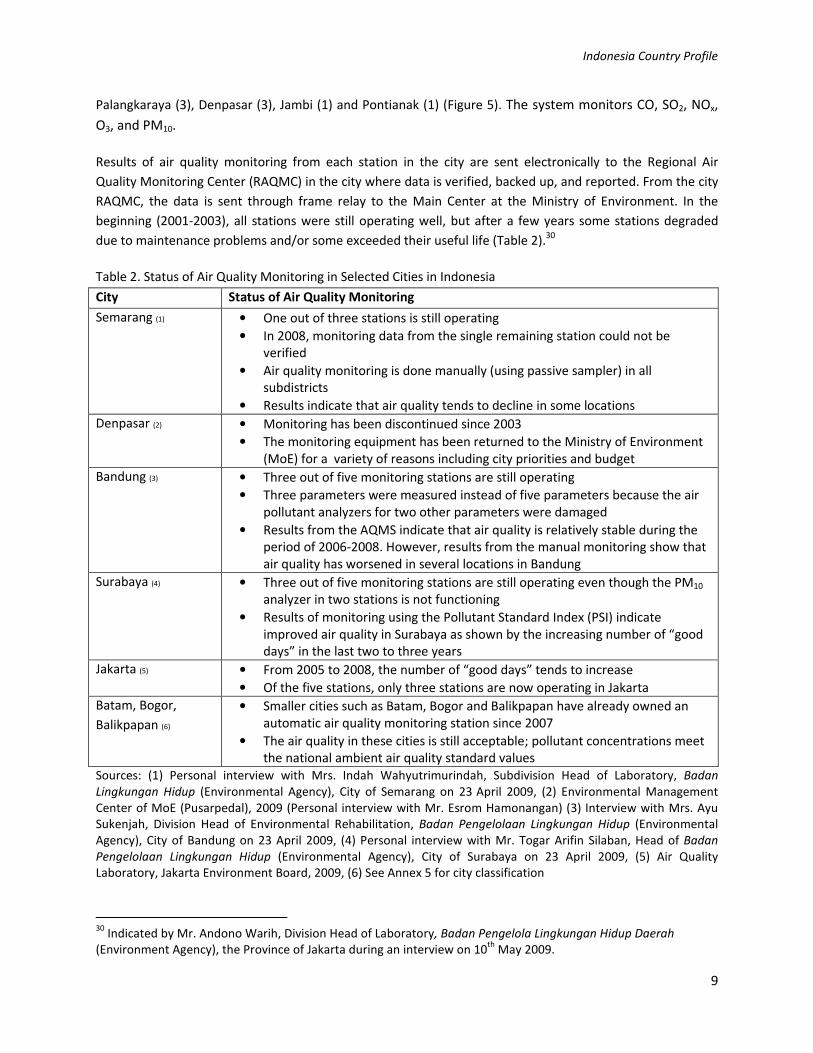
Results of air quality monitoring from each station in the city are sent electronically to the Regional Air
Quality Monitoring Center (RAQMC) in the city where data is verified, backed up, and reported. From the city
RAQMC, the data is sent through frame relay to the Main Center at the Ministry of Environment. In the
beginning (2001-2003), all stations were still operating well, but after a few years some stations degraded
due to maintenance problems and/or some exceeded their useful life (Table 2).30
Table 2. Status of Air Quality Monitoring in Selected Cities in Indonesia
City Status of Air Quality Monitoring
Semarang (1) • One out of three stations is still operating
• In 2008, monitoring data from the single remaining station could not be
verified
• Air quality monitoring is done manually (using passive sampler) in all
subdistricts
• Results indicate that air quality tends to decline in some locations
Denpasar (2) • Monitoring has been discontinued since 2003
• The monitoring equipment has been returned to the Ministry of Environment
(MoE) for a variety of reasons including city priorities and budget
Bandung (3) • Three out of five monitoring stations are still operating
• Three parameters were measured instead of five parameters because the air
pollutant analyzers for two other parameters were damaged
• Results from the AQMS indicate that air quality is relatively stable during the
period of 2006-2008. However, results from the manual monitoring show that
air quality has worsened in several locations in Bandung
Surabaya (4) • Three out of five monitoring stations are still operating even though the PM10
analyzer in two stations is not functioning
• Results of monitoring using the Pollutant Standard Index (PSI) indicate
improved air quality in Surabaya as shown by the increasing number of “good
days” in the last two to three years
Jakarta (5) • From 2005 to 2008, the number of “good days” tends to increase
• Of the five stations, only three stations are now operating in Jakarta
Batam, Bogor,
Balikpapan (6)
• Smaller cities such as Batam, Bogor and Balikpapan have already owned an
automatic air quality monitoring station since 2007
• The air quality in these cities is still acceptable; pollutant concentrations meet
the national ambient air quality standard values
Sources: (1) Personal interview with Mrs. Indah Wahyutrimurindah, Subdivision Head of Laboratory, Badan
Lingkungan Hidup (Environmental Agency), City of Semarang on 23 April 2009, (2) Environmental Management
Center of MoE (Pusarpedal), 2009 (Personal interview with Mr. Esrom Hamonangan) (3) Interview with Mrs. Ayu
Sukenjah, Division Head of Environmental Rehabilitation, Badan Pengelolaan Lingkungan Hidup (Environmental
Agency), City of Bandung on 23 April 2009, (4) Personal interview with Mr. Togar Arifin Silaban, Head of Badan
Pengelolaan Lingkungan Hidup (Environmental Agency), City of Surabaya on 23 April 2009, (5) Air Quality
Laboratory, Jakarta Environment Board, 2009, (6) See Annex 5 for city classification
30
Indicated by Mr. Andono Warih, Division Head of Laboratory, Badan Pengelola Lingkungan Hidup Daerah
(Environment Agency), the Province of Jakarta during an interview on 10th
May 2009.
Indonesia Country Profile
10
The trend of improved air quality in Jakarta and Surabaya needs to be further studied to verify the underlying
factors. Analysis of air quality should consider both PSI and ambient concentration levels. The difference in
the monitoring results using PSI and concentration data can occur because the PSI system converts the
concentration data of each of the five pollutants measured from each monitoring station into an index, and
retrieves the lowest index or the highest concentration of any of the five pollutants among those stations, to
represent the PSI for the whole city.31
Therefore, if one or more pollutant is not measured or if the number of
stations is reduced or if the data capture is less, the PSI indicator becomes less accurate.
Apart from the air quality monitoring conducted by MoE, several other local and national government
agencies conduct their own air quality monitoring such as the local Environment Management Agencies,
Environmental Health Laboratories (BTKL), the Climatological, Meteorological and Geophysical Board
(BKMG), the National Atomic Board (BATAN), the National Aeronautical Board (LAPAN), Ministry of Health,
Ministry of Transport, and the Road Development and Research Authority. The data collected is currently not
being shared among these different agencies.
Air Quality Data
Complete yearly air quality monitoring data is available from 2001 to 2008 for Jakarta, Surabaya and Bandung
for these pollutants - PM10, SO2, and NO2. For this reason, the trends presented below use data from Jakarta,
Surabaya and Bandung. Similar data for Bandung, Palangkaraya, Pekanbaru, Medan and Semarang are
incomplete (Annex 4).
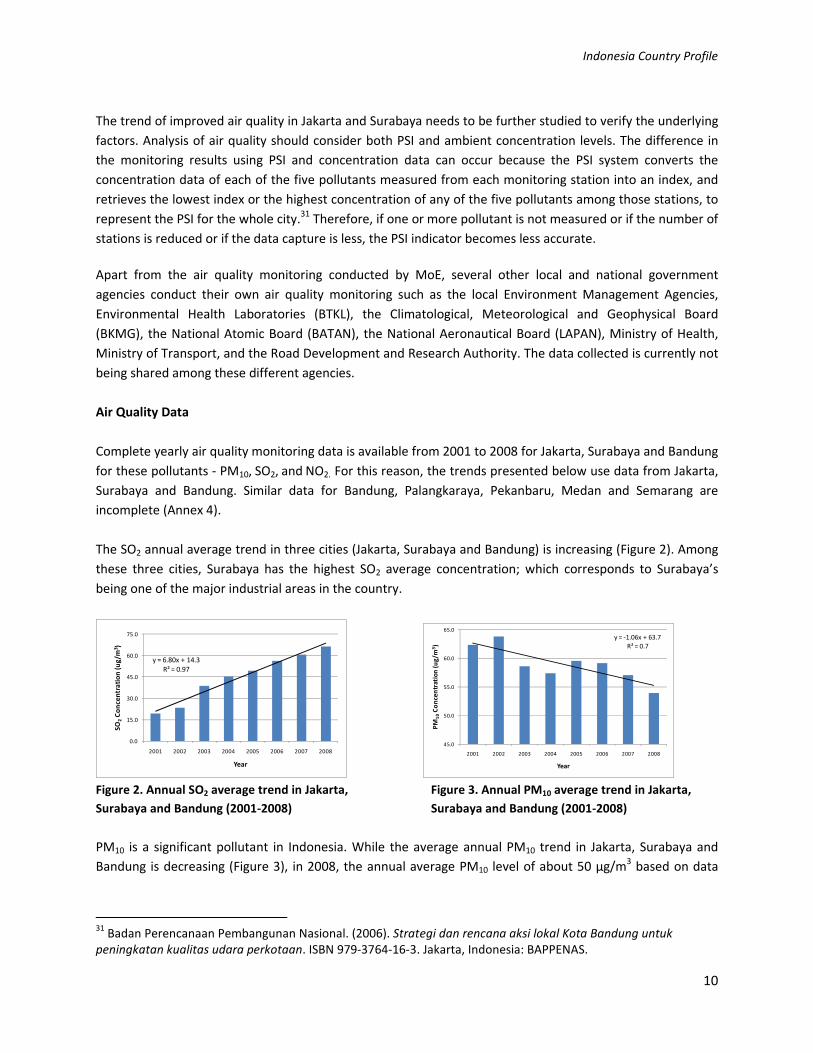
The SO2 annual average trend in three cities (Jakarta, Surabaya and Bandung) is increasing (Figure 2). Among
these three cities, Surabaya has the highest SO2 average concentration; which corresponds to Surabaya’s
being one of the major industrial areas in the country.
y = 6.80x + 14.3
R² = 0.97
0.0
15.0
30.0
45.0
60.0
75.0
2001 2002 2003 2004 2005 2006 2007 2008
SO
2C
on
cen
tra
tio
n (
ug
/m3)
Year
y = -1.06x + 63.7
R² = 0.7
45.0
50.0
55.0
60.0
65.0
2001 2002 2003 2004 2005 2006 2007 2008
PM
10
Co
nce
ntr
atio
n (
ug
/m3)
Year
Figure 2. Annual SO2 average trend in Jakarta, Figure 3. Annual PM10 average trend in Jakarta,
Surabaya and Bandung (2001-2008) Surabaya and Bandung (2001-2008)
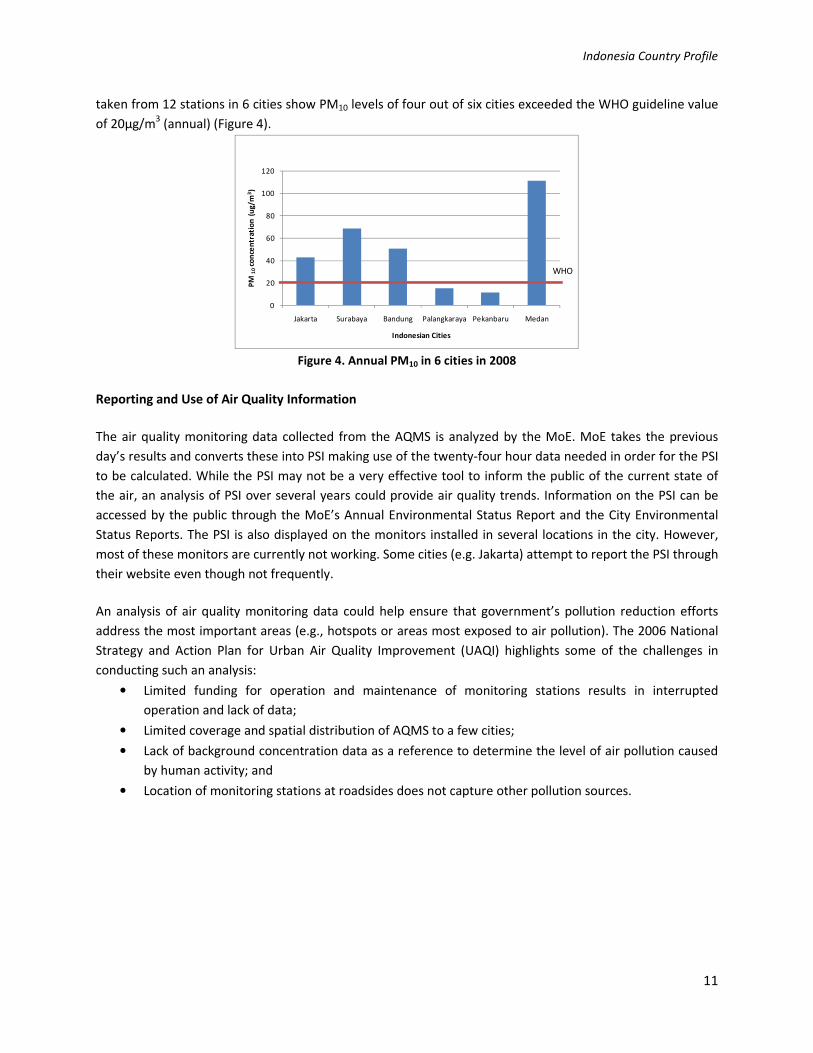
PM10 is a significant pollutant in Indonesia. While the average annual PM10 trend in Jakarta, Surabaya and
Bandung is decreasing (Figure 3), in 2008, the annual average PM10 level of about 50 µg/m3 based on data
31
Badan Perencanaan Pembangunan Nasional. (2006). Strategi dan rencana aksi lokal Kota Bandung untuk
peningkatan kualitas udara perkotaan. ISBN 979-3764-16-3. Jakarta, Indonesia: BAPPENAS.
Indonesia Country Profile
11
taken from 12 stations in 6 cities show PM10 levels of four out of six cities exceeded the WHO guideline value
of 20μg/m3 (annual) (Figure 4).
0
20
40
60
80
100
120
Jakarta Surabaya Bandung Palangkaraya Pekanbaru Medan
PM
10
con
cen
trat
ion
(u
g/m
3)
Indonesian Cities
WHO
Figure 4. Annual PM10 in 6 cities in 2008
Reporting and Use of Air Quality Information
The air quality monitoring data collected from the AQMS is analyzed by the MoE. MoE takes the previous
day’s results and converts these into PSI making use of the twenty-four hour data needed in order for the PSI
to be calculated. While the PSI may not be a very effective tool to inform the public of the current state of
the air, an analysis of PSI over several years could provide air quality trends. Information on the PSI can be
accessed by the public through the MoE’s Annual Environmental Status Report and the City Environmental
Status Reports. The PSI is also displayed on the monitors installed in several locations in the city. However,
most of these monitors are currently not working. Some cities (e.g. Jakarta) attempt to report the PSI through
their website even though not frequently.
An analysis of air quality monitoring data could help ensure that government’s pollution reduction efforts
address the most important areas (e.g., hotspots or areas most exposed to air pollution). The 2006 National
Strategy and Action Plan for Urban Air Quality Improvement (UAQI) highlights some of the challenges in
conducting such an analysis:
• Limited funding for operation and maintenance of monitoring stations results in interrupted
operation and lack of data;
• Limited coverage and spatial distribution of AQMS to a few cities;
• Lack of background concentration data as a reference to determine the level of air pollution caused
by human activity; and
• Location of monitoring stations at roadsides does not capture other pollution sources.
Indonesia Country Profile
12
Source: Bappenas. 2006. National Strategy and Action Plan for Urban Air Quality Improvement
Figure 5. Location of Air Quality Monitoring Stations
2.4 Impacts of Air Pollution
The health, environmental and economic impacts of air pollution in Jakarta and the public perception of the
air pollution problem is documented in several studies.
A 2005 study by the University of Indonesia on the health risks of PM2.5 and CO in Jakarta showed high
concentrations of air pollutants inhaled by respondents while traveling from their home to the office or
school. The same report also indicated that air conditioned cars do not keep out the pollution; those traveling
in these cars inhale the same level of pollution.32
Studies show the substantial economic cost incurred by Indonesia from air pollution. A 1994 study by the
World Bank estimated that the economic cost due to air pollution in Jakarta was IDR 500 billion from 1,200
premature deaths, 32 million respiratory problem cases, and 464,000 cases of asthma.33
A 2002 study in
Jakarta funded by the ADB estimated the economic cost due to PM10 pollution in Jakarta at IDR 1.7 trillion in
1998 and expected the cost to increase to around IDR 4.2 trillion in 2015 if no action is taken.34
32
University of Indonesia and U.S. Environmental Partnership. 2005. Health Risks of PM2.5 and CO in Jakarta. 33
Shah, J.J., Nagpal, T., & Brandon, C.J. (1997). Urban air quality management strategy in Asia: Jakarta report.
Washington, DC: World Bank. 34
Syahril, S., Resosudarmo, B.P., & Satriyo Tomo, B. (2002b). Study on air quality in Jakarta: Future trends, health
impacts, economic value and policy options (Technical Assistance 5937). Manila: Asian Development Bank.
Indonesia Country Profile
13
A survey on the public’s (i.e., government, civil society, and private sector) perception towards air pollution
conducted in Jakarta, Bandung, and Surabaya yielded interesting results: 35
• While in the cities of Jakarta and Surabaya, about 80 to 90 percent of the respondents considered air
pollution a serious problem; in Bandung, a majority of the respondents did not consider air pollution
as a major issue.
• In Jakarta and Surabaya, while the level of understanding of air pollution issues is high, a
considerable percentage of respondents were unwilling to commit to take measures to reduce air
pollution such as paying more for cleaner fuel, paying for inspection and maintenance fee, and
agreeing to be fined for non-compliance with emission regulations. Possible reasons for this low
commitment could be limited information on ways to reduce air pollution and that some air
pollution control measures such as vehicle inspection and maintenance are not mandatory.
35
Clean Air Project, Swisscontact. (2005-2006) and Ministry of Environment. (2006).
Indonesia Country Profile
14
3. LEGAL FRAMEWORK FOR AIR QUALITY MANAGEMENT
A country’s seriousness in implementing a policy to provide better air quality for its people may be judged on
whether: (1) the policy and its implementation details are reflected in laws, regulations and plans; (2) enough
resources are provided to implement it; and (3) the laws, regulations and plans are actually implemented.
This Chapter discusses the main laws, regulations, policies and plans that are the basis for air quality
management in Indonesia; an overview of the management of pollution from motor vehicles, industries, and
area sources; and the power and resources of smaller cities to develop and implement clean air action plans.
3.1 Air Quality Management
Indonesia does not have an Act that specifically regulates air quality management, but the Constitution and
several relevant Acts, Government Regulations or Peraturan Pemerintah (PP) to implement the Acts, and
other lower hierarchy of legal instruments such as ministerial regulations or technical guidelines to
implement the PP can be used as a legal basis for addressing air quality management. The Constitution of
Indonesia (Undang-Undang Dasar 45, Article 28 H 1), in general, protects the right of every person to enjoy a
good and healthy environment. The main Acts, Regulations and Plans to manage pollution from motor
vehicles, industries, and area sources are discussed below and summarized in Annex 6.
Act No. 23 of 1997 on Environmental Management36
confers each individual the right to have a good and
healthy environment and to obtain information related to the environment. It also gives each individual the
obligation to preserve the environment and restricts activities that exceed environmental quality standards.
Government Regulation (PP) No. 41/1999 on Air Pollution Control is an implementing regulation to Act No.
23/1997 which relates to air quality management. This PP imposed several standards: ambient air quality
standards, emission standards for industrial activities and motor vehicles, and Pollutant Standard Index (PSI).
To implement the articles in this PP, the State Ministry of Environment (MoE) has issued several regulations
and decrees specifically pertaining to the emissions standards. Local governments need these technical
guidelines to develop and implement policies, strategies and action plans for air quality management in their
respective areas.
On the authority of local governments to issue standards, the Government Regulation No. 41/1999
concerning Air Pollution Control and MoE Decree on emission standards allows provincial governments to set
regional vehicle emission standards, industrial emission standards, and ambient air quality standards that are
more stringent than or at least equivalent to the national standards. However, city governments have no
authority to issue either emission standards or ambient air quality standards.
Some provinces have issued bylaws to prevent, control, monitor and mitigate air pollution. The provinces of
Jakarta and Yogyakarta and Surabaya City are the first to have issued such a bylaw.37
To implement the
Bylaw, the Province of Jakarta issued a series of implementing regulations including: 1) Gas Fuel Usage for
36
At time of writing was to be replaced by a new Act 37
Act No. 2/2005 for the province of Jakarta, Act No. 5/2007 for Yogyakarta, and Act No. 3/2008 for Surabaya on
Air pollution Control
Indonesia Country Profile
15
Public Transport and Government Operational Vehicles,38
2) Vehicle Emission Test and Vehicle
Maintenance,39
and 3) Non-Smoking Areas.40
Although not called the Bylaw on Air Pollution Control, the City of Bandung has also issued a Bylaw on Law
and Order, Cleanliness and Aesthetic with air pollution measures such as: 1) control of air pollution from
mobile sources including the supervision of vehicle emission standard compliance, on-road inspection for
vehicle emissions, and monitoring of roadside ambient air quality; and 2) on-road vehicle emission testing
and roadside ambient air quality monitoring by the city government at least once a year.41
Ambient Air Quality Standards
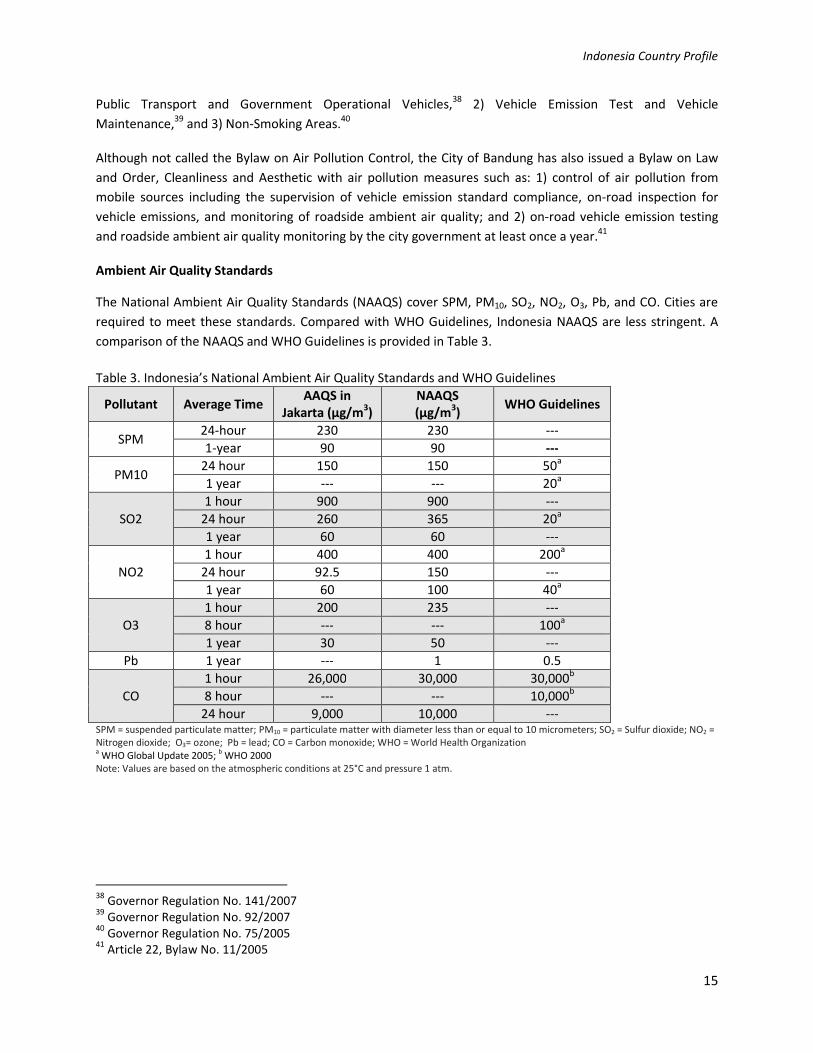
The National Ambient Air Quality Standards (NAAQS) cover SPM, PM10, SO2, NO2, O3, Pb, and CO. Cities are
required to meet these standards. Compared with WHO Guidelines, Indonesia NAAQS are less stringent. A
comparison of the NAAQS and WHO Guidelines is provided in Table 3.
Table 3. Indonesia’s National Ambient Air Quality Standards and WHO Guidelines
Pollutant Average Time AAQS in
Jakarta (µg/m3)
NAAQS
(µg/m3)
WHO Guidelines
SPM 24-hour 230 230 ---
1-year 90 90 ---
PM10 24 hour 150 150 50
a
1 year --- --- 20a
SO2
1 hour 900 900 ---
24 hour 260 365 20a
1 year 60 60 ---
NO2
1 hour 400 400 200a
24 hour 92.5 150 ---
1 year 60 100 40a
O3
1 hour 200 235 ---
8 hour --- --- 100a
1 year 30 50 ---
Pb 1 year --- 1 0.5
CO
1 hour 26,000 30,000 30,000b
8 hour --- --- 10,000b
24 hour 9,000 10,000 --- SPM = suspended particulate matter; PM10 = particulate matter with diameter less than or equal to 10 micrometers; SO2 = Sulfur dioxide; NO2 =
Nitrogen dioxide; O3= ozone; Pb = lead; CO = Carbon monoxide; WHO = World Health Organization a WHO Global Update 2005;
b WHO 2000
Note: Values are based on the atmospheric conditions at 25°C and pressure 1 atm.
38
Governor Regulation No. 141/2007 39
Governor Regulation No. 92/2007 40
Governor Regulation No. 75/2005 41
Article 22, Bylaw No. 11/2005
Indonesia Country Profile
16
Management of Mobile Sources
The newly enacted Act No. 22/2009 which replaces the Act No. 14/1992 on Traffic and Road Transportation is
the legal basis for the management of land transportation, including the control of vehicle emissions. The Act
stipulates that the vehicle emission test is an integral part of the roadworthiness test. Hence, the
responsibility for vehicle emission testing lies with the transportation office. The new important provisions in
this Act relate to the road fund to be collected from road users which is managed by a unit in the Ministry of
Public Works; inclusion of bicycle lanes, pedestrian pathways and crossings in road facilities; periodic
roadworthiness and emission test being mandatory for public vehicles; provision of segregated lane for mass
public transport; rights of pedestrians to pedestrian facilities (Annex 7). As a result of the enactment of the
new Act, the implementing regulations to the outdated Act No. 14/1992 must be subsequently revised.
Currently the revision process is underway and is expected to be completed within one year from the
issuance date of the new Act No. 22/2009.42
For new vehicles, government regulations mandate that new vehicles sold in Indonesia must comply with
Euro 2 standard starting January 2005.43
However, this regulation became effective in January 2007 with the
phase out of leaded gasoline. According to the Chairman of the Association of Indonesia Automotive
Industries (Gaikindo), all new gasoline vehicles and new motorcycles sold in Indonesia complied with the Euro
2 standard in 2007.44
The poor quality of diesel fuel sold in the country hinders compliance by new diesel
vehicles with Euro 2 standard which requires maximum of 500 ppm sulfur in diesel. The vehicle fuel
specifications for gasoline and automotive diesel oil are provided in Annex 8 and the in-use vehicle emission
standards in Indonesia are provided in Annex 9.
Act No. 22/2001 concerning Oil and Gas is the legal basis for the provision of cleaner fuel through the
implementation of fuel specifications set by the Directorate General of Oil and Gas. This Act allows
companies other than the state-owned oil company Pertamina to produce and distribute fuel. The opening of
the downstream market, if followed with tightened fuel specifications, can push the production and
distribution of cleaner fuel and enable the application of vehicle technology to further reduce vehicle
emissions. The MoE conducts a fuel inspection program yearly to ensure that vehicle fuel specifications are
complied with.45
Exhaust gas emission test is part of vehicle roadworthiness test (Government Regulation No. 44/1993
currently being revised following the enactment of new Act. No. 22/2009 on Traffic and Road Transport). The
question on which agency – environment or transport – has the authority to conduct emission test for in-use
42
The Government Regulations to be amended include: 1) Government Regulation No. 41/1993 on Road Transport
regulating the transportation of goods and people, transportation route, route licensing, and transportation tariff;
2) Government Regulation No. 42/1993 on Road Inspection which regulates random on-road inspection to verify
the result of the roadworthiness test conducted at fixed test centers; 3) Government Regulation No. 43/1993 on
Road Facilities and Traffic which regulates traffic management and engineering; 4) Government Regulation No.
44/1993 on Vehicles and Drivers which regulates technical requirements and roadworthiness, motor vehicle
testing, and driving license. 43
MoE Decree No. 141/2003 concerning Emission Standard Limits for New Types of Motor Vehicles and Motor
Vehicles in Current Production 44
Association of Indonesia Motorcycle Industries (AISI) 2008 45
http://langitbiru.menlh.go.id/
Indonesia Country Profile
17
vehicles arose because of the different interpretations of the Government Regulation No. 44/1993 Article
148 which states that only certain vehicle categories such as bus, goods vehicle, specialized vehicle or
commercial vehicle are required to undergo a periodic roadworthiness test every 6 months. While for other
vehicle categories (passenger car and motorcycle), the need for a roadworthiness test will be covered by a
separate Government Regulation which has yet to be issued.
Given that vehicle emission test for passenger car and motorcycles has not yet been regulated, several
environmental agencies in the region (Jakarta, Surabaya, Yogyakarta, and Bandung) which consider it a
priority to control air pollution from mobile sources, took the initiative by issuing a regional bylaw on I&M
system for passenger cars and motorcycles. In this decentralized system, emission test will be carried out by
the private sector in auto workshops. However, since the new legislation (Act No. 22/2009 on Traffic and
Road Transport does not mandate emission testing (as part of the roadworthiness test) for private vehicles -
pending the revision of Government Regulation No. 44/1993 – this could be interpreted that local
government may possibly regulate emission test for passenger cars and/or motorcycles through local
legislation for their respective area.
Some regions (provinces, regencies/cities) have issued laws and regulations which regulate traffic
management and road transportation, and transport policy. For instance, the Province of Jakarta Bylaw No.
12/2003 concerning Traffic and Transportation and the Governor Decree No. 84/2004 concerning Macro
Transportation Plan for 2007, 2010, and 2020. The macro transportation plan comprises of the development
of Bus Rapid Transit (BRT) and feeder system, rail-based transportation system (train, mass rapid transit
(MRT), monorail/light rail train), river transportation; and the introduction of transport demand management
like traffic and parking restrictions.
The city of Surabaya has issued Bylaw No. 7/2006 on Provision of Road Public Transport. Some important
provisions of this regulation are: 1) improving service-oriented public transport based on the hierarchy of
roads and the quality of service (for example, on the main route, public transport should have a fixed
schedule and stop at places that have been determined for pick-up and drop-off of passengers, and 2) age
restriction of public transport to 15 years old.
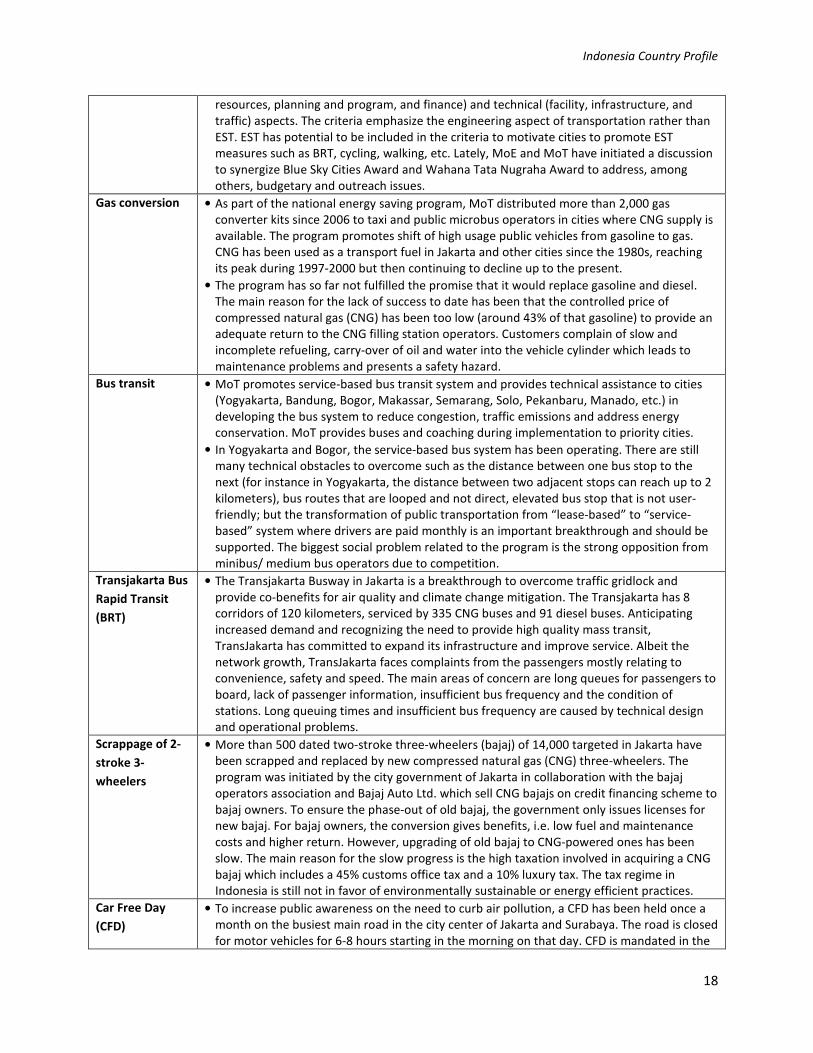
Several state agencies and cities implement programs to reduce emissions from motor vehicles. A description
of some of these programs and the challenges faces are provided in Table 4.
Table 4. Programs to Reduce Emissions from Motor Vehicles
Program Program Details and Challenges
Blue Sky Cities
Award
• Launched by MoE in 2007 to promote environmentally sustainable transport (EST) and
support cities in implementing EST policies
• A set of evaluation criteria has been established and applied. The evaluation criteria include
ambient air quality, vehicle exhaust emissions, and transport management system. In 2008,
5 cities were among the first recipients of the Award. This program also aims to support the
existing Adipura Awards Program (an evaluation of region/city performance in overall
environmental management).
Wahana Tata
Nugraha Award
• The program run by MoT encourages city government to manage transportation in a more
environmentally sustainable manner. It evaluates traffic and road transport management
performance by cities. The criteria include administrative (institutional arrangement, human
Indonesia Country Profile
18
resources, planning and program, and finance) and technical (facility, infrastructure, and
traffic) aspects. The criteria emphasize the engineering aspect of transportation rather than
EST. EST has potential to be included in the criteria to motivate cities to promote EST
measures such as BRT, cycling, walking, etc. Lately, MoE and MoT have initiated a discussion
to synergize Blue Sky Cities Award and Wahana Tata Nugraha Award to address, among
others, budgetary and outreach issues.
Gas conversion • As part of the national energy saving program, MoT distributed more than 2,000 gas
converter kits since 2006 to taxi and public microbus operators in cities where CNG supply is
available. The program promotes shift of high usage public vehicles from gasoline to gas.
CNG has been used as a transport fuel in Jakarta and other cities since the 1980s, reaching
its peak during 1997-2000 but then continuing to decline up to the present.
• The program has so far not fulfilled the promise that it would replace gasoline and diesel.
The main reason for the lack of success to date has been that the controlled price of
compressed natural gas (CNG) has been too low (around 43% of that gasoline) to provide an
adequate return to the CNG filling station operators. Customers complain of slow and
incomplete refueling, carry-over of oil and water into the vehicle cylinder which leads to
maintenance problems and presents a safety hazard.
Bus transit • MoT promotes service-based bus transit system and provides technical assistance to cities
(Yogyakarta, Bandung, Bogor, Makassar, Semarang, Solo, Pekanbaru, Manado, etc.) in
developing the bus system to reduce congestion, traffic emissions and address energy
conservation. MoT provides buses and coaching during implementation to priority cities.
• In Yogyakarta and Bogor, the service-based bus system has been operating. There are still
many technical obstacles to overcome such as the distance between one bus stop to the
next (for instance in Yogyakarta, the distance between two adjacent stops can reach up to 2
kilometers), bus routes that are looped and not direct, elevated bus stop that is not user-
friendly; but the transformation of public transportation from “lease-based” to “service-
based” system where drivers are paid monthly is an important breakthrough and should be
supported. The biggest social problem related to the program is the strong opposition from
minibus/ medium bus operators due to competition.
Transjakarta Bus
Rapid Transit
(BRT)
• The Transjakarta Busway in Jakarta is a breakthrough to overcome traffic gridlock and
provide co-benefits for air quality and climate change mitigation. The Transjakarta has 8
corridors of 120 kilometers, serviced by 335 CNG buses and 91 diesel buses. Anticipating
increased demand and recognizing the need to provide high quality mass transit,
TransJakarta has committed to expand its infrastructure and improve service. Albeit the
network growth, TransJakarta faces complaints from the passengers mostly relating to
convenience, safety and speed. The main areas of concern are long queues for passengers to
board, lack of passenger information, insufficient bus frequency and the condition of
stations. Long queuing times and insufficient bus frequency are caused by technical design
and operational problems.
Scrappage of 2-
stroke 3-
wheelers
• More than 500 dated two-stroke three-wheelers (bajaj) of 14,000 targeted in Jakarta have
been scrapped and replaced by new compressed natural gas (CNG) three-wheelers. The
program was initiated by the city government of Jakarta in collaboration with the bajaj
operators association and Bajaj Auto Ltd. which sell CNG bajajs on credit financing scheme to
bajaj owners. To ensure the phase-out of old bajaj, the government only issues licenses for
new bajaj. For bajaj owners, the conversion gives benefits, i.e. low fuel and maintenance
costs and higher return. However, upgrading of old bajaj to CNG-powered ones has been
slow. The main reason for the slow progress is the high taxation involved in acquiring a CNG
bajaj which includes a 45% customs office tax and a 10% luxury tax. The tax regime in
Indonesia is still not in favor of environmentally sustainable or energy efficient practices.
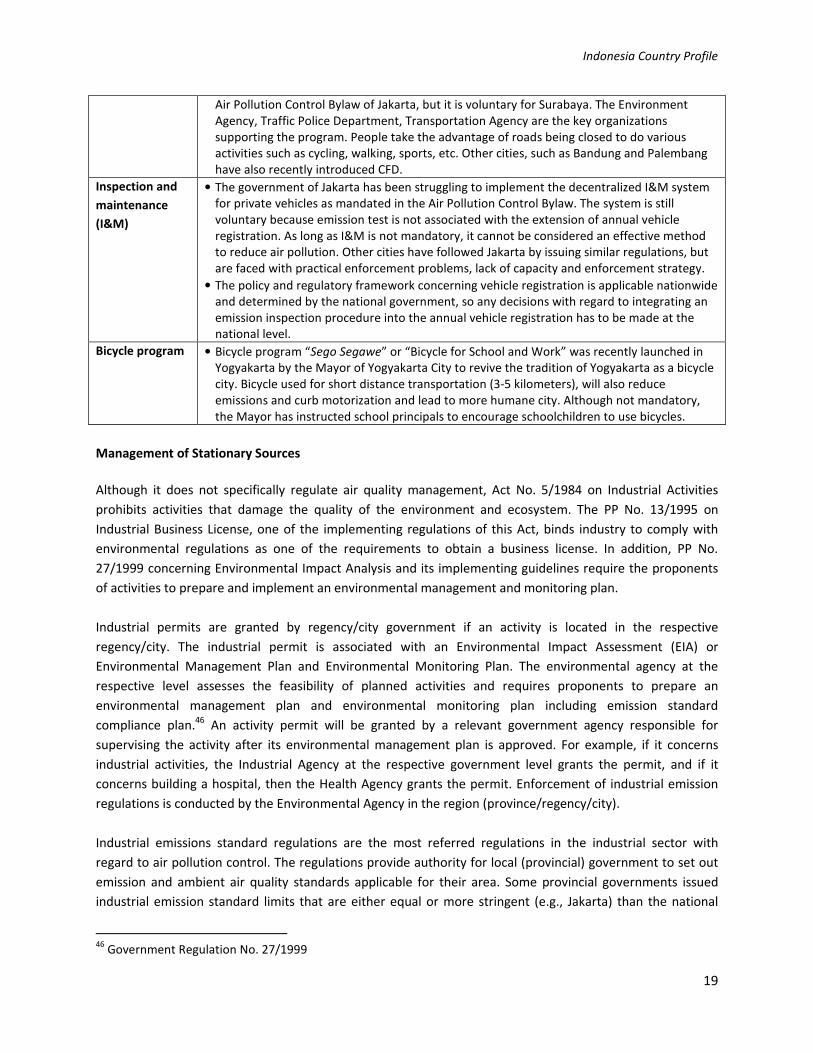
Car Free Day
(CFD)
• To increase public awareness on the need to curb air pollution, a CFD has been held once a
month on the busiest main road in the city center of Jakarta and Surabaya. The road is closed
for motor vehicles for 6-8 hours starting in the morning on that day. CFD is mandated in the
Indonesia Country Profile
19
Air Pollution Control Bylaw of Jakarta, but it is voluntary for Surabaya. The Environment
Agency, Traffic Police Department, Transportation Agency are the key organizations
supporting the program. People take the advantage of roads being closed to do various
activities such as cycling, walking, sports, etc. Other cities, such as Bandung and Palembang
have also recently introduced CFD.
Inspection and
maintenance
(I&M)
• The government of Jakarta has been struggling to implement the decentralized I&M system
for private vehicles as mandated in the Air Pollution Control Bylaw. The system is still
voluntary because emission test is not associated with the extension of annual vehicle
registration. As long as I&M is not mandatory, it cannot be considered an effective method
to reduce air pollution. Other cities have followed Jakarta by issuing similar regulations, but
are faced with practical enforcement problems, lack of capacity and enforcement strategy.
• The policy and regulatory framework concerning vehicle registration is applicable nationwide
and determined by the national government, so any decisions with regard to integrating an
emission inspection procedure into the annual vehicle registration has to be made at the
national level.
Bicycle program • Bicycle program “Sego Segawe” or “Bicycle for School and Work” was recently launched in
Yogyakarta by the Mayor of Yogyakarta City to revive the tradition of Yogyakarta as a bicycle
city. Bicycle used for short distance transportation (3-5 kilometers), will also reduce
emissions and curb motorization and lead to more humane city. Although not mandatory,
the Mayor has instructed school principals to encourage schoolchildren to use bicycles.
Management of Stationary Sources
Although it does not specifically regulate air quality management, Act No. 5/1984 on Industrial Activities
prohibits activities that damage the quality of the environment and ecosystem. The PP No. 13/1995 on
Industrial Business License, one of the implementing regulations of this Act, binds industry to comply with
environmental regulations as one of the requirements to obtain a business license. In addition, PP No.
27/1999 concerning Environmental Impact Analysis and its implementing guidelines require the proponents
of activities to prepare and implement an environmental management and monitoring plan.
Industrial permits are granted by regency/city government if an activity is located in the respective
regency/city. The industrial permit is associated with an Environmental Impact Assessment (EIA) or
Environmental Management Plan and Environmental Monitoring Plan. The environmental agency at the
respective level assesses the feasibility of planned activities and requires proponents to prepare an
environmental management plan and environmental monitoring plan including emission standard
compliance plan.46
An activity permit will be granted by a relevant government agency responsible for
supervising the activity after its environmental management plan is approved. For example, if it concerns
industrial activities, the Industrial Agency at the respective government level grants the permit, and if it
concerns building a hospital, then the Health Agency grants the permit. Enforcement of industrial emission
regulations is conducted by the Environmental Agency in the region (province/regency/city).
Industrial emissions standard regulations are the most referred regulations in the industrial sector with
regard to air pollution control. The regulations provide authority for local (provincial) government to set out
emission and ambient air quality standards applicable for their area. Some provincial governments issued
industrial emission standard limits that are either equal or more stringent (e.g., Jakarta) than the national
46
Government Regulation No. 27/1999
Indonesia Country Profile
20
limits regulated by MoE. If a provincial government does not issue the standard limits for industrial and/or
vehicle exhaust emissions then the national standard applies. It should be noted that city governments do
not have such authority.
Act No. 30/2007 concerning Energy requires energy management to be based on the principle of
sustainability and environmental protection, among others. This Act regulates energy resilience, new and
renewable energy, energy prices, and the establishment of National Energy Council (NEC). The NEC is led by
the President along with members selected and chosen by the House of Representatives. NEC formulates
energy policy, designs the overall national energy plan, determines the emergency response plan in the event
of an energy crisis, and supervises the implementation of cross-sectoral policies by the relevant government
institutions in the field of energy. This Act also stipulates that energy conservation is given incentives, while
energy dissipation is imposed disincentives.
Presidential Regulation No. 5/2006 concerning National Energy Policy set the target for energy mix by 2025.
The decree states that the contribution of fossil oil as a source of energy is targeted to be reduced from 52%
in the year 2003 to 26.2% in the year 2025 of the total energy demand. While for other sources of energy,
contribution of geothermal is targeted to increase from 3.1% to 3.8%, natural gas from 21.2% to 30.6%, coal
from 19.7% to 32.7%, and renewable energy from 0.2% to 4.4%. On the other hand the contribution of
hydropower is targeted to be reduced from 3.8% to 2.4%.
In response to the rising global oil prices and Indonesia’s over reliance on fossil fuels, the President instructed
the relevant line ministries and local government through Presidential Instruction No. 1/2006 to take
necessary action to accelerate the production and utilization of biofuel as an alternative source of energy.
Presidential Instruction No. 10/2005 concerning Energy Conservation and Regulation of the Ministry of
Energy and Mineral Resources No. 31/2005 on Energy Efficiency require government agencies to undertake
energy conservation in offices, office equipment, and transportation, and for industries to undertake energy
audits and promote the use of energy saving products or technology.
Management of Area Sources
Waste burning is another source of air pollution which requires attention. Cities face the challenge of
efficiently managing solid waste. The waste collection capacity and disposal is generally insufficient to serve
the city 100 percent. While in Jakarta, waste collection rate is at 97 percent, in the Bodetabek area (Bogor,
Depok, Bekasi, Tangerang) the waste collection rate is only at 33 percent.47
Unserved households often burn
their garbage; very few compost and recycle solid waste.
Some cities (e.g., Pontianak and Bekasi) have initiated CDM projects for the city waste landfill and Jakarta
plans to follow their example.
47
Jakarta Environment Status Report. 2006.
Indonesia Country Profile
21
Regional Governments Institutional Structure
Agencies and offices at the regency/city, provinces and national levels play different roles in managing air
quality in smaller cities. In this report, regional governments refer to regency/city and province.
The Republic of Indonesia is divided into provinces, and each province consists of regencies and/or cities that
have their own government and legislative body. A regency and city are at the same level of local
government but they differ only in area and economic activity; the regency is larger in area than a city and a
city only has non-agricultural economic activity. Additional information on Regional Government Structure is
provided in Annex 9.
Regional governments enjoy a greater role in administering their government affairs except foreign policy,
defense, judicature, monetary and fiscal, and religion. In the utilization of natural resources, the national
government, provincial and regency/city government cooperate; they manage licensing together, and share
the revenue. In the provision of public services, the national government sets a minimum service standard,
assists funding and facilitates regional cooperation. In financial matters, the national government provides
financial resources for local government to administer their own government affairs, allocates balanced fund
and provides loan or grant to regional government. The relationship between provincial government and
regency/city government in the field of finance among others are: sharing tax and non-tax revenue, and
funding for government affairs that are of mutual responsibility.48
The head of the region together with the regional House of Representatives pass regional legislation or
bylaw. A bylaw must be consistent with the public interest and with higher legislation (National Acts and
Government Regulations); if it is in conflict, the bylaw is annulled by the national government. A bylaw can
impose a criminal sanction of confinement (maximum of 6 months or fine up to Rp. 50 million) or impose
other sanctions. To implement a bylaw, the head of the region issues a regulation or decree.
The regional government (province or regency/city) develops a regional development plan which consists of:
1) Long Term Development Plan of 20 years that refers to the National Long Term Development Plan, 2) Mid-
Term Development Plan of 5 years that refers to the National Mid-Term Development Plan, 3) Regional
Development Work Plan of 1 year which is derived from the Mid-Term Development Plan. The Regional Mid-
and Long-Term Development Plan is regulated through a bylaw. The government agency responsible for
preparing the regional development plan is the Regional Development Planning Agency. Guided by the
Regional Mid-Term Development Plan, regional technical agencies then prepare a strategic plan which
defines vision, mission, goal, strategies, policies, programs, and activities in accordance with the duties and
functions of the respective agencies.
The national government is required to assist the regional government in strengthening the capacity of the
region for executing tasks and responsibilities that are in line with the authority of the regional government.
Hence, a concerned minister for a related matter, for instance for environmental affairs, shall provide
coaching to its counterpart at the regional level.
48
Act No. 32/2004 on Regional Government
Indonesia Country Profile
22
As an illustration, the role and function of a national government agency (Ministry of Environment) is
described as follows: the MoE Regulation No. 1/2005 concerning Organization and Work Guidance for the
Ministry of Environment states that the tasks of Assistant Deputy Minister for Mobile Source Emission
Control are to: 1) formulate policies in the field of environmental impact control due to emission and noise
pollution from motor vehicles; 2) monitor, analyze, and evaluate the implementation of policies; and 3)
prepare policy implementation report in the field of emission control and noise pollution from vehicles. The
description of this task indicates that the role of MoE and other ministries at the national level is to formulate
policies; develop norms, standards, procedures and criteria; and provide support and coaching to the
corresponding regional agencies. Meanwhile, technical agencies in the region play an important role in the
preparation of regional policies and strategies and execution of the strategies and programs based on the
policies, norms, and standards set by the ministries.
Regional governments can have their own initiatives to control air pollution. However, not all regions
(provinces, regencies or cities) have sufficient capacity and resources to develop and implement air pollution
programs. Assistance from national government (ministries) to help cities develop and implement an air
quality strategy and action plan is needed. The national government also needs to encourage regions to take
initiative to control air pollution in their respective regions. Programs such as car free day, bus rapid transit,
three-wheelers gas conversion, and I&M are examples of regional initiatives.
Climate Change Mitigation
The 2007 National Action Plan (NAP) on Climate Change is Indonesia’s guiding document on climate change
efforts. It guides various agencies in carrying out efforts to tackle climate change and sets the requirements
for institutional coordination. It provides for immediate, short-, medium-, and long-term actions.
The National Council for Climate Change was established to coordinate the implementation of climate
change mitigation efforts.49
Headed by the President, the Council’s tasks include the development of national
policy, strategy, program and action plan for mitigating climate change. Besides the 2007 NAP developed
under the coordination of MoE, the National Development Planning Agency (Bappenas) also issued the
National Development Planning Response to Climate Change. This document aims to mainstream
environmental and natural resource considerations into the development planning process. It also discusses
funding mechanism for climate change mitigation and adaptation programs.
The MoE Decree No. 206/2005 on the establishment of Komisi Nasional Mekanisme Pembangunan Bersih
(Komnas MPB) or the National Committee for the Clean Development Mechanism states that the Komnas
MPB functions as Indonesia’s Designated National Agency (DNA) and is responsible for assessing, evaluating,
and monitoring clean development mechanism (CDM) activities in Indonesia. The Committee is led by a
National Executive Board with representatives from nine national government institutions. The head of the
Committee is MoE.
As Indonesia implements measures within the National Energy Policy to ensure self-sufficiency, it is
important to ensure that new coal-fired power plants are state-of-the-art, energy efficient and use cleaner
49
Presidential Regulation No. 46/2008
Indonesia Country Profile
23
technologies. Existing coal-fired power plants' performance must also be assessed. Increasing biofuels
production in support of this policy should also be considered with caution as its implications to land-use and
food production may be economically and socially counter-productive in the long-term. Government should
support research and development for biofuels production and use, especially for second generation
biofuels.
3.2 Clean Air Action Plans in Smaller Cities
Since the implementation of regional autonomy in the year 1999 (Act No. 22/1999 on Regional Government
which was then superseded by Act No. 32/2004), regional governments have the authority to manage their
own affairs, except matters that fall under the authority of the national government. The development
implementation of clean air action plans is within the regional governments’ power.50
Several regional
governments have developed clean air action plans. The Province of Jakarta, City of Surabaya, City of
Bandung, City of Semarang, and Province of Yogyakarta (collectively called the “UAQ-I provinces and cities”)
developed clean air action plans in 2006 as part of the Urban Air Quality Improvement (UAQ-i) Sector
Development Program implementation. A participatory approach was used in the action plan development.
The action plan shall be used as reference and guideline for various institutions in the implementation of
measures to improve air quality. For example, the Environmental Board of Jakarta which is currently
developing its local emission inventory used the action plan document as reference.
Among the lessons learned from previous action planning include: 1) for the action plan to be implemented,
there should be local ownership of the action plan achieved by active involvement by local stakeholders in its
formulation; and 2) formulation of action plan requires an effective coordination among sectors; it is
important for the lead agency to demonstrate sufficient capacity in inter-agency coordination and
communication.
Planning for areas related to clean air (e.g., urban planning, transport, development and spatial planning) is
also within the ambit of regional governments’ authority. In terms of urban planning, regional governments
(province and regency/city) have the authority to develop regional or city spatial planning, incorporate and
oversee the implementation of spatial planning (Act No. 26/2007). Urban planning is governed by regional
legislation and must be integrated with the national spatial planning thus it has to be approved by Minister of
Public Works before the bylaw is enacted. Likewise the transport plan and regional or city development plan
have to be integrated with the national spatial planning. The regional governments have full authority to
develop regional or city transport plans. They can also grant franchises to public transport operators. Besides
the spatial planning, other plans that determine the city development is Long Term Development Plan (20
years) and Medium Term Development Plan (5 years), which are regulated through legislation at the national
and regional level. In the end, air quality management efforts and environmentally sustainable transport
policies have to be integrated into the Spatial Planning and City Development Plan.
50
The legal bases of the powers of regional government include: Act No. 32/2004 on Regional Government; Act
No. 33/2004 on Fiscal Balance between National and Regional Government; Act No. 18/1997 on Regional Tax and
Retribution; Act No. 4/2000 on Revision to Act No. 18/1997 on Regional Tax and Retribution; Government
Regulation No. 38/2007 on Division of Government Affairs between National Government, Provincial Government,
and Regency or City Government; Government Regulation No. 41/2007 on Regional Structure of Organization.
Indonesia Country Profile
24
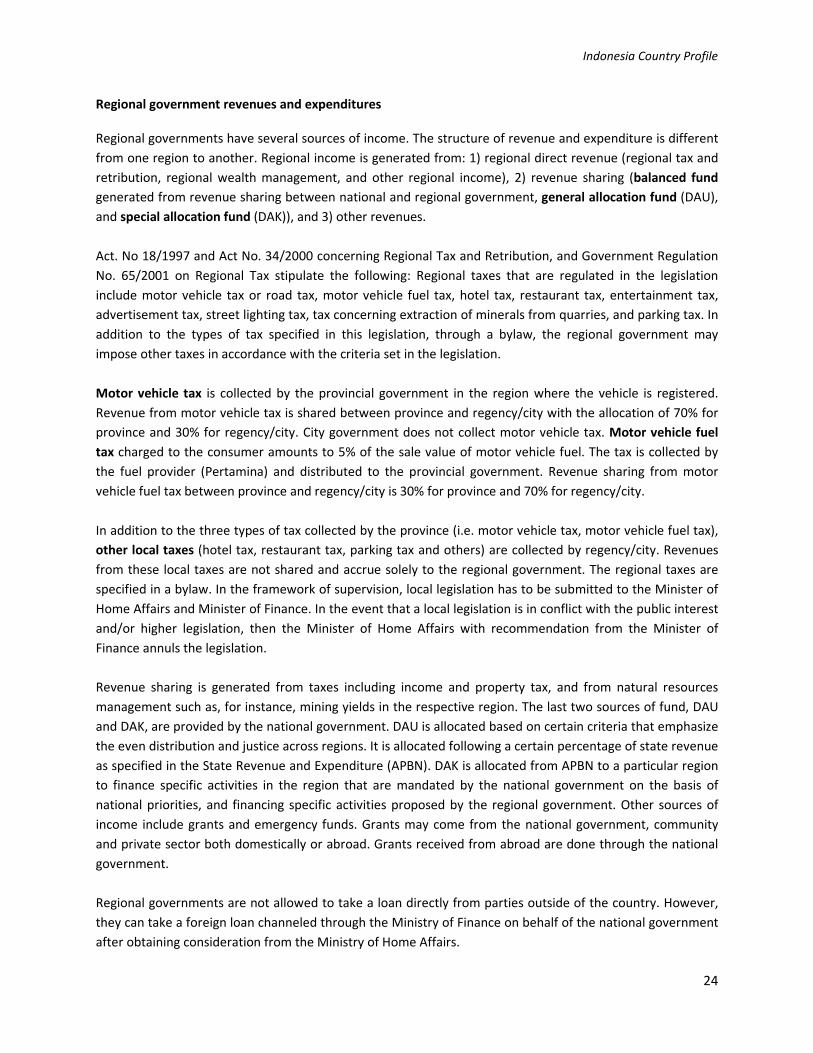
Regional government revenues and expenditures
Regional governments have several sources of income. The structure of revenue and expenditure is different
from one region to another. Regional income is generated from: 1) regional direct revenue (regional tax and
retribution, regional wealth management, and other regional income), 2) revenue sharing (balanced fund
generated from revenue sharing between national and regional government, general allocation fund (DAU),
and special allocation fund (DAK)), and 3) other revenues.
Act. No 18/1997 and Act No. 34/2000 concerning Regional Tax and Retribution, and Government Regulation
No. 65/2001 on Regional Tax stipulate the following: Regional taxes that are regulated in the legislation
include motor vehicle tax or road tax, motor vehicle fuel tax, hotel tax, restaurant tax, entertainment tax,
advertisement tax, street lighting tax, tax concerning extraction of minerals from quarries, and parking tax. In
addition to the types of tax specified in this legislation, through a bylaw, the regional government may
impose other taxes in accordance with the criteria set in the legislation.
Motor vehicle tax is collected by the provincial government in the region where the vehicle is registered.
Revenue from motor vehicle tax is shared between province and regency/city with the allocation of 70% for
province and 30% for regency/city. City government does not collect motor vehicle tax. Motor vehicle fuel
tax charged to the consumer amounts to 5% of the sale value of motor vehicle fuel. The tax is collected by
the fuel provider (Pertamina) and distributed to the provincial government. Revenue sharing from motor
vehicle fuel tax between province and regency/city is 30% for province and 70% for regency/city.
In addition to the three types of tax collected by the province (i.e. motor vehicle tax, motor vehicle fuel tax),
other local taxes (hotel tax, restaurant tax, parking tax and others) are collected by regency/city. Revenues
from these local taxes are not shared and accrue solely to the regional government. The regional taxes are
specified in a bylaw. In the framework of supervision, local legislation has to be submitted to the Minister of
Home Affairs and Minister of Finance. In the event that a local legislation is in conflict with the public interest
and/or higher legislation, then the Minister of Home Affairs with recommendation from the Minister of
Finance annuls the legislation.
Revenue sharing is generated from taxes including income and property tax, and from natural resources
management such as, for instance, mining yields in the respective region. The last two sources of fund, DAU
and DAK, are provided by the national government. DAU is allocated based on certain criteria that emphasize
the even distribution and justice across regions. It is allocated following a certain percentage of state revenue
as specified in the State Revenue and Expenditure (APBN). DAK is allocated from APBN to a particular region
to finance specific activities in the region that are mandated by the national government on the basis of
national priorities, and financing specific activities proposed by the regional government. Other sources of
income include grants and emergency funds. Grants may come from the national government, community
and private sector both domestically or abroad. Grants received from abroad are done through the national
government.
Regional governments are not allowed to take a loan directly from parties outside of the country. However,
they can take a foreign loan channeled through the Ministry of Finance on behalf of the national government
after obtaining consideration from the Ministry of Home Affairs.
Indonesia Country Profile
25
Regional expenditure is generally divided into: 1) state apparatus expenditure, 2) public expenditure, 3)
financial assistance expenditure, and 4) contingency. Expenditure for environmental programs (particularly
for air quality management program) is further divided into a direct and indirect spending of technical
agencies that are associated with the management of air quality (environment agency, industry, transport,
sanitation, and others). Thus, the expenditure for air quality program can be said as a total sum of
expenditures related to air quality management incurred by all relevant agencies.
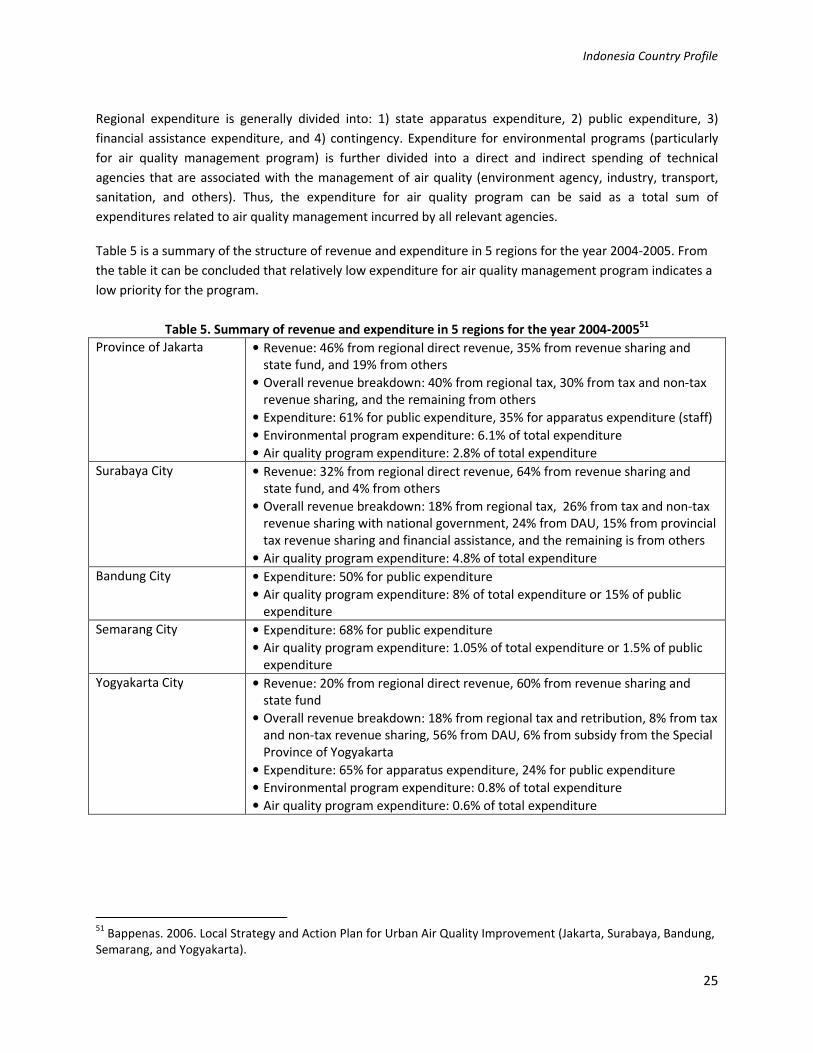
Table 5 is a summary of the structure of revenue and expenditure in 5 regions for the year 2004-2005. From
the table it can be concluded that relatively low expenditure for air quality management program indicates a
low priority for the program.
Table 5. Summary of revenue and expenditure in 5 regions for the year 2004-200551
Province of Jakarta • Revenue: 46% from regional direct revenue, 35% from revenue sharing and
state fund, and 19% from others
• Overall revenue breakdown: 40% from regional tax, 30% from tax and non-tax
revenue sharing, and the remaining from others
• Expenditure: 61% for public expenditure, 35% for apparatus expenditure (staff)
• Environmental program expenditure: 6.1% of total expenditure
• Air quality program expenditure: 2.8% of total expenditure
Surabaya City • Revenue: 32% from regional direct revenue, 64% from revenue sharing and
state fund, and 4% from others
• Overall revenue breakdown: 18% from regional tax, 26% from tax and non-tax
revenue sharing with national government, 24% from DAU, 15% from provincial
tax revenue sharing and financial assistance, and the remaining is from others
• Air quality program expenditure: 4.8% of total expenditure
Bandung City • Expenditure: 50% for public expenditure
• Air quality program expenditure: 8% of total expenditure or 15% of public
expenditure
Semarang City • Expenditure: 68% for public expenditure
• Air quality program expenditure: 1.05% of total expenditure or 1.5% of public
expenditure
Yogyakarta City • Revenue: 20% from regional direct revenue, 60% from revenue sharing and
state fund
• Overall revenue breakdown: 18% from regional tax and retribution, 8% from tax
and non-tax revenue sharing, 56% from DAU, 6% from subsidy from the Special
Province of Yogyakarta
• Expenditure: 65% for apparatus expenditure, 24% for public expenditure
• Environmental program expenditure: 0.8% of total expenditure
• Air quality program expenditure: 0.6% of total expenditure
51
Bappenas. 2006. Local Strategy and Action Plan for Urban Air Quality Improvement (Jakarta, Surabaya, Bandung,
Semarang, and Yogyakarta).
Indonesia Country Profile
26
4. STAKEHOLDERS
No less than the Constitution of the Republic of Indonesia recognizes the right of every person to enjoy a
good and healthy environment. Laws and regulations support stakeholder participation in decision making on
matters of the environment. This Chapter takes a look at whether stakeholders actively participate in air
quality management especially in regional governments in Indonesia.
National government agencies
An important contribution by the national government agencies in air quality management by cities is in
capacity building and technical guidance to cities in air quality policy and action plan implementation. While
some cities have been proactive in passing bylaws to control air pollution (e.g., Bandung, Bogor, Batam
Balikpapan, Jakarta, Surabaya, Yogyakarta), some cities require technical guidance and assistance from the
national government. Lacking such technical guidance, some regional governments may find it difficult to
implement national policies.
Regional government associations
There are several regional government associations which provide assistance to its members (Annex 12). The
common aim of these regional government associations is to create synergies among their members and to
build the capacity of members in different areas of concern. These associations would be important partners
in promoting better air quality management in Indonesia’s cities, regencies, and provinces:
• Asosiasi Pemerintah Kabupaten Seluruh Indonesia (APKASI - Indonesian Governmental Regencies
Association). APKASI programs focus on advocacy, capacity building and regional cooperation. The
association has also published some publications such as newsletters, best practices in various fields
(one-stop public service, government information system, etc.)
• Asosiasi Dewan Perwakilan Rakyat Daerah Kabupaten Seluruh Indonesia (ADKASI - Association of
Indonesian Regency Parliament) aims to achieve an effective legislative body by encouraging good
governance towards sustainable development in the framework of regional autonomy and
democracy
• Asosiasi Pemerintah Provinsi Seluruh Indonesia (APPSI – Association for Provincial Government of
Indonesia) aims to build harmonious relationship between national and regional government, and to
increase the capacity of regional government through education and training activities, research,
seminars
• Asosiasi Pemerintah Kota Seluruh Indonesia (APEKSI - Indonesian Municipalities Association) aims to
empower cities in implementing regional autonomy and create an amicable cooperation between
city governments
• Asosiasi DPRD Kota Seluruh Indonesia (ADEKSI - Indonesian Municipal Councils Association) aims to
improve quality of life through enhancing regional democracy
Indonesia Country Profile
27
Nongovernment Organizations (NGOs)
The activities of NGOs related to air pollution issues can be grouped into three: (a) public awareness
campaigns, (b) policy advocacy and reform, and (c) technical solutions. The most important contributions of
NGOs in public awareness are in the phase out of leaded gasoline, establishment of stakeholder networks
[e.g., Mitra Emisi Bersih (MEB), Asosiasi Emisi Bersih (AEB), and Gerakan Peduli Udara Bersih (GPUB)], setting
up of call center or hotline to report polluting vehicles, and organizing the Car Free Day. In policy advocacy
and reform, NGOs assist in the formulation of air pollution control legislation at the sub-national or regional
government level; and phase out of leaded gasoline nationwide. NGOs also propose technical solutions and
assist in implementing them such as ecodriving and cleaning up buses.
Media
The media coverage and public service advertisements have helped bring air pollution problems to the
attention of national and regional agencies responsible for managing air quality. Media has helped shape the
opinion of decision-makers in favor of better air quality management.
Universities and academe
Universities and academe have conducted scientific research in the field of air pollution. The main studies
include:
• Personal exposure monitoring of CO and PM2.5 in Jakarta (University of Indonesia, 2005)
• Blood lead levels in school children in Jakarta and Bandung (University of Indonesia and ITB, 2004-
2005)
• Blood lead levels in street vendors in Surabaya (University of Airlangga, 2004)
• Cohort study on the relationship between respiratory symptoms and air pollution in school children
in Jakarta (University of Indonesia, 2001)
• Blood lead levels in public minibus drivers in Surabaya (University of Airlangga, 1999)
• Measurement of bio-diesel emission levels (ITB, 2006)
• Various sustainable transport studies (PUSTRAL - University of Gajah Mada, 2001-to date)
Development Agencies
Development agencies provide technical and financial support through projects aimed to improve air quality
management. Some of the main air quality related projects in Indonesia supported by development agencies
were:
• Indonesia country natural resource environment analysis and National development planning
response to climate change (DANIDA, 2007)
• Integrated vehicle emission reduction strategy for greater Jakarta, Indonesia (ADB Regional Technical
Assistance 5937 in 2002)
• National strategy and action plan for urban air quality improvement, and local strategy and action
plan for 5 urban cities (ADB, 2005-2006)
• Urban air quality management strategy in Asia: Jakarta report (World Bank, 1995)
Indonesia Country Profile
28
• Jakarta Clean Air Project (Swiss Agency for Development and Technical Cooperation, 1997 to 2007)
• The study on integrated transport master plan for JABODETABEK – SITRAMP (JICA, 2004)
• The study on the integrated air quality management for Jakarta metropolitan area (JICA, 1997)
Indonesia Country Profile
29
5. FINDINGS
The findings of the report focus on the three main areas discussed in the previous chapters: (1) state of the
air, (2) legal framework for air quality management, and (3) stakeholder participation in air quality
management.
• State of the air: Determining the status of air quality in Indonesian cities, at the moment, is possible
only for cities which monitor air quality. Air quality monitoring results for the cities of Jakarta,
Surabaya, and Bandung, indicate that parameters PM10 in these cities, and O3 in Jakarta exceed the
national or provincial ambient air quality standards and/or WHO air quality guideline. The SO2 annual
average trend from 2001-2007 in three cities (Jakarta, Surabaya and Bandung) is increasing. Among
these three cities, Surabaya has the highest SO2 average concentration; which corresponds to
Surabaya’s being one of the major industrial areas in the country. PM10 is a significant pollutant in
Indonesia. While the average annual PM10 trend in Jakarta, Surabaya and Bandung is decreasing
(Figure 3), in 2008, the annual average PM10 level of about 50 µg/m3 based on data taken from 12
stations in 6 cities show PM10 levels of four out of six cities exceeded the WHO guideline value of
20μg/m3 (annual). However, if Pollutant Standard Index (PSI) reports are considered, the air quality
in Surabaya and Jakarta shows some level of improvement based on the increasing number of “Good
Days” in the last 2-3 years for Surabaya and from 2005 to 2008 for Jakarta. However, the trend of
improved air quality in Jakarta and Surabaya needs to be further studied to verify the underlying
factors including the limitations of using the PSI to assess a city’s air quality.
• Legal framework for air quality management: While some technical guidelines for air quality
management have yet to be issued by national government agencies, the basic laws and regulations
to guide air quality management in cities are in place (e.g., ambient air quality standards, fuel quality
standards, emission standards for industrial and mobile sources). Cities are vested with power and
authority to develop and implement air quality action plans and related plans (e.g., city
development, transport, and spatial plans). With support from projects funded by development
agencies, some of the larger cities have developed air quality action plans; smaller cities still require
assistance for air quality action plan formulation. Revenue laws allow cities some access to sources
of funding for air quality programs. However, from a study of selected cities, expenditure for air
quality management currently constitutes a very small portion of total city expenditure.
• Stakeholders: An important lesson learned from previous action planning exercises is the need for
local ownership of the action plan. This can be achieved by involving stakeholders in the formulation
process from beginning to end. National government agencies (through technical guidelines and
support), educational institutions and academe (through scientific studies), NGOs (through public
awareness, policy advocacy and reform, and technical solutions), private sector (technologies and
other support) and development agencies (technical and financial assistance) assist smaller cities in
many aspects of air quality management. They should be involved in the action planning and action
plan implementation. Regional government associations could play an important role in the
systematic and wide dissemination of case studies (e.g., good practices, air quality policies and
programs) and in capacity building on air quality management for their member local governments.
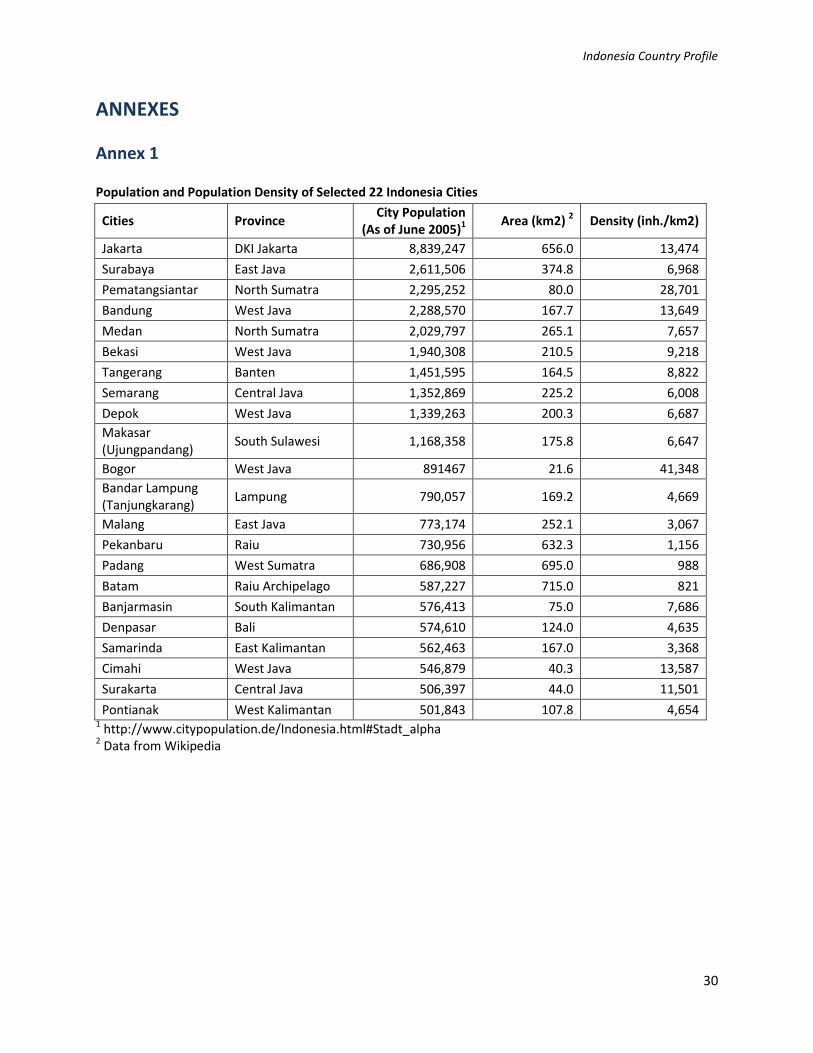
Indonesia Country Profile
30
ANNEXES
Annex 1
Population and Population Density of Selected 22 Indonesia Cities
Cities Province City Population
(As of June 2005)1
Area (km2) 2 Density (inh./km2)
Jakarta DKI Jakarta 8,839,247 656.0 13,474
Surabaya East Java 2,611,506 374.8 6,968
Pematangsiantar North Sumatra 2,295,252 80.0 28,701
Bandung West Java 2,288,570 167.7 13,649
Medan North Sumatra 2,029,797 265.1 7,657
Bekasi West Java 1,940,308 210.5 9,218
Tangerang Banten 1,451,595 164.5 8,822
Semarang Central Java 1,352,869 225.2 6,008
Depok West Java 1,339,263 200.3 6,687
Makasar
(Ujungpandang) South Sulawesi 1,168,358 175.8 6,647
Bogor West Java 891467 21.6 41,348
Bandar Lampung
(Tanjungkarang) Lampung 790,057 169.2 4,669
Malang East Java 773,174 252.1 3,067
Pekanbaru Raiu 730,956 632.3 1,156
Padang West Sumatra 686,908 695.0 988
Batam Raiu Archipelago 587,227 715.0 821
Banjarmasin South Kalimantan 576,413 75.0 7,686
Denpasar Bali 574,610 124.0 4,635
Samarinda East Kalimantan 562,463 167.0 3,368
Cimahi West Java 546,879 40.3 13,587
Surakarta Central Java 506,397 44.0 11,501
Pontianak West Kalimantan 501,843 107.8 4,654 1 http://www.citypopulation.de/Indonesia.html#Stadt_alpha
2 Data from Wikipedia
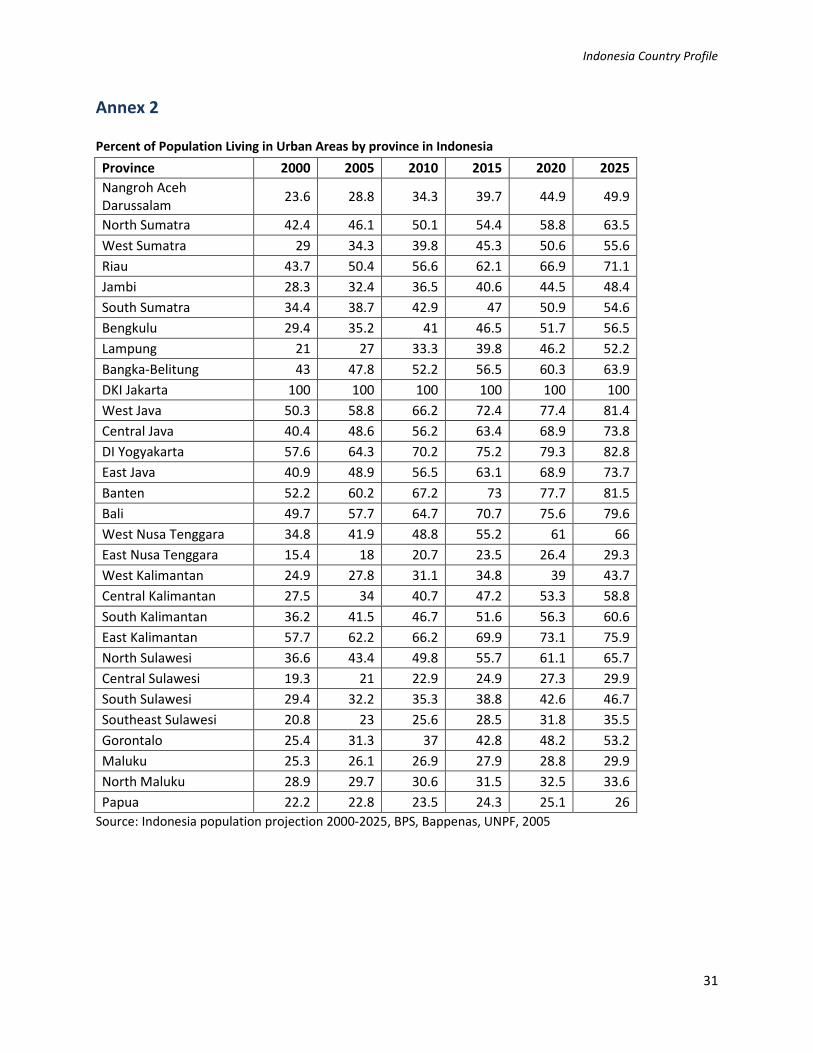
Indonesia Country Profile
31
Annex 2
Percent of Population Living in Urban Areas by province in Indonesia
Province 2000 2005 2010 2015 2020 2025
Nangroh Aceh
Darussalam 23.6 28.8 34.3 39.7 44.9 49.9
North Sumatra 42.4 46.1 50.1 54.4 58.8 63.5
West Sumatra 29 34.3 39.8 45.3 50.6 55.6
Riau 43.7 50.4 56.6 62.1 66.9 71.1
Jambi 28.3 32.4 36.5 40.6 44.5 48.4
South Sumatra 34.4 38.7 42.9 47 50.9 54.6
Bengkulu 29.4 35.2 41 46.5 51.7 56.5
Lampung 21 27 33.3 39.8 46.2 52.2
Bangka-Belitung 43 47.8 52.2 56.5 60.3 63.9
DKI Jakarta 100 100 100 100 100 100
West Java 50.3 58.8 66.2 72.4 77.4 81.4
Central Java 40.4 48.6 56.2 63.4 68.9 73.8
DI Yogyakarta 57.6 64.3 70.2 75.2 79.3 82.8
East Java 40.9 48.9 56.5 63.1 68.9 73.7
Banten 52.2 60.2 67.2 73 77.7 81.5
Bali 49.7 57.7 64.7 70.7 75.6 79.6
West Nusa Tenggara 34.8 41.9 48.8 55.2 61 66
East Nusa Tenggara 15.4 18 20.7 23.5 26.4 29.3
West Kalimantan 24.9 27.8 31.1 34.8 39 43.7
Central Kalimantan 27.5 34 40.7 47.2 53.3 58.8
South Kalimantan 36.2 41.5 46.7 51.6 56.3 60.6
East Kalimantan 57.7 62.2 66.2 69.9 73.1 75.9
North Sulawesi 36.6 43.4 49.8 55.7 61.1 65.7
Central Sulawesi 19.3 21 22.9 24.9 27.3 29.9
South Sulawesi 29.4 32.2 35.3 38.8 42.6 46.7
Southeast Sulawesi 20.8 23 25.6 28.5 31.8 35.5
Gorontalo 25.4 31.3 37 42.8 48.2 53.2
Maluku 25.3 26.1 26.9 27.9 28.8 29.9
North Maluku 28.9 29.7 30.6 31.5 32.5 33.6
Papua 22.2 22.8 23.5 24.3 25.1 26
Source: Indonesia population projection 2000-2025, BPS, Bappenas, UNPF, 2005
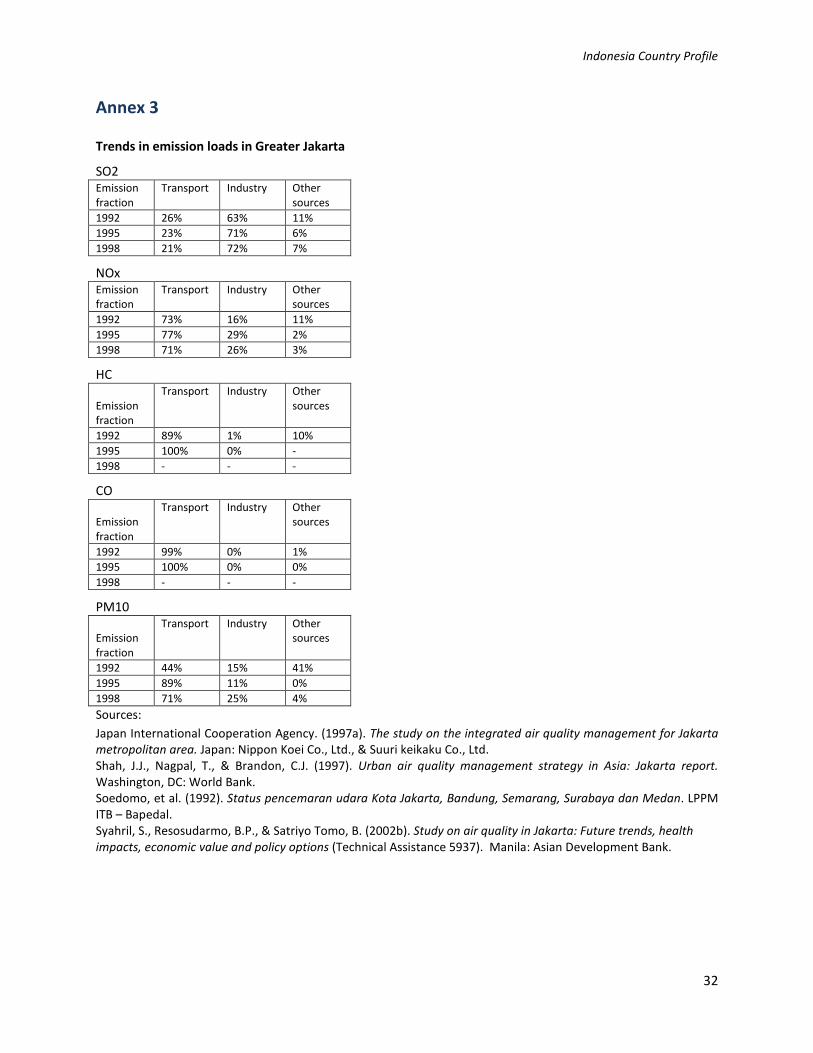
Indonesia Country Profile
32
Annex 3
Trends in emission loads in Greater Jakarta
SO2 Emission
fraction
Transport Industry Other
sources
1992 26% 63% 11%
1995 23% 71% 6%
1998 21% 72% 7%
NOx Emission
fraction
Transport Industry Other
sources
1992 73% 16% 11%
1995 77% 29% 2%
1998 71% 26% 3%
HC
Emission
fraction
Transport Industry Other
sources
1992 89% 1% 10%
1995 100% 0% -
1998 - - -
CO
Emission
fraction
Transport Industry Other
sources
1992 99% 0% 1%
1995 100% 0% 0%
1998 - - -
PM10
Emission
fraction
Transport Industry Other
sources
1992 44% 15% 41%
1995 89% 11% 0%
1998 71% 25% 4%
Sources:
Japan International Cooperation Agency. (1997a). The study on the integrated air quality management for Jakarta
metropolitan area. Japan: Nippon Koei Co., Ltd., & Suuri keikaku Co., Ltd.
Shah, J.J., Nagpal, T., & Brandon, C.J. (1997). Urban air quality management strategy in Asia: Jakarta report.
Washington, DC: World Bank.
Soedomo, et al. (1992). Status pencemaran udara Kota Jakarta, Bandung, Semarang, Surabaya dan Medan. LPPM
ITB – Bapedal.
Syahril, S., Resosudarmo, B.P., & Satriyo Tomo, B. (2002b). Study on air quality in Jakarta: Future trends, health
impacts, economic value and policy options (Technical Assistance 5937). Manila: Asian Development Bank.
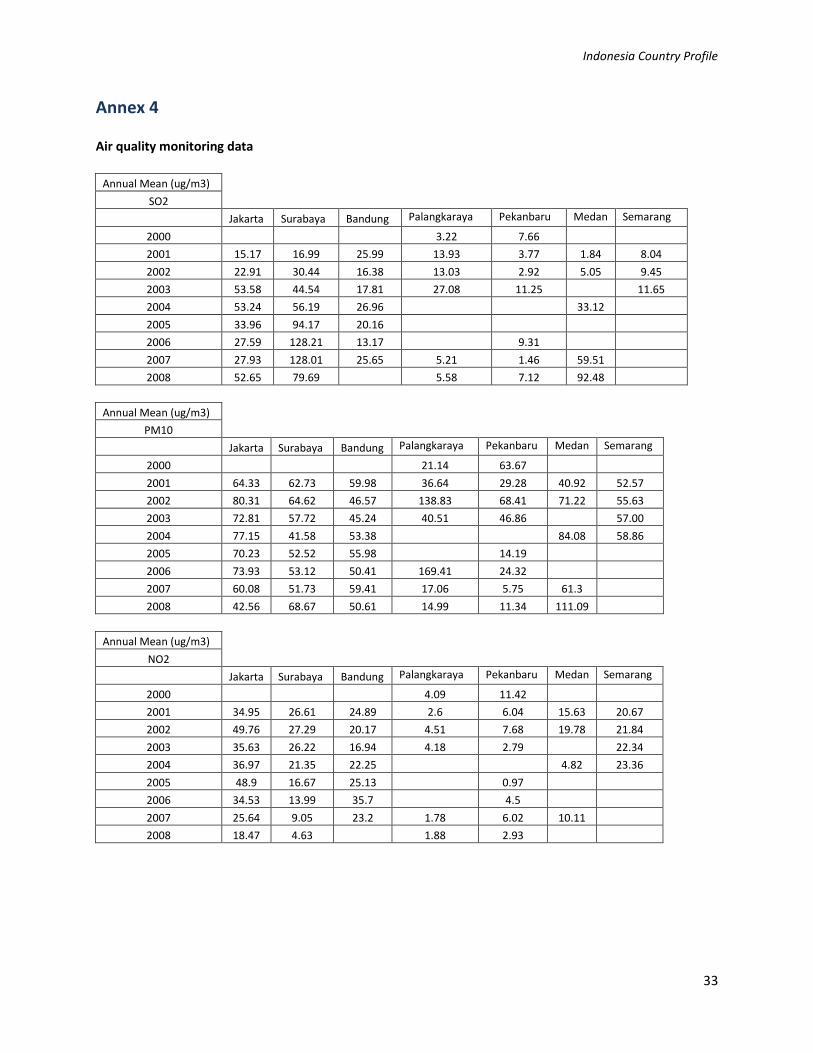
Indonesia Country Profile
33
Annex 4
Air quality monitoring data
Annual Mean (ug/m3)
SO2
Jakarta Surabaya Bandung Palangkaraya Pekanbaru Medan Semarang
2000 3.22 7.66
2001 15.17 16.99 25.99 13.93 3.77 1.84 8.04
2002 22.91 30.44 16.38 13.03 2.92 5.05 9.45
2003 53.58 44.54 17.81 27.08 11.25 11.65
2004 53.24 56.19 26.96 33.12
2005 33.96 94.17 20.16
2006 27.59 128.21 13.17 9.31
2007 27.93 128.01 25.65 5.21 1.46 59.51
2008 52.65 79.69 5.58 7.12 92.48
Annual Mean (ug/m3)
PM10
Jakarta Surabaya Bandung Palangkaraya Pekanbaru Medan Semarang
2000 21.14 63.67
2001 64.33 62.73 59.98 36.64 29.28 40.92 52.57
2002 80.31 64.62 46.57 138.83 68.41 71.22 55.63
2003 72.81 57.72 45.24 40.51 46.86 57.00
2004 77.15 41.58 53.38 84.08 58.86
2005 70.23 52.52 55.98 14.19
2006 73.93 53.12 50.41 169.41 24.32
2007 60.08 51.73 59.41 17.06 5.75 61.3
2008 42.56 68.67 50.61 14.99 11.34 111.09
Annual Mean (ug/m3)
NO2
Jakarta Surabaya Bandung Palangkaraya Pekanbaru Medan Semarang
2000 4.09 11.42
2001 34.95 26.61 24.89 2.6 6.04 15.63 20.67
2002 49.76 27.29 20.17 4.51 7.68 19.78 21.84
2003 35.63 26.22 16.94 4.18 2.79 22.34
2004 36.97 21.35 22.25 4.82 23.36
2005 48.9 16.67 25.13 0.97
2006 34.53 13.99 35.7 4.5
2007 25.64 9.05 23.2 1.78 6.02 10.11
2008 18.47 4.63 1.88 2.93
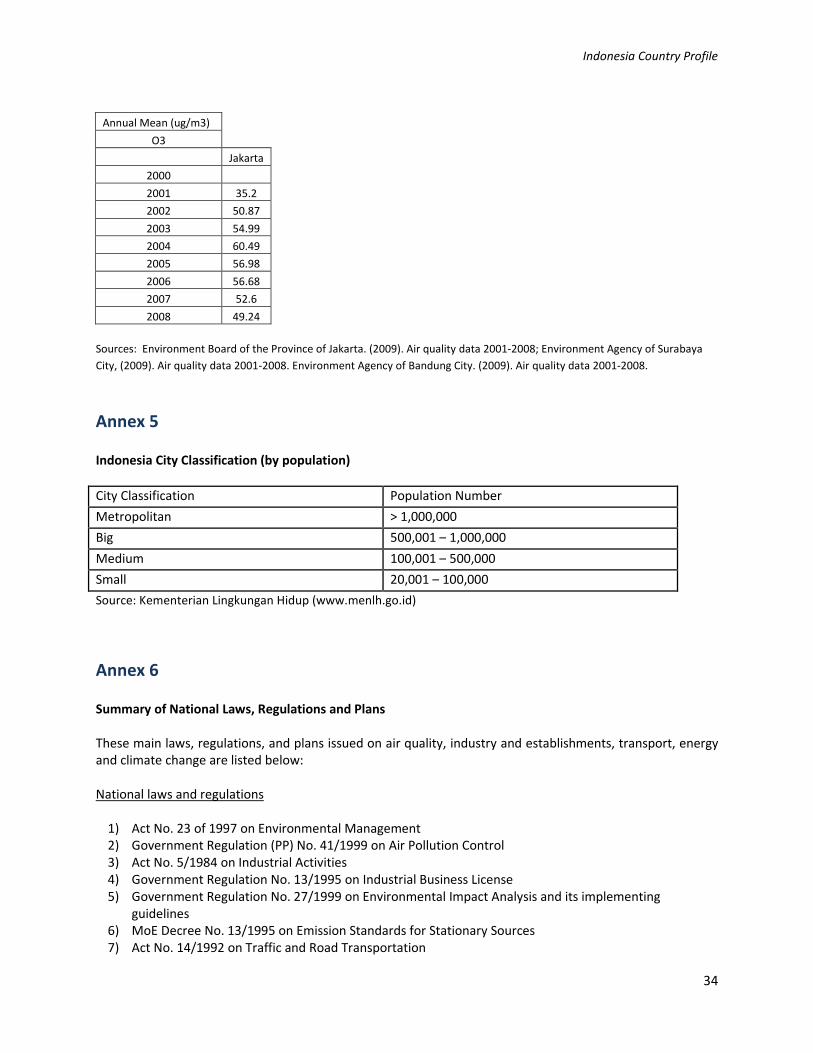
Indonesia Country Profile
34
Annual Mean (ug/m3)
O3
Jakarta
2000
2001 35.2
2002 50.87
2003 54.99
2004 60.49
2005 56.98
2006 56.68
2007 52.6
2008 49.24
Sources: Environment Board of the Province of Jakarta. (2009). Air quality data 2001-2008; Environment Agency of Surabaya
City, (2009). Air quality data 2001-2008. Environment Agency of Bandung City. (2009). Air quality data 2001-2008.
Annex 5
Indonesia City Classification (by population)
City Classification Population Number
Metropolitan > 1,000,000
Big 500,001 – 1,000,000
Medium 100,001 – 500,000
Small 20,001 – 100,000
Source: Kementerian Lingkungan Hidup (www.menlh.go.id)
Annex 6
Summary of National Laws, Regulations and Plans
These main laws, regulations, and plans issued on air quality, industry and establishments, transport, energy
and climate change are listed below:
National laws and regulations
1) Act No. 23 of 1997 on Environmental Management
2) Government Regulation (PP) No. 41/1999 on Air Pollution Control
3) Act No. 5/1984 on Industrial Activities
4) Government Regulation No. 13/1995 on Industrial Business License
5) Government Regulation No. 27/1999 on Environmental Impact Analysis and its implementing
guidelines
6) MoE Decree No. 13/1995 on Emission Standards for Stationary Sources
7) Act No. 14/1992 on Traffic and Road Transportation
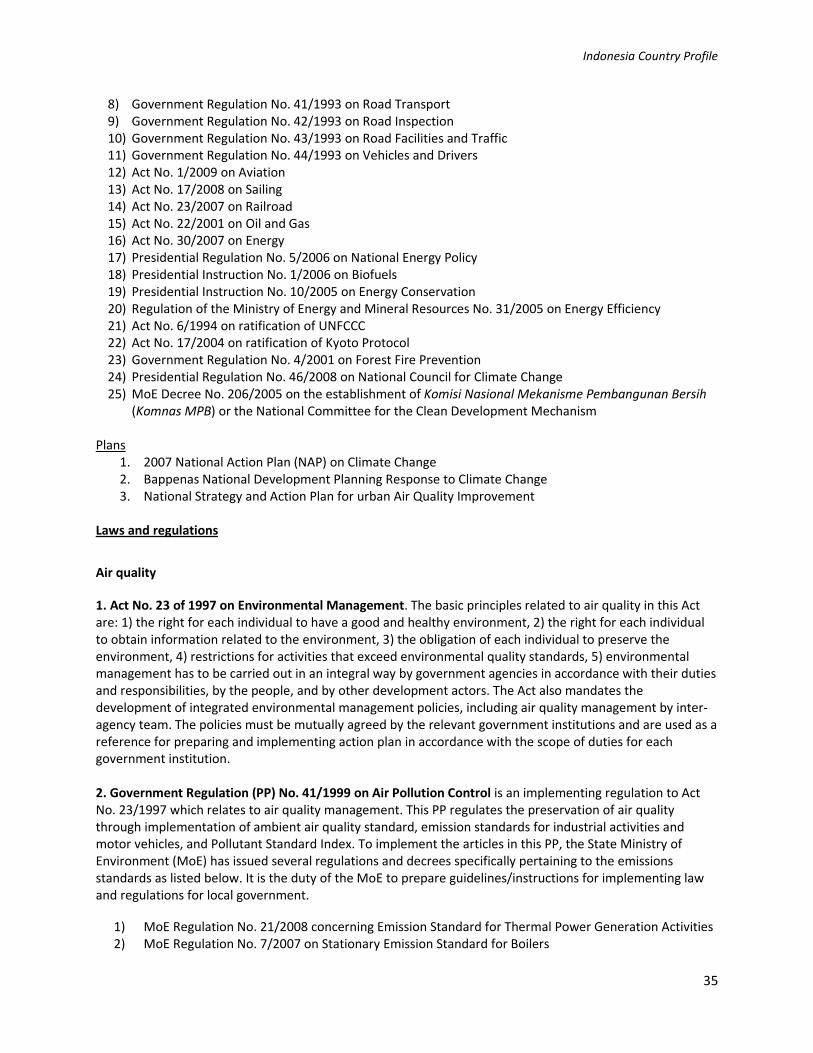
Indonesia Country Profile
35
8) Government Regulation No. 41/1993 on Road Transport
9) Government Regulation No. 42/1993 on Road Inspection
10) Government Regulation No. 43/1993 on Road Facilities and Traffic
11) Government Regulation No. 44/1993 on Vehicles and Drivers
12) Act No. 1/2009 on Aviation
13) Act No. 17/2008 on Sailing
14) Act No. 23/2007 on Railroad
15) Act No. 22/2001 on Oil and Gas
16) Act No. 30/2007 on Energy
17) Presidential Regulation No. 5/2006 on National Energy Policy
18) Presidential Instruction No. 1/2006 on Biofuels
19) Presidential Instruction No. 10/2005 on Energy Conservation
20) Regulation of the Ministry of Energy and Mineral Resources No. 31/2005 on Energy Efficiency
21) Act No. 6/1994 on ratification of UNFCCC
22) Act No. 17/2004 on ratification of Kyoto Protocol
23) Government Regulation No. 4/2001 on Forest Fire Prevention
24) Presidential Regulation No. 46/2008 on National Council for Climate Change
25) MoE Decree No. 206/2005 on the establishment of Komisi Nasional Mekanisme Pembangunan Bersih
(Komnas MPB) or the National Committee for the Clean Development Mechanism
Plans
1. 2007 National Action Plan (NAP) on Climate Change
2. Bappenas National Development Planning Response to Climate Change
3. National Strategy and Action Plan for urban Air Quality Improvement
Laws and regulations
Air quality
1. Act No. 23 of 1997 on Environmental Management. The basic principles related to air quality in this Act
are: 1) the right for each individual to have a good and healthy environment, 2) the right for each individual
to obtain information related to the environment, 3) the obligation of each individual to preserve the
environment, 4) restrictions for activities that exceed environmental quality standards, 5) environmental
management has to be carried out in an integral way by government agencies in accordance with their duties
and responsibilities, by the people, and by other development actors. The Act also mandates the
development of integrated environmental management policies, including air quality management by inter-
agency team. The policies must be mutually agreed by the relevant government institutions and are used as a
reference for preparing and implementing action plan in accordance with the scope of duties for each
government institution.
2. Government Regulation (PP) No. 41/1999 on Air Pollution Control is an implementing regulation to Act
No. 23/1997 which relates to air quality management. This PP regulates the preservation of air quality
through implementation of ambient air quality standard, emission standards for industrial activities and
motor vehicles, and Pollutant Standard Index. To implement the articles in this PP, the State Ministry of
Environment (MoE) has issued several regulations and decrees specifically pertaining to the emissions
standards as listed below. It is the duty of the MoE to prepare guidelines/instructions for implementing law
and regulations for local government.
1) MoE Regulation No. 21/2008 concerning Emission Standard for Thermal Power Generation Activities
2) MoE Regulation No. 7/2007 on Stationary Emission Standard for Boilers
Indonesia Country Profile
36
3) MoE Regulation No. 5/2006 on Emission Standard Limits for In-use Motor Vehicles
4) MoE Decree No. 133/2004 on Emission Standard for Fertilizer Industry
5) MoE Decree No. 252/2004 on Mandatory Disclosure of Automotive Emissions Program
6) MoE Decree No. 141/2003 on Emission Standard Limits for New Types of Motor Vehicles and Motor
Vehicles in Current Production (superseded by MoE Regulation No. 4/2009)
7) MoE Decree No. 129/2003 on Emission Standard for Oil and Gas Activities (superseded by MoE
Regulation No. 13/2009)
8) MoE Decree No. 45/1997 on Air Pollutant Standard Index
9) MoE Decree No. 48/1996 on Noise Standard
10) MoE Decree No. 49/1996 on Vibration Standard
11) MoE Decree No. 13/1995 on Emission Standards for Stationary Sources (iron and steel, pulp and
paper, coal-fired power plant, and cement)
Industry and establishment
3. Act No. 5/1984 on Industrial Activities does not specifically regulate air quality management but it
prohibits activities that damage the quality of the environment and ecosystem.
4. PP No. 13/1995 on Industrial Business License is one of the implementing regulations of Act No. 5/1984. It
binds industry to comply with environmental regulations as one of the requirements to obtain a business
license.
5. PP No. 27/1999 concerning Environmental Impact Analysis and its implementing guidelines require the
proponents of efforts or activities to prepare an environmental management and monitoring plan and
implement the plan.
6. MoE Decree No. 13/1995 on Emission Standards for Stationary Sources (iron and steel, pulp and paper,
coal-fired power plant, and cement). These industrial emissions standard regulations are the most referred
regulations in the industrial sector with regard to air pollution control. The regulations provide authority for
regional (provincial) government to set out emission and ambient air quality standards applicable for their
region.
Transport
7. Act No. 14/1992 on Traffic and Road Transportation (amended in 2009) stipulates that vehicle emission
test is an integral part of roadworthiness test. Hence the responsibility for vehicle emission test lies with the
transportation institution. With the amendment of Traffic and Road Transportation Act, a series of its
implementing regulations will be subsequently revised.
8. Government Regulation No. 41/1993 on Road Transport, an implementing regulation of Act No. 14/1992,
regulates the transportation of goods and people, transportation route, route licensing, and transportation
tariff
9. Government Regulation No. 42/1993 concerning Road Inspection, an implementing regulation of Act No.
14/1992, regulates random on-road inspection to verify the result of roadworthiness test conducted at fixed
test centers
10. Government Regulation No. 43/1993 on Road Facilities and Traffic, an implementing regulation of Act
No. 14/1992, regulates traffic management and engineering
Indonesia Country Profile
37
11. Government Regulation No. 44/1993 on Vehicles and Drivers, an implementing regulation of Act No.
14/1992, regulates technical requirements and roadworthiness, motor vehicle testing, and driving license
In addition to the legislation on land transportation, there are other Acts on transportation. These are:
12. Act No. 1/2009 on Aviation
13. Act No. 17/2008 on Sailing
14. Act No. 23/2007 on Railroad
Energy
15. Act No. 22/2001 concerning Oil and Gas is the legal basis for the provision of cleaner fuel through the
implementation of fuel specification set by the government (Directorate General of Oil and Gas). This Act also
opens business opportunity for companies other than the state-owned oil company Pertamina to produce
and distribute fuel.
16. Act No. 30/2007 concerning Energy requires energy management to be based on the principle of
sustainability and environmental protection, among others. This Act regulates energy resilience, new and
renewable energy, energy prices, and the establishment of National Energy Council (NEC). The NEC is led by
the President along with members selected and chosen by the House of Representative. The task of NEC is to
formulate energy policy, design the overall national energy plan, determine emergency response plan in the
event of energy crisis, and supervise the implementation of cross-sectoral policies by the relevant
government institutions in the field of energy. This Act also stipulates that energy conservation is given
incentive, while energy dissipation is given disincentive. But the Act does not mention specifically the form of
incentive/disincentive.
17. Presidential Regulation No. 5/2006 concerning National Energy Policy set the target for energy mix by
2025. The decree states that the contribution of fossil oil as a source of energy is targeted to be reduced from
52% in the year 2003 to 26.2% in the year 2025 of the total energy demand. While for other sources of
energy, contribution of geothermal is targeted to increase from 3.1% to 3.8%, natural gas from 21.2% to
30.6%, coal from 19.7% to 32.7%, and renewable energy from 0.2% to 4.4%. On the other hand the
contribution of hydropower is targeted to be reduced from 3.8% to 2.4%.
18. In response to the rising global oil prices and Indonesia’s over reliance on fossil fuels, the president
instructed the relevant line ministries and local government through Presidential Instruction No. 1/2006 to
take necessary action to accelerate the production and utilization of biofuel as an alternative source of
energy.
19. Presidential Instruction No. 10/2005 and
20. Regulation of the Ministry of Energy and Mineral Resources No. 31/2005 require government agencies
to undertake energy conservation in offices, office equipment, and transportation, and for industries to
undertake energy audits and promote use of energy saving products or technology.
Climate change
21. Indonesia ratified the UNFCCC through Act No. 6/1994
22. Indonesia ratified the Kyoto Protocol through Act No. 17/2004.
Indonesia Country Profile
38
23. Government Regulation No. 4/2001 on Forest Fire Prevention is one of the current basic laws in
Indonesia being the most closely related to climate change.
24. Presidential Regulation No. 46/2008 concerning National Council for Climate Change stipulates that the
establishment of Council is to coordinate the implementation of climate change mitigation efforts and to
strengthen Indonesia’s position in international fora for mitigating climate change. The Council is headed by
the President, and has as its core task, among others, to develop national policy, strategy, program and
action plan for mitigating climate change; formulate strategy and mechanism for carbon trade; and monitor
and evaluate strategy implementation.
25. The MoE Decree No. 206/2005 concerning the establishment of Komisi Nasional Mekanisme
Pembangunan Bersih (Komnas MPB) or the National Committee for the Clean Development Mechanism
states that the Komnas MPB functions as Indonesia’s Designated National Agency (DNA) and is responsible
for assessing, evaluating, and monitoring CDM activities in Indonesia. The structure of the Committee
consists of the National Executive Board with representatives from nine national government institutions.
The head of the Committee is MoE.
Plans
1. 2007 National Action Plan (NAP) on Climate Change. Indonesia’s main guiding document in relation to
climate change is the 2007 NAP on Climate Change. The NAP provides guidance for various agencies in
carrying efforts to tackle climate change and sets out requirements for institutional coordination. The NAP
provides for immediate action between 2007-2009, short-term action between 2009-2012, medium-term
action between 2012-2025, and long-term action between 2025-2050.
2. National Development Planning Response to Climate Change. Besides the 2007 NAP developed under the
coordination of MoE, State Ministry for National Development Planning/National Development Planning
Board (Bappenas) also issued the National Development Planning Response to Climate Change. This
document aims to mainstream environmental and natural resource considerations into the development
planning process. It also discusses funding mechanism for climate change mitigation and adaptation program.
3. The National Strategy and Action Plan for urban Air Quality Improvement published in 2006 by an inter-
agency team led by Bappenas is an example of an integrated cross-sectoral policy document.
4. Regional development plan is developed by regional governments and comprises of: 1) Long Term
Development Plan of 20 years that refers to the National Long Term Development Plan, 2) Mid Term
Development Plan of 5 years that refers to the National Mid Term Development Plan, 3) Regional
Development Work Plan of 1 year which is derived from the Mid Term Development Plan. The government
agency responsible for preparing the regional development plan is the Regional Development Planning
Agency. Guided by the Regional Mid Term Development Plan, regional technical agencies then prepare a
strategic plan which defines vision, mission, goal, strategies, policies, programs, and activities in accordance
with the duties and functions of the respective agencies.
5. Regional or city spatial plans are developed by regional governments (province and regency/city) (Act No.
26/2007). Urban planning is governed by regional legislation and must be integrated with the national spatial
planning and has to be approved by Minister of Public Works before the bylaw is enacted.
6. Transport plans and regional or city development plans have to be integrated with the national spatial
planning. Regional government has its full authority to develop regional or city transport planning.
Indonesia Country Profile
39
Annex 7
Summary of Relevant Provisions of the Amended Traffic and Road Transportation Act
The road fund is collected by the Ministry of Public Works for the maintenance, rehabilitation and
reconstruction of roads. The source of the road fund may come from road users. Provisions concerning the
management and organization of the road fund shall be defined through presidential regulation.
Road facilities shall include bicycle lane, pedestrian pathway and crossing, and special facilities for persons
with disability. Further provisions shall be defined through government regulation.
Periodic roadworthiness test (including emission test) is mandatory for public vehicles, but not private cars.
Non-motorized transport. The Government must provide easy access to bicyclists. Bicyclists have a right to
safety, security, orderliness, and smooth mobility (Article 62). The local government may set out types and
use of non-motorized vehicles in accordance with the characteristic and demand of the city, and shall be
defined further through local legislation (Article 63).
Traffic management and engineering is done by: 1) giving priority to mass public transport (provision of
segregated lane), 2) giving priority to pedestrian safety and comfort, 3) providing easy access for people with
disability, 4) segregating traffic flow based on land use, mobility and accessibility, 5) integrating transport
modes, 6) maintaining traffic control at intersections, 7) maintaining traffic control on road segments, 8)
preserving the environment.
Road orderliness and safety. Motorists must give a priority to safety of pedestrians and bicyclists (Article 106
(2)).
Right and obligation of pedestrians. Pedestrians have a right to facilities such as pedestrian pathway,
crossing and other facilities. Pedestrian is given a priority when crossing the road at pedestrian crossing
(Article 131). An obligation of pedestrians is to use part of the road which is dedicated for pedestrians or use
the far edge of the road, use pedestrian crossing (Article 132 (1)). If a pedestrian crossing does not exist,
pedestrians must take care of their own safety when crossing the road. People with disabilities must wear
special signs that are visible to motorists (Article 132 (3)).
Annex 8
Fuel specifications following the decrees of Directorate General of Oil & Gas No. 3674 K/24/DJM/2006 for
gasoline and No. 3675 K/24/DJM/2006 for diesel
Gasoline
Item Unit
RON 88 RON 91 RON 95
Leaded Unleaded
Min Max Min Max Min Max Min Max
Research Octane Number RON 88.0 - 88.0 - 91.0 - 95.0 -
Sulfur content (S) % m/m - 0.05 - 0.05 - 0.05 - 0.05
Lead content (Pb) g/L - 0.3 - 0.013 - 0.013 - 0.013
Reid Vapor Pressure (RVP) kPa - 62 - 62 45 60 45 60
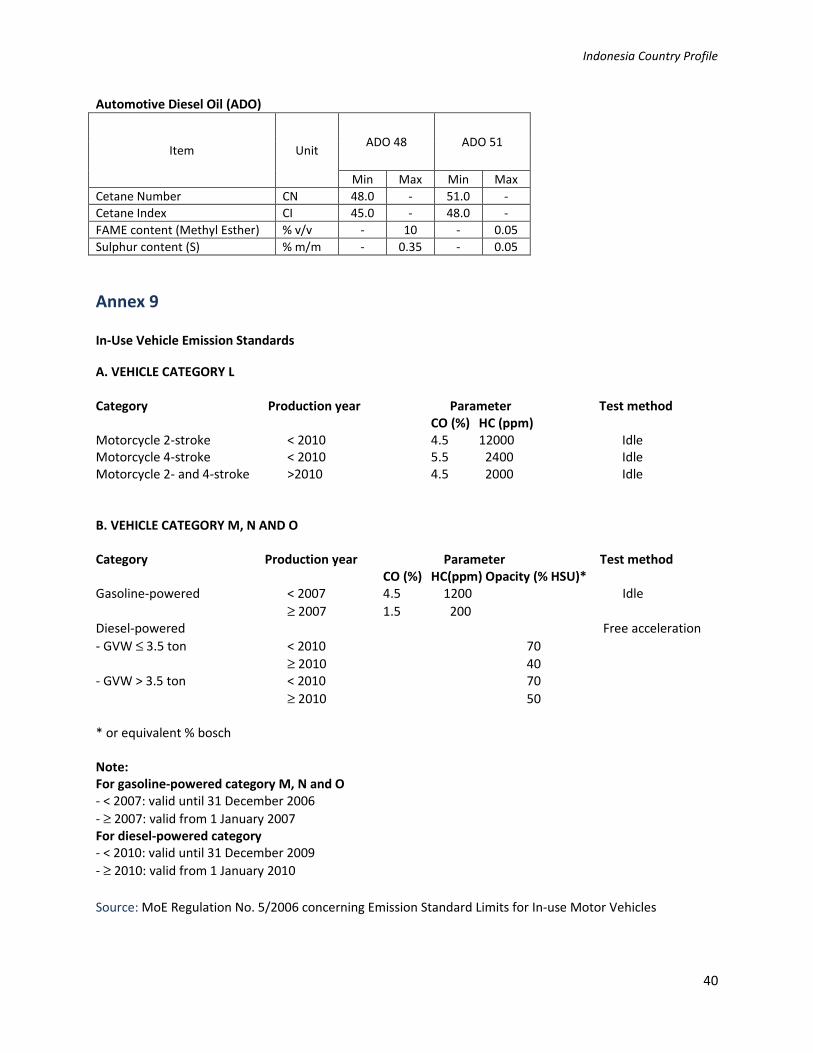
Indonesia Country Profile
40
Automotive Diesel Oil (ADO)
Item Unit ADO 48 ADO 51
Min Max Min Max
Cetane Number CN 48.0 - 51.0 -
Cetane Index CI 45.0 - 48.0 -
FAME content (Methyl Esther) % v/v - 10 - 0.05
Sulphur content (S) % m/m - 0.35 - 0.05
Annex 9
In-Use Vehicle Emission Standards
A. VEHICLE CATEGORY L
Category Production year Parameter Test method
CO (%) HC (ppm)
Motorcycle 2-stroke < 2010 4.5 12000 Idle
Motorcycle 4-stroke < 2010 5.5 2400 Idle
Motorcycle 2- and 4-stroke >2010 4.5 2000 Idle
B. VEHICLE CATEGORY M, N AND O
Category Production year Parameter Test method
CO (%) HC(ppm) Opacity (% HSU)*
Gasoline-powered < 2007 4.5 1200 Idle
≥ 2007 1.5 200
Diesel-powered Free acceleration
- GVW ≤ 3.5 ton < 2010 70
≥ 2010 40
- GVW > 3.5 ton < 2010 70
≥ 2010 50
* or equivalent % bosch
Note:
For gasoline-powered category M, N and O
- < 2007: valid until 31 December 2006
- ≥ 2007: valid from 1 January 2007
For diesel-powered category
- < 2010: valid until 31 December 2009
- ≥ 2010: valid from 1 January 2010
Source: MoE Regulation No. 5/2006 concerning Emission Standard Limits for In-use Motor Vehicles
Indonesia Country Profile
41
Annex 10
Regional Government Organization Structure
The head of a regional government may be a governor (province), regent (regency) or a mayor (city). The
head of a regional government is assisted by a deputy. Both the head and deputy head are elected by the
people in the respective region every 5 years. The tasks and responsibilities of the head of region are to: 1)
administer government affairs based on policies mutually agreed upon by the legislative body, 2) propose
regional bills, 3) issue legislation that has been approved by legislative and executive bodies, 4) prepare and
propose a regional bill on the regional budget to the legislative body, discuss the bill and finally issue the
bylaw, and 5) ensure that regional mandate is fulfilled. Besides having the obligations of improving the
welfare of the people, abiding by and enforcing laws and regulations, and promoting good governance, the
head of regional government also has the responsibility to present an annual accountability report on the
execution of the regional development plan to the national government (to President through the Minister of
Home Affairs for a governor, and to Minister of Home Affairs through the governor for a regent/mayor). The
head of regional government also submits the report to the regional House of Representatives.
The organizational structure of regional government consists of: regional executive secretariat, regional
legislative secretariat, inspectorate, regional development planning agency, regional technical agencies, and
district and sub-district governments. All the heads of these organizations are responsible to the head of the
regional government.
Environmental affairs, public works, transportation, development planning, and spatial planning are part of
mandatory government affairs that must be addressed by a regional government according to the
Government Regulation No. 38/2007 concerning Division of Government Affairs between National
Government, Provincial Government and Regency/City Government. A list of mandatory and optional
regional government affairs is presented in Annex 11.
The organization of these government affairs is guided by a minimum service standard defined by the
national government and is implemented in stages. The respective ministers set out norms, standards,
procedures, and criteria for the implementation of mandatory and optional government affairs by the
regional government. The Minister of Home Affairs coordinates the provision of such norms, standards,
procedures and criteria. However, in the event that norms, standards, procedures and criteria have not been
established for two years since the enactment of this Government Regulation, the regional government
continues to execute its authority without referring to any standards, procedures, etc. but in accordance with
the current legislation.
Annex 11
List of mandatory local government affairs (province and regency/city)
a. Education
b. Health
c. Environment
d. Public works
e. Spatial planning
f. Development planning
g. Housing
Indonesia Country Profile
42
h. Youth and sports
i. Investment
j. Cooperative and small medium-sized enterprises
k. Demography and civil record
l. Employment
m. Food security
n. Women’s empowerment and child protection
o. Family planning and prosperous family
p. Transportation
q. Communication and informatics
r. Land affairs
s. Nation Unity and domestic political affairs
t. Regional autonomy, general governance, financial administration
u. Organizational structure, personnel and security
v. Community development and villages
w. Social
x. Cultural
y. Statistics
z. Archives
aa. Library
List of optional regional government affairs (provincial and regency/city):
a. Marine and fishery
b. Agriculture
c. Forestry
d. Energy and mineral resources
e. Tourism
f. Industry
g. Commerce
h. Transmigration
Source: Government Regulation No. 38/2007 concerning Division of Government Affairs between National
Government, Provincial Government and Regency/City Government
Annex 12
Information about Regional Government Associations in Indonesia
1) Asosiasi Pemerintah Kabupaten Seluruh Indonesia (APKASI-Indonesian Governmental Regencies
Association). Website http://www.apkasi.or.id
APKASI was officially established by 26 heads of regencies on May 2000. The main function of APKASI is
to facilitate the creation of synergized and mutually beneficial relationship among APKASI members as
well as harmonious relationship between regency government, provincial government and national
government. The general meeting for members consists of: 1) National Convention organized every four
Indonesia Country Profile
43
year and 2) National Work Meeting organized at least once in four years. APKASI organization consists of:
1) Honorary Board, chaired by the Minister of Home Affairs and members comprise of governors, 2)
Executive Board, chaired by the chairman (head of a regency), 3) Regional Coordinator, and 4) Executive
Director. APKASI programs focus on advocacy, capacity building and regional cooperation. Source of
funding includes members’ compulsory fee, members’ voluntary contribution, unbinding third party’s
contribution and legal APKASI business revenue. The association has also published some publications
such as newsletters, best practices in various fields (one-stop public service, government information
system, etc.)
2) Asosiasi Dewan Perwakilan Rakyat Daerah Kabupaten Seluruh Indonesia (ADKASI- Association of
Indonesian Regency Parliament). Website http://www.adkasi.org
ADKASI was established on August 2001 by Parliament of Regencies in Indonesia. ADKASI aims to achieve
an effective legislative body by encouraging good governance towards sustainable development in the
framework of regional autonomy and democracy. Its mission is to improve the capacity of member
institutions and the legislative body, to advocate policies that are in line with the interest of the regency
and the community, and to create synergies between the legislative body and stakeholders in order to
strengthen local autonomy and local democracy. To ensure the fair representation of women in politics,
ADKASI holds trainings and annual meeting for women who are in the Regency Parliament. Other key
program includes improving the capacity of legislative members in regulatory impact assessment and
formulation through training workshop. The organization provides relevant information to members and
the public through a talk show program on TV Swara. The organization has implemented “Musyawarah
Nasional II” (National Convention) in Jakarta on July 2005 for the period of 2005-2009.
3) Asosiasi Pemerintah Provinsi Seluruh Indonesia (APPSI – Association for Provincial Government of
Indonesia). Website: http://www.appsi-online.com
APPSI was officially established by provincial government of Indonesia on June 2000. It aims to support
the successful execution of regional autonomy. The organization purpose and goal is to foster
cooperation among various other organizations within the scope of local autonomy as partner. To
achieve its goal, APPSI aims to encourage the people to maintain national diversity as part of the effort to
strengthen national unity, to build harmonious relationship between national and regional government,
and to increase the capacity of regional government through education and training activities, research,
seminars. The chairman of APPSI for the period of 2007-2011 is the Governor of Jakarta. APPSI strives to
advocate fiscal decentralization, provincial autonomy for the management of government employees
following a clear competence standard and norm, good governance and improved mechanism for
governor’s accountability towards the provincial legislative body.
4) Asosiasi Pemerintah Kota Seluruh Indonesia (APEKSI- Indonesian Municipalities Association). Website
http://www.apeksi.or.id
APEKSI was established on May 2000 for the purpose of helping members to accelerate the
implementation of regional autonomy and to create an amicable cooperation between city governments.
The organization mission is to empower cities in implementing regional autonomy. While its mission is
seeking to be an organization that is trusted, professional in the field of urban studies and supporting the
effort of mayors through the development of democratic, and transparent autonomy. To reach its goal
and mission, APEKSI holds a yearly national meeting. The organizational structure consists of board of
Indonesia Country Profile
44
supervisors, board of management, and executive director. It has published documentation such as city
best practices.
5) Asosiasi DPRD Kota Seluruh Indonesia (ADEKSI- Indonesian Municipal Councils Association). Website:
www.adeksi.or.id
ADEKSI is an autonomous and independent organization consisting of 90 municipals. ADEKSI was
established on June 2001 as part of the decentralization program also known as regional autonomy. The
organization has three main activities; these are 1) increasing the capacity of its members, 2)
implementing advocacy activities, 3) provision of information and publication. The organization mission is
to improve quality of life through enhancing regional democracy.