Embed Size (px)
Citation preview

Introduction
Knowledge of rock deformation and yieldsurrounding deep level openings in hard rockis of significant interest to engineers in theSouth African mining industry. Althoughimportant progress was made in research ofthis topic over past decades, a completeunderstanding of the fracture zonedevelopment surrounding these excavationshas not yet been achieved. Commonly, elasticand elastoplastic constitutive models are usedto determine stresses and strains aroundopenings. A disadvantage of these models isthat the time factor is ignored.
As the term creep is commonly used todescribe different types of time-dependentrock behaviour, the following definitions areintroduced to avoid confusion. Creep iscontinued deformation due to a constantapplied stress and will be used exclusively inrelation to laboratory-sized specimenscontaining no large- scale discontinuities.Time-dependency is a more general term
encompassing concept like creep, rate-dependent behaviour, delayed fracturing andlong-term strength. As the rheologicalbehaviour of the rockmass underground is acomplex interrelation of these factors, it willtherefore be referred to as time-dependency.When used in relation to undergroundmeasurements, time dependency is alsounderstood to refer to deformations notrelated to geometric changes in thedimensions of an excavation. It occurs on atime scale of days to years and is thereforenot related to elastodynamic behaviour.
Creep of rocks has been studied since theearly part of this century (Griggs1) resultingin the availability of a vast amount of data.Most of the studies however focused on thesofter saltrocks because they show significantcreep under stress and temperatureconditions easily applied in the laboratory.(See Lama and Vutukuri2 and Dusseault andFordham3 for a detailed summary of creepstudies.) This paper will focus on the time-dependent behaviour of hard rocks found inSouth African gold mines. Results of thelaboratory creep of quartzite and lavaspecimens will be presented. This will becontrasted with time-dependent behaviourmeasured underground.
The need for research into time-dependent rock behaviour
Researchers (Roux and Denkhaus4;Denkhaus et al.5) recognised as early as thefifties that the time-dependent behaviour ofrock is important as it may cast light on whyrockbursts do not always occur at blastingtime but also when there is no externalinfluence which could account for changes instress distribution. Significant time-dependent deformation may also cause agradual non-violent release of abutment
▲135The Journal of The South African Institute of Mining and Metallurgy MAY/JUNE 1997
Time-dependent behaviour of hard rockin deep level gold minesby D.F. Malan*, U.W. Vogler*, and K. Drescher*
Synopsis
In deep level hard rock mining the rheological behaviour ofthe rock is important as time-dependent aseismic processescan lead to a stable dissipation of energy thus reducingviolent outbursts. Underground closure measurements,observations of time-dependent fracture formation andsiesmic data indicate that the rock in deep South Africangold mines shows significant time-dependent behaviour.The objective of this work is to quantify the time-dependentrock behaviour for laboratory specimens and undergroundconditions. Laboratory experiments indicated that lava andquartzite specimens undergo measurable creep strain atstress magnitudes below the failure stress. Quartzite ishowever prone to more significant creep at lower stresslevels. A viscoelastic analysis showed that laboratory creepresults can not fully explain the behaviour observedunderground. The in situ behaviour is governed mainly bythe rheological behaviour of the fracture zone and theresulting time-dependent formation of new fractures. Aviscoplastic discontinuity model implemented in a boundaryelement program is used to simulate this behaviour.
* CSIR Division of Mining Technology, P.O. Box91230, Auckland Park, 2006.
© The South African Institute of Mining and Metallurgy,1996. SA ISSN 0038–223X/3.00 + 0.00. Paperreceived Dec. 1996; revised paper received Apr.1997.
Time-dependent behaviour of hard rock in deep level gold mines
stress and hence diminish the danger of rockbursts.Although not directly related to hard rock, Pomeroy6
carried out creep experiments on a number of coalspecimens. Anthracite samples did not creep (within thelimits of sensitivity of the equipment used) and alwaysfailed explosively. He related this to the frequentoccurrence of violent outbursts in anthracite mines.These outbursts are much less common in mines wheresignificant creep is observed in the coal. Similarly,Denkhaus et al.5 noted that the susceptibility to burstswas much more prevalent in stopes in the Central Rand,where the reef lies between hard brittle quartzite bands,than on the Far East Rand where the reef lies on ductileshale.
One strategy which may be useful in controlling thestability of the fracture zone is the rate of stope faceadvance. An appropriate time-dependent constitutivelaw could lead to some generalisations regarding safevalues of extraction rate and better control of thefracture zone. Research is being directed towardsfinding this appropriate constitutive description of hardrock in the South African mining industry.
Time-dependent rock behaviour plays a furtherimportant role in determining the long-term stability ofservice excavations and the behaviour of pillars wheredelayed fracture may lead to eventual failure. Potts andHedly7 pointed out that:
‘One of the most important features of a materialwhich exhibits “creep” characteristics is the incidence ofdelayed fracture. In mining this would imply that aroom-and-pillar area, which is stable immediately afterextraction deteriorates in time and ultimately goes tofailure’.
Laboratory testing of creep in South African hardrocks
In an attempt to quantify these effects in the SouthAfrican industry, some initial studies on the time-dependent behaviour of hard rock were conducted in thesixties by the Rock Mechanics Division of the CSIR’sNational Mechanical Engineering Research Institute(Wiid8; Kovács9). These studies concentrated on thecreep of intact specimens and on long-term strengthmeasurements. Unfortunately a systematic study of thecreep of hard rock throughout the industry was neverconducted, probably due to the long duration of
individual tests and the lack of funding. The situationwas further aggravated by a school of thought whichassociated creep phenomena exclusively with soft rockslike halite and potash. The need for the time-dependenttesting of hard rock, whether for intact samples, discon-tinuities or in situ, has not always been recognised.
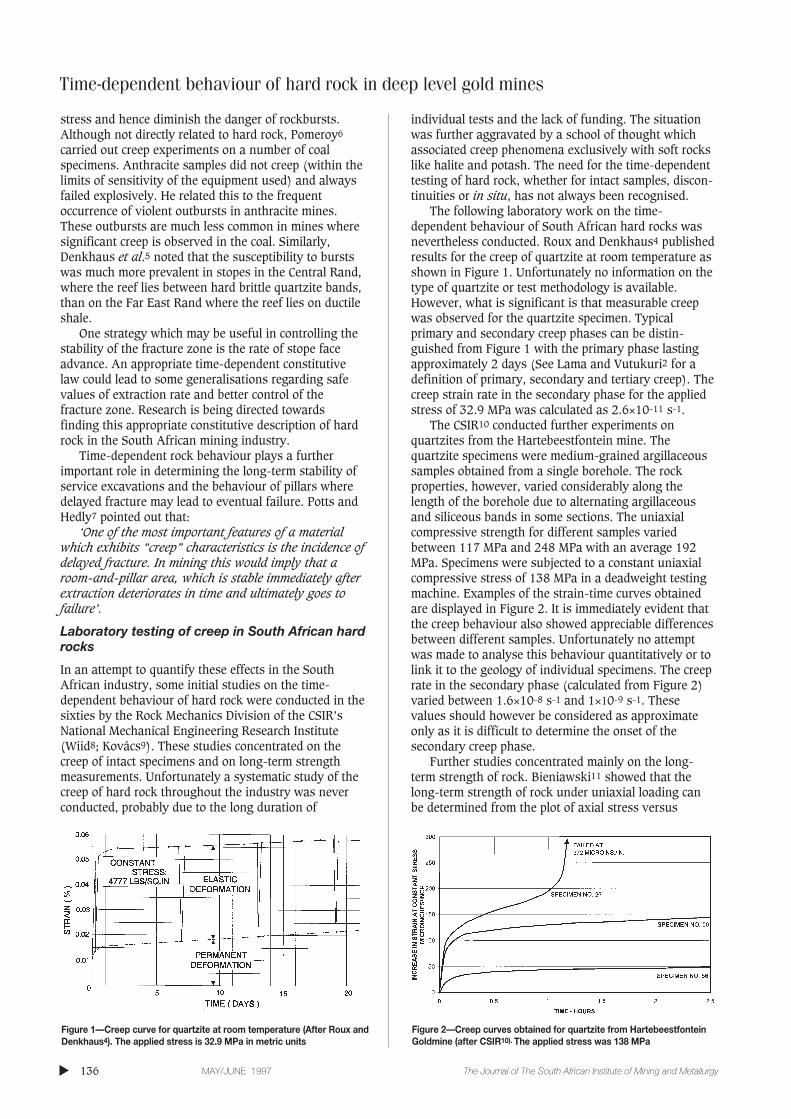
The following laboratory work on the time-dependent behaviour of South African hard rocks wasnevertheless conducted. Roux and Denkhaus4 publishedresults for the creep of quartzite at room temperature asshown in Figure 1. Unfortunately no information on thetype of quartzite or test methodology is available.However, what is significant is that measurable creepwas observed for the quartzite specimen. Typicalprimary and secondary creep phases can be distin-guished from Figure 1 with the primary phase lastingapproximately 2 days (See Lama and Vutukuri2 for adefinition of primary, secondary and tertiary creep). Thecreep strain rate in the secondary phase for the appliedstress of 32.9 MPa was calculated as 2.6×10⁻¹¹ s-1.
The CSIR10 conducted further experiments onquartzites from the Hartebeestfontein mine. Thequartzite specimens were medium-grained argillaceoussamples obtained from a single borehole. The rockproperties, however, varied considerably along thelength of the borehole due to alternating argillaceousand siliceous bands in some sections. The uniaxialcompressive strength for different samples variedbetween 117 MPa and 248 MPa with an average 192MPa. Specimens were subjected to a constant uniaxialcompressive stress of 138 MPa in a deadweight testingmachine. Examples of the strain-time curves obtainedare displayed in Figure 2. It is immediately evident thatthe creep behaviour also showed appreciable differencesbetween different samples. Unfortunately no attemptwas made to analyse this behaviour quantitatively or tolink it to the geology of individual specimens. The creeprate in the secondary phase (calculated from Figure 2)varied between 1.6×10⁻⁸ s-1 and 1×10⁻⁹ s-1. Thesevalues should however be considered as approximateonly as it is difficult to determine the onset of thesecondary creep phase.
Further studies concentrated mainly on the long-term strength of rock. Bieniawski11 showed that thelong-term strength of rock under uniaxial loading canbe determined from the plot of axial stress versus
▲
136 MAY/JUNE 1997 The Journal of The South African Institute of Mining and Metallurgy
Figure 1—Creep curve for quartzite at room temperature (After Roux andDenkhaus4). The applied stress is 32.9 MPa in metric units
Figure 2—Creep curves obtained for quartzite from HartebeestfonteinGoldmine (after CSIR10). The applied stress was 138 MPa
volumetric strain. The onset of unstable fracturepropagation (the point on the plot where the slopechanges from negative to positive) indicates the long-term strength. Tests on norite samples showed that thelong-term strength can be as low as 73% of the uniaxialcompressive strength. Bieniawski’s hypothesis wasconfirmed by experiments conducted by Wiid8 ondolerite and sandstone. Again, the long-term strengthcould be as low as 70% of the uniaxial compressivestrength. Kovács9 investigated the relationship betweentime to failure (tF) and applied load (σt) for samples ofquartzite with σL <σt <σC where σL is the long-termstrength and σC the uniaxial compressive strength. Thefollowing empirical relationship was used to representthis relationship.
[1]
where
[2]
For argillaceous quartzite, the calculated values of a andb were 24.75 and 1.95 respectively (for tF calibrated inhours).
In situ measurements of time-dependent rockbehaviour
Apart from the laboratory experiments, significant time-dependent rock behaviour was noted by reseachersmonitoring stope closure behaviour underground. King etal.12 measured closure behaviour in two adjacent panels atHartebeesfontein Gold Mine. After blasting activity hadbeen stopped in one of the panels, the closure rate in thispanel continued at a constant rate of 6mm/day for 37 days.Only after this period did the rate gradually start todecrease. Mining however continued in the second panel(and probably in other nearby panels) and it is unclearwhat the effect of these geometrical changes were on thefirst panel. After mining stopped in the second panel theclosure rate in this panel persisted for 13 days and thengradually declined. Closure data collected by Gürtunca13 inthe Klerksdorp area to quantify the effect of backfill alsoexhibited significant time-dependent effects. Daily closurerates varied from panel to panel and were in some instancesas high as 30 mm/day. The study showed that closure ratesare significantly lower in backfilled panels than in partiallyfilled panels.
The true time-dependent behaviour of the rock mass isdifficult to identify from daily measurements as the dataalso contains the effect of changes in the mining geometry.This problem can be overcome partially by taking closuremeasurements with instruments which record in acontinuous fashion. From this the time-dependent closurebehaviour between successive blasts (when there is nochange in mining geometry) can be identified.
The following observations and analysis of continuousclosure measurements are described in literature. Leeman14
used closure recorders to measure continuous closureprofiles in a tabular stope at East Rand Proprietary Mines.
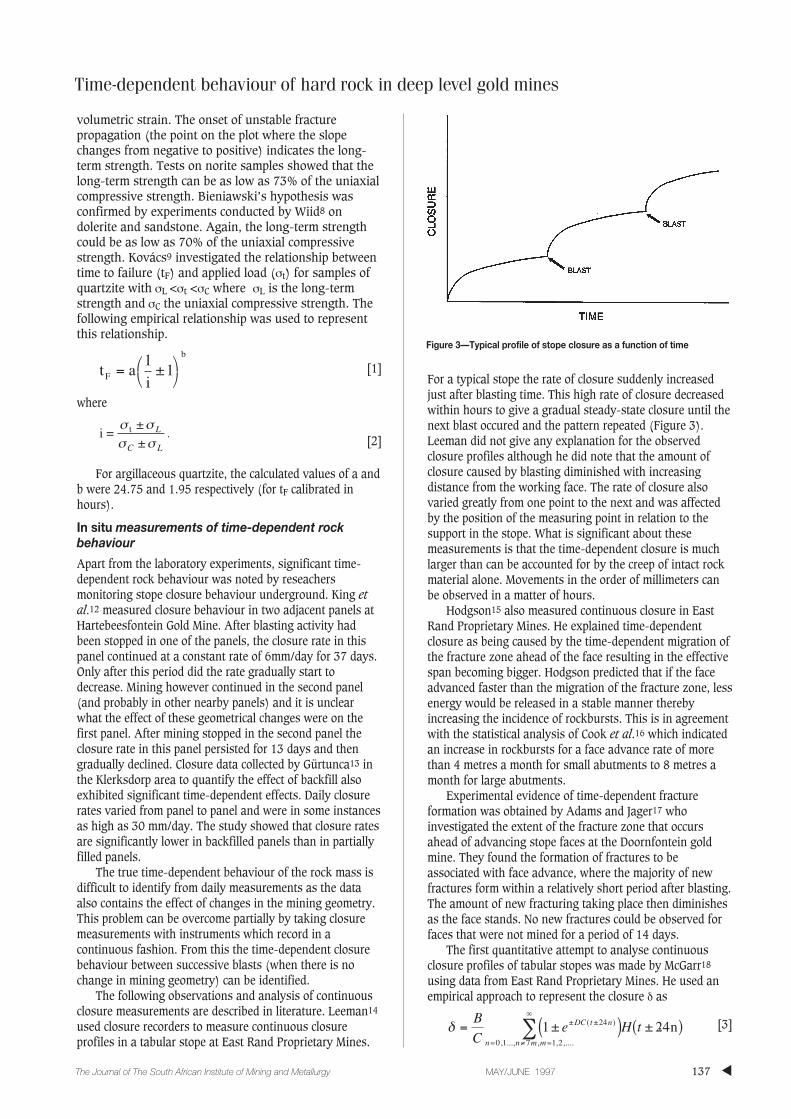
For a typical stope the rate of closure suddenly increasedjust after blasting time. This high rate of closure decreasedwithin hours to give a gradual steady-state closure until thenext blast occured and the pattern repeated (Figure 3).Leeman did not give any explanation for the observedclosure profiles although he did note that the amount ofclosure caused by blasting diminished with increasingdistance from the working face. The rate of closure alsovaried greatly from one point to the next and was affectedby the position of the measuring point in relation to thesupport in the stope. What is significant about thesemeasurements is that the time-dependent closure is muchlarger than can be accounted for by the creep of intact rockmaterial alone. Movements in the order of millimeters canbe observed in a matter of hours.
Hodgson15 also measured continuous closure in EastRand Proprietary Mines. He explained time-dependentclosure as being caused by the time-dependent migration ofthe fracture zone ahead of the face resulting in the effectivespan becoming bigger. Hodgson predicted that if the faceadvanced faster than the migration of the fracture zone, lessenergy would be released in a stable manner therebyincreasing the incidence of rockbursts. This is in agreementwith the statistical analysis of Cook et al.16 which indicatedan increase in rockbursts for a face advance rate of morethan 4 metres a month for small abutments to 8 metres amonth for large abutments.
Experimental evidence of time-dependent fractureformation was obtained by Adams and Jager17 whoinvestigated the extent of the fracture zone that occursahead of advancing stope faces at the Doornfontein goldmine. They found the formation of fractures to beassociated with face advance, where the majority of newfractures form within a relatively short period after blasting.The amount of new fracturing taking place then diminishesas the face stands. No new fractures could be observed forfaces that were not mined for a period of 14 days.
The first quantitative attempt to analyse continuousclosure profiles of tabular stopes was made by McGarr18
using data from East Rand Proprietary Mines. He used anempirical approach to represent the closure δ as
[3]δ = ( ) ( )= ≠ =
∞
∑B
Ce H tDC t n
n n m m
1 2424
0 1 7 1 2
± ±± ( ± )
, ..., , , ,....
n
i = tσ σσ σ
±
±.L
C L
t a1iF
b
=
±1
Time-dependent behaviour of hard rock in deep level gold mines
▲137The Journal of The South African Institute of Mining and Metallurgy MAY/JUNE 1997
Figure 3—Typical profile of stope closure as a function of time
.

Time-dependent behaviour of hard rock in deep level gold mines
where B, C and D are positive constants, n and m are integersrepresenting number of days and H is the Heaviside unitfunction (H(t) =1 for t ≥ 0 and 0 for t <0). The unit of time tin the equation is hours. At the time of this study no blastingon Sundays was allowed and n = 7m corresponds to thosedays. Obtaining the rate of closure from equation [3] bydifferentiating gives
[4]
After the last blasting period of the week on Saturday,the closure and the rate of closure become
[5]
and
[6]
respectively where a and b are constants and τ=1/DC.McGarr18 suggested the relaxation time τ may be used asa parameter to describe the ability of the rock mass toform a fracture zone in response to face advance. Highvalues of τ might be associated with mines that are proneto rockbursts.
Malan19 used a viscoelastic approach to modelcontinuous closure profiles of tabular excavations afterblasting. An analytical solution for the time-dependentclosure behaviour of a parallel-sided panel without totalclosure in the back area was derived. A good fit wasobtained between the model and experimental closuredata. The limitation of the model however is that itassumes the rock mass to be a continuum viscoelasticmaterial and is therefore unable to simulate the fractureprocess in the immediate area of the stope.
Seismicity and time-dependent rock behaviour
Further evidence of time-dependent processes in rockwas obtained from seismic data. For the typical dailydistribution of seismicity, Cook20 found that theincidence of events is greatest during and immediatelyafter blasting. A large proportion of the eventsnevertheless occurs throughout the remainder of the dayas does much of the total amount of energy released. Thisevidence indicates that the rock failure process must be
time-dependent in nature. McGarr21 investigated thedependence of magnitude statistics on aseismic rockdeformation in the East Rand Proprietary Mines. Thereappeared to be a strong correlation between the level ofseismicity and the rate of aseismic deformation. That is,the time-dependence of the seismicity is the result ofaseismic deformation that occurs over an extended period.It appeared that the rock was undergoing logarithmic creepin response to stress changes due to either mine faceadvance or to seismic events. It was postulated that theaseismic deformation was due to progressive brittle failureas the rock temperature was too low to allow forcontinuum plastic deformation in the quartizites.
Stewart and Spottiswoode22 discussed cumulativeseismicity with time after blasting for data obtained froman experimental preconditioning site at BlyvooruitzichtGold Mine. The data exhibits three clear trends, namely aninitial steep linear portion corresponding to the blastsequence itself, an intermediate portion in which thecumulative seismicity rate is inversely proportional totime, and a final portion which corresponds to thebackground level of seismicity. The data set was, however,limited to the first hour after blasting.
Van Aswegen and Butler23 monitored time-dependentmovement of a major fault in the Welkom goldfields. Anaverage displacement rate of 1 mm/month was recordedon the fault. The cumulative apparent volume (seereference24 for a definition) of seismic events in the rocksurrounding the fault showed significant correlation withthe measured movement.
Time-dependent rock behaviour has been noted byMendecki25 through his involvement in developing realtime quantitative seismic systems for the mining industry.Concepts like seismic viscosity and seismic relaxation timehave been used to quantify rheological characteristics ofthe rock mass24. It has been noted that a decrease inseismic viscosity with time is frequently observed at somestage before rock instability.
From the various studies described above, it is clearthat there is only a limited understanding of the time-dependent behaviour of South African hard rocks in thedeep level gold mines. There is virtually no data availableon the laboratory creep of these rocks. Results of the creepof a typical quartzite and lava specimen as determined inthe laboratory will be presented in this paper. The testmethodology is described in the next section.
δ τ= be±
t
δ τ=
a 1 ± e
±t
δ == ≠ =
∞
∑DB H(t ± 24n)DC(t ±24n)en n m m
±
, ,..., , , ,....0 1 7 1 2
▲
138 MAY/JUNE 1997 The Journal of The South African Institute of Mining and Metallurgy
Table I
Quartzite Lava
Test specimen number 1355-CRP-05 1640-CRP-63Rock type Argillaceous footwall quartzite (Lorraine) Ventersdorp lava (Western Deep Levels)Starting date of test 1989-09-21 1995-10-28Duration of creep stages 24 hours 72 hoursTotal number of full creep stages 23 4Testing machine Amsler CSIR creep testerMethod of maintaining constant load Servo-control DeadweightsPartial unloading before next stage No YesDensity 2170 kg/m3 2920 kg/m3
Failure stress 116 MPa 402 MPaYoung’s modulus 66 GPa 92 GPaFailure during load increase Yes NoFailure within minutes of load increase No YesControl specimen propertiesUniaxial compressive strength 38 MPa 430 MPaYoung’s modulus 59 MPa 95 MPa
.
.

Time-dependent behaviour of hard rock in deep level gold mines
▲139The Journal of The South African Institute of Mining and Metallurgy MAY/JUNE 1997
Laboratory testing methodology
Load application principlesLaboratory creep tests on the quartzite and the lavaspecimens were performed as part of other investigationsusing different testing equipment. Full details of the testshave been reported by Vogler26 and Vogler and Drescher27.The data has however never been analysed. Thesimilarities and the differences in the testing methodologyare summarised in Table I.
Two methods of conducting laboratory creepexperiments are available namely:
➤ Specimens are loaded to a pre-determined, constantstress level. This stress level may, for instance, bethe stress level expected around a miningexcavation. The creep strain and the time to failuremay be monitored. If, however, the aim of the testingprogramme is to fully characterise the creepbehaviour of the material or its time-dependentstrength characteristics, many tests have to beperformed at different stress levels. If the materialproperties vary considerably it may be difficult todetermine the time-dependent strength (the time tofailure for the material when loaded to a particularstress) or the long-term strength (the stress belowwhich failure will not occur). It may happen that aspecimen loaded to a certain stress level fails after afew days while another loaded to the same stresslevel does not fail after a period of months. Thiscould be the result of a stress level chosen which isjust above or below the specimen’s long-termstrength.
➤ The same specimen is loaded to different stresslevels by starting at a low value and increasing thestress in steps after allowing a certain time intervalfor creep. The obvious advantage of this approach isthat the creep strain may be monitored for an‘identical’ material at different stress levels and thateach specimen will be tested to failure within areasonable time. The total test duration isdetermined by the choice of the stress level of thefirst creep stage, the duration of each creep stageand the magnitude of subsequent stress levelincreases. A similar methodology was used byTan28.
This second approach was used for the tests describedin this paper. When performing long duration testsrequiring attention at regular intervals, it is advisable touse 24-hour creep cycles or multiples thereof. For the teston the quartzite, the duration of the creep stages was 24hours and for the lava, 72 hours.
Testing equipmentFor the tests on the quartzite, a servo-controlled Amslercompression testing machine was used. Minor fluctuationsin load (below 0.1 MPa) took place as the machine contin-uously made the necessary adjustments. Loading to eachsuccessive stress level was achieved by adjusting thesettings of the load control.
For the tests on the lava the CSIR creep testingmachine, described by Bieniawski11, was used. Thismachine makes use of deadweights and cantilevers to
maintain the desired load. Loading to the next stress levelwas done by adding further weights. For this test, eachloading step was preceded by a partial unloading step tomonitor any change in deformation modulus duringloading and unloading.
Strain measurements
Strain measurements were obtained by using straingauges and inductive transducers. The inductivetransducer measurements were used to monitor anypossible creep in the strain gauges. No noticeable creepwas observed and the strain gauge measurements, givinghigher resolution, were used for subsequent evaluations.
Due to the minor fluctuations in the load applied to thequartzites by the compression testing machine, the strainvalues measured for the creep period were corrected to aconstant stress level by using the elastic modulus for thespecimen as determined from the initial loading cycle.
Temperature
The laboratory experiments were performed at roomtemperature. The Amsler machine is housed in an openlaboratory, subject to ambient temperature variations. Thiswas in turn influenced by the heat generated by themachine. Therefore the temperature of the test specimenwas monitored throughout the experiment. For thequartzite, the experiment lasted 24 days and the minimumand maximum temperatures recorded were 20.6°C and28.0°C respectively.
The CSIR creep testing apparatus is installed in atemperature controlled laboratory with the temperaturemaintained at 22°C.
Control specimens
Before performing the creep tests, uniaxial compressiontests were conducted to determine strength as well asdeformability characteristics for the material. This datawas necessary in order to plan the stress levels for thecreep cycles.
Number of creep stages
For the quartzite the total number of creep stages was 24.The reason for this was that the compressive strength hadbeen underestimated due to the low strength of the control
Figure 4—Stress-strain curves for quartzite and lava during the creeptests

Time-dependent behaviour of hard rock in deep level gold mines
▲
140 MAY/JUNE 1997 The Journal of The South African Institute of Mining and Metallurgy
specimen. It was subsequently established that thestrength of the control specimen had been influenced by apre-existing plane of weakness. This impacted on thestress level chosen for the first creep stage as well as onthe magnitude of the subsequent load increments. Only thelast four creep stages showed significant creep. Thereforethe detailed evaluations described in the following sectionswere only done on these four creep stages.
For the lava the number of creep stages was 4.
Results for laboratory specimens: Quartzite and Lava
The complete stress-strain curves are illustrated in Figure4. Figure 5 shows the complete strain-time records whileFigures 6a and 6b show the incremental creep strain as afunction of time for the individual creep stages for thequartzite and the lava specimens respectively.
Effect of stress level on the secondary creep phase
It is well known for soft rocks that the creep rate of thesecondary phase (steady-state creep rate) depends on thestress level2. From Figures 6a and 6b, this also appears tobe true for the creep of lava and quartzite specimens. Themost widely used steady-state creep law for salt is3
[7]
where ε is the steady-state creep rate, A is a constant, σι isa principal stress, Q is the activation energy for the creepmechanism, R is the universal gas constant and T is thetemperature in degrees Kelvin. For both rock types, thetests were conducted at a constant temperature underuniaxial conditions. Equation 7 can therefore be reduced to
ε = A'σn [8]
where
with units Pa-ns-1 and σ = σ1 is the applied axial stress.The coefficient n can be determined from the slope of thecurve of a log(ε) vs log(σ)plot. Figure 7 show these graphsfor typical lava and quartzite specimens. The linear natureof the curves illustrate the applicability of equation 8 as amodel. The values of n are given in Table II.
′ =A AeQ
RT±
ε σ σ= ( )A en
Q
RT1 3±
±
Figure 5—Complete strain vs time record for the quartzite and lavaspecimen during the creep tests
Figure 6a—Incremental creep curves at the different stages for quartzite
Figure 6b—Incremental creep curves at the different stages for lavaFigure 7—Log (strain rate) versus Log (stress) for lava and quartzite.The straight lines were fitted using linear regression
Table II
Rock Maximum strain Maximum Stress Exponent nx 10-3 MPa
Lava 4.1 329 3.5Quartzite 1.9 107 9.1*Granite 1.0 344.8 3.3
(Lama and Vutukuri2)
Shale 3.0 9.7 2.7(Lama and Vutukuri2)
.
.
.
.
* See comment in text

The value of n=3.5 for the lava specimen is of thesame order as that obtained for the granite and shale. Thevalue of n=9.1 for the quartzite is however much largerand needs to be confirmed by further experiments. It ispossible that this value is too high as the time duration ofindividual loading steps for the quartzite was only 24hours. Dusseault and Fordham3 suggested that the steady-state creep rate can only be calculated after 4 to 5 days ofmeasurements at a particular stress level. For the quartzitethe strain-rate for the assumed secondary phase could stillbe artificially high due to the influence of primary creep.
Figure 8 illustrates a comparison between the strainrate of quartzite and that of lava in the secondary creepphase for different stress levels. The single datum pointfrom Roux and Denkhaus4 is also included. It is of signif-icance that the quartzite samples experience strain rateswhich are comparable to lava at less than a third of thestress levels. Mining in quartzite host rock as opposed tolava at a particular depth will lead to a more stable fracturezone extending further away from the stope. At theboundary between fractured and unfractured rock, theintact rock will undergo secondary creep leading to thetime-dependent formation of new fractures. This time-dependent process zone will extend further into the rockfor quartzite. As stable fracturing dissipates energy, thisbehaviour may be advantageous in reducing violentoutbursts. Mining of the Ventersdorp Contact Reef (lavahangingwall, quartzite footwall) in areas where the lava isparticularly hard can be problematical due to the rollingnature of the reef. In areas where the reef rolls into thefootwall, the mining is sometimes slow to follow, resultingin mining taking place entirely in the lava. The stableformation of the fracture zone could then be disruptedleading to face bursting. This phenomenon has beenobserved at mines in the Carletonville area (Handley29).
Rheological parameters for the laboratory creep oflava and quartzite
The viscoelastic rheological parameters for the laboratoryspecimens were calculated to facilitate comparison withunderground measurements. The Burgers viscoelasticmodel (Figure 9) has been used frequently to modellaboratory creep results as both the primary and secondaryphase can be simulated. Lama and Vutukuri2 derived thetime-dependent strain for the Burgers model as
[9]εσ σ
ησ η
tM M K
E t
E
t
Ee
K
K= + +
−
31 3±
Time-dependent behaviour of hard rock in deep level gold mines
▲141The Journal of The South African Institute of Mining and Metallurgy MAY/JUNE 1997
Figure 8—Strain rate of the secondary creep phase as a function ofstress for lava and quartzite
Figure 9—Burgers viscoelastic model
Table III
Source EM (GPa) EK (GPa) ηM (GPa.h) ηK (GPa.h)
Quartzite 60 1400 4.5x10⁴ 900laboratory creep
Lava 88 2100 1.8x10⁵ 3800laboratory creep
Deelkraal Goldmine 147 5000 2.3x10³ 250in situ measurements
Figure 10b—Burgers viscoelastic model fitted to the creep of lava at aconstant stress of 367 MPa
Figure 10a—Burgers viscoelastic model fitted to the creep of quartziteat a constant stress of 107 MPa
Time-dependent behaviour of hard rock in deep level gold mines
where EM and EK are the Young’s moduli for the Maxwelland Kelvin units, ηK and ηM are the viscosity coefficients forthe Kelvin and Maxwell units and t is time. This model wasfitted to the data of the last creep stage for the quartzite andlava specimens. The results are illustrated in Figures 10aand 10b. The calibrated parameters are included in Table IIIfor comparison with underground data. The strain rate of thesecondary phase is determined by the viscosity coefficientηM. The quartzite has a lower value of ηM at a much lowerstress and will therefore be prone to higher creep rates in thesecondary phase than the lava.
From the discussion in the previous section it followsthat ηM is not a fundamental material constant but afunction of stress and temperature, ηM=f(σ,T). To describethis dependence, the following derived model utilises theempirical creep law just described. For the Maxwell model,the steady-state strain is given as2
[10]
Inserting equation 7 and rearranging gives
[11]
As the tests were conducted at a constant temperature underuniaxial conditions, equation 11 becomes
[12]
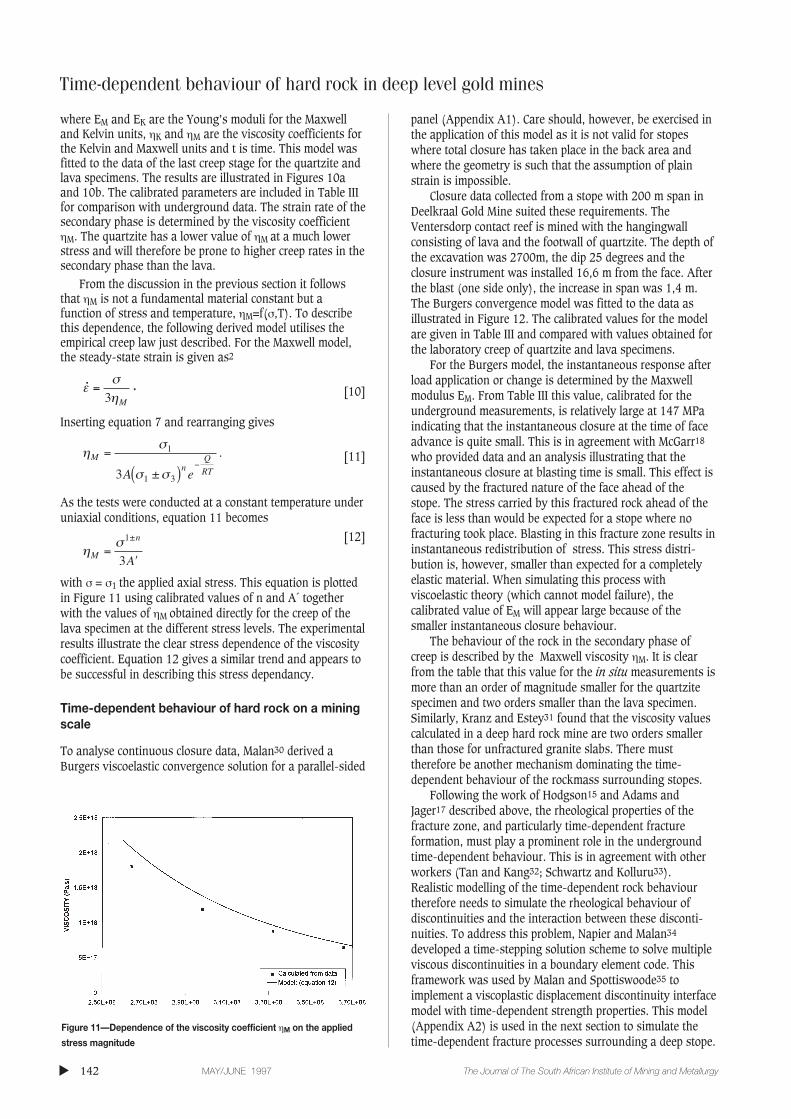
with σ = σ1 the applied axial stress. This equation is plottedin Figure 11 using calibrated values of n and A´ togetherwith the values of ηM obtained directly for the creep of thelava specimen at the different stress levels. The experimentalresults illustrate the clear stress dependence of the viscositycoefficient. Equation 12 gives a similar trend and appears tobe successful in describing this stress dependancy.
Time-dependent behaviour of hard rock on a miningscale
To analyse continuous closure data, Malan30 derived aBurgers viscoelastic convergence solution for a parallel-sided
panel (Appendix A1). Care should, however, be exercised inthe application of this model as it is not valid for stopeswhere total closure has taken place in the back area andwhere the geometry is such that the assumption of plainstrain is impossible.
Closure data collected from a stope with 200 m span inDeelkraal Gold Mine suited these requirements. TheVentersdorp contact reef is mined with the hangingwallconsisting of lava and the footwall of quartzite. The depth ofthe excavation was 2700m, the dip 25 degrees and theclosure instrument was installed 16,6 m from the face. Afterthe blast (one side only), the increase in span was 1,4 m.The Burgers convergence model was fitted to the data asillustrated in Figure 12. The calibrated values for the modelare given in Table III and compared with values obtained forthe laboratory creep of quartzite and lava specimens.
For the Burgers model, the instantaneous response afterload application or change is determined by the Maxwellmodulus EM. From Table III this value, calibrated for theunderground measurements, is relatively large at 147 MPaindicating that the instantaneous closure at the time of faceadvance is quite small. This is in agreement with McGarr18
who provided data and an analysis illustrating that theinstantaneous closure at blasting time is small. This effect iscaused by the fractured nature of the face ahead of thestope. The stress carried by this fractured rock ahead of theface is less than would be expected for a stope where nofracturing took place. Blasting in this fracture zone results ininstantaneous redistribution of stress. This stress distri-bution is, however, smaller than expected for a completelyelastic material. When simulating this process withviscoelastic theory (which cannot model failure), thecalibrated value of EM will appear large because of thesmaller instantaneous closure behaviour.
The behaviour of the rock in the secondary phase ofcreep is described by the Maxwell viscosity ηM. It is clearfrom the table that this value for the in situ measurements ismore than an order of magnitude smaller for the quartzitespecimen and two orders smaller than the lava specimen.Similarly, Kranz and Estey31 found that the viscosity valuescalculated in a deep hard rock mine are two orders smallerthan those for unfractured granite slabs. There musttherefore be another mechanism dominating the time-dependent behaviour of the rockmass surrounding stopes.
Following the work of Hodgson15 and Adams andJager17 described above, the rheological properties of thefracture zone, and particularly time-dependent fractureformation, must play a prominent role in the undergroundtime-dependent behaviour. This is in agreement with otherworkers (Tan and Kang32; Schwartz and Kolluru33).Realistic modelling of the time-dependent rock behaviourtherefore needs to simulate the rheological behaviour ofdiscontinuities and the interaction between these disconti-nuities. To address this problem, Napier and Malan34
developed a time-stepping solution scheme to solve multipleviscous discontinuities in a boundary element code. Thisframework was used by Malan and Spottiswoode35 toimplement a viscoplastic displacement discontinuity interfacemodel with time-dependent strength properties. This model(Appendix A2) is used in the next section to simulate thetime-dependent fracture processes surrounding a deep stope.
ησ
M
n
A=
′
1
3
±
ησ
σ σM
nQ
RTA e
=
( )−
1
1 33 ±
.
εση
=3 M
▲
142 MAY/JUNE 1997 The Journal of The South African Institute of Mining and Metallurgy
Figure 11—Dependence of the viscosity coefficient ηM on the applied
stress magnitude
. .

Incremental mining of a tabular stope: Numericalresults
Stope modelling was undertaken by covering the problemspace by a random mesh of viscoplastic discontinuities.Figure 13 shows a typical distribution used. This distri-bution should be considered as potential fracture surfacesas they are initially intact with a prescribed strengthdetermined by the failure criteria of the model. Mining wasundertaken in an incremental fashion allowing theprogressive evolution of the fracture zone. Due to computermemory limitations, the number of elements is limited. Theobject of this modelling should therefore be seen asstudying the effect of the time-dependent fracture processand not to replicate observed fracture patterns.
Figure 14 illustrates the typical development of thefracture zone following a series of mining steps. Thediscontinuities shown are all those mobilised up to thatparticular point in time. Due to the low density of the initialtessellation, this fracture pattern is at best only a coarseapproximation of that observed underground. This isespecially notable in the immediate area of the stope faceswhere the density of fracturing is much lower than expectedfor underground stopes. The model has nevertheless provedto be useful for simulating the time-dependent processes in
the rock. An important consequence of the prescribedviscoplastic behaviour is that the additional fracturingcaused by a sudden increase in stress occurs in a time-dependent fashion. After a mining increment, the existingdiscontinuities surrounding the stope are subjected to anincrease in mining- induced stress. Those discontinuitiessubjected to stresses above the yield surface relax in a time-dependent manner according to the constitutive model. Thisrelaxation process causes a stress transfer to the solid rockat the edge of the fracture zone. New fractures then form inthese positions as a time-dependent process. For theexample given, the increase in cumulative fracture length asa function of time after a blast is illustrated in Figure 15. Itshould be emphasised that there are no changes in theexcavation dimension during this time period. Similarly toAdams and Jager’s17 observations, the majority of newfractures formed within a short period after the blast, andthe rate of fracturing then diminished until the next blast. Acomparison between this numerical time-dependent fractureprocess and cumulative seismicity after blasting can befound in Malan and Spottiswoode35. A good fit wasobtained illustrating the applicability of the model.
Time-dependent behaviour of hard rock in deep level gold mines
▲143The Journal of The South African Institute of Mining and Metallurgy MAY/JUNE 1997
Figure 12—The Burgers convergence model fitted to undergroundmeasurements
Figure 13—Initial random distribution of potential fracture planessurrounding the reef
Figure 14—Development of the fracture zone 24 hours after the 9th
mining increment. The stope is represented by the thick black line
Figure 15—Increase in cumulative fracture length after the 9th miningincrement

Time-dependent behaviour of hard rock in deep level gold mines
The time-dependent fracture process leads to the typicalstope closure profile illustrated in Figure 16. As expectedthe highest rate of closure occurs after blasting time andthis decays until the next blast takes place. Whencomparing this with underground observations (e.g. Figure12, and Leeman14) it is clear that similar closure trends arepredicted by the model.
As mentioned in the introduction, McGarr18 investigatedthe stope closure rate throughout the week at East RandProprietary Mines (Figure 17). The closure is given duringsix-hour intervals with the value at the middle of a givensix-hour period plotted in the Figure 17. The experimentaldata have been averaged over 30 weeks. Results obtainedfrom numerical modelling illustrates similar trends. Themodel parameters used are µ’ = le-8 MPa–1s–1m, Sp =20MPa, Sr = 0 MPa, α = 0.005 s–1, β = 0.005 s–1, ϕp = 30, ϕr
= 20 (See Appendix A2). The highest rate of closure occursduring the six-hour interval that includes the times of faceadvance. The rate also increases throughout the week untilSunday when no blasting takes place and the rock isallowed to relax further. There is however a weak fitbetween the experimental data and numerical results for theperiods of decreasing rate of closure after the blast. This iscaused by the low density of fracturing ahead of the faces inthe numerical model. Mining in this unfractured stressedrock results in relatively higher increase in convergence forthe period which includes the blast. The peak values of themodelling results also show some erratic behaviour becauseof the discontinuous nature of the model. As the density offractures in the tessellation is low, the rate of convergenceis still strongly influenced by the measurement position andthe orientation of the new fractures activated by eachmining step. If fractures with a favourable orientation areactivated in a particular step, higher rates of convergenceare suddenly experienced. That this erratic behaviouralmost follows the same trend as the peak values of theunderground measurements is purely accidental. Othertessellation patterns and measurement positions will givedifferent peak values for each step. Work is currentlyundertaken to increase the number of potential fractureplanes in the tessellation to alleviate this problem.
Conclusions
In deep level hard rock mining, the rheological behaviour ofthe rock is important as time-dependent aseismic processescan lead to a stable dissipation of energy reducing violentoutbursts. Underground closure measurements, observationsof time-dependent fracture formation and seismic dataindicate that the rock in deep South African gold minesshows notable time-dependent behaviour. The objective ofthis work was to quantify the time-dependent rock behaviourfor laboratory specimens and underground conditions.
Laboratory creep experiments of quartzite and lavaspecimens indicate that these rocks undergo measurablecreep strain at stress values below the failure strength. Thecreep curves illustrate the typical primary and secondarybehaviour. The strain rate in the secondary creep phase isstrongly dependent on the stress level for both rock types.This dependence can be successfully modelled with a stresspower law. The quartzite specimens are however prone tomore significant creep than the lava samples. For the type ofquartzite and lava tested, comparable creep rates areobtained if the stress in the quartzite is approximately one-third of that in lava.
The time-dependent rock behaviour observed for deeplevel stopes is much more significant than what can beexpected of the creep of intact rock. A Burgers viscoelasticmodel fitted to the creep of intact laboratory specimens andin situ closure measurements, indicates viscosity values twoorders smaller for rock on a mining scale. Observations andnumerical modelling indicate that underground behaviour isgoverned mainly by rheological behaviour of the fracturezone and the resulting time-dependent formation of newfractures. After a blast, the existing fractures surrounding thestope are subjected to an increase in mining induced stress.The fracture zone relaxes in a time-dependent fashiontransferring stress to the more solid rock. New fractures thenform in these positions as a time-dependent process. Themajority of the fractures however form within a short periodof the blast. Numerical modelling showed that this processcan be simulated by a large assembly of discontinuities eachbehaving in a viscoplastic fashion. Of significance, is that thecontinuous closure profiles observed can be simulated and
▲
144 MAY/JUNE 1997 The Journal of The South African Institute of Mining and Metallurgy
Figure 16—Numerical stope closure as a function of time. Blasting tookplace at 0, 24, 48, 72 and 96 hours
Figure 17—Numerical and experimental rate of closure as a function oftime. The experimental data are from East Rand Proprietary Mines(after McGarr18, see text)

therefore explained by this delayed fracture model. Almost no experimental data on the time-dependent
behaviour of fractures and other discontinuities subjected toshear is available however. Therefore, this study is currentlydirected towards a laboratory investigation to determine theapplicability of the time-dependent constitutive model andparameters for discontinuities. Further comparison withunderground observations and closure measurements is alsorequired.
Acknowledgements
This work forms part of the rockmass behaviour researchprogramme of Rock Engineering, CSIR Division of MiningTechnology. The authors acknowledge the financialassistance and support received from the Safety in MinesResearch Advisory Committee (SIMRAC). D.F. Malan isworking towards a Ph.D. degree at the University of theWitwatersrand and the work described here also forms partof that study. The authors would like to thank Dr J.A.L.Napier, Dr M.F. Handley and an anonymous referee forreviewing the manuscript and making several usefulcomments.
Appendix
A1: Burgers viscoelastic convergence solution for a tabularparallel-sided panel in isotropic ground
If it is assumed that the rock behaves elastically inhydrostatic compression and as a Burgers model (see Figure9) in distortion, Malan30 showed that the incrementalviscoelastic convergence ∆Sz(x,t) for a stope with faceadvance of ∆1 at one side only can be written as
[A1]
where
[A2]
and
[A3]
[A4]
[A5]
[A6]
[A7]
[A8]
[A9]
[A10]
and
[A11]
[A12]
[A13]
[A14]
[A15]
[A16]
L = half span of the stopex = distance from the centre of the stope (origin of co-
ordinate system)γ = specific weight of the rock H = depth below surfacek = ratio of horizontal to vertical stress α = dip of the reefβ = angle between x-axis and the dipK = bulk modulus
The z-axis is perpendicular to the plane of the excavationand points towards the footwall. The two-dimensional sectionis taken parallel to a plane normal to the y-axis (See FigureA1). This model is however only applicable to stopes withouttotal closure in the back area and where the geometry is suchthat the assumption of plain strain is possible.
A2: Formulation of a viscoplastic displacementdiscontinuity model
Figure A2 illustrates a discontinuity with the shearcomponent Ds and normal component Dn. Malan andSpottiswoode35 showed that if the discontinuity behaves in aviscoplastic fashion (Perzyna36 ) the incremental increase indiscontinuity components for a small timestep ∆t, can be
dH
=sin cosα β
W k kz = +( ) + ( )[ ]±± cos
γα
H2
1 1 2
qv
EM K
K2
1=
+( )η η
q M1 = η
pv
E EK M
M K2
21=
+( )η η
pv E E E
E EK M M K M M
K M1
1=
+( ) + +( )η η η
hKp q
Kp q=
++
1 1
2 26
fq
q= 1
2
cq q
Kp q Kp q q Kq8
12
2
2 2 1 1 12
26 2 2=
+( ) − +( )±
cq Kp q Kp q q q
b Kp q Kp q q Kq7
12
2 1 1 2 1 2
2 22
1 1 12
2
12 6
2 6 2 2=
+( )+( ) +( )
± ±
±
cK p q p q q q
q Kp q q Kq6
2 12
1 1 2 22
2 1 1 12
2
2
2 2=
+( )+( )
±
±
cKq
Kp q q Kq51
1 1 12
2
22 2
=+ ±
gKp q q Kq
Kq11 1 1
22
12
2 24
=+ ±
bKp q K Kp q
Kp q=
+( ) +( )+( )
6 24 6
4 6
1 12
2 2
2 22
±
F t g
c t c e c eftht
( ) =
+ + + ( )
−
1
5 6 712± sinh cosh bt + c bt8
∆
∆ ∆
S x t Wdx
F t
L x L x
z z, ±
± ± ± ±
( ) = +
( )
+
4 12
12
12
2 22 2
Time-dependent behaviour of hard rock in deep level gold mines
▲145The Journal of The South African Institute of Mining and Metallurgy MAY/JUNE 1997

Time-dependent behaviour of hard rock in deep level gold mines
given as
[A17]
where ψ is the dilation angle, µ' is the discontinuityfluidity constant with units Pa-1s-1m and l assumes thevalue -1 or +1 depending on the direction of the shearstress. ⟨F⟩ is the yield function and assumes a value of 0 ifthe stresses are below the shear strength of the discon-tinuity.
When assuming a Mohr-Coulomb model, F can begiven by
F = | τ | – Sc + σn tan φc [A18]
where τ is the shear stress and Sc and φc are the currentvalues of cohesion and friction angle respectively. Themobilised discontinuities can undergo a time-dependentreduction in strength (Malan and Spottiswoode35 )according to
[A19]
[A20]
where α is the cohesion decay factor, β is the friction decayfactor and Sr and φr the residual values of cohesion andfriction angle. The time t is that accumulated for eachdiscontinuity which is loaded to within 80% or above ofthe shear strength.
References
1. GRIGGS, D. Creep of rocks. J. Geol. vol. 47, 1939. pp. 225–251.
2. LAMA, R.D. and VUTUKURI, V.S. Handbook on mechanical properties of
rocks—Testing techniques and results. Volume III. Trans Tech
Publications, Germany, 1978. pp. 209–320.
3. DUSSEAULT, M.B. and FORDHAM, C.J. Time-dependent behavior of rocks.
Comprehensive rock engineering, vol. 3, Hudson, J.A. (ed.). Pergamon
Press, 1993, pp. 119–149.
4. ROUX, A.J.A. and DENKHAUS, H.G. An investigation into the the problem of
rock bursts- An operational research project. J. Chem. Metall. Min. Soc. S.
Afr., vol. 55, 1954. pp. 103–124.
5. DENKHAUS, H.G., HILL, F.G., and ROUX, A.J.A. A review of recent research
into rockbursts and strata movement in deep-level mining in South
Africa. Ass. Min. Mngrs. S. Afr., 1958. pp. 245–268.
6. POMEROY, C.D. Creep in coal at room temperature. Nature. vol. 178, 1956.
pp. 279–280.
7. POTTS, E.L.J. and HEDLY, D.G.F. The influence of time-dependent effects on
the design of mine pillars. Int. Bureau of Rock Mech. Proc. 6th Int. Conf.
Leipzig, 1964.
8. WIID, B.L. The time-dependent behaviour of rock: Considerations with
regard to a research programme. CSIR Report MEG 514, 1966.
9. KOVÁCS, I.K.A. An investigation of the time-dependent behaviour of solid
rock in uniaxial compression. CSIR Report MEG 1032, 1971.
10. Rock Mechanics Research Group, National Mechanical Engineering
Institute, CSIR. Report on the non-elastic properties of rock from borehole
number 3034 from Hartebeestfontein gold mine. CSIR Report MEG 563,
1963.
11. BIENIAWSKI, Z.T. Mechanism of brittle fracture of rock–Part III–Fracture in
tension and under long term loading. Int. J. Rock Mech. Min. Sci., vol. 4,
1967. pp. 425–430.
12. KING, R.G., JAGER, A.J., ROBERTS, M.K.C., and TURNER, P.A. Rock mechanics
aspects of stoping without back-area support. COMRO (Now CSIR
Miningtek) Research Report no. 17/89. 1989.
13. GÜRTUNCA, R.G. Results of a classified tailings monitoring programme at
Vaal Reefs. COMRO (Now CSIR Miningtek) Internal Report no. 614. 1989.
14. LEEMAN, E.R. Some measurements of closure and ride in a stope of the
East Rand Proprietary Mines. Pap. Ass. Min. Mngrs. S.Afr. vol.
1958–1959, 1958. pp. 385–404.
15. HODGSON, K. The behaviour of the failed zone ahead of a face, as indicated
by continuous seismic and convergence measurements, C.O.M. Res. Rep.
31/61, Transvaal and Orange Free State Chamber of Mines Res. Org.
1967.
16. COOK, N.G.W., HOEK, E., PRETORIUS, J.P.G., ORTLEPP, W.D. and SALAMON,
M.D.G. Rock Mechanics applied to the study of rockbursts. J. S. Afr. Inst.
Min. Metall. vol. 66, 1966. pp. 435–528.
17. ADAMS, G.R. and JAGER, A.J. Petroscopic observations of rock fracturing
ahead of stope faces in deep-level gold mines. J. S. Afr. Inst. Min. Metall.,
vol. 44, 1980. pp. 204–209.
18. MCGARR, A. Stable deformation near deep-level tabular excavations
J. Geophys. Res. vol. 76, no 29, 1971, pp. 7088–7106.
19. MALAN, D.F. A viscoelastic approach to the modelling of the transient
closure behaviour of tabular excavations after blasting. J. S. Afr. Inst.
Min. Metall., vol. 95, 1995. pp. 211–220.
20. COOK, N.G.W. Seismicity associated with mining. Eng. Geol. vol. 10, 1976.
pp. 99–122.
21. MCGARR, A. Dependence of magnitude statistics on strain rate. Bull. Seism.
Soc. Am., vol. 66, no. 1, 1976. pp. 33–44.
22. STEWART, R.D. and SPOTTISWOODE, S.M. A technique for determining the
seismic risk in deep-level mining. Rockbursts and Seismicity in Mines.
R. P. Young, (Ed.). 1993. pp.123–128.
S S S S e
e
c r p rt
c r p rt
= + ( )= + −( )
−
−
± α
βφ φ φ φ
∆ ∆
∆ ∆ Ψ
D F t
D | D tans
n s
= ′
=
µ l
|
▲
146 MAY/JUNE 1997 The Journal of The South African Institute of Mining and Metallurgy
Figure A1—Co-ordinate system used for the Burgers convergencemodel
Figure A2—Components of the displacement discontinuity vector

23. VAN ASWEGEN G. and BUTLER A.G. Applications of quantitative seismologyin South African gold mines. Rockbursts and Seismicity in Mines,R.P. Young (ed.). Balkema, 1993. pp. 261–266.
24. MENDECKI, A.J. Management strategies and rockburst prediction. Proc.SIMRAC/SAIMM Symposium, Johannesburg, 1996.
25. MENDECKI, A.J. Real time quantitative seimology in mines. Keynote lecture.Rockbursts and Seismicity in Mines, R.P. Young (ed.). Balkema, 1993.pp. 287–295.
26. VOGLER, U.W. Creep tests on argillaceous footwall quartzite. CSIR ReportEMA-C 9052. 1990.
27. VOGLER, U.W. and DRESCHER, K. Creep tests on Ventersdorp Lava. CSIRInternal Report. In preparation. 1996.
28. TAN, T-K. The importance of creep and time-dependent dilatancy, asrevealed from case records in China. Rock testing and site characteri-sation. Comprehensive Rock Engineering, vol. 3, J.A. Hudson (ed.). 1993.pp. 709–744
29. HANDLEY, M.F. Personal communication, 1996.
30. MALAN, D.F. Discussion of reference 19. A viscoelastic approach to themodelling of transient closure behaviour of tabular excavations afterblasting. J. S. Afr. Inst. Min. Metall., vol. 96, 1996. pp. 159–164.
31. KRANZ, R.L. and ESTEY, L.H. Listening to a mine relax for over a year at 10
to 1000 meter scale. Proc. 2nd North Am. Rock Mech. Symp: NARMS ’96,
M. Aubertin, F. Hassani and H. Mitri, (eds.). Montreal, Jun. 1996.
pp. 491–498.
32. TAN, T-K. and KANG, W. Locked in stresses, creep and dilatancy of rocks,
and constitutive equations. Rock Mechanics, vol. 13, 1980. pp. 5–22.
33. SCHWARTZ, C.W. and KOLLURU, S. The influence of stress level on the creep
of unfilled rock joints. Proc. 25th Symp. Rock Mech. 1984.
pp. 333–340.
34. NAPIER, J.A.L. and MALAN D.F. Viscoplastic modelling of rock deformation
using an explicit displacement discontinuity formulation. Submitted to Int.
J. Rock Mech. Min. Sci. & Geom. Abstr., 1996.
35. MALAN, D.F. and SPOTTISWOODE, S.M. Time-dependent fracture zone
behaviour and seismicity surrounding deep level stoping operations.
Accepted for publication in Proc. 4th Int. Symp. Rockbursts & Seismicity
in Mines, S.J. Gibowitz (eds.). Krakow, Poland, Aug. 1997.
36. PERZYNA, P. Fundamental problems in viscoplasticity. Adv. Appl. Mech.,
vol 9, 1966. pp. 243–377. ◆
Time-dependent behaviour of hard rock in deep level gold mines
▲147The Journal of The South African Institute of Mining and Metallurgy MAY/JUNE 1997
New software that will assist mining engineers in the designof safer underground workings has recently been developedby the Department of Mining Engineering at the Universityof Pretoria. A workshop was held to announce the computerprogram, known as JBlock. The program evaluates thepotential for rock falls in blocky rock often encountered inmining excavations. The program calculates the effect ofdifferent types and layouts of support on potential rock falls.This enables engineers to optimise the layout of support fortheir local rock conditions.
Rock falls are a major cause of accidents in undergroundmines. The falls are often caused by natural planes ofweakness in the rock being mined. In deep mines, stressfractures may also exist in the rock, further increasing thehazard of rock falls. Rock engineers require a designmethod to realistically model the types of rock block whichare formed by the intersection of these natural and stress-induced planes of weakness. They also need a method todetermine how the supports installed in the workings willinteract with the rock blocks. This need is addressed by theprogram JBlock.
JBlock was developed by Mr Essie Esterhuizen of theDepartment of Mining Engineering. The development wasinitially supported by Samancor. The program is nowcommercially available and has aroused much interest in the
rock engineering fraternity. The workshop was attended by40 persons from different South African mining groups.
* Issued by: Mr G.S. Esterhuizen, Dept. of MiningEngineering, University of Pretoria.
◆
New software ensures safer mine environment*
Representatives from the mining industry who attended the launch. Mr Essie Esterhuizen
is on the extreme left

▲
148 MAY/JUNE 1997 The Journal of The South African Institute of Mining and Metallurgy
Twenty-three bursaries,valued at R161 000.00, havebeen awarded by the SouthAfrican Institute of ElectricalEngineers (SAIEE) this year.This three-fold increase offunds previously set aside forbursaries has been structuredto meet future demand forelectrical engineers andtechnicians. The SAIEE’sHermann Broschk (right),responsible for the Institute’sbursary loan scheme and a member of its education andtraining committee, says several innovative strategies wererecently adopted. Among these are that the Institute willadminister bursaries for companies without facilities to doso themselves, and will also administer bursaries to which
small companies can collec-tively contribute and whichwill bear the names of thecontributing companies assponsors. With Broschk areHT Aspinall bursars HansZacher of the University of theWitwatersrand (left) andDaniel van Niekerk of WitsTechnikon. The HT AspinallBursary Fund is administeredby the SAIEE and givespreference to Technikon
Witwatersrand and University of the Witwatersrandstudents.
* Issued by: Lynne Hancock Communications, P.O. Box 180Witkoppen, 2068.
◆
Revamped SAIEE bursary scheme offers more than financial help*
Colliery Dust Control (CDC) of Springs has secured a majorcoal dust suppression systems contract with Matla Colliery.
The R1,7-million contract is for provision of dust sup-pression equipment for 12 continuous miners—representingabout 75% of the machines deployed in the mine’s three shafts.
The contract involves manufacture and supply ofscrubber boxes, water-powered air movers and spray fansystems operating together as an integrated system on eachof the continuous miners.
Matla Colliery, near Kriel in Mpumalanga, is one ofIngwe Coal Corporation’s collieries. The order is the firstmajor order by an Ingwe group colliery for CDC equipment.
Prior to the order being placed CDC made available threescrubber boxes to Matla Colliery to use on their continuousminers to assist them in assessing their requirements.
CDC’s range of dust suppression equipment forcontinuous miners is backed by a 24-hours-a-day sparesand service operation and service exchange units, enablingmines to reduce their stockholding of key componentswithout adversely affecting machine availability.
The CDC scrubber box is the most important componentin the three-in-one integrated system which the companyprovides. A major feature of the scrubber box is its small-frame water-cooled motor which assures the reliability ofthe unit and virtually eliminates the risk of motor failuredue to low inertia and minimal thermal cycling.
* Issued by: J. Kraft Public Relations, P.O. Box 28552,Kensington 2101.
◆
Matla awards R1,7-million dust suppression contract to CDC*