Embed Size (px)
Citation preview

Tilburg University
Pension deals and value-based ALM
Kortleve, N.; Ponds, Eduard
Published in:Fair value and pension fund management
Publication date:2006
Link to publication
Citation for published version (APA):Kortleve, N., & Ponds, E. H. M. (2006). Pension deals and value-based ALM. In N. Kortleve, T. NIjman, & E. H.M. Ponds (Eds.), Fair value and pension fund management (pp. 181-209). Amsterdam: Elsevier.
General rightsCopyright and moral rights for the publications made accessible in the public portal are retained by the authors and/or other copyright ownersand it is a condition of accessing publications that users recognise and abide by the legal requirements associated with these rights.
- Users may download and print one copy of any publication from the public portal for the purpose of private study or research - You may not further distribute the material or use it for any profit-making activity or commercial gain - You may freely distribute the URL identifying the publication in the public portal
Take down policyIf you believe that this document breaches copyright, please contact us providing details, and we will remove access to the work immediatelyand investigate your claim.
Download date: 17. May. 2018

Fair Value and Pension Fund ManagementN. Kortleve, T. Nijman and E. Ponds (Editors)© 2006 Elsevier B.V.
CHAPTER 10
Pension Deals and Value-Based ALM
Niels Kortleve (PGGM)a,1 and Eduard Ponds (ABP and Netspar)b,1
JEL codes: G13, G23, H55 and M41
Abstract
High expected returns for equities do not imply that equities are more attrac-tive. Value-based ALM shows that poor equity returns come in economicbad times and that raising contributions and/or lowering benefits (cuttingnominal benefits or cutting indexation) is very expensive in these circum-stances. Equities will often outperform the riskless asset and on averageresult in cheaper funding and higher benefits, but this is offset by poor times,often even more than offset! Value-based ALM leads to the insight that cur-rent stakeholders often lose by taking more risk in the form of investing inequities. Next to that, investing in equities increases the size of ‘option sur-plus’ and ‘option deficit,’ the present value of future surpluses and deficits.Thereby the risk will increase and the sustainability of the pension dealdecreases since the future outcome can be very unattractive for one groupof stakeholders.
We will use the new approach of value-based ALM to investigate pensiondeals ranging from pure defined benefit to pure defined contribution and toasset allocations of 100% in equities versus 100% in bonds. We will showthat seemingly attractive pension deals, that have for instance low averagecontribution rates and high expected surpluses, may have low present valuesfor certain stakeholders. Value-based ALM will show who will gain and loose
aNiels Kortleve is a manager Actuarial Projects & Special Accounts for PGGM; bEduard Ponds ishead of strategy, Financial and Risk Policy Department, ABP and senior researcher for Netspar.1We are very grateful to Theo Nijman for his comments, Elbert Schrier and Jeroen Trip for theirsupport in generating the results.

182 N. Kortleve and E. Ponds
from changing the current pension deal. This information in our opinion willhelp to construct a more sustainable pension deal.
Value-based ALM adds new information relative to classical ALM in theform of present values of future cash flows, the economic value of futuresurpluses and deficits as well as stakeholder information, showing the inter-generational solidarity expressed in economic value terms. We think thisinformation should no longer be disregarded and should be included indoing ALM and constructing pension deals in the future.
10.1. Introduction
In the pension industry, Asset Liability Management (ALM) is being usedto come to optimal pension deals. Board members of pension plans have todecide what the optimal funding strategy, indexation policy and investmentstrategy is for the fund, as well as how risks best can be shared over thevarious stakeholders like members and sponsor. ALM outcomes could sug-gest to increase contributions in periods of poor investment returns – andfor Defined Benefit plans low funding ratios – and to lower indexation oreven cut benefits (in the case of Defined Contribution). Within ALM, onelooks to the possible distributions amongst others contributions, indexationand funding ratio to form an opinion on the attractiveness of the strategybeing considered.
Value-based ALM adds an extra, new dimension by showing thepresent value – also called economic value – of all decisions about thefunding strategy, indexation policy and investment strategy. Using the tech-niques described in the previous chapters,2 one can calculate the presentvalue of contributions (conditional), benefits (including indexation) andshortfalls/surpluses for the fund collectively and also for the various stake-holders. This addition leads to at least two types of extra insights, whichwe will discuss in more detail in Section 10.2. The main conclusions arethat economic value will lead to different insights in the attractiveness andsustainability of a pension deal for the pension fund and for its stakeholders.
2See chapters of Hibbert et al. (2006) and Nijman and Koijen (2006) for technique and Exley(2006) for concepts.

Pension Deals and Value-Based ALM 183
Value-based ALM could thus lead to even better pension deals and risksharing within pension plans.
An extra reason for applying value-based ALM is the broad shift to fairvalue that one can notice in (international) accounting standards and in super-vision of pension funds and insurance companies.3 Fair value does not onlygive relevant information for shareholders, but also for other stakehold-ers like members and leads to more transparent and easier to understandinformation about the pension deal. Supervisors are working on frameworksincorporating fair value for both assets and liabilities, making value-basedALM an even more sensible approach.
10.2. Characteristics of value-based ALM
What are the main characteristics of a value-based ALM approach forstrategic decision making by a pension fund? As the focus of analysisof value-based ALM is economic value, the analytical framework of thisapproach will therefore differ from standard ALM. Classical ALM usuallyuses items like the expected value of core variables supplemented with one ormore measures of the degree of riskiness of those variables. Classical ALMoften makes use of techniques like Monte Carlo simulations to project thesedistributions and to optimize the strategy of the fund. This output remainsuseful because it provides insight in the distribution of future possible results.One gets information on the probability of underfunding, the probability ofa high contribution rate or probability of a low indexation or no indexationat all, and so on. This will give some idea as to the sustainability of thepension deal in the long run.
Value-based ALM essentially uses the same output of scenario analysisas classical ALM, however the future outcomes are discounted back to thepresent with an appropriate risk adjusted discount rate. This is realized bydiscounting with either deflators, risk neutral valuation or pricing kernels(compare the contributions of Hibbert et al. (2006), and Nijman and Koijen(2006) in this volume).
3Major trends are IFRS (International Financial Reporting Standards) using fair value concepts andsupervision in countries in Europe. In the Netherlands the government and supervisor are workingon a fair value framework to be implemented January 1, 2007.
184 N. Kortleve and E. Ponds
The shift from classical ALM to value-based ALM leads to at least twotypes of extra insights. The first new insight is the value the (financial) marketcurrently attaches to future cash flows. ALM experts looked at averages,shortfalls etc., but disregarded information given by financial markets inthe form of the present value of the future cash flows. Since the marketis risk averse, one can learn that a deal with low average contributionscan have a high present value for these contributions, especially if futurecontributions can be high in expensive states as often is the case in periodsof low investment returns/funding ratios.4 The opportunity the fund has toincrease contributions in economic bad times will have a high present valuefor the fund. Active members are the ones bearing this risk.
Value-based ALM can calculate the present value of cash flows like con-tributions and indexation since these cash flows – in the approach we useby making these contingent on the funding ratio – are linked to cash flowsof financial titles like equities and bonds. Even if these cash flows are notfixed – like in the situation of conditional indexation based on an indexationladder (also see Section 10.6.4) – their present value can be calculated usingthe concept of replicating portfolios (also see Exley (2006) in this volume).A pension fund can thus value all options it is holding in the form of allkinds of contribution and/or indexation policies.
In this chapter, apart from giving information about the present value offuture cash flows in the form of present value of contributions and benefits,we also use ‘option surplus’ and ‘option deficit,’ the present value of futuresurpluses and deficits. These in our opinion give far more relevant informa-tion about the possible future surpluses/deficits than the likelihood and thedepth of a possible shortfall or surplus.
The second new insight is that one can look at the stakes of variousparties joining the pension fund and that one can see the impact of changingthe pension deal on various stakeholders. This will help to formulate a moresustainable pension deal and to avoid that one group, for instance the youngmembers, have to pay up for any shortfall but do not get compensatedin getting extra upside at the same time. The new pension deal can have(substantial) negative impact on the present value for certain stakeholders,in our experience this information is an important addition to classical ALM.
As to our knowledge, the paper of Chapman et al. (2001) is the firstcontribution in this field. They apply the approach to strategic decision
4Also see Kortleve (2003).

Pension Deals and Value-Based ALM 185
making within a company pension fund organising a defined benefit plan.They model the fund not as a self-contained entity but simultaneously withthe sponsoring company. The analysis is focused primarily on transfers ofvalue between the shareholders and the pension fund participants. Ponds(2003b) and Kortleve (2003, 2004) employ the value-based approach toanalyse transfers of value between old, young and future members within apension fund where risk have to be borne primarily by the plan members.One may speak of intergenerational risk sharing that typically can be foundin industry wide pension plans (the Netherlands) and public sector pensionfunds (UK, US, Canada). This contribution primarily is aimed at clarifyingthe main differences between classical ALM and value-based ALM.
A pension fund is a zero-sum game in economic value terms. A change inthe pension fund strategy (for example taking more or less investment risk)does not create economic value, however it may lead to transfers of valuebetween stakeholders. Value-based ALM facilitates in clarifying who gainsand who loses in economic value terms from a given pension fund strategyor from a change in the strategy.5 A pension fund being a zero-sum game invalue terms can be a positive-sum game in utility terms. The final sectionof this chapter discusses implications if one incorporates welfare aspects inthe analysis.
10.3. Characteristics of the pension fund
The pension fund has the following features:
1. Pension plan: average-wage plan with indexed liabilities. The indexationmay be conditional depending on the content of the Pension Deal. Theyearly indexation is aimed to follow the price inflation.
2. Liabilities: the valuation of the indexed liabilities is based on discount-ing with the real interest rate.6 The duration of the indexed liabilitiesis 21 years (at a real rate of 2%). 60% of the participants is pensioner
5Assuming stakeholders will not compensate these changes using financial markets. If markets arecomplete and frictionless markets and there are no transaction costs etc., stakeholders could forinstance use derivatives to hedge and offset the impact of the changes.6Almost all Dutch pension plans assume nominal liabilities in accounting for their funding ratiofor the new solvency test.

186 N. Kortleve and E. Ponds
or deferred. The remaining part of 40% comprises the (current and future)active members.
3. Funding ratio: the initial real funding ratio is 100%. The real fundingratio is defined as the ratio of the value of the assets and the value of theindexed liabilities.
4. Contribution rate: the base contribution rate has to meet the economiccosts (‘cost price’) of new liabilities accruing during one year of servicebased on the relevant discount rate, i.e., the real rate. The funding methodis formulated for a going-concern pension fund: the base contribution rateto be asked in the coming 40 years P∗
t is solved from the requirementof a balance between the present value of new accrued liabilities in thecoming 40 years and the present value of contributions in the coming40 years:
P∗t = PV new liabilities 40 years
PV pensionable wages 40 years
Contributions are expressed as a percentage of the pensionable wageincome. As the target indexation is linked to the price inflation, the termsin the above formula for the base contribution rate is calculated with theexpected real rate. The length of the 40 year period reflects the length ofone generation.
5. Asset mix: we consider just two variants in the asset mix: 100% nominalbonds and 100% equities. The duration of the bonds is 5.3 years.
6. Policy horizon: we assume a policy horizon of 15 years.7 This meansthat we assume a plan horizon of 15 years. During these 15 years newbenefits are being built, benefits will accrue with the indexation beinggranted, the fund realizes investment returns etc.
7. Risk-bearing:8 employers (in this chapter) are no risk-bearing party. Theinvolvement of employers with the funding is restricted to paying con-tributions from gross wage income. Hence, all the funding risks have to
7The 15-year period is the length of the recovery period that pension funds in the Netherlands willbe given to accumulate the required solvency buffer in case of a solvency deficit.8The spectrum of pension funds shows up a great variety in the nature of risk bearing becausethe stakeholders are free in making rules as to who should bear the risks in the funding process.However, one may distinguish two basic types. The first one may be found in company pensionplans, where it is usually prescribed that the sponsoring firm is solely responsible for the fundingposition. The second basic form can be found in public sector pension funds and industry pensionfunds where the funding risks typically are borne by the members collectively.

Pension Deals and Value-Based ALM 187
be borne by current and future members of the pension plan.9 In Sec-tion 10.6 we will discuss four different variants of risk-bearing by theplan members.
10.4. Framework of analysis
The balance sheet of a pension fund in economic value terms will look asthe one displayed in Figure 10.1. The represented terms are the economicvalue expressions at t = 0 of the relevant variables at the end of the horizonat t = T .
The term �IndT may be negative or positive reflecting either a cut in fullindexation or additional indexation above full indexation. The term �PT
also may be negative or positive reflecting either a reduction or an extracharge to the cost price contributions. The term RT is the economic value of
Figure 10.1. Balance sheet pension fund in economic value terms
A0
PT
∆PT
L0
nLT
∆IndT
RT
whereA0 = value of assets at t = 0L0 = value of accrued liabilities (with full indexation) at t = 0nLT = economic value of new accruing liabilities during the period t = 0 to t = T (with full indexation)PT = economic value of contributions during the period t = 0 to t = T to fund the new accruing liabilities nLT∆IndT = economic value of additional indexation apart from full indexation during the period t = 0 to t = T∆PT = economic value of additional contributions apart from full cost price contributions PT during the period t = 0 to t = TRT = economic value of funding residue at the end of year T
9This type of risk bearing is typical for industry pension funds in the Netherlands. There are around80 industry pension funds in the Netherlands, covering almost 70% of the workers and more than70% of total assets of Dutch pension funds of around 480 billion Euro (end of 2004). Around 25%of the working force is participant in a corporate pension fund. The remaining 5% of the workershas a defined contribution plan (3%) or no plan at all (2%).

188 N. Kortleve and E. Ponds
the residue at the end of year T, and it may be either positive or negativeas well.
As by definition the economic value of the cost price contributions equalsthe value of the new liabilities to be built up during the horizon under con-sideration, i.e., PT = nLT , and as the initial balance sheet at t = 0 isidentical to: A0 = L0 + R0, we can rearrange terms in the balance sheet ofFigure 10.1. to get the fundamental expression below reflecting the natureof a pension fund of being a zero-sum game in economic value terms:
−�PT + �IndT + �RT = 0
where:�RT = RT − R0
This expression also clarifies that a pension fund has three methods ofrisk management:
1. Intertemporal spreading of risk: a funding surplus or a funding deficit isshifted forward in time. There is no active risk management at all.
2. Contribution adjustments: a funding surplus or a deficit is absorbed byworkers via receiving a contribution cut or an extra contribution chargerespectively. Total contributions are equal to the cost price contributionsplus – some part of – the pension fund residue.
3. Indexation adjustments: the funding risks can be taken up by adjustingthe indexation rate so that total indexation is equal to the total aimedindexation plus – some part of – the pension fund residue.10
The risk-adjusted discounting provides the economic value of the residue(at t = T ) of this distribution at t = 0, RT . The term RT can be split up intwo parts: the economic value of the surplus minus the economic value ofthe deficit.
RT = economic value surplus −/− economic value deficitat t = T at t = T
= option price at t = 0 of −/− option price at t = 0 ofsurplus at t = T deficit at t = T
10A fourth method may be reduction of nominal liabilities. Technically this may be processed byallowing negative indexation. The latter is possible within deal 3 (see Section 10.6.3).

Pension Deals and Value-Based ALM 189
The risk-bearing stakeholders have a call on the future surpluses andthese surpluses will be distributed amongst them according to the risk-allocation rules of the pension deal in operation. In case of deficits therisk-bearing stakeholders have to make up the funding shortfall. This maybe interpreted as if these stakeholders have written a put with an exerciseprice for the residue of zero, i.e., the economic cost of reinsurance againstdeficits at t = T . One may interpret the economic value of a surplus or adeficit as option premiums. Hence, the economic value of the surplus maybe seen as the option premium for a call on the surplus at the end of period T,whereas the economic value of the deficit may be interpreted as the optionprice for a written put with an exercise price for the residue of zero.
10.5. Economic environment
10.5.1. Assumptions
The model being used for the calculations in this chapter is a modern ver-sion of Timbuk1.11,12 The model is calibrated to the market prices as ofDecember 31, 2003.
The pension fund outlook with respect to the economic future is capturedin the expectations and volatility of the core economic variables as displayedin Table 10.1. Note that it is assumed that the wage inflation is equal to theprice inflation, so the real growth rate of wages is zero.
10.5.2. Deflators
In this chapter we use deflators to discount the cash flows to arrive at thecorrect present value of these cash flows. Either deflators, risk neutral valua-tion or pricing kernels can be used to discount all kinds of future cash flows,including benefits, contributions and asset returns.13 To get the present valueof a financial title, one should multiply the possible cash flows of that title
11One can download documentation from http://www.gemstudy.com/FairValueDownloads/Timbuk1.pdf.12For description of these types of models, also see the contributions of Hibbert et al. (2006) andNijman and Koijen (2006) in this volume.13See contributions of Hibbert et al. (2006) for concept of various approaches and how theseapproaches are linked to one another.

190 N. Kortleve and E. Ponds
Table 10.1. Economic outlook
Economic variables Expected outcome1 Standard deviation
Inflation2 3.2 1.5Nominal rate of interest 5.6 1.6Nominal bonds3 5.4 4.7Real rate of interest4 2.0 0.5Equities 10.8 26.3
1Geometric returns.2It is assumed price inflation and wage inflation are the same, i.e., there is no real wagegrowth.3Duration nominal bonds is 5.3 years, being the duration in the market.410 year zero rate.
by the corresponding deflators:
PV = �iCFi × pi × Di
WherePV = present valueCFi = cash flow in state i (assuming 1000 simulations, this can be
any of the simulations)pi = probability of state i (e.g. 1 out of 1000)Di = deflator for state i
Deflators will correct for the equity risk premium relative to risk freeassets. In other words, even though equities do show a higher expect returnand therefore generate higher cash flows on average than bonds, the presentvalue of 100 Euros in equities is (of course) the same as the present value of100 Euros in bonds. High cash flows from equities will most of the time bemultiplied by low deflators, whereas low cash flows will be multiplied byhigh deflators, as one can also see from Figure 10.2. The correlation betweenequity returns and deflators is negative, meaning that on average high equityreturns will be multiplied by low deflators and vice versa. So, very poorequity returns of −50% can have a deflator of 3 or even more, whereasvery attractive equity returns of +100% have deflators of 0.5 or below.For equities the present value of a cash flow of 100 in poor times can be10 times as high as in prosperous times. As one can see from the figure,there is hardly any correlation between bond returns and deflators, whichmeans that high bond returns are – on average – not compensated by lowdeflators and vice versa.

Pension Deals and Value-Based ALM 191
Figure 10.2. Equity and bond returns versus deflators
EquitiesBonds
-75
-50
-25
0
25
50
75
100
125
150
0 1.5 2 3 4
Deflator
Ret
urn
(in %
)
0.5 1 2.5 3.5 4.5
10.6. Variants in funding strategy and risk bearing
We will discuss four distinctive pension deals. This enables us to showthe impact of alternative pension deals on the value of the stakes of thestakeholders. These deals differ as to the contribution policy, the indexationpolicy, the asset mix and risk allocation.
With the term ‘pension deal’ we mean the contract between the pensionfund and the stakeholders that sets out the nature of the pension promise (finalpay or average wage, the nature of the indexation policy), the funding of thispromise and how the risks in the funding process are allocated (implicit orexplicit) amongst the stakeholders. An explicit pension deal has clear rulesprescribing who has to pay, when and to what extent in a deficit situation.These rules also set down who will benefit, when, and to what extent ina surplus situation. Below we discuss four examples of explicit deals. Thedeals investigated are:
Variants in funding strategy and risk bearing
Pension deal Riskmanagement
Indexation policy Contribution policy
1. No active riskmanagement
None Full Fixed
2. Pure definedbenefit
Steering usingcontributions
Full Contingent onfunding ratio
continued

192 N. Kortleve and E. Ponds
Variants in funding strategy and risk bearing—Cont’d
Pension deal Riskmanagement
Indexation policy Contribution policy
3. Collective definedcontribution
Steering usingindexation
Indexation accruedrights contingent onfunding ratio
Fixed
4. Policy ladder Using bothindexation andcontribution tosteer
Indexation accruedrights contingent onfunding ratio withminimum andmaximum
Contingent onfunding ratiowith minimumand maximum
10.6.1. Deal 1: No active risk management (Spreading risk over time/riskspreading between generations)
Pension deal 1 is characterized by no active risk management at all. Thereis no aim to correct the course of the funding ratio over time by making useof either the indexation instrument or the contribution policy. Each year thecontribution rate is set equal to the cost price to fund new accrued liabilitiesand every year the indexation follows the actual inflation (see Figure 10.3)This deal has a maximum appeal on spreading risk over time, or in otherwords on intergenerational risk-sharing. Actually, the pension fund relies onan infinite sequence of overlapping age-cohorts. Table 10.2 reflects the coreresults in terms of expected values and riskiness of the variables for a mixof 100% bonds and a mix of 100% equities, respectively. This is the usualclassical ALM output.
Figure 10.3. Pension deal 1: No active risk management
Contribution
Indexation
Funding ratio
Costprice
Inflation

Pension Deals and Value-Based ALM 193
Table 10.2. Classic ALM results deal 1
MIX = 100% Bonds MIX = 100% Equities2005–2019 2005–2019
Funding ratioaverage 99.0 180.9risk (st dev) 2.7 132.8st dev D FR 1.0 45.0prob underfunding 70.4 29.7
Contributionsaverage 21.4 21.4risk 1.5 1.5
Relative pension result 100% 100%
Indexationnone 0% 0%partial 0% 0%full 100% 100%catch up 0% 0%
As can be read from Table 10.2, the cost price contribution rate is slightlyhigher than 21% of pensionable wages. Indexation is always linked to theactual inflation, so the cumulative indexation has a full 100% match withthe target indexation. The mix consisting of 100% nominal bond delivers onaverage a real rate of return of 2% as anticipated in setting the contributionrate. Therefore the funding ratio on average remains stable over time. Thevolatility in the funding ratio is quite low primarily because of the low riskin the real rate and because of the high correlation between the real rateand the nominal rate. The 100% bonds mix nevertheless will imply somemismatch risk, firstly because the pay-off structure of nominal bonds differsfrom the growth rate of indexed liabilities as there is no perfect correlationbetween nominal rate and real rate, and secondly because the duration ofthe liabilities is much higher than the duration of the bond mix.
The 100% equity mix gives prospect to a higher expected real returncompared with the real rate, so the expected funding ratio will increase overtime. This investment strategy implies a much higher risk profile for thestakeholders than the investment strategy with 100% bonds. This can bechecked with Table 10.2 by looking at the risk measures of the funding ratiothat quantify the spreading in the funding ratio, i.e., the standard deviation

194 N. Kortleve and E. Ponds
of the funding ratio itself (almost 133% for equities and just 3% for bonds)and of the change in the funding ratio in one year (45% for equities and just1% for bonds).
Figures 10.4 and 10.5 show the development of the funding ratio forthe two investment strategies.14 The risky 100% equity strategy leads onaverage to an increase in the funding ratio, and so to an increasing fundingsurplus. The funding ratio of the low risky 100% bond strategy remainsstable over time.
Table 10.3 shows the results of value-based ALM. The balance sheetsreflect economic values. Note that the economic value of the funding residueof both strategies is the same! This is to be explained by the high economicvalue attached to underfunding and the low economic value of overfunding.
Figure 10.4. Funding ratio in deal 1 with 100% bonds
050
100150200250300350400450500
2004 2009 2014 2019
year
Figure 10.5. Funding ratio in deal 1 with 100% equities
050
100150200250300350400450500
2004 2009 2014 2019
year
14The graphs show the following percentiles of the probability distribution of the funding ratio: 1,5, 10, 90, 95, 99 and the median.

Pension Deals and Value-Based ALM 195
Table 10.3. Value-based ALM results deal 1
100% Bonds
Assets (A0) 100 Accrued liabilities (L0) 100
Contributions (PT ) 90 New liabilities (nLT ) 90
Additional contributions 0 Additional indexation 0
Change residue (�RT ) 0Option surplus 4Option deficit −4
100% Equities
Assets (A0) 100 Accrued liabilities (L0) 100
Contributions (PT ) 90 New liabilities (nLT ) 90
Additional contributions 0 Additional indexation 0
Change residue (�RT ) 0Option surplus 50Option deficit −49
The 100% equity strategy may lead to a lower probability of underfunding,however when it occurs, underfunding may be sizeable and it most likelywill happen in expensive states when stakeholders will not be able andwilling to make up for shortfalls. It is very expensive to hedge a situation ofunderfunding. The deflator method attaches a high present value to outcomesin economic bad times. Deep underfunding typically will occur in bad times.The 100% bond strategy will have less underfunding in bad times, less bothin terms of frequency and depth.
Our conclusion is that the assumed attractiveness of equities, as can beread from the classical Table 10.2, is not so attractive when viewed from theperspective of fair value. Equities do not add economic value; they increasethe present value of future surpluses as well as the present value of futuredeficits!15 Fair value shows that taking risk does not increase the presentvalue.
15The higher the volatility, the higher the value of an option price.

196 N. Kortleve and E. Ponds
10.6.2. Deal 2: Pure defined benefit
The characteristics of deal 2 are in line with a pure defined benefit scheme:indexation is always given according to the promise and the contributionrate is adjusted yearly in order to absorb the risk in the pension fund. Thetarget funding ratio is defined as the 100% funding ratio, this is the situationwhere the assets At are equal to the value of the indexed liabilities Lt , i.e.,At/Lt = 100%. The contribution rate will be equal to the cost price whenthe funding ratio is 100%. Any deviation between the actual and the targetfunding ratio will lead to an adjustment in the contribution rate. There is a cutin case of overfunding, whereas a charge is asked in case of underfunding.Full adjustment of the funding ratio back to the target level in one year willlead to extreme adjustments in the contribution. Therefore the fund aimsto reach the full funding situation after 40 years. So the restoration of anydeviation of the actual funding ratio from its target level is smoothed outover a period of 40 years. Hence, the additional contribution rate apart fromthe base rate, Padd
t , is calculated as follows (also see Figure 10.6):
Paddt = Liabilities − Assets
PV pensionable wages 40 years
The total contribution rate is equal to the sum of cost price contributionrate plus the additional contribution rate:
Total Contribution Rate = P∗t + Padd
t
Figure 10.6. Deal 2: Pure defined benefit
Funding ratio100%
Contribution
Indexation
Costprice
Inflation

Pension Deals and Value-Based ALM 197
Table 10.4. Classic ALM results deal 2
MIX = 100% Bonds MIX = 100% Equities2005–2019 2005–2019
Funding ratioaverage 99 172.7risk (st dev) 2.5 118.5st dev D FR 1 42.9prob underfunding 68.7 29.6
Contributionsaverage 21.5 13.3risk 1.6 13.5
Relative pension result 100% 100%
Indexationnone 0% 0%partial 0% 0%full 100% 100%catch up 0% 0%
The classical ALM results are quite familiar (Table 10.4). The contri-bution rate in the equity strategy displays on average a downward trend(Figure 10.7). The on average high excess return in this strategy is translatedin cuts in the contribution rate. The average contribution rate drops from21.4% to only 13.3%, though the latter has more dispersion and can behigher than 30% in some more extreme cases. The bond strategy delivers
Figure 10.7. Contribution rate in deal 2 with 100% bonds
0
10
20
30
2004 2009 2014 2019
year
198 N. Kortleve and E. Ponds
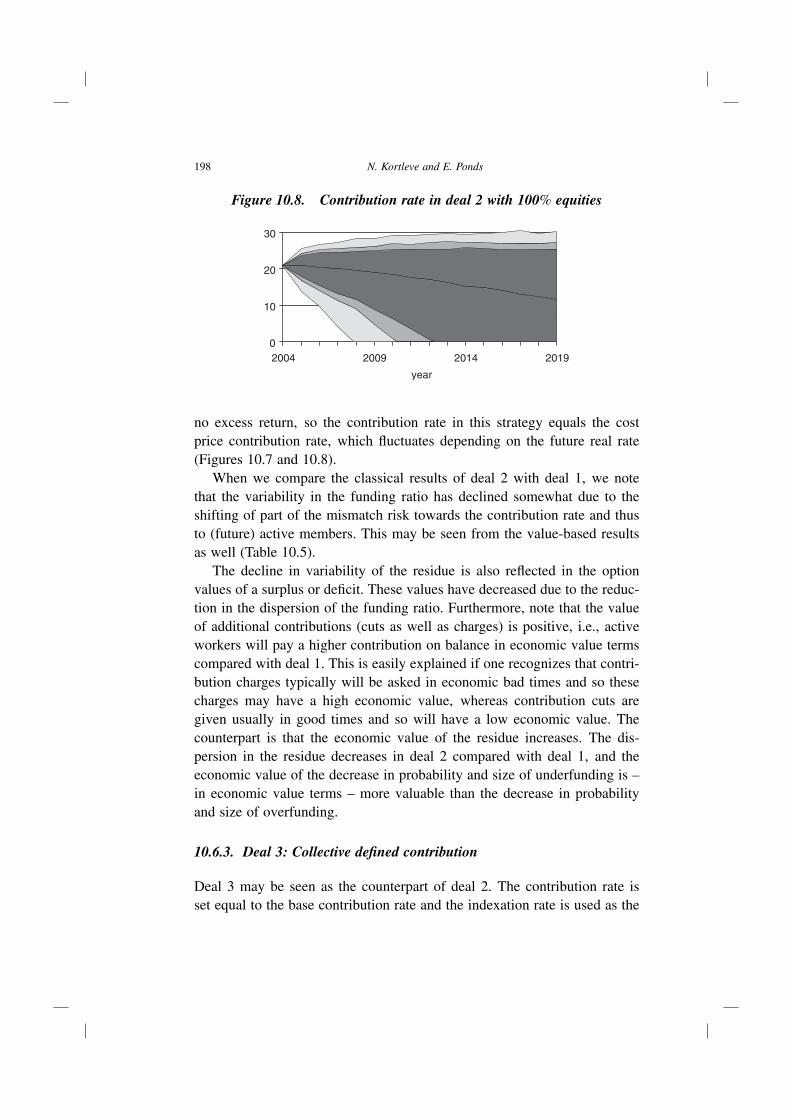
Figure 10.8. Contribution rate in deal 2 with 100% equities
0
10
20
30
2004 2009 2014 2019
year
no excess return, so the contribution rate in this strategy equals the costprice contribution rate, which fluctuates depending on the future real rate(Figures 10.7 and 10.8).
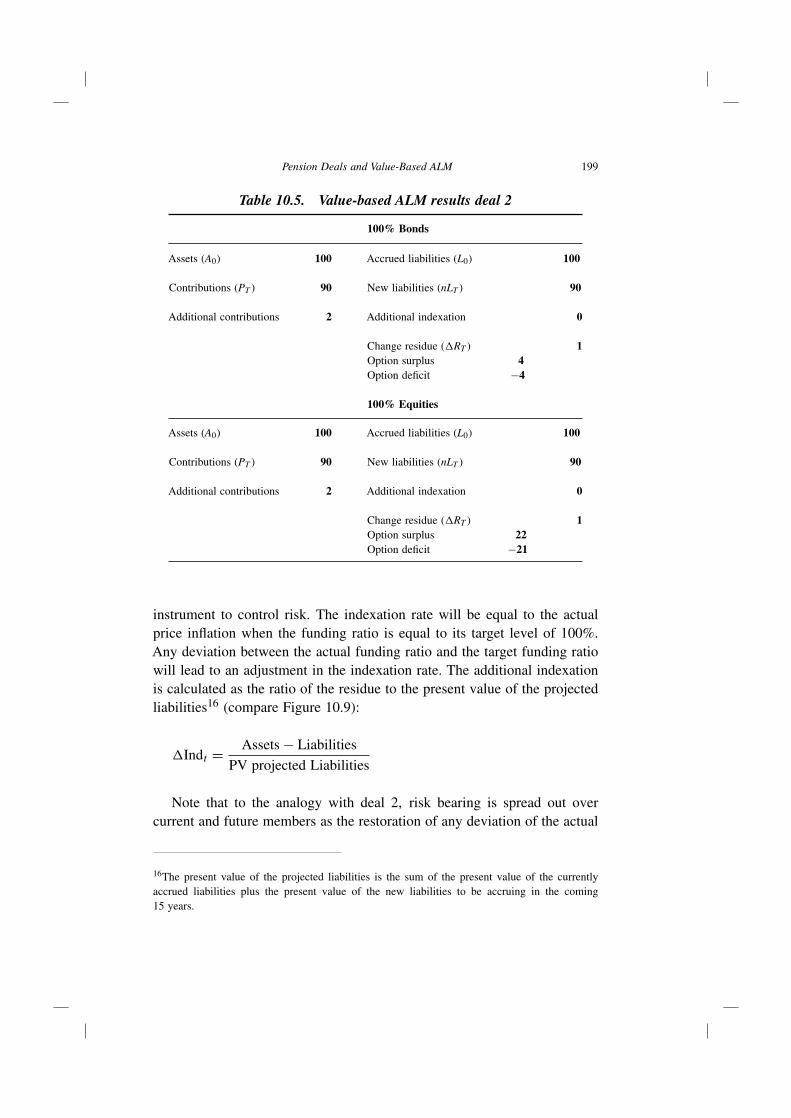
When we compare the classical results of deal 2 with deal 1, we notethat the variability in the funding ratio has declined somewhat due to theshifting of part of the mismatch risk towards the contribution rate and thusto (future) active members. This may be seen from the value-based resultsas well (Table 10.5).
The decline in variability of the residue is also reflected in the optionvalues of a surplus or deficit. These values have decreased due to the reduc-tion in the dispersion of the funding ratio. Furthermore, note that the valueof additional contributions (cuts as well as charges) is positive, i.e., activeworkers will pay a higher contribution on balance in economic value termscompared with deal 1. This is easily explained if one recognizes that contri-bution charges typically will be asked in economic bad times and so thesecharges may have a high economic value, whereas contribution cuts aregiven usually in good times and so will have a low economic value. Thecounterpart is that the economic value of the residue increases. The dis-persion in the residue decreases in deal 2 compared with deal 1, and theeconomic value of the decrease in probability and size of underfunding is –in economic value terms – more valuable than the decrease in probabilityand size of overfunding.
10.6.3. Deal 3: Collective defined contribution
Deal 3 may be seen as the counterpart of deal 2. The contribution rate isset equal to the base contribution rate and the indexation rate is used as the
Pension Deals and Value-Based ALM 199
Table 10.5. Value-based ALM results deal 2
100% Bonds
Assets (A0) 100 Accrued liabilities (L0) 100
Contributions (PT ) 90 New liabilities (nLT ) 90
Additional contributions 2 Additional indexation 0
Change residue (�RT ) 1Option surplus 4Option deficit −4
100% Equities
Assets (A0) 100 Accrued liabilities (L0) 100
Contributions (PT ) 90 New liabilities (nLT ) 90
Additional contributions 2 Additional indexation 0
Change residue (�RT ) 1Option surplus 22Option deficit −21
instrument to control risk. The indexation rate will be equal to the actualprice inflation when the funding ratio is equal to its target level of 100%.Any deviation between the actual funding ratio and the target funding ratiowill lead to an adjustment in the indexation rate. The additional indexationis calculated as the ratio of the residue to the present value of the projectedliabilities16 (compare Figure 10.9):
�Indt = Assets − Liabilities
PV projected Liabilities
Note that to the analogy with deal 2, risk bearing is spread out overcurrent and future members as the restoration of any deviation of the actual
16The present value of the projected liabilities is the sum of the present value of the currentlyaccrued liabilities plus the present value of the new liabilities to be accruing in the coming15 years.

200 N. Kortleve and E. Ponds
funding ratio from its target is smoothed out over time, over already accruedand newly accruing liabilities.
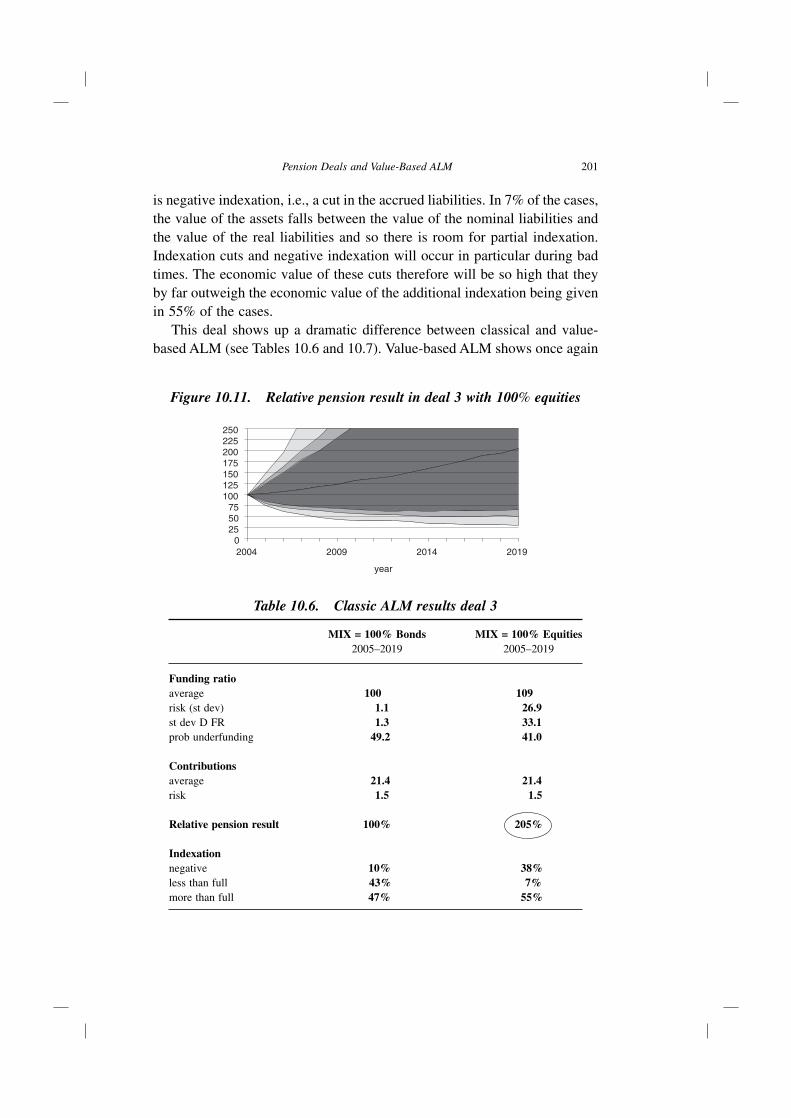
This deal implies that any deviation of the funding ratio of its target willlead to a deviation between the aimed indexation and the actual indexation.The 100% equity mix on average has a high return and this high return willbe given away in additional indexation. In 55% of the cases, the fundingratio is above 100% and so the pension fund pays out more than just fullindexation (Figure 10.10). The relative pension result indexation reaches anaverage value of 205%! The relative pension result is defined as the ratio ofthe actual pension result to the target pension result. However, the dispersionis also very high as can be seen from Figure 10.11.
When we take notice of the economic value consequences of this deal,then another picture arises. In 38% of the cases during the period underconsideration, assets fall below the value of nominal liabilities so then there
Figure 10.9. Deal 3: Collective defined contribution
Funding ratio 100%
Contribution
Indexation
Costprice
Inflation
Figure 10.10. Relative pension result in deal 3 with 100% bonds
0255075
100125150175200225250
2004 2009 2014 2019
year
Pension Deals and Value-Based ALM 201
is negative indexation, i.e., a cut in the accrued liabilities. In 7% of the cases,the value of the assets falls between the value of the nominal liabilities andthe value of the real liabilities and so there is room for partial indexation.Indexation cuts and negative indexation will occur in particular during badtimes. The economic value of these cuts therefore will be so high that theyby far outweigh the economic value of the additional indexation being givenin 55% of the cases.
This deal shows up a dramatic difference between classical and value-based ALM (see Tables 10.6 and 10.7). Value-based ALM shows once again
Figure 10.11. Relative pension result in deal 3 with 100% equities
0255075
100125150175200225250
2004 2009 2014 2019
year
Table 10.6. Classic ALM results deal 3
MIX = 100% Bonds MIX = 100% Equities2005–2019 2005–2019
Funding ratioaverage 100 109risk (st dev) 1.1 26.9st dev D FR 1.3 33.1prob underfunding 49.2 41.0
Contributionsaverage 21.4 21.4risk 1.5 1.5
Relative pension result 100% 205%
Indexationnegative 10% 38%less than full 43% 7%more than full 47% 55%

202 N. Kortleve and E. Ponds
Table 10.7. Value-based ALM results deal 3
100% Bonds
Assets (A0) 100 Accrued liabilities (L0) 100
Contributions (PT ) 90 New liabilities (nLT ) 90
Additional contributions 0 Additional indexation −2
Change residue (�RT ) 4Option surplus 4Option deficit −1
100% Equities
Assets (A0) 100 Accrued liabilities (L0) 100
Contributions (PT ) 90 New liabilities (nLT ) 90
Additional contributions 0 Additional indexation −2
Change residue (�RT ) 4Option surplus 18Option deficit −14
that the extra indexation comes in good times, so the present value of these55% of the scenarios does not outweigh the other 45%; the present value isthe same for the portfolio of 100% bonds and of 100% equities.
10.6.4. Deal 4: Policy ladder
A number of Dutch pension funds recently has introduced a so-called policyladder, in Dutch ‘Beleidsstaffel’ (Ponds, 2003a). We may interpret the ladderas a combination of components of the two preceding deals. The basic ideaof the ladder is quite simple. We explain the basic idea with the help ofFigure 10.12. Two points are of crucial importance, the upper bound and thelower bound. It is assumed in this chapter that the upper bound is the situationwhere the real funding ratio is 100%, this is when the assets exactly matchthe value of the indexed liabilities. The lower bound is the situation where thenominal funding ratio is 100%, i.e., the value of the assets is the same as thevalue of the nominal liabilities (thus no indexation). The difference between

Pension Deals and Value-Based ALM 203
Figure 10.12. Deal 4: Policy ladder
Contribution
Indexation
Funding ratio
lowerbound
Costprice
Inflation
0
100%
Cost price+ ∆Pmax
upperbound
Catchup indexation
the upper bound and lower bound is the necessary indexation reserve neededto pay for the future indexation of the accrued liabilities. This indexationreserve can also be expressed as the difference between the value of indexedliabilities (based on the real yield curve) and the value of nominal liabilities(with valuation based on the nominal yield curve).
The contribution rate and the indexation are set along the vertical axis.
Indexation policy: The magnitude of the indexation is related proportion-ally to the size of the available indexation reserve, this is the differencebetween assets and nominal liabilities. There is room for full index-ation, if and when the value of the assets equals the value of fullyindexed liabilities. In this case, the actual indexation reserve matchesthe required indexation reserve. The indexation rate will be zero whenthe assets are equal to or even below the present value of the nominalliabilities. The indexation reserve then is actually zero or even negative.Between these points there will be an indexation cut where the size ofthe cut is related to the actual deficit in indexation reserve. Wheneverthe value of the assets exceeds the value of indexed liabilities, thereis room to provide extra indexation until there is a full catching-up ofpreviously missed indexation.

204 N. Kortleve and E. Ponds
Figure 10.13. Contribution rate in deal 4 with 100% bonds
0
10
20
30
2004 2009 2014 2019
year
Figure 10.14. Contribution rate in deal 4 with 100% equities
0
10
20
30
2004 2009 2014 2019
year
Contribution rate: The contribution rate is set equal to the cost price ofthe new accrued liabilities of one year of service when the fundingratio is equal to or is higher than 100%.17 A contribution charge islevied when assets fall short of the indexed liabilities. To the analogywith the indexation cut, the charge will increase when the deficit isincreasing. The maximum charge is determined by the annual fundingcosts in order to build up the required indexation reserve within 40 years(Figures 10.13 and 10.14).
From the classical ALM results we make up that the 100% bonds strat-egy on average yields a funding ratio of around 100% (Table 10.8). Thecontribution rate is on average around the cost price level. The median
17The pension fund could also decide to cut the contribution below cost price, when the plan isoverfunded (i.e., funding ratio is higher than 100%).

Pension Deals and Value-Based ALM 205
Table 10.8. Classic ALM results deal 4
MIX = 100% Bonds MIX = 100% Equities2005–2019 2005–2019
Funding ratioaverage 99.2 182.7risk (st dev) 2.5 131.8st dev D FR 1 45.2prob underfunding 68.4 28.5
Contributionsaverage 21.5 21.9risk 1.6 2
Relative pension result 100% 100%
Indexationnone 0% 3%partial 32% 22%full 49% 47%catch up 19% 28%
Figure 10.15. Relative pension result in deal 4 with 100% bonds
70
80
90
100
110
2004 2009 2014 2019
year
cumulative indexation equals 100%, being the result of both indexation cutsand catch-up indexation. The 100% equity mix will lead on average to anever increasing funding ratio as the expected high equity return cannot betranslated in cuts in the contribution rate as in deal 2 or in additional index-ation as in deal 3. The average funding ratio is increasingly much higherthan 100%.

206 N. Kortleve and E. Ponds
The value-based ALM results make clear that the 100% equity strategydoes not necessarily imply better results in economic value terms. Afteradjusting the future results for the high risk involvement it becomes clearthat the costs of additional contributions and indexation cuts are very highand take away the general believed advantages of risk-taking. The highequity returns turn up in economic times with low deflators and thereforehave limited present value, at least lower than their nominal cash flows doimply. The low equity returns coincide with high deflators as well as withhigher contributions and lower indexation. So when equities perform poor,the members are hurt by extra payments to the fund and lower pensions outof the fund (Figure 10.15).
Further note that with 100% equities the current stakeholders are losingeconomic value (compare 100% equities with 100% bonds in Table 10.9).There is an increase of +20 in the value of the future residue in comparisonwith deal 1. This increase is primarily due to indexation cuts during badperiods for equity investments (note the additional indexation is –16, also
Table 10.9. Value-based ALM results deal 4
100% Bonds
Assets (A0) 100 Accrued liabilities (L0) 100
Contributions (PT ) 90 New liabilities (nLT ) 90
Additional contributions 1 Additional indexation 0
Change residue (�RT ) 2Option surplus 4Option deficit −2
100% Equities
Assets (A0) 100 Accrued liabilities (L0) 100
Contributions (PT ) 90 New liabilities (nLT ) 90
Additional contributions 6 Additional indexation −16
Change residue (�RT ) 20Option surplus 50Option deficit −31

Pension Deals and Value-Based ALM 207
Figure 10.16. Relative pension result in deal 4 with 100% equities
70
80
90
100
110
2004 2009 2014 2019
year
Figure 10.17. Change in economic value per age cohort
-700
-600
-500
-400
-300
-200
-100
0
100
1888 1898 1908 1918 1928 1938 1948 1958 1968 1978 1988 1998
Year of Birth
see Figure 10.16) and also because of extra contributions during these badperiods (note additional contribution is +6, also see Figure 10.14).
Figure 10.17 clarifies who is paying for this increase in the fundingresidue. We have displayed the change in economic value per age cohortswhen the pension fund steps over from deal 2 (or deal 1 or deal 3) to deal 4.We see that all cohorts lose economic value by this change. The fund col-lectively benefits, since the present value of the residue increases relativeto the previous deals. Future generations will be more willing to join thisdeal since the present value for them more likely will be positive. Why docurrent members lose on average? Active workers have to pay additionalcontributions when the funding ratio falls below the upper bound, however

208 N. Kortleve and E. Ponds
there are no contribution cuts when the funding ratio is higher than the upperbound. So workers pay on balance more contributions in deal 4 comparedto Deal 2. There are indexation cuts when the funding ratio falls short of theupper bound. Catch-up indexation is given when the funding ratio is recov-ered above the upper bound. On balance, cohorts will lose economic valuebecause there will be scenarios where indexation cuts have been passed butcatch-up indexation has not been given yet or only partially. Extending thehorizon will lead to a decrease in the shortage. The relative reduction inshortage for a specific cohort will be larger the younger a cohort is.
10.7. From value to welfare
An important result of value-based ALM is that it shows that a pensionfund is a zero-sum game in economic value terms. This insight may sug-gest that any pension fund policy only implies transfers of value amongst thestakeholders which do not have any role (cf. Exley, 2004). However this con-clusion neglects the welfare aspects of pension funds. Indeed pension fundsare potentially welfare-enhancing because pension funds aim to offer retire-ment income products which are not available in the market.18 Although theoffered insurance may differ amongst the various pension funds, the aim ofthe different pension deals is to enable the participant to go on with the stan-dard of living before retirement after one is retired. This kind of ‘insurance’offers protection against the risk that the purchasing power of pension sav-ings is eroded by inflation and also against the risk that pension savings donot hold pace with the real growth of the economy, i.e., the general standardof living. From the literature, it is well-known that these types of insurancecan be organized by intergenerational risk-sharing. Just because the mar-ket fails to organize this kind of risk-sharing, pension funds are potentiallywelfare-enhancing (Gordon and Varian, 1988; Shiller, 1999; Ponds, 2003b).Cui et al. (2005) developed a framework wherein pension funds can be eval-uated in economic value terms as well as in utility terms. The utility analysisclarifies the welfare aspects of pension funds. They show first that in utilityterms a pension fund as a risk-sharing arrangement is more useful than an
18Even if markets are complete and stakeholders do have full insight in and understanding of theirstakes (i.e., contributions, benefits and indexation), cutting costs, sharing risks and other argumentsstill seem to favour collective pensions over individual pensions.

Pension Deals and Value-Based ALM 209
individual pension saving program without risk-sharing opportunities (indi-vidual defined contribution plan), and secondly that pension deals beingperformed by pension funds are ranked higher in utility terms the more theycontribute to safe and smoothed consumption patterns over the life-cycle ofthe involved participants. Indeed a pension fund always is a zero-sum gamein value terms, however it is potentially a positive-sum game in welfareterms.
References
Ambachtsheer, K.A. (2006), Building better pension plans on a ‘fair value’ foundation, thisvolume.
Chapman, R.J., T.J. Gordon and C.A. Speed (2001), “Pensions, funding and risk”, BritishActuarial Journal, Vol. 74, pp. 605–663.
Cui, J., F. Jong de and E.H.M. Ponds (2005), Intergenerational transfers within funded pensionschemes, working paper, Netspar, University of Tilburg.
Exley, J. (2004), Stakeholders Interests Alignment/Agency Issues, paper presented at theInternational Centre for Pension Management Colloquium October 5–6 2004, Universityof Toronto.
Exley, J. (2006), The fair value principle, this volume.Gordon, R.H. and H.R. Varian (1988), “Intergenerational risk-sharing”, Journal of Public
Economics, Vol. 14, pp. 1–29.Hibbert, J., S. Morrison and C. Turnbull (2006), Techniques for market-consistent valuation
of contingent claims, this volume.Kortleve, C.E. (2003), “De meerwaarde van beleidsopties”, Economisch-Statistische
Berichten, 12 December 2003, pp. 588–590 (English translation available).Kortleve, C.E. (2004), “De marktwaarde van beleggingsopties”, VBA Journaal, No. 2,
summer 2004, pp. 32–36.Nijman, T. and R. Koijen (2006), Valuation and risk management of inflation-sensitive
pension rights, this volume.Ponds, E.H.M. (2003a), “Fair pensioen voor jong en oud”, Economisch-Statistische Berichten,
24 January 2003, pp. 28–31.Ponds, E.H.M. (2003b), “Pension funds and value-based generational accounting”, Journal
of Pension Economics and Finance, Vol. 2, No. 3, pp. 295–325.Shiller, R.J. (1999), “Social security and institutions for intergenerational, intragenerational
and international risk sharing”, Carnegie-Rochester Conference Series on Public Policy,Vol. 50, pp. 165–204.