Embed Size (px)
Citation preview
Tilburg University
The service bullwhip effect
Akkermans, Henk; Voss, C.
Published in:International Journal of Operations and Production Management
Document version:Peer reviewed version
DOI:10.1108/ijopm-10-2012-0402
Publication date:2013
Link to publication
Citation for published version (APA):Akkermans, H. A., & Voss, C. (2013). The service bullwhip effect. International Journal of Operations andProduction Management, 33(6), 765-788. DOI: 10.1108/ijopm-10-2012-0402
General rightsCopyright and moral rights for the publications made accessible in the public portal are retained by the authors and/or other copyright ownersand it is a condition of accessing publications that users recognise and abide by the legal requirements associated with these rights.
- Users may download and print one copy of any publication from the public portal for the purpose of private study or research - You may not further distribute the material or use it for any profit-making activity or commercial gain - You may freely distribute the URL identifying the publication in the public portal
Take down policyIf you believe that this document breaches copyright, please contact us providing details, and we will remove access to the work immediatelyand investigate your claim.
Download date: 08. Jun. 2018
1
The service bullwhip effect
Henk Akkermans Chris Voss Tilburg University
Tilburg, The Netherlands [email protected]
London Business School London, United Kingdom
Abstract Purpose This paper sets out to explore whether and how the bullwhip effect, as found in product supply chains, might also manifest itself in services, as well as what policies can be successful for mitigating it. Design/methodology/approach A combination of analytic methods was used—inductive case analysis and analysis of data from two service supply chains in the telecom industry. Findings Empirical evidence from two cases was examined and provides support for the presence of a service bullwhip effect. Quantitative and qualitative case data were used to explore how this effect manifests itself in services, the distinctive drivers of the bullwhip effect in services, and the managerial actions that can either trigger or mitigate these bullwhip effects. Eight propositions are developed. Three types of characteristics that potentially make the bullwhip effect worse in services than in manufacturing are identified: (1) the destabilizing effects of manual rework in otherwise automated service processes, (2) the omission of accurate and timely data on rework volumes upstream in the chain, pointing at future bullwhip effects downstream, and (3) the lack of a supply-chain mindset within the various departments jointly responsible for delivering the service, leading to longer delays in reacting to service bullwhips as they develop over time. Originality/value This paper explores an area that has been well researched in manufacturing, but not in services, and it contributes to both the theory and practice of service supply chains. Research limitations The research is based on two cases within a single industry, limiting generalizability. The propositions developed need testing in a wider set of contexts, including hybrid service and product supply chains. Practical implications

2
The implications of this research can help organizations prevent or reduce the negative impact of planned and unplanned fluctuations in their service supply chains. Keywords: Service supply chain, Bullwhip effects, Service variability Paper type: research paper
Introduction As the importance of service supply chains is becoming recognized, there is a
need to understand whether phenomena identified in product supply chains also exist in services. If they do, then there is a need to understand if they manifest themselves in a similar or different way. One such phenomenon is the bullwhip effect. The existence, and indeed, persistence of the bullwhip effect has been well established in product supply chains (Forrester 1958; Lee, Padmanabhan & Whang 1997; Croson & Donohue 2006; Cachon, Randall & Schmidt 2007). Major demand surges are not uncommon in services; however, these alone are not or may not trigger bullwhip-type effects. In this paper we set out to explore whether the effect also manifests itself in service supply chains, and if so, how. In addition, to what extent are the managerial policies to address it different from those in manufacturing settings?
In 2008, the Dutch cable company Ziggo suffered from unexplained escalation of technical problems and workloads. There was a new, larger, call center, but response lead time and customer complaints amplified over time. The company did not know what was causing this. “The odd thing is: when we solve one malfunctioning, another pops up; how is that possible? You tell us, and we will solve it” (NRC Handelsblad, 2008). Such escalation from seemingly small problems and the lack of understanding by the company regarding the causes and how to avoid or address them is not uncommon. This is not a unique case. Time and time again, organizations have let themselves get into similar situations. As a result, problems that arise from inadequate planning or information get amplified further down the service supply chain. When inadequately addressed, the amplification can lead to a tipping point in the organization’s ability to handle problems, which then leads to subsequent meltdown (Akkermans and Vos, 2003).
Theoretical Background
The bullwhip effect has been known to exist in manufacturing for a number of years, being initially described and explained over half a century ago (Forrester, 1958), and receiving its present label in 1997 (Lee et al., 1997). Nowadays, it is well recognized and there is considerable evidence that product organizations are taking steps to minimize its effects (Cachon et al., 2007). There is considerable knowledge of how it manifests itself, what its root causes are and what managerial policies are available to mitigate its effects.

3
The bullwhip effect in manufacturing In manufacturing, a bullwhip effect occurs when, in a chain of interlinked
process stages, the variation in the demand pattern coming out of a process stage is greater than the variation of the demand that came into that process stage. Moreover, this process of amplification is repeated from process stage to process stage. This can be operationalized as follows: If the ingoing signal is mainly a stationary one with considerable noise, it is the noise that is amplified, and hence, one looks at variation:
Var Demand from process stage n+1 > Var Demand from process stage n. If the ingoing signal is greater, a one-time step increase or pulse, for example, as a result of a sudden surge in demand, then variation is less appropriate and one looks at the maximum degree of amplification between consecutive process stages (Sterman, 2000): Ampl Demand from process stage n+1 > Ampl Demand from process stage n.
There are a number of possible root causes of the bullwhip effect in product supply chains. These complement rather than contradict each other. The first was put forward by Forrester (1961), who found that, in supply chains, it takes managers time to (1) observe that there is a change in demand and (2) react to that change. Therefore, response delays are a fundamental driving factor of the bullwhip effect.
A second set of explanations focuses on bounded rationality (Simon, 1991). Those in charge of production rates in these chains find making correct mental calculations of how much demand already has accumulated, and how many orders have been placed already, difficult. This has been observed in numerous experimental studies of the well-known Beer Game (Croson & Donohue, 2006). People tend to forget part of the orders they placed, or they do not correctly use the information they have.
A third set of explanations, which can be seen as a special case of the second, is industry practices that from a local and short-term perspective seem rational and smart, but from a supply chain-wide and longer term perspective are not. These include Lee et al.’s (1997) classic list of demand signaling, order batching, promotion campaigns and shortage gaming. The service supply chain
The bullwhip effect is seen as taking place in the context of a supply chain. The concept of the product supply chain is very well established; however, that of the service supply chain is still open to debate. Manufacturing supply chains have the common link of managing the physical flow of goods; this obvious common link is lacking among service supply chains (Ellram, Tate and Billington, 2004). A number of authors have sought to frame the service supply chain by adapting established product supply chain models, such as the SCOR model (Baltacioglu, Ada, Kaplan, Yurt and Kaplan, 2007). So for example it has been defined as “the management of information, processes, capacity, service performance and funds from the earliest supplier to the ultimate customer” (Ellram et al., 2004) and “The service supply chain is the network of suppliers, service providers, consumers and other supporting units that performs the functions of transaction of resources required to produce

4
services; transformation of these resources into supporting and core services; and the delivery of these services to customers” (Baltacioglu et al. 2007). More recently scholars from service operations management, as opposed to supply chain management, have begun to address the nature of service supply chains. Sampson (2012) argues that models derived from product supply chains neglect some of the important aspects of services. These aspects include that service supply chains are frequently not linear, as in the traditional product supply chain, but are networks. In addition, services are characterized by customer contact in service processes (Chase, 1978) and by co-creation of value between supplier and customer (Vargo and Lusch, 2010), and this may result in two-way flows between customers and suppliers (Sampson, 2000). In this paper we chose to follow Sampson (2012), who originally saw service supply chains as a dyadic phenomenon, but who now argues that they are, in fact, extended networks. We define service as a producer–consumer interactive process. As the definitions above do not explicitly see service as a process, we build on Ellram et al., (2004) and define a service supply chain as a network of interdependent service processes that span multiple process entities; a process entity being “any entity that participates in a process such as a firm, customers, agents of customers and so forth” (Sampson, 2012).There are a number of important differences between products and services which may influence service supply chains. The most important one is that building inventory to cope with variability in demand is not possible; instead, other strategies are used such as building backlogs, queues and the use of reservations systems (Sasser, 1976). In addition, demand management is frequently used, often in a very sophisticated manner such as yield management in the airline industry (Kimes, 1990). An important distinguishing factor of services is the direct customer involvement in many service processes. As Frei (2006) points out, the fact that they introduce tremendous variability—but complain about any lack of consistency—is an everyday reality. She argues that there are five types: arrival variability, request variability, capability variability, and subjective preference variability. Recognizing and dealing with customer-induced variability becomes an important task in service supply chain management.
Bullwhip behavior in services There is a growing body of literature on bullwhip-type behavior in service
supply chains. Akkermans and Vos (2003) reported amplification effects in a service supply chain. Anderson, Morrice, and Lundeen (2005) examined the dynamic behavior of service supply chains in the presence of varying demand and information sharing: they “characterize the conditions under which a ‘bullwhip effect’ (i.e., an increase in demand and backlog variability as one looks up the supply chain) can occur.” They point out that in service supply chains, as compared to product supply chains, the service firms must adjust their backlogs, as they have no access to finished goods inventories. While Ellram et al. (2004) position the service supply chain in the “service sector,” we argue that service supply chains can occur in both what are considered service sectors, and in other sectors such as manufacturing and health care. Clearly, many supply chains are hybrid, as they manage both backlogs and inventories.
Akkermans and Vos (2003) propose that, in service supply chains, there are both similarities and substantial differences to product supply chains in terms of the nature and causes of amplification (bullwhip) effects. They also state that backlog,
5
rather than inventory build-up, is the key element in service supply chains. They propose that interactions between workload and quality can lead to amplification, and that cascades of upstream errors amplify workload. They see sales campaigns, overload, and errors as triggers of amplification, and they propose that silos — inter-functional barriers — lead to greater amplification.
Using system dynamics modeling, Anderson et al. (2005) examine under what conditions a bullwhip effect will occur in services, that is, under what conditions orders will be amplified rather than attenuated at each stage of the supply chain. They found that high variance of base demand has a high positive effect on every variance, and consistent with extant bullwhip literature, including more demand information in the capacity change decision reduces the variances. More interestingly, they argue that reducing stage 1 service delay reduces the backlog variance but increases the capacity variance, which implies increased hiring, training, and firing, along with their associated costs. As backlog decreases, something else must absorb demand uncertainty, and that something else in service organizations is capacity. There is thus a trade-off between reducing backlog variance and increasing capacity costs.
In this paper, we build on the work of Akkermans and Vos (2003) and Anderson et al., (2005). We explore empirical data from the analysis of two supply chains and associated case data to explore the service bullwhip effect in greater detail. We will first address the following research question:
RQ1: What evidence can be found to support the applicability of the bullwhip effect concept in services? Given that there is evidence, this leads to the need to explore the effect in more
detail. For instance, of Lee at al’s (1997) list of the four major causes of the bullwhip effect, some would seem to be very much associated with products rather than services; for example, services are not normally batched. This raises the question of whether there are some root causes of bullwhip effects that are distinctive to services, and whether there are specific managerial actions in services that can either trigger or mitigate bullwhip effects. Therefore, we put forward the following two further research questions:
RQ2: What distinctive root causes explain bullwhip effects in services? RQ3: What managerial actions can either trigger or mitigate these bullwhip effects?
Research design This paper explores the notion of a bullwhip effect in services through empirical
study using a nested case approach of two cases set in a telecom operator. The company was the largest supplier of telecom services in a European country — it had 5.4 million fixed-line customers, 2.4 million internet customers, and 27 million mobile customers. It also had major services in other European countries and a staff of 43,500 FTE. We chose a case research design as this is appropriate for theory development research (Voss, 2009). When building theory from case studies, case selection using replication logic rather than sampling logic should be used (Eisenhardt, 1989; Yin, 1994). Each case should be selected so that it either:
(a) predicts similar results (a literal replication) or

6
(b) produces contrary results, but for predictable reasons (a theoretical replication).
The nested cases were selected on the basis of literal replication logic; in both, bullwhip-like effects had already been observed. We selected a context similar to Akkermans and Vos (2003) enabling us to replicate and validate their findings in a controlled manner. This research design enhances the quality and depth of insights in emergent areas, but it has limitations in generalizability. The case research was conducted by a lead researcher and two additional researchers. Interviews were conducted with managers and other players in the two cases over a period of time. The data collected and the questions in the field interviews were based on Akkermans & Vos (2003). Twenty semi-structured interviews were conducted with executives from the two service supply chains investigated. Of these, fifteen were recorded and transcribed, the others were documented manually. To address reliability and validity, multiple people involved in the same supply chain decision making were interviewed, and results were fed back to participants (Voss 2009). In addition to the interviews, objective data was collected from company records and databases on sales, orders in various process stages, rework rates and backlogs, call rates and complaint rates over the period of the two potential bullwhip-type effects.
A combination of analytic methods was used. For the case analysis, we followed Eisenhardt (1989) and used an inductive iterative process of examining evidence and revisiting propositions. To explore the interactions, we drew on systems dynamics analysis to explore and understand the causes and outcomes of the phenomena that were observed (see Appendix 1).
Case analysis and findings Identifying the service supply chains
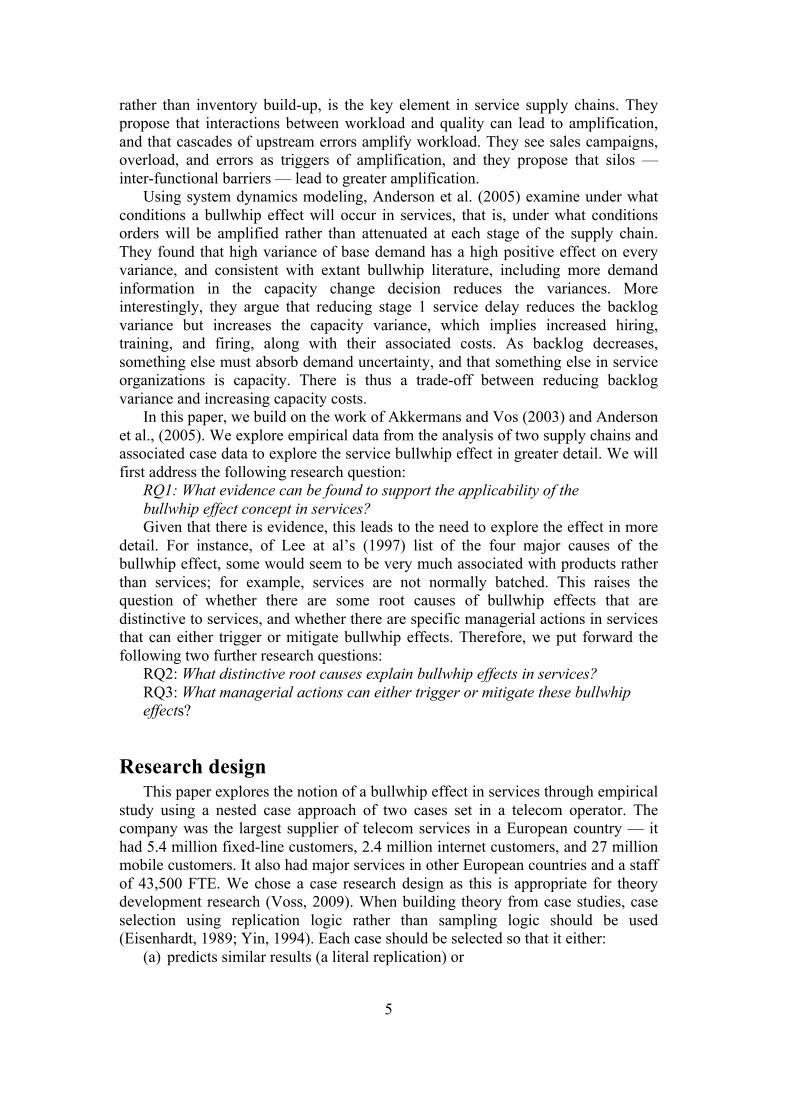
To understand the service bullwhip effect in any context, we need to examine the primary processes in the service supply chain more closely. In both cases, we examined the amplifications along a service supply chain. We viewed the service supply chain as first, the upstream and downstream network of the supply of services to any organization including service, manufacturing and public sector organizations. Second, the service supply chain, especially in a large organization, can include internal as well as external supply activities. We show the high-level structure of both service supply chain, using system dynamics notation. The supply chain for Case A, installation of consumer broadband services, is shown in Figure 1. The service supply chain starts with sales booking a new order, leading to provisioning, technical actions by the provider. The next step is field install, actions that need to be taken at the customer’s home, usually by customers themselves, but if necessary, assisted by a field technician. All these steps are partly outsourced and partly internal. For instance, the provisioning is done by internal staff, but using IT systems that are outsourced and managed by third parties. Some field technicians are permanent staff, but a pool of temporary external staff is also regularly used. In every step of the order flow, customers are co-producing the service, as they provide necessary input and receive feedback. In the field install phase, it is intended that the actual install process is to be conducted by the customers themselves. In Figure 1, the upper flow is what happens when everything goes
7
according to plan. However, if all does not go well, customers will have questions, and eventually, complaints, leading to a secondary flow of work to be dealt with—customer queries and complaints, shown in the lower part of Figure 1.
Figure 1: High-level structure of the service supply chain for case A We show the service supply chain for case B, installation of glass fiber network
services, in Figure 2. It begins with a specification phase of order detailing, before orders are given to outside contractors to conduct the necessary digging and cabling activities. Once the contractors are finished, the company’s field technicians install the network at the customer’s site. Again, the customer is actively co-producing in every step of the process. And again, there exists a secondary order flow of calls to the call center and customer complaints.

8
Figure 2: High-level structure of service supply chain for Case B
Some of the common characteristics of service supply chains are illustrated in
these cases. First, at each process level, the equivalent of a tier in product supply chains, there may be a backlog rather than an inventory buffer. Second, it is common for a supplier to interact directly with a customer, as with the outside contractors in case B, rather than indirectly through the main service supplier. Finally, as in case A, it is common for the customers themselves to perform processes, self-service, rather than a supplier. Indeed, the act of service itself can be seen as co-creation between customer and supplier.
1. Case A. Consumer broadband services In June 2008, the management of consumer broadband services in a European
Telco were taken by surprise by a sudden and dramatic increase in customer calls, particularly as this coincided with a decreased inflow of new sales orders for this same service. Where did these calls come from? With significantly fewer new customers, how could there be so many more calls? It took management quite some time to assess the magnitude of the problems. First, it was thought to be just a temporary blip. One month later, the call overload appeared to be resolved: call volumes were down and the weekly management meeting reported that the service level, defined as the percentage of incoming calls that was picked up by an agent in a timely manner at the call center, had gone up by 4.5% to 49.5%. However, five weeks later, performance had still not improved; indeed the service level by then had dropped to 28.6%. This delayed and underestimated understanding of the size of the problem led to additional staff being hired as late as October, but by then on a massive scale, to deal with these extra customers. However, by the time the new staff became available, call volume had already returned to its pre-peak level. It was

9
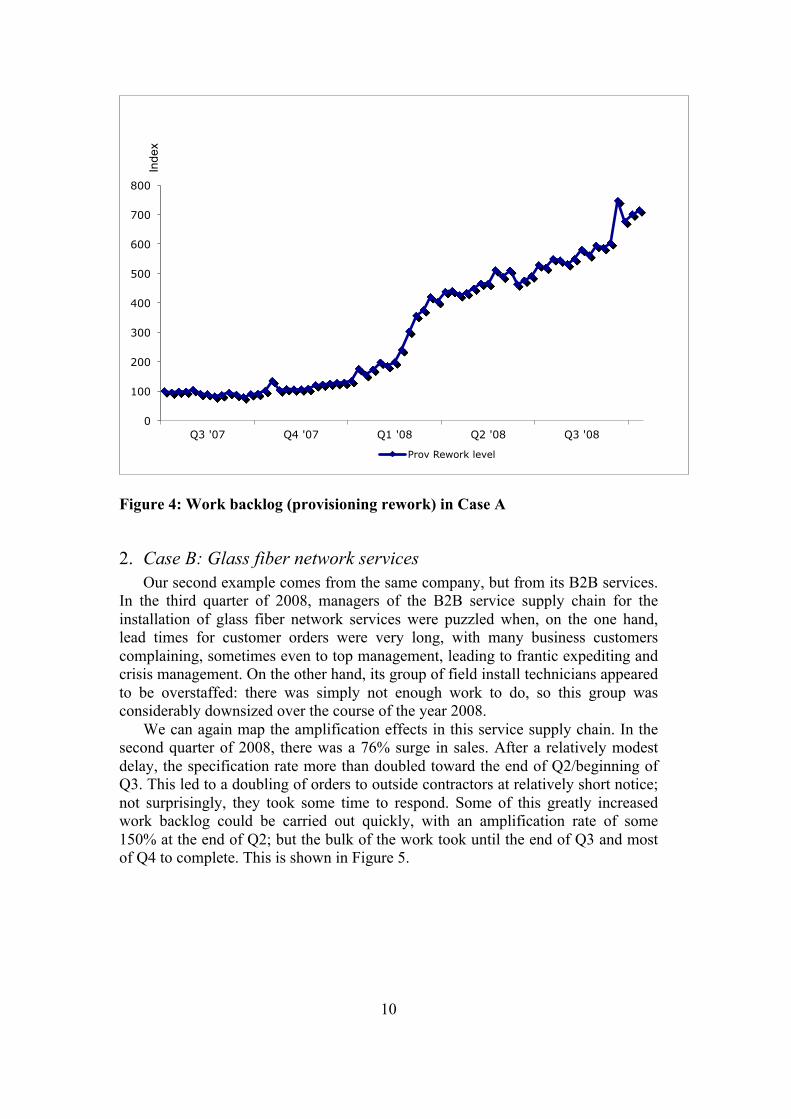
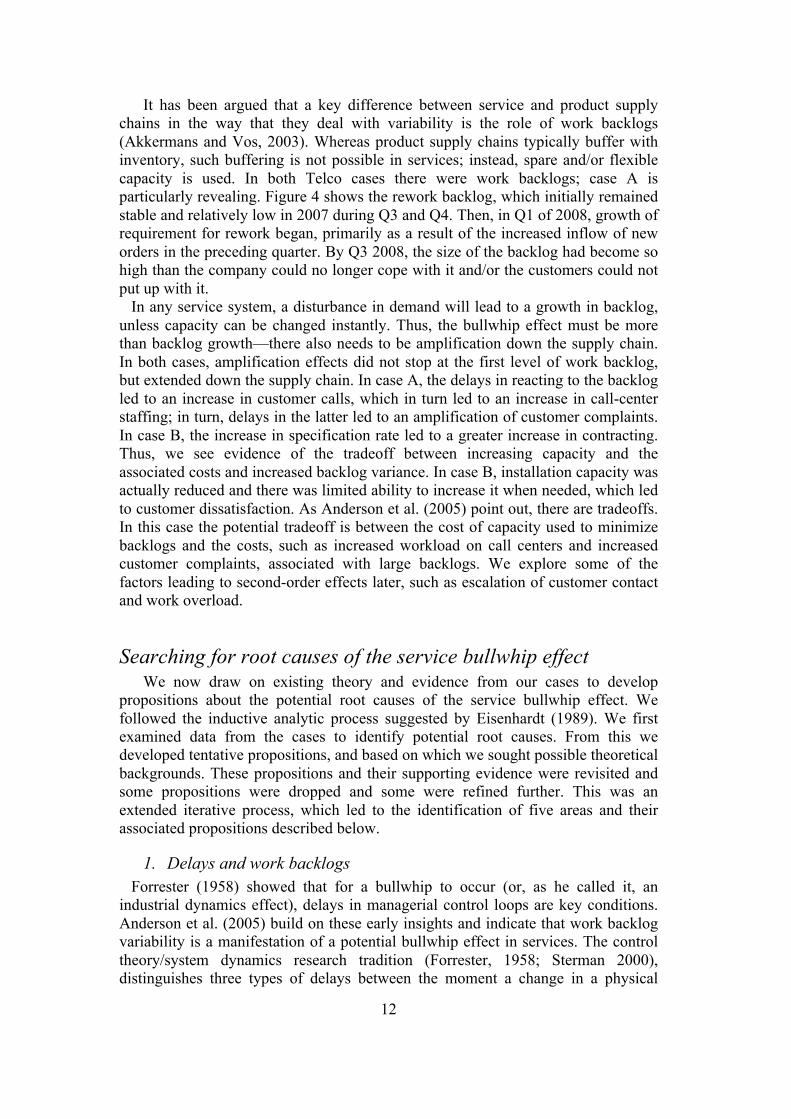
in Q4, when the call volume had long since returned to normal, that customer complaints peaked, possibly as a result of inadequately trained call-center agents. The history of sales, calls and complaints is shown in Figure 3. Following installation, the customer then becomes part of the installed base. This installed base of customers in the company often numbers millions. Provisioning is, in principle, a fully automated process, where up to a dozen different IT systems have to interact. Typically, the bulk of these process steps go well, but a small but significant percentage falls out of the automated process and then becomes part of a pool of “provisioning rework.” The backlog of provisioning rework in Case A is shown in Figure 4.
VRS = Voice Response System Figure 3: Main service supply chain flow rates in case A
This rework has to be done by company staff—by people, not computers. We
will return to this phenomenon later on. The trigger for the sudden increase in calls in this case lay in Q4 2007, when there was an unanticipated 39% increase in sales (see Figure 3); by Q3 2008 this had led to an increase in work backlog of around 700% (see Figure 4).
0
50
100
150
200
250
300
Q3 '07
Q4 '07
Q1 '08
Q2 '08
Q3 '08
Q4'08
Q1'09
Sales rate VRS Calls Complaint rate
Sales +36%
Calls +60%
Complaints +139%
10
Figure 4: Work backlog (provisioning rework) in Case A
2. Case B: Glass fiber network services Our second example comes from the same company, but from its B2B services.
In the third quarter of 2008, managers of the B2B service supply chain for the installation of glass fiber network services were puzzled when, on the one hand, lead times for customer orders were very long, with many business customers complaining, sometimes even to top management, leading to frantic expediting and crisis management. On the other hand, its group of field install technicians appeared to be overstaffed: there was simply not enough work to do, so this group was considerably downsized over the course of the year 2008.
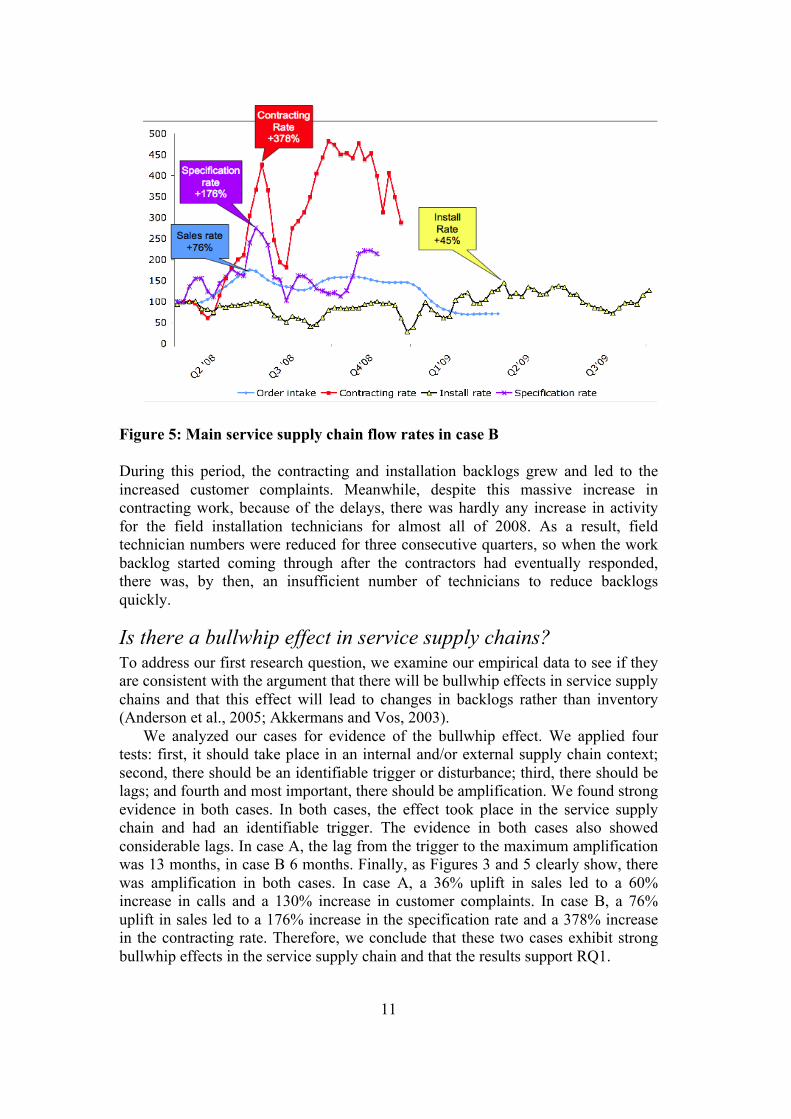
We can again map the amplification effects in this service supply chain. In the second quarter of 2008, there was a 76% surge in sales. After a relatively modest delay, the specification rate more than doubled toward the end of Q2/beginning of Q3. This led to a doubling of orders to outside contractors at relatively short notice; not surprisingly, they took some time to respond. Some of this greatly increased work backlog could be carried out quickly, with an amplification rate of some 150% at the end of Q2; but the bulk of the work took until the end of Q3 and most of Q4 to complete. This is shown in Figure 5.
0
100
200
300
400
500
600
700
800
Q3 '07 Q4 '07 Q1 '08 Q2 '08 Q3 '08
Weeks Prov Rework level
Inde
x
11
Figure 5: Main service supply chain flow rates in case B During this period, the contracting and installation backlogs grew and led to the increased customer complaints. Meanwhile, despite this massive increase in contracting work, because of the delays, there was hardly any increase in activity for the field installation technicians for almost all of 2008. As a result, field technician numbers were reduced for three consecutive quarters, so when the work backlog started coming through after the contractors had eventually responded, there was, by then, an insufficient number of technicians to reduce backlogs quickly.
Is there a bullwhip effect in service supply chains? To address our first research question, we examine our empirical data to see if they are consistent with the argument that there will be bullwhip effects in service supply chains and that this effect will lead to changes in backlogs rather than inventory (Anderson et al., 2005; Akkermans and Vos, 2003).
We analyzed our cases for evidence of the bullwhip effect. We applied four tests: first, it should take place in an internal and/or external supply chain context; second, there should be an identifiable trigger or disturbance; third, there should be lags; and fourth and most important, there should be amplification. We found strong evidence in both cases. In both cases, the effect took place in the service supply chain and had an identifiable trigger. The evidence in both cases also showed considerable lags. In case A, the lag from the trigger to the maximum amplification was 13 months, in case B 6 months. Finally, as Figures 3 and 5 clearly show, there was amplification in both cases. In case A, a 36% uplift in sales led to a 60% increase in calls and a 130% increase in customer complaints. In case B, a 76% uplift in sales led to a 176% increase in the specification rate and a 378% increase in the contracting rate. Therefore, we conclude that these two cases exhibit strong bullwhip effects in the service supply chain and that the results support RQ1.
12
It has been argued that a key difference between service and product supply chains in the way that they deal with variability is the role of work backlogs (Akkermans and Vos, 2003). Whereas product supply chains typically buffer with inventory, such buffering is not possible in services; instead, spare and/or flexible capacity is used. In both Telco cases there were work backlogs; case A is particularly revealing. Figure 4 shows the rework backlog, which initially remained stable and relatively low in 2007 during Q3 and Q4. Then, in Q1 of 2008, growth of requirement for rework began, primarily as a result of the increased inflow of new orders in the preceding quarter. By Q3 2008, the size of the backlog had become so high than the company could no longer cope with it and/or the customers could not put up with it.
In any service system, a disturbance in demand will lead to a growth in backlog, unless capacity can be changed instantly. Thus, the bullwhip effect must be more than backlog growth—there also needs to be amplification down the supply chain. In both cases, amplification effects did not stop at the first level of work backlog, but extended down the supply chain. In case A, the delays in reacting to the backlog led to an increase in customer calls, which in turn led to an increase in call-center staffing; in turn, delays in the latter led to an amplification of customer complaints. In case B, the increase in specification rate led to a greater increase in contracting. Thus, we see evidence of the tradeoff between increasing capacity and the associated costs and increased backlog variance. In case B, installation capacity was actually reduced and there was limited ability to increase it when needed, which led to customer dissatisfaction. As Anderson et al. (2005) point out, there are tradeoffs. In this case the potential tradeoff is between the cost of capacity used to minimize backlogs and the costs, such as increased workload on call centers and increased customer complaints, associated with large backlogs. We explore some of the factors leading to second-order effects later, such as escalation of customer contact and work overload.
Searching for root causes of the service bullwhip effect We now draw on existing theory and evidence from our cases to develop
propositions about the potential root causes of the service bullwhip effect. We followed the inductive analytic process suggested by Eisenhardt (1989). We first examined data from the cases to identify potential root causes. From this we developed tentative propositions, and based on which we sought possible theoretical backgrounds. These propositions and their supporting evidence were revisited and some propositions were dropped and some were refined further. This was an extended iterative process, which led to the identification of five areas and their associated propositions described below.
1. Delays and work backlogs Forrester (1958) showed that for a bullwhip to occur (or, as he called it, an
industrial dynamics effect), delays in managerial control loops are key conditions. Anderson et al. (2005) build on these early insights and indicate that work backlog variability is a manifestation of a potential bullwhip effect in services. The control theory/system dynamics research tradition (Forrester, 1958; Sterman 2000), distinguishes three types of delays between the moment a change in a physical
13
system occurs and the moment in which a corrective action in the physical system has been implemented:
• Information processing failure or delay: how long it takes the company to notice that more capacity is required;
• Decision-making failure or delay: how long it takes the company to decide upon the actions it needs to take; or
• Implementation failure or delay: how long it takes the company to implement its capacity adjustment decisions.
In both cases there was a triggering event that led to the need for more capacity, and in both cases there were delays in recognizing the event and its impact. Case A provides insights into delays and the growth of work backlogs. As the workload increased, the company increased the staffing to cope with the perceived backlog. However, this response did not happen instantly; all three forms of delay were observed. Early signs were ignored in management team meetings:
I think we basically discussed the competition, the enormous success of growth, of course there were some worries, a rise of complaints, more calls at the call center, but not looking at the real problems that was behind that. (Senior manager in customer contact)
The gradual progression of problems led to decision-making delays: In the spring of 2008, orders first went through our internal IT system and then there was already smoke coming out, but we are obviously not spooked when there is a small inventory of complaints lying about somewhere. However, it built and suddenly it had doubled, and so you become alarmed gradually. (Internal senior consultant)
Finally, the lead times and resources required to train staff led to implementation delays:
There is also a training time. Some functions, especially technical ones, are too complicated to learn in a day or so. Moreover, when you hire someone, it will have an effect on other people in that department. Often experienced staff will have to coach the new employee or help him out, and that experienced employee is then not processing orders. (Product manager) We conclude that each of these delays, consistent with Anderson et al. (2005),
in turn contributed to extending the bullwhip effect along the service supply chain. This leads to the following proposition:
P1 Delays in information processing, decision-making, and/or deployment of capacity will lead to amplification of backlogs and workloads.
2. Escalation of frequency of customer contact The customer is a co-producer in services (Vargo and Lusch, 2004) and we
observe that when there is a problem with service production, the customer will seek to get in contact with those upstream in the service supply chain. Typically, this is through telephone calls or emails. In case A, the absolute number of customers with problems was small compared to the massive installed base; this

14
raises the question of why this small number of customers led to a large increase in calls. We propose that the number of customers that will call is only one driver of call volume. A second and crucial driver is call frequency. In case A, the company expected one or two calls per year per customer. Multiplied by the size of the installed base, this would still be a high, but stable number. New customers whose orders were processed normally would be expected to call more frequently than the installed base, but in a relatively small and stable number. However, the customers, whose orders were backlogged, in this case remaining in rework, would often call every day until their issues were resolved. These were customers who could not use their internet, watch TV or use their home phone. It is likely that the longer the delay, the more annoyed they would be, a phenomenon known from the retail marketing literature (Taylor, 1994; Pruyn & Smidts, 1998). So, as the pool of customers with problems grew, the number of additional calls from these customers grew very quickly as well. Thus, in Case A, unresolved issues with a small set of customers led to a major growth in calls and complaints:
One of our big problems is call ratios. (…) The problem is indeed that there are 100,000 calls per week, and that main part of these calls is repeat calls, people who have called before. (Product manager, case A) Another cause of repeat calls was customers calling who could not get through
before. This happened when there were not enough call center agents to deal with the inflow of calls.
I didn’t make my target and so I asked at the call center: do you have enough agents based on my forecast? (..) then it turned out that they were 35 staff short. Yeah, then you get into a loop with repeat calls.(Manager, complaints handling group, Case A) This situation could quickly get out of hand. For instance, in the middle of the
crisis in Case A, one interviewee, a senior supply chain consultant, observed that:
…currently, the number of complaints is almost one to one with the orders, which is not so good, which is horribly wrong and has grown enormously. Customers vary greatly in the degree of contact with the organization and the
impact of these contacts. This is consistent with the observations of Frei (2006) on customer-induced variability. Thus, in a service environment, delays in responding to customer needs or problems that lead to backlogs, in turn can lead to escalation of the frequency of customer contact. Therefore, we put forward the following proposition:
P2. A growth in backlog will lead to amplification of customer-induced contact and the associated workload.
3. Rework cycles and tipping points We observe that bullwhip effects in services are associated with major
fluctuations in workload, and in particular, with unexpected peaks. So for example in case A there was a major, unexpected and sustained increase in workload for call agents in 2008. Suppose that a service deliverer can perform 10 tasks in one day. She can manage this comfortably, perhaps even 12, with harder work. However, as the load increases, the likelihood that she will make some mistakes will also start to

15
increase. When the employee has, say, 14 or 15 tasks on her plate, quality problems increase and she is quite likely to finish only 7 or 8 tasks by the end of the day. This relation between workload and performance was first established in psychology over a century ago and is known as the Yerkes–Dodson Law (Yerkes and Dodson, 1908).
Thus, if staff do not have too many overload days in a row, they would be able to manage both regular workloads and small variations in that workload. With a sustained growth in workload, after a certain delay, we would expect that things would suddenly appear to be going wrong all over the place. The accumulated backlog of work would have become larger than staff could handle. This, in turn, would lead to lower productivity and more errors, which only further increases the backlog, so that staff become swamped with work. This has been called the “rework cycle” (Oliva and Sterman, 2001) and is consistent with “tipping-point behavior” (Gladwell, 2000), the notion of “the straw that breaks the camel’s back.” As something keeps increasing quietly, nothing much seems to happen, until, apparently all of a sudden, after a certain critical “tipping- point” is passed, a drastic change of behavior occurs. In Case A, the manager of the complaints department at the time when the crisis hit his department hardest, described his experiences in tipping-point terms:
In complaints, there was a signal that things moved upwards, but then things started boiling everywhere. First, everybody had the idea: yes, with me things are tough but I will work it out. I am still in control of my own piece. And then, one rafter breaks and the entire building collapses. And now we have another crisis, our desks are again flooding. When it takes a long time for the situation to return to normal, we would expect
employee burnout to occur. More people than normal will call in sick, further decreasing capacity and morale of the remaining workers. Hence, employee turnover will increase, only to make capacity even lower and the situation even worse. This appears to have happened, at least to some extent, in the call center in case A in Q3 2008, as they had had to cope with a flood of calls for three months without any real increase in hiring of new agents:
We think: this is the call ratio, this is the handling time, and so this is the staffing we need to handle these calls. What happens? The turnover in this organization is so great that we have structurally fewer people answering the phone, and then a problem develops. Service levels collapse, customers can no longer call, start to mail after a given time, and file complaints. (Sales & operations planning manager, Case A)
Backlogs may also lead to customer behavior change. Customers who can talk
about their issues with helpful, understanding, and polite agents, who are clearly doing their best to be responsive to their needs, will tend to be patient. Under pressure this changes:
One of our KPIs is service level... you answer the customer within 20 to 30 seconds. When you are short in capacity and your service level is low, and your supervisor tells you: “hey guys, your service level is dropping”, what are you going to do. Well, the quickest way to crank up service levels without quick extra capacity is to make the
16
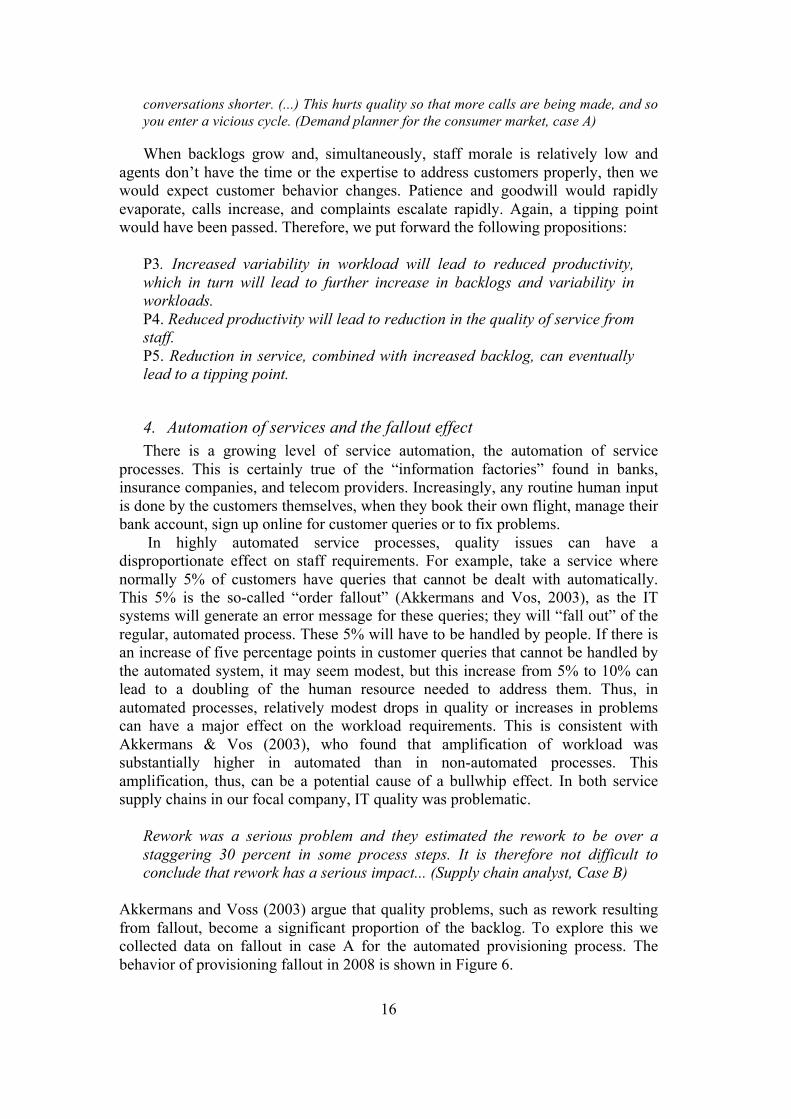
conversations shorter. (...) This hurts quality so that more calls are being made, and so you enter a vicious cycle. (Demand planner for the consumer market, case A) When backlogs grow and, simultaneously, staff morale is relatively low and
agents don’t have the time or the expertise to address customers properly, then we would expect customer behavior changes. Patience and goodwill would rapidly evaporate, calls increase, and complaints escalate rapidly. Again, a tipping point would have been passed. Therefore, we put forward the following propositions:
P3. Increased variability in workload will lead to reduced productivity, which in turn will lead to further increase in backlogs and variability in workloads. P4. Reduced productivity will lead to reduction in the quality of service from staff. P5. Reduction in service, combined with increased backlog, can eventually lead to a tipping point.
4. Automation of services and the fallout effect There is a growing level of service automation, the automation of service
processes. This is certainly true of the “information factories” found in banks, insurance companies, and telecom providers. Increasingly, any routine human input is done by the customers themselves, when they book their own flight, manage their bank account, sign up online for customer queries or to fix problems.
In highly automated service processes, quality issues can have a disproportionate effect on staff requirements. For example, take a service where normally 5% of customers have queries that cannot be dealt with automatically. This 5% is the so-called “order fallout” (Akkermans and Vos, 2003), as the IT systems will generate an error message for these queries; they will “fall out” of the regular, automated process. These 5% will have to be handled by people. If there is an increase of five percentage points in customer queries that cannot be handled by the automated system, it may seem modest, but this increase from 5% to 10% can lead to a doubling of the human resource needed to address them. Thus, in automated processes, relatively modest drops in quality or increases in problems can have a major effect on the workload requirements. This is consistent with Akkermans & Vos (2003), who found that amplification of workload was substantially higher in automated than in non-automated processes. This amplification, thus, can be a potential cause of a bullwhip effect. In both service supply chains in our focal company, IT quality was problematic.
Rework was a serious problem and they estimated the rework to be over a staggering 30 percent in some process steps. It is therefore not difficult to conclude that rework has a serious impact... (Supply chain analyst, Case B)
Akkermans and Voss (2003) argue that quality problems, such as rework resulting from fallout, become a significant proportion of the backlog. To explore this we collected data on fallout in case A for the automated provisioning process. The behavior of provisioning fallout in 2008 is shown in Figure 6.

17
Figure 6: Order fallout from an automated process step in case A
A 36% increase in sales rate late in 2007 was followed, one quarter later, by a 221% increase in provisioning fallout. Thus, an input into the automated process of provisioning from a limited increase in sales had led to a disproportionate increase in fallout, and we argue that it was from this pool of customer orders in rework that the increase in customer calls was generated. The fallout effect that occurs in non-foolproof IT thus results in amplification of the upstream demand for service. Therefore, we put forward the following proposition:
P6. Automation of services will increase the variability of service demand to be addressed by people.
5. Lack of management data and understanding A bullwhip-type effect does not necessarily follow a triggering event such as a
sales surge or a technical problem. Appropriate capacity planning, fast communication, and response to the unexpected can prevent this. The two cases raise the question as to how management could have allowed the amplification and delays to occur, and at the same time find it so difficult to identify the root cause of the problem. We examined the data available to management and its use. The underlying data in this paper was available in the company at the time of the events. We observed two areas that potentially contributed to the failure to respond effectively. First, as argued earlier, managers failed to note the increase in service backlogs, as this data was available, but not visible enough to management.
Every day they send you a picture [of the supply chain status]. However, to keep
track of your backlog, of your productivity, a picture is of little use because if I see at time X that there are 4,000 complaints and I come back two months later and I see the same, what does that tell me? Has the inflow been very high or the outflow? And that backlog, is that good or bad? So I have begun to calculate that on a daily
0
50
100
150
200
250
300
350
Q3 '07
Q4 '07
Q1 '08
Q2 '08
Q3 '08
Q4'08
Q1'09
Sales rate VRS Calls Complaint rate Prov Fallout
Sales +36%
Calls +60%
Complaints +139%
Provisioning Fallout +221%

18
basis and everyone else won’t. And then you get a huge amount of resistance… (Demand Planner, Case A)
It was not self-evident from the data they looked at, as in Figure 7, that work
backlogs and customers with issues were heading out of control. The evidence from case B is similar. As noted earlier, the installation capacity had been cut during 2008 because not all of the expected work came through in Q1 2008. However, there was a backlog in contracting building up. When this work eventually came through there was insufficient capacity to install rapidly. As with case A, data on these backlogs were not prominently on the managerial agenda for this supply chain, and the “official” numbers suggested a considerably more modest size of this backlog.
Figure 7: Provisioning rework arrival rate (“inflow”) and completion rate
(“outflow”) in Case A Data such as order fallout and subsequent workload were available on a routine
basis and had provided warnings of problems. However, these were not seen as important by management. The weekly management reports focused on order intake and completion versus management targets, and not on the small numbers of backlogged orders compared to the considerable volume of “regular” orders that did go well. As a result, in both cases, no data were available at the managerial level that would have revealed the number of customers in the pool of provisioning rework. In addition, the number of calls made by this particular group of customers was not logged at the call center. This supports the argument of Cronin, Gonzalez and Sterman (2009), who argue that there is a tendency for managers to look at flow rates and not accumulation such as backlogs, known as the stock/flow failure.
At one moment in time, over ten extensive breakdowns were produced for a weekly production meeting. It primarily concerned breakdowns of work in progress inventories (also referred to as backlogs) with the key answer for management being: what types of orders are there in these backlogs? However, the data analysts observed that a lot of these reports were not systematically
0
50
100
150
200
250
300
350
400
Q3'07
Q4'07
Q1'08
Q2'08
Q3'08
Weeks
Orders/week
Prov Inflow Prov Outflow
19
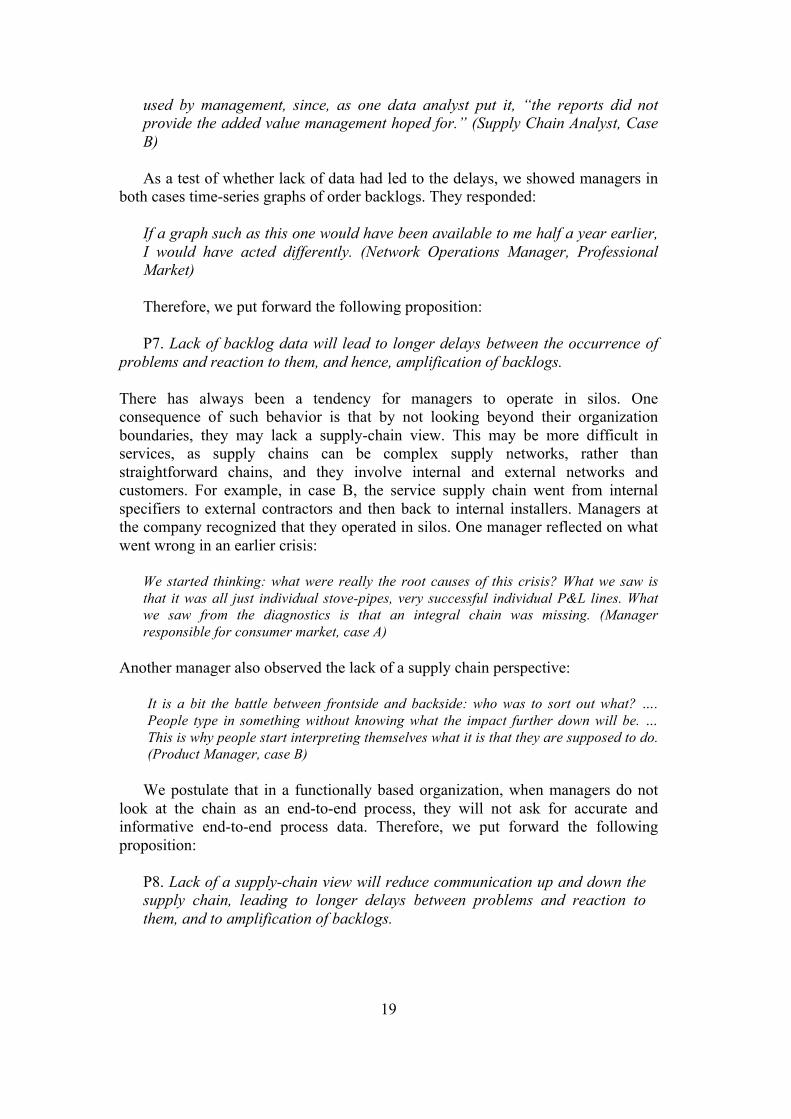
used by management, since, as one data analyst put it, “the reports did not provide the added value management hoped for.” (Supply Chain Analyst, Case B) As a test of whether lack of data had led to the delays, we showed managers in
both cases time-series graphs of order backlogs. They responded: If a graph such as this one would have been available to me half a year earlier, I would have acted differently. (Network Operations Manager, Professional Market) Therefore, we put forward the following proposition: P7. Lack of backlog data will lead to longer delays between the occurrence of
problems and reaction to them, and hence, amplification of backlogs.
There has always been a tendency for managers to operate in silos. One consequence of such behavior is that by not looking beyond their organization boundaries, they may lack a supply-chain view. This may be more difficult in services, as supply chains can be complex supply networks, rather than straightforward chains, and they involve internal and external networks and customers. For example, in case B, the service supply chain went from internal specifiers to external contractors and then back to internal installers. Managers at the company recognized that they operated in silos. One manager reflected on what went wrong in an earlier crisis:
We started thinking: what were really the root causes of this crisis? What we saw is that it was all just individual stove-pipes, very successful individual P&L lines. What we saw from the diagnostics is that an integral chain was missing. (Manager responsible for consumer market, case A)
Another manager also observed the lack of a supply chain perspective:
It is a bit the battle between frontside and backside: who was to sort out what? …. People type in something without knowing what the impact further down will be. … This is why people start interpreting themselves what it is that they are supposed to do. (Product Manager, case B)
We postulate that in a functionally based organization, when managers do not
look at the chain as an end-to-end process, they will not ask for accurate and informative end-to-end process data. Therefore, we put forward the following proposition:
P8. Lack of a supply-chain view will reduce communication up and down the supply chain, leading to longer delays between problems and reaction to them, and to amplification of backlogs.

20
Discussion
This research contributes to the nascent literature on service supply chains in multiple ways. We can compare our observations with those of product supply chains. Lee et al. (1997) proposed four causes of the bullwhip effect in product supply chains: shortage gaming, demand signaling, order batching and price variations. Shortage gaming may result in overbooking of services by customers, or overbooking of available capacity by suppliers, thus increasing variability of demand. Both occur in the airline industry as well as elsewhere. Although we did not observe it directly, it is possible that the customer behavior observed was, in fact, a sign of shortage gaming. For example, if the customers do not feel that their work is in an orderly queue, they might start gaming—i.e., by bombarding the service provider they think that they might get faster service. Interestingly, we did not observe evidence of the other two in our cases, though this may be due to the narrow sample. Order batching would seem to be associated with inventories of products, and we have studied two pure service supply chains. Although we did not observe the other two categories, we postulate that these may cause bullwhip effects in services. We did not observe price fluctuation as a cause of bullwhip effects; however it is interesting to note that in capacity-constrained services such as airlines and hotels, price fluctuation as embodied in yield management is widely used to smooth demand, as well as to optimize revenue and address shortage gaming (Kimes 1990). Thus, managed price fluctuation, rather than a cause, may be a tool to prevent bullwhip effects in services, through the application of yield management. Finally, demand signaling was not observed as a direct cause of bullwhip effects, but communication failures and delays were.
Service supply chains are complex and their dynamics are not at all straightforward to deduce because of the superposition of multiple, interrelated dynamic effects (Akkermans and Vos, 2003; Anderson et al., 2005). Questions such as what will be the net result of an effect in one part of the service supply chain on the rest cannot be deduced through intuition or back-of-the-envelope calculations. Formal modeling of the entire service supply chain can contribute to addressing this. Forrester’s (1958) models of delays in feedback control loops in multi-stage systems can be a valuable managerial tool in understanding service supply chains.
Given that “to a large extent, the service operations field has long been considered to occupy a niche within operations management” (Smith, Kirwan and Markland, 2007), there have been a number of calls for increased research in this area (Menor, Tatikonda and Sampson, 2002; Roth and Menor, 2003; Ostrom, Bitner, Brown, Burkhard, Goul, Smith-Daniels, Demirkan and Rabinovich, 2010). We see a number of contributions from this research to the field of service operations management. The first is confirmatory, in that we find evidence of both the existence of bullwhip effects in practice, as predicted by Anderson et al. (2005), and that the key management variable is the backlog, or more precisely, workload rather than inventory or move rates. In the context of service supply chains, there has been some debate as to how traditional models, in particular the SCOR model, apply to services. Ellram, Tate and Billington (2004) point out that “there are a host of processes that take place in the supply chain, and they must be effectively coordinated across organizations and functions in order to best meet the uncertain demands of the customer” (p. 23). Our research supports this and, in particular,

21
argues that there should be visibility for both customers and suppliers along the whole service supply chain.
There are conflicting views among researchers on the relationship between productivity and service. On the one hand Grönroos and Ojasalob (2004) see a dilemma in that improved internal efficiency through the introduction of more productive processes does not necessarily lead to better economic results. On the other hand, Frei (2006) argues that this tradeoff need not necessarily be there. Our research contributes to this debate; the growing use of back-office automation was identified as one of the potential causes of bullwhips, and hence, poor service. Our observations are consistent with Grönroos (1984), who argues that the consumer is not just interested in the technical quality, but also in the perceptions of the quality that he has received—the functional quality. Increasing productivity may have maintained technical quality but reduced functional quality. However, consistent with Frei (2006), we also argue that steps can and should be taken to prevent, or at least minimize, these problems.
Zomerdijk and De Vries (2007) propose three sets of decisions in structuring front and back office work in services: customer contact, decoupling and grouping decisions. Our research indicates that where bullwhip effects are likely, appropriate decisions are required in all three. First, the need for information transparency to customers may not require direct customer contact, but may require access to online information and possible proactive information when issues occur. Second, decoupling decisions are crucial, as coupled processes are more likely to provide the flexibility and responsiveness required for dealing with unforeseen triggers of potential bullwhip effects. Finally, functional grouping risks limiting the supply chain mindset that we see as important for managing bullwhip effects.
The role of IT in service operations has gained increasing attention, particularly regarding the role of the web. Authors such as Voss (2003) have focused on the external or virtual aspects of the growth of IT; however, our research indicates that the internal impact is just as important, especially when there are very large databases and highly automated process that can lead to fallout effects. Finally, our research suggests the development of a more endogenous perspective in understanding fluctuations, for instance, in call center demand. Rather than looking at a short-term extrapolation of recent customer calls, where these calls are seen as exogenous, an endogenous perspective, where the reasons for these calls are seen as located in upstream supply chain processes, may yield more explanatory and even predictive power.
22
Conclusions We posed three research questions. The first was what evidence can be found to
support the applicability of the bullwhip effect concept in services? The bullwhip effect in products, as conceptualized by Lee et al. (1997), is an effect that manifests itself across multiple tiers in a supply chain and has implications for physical resources. We postulated that in service supply chains it would manifest itself across multiple processes in a service network. We put forward criteria for determining whether the fluctuations along the service supply chain observed in our two cases was a bullwhip-type effect. In both we concluded that it was, thus supporting our proposition. In these two service supply chains we observed that, consistent with Akkermans and Vos (2003) and Anderson et al. (2005), role of work backlogs in services was central, as opposed to inventory build-up in product supply chains. However, we should be careful not to argue that all major fluctuations are bullwhip effects. There are frequently major surges in demand in services, for instance through what is known as the slash-dot effect (Baryshnikov, Coffman, Rubenstein and Yimwadsana, 2002). However, these will not necessarily lead to bullwhip-type effects. A variation in demand for a service leading to variation in backlog or queues does not, by itself, constitute a bullwhip effect. Building a backlog is one of the standard capacity management strategies for service operations to deal with variation (Sasser, 1976). The bullwhip effect in services is a supply chain phenomenon. It can be characterized first by delays and amplification of backlogs, as proposed by Anderson et al. (2005), which in turn leads to amplification of workloads along the service supply chain. In the two cases studied, these also led to amplification of customer feedback and complaints. However, this may not necessarily be true in all cases.
Our second research question was to seek evidence of the distinctive root causes of the bullwhip effect in services. It would seem that several of these are related to the distinct characteristic of service. First, as has already been pointed out, services cannot cope with variability in demand by building inventories, and instead, have to do this with backlogs and varying capacity. There is a tradeoff between amplification of backlogs and varying workload. Larger backlogs will lead to reduced variability of workloads and hence, lower costs. However, this will lead to amplification of customer calls, customer complaints, and in the long run, a loss of business. On the other hand, reducing backlogs may require much greater variability of workloads. This, in turn, will lead not only to higher costs, but also to pressure on the workforce, which in turn can lead to poorer customer service and lower productivity, and increase the backlog and the problems associated with this. A second distinct characteristic of service is the customer involvement in the service process (Bendapudi & Leone, 2003). Thus, customers are both part of the service supply chain and they bring variability into the service process (Frei, 2006). In the two cases studied, customers played an important role in amplifying the effects of delays.
There are two further characteristics, though not found in all service supply chains, that we argue play a role in the bullwhips in the two cases. The first is that where the service provision is highly automated, as is increasingly the case, problems that cannot be addressed automatically “fall out” and have to be addressed by people. This can potentially lead to big surges in the workload needed and to high variability in the demand for services. In extreme cases, we feel that this can

23
lead to “tipping points,” where the load on services becomes excessive and the demands from customers swamp the organization’s call centers, and may eventually lead to “meltdown.” The other characteristic is the labor intensity of many service processes. Whereas in the past, labor-intensive processes were found widely in manufacturing and service, today the main labor-intensive processes are in service contexts such as call centers, retailing and professional services. Therefore, we argue that understanding the impact of variability in demand on labor-intensive processes is important in understanding potential bullwhip effects.
The final research question was to identify managerial actions that can either trigger or mitigate these bullwhip effects. The conditions potentially leading to bullwhip effects occur frequently and, as in our cases, bullwhip effects catch management by surprise, and they find it difficult to identify the causes. This indicates that there are management causes that also impact the occurrence of bullwhip effects. First, we propose that lack of appropriate information on backlogs and/or management failure to use it is a cause of bullwhip effects. Better information on management of backlogs and its use may be able to prevent, or at least mitigate, many of these problems. Unlike product supply chains whose focus is on physical inventories, the focus in services has to be on monitoring order backlogs, and in particular, on rework backlogs. Second, we propose that the lack of a supply-chain view is a potential cause of bullwhip effects in service. There is evidence that in product supply chains, increasing attention to a supply chain view is leading to the reduction of bullwhip effects (Cachon et al., 2007); thus, a supply chain view in services may also lead to a reduction in bullwhip effects. Based on our findings and on existing theory, we have developed a number of propositions which are summarized in Table 1.
P1. Delays in information availability or process, decision-making, and/or deployment of capacity will lead to amplification of backlogs and workloads. P2. A growth in backlog will lead to amplification of customer calls and the associated workload. P3. Increased variability in workload will lead to reduced productivity, which in turn will lead to a further increase in backlogs and variability in workloads. P4. The reduced productivity will lead to reduction in the quality of service from staff. P5. The reduction in service, combined with increased backlog, may eventually lead to a tipping point. P6. Automation of services will increase the variability of service demand to be addressed by people. P7. Lack of backlog data will lead to longer delays between problems occurring and reaction to them, and hence, amplification of backlogs. P8. Lack of a supply-chain view will reduce communication up and down the supply chain, leading to longer delays between problems and to them and amplification of backlogs. Table 1 Propositions on amplification and bullwhip effects in service supply chains

24
In conclusion, based on our analysis of two cases, we conclude that there is evidence to confirm the existence of bullwhip effects in services. We also have identified a number of characteristics that can make these bullwhip effects worse in service than in product supply chains. In particular, automation of services can lead to major amplifications if problems require manual intervention to solve them; and the existence of massive, easily contactable installed bases potentially has the same effect, sometimes called the installed base effect (Herbig, Howard and Kramer, 1995). As with product supply chains, managerial and customer behavior have been seen to be a major contribution to bullwhip effects. We also propose that, in a service setting, this leads to the phenomenon of tipping points. Finally, as with product supply chains, lack of visibility across the service supply chain can be a major cause of failure to prevent bullwhip effects occurring. However, in services, we propose that the key metric to observe is the work backlog in every stage of the service supply chain, for both regular (often automated) work and for (manual) rework.
Implications for management Bullwhip effects in service can be a source of both customer dissatisfaction and
higher costs, and it is important for managers to recognize the potential for their occurrence and to take steps both to prevent and to mitigate them. They are triggered by variability, an aspect of operations that must be managed. Strategies for managing variability in services are well established. Variability in demand and workload arises from many sources including customer demand, service updates, and technical problems. In services, co-production with customers also leads to customer-induced variability (Frei, 2006). These can be either known or unplanned. A simple framework for capacity strategies is shown in Figure 8.
Known variability Unplanned variability Reducing capacity required
Demand smoothing Demand forecasting
Data speed and quality
Increasing Capacity available
Capacity buffering
Agility
Figure 8: Capacity strategies to prevent and mitigate the Service Bullwhip Effect
Such strategies are part of the standard operations toolkit (Sasser, 1976), which
involves both demand and capacity management. Demand management can be seen as strategies to prevent bullwhip effects, and capacity management as strategies to mitigate them if they occur. Prevention strategies often need to be context-specific, for example, in context of high fixed capacity, such as hotel rooms or airline seats. Yield management tools can be used. In retailing, some have begun to use pop-up stores during peak demand in order to improve sales and add shelf space. Our research highlights some additional implications that management must be aware of if they are to prevent bullwhip effects.
25
There are two less recognized causes of variability that managers must understand and take into account. First, service demands that come from an existing customer or installed base. Factors such as a sales promotion, a software upgrade or a fault in the service delivery process could trigger rapid expected or unexpected spikes in demand. In software-based services, the slash-dot effect is one manifestation. Second, as services become more automated, the possibility of the fallout effect increases. Managers must be aware of implications of large installed bases and fallout from automated services. Both demand and capacity management possibilities must recognize this. For example, it may be sensible to avoid doing anything that will affect the whole installed base at one time. Thus, it is important to be prepared for the unexpected surge in service demand. This requires agility in the ability to bring in capacity rapidly through many means, including having standby operatives, access to server farms in IT, using pop-up stores, reducing capacity available to other services, etc. In addition, one response may be to limit order intake or customer access through, for example, choking the entry point or restricting entry or processing of less critical customer service requirements.
Managing the tradeoff between the costs of having or making capacity available versus the costs of allowing backlogs to develop is part of these strategies. Because of the bullwhip effect, the costs of backlogs may be much higher than anticipated. They will not just be the cost of immediate lost customers, but also from the additional impact along the supply chain from rapid growth in customer contact and loss of productivity if too much pressure is put on service employees to reduce the backlog. Getting this tradeoff wrong can be a major trigger of the service bullwhip effect, a major peak, which if not prepared for, will lead to severe bullwhip effects. Such strategies are often applied just at the first level of the supply chain—customer contact. We argue that it is important for management to recognize that these need to be applied to the whole service supply chain and to recognize the knock-on effects along the supply chain.
Even with good prevention strategies, bullwhip effects may occur, and companies must have strategies in place to mitigate them. Central to the management of variability in services is the management of backlogs, and we have argued that a potential cause of bullwhip effects is the failure to recognize and act in a timely manner when backlogs occur. Thus, a key mitigation strategy is ensuring the visibility of backlogs, not just with the customer at the point of service delivery, but at each process step in the supply chain. Together with this, management will need visibility of available capacity across the whole service supply chain, and of demand and actions, such as systems upgrades, that may trigger further demand for response. Visibility for customers is also an important mitigating strategy to prevent bullwhip effects from getting worse through shortage gaming behavior by customers.
The final area to address in mitigating bullwhip effects is reducing time lags or delays. All potential bullwhip effects will have some triggering event, but this may only lead to a bullwhip effect if it is not recognized or it is recognized but managerial action is delayed. Delays are a central cause of amplification effects. If capacity can be adjusted rapidly at each stage of the supply chain when an increase in required capacity occurs, there will be little or no amplification, and hence, no bullwhip. On the other hand, a delay in the adjustment of capacity (the adjustment delay) will increase amplification.
26
Need for further research and limitations The study of bullwhip effects in both services and service supply chains is at an
early stage. There is a need for further research in all the areas identified in this paper. First, there is considerable scope to examine each of the above propositions and to develop them through modeling and similar analytical means. Second, there is a need for further empirical work to both test these propositions and to further our understanding. For example, the propositions on fallout in highly automated systems can be examined through comparison of high and low installed-base contexts and high and low automation services. Third, there is a need for research into communication in service supply chains and, in particular, the value of information on backlogs.
A major limitation of this paper is that the two cases are drawn from a single business context. This limits generalizability, but it allows us to put forward propositions that can be tested in broader contexts. This, in turn, would allow further understanding as to what may be generic conclusions about amplification and bullwhips in service supply chains and networks, and what might be context-specific. Service and services take place in a wide variety of contexts. In particular, much of what happens in product-based companies is service, and many supply chains can be considered as hybrid product- and service-supply chains. Research is needed to examine the bullwhip effect in different contexts and, in particular, in manufacturing-based service and hybrid supply chains.
References Akkermans, H.A. and Vos, B. (2003), “Amplification in service supply chains:
An exploratory case study from the telecom industry”, Production and Operations Management, Vol. 12 No. 2, pp. 204-223.
Anderson, E.G., Morrice, D.J., and Lundeen, G., (2005). “The physics of capacity and backlog management in service and custom manufacturing supply chains”, System Dynamics Review, Vol. 21 No. 3, pp. 217-247.
Baltacioglu T., Ada E., Kaplan M., Yurt O., Kaplan C., (2007), a new framework for service supply chains, Services industry journal, Vol. 27 No. 2, pp.105-124
Baryshnikov Y., Coffman E., Rubenstein D. and Yimwadsana B. (2002), Traffic Prediction on the Internet, Technical Report EE200514-1, Computer Networking Research Center, Columbia University.
Bendapudi, N., Leone, R.P. (2003), “Psychological implications of customer participation in co-production”, Journal of Marketing, Vol. 67, January, pp.14-28.
Cachon, G. P., Randall, I.T. and Schmidt, G.M. (2007), “In search of the bullwhip effect”, Manufacturing & Service Operations Management, Vol. 9, No. 4, pp. 457-479.
Chase, Richard B. (1978), “Where does the customer fit in a service operation?” Harvard Business Review, Vol. 56 No. 6, pp. 137-142.
Chase, R.B., and Stewart, D.M. (1994), “Make your service fail-safe”, Sloan Management Review, Vol. 35 No. 3, pp. 35-44.
Cronin M.A., Gonzalez C. and Sterman J.D. (2009), “Why don't well-educated adults understand accumulation? A Challenge to Researchers, Educators, and Citizens” Organizational Behavior and Human Decision Processes, Vol. 108 No. 1, pp. 116-130.

27
Croson, R.& Donohue, K. (2006), “Behavioral causes of the bullwhip effect and the observed value of inventory information”, Management Science, Vol. 52 No. 3, pp. 323-336.
Eisenhardt K.M. (1989), “Building theory from case study research”, Academy of Management Review, Vol. 14 No. 4, pp. 532-550.
Ellram L., Tate W., Billington C. (2004), “Understanding and managing the services supply chain”, Journal of Supply Chain Management, Vol. 40, No. 4, pp. 17-32.
Forrester, J.W. (1958), “Industrial dynamics--A major breakthrough for decision makers”, Harvard Business Review, Vol. 36 No. 4, pp. 37-66.
Forrester, J.W. (1961), Industrial Dynamics, Cambridge Ma., MIT Press Frei F.X. (2006), “Breaking the trade-off between efficiency and service”,
Harvard Business Review, November, pp. 90-101 Gladwell, M. (2000), “The tipping point. How little things can make a big
difference”, London, Abacus. Grönroos C. (1984), “A service quality model and its marketing implications”,
European Journal of Marketing, Vol. 18 No. 4, pp. 36-45. Grönroos C. and Ojasalob K. (2004), “Service productivity Towards a
conceptualization of the transformation of inputs into economic results in services”, Journal of Business Research, vol. 57, pp. 414– 423.
Herbig, P.A., Howard, C.A., and Kramer, H.E. (1995), “The installed base effect: Implications for the management of innovation”, Journal of Marketing Management, Vol. 11, pp. 387-401.
Kimes, S.E. (1990), "Yield management: a tool for capacity-constrained service firms”, Journal of Operations Management, Vol. 8 No. 4, pp. 348-363.
Lee, H. L., V., Padmanabhan, V., and Whang, S. (1997), “The bullwhip effect in supply chains”, Sloan Management Review, Vol. 38 No. 3, pp. 93–102.
Menor, L. J., Tatikonda, M. V. & Sampson, S. E. (2002), “New service development: areas for exploitation and exploration”, Journal of Operations Management, Vol. 20, pp. 135-157.
NRC Handelsblad (2008), “Klachtenregen bij Ziggo ("A torrent of complaints at Ziggo", in Dutch)”, NRC Handelsblad, June 17.
Oliva, R. and Sterman, J.D. (2001), “Cutting corners and working overtime: Quality erosion in the service industry”, Management Science, Vol. 47 No. 7, pp. 894–914.
Ostrom A.L., Bitner M.J., Brown, S.W., Burkhard K.A., Goul M., Smith-Daniels V., Demirkan H. and Rabinovich E. (2010), “Moving forward and making a difference: research priorities for the science of service”, Journal of Service Research, 13(1) 4-36
Pruyn, A., Smidts, A. (1998), “Effects of waiting on the satisfaction with the service: beyond objective time measures”, International Journal of Research in Marketing, Vol.15, pp.321 – 334.
Roth, A. V. & Menor, L. J. (2003), “Insights into service operations management: a research agenda”, Production & Operations Management, Vol. 12, pp. 145-164.
Sampson S.E. (2000), “Customer-supplier duality and bidirectional supply chains in service organizations, International Journal of Service Industry Management, Vol.11 No. 4, pp. 348-364.

28
Sampson, S.E. (2012), “Visualizing service operations”, Journal of Service Research, Vol. 15 No. 2, pp. 182-198.
Sasser W.E. (1976), “Match supply and demand in the service industries”, Harvard Business Review, Vol. 54 No. 6, pp. 133-140.
Simon, H. A. 1991. “Bounded rationality and organizational learning”, Organization Science, Vol. 2, pp. 125–134.
Smith J., Kirk R. Karwan K., and Markland R. (2007), “A note on the growth of research in service operations management”, Production and Operations Management, Vol. 16 No. 6, pp. 780–790.
Sterman, J.S. (2000), Business dynamics. Systems Thinking and Modeling for a Complex World, McGraw-Hill, Boston.
Taylor, S. (1994), “Waiting for service: the relationship between delays and evaluation of service quality”, Journal of Marketing, Vol. 58 No. 2, pp.56-69.
Vargo S.L. and Lusch R.F. (2004), “Evolving towards a new dominant logic for marketing”, Journal of Marketing, Vol. 68, pp. 1-17.
Voss, C.A., (2003), "Rethinking paradigms of service - service in a virtual environment," International Journal of Operations & Production Management, Vol. 23 No. 1, pp. 88-104.
Voss C.A., (2009), “Case research”, in Karlsson C, Researching Operations Management, London, Routledge.
Yin R. (1994), “Case Study Research” Beverly Hills, CA, Sage Publications. Yerkes, R.M. and Dodson, J.D. (1908), “The relations of strength of stimulus to
rapidity of habit formation, Journal of Comparative Neurological Psychology, Vol. 18, pp. 459-482 .
Zomerdijk, L. and de Vries G. (2007), “Structuring front office and back office work in service delivery systems”, International Journal of Operations & Production Management, Vol. 27 No. 10, pp. 108-131.

29
Appendix 1 System Dynamics This is an approach to understanding and modeling the behavior of complex systems over time. It models internal feedback loops and time delays that affect the behavior of the entire system. In the System Dynamics methodology, a system is represented in a map of a system with all its constituent components and their interactions (a causal loop diagram). Causal loop diagrams aid in visualizing a system’s structure and behavior, and in analyzing the system qualitatively. To perform a more detailed quantitative analysis, a causal loop diagram is transformed to a stock and flow diagram. A stock is the term for any entity that accumulates or depletes over time; in this paper, for example, it is the backlog. A flow is the rate of change in a stock, such as incoming service orders.