Embed Size (px)
Citation preview
Disclosures & Disclaimer
This report must be read with the disclosures and the analyst certifications in
the Disclosure appendix, and with the Disclaimer, which forms part of it.
Issuer of report: The Hongkong and Shanghai Banking Corporation Limited
View HSBC Global Research at:
https://www.research.hsbc.com
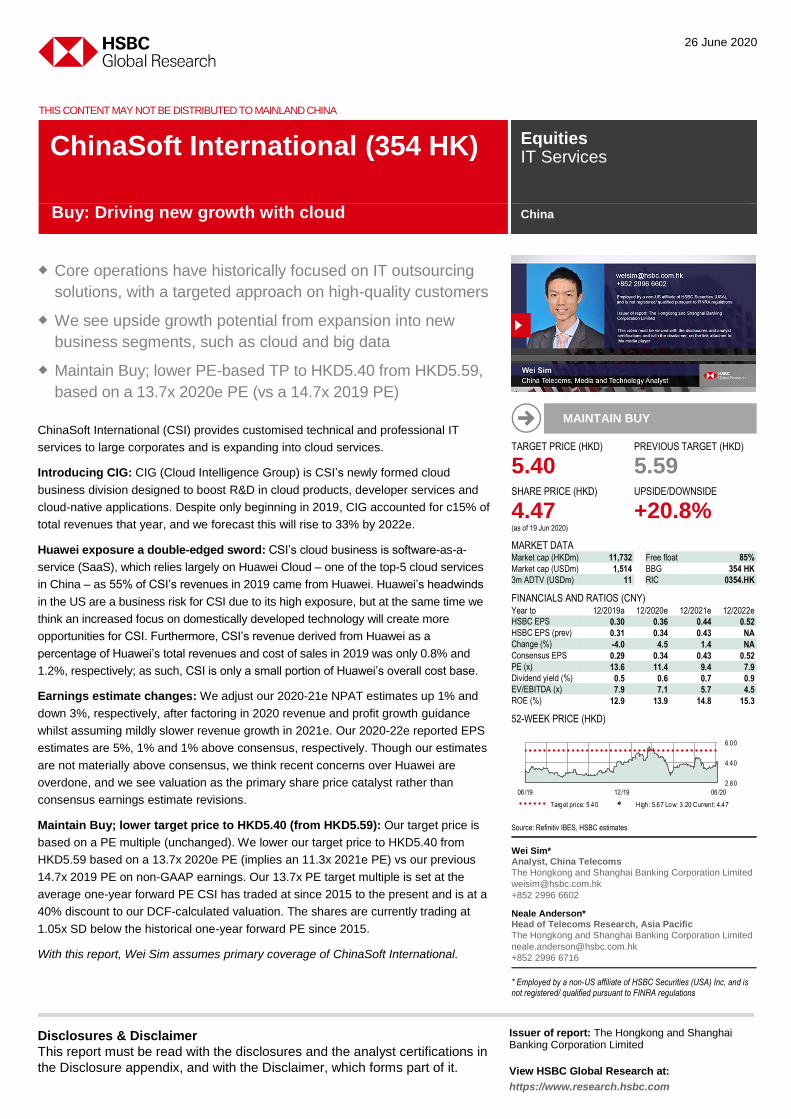
THIS CONTENT MAY NOT BE DISTRIBUTED TO MAINLAND CHINA
Core operations have historically focused on IT outsourcing
solutions, with a targeted approach on high-quality customers
We see upside growth potential from expansion into new
business segments, such as cloud and big data
Maintain Buy; lower PE-based TP to HKD5.40 from HKD5.59,
based on a 13.7x 2020e PE (vs a 14.7x 2019 PE)
ChinaSoft International (CSI) provides customised technical and professional IT
services to large corporates and is expanding into cloud services.
Introducing CIG: CIG (Cloud Intelligence Group) is CSI’s newly formed cloud
business division designed to boost R&D in cloud products, developer services and
cloud-native applications. Despite only beginning in 2019, CIG accounted for c15% of
total revenues that year, and we forecast this will rise to 33% by 2022e.
Huawei exposure a double-edged sword: CSI’s cloud business is software-as-a-
service (SaaS), which relies largely on Huawei Cloud – one of the top-5 cloud services
in China – as 55% of CSI’s revenues in 2019 came from Huawei. Huawei’s headwinds
in the US are a business risk for CSI due to its high exposure, but at the same time we
think an increased focus on domestically developed technology will create more
opportunities for CSI. Furthermore, CSI’s revenue derived from Huawei as a
percentage of Huawei’s total revenues and cost of sales in 2019 was only 0.8% and
1.2%, respectively; as such, CSI is only a small portion of Huawei’s overall cost base.
Earnings estimate changes: We adjust our 2020-21e NPAT estimates up 1% and
down 3%, respectively, after factoring in 2020 revenue and profit growth guidance
whilst assuming mildly slower revenue growth in 2021e. Our 2020-22e reported EPS
estimates are 5%, 1% and 1% above consensus, respectively. Though our estimates
are not materially above consensus, we think recent concerns over Huawei are
overdone, and we see valuation as the primary share price catalyst rather than
consensus earnings estimate revisions.
Maintain Buy; lower target price to HKD5.40 (from HKD5.59): Our target price is
based on a PE multiple (unchanged). We lower our target price to HKD5.40 from
HKD5.59 based on a 13.7x 2020e PE (implies an 11.3x 2021e PE) vs our previous
14.7x 2019 PE on non-GAAP earnings. Our 13.7x PE target multiple is set at the
average one-year forward PE CSI has traded at since 2015 to the present and is at a
40% discount to our DCF-calculated valuation. The shares are currently trading at
1.05x SD below the historical one-year forward PE since 2015.
With this report, Wei Sim assumes primary coverage of ChinaSoft International.
26 June 2020
MAINTAIN BUY
TARGET PRICE (HKD) PREVIOUS TARGET (HKD)
5.40 5.59 SHARE PRICE (HKD) UPSIDE/DOWNSIDE
4.47 +20.8% (as of 19 Jun 2020)
MARKET DATA Market cap (HKDm) 11,732 Free float 85%
Market cap (USDm) 1,514 BBG 354 HK
3m ADTV (USDm) 11 RIC 0354.HK
FINANCIALS AND RATIOS (CNY) Year to 12/2019a 12/2020e 12/2021e 12/2022e HSBC EPS 0.30 0.36 0.44 0.52
HSBC EPS (prev) 0.31 0.34 0.43 NA
Change (%) -4.0 4.5 1.4 NA
Consensus EPS 0.29 0.34 0.43 0.52
PE (x) 13.6 11.4 9.4 7.9
Dividend yield (%) 0.5 0.6 0.7 0.9 EV/EBITDA (x) 7.9 7.1 5.7 4.5
ROE (%) 12.9 13.9 14.8 15.3
52-WEEK PRICE (HKD)
Source: Refinitiv IBES, HSBC estimates
Wei Sim* Analyst, China Telecoms
The Hongkong and Shanghai Banking Corporation Limited
+852 2996 6602
Neale Anderson* Head of Telecoms Research, Asia Pacific
The Hongkong and Shanghai Banking Corporation Limited
+852 2996 6716
* Employed by a non-US affiliate of HSBC Securities (USA) Inc, and is not registered/ qualified pursuant to FINRA regulations
ChinaSoft International (354 HK) Equities IT Services
China
2.80
4.40
6.00
06/19 12/19 06/20
Target price: 5.40 High: 5.67 Low: 3 .20 Current: 4.47
Buy: Driving new growth with cloud
Equities ● IT Services 26 June 2020
2
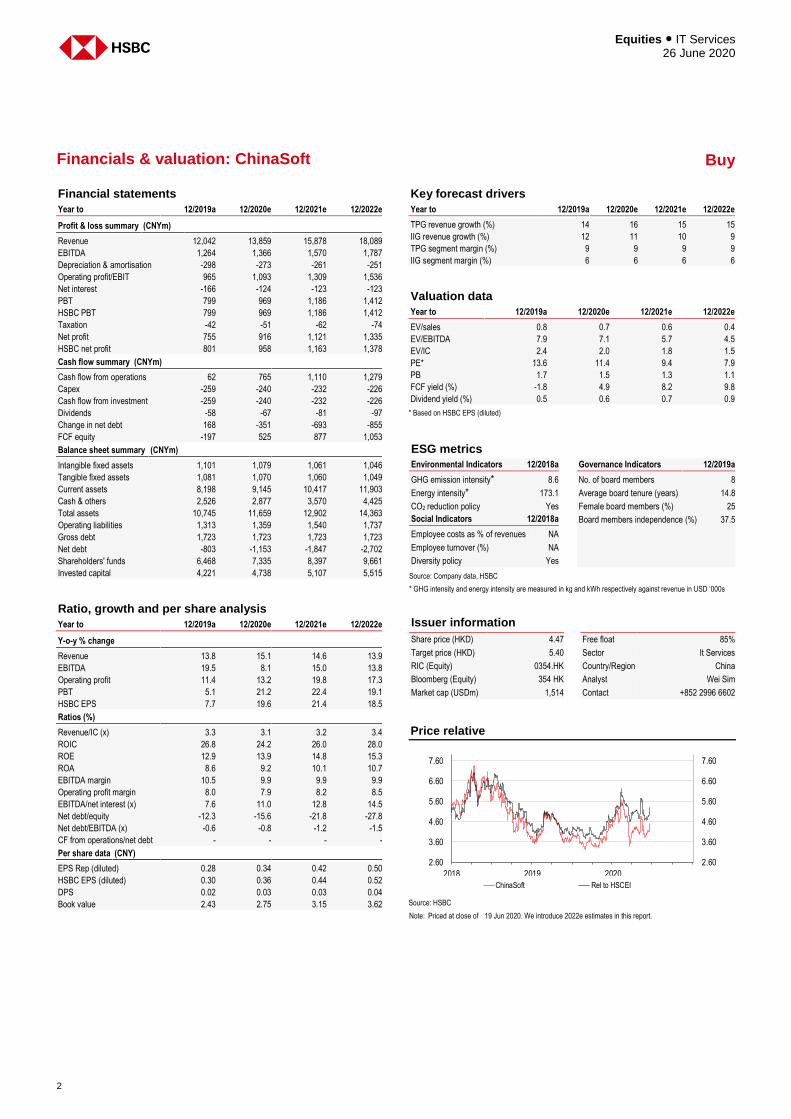
Financial statements
Year to 12/2019a 12/2020e 12/2021e 12/2022e
Profit & loss summary (CNYm)
Revenue 12,042 13,859 15,878 18,089
EBITDA 1,264 1,366 1,570 1,787
Depreciation & amortisation -298 -273 -261 -251
Operating profit/EBIT 965 1,093 1,309 1,536
Net interest -166 -124 -123 -123
PBT 799 969 1,186 1,412
HSBC PBT 799 969 1,186 1,412
Taxation -42 -51 -62 -74
Net profit 755 916 1,121 1,335
HSBC net profit 801 958 1,163 1,378
Cash flow summary (CNYm)
Cash flow from operations 62 765 1,110 1,279
Capex -259 -240 -232 -226
Cash flow from investment -259 -240 -232 -226
Dividends -58 -67 -81 -97
Change in net debt 168 -351 -693 -855
FCF equity -197 525 877 1,053
Balance sheet summary (CNYm)
Intangible fixed assets 1,101 1,079 1,061 1,046
Tangible fixed assets 1,081 1,070 1,060 1,049
Current assets 8,198 9,145 10,417 11,903
Cash & others 2,526 2,877 3,570 4,425
Total assets 10,745 11,659 12,902 14,363
Operating liabilities 1,313 1,359 1,540 1,737
Gross debt 1,723 1,723 1,723 1,723
Net debt -803 -1,153 -1,847 -2,702
Shareholders' funds 6,468 7,335 8,397 9,661
Invested capital 4,221 4,738 5,107 5,515
Ratio, growth and per share analysis
Year to 12/2019a 12/2020e 12/2021e 12/2022e
Y-o-y % change
Revenue 13.8 15.1 14.6 13.9
EBITDA 19.5 8.1 15.0 13.8
Operating profit 11.4 13.2 19.8 17.3
PBT 5.1 21.2 22.4 19.1
HSBC EPS 7.7 19.6 21.4 18.5
Ratios (%)
Revenue/IC (x) 3.3 3.1 3.2 3.4
ROIC 26.8 24.2 26.0 28.0
ROE 12.9 13.9 14.8 15.3
ROA 8.6 9.2 10.1 10.7
EBITDA margin 10.5 9.9 9.9 9.9
Operating profit margin 8.0 7.9 8.2 8.5
EBITDA/net interest (x) 7.6 11.0 12.8 14.5
Net debt/equity -12.3 -15.6 -21.8 -27.8
Net debt/EBITDA (x) -0.6 -0.8 -1.2 -1.5
CF from operations/net debt - - - -
Per share data (CNY)
EPS Rep (diluted) 0.28 0.34 0.42 0.50
HSBC EPS (diluted) 0.30 0.36 0.44 0.52
DPS 0.02 0.03 0.03 0.04
Book value 2.43 2.75 3.15 3.62
Key forecast drivers
Year to 12/2019a 12/2020e 12/2021e 12/2022e
TPG revenue growth (%) 14 16 15 15
IIG revenue growth (%) 12 11 10 9
TPG segment margin (%) 9 9 9 9
IIG segment margin (%) 6 6 6 6
Valuation data
Year to 12/2019a 12/2020e 12/2021e 12/2022e
EV/sales 0.8 0.7 0.6 0.4
EV/EBITDA 7.9 7.1 5.7 4.5
EV/IC 2.4 2.0 1.8 1.5
PE* 13.6 11.4 9.4 7.9
PB 1.7 1.5 1.3 1.1
FCF yield (%) -1.8 4.9 8.2 9.8
Dividend yield (%) 0.5 0.6 0.7 0.9
* Based on HSBC EPS (diluted)
ESG metrics
Environmental Indicators 12/2018a Governance Indicators 12/2019a
GHG emission intensity* 8.6 No. of board members 8
Energy intensity* 173.1 Average board tenure (years) 14.8
CO2 reduction policy Yes Female board members (%) 25
Social Indicators 12/2018a Board members independence (%) 37.5
Employee costs as % of revenues NA
Employee turnover (%) NA
Diversity policy Yes
Source: Company data, HSBC
* GHG intensity and energy intensity are measured in kg and kWh respectively against revenue in USD ‘000s
Issuer information
Share price (HKD) 4.47 Free float 85%
Target price (HKD) 5.40 Sector It Services
RIC (Equity) 0354.HK Country/Region China
Bloomberg (Equity) 354 HK Analyst Wei Sim
Market cap (USDm) 1,514 Contact +852 2996 6602
Price relative
Source: HSBC Note: Priced at close of 19 Jun 2020. We introduce 2022e estimates in this report.
2.60
3.60
4.60
5.60
6.60
7.60
2.60
3.60
4.60
5.60
6.60
7.60
2018 2019 2020
ChinaSoft Rel to HSCEI
Financials & valuation: ChinaSoft Buy

3
Equities ● IT Services 26 June 2020
Investment summary
ChinaSoft International (CSI) is an IT services company traditionally providing customised
technical and professional services to large corporates. In 2019, the company formed its cloud
business division CIG (Cloud Intelligence Group), which leverages the existing customer base.
Despite only beginning in 2019, CIG has already started to contribute c15% to the company’s total
revenue in 2019, and we forecast for this mix to increase to 33% by 2022e. We forecast a 2019-
22e revenue CAGR of 15%, which is only slightly stronger than the historical 2017-19 revenue
CAGR of 14%. However, as a result of the change in business mix to the increased contribution
from CIG, we forecast NPAT’s CAGR to increase to 21% in 2019-22e from 16% in 2017-19.
Fig 1: ChinaSoft International historical and future forecast revenue vs NPAT trend
Source: Company data, HSBC estimates
CSI’s cloud business
CSI’s cloud business is focused on software (see Fig. 2 for more details). The company focuses
on SaaS across the public, hybrid and private cloud, providing services and scenario-based
applications in financial, workplace, park, retail, and transportation industries, using a
subscription model.
In terms of providing platform-as-a-service (PaaS), CSI has also built aPaaS (application-driven
PaaS) to better support itself and the cloud ecosystem, as well as building cloud-native
application service capabilities, such as DevOps and JointForce ADM (application development
& maintenance).
At the infrastructure-as-a-service (IaaS) level, CSI’s cloud infrastructure utilises third parties,
including Huawei, Microsoft and Tencent.
-
200
400
600
800
1,000
1,200
1,400
-
2,000
4,000
6,000
8,000
10,000
12,000
14,000
16,000
18,000
20,000
FY17A FY18A FY19A FY20E FY21E FY22E
Traditional revenues [LHS] CIG revenues [LHS] NPAT [RHS]
RMBm RMBm
Fig 2: CSI’s cloud business model
Layer Provider Description
SaaS CSI Public/Hybrid/Private “Cloud Integrative” services, scenario-based applications in financial, workplace, park, retail, and transportation PaaS CSI /third party CSI (APaaS), cloud-native application service (e.g., DevOps and JointForce ADM) IaaS Third party Huawei Kunpeng Cloud, Microsoft Azure, Tencent Cloud
Source: HSBC

Equities ● IT Services 26 June 2020
4
China’s cloud market share
CSI’s cloud business is software-based (SaaS), which feeds largely off Huawei Cloud; the
company has formed various strategic co-operations and participates in the construction of
software around Kunpeng (Huawei’s ARM-based server processor) and HMS (Huawei Mobile
Services) ecosystems.
Fig 3: Market share of key firms in China’s cloud market
Source: HSBC
In China, Alibaba (BABA US, USD223.54, Buy) makes up about a third of the market followed by
Tencent (0700 HK, HKD460.4, Buy), China Telecom’s e-Cloud (天翼云) (Not listed), AWS (Not
listed) and Huawei (Not listed) taking second to fifth position. The top-5 firms have a combined 70-
75% cloud market share in China in terms of infrastructure and platform.
Porter’s five forces analysis
Industry rivalry: IT services are fragmented in China. ChinaSoft International is one of the
largest companies in the space, but the top few companies combined only make up c5% of the
entire market; therefore, the space is competitive. According to the company, its largest
competitor is Neusoft (600718 CH, Not Rated). ChinaSoft’s strategy is to focus on a few key
customers, especially large corporates with a revenue contribution of more than USD100m.
CSI has recognised that market competition risk is increasing. While striving to provide high
quality products and services to customers, it advocates a spirit of innovation and a culture of
creativity, setting up a special operation group known as Zero Distance Innovation, which seeks
to rapidly upgrade products and service cycles.
Bargaining power of suppliers: CSI’s main suppliers are IT hardware enterprises as the
company’s value generation is through software and IT services. According to CSI, the
company has good relationship with its suppliers and conducts a fair and strict appraisal of its
suppliers on an annual basis. CSI also grants share options to certain suppliers as part of an
incentive scheme to align the priorities of suppliers with those of the company.
Bargaining power of buyers: As noted above, China’s IT services sector is fragmented, and,
as such, customers have good bargaining power. As per above, ChinaSoft’s strategy has been
to focus on fewer large customers and grow its IT services along with the growth of those
customers; this is the company’s TPG business (technical and professional services group).
Huawei is the CSI’s largest customer currently, making up over 50% of the revenue contribution.
Beyond Huawei, other major customers include Tencent, Alibaba, Baidu, China Mobile (941 HK,
HKD55.00, Buy), and Ping An (2318 HK, HKD79.15, Buy).
0%
10%
20%
30%
40%
50%
AliCloud Tencent Cloud Huawei Cloud AWS Baidu Cloud Kingsoft Cloud Others
2017 2018 2019
CSI has recognised that
market competition risk is
increasing and set up a
special operation group
Huawei is the company’s
largest customer currently,
making up over 50% of the
revenue contribution

5
Equities ● IT Services 26 June 2020
For CSI’s smaller customers, most business is based on its JointForce platform, which is an
online IT crowdsourcing platform that provides online transaction and software development
management services, matching, coordinating and guaranteeing service providers (contracting
companies) and engineers based on the platform to provide quality IT services to customers
(outsourcing companies). JointForce is essentially a supply procurement platform for customers
to find contractors. The bargaining is between contracting and outsourcing companies and
CSI’s JointForce platform acts an intermediary.
Threat of substitutes: Apart from new entrants or industry rivals, we do not see any substitutes
for CSI’s provision of IT services at this point in time.
Threat of new entrants: Given the fragmented nature of the IT services market, this threat is
ever present. CSI minimises the risk by focusing on a small number of large customers. The
loss of these large customers, however, would have a material negative impact on the
company’s business. CSI’s largest customer is Huawei, which contributes over 50% to the
company’s revenue.
Huawei: CSI’s major customer
Historically, CSI’s relationship with Huawei has been like a second R&D centre. CSI
collaborates with Huawei on everything from application development to maintenance,
infrastructure operations and application operations. The evolution of the relationship started
from just making communication equipment applications and software and maintaining those to
a solutions business. For example, in Kenya, CSI and Huawei signed a contract with Vodafone
(VOD LN, GBP1.25, Buy) to provide a mobile payments solution, which worked not just with
smartphones but also with feature phones. Thereafter, CSI expanded its relationship with
Huawei by working on cloud, cloud solutions, big data, consumer goods and testing.
Recently, more prominent projects CSI is working on with Huawei include assisting in building
out Huawei’s Kunpeng and HMS (Huawei Mobile Services) ecosystems.
Kunpeng
Kunpeng is a family of Huawei’s ARM-based server CPU architecture. The company signed the
first Huawei Kunpeng Cloud Migration Framework Agreement, covering services, such as chips,
servers, operating systems, databases, big data and cloud services, in 2019.
Fig 4: CSI 2019 customer contribution concentration breakdown (value)
Fig 5: CSI 2019 supply procurement concentration breakdown (value)
Source: Company data, HSBC Source: Company data, HSBC
CSI’s strategy is to focus on
a small number of large
customers
CSI assists in building out
Huawei’s Kunpeng and HMS
(Huawei Mobile Services)
ecosystems
55%
14%
18%
13%
Huawei
Nos. 2-5
Other TPGcustomers
Long-tailcustomers
18%
29%
53%
1
2-5
Others
Equities ● IT Services 26 June 2020
6
Fig 6: Huawei’s all-scenario processor portfolio
Processor family Scenario
Kunpeng General-purpose computing Ascend AI computing Kirin Smart devices Honghu Smart screens
Source: Company data
Examples of Kunpeng projects include the Chongqing Kunpeng Industrial Ecosystem Project
(CKIEP) signed in May 2020. CKIEP is a three-way strategic cooperation between CSI, Huawei
and Chongqing Xiyong Microelectronics Industrial Park.
Leveraging JointForce, CSI provides comprehensive services, such as ecological operations, IT
engineering, and personnel training, and works with Huawei to build Kunpeng ecological full-
stack service capabilities to support the construction and development of Kunpeng’s
technological, industrial and market ecosystem.
Huawei Mobile Services
As a result of the US trade restrictions, Huawei hasn’t been able to launch new phones with
Google Mobile Services (GMS) since last year. GMS is a core element of most Android
smartphones. It comprises dozens of apps, APIs, and cloud-based services, such as Google
Maps, Google Drive, YouTube, Google Photos, Google Play Store, Google Chrome, and more.
Without GMS, Huawei phones not only miss out on Google products, they also lack a number of
other popular apps, such as Facebook, WhatsApp and Instagram. Many smaller apps also
depend on the infrastructure provided by Google through GMS. Huawei’s solution to combat the
lack of GMS is to create its own competing platform – Huawei Mobile Services (HMS) – which
CSI is helping to build out. HMS has actually been around for years, but Huawei relaunched and
expanded the platform.
HMS has a user-facing component (e.g., AppGallery and other Huawei apps and services) and
a developer-facing component, called HMS Core. HMS Core is made up of various APIs, SDKs,
and services that developers can use to create and improve apps.
HMS Core A set of developer services from Huawei, including tools for location tracking, sign-ins, in-
app purchases, ads, face detection and text recognition; CSI is helping to build this out.
Beyond building out the HMS ecosystem, CSI participated in 17 out of 24 R&D processes of
HMS Core 4.0. In the future, CSI intends to continue providing services for Huawei’s HMS
upgrade and support the global ecological development of HMS.
Huawei CBG
In 2019, CSI joined the list of core IT suppliers for Huawei Consumer Business Group (CBG)
and was named best supplier of Huawei’s CBG IT annual framework. The “Co-sell” model of
CSI and Huawei had a breakthrough in the Latin America region, adding New Mexico business.
At the same time, CSI consolidated the South Asian and East Asian markets, and established
overseas branches in Malaysia, Myanmar, India, and Hong Kong. In addition to traditional
businesses, Huawei Cloud-based solutions have made breakthroughs in government,
manufacturing, retail, and transportation industries.
CSI migrates systems and
software to the Kunpeng
platform, accelerating the
localisation of key industries
CSI participated in 17 out of
24 R&D processes of HMS
Core 4.0
7
Equities ● IT Services 26 June 2020
HSBC estimates vs consensus
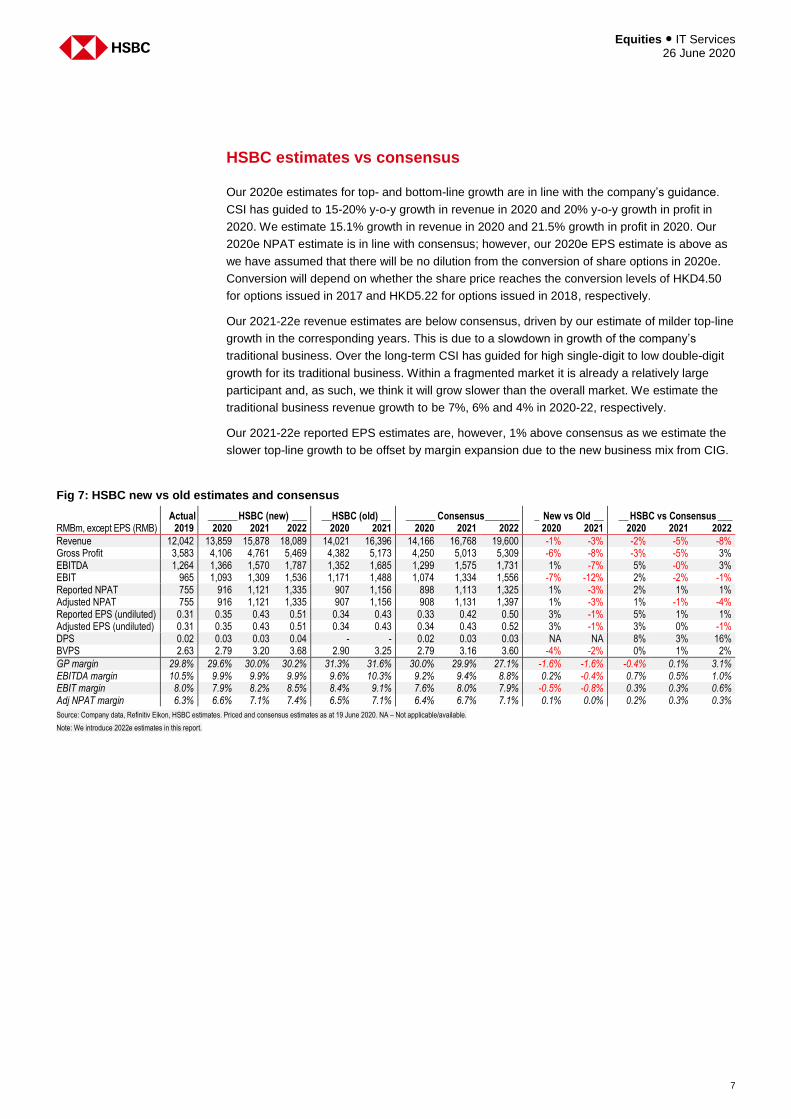
Our 2020e estimates for top- and bottom-line growth are in line with the company’s guidance.
CSI has guided to 15-20% y-o-y growth in revenue in 2020 and 20% y-o-y growth in profit in
2020. We estimate 15.1% growth in revenue in 2020 and 21.5% growth in profit in 2020. Our
2020e NPAT estimate is in line with consensus; however, our 2020e EPS estimate is above as
we have assumed that there will be no dilution from the conversion of share options in 2020e.
Conversion will depend on whether the share price reaches the conversion levels of HKD4.50
for options issued in 2017 and HKD5.22 for options issued in 2018, respectively.
Our 2021-22e revenue estimates are below consensus, driven by our estimate of milder top-line
growth in the corresponding years. This is due to a slowdown in growth of the company’s
traditional business. Over the long-term CSI has guided for high single-digit to low double-digit
growth for its traditional business. Within a fragmented market it is already a relatively large
participant and, as such, we think it will grow slower than the overall market. We estimate the
traditional business revenue growth to be 7%, 6% and 4% in 2020-22, respectively.
Our 2021-22e reported EPS estimates are, however, 1% above consensus as we estimate the
slower top-line growth to be offset by margin expansion due to the new business mix from CIG.
Fig 7: HSBC new vs old estimates and consensus
Actual ______ HSBC (new) ___ __ HSBC (old) __ ______ Consensus _______ _ New vs Old __ __ HSBC vs Consensus ___ RMBm, except EPS (RMB) 2019 2020 2021 2022 2020 2021 2020 2021 2022 2020 2021 2020 2021 2022
Revenue 12,042 13,859 15,878 18,089 14,021 16,396 14,166 16,768 19,600 -1% -3% -2% -5% -8% Gross Profit 3,583 4,106 4,761 5,469 4,382 5,173 4,250 5,013 5,309 -6% -8% -3% -5% 3% EBITDA 1,264 1,366 1,570 1,787 1,352 1,685 1,299 1,575 1,731 1% -7% 5% -0% 3% EBIT 965 1,093 1,309 1,536 1,171 1,488 1,074 1,334 1,556 -7% -12% 2% -2% -1% Reported NPAT 755 916 1,121 1,335 907 1,156 898 1,113 1,325 1% -3% 2% 1% 1% Adjusted NPAT 755 916 1,121 1,335 907 1,156 908 1,131 1,397 1% -3% 1% -1% -4% Reported EPS (undiluted) 0.31 0.35 0.43 0.51 0.34 0.43 0.33 0.42 0.50 3% -1% 5% 1% 1% Adjusted EPS (undiluted) 0.31 0.35 0.43 0.51 0.34 0.43 0.34 0.43 0.52 3% -1% 3% 0% -1% DPS 0.02 0.03 0.03 0.04 - - 0.02 0.03 0.03 NA NA 8% 3% 16% BVPS 2.63 2.79 3.20 3.68 2.90 3.25 2.79 3.16 3.60 -4% -2% 0% 1% 2%
GP margin 29.8% 29.6% 30.0% 30.2% 31.3% 31.6% 30.0% 29.9% 27.1% -1.6% -1.6% -0.4% 0.1% 3.1% EBITDA margin 10.5% 9.9% 9.9% 9.9% 9.6% 10.3% 9.2% 9.4% 8.8% 0.2% -0.4% 0.7% 0.5% 1.0% EBIT margin 8.0% 7.9% 8.2% 8.5% 8.4% 9.1% 7.6% 8.0% 7.9% -0.5% -0.8% 0.3% 0.3% 0.6% Adj NPAT margin 6.3% 6.6% 7.1% 7.4% 6.5% 7.1% 6.4% 6.7% 7.1% 0.1% 0.0% 0.2% 0.3% 0.3%
Source: Company data, Refinitiv Eikon, HSBC estimates. Priced and consensus estimates as at 19 June 2020. NA – Not applicable/available.
Note: We introduce 2022e estimates in this report.
Equities ● IT Services 26 June 2020
8
Valuation and risks
Our target price for CSI is HKD5.40 (down from HKD5.59). Our target price is set using a PE
valuation methodology. We also cross-check our target price with a DCF valuation. Our target
multiple has been updated to a 13.7x 2020e PE (from a 14.7x 2019e PE on non-GAAP earnings).
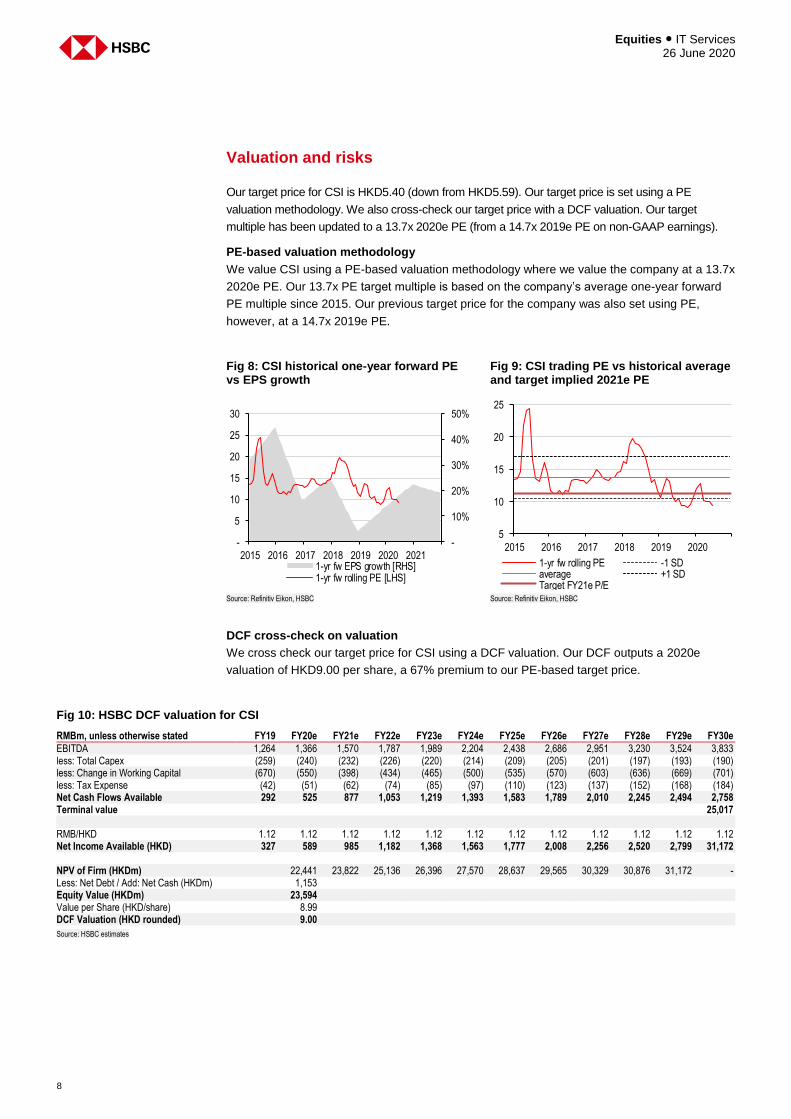
PE-based valuation methodology
We value CSI using a PE-based valuation methodology where we value the company at a 13.7x
2020e PE. Our 13.7x PE target multiple is based on the company’s average one-year forward
PE multiple since 2015. Our previous target price for the company was also set using PE,
however, at a 14.7x 2019e PE.
Fig 8: CSI historical one-year forward PE vs EPS growth
Fig 9: CSI trading PE vs historical average and target implied 2021e PE
Source: Refinitiv Eikon, HSBC Source: Refinitiv Eikon, HSBC
DCF cross-check on valuation
We cross check our target price for CSI using a DCF valuation. Our DCF outputs a 2020e
valuation of HKD9.00 per share, a 67% premium to our PE-based target price.
-
10%
20%
30%
40%
50%
-
5
10
15
20
25
30
2015 2016 2017 2018 2019 2020 20211-yr fw EPS growth [RHS]1-yr fw rolling PE [LHS]
5
10
15
20
25
2015 2016 2017 2018 2019 2020
1-yr fw rolling PE -1 SDaverage +1 SDTarget FY21e P/E
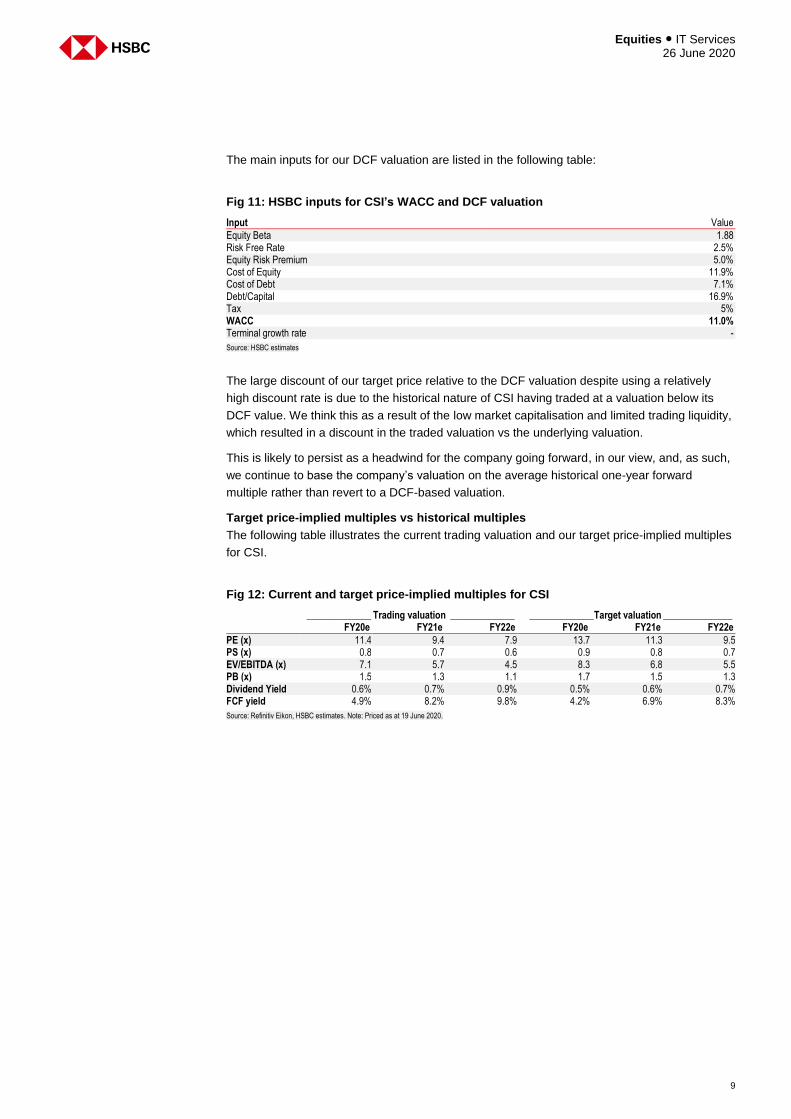
Fig 10: HSBC DCF valuation for CSI
RMBm, unless otherwise stated FY19 FY20e FY21e FY22e FY23e FY24e FY25e FY26e FY27e FY28e FY29e FY30e
EBITDA 1,264 1,366 1,570 1,787 1,989 2,204 2,438 2,686 2,951 3,230 3,524 3,833 less: Total Capex (259) (240) (232) (226) (220) (214) (209) (205) (201) (197) (193) (190) less: Change in Working Capital (670) (550) (398) (434) (465) (500) (535) (570) (603) (636) (669) (701) less: Tax Expense (42) (51) (62) (74) (85) (97) (110) (123) (137) (152) (168) (184) Net Cash Flows Available 292 525 877 1,053 1,219 1,393 1,583 1,789 2,010 2,245 2,494 2,758 Terminal value 25,017 RMB/HKD 1.12 1.12 1.12 1.12 1.12 1.12 1.12 1.12 1.12 1.12 1.12 1.12 Net Income Available (HKD) 327 589 985 1,182 1,368 1,563 1,777 2,008 2,256 2,520 2,799 31,172 NPV of Firm (HKDm) 22,441 23,822 25,136 26,396 27,570 28,637 29,565 30,329 30,876 31,172 - Less: Net Debt / Add: Net Cash (HKDm) 1,153 Equity Value (HKDm) 23,594 Value per Share (HKD/share) 8.99 DCF Valuation (HKD rounded) 9.00
Source: HSBC estimates
9
Equities ● IT Services 26 June 2020
The main inputs for our DCF valuation are listed in the following table:
Fig 11: HSBC inputs for CSI’s WACC and DCF valuation
Input Value
Equity Beta 1.88 Risk Free Rate 2.5% Equity Risk Premium 5.0% Cost of Equity 11.9% Cost of Debt 7.1% Debt/Capital 16.9% Tax 5% WACC 11.0% Terminal growth rate -
Source: HSBC estimates
The large discount of our target price relative to the DCF valuation despite using a relatively
high discount rate is due to the historical nature of CSI having traded at a valuation below its
DCF value. We think this as a result of the low market capitalisation and limited trading liquidity,
which resulted in a discount in the traded valuation vs the underlying valuation.
This is likely to persist as a headwind for the company going forward, in our view, and, as such,
we continue to base the company’s valuation on the average historical one-year forward
multiple rather than revert to a DCF-based valuation.
Target price-implied multiples vs historical multiples
The following table illustrates the current trading valuation and our target price-implied multiples
for CSI.
Fig 12: Current and target price-implied multiples for CSI
_____________ Trading valuation _____________ _____________ Target valuation ______________ FY20e FY21e FY22e FY20e FY21e FY22e
PE (x) 11.4 9.4 7.9 13.7 11.3 9.5 PS (x) 0.8 0.7 0.6 0.9 0.8 0.7 EV/EBITDA (x) 7.1 5.7 4.5 8.3 6.8 5.5 PB (x) 1.5 1.3 1.1 1.7 1.5 1.3 Dividend Yield 0.6% 0.7% 0.9% 0.5% 0.6% 0.7% FCF yield 4.9% 8.2% 9.8% 4.2% 6.9% 8.3%
Source: Refinitiv Eikon, HSBC estimates. Note: Priced as at 19 June 2020.
Equities ● IT Services 26 June 2020
10
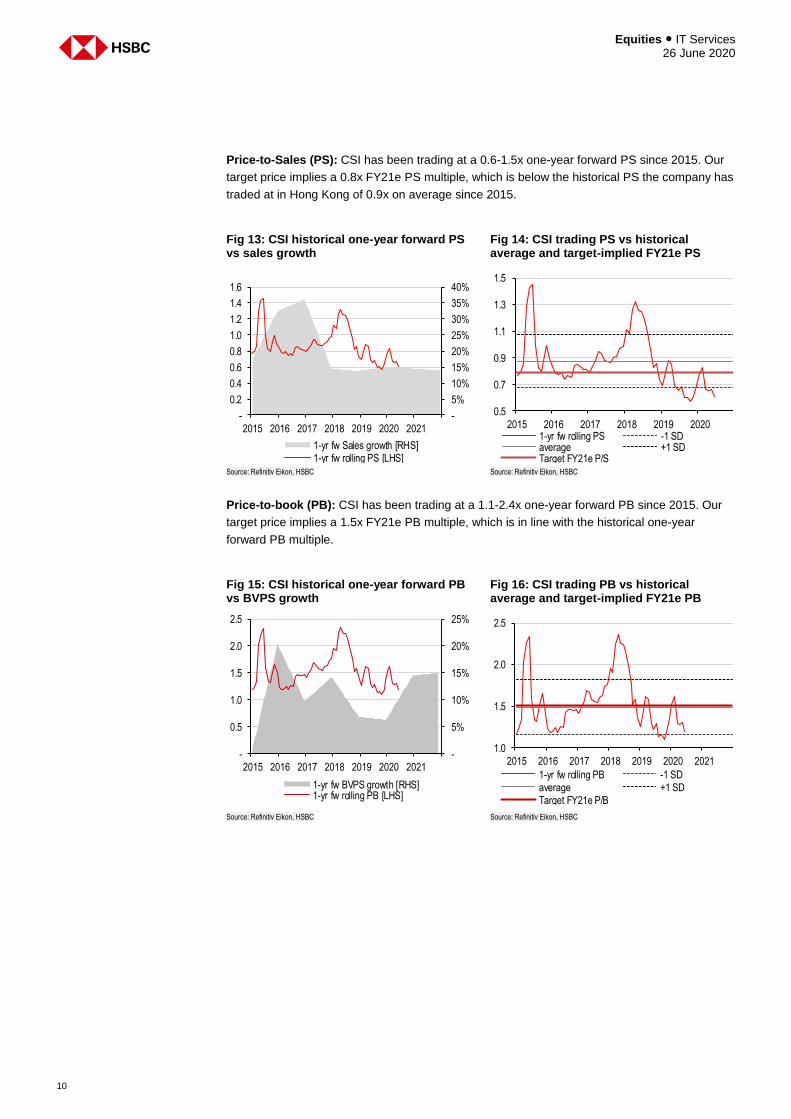
Price-to-Sales (PS): CSI has been trading at a 0.6-1.5x one-year forward PS since 2015. Our
target price implies a 0.8x FY21e PS multiple, which is below the historical PS the company has
traded at in Hong Kong of 0.9x on average since 2015.
Fig 13: CSI historical one-year forward PS vs sales growth
Fig 14: CSI trading PS vs historical average and target-implied FY21e PS
Source: Refinitiv Eikon, HSBC Source: Refinitiv Eikon, HSBC
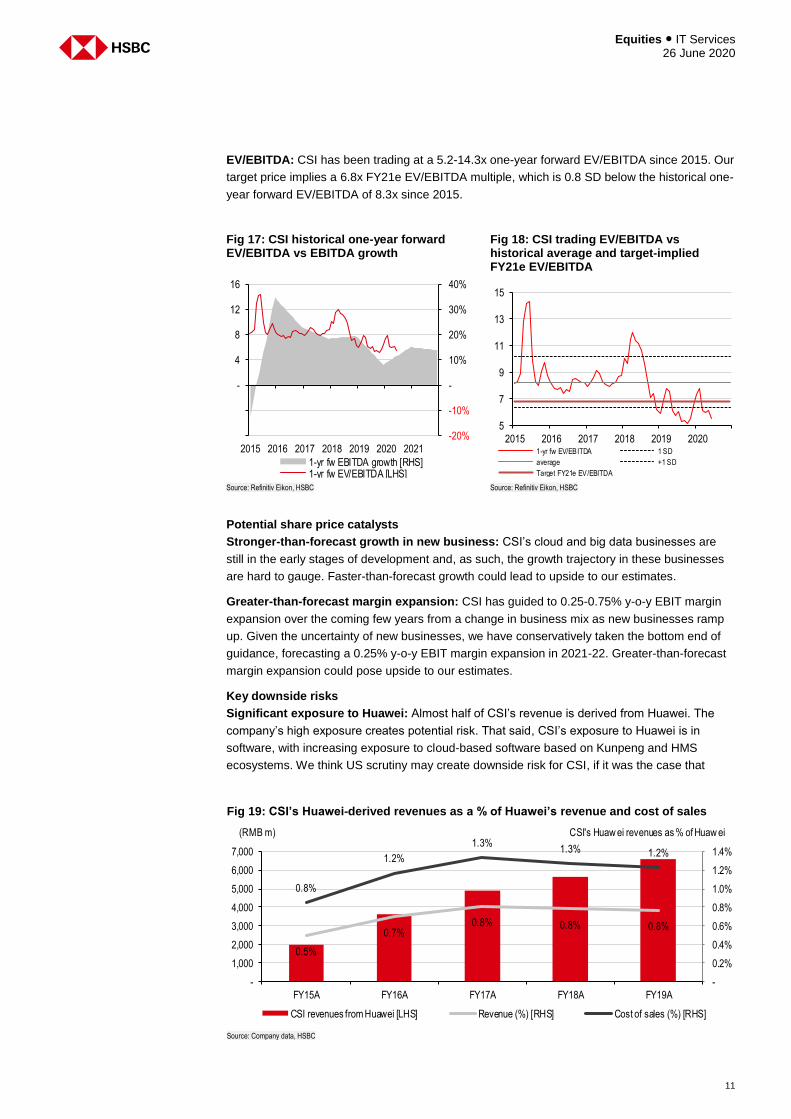
Price-to-book (PB): CSI has been trading at a 1.1-2.4x one-year forward PB since 2015. Our
target price implies a 1.5x FY21e PB multiple, which is in line with the historical one-year
forward PB multiple.
Fig 15: CSI historical one-year forward PB vs BVPS growth
Fig 16: CSI trading PB vs historical average and target-implied FY21e PB
Source: Refinitiv Eikon, HSBC Source: Refinitiv Eikon, HSBC
-
5%
10%
15%
20%
25%
30%
35%
40%
-
0.2
0.4
0.6
0.8
1.0
1.2
1.4
1.6
2015 2016 2017 2018 2019 2020 2021
1-yr fw Sales growth [RHS]1-yr fw rolling PS [LHS]
0.5
0.7
0.9
1.1
1.3
1.5
2015 2016 2017 2018 2019 20201-yr fw rolling PS -1 SDaverage +1 SDTarget FY21e P/S
-
5%
10%
15%
20%
25%
-
0.5
1.0
1.5
2.0
2.5
2015 2016 2017 2018 2019 2020 2021
1-yr fw BVPS growth [RHS]1-yr fw rolling PB [LHS]
1.0
1.5
2.0
2.5
2015 2016 2017 2018 2019 2020 2021
1-yr fw rolling PB -1 SDaverage +1 SDTarget FY21e P/B
11
Equities ● IT Services 26 June 2020
EV/EBITDA: CSI has been trading at a 5.2-14.3x one-year forward EV/EBITDA since 2015. Our
target price implies a 6.8x FY21e EV/EBITDA multiple, which is 0.8 SD below the historical one-
year forward EV/EBITDA of 8.3x since 2015.
Fig 17: CSI historical one-year forward EV/EBITDA vs EBITDA growth
Fig 18: CSI trading EV/EBITDA vs historical average and target-implied FY21e EV/EBITDA
Source: Refinitiv Eikon, HSBC Source: Refinitiv Eikon, HSBC
Potential share price catalysts
Stronger-than-forecast growth in new business: CSI’s cloud and big data businesses are
still in the early stages of development and, as such, the growth trajectory in these businesses
are hard to gauge. Faster-than-forecast growth could lead to upside to our estimates.
Greater-than-forecast margin expansion: CSI has guided to 0.25-0.75% y-o-y EBIT margin
expansion over the coming few years from a change in business mix as new businesses ramp
up. Given the uncertainty of new businesses, we have conservatively taken the bottom end of
guidance, forecasting a 0.25% y-o-y EBIT margin expansion in 2021-22. Greater-than-forecast
margin expansion could pose upside to our estimates.
Key downside risks
Significant exposure to Huawei: Almost half of CSI’s revenue is derived from Huawei. The
company’s high exposure creates potential risk. That said, CSI’s exposure to Huawei is in
software, with increasing exposure to cloud-based software based on Kunpeng and HMS
ecosystems. We think US scrutiny may create downside risk for CSI, if it was the case that
-20%
-10%
-
10%
20%
30%
40%
-
4
8
12
16
2015 2016 2017 2018 2019 2020 2021
1-yr fw EBITDA growth [RHS]1-yr fw EV/EBITDA [LHS]
5
7
9
11
13
15
2015 2016 2017 2018 2019 20201-yr fw EV/EBITDA 1 SD
average +1 SD
Target FY21e EV/EBITDA
Fig 19: CSI’s Huawei-derived revenues as a % of Huawei’s revenue and cost of sales
Source: Company data, HSBC
0.5%
0.7%0.8% 0.8% 0.8%
0.8%
1.2%
1.3%1.3% 1.2%
-
0.2%
0.4%
0.6%
0.8%
1.0%
1.2%
1.4%
-
1,000
2,000
3,000
4,000
5,000
6,000
7,000
FY15A FY16A FY17A FY18A FY19A
CSI revenues from Huawei [LHS] Revenue (%) [RHS] Cost of sales (%) [RHS]
(RMB m) CSI's Huaw ei revenues as % of Huaw ei
Equities ● IT Services 26 June 2020
12
Huawei was no longer able to operate; however, on the flip-side, it may also force the rapid
growth of domestic and independent controllable science and technology. To that end CSI could
be a beneficiary. Furthermore, CSI’s revenues derived from Huawei as a percentage of
Huawei’s revenues and cost of sales in 2019 was only 0.8% and 1.2%, respectively.
Size and liquidity: CSI’s relatively small market capitalisation and limited share liquidity may
limit the relative attractiveness of investing in the company and has historically resulted in CSI
trading at a discount to its DCF valuation. If there is no increase in the company’s share liquidity
and market capitalisation, then this may continue to be an overhang, hindering the company’s
valuation relative to its DCF valuation.
Growth rates below company guidance: CSI has guided to 15-20% revenue growth in 2020
and 20% net profit growth, growth which if lower than this guidance may result in market
disappointment and earnings expectation downgrades for future years.
Currency risk: Several of CSI’s subsidiaries have bank balances and cash, trade receivables
denominated in foreign currencies arising from income generated from the provision of services,
trade and other payables arising from purchases denominated in foreign currencies and
borrowing, which expose CSI to foreign currency risk. CSI’s principal operating subsidiaries are
located in mainland China, the United States and Japan, and principal businesses are
conducted in RMB. CSI is mainly exposed to USD, HKD and JPY.
Market risk: The loss of market share is a risk encountered by CSI. The company constantly faces
fierce competition in its core market of mainland China. The financial position of CSI may be adversely
affected, if it fails to respond to market changes, resulting in the loss of business to competitors.
13
Equities ● IT Services 26 June 2020
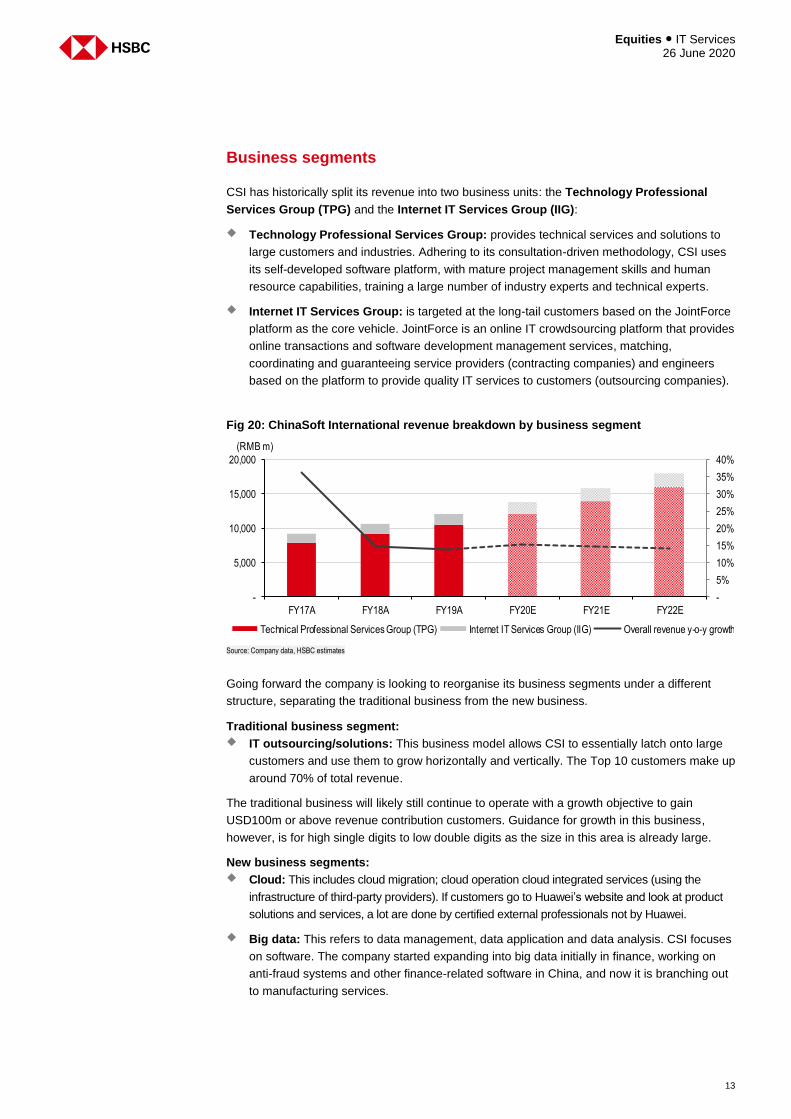
Business segments
CSI has historically split its revenue into two business units: the Technology Professional
Services Group (TPG) and the Internet IT Services Group (IIG):
Technology Professional Services Group: provides technical services and solutions to
large customers and industries. Adhering to its consultation-driven methodology, CSI uses
its self-developed software platform, with mature project management skills and human
resource capabilities, training a large number of industry experts and technical experts.
Internet IT Services Group: is targeted at the long-tail customers based on the JointForce
platform as the core vehicle. JointForce is an online IT crowdsourcing platform that provides
online transactions and software development management services, matching,
coordinating and guaranteeing service providers (contracting companies) and engineers
based on the platform to provide quality IT services to customers (outsourcing companies).
Fig 20: ChinaSoft International revenue breakdown by business segment
Source: Company data, HSBC estimates
Going forward the company is looking to reorganise its business segments under a different
structure, separating the traditional business from the new business.
Traditional business segment:
IT outsourcing/solutions: This business model allows CSI to essentially latch onto large
customers and use them to grow horizontally and vertically. The Top 10 customers make up
around 70% of total revenue.
The traditional business will likely still continue to operate with a growth objective to gain
USD100m or above revenue contribution customers. Guidance for growth in this business,
however, is for high single digits to low double digits as the size in this area is already large.
New business segments:
Cloud: This includes cloud migration; cloud operation cloud integrated services (using the
infrastructure of third-party providers). If customers go to Huawei’s website and look at product
solutions and services, a lot are done by certified external professionals not by Huawei.
Big data: This refers to data management, data application and data analysis. CSI focuses
on software. The company started expanding into big data initially in finance, working on
anti-fraud systems and other finance-related software in China, and now it is branching out
to manufacturing services.
-
5%
10%
15%
20%
25%
30%
35%
40%
-
5,000
10,000
15,000
20,000
FY17A FY18A FY19A FY20E FY21E FY22E
Technical Professional Services Group (TPG) Internet IT Services Group (IIG) Overall revenue y-o-y growth
(RMB m)
Equities ● IT Services 26 June 2020
14
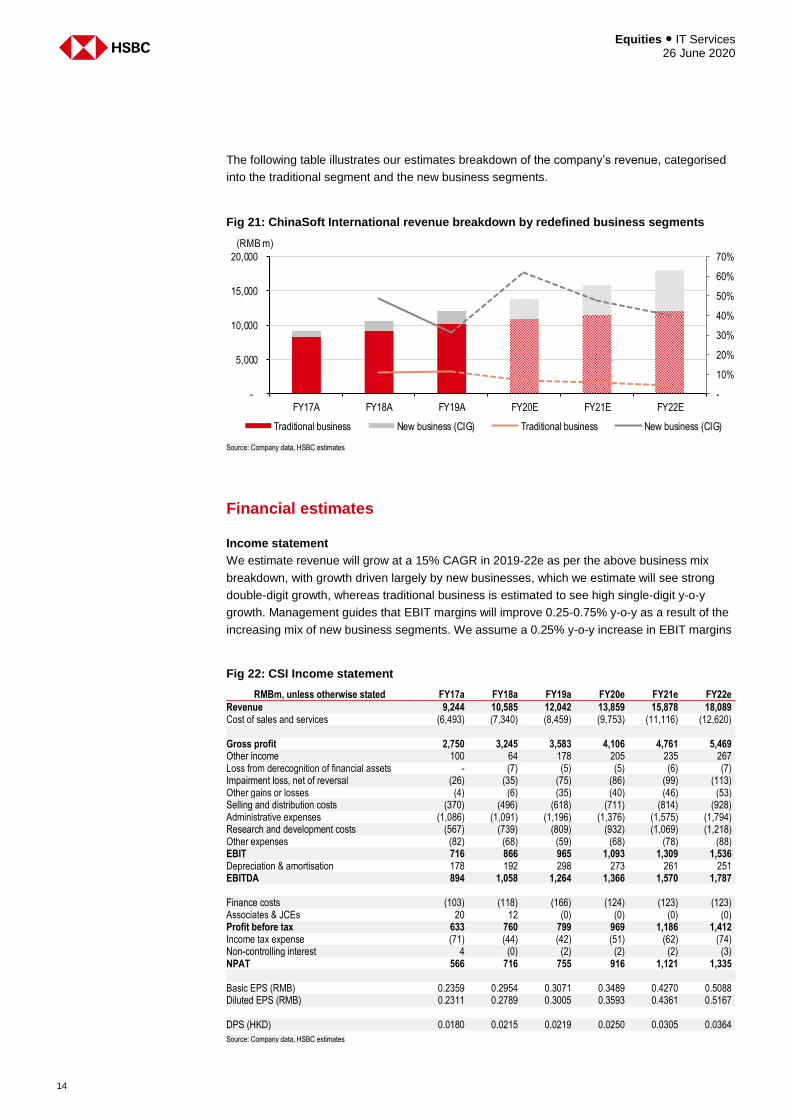
The following table illustrates our estimates breakdown of the company’s revenue, categorised
into the traditional segment and the new business segments.
Fig 21: ChinaSoft International revenue breakdown by redefined business segments
Source: Company data, HSBC estimates
Financial estimates
Income statement
We estimate revenue will grow at a 15% CAGR in 2019-22e as per the above business mix
breakdown, with growth driven largely by new businesses, which we estimate will see strong
double-digit growth, whereas traditional business is estimated to see high single-digit y-o-y
growth. Management guides that EBIT margins will improve 0.25-0.75% y-o-y as a result of the
increasing mix of new business segments. We assume a 0.25% y-o-y increase in EBIT margins
-
10%
20%
30%
40%
50%
60%
70%
-
5,000
10,000
15,000
20,000
FY17A FY18A FY19A FY20E FY21E FY22E
Traditional business New business (CIG) Traditional business New business (CIG)
(RMB m)
Fig 22: CSI Income statement
RMBm, unless otherwise stated FY17a FY18a FY19a FY20e FY21e FY22e
Revenue 9,244 10,585 12,042 13,859 15,878 18,089 Cost of sales and services (6,493) (7,340) (8,459) (9,753) (11,116) (12,620) Gross profit 2,750 3,245 3,583 4,106 4,761 5,469 Other income 100 64 178 205 235 267 Loss from derecognition of financial assets - (7) (5) (5) (6) (7) Impairment loss, net of reversal (26) (35) (75) (86) (99) (113) Other gains or losses (4) (6) (35) (40) (46) (53) Selling and distribution costs (370) (496) (618) (711) (814) (928) Administrative expenses (1,086) (1,091) (1,196) (1,376) (1,575) (1,794) Research and development costs (567) (739) (809) (932) (1,069) (1,218) Other expenses (82) (68) (59) (68) (78) (88) EBIT 716 866 965 1,093 1,309 1,536 Depreciation & amortisation 178 192 298 273 261 251 EBITDA 894 1,058 1,264 1,366 1,570 1,787 Finance costs (103) (118) (166) (124) (123) (123) Associates & JCEs 20 12 (0) (0) (0) (0) Profit before tax 633 760 799 969 1,186 1,412 Income tax expense (71) (44) (42) (51) (62) (74) Non-controlling interest 4 (0) (2) (2) (2) (3) NPAT 566 716 755 916 1,121 1,335 Basic EPS (RMB) 0.2359 0.2954 0.3071 0.3489 0.4270 0.5088 Diluted EPS (RMB) 0.2311 0.2789 0.3005 0.3593 0.4361 0.5167 DPS (HKD) 0.0180 0.0215 0.0219 0.0250 0.0305 0.0364
Source: Company data, HSBC estimates

15
Equities ● IT Services 26 June 2020
in 2021-22e. We assume the lower end of CSI’s guidance as we think there is execution risk
and uncertainty in margin expansion at this point in time. Top-line growth, combined with mild
margin expansion, results in our 21% CAGR in NPAT over the forecast period.
Cash flow statement
We estimate CSI’s cash flows will grow at a similar pace to the company’s EBITDA.
The company guides to capex to remain at similar levels to 2019. We estimate capex in 2020-
22e will stay at similar levels, an estimated RMB226-240m in capex each year.
Fig 23: CSI Cash flow statement
RMBm, unless otherwise stated FY17a FY18a FY19a FY20e FY21e FY22e
Operating activities Cash generated from operations 380 243 594 816 1,172 1,353 Income tax paid (48) (112) (42) (51) (62) (74) Taxation refunded - 30 - - - - Net cash generated from operating activities 332 161 62 765 1,110 1,279 Net cash used in investing activities (234) (167) (259) (240) (232) (226) Net cash from financing activities 432 853 (46) (48) (58) (71) Net increase in cash and cash equivalents 530 847 (242) 477 819 981 Effect of foreign exchange rate changes (44) 14 6 - - - Cash and cash equivalents at beginning of the year 1,299 1,785 2,646 2,410 2,887 3,706 Cash and cash equivalents at the end of the year 1,785 2,646 2,410 2,887 3,706 4,687
Source: Company data, HSBC estimates
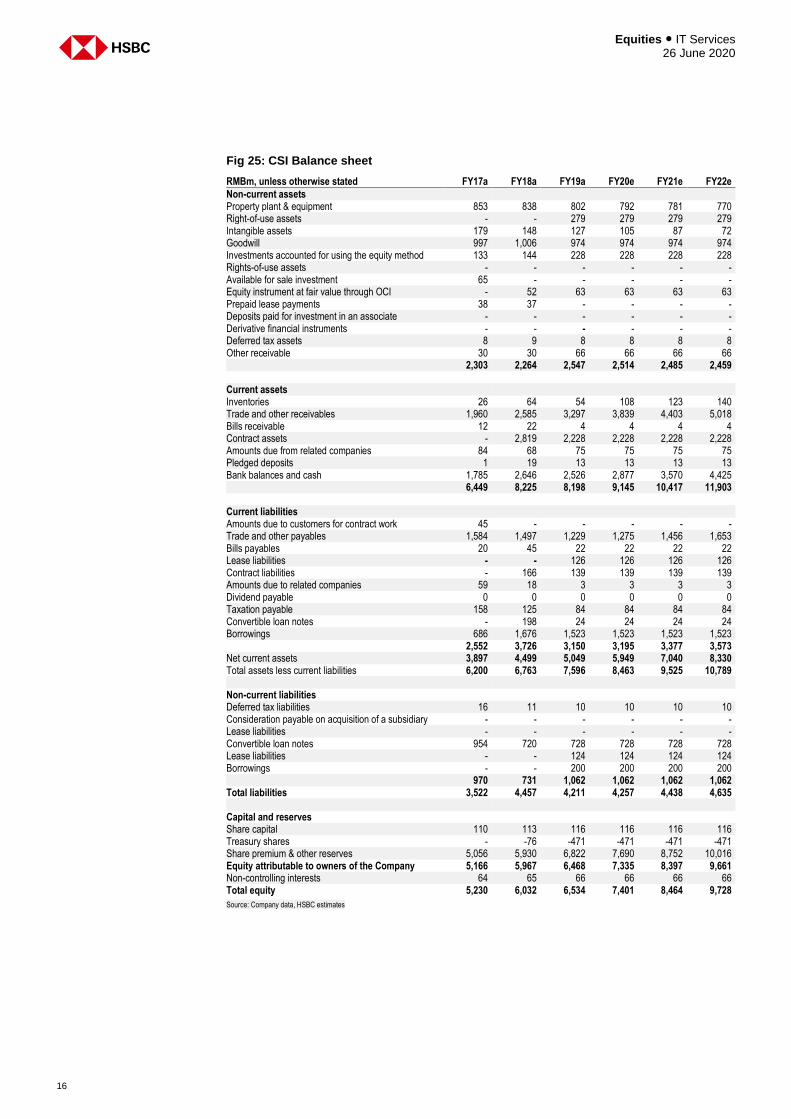
Balance sheet
CSI has a strong balance sheet with a net cash position. As a percentage of EBITDA, net cash
was 64% as at the end of 2019. We estimate this reserve will increase to 151% of EBITDA by
2022e as the company continues to generate cash flow.
Fig 24: CSI gearing profile
Source: Company data, HSBC estimates
-123%
-92%
-64%
-84%
-118%
-151%-160%
-140%
-120%
-100%
-80%
-60%
-40%
-20%
0%
-3,000
-2,500
-2,000
-1,500
-1,000
-500
-
FY17A FY18A FY19A FY20E FY21E FY22E
Net Debt/(net cash) [LHS] (Net Cash)/EBITDA [RHS]
(RMB m)
Equities ● IT Services 26 June 2020
16
Fig 25: CSI Balance sheet
RMBm, unless otherwise stated FY17a FY18a FY19a FY20e FY21e FY22e
Non-current assets Property plant & equipment 853 838 802 792 781 770 Right-of-use assets - - 279 279 279 279 Intangible assets 179 148 127 105 87 72 Goodwill 997 1,006 974 974 974 974 Investments accounted for using the equity method 133 144 228 228 228 228 Rights-of-use assets - - - - - - Available for sale investment 65 - - - - - Equity instrument at fair value through OCI - 52 63 63 63 63 Prepaid lease payments 38 37 - - - - Deposits paid for investment in an associate - - - - - - Derivative financial instruments - - - - - - Deferred tax assets 8 9 8 8 8 8 Other receivable 30 30 66 66 66 66 2,303 2,264 2,547 2,514 2,485 2,459 Current assets Inventories 26 64 54 108 123 140 Trade and other receivables 1,960 2,585 3,297 3,839 4,403 5,018 Bills receivable 12 22 4 4 4 4 Contract assets - 2,819 2,228 2,228 2,228 2,228 Amounts due from related companies 84 68 75 75 75 75 Pledged deposits 1 19 13 13 13 13 Bank balances and cash 1,785 2,646 2,526 2,877 3,570 4,425 6,449 8,225 8,198 9,145 10,417 11,903 Current liabilities Amounts due to customers for contract work 45 - - - - - Trade and other payables 1,584 1,497 1,229 1,275 1,456 1,653 Bills payables 20 45 22 22 22 22 Lease liabilities - - 126 126 126 126 Contract liabilities - 166 139 139 139 139 Amounts due to related companies 59 18 3 3 3 3 Dividend payable 0 0 0 0 0 0 Taxation payable 158 125 84 84 84 84 Convertible loan notes - 198 24 24 24 24 Borrowings 686 1,676 1,523 1,523 1,523 1,523 2,552 3,726 3,150 3,195 3,377 3,573 Net current assets 3,897 4,499 5,049 5,949 7,040 8,330 Total assets less current liabilities 6,200 6,763 7,596 8,463 9,525 10,789 Non-current liabilities Deferred tax liabilities 16 11 10 10 10 10 Consideration payable on acquisition of a subsidiary - - - - - - Lease liabilities - - - - - - Convertible loan notes 954 720 728 728 728 728 Lease liabilities - - 124 124 124 124 Borrowings - - 200 200 200 200 970 731 1,062 1,062 1,062 1,062 Total liabilities 3,522 4,457 4,211 4,257 4,438 4,635 Capital and reserves Share capital 110 113 116 116 116 116 Treasury shares - -76 -471 -471 -471 -471 Share premium & other reserves 5,056 5,930 6,822 7,690 8,752 10,016 Equity attributable to owners of the Company 5,166 5,967 6,468 7,335 8,397 9,661 Non-controlling interests 64 65 66 66 66 66 Total equity 5,230 6,032 6,534 7,401 8,464 9,728
Source: Company data, HSBC estimates
17
Equities ● IT Services 26 June 2020
Environmental, Social and Governance
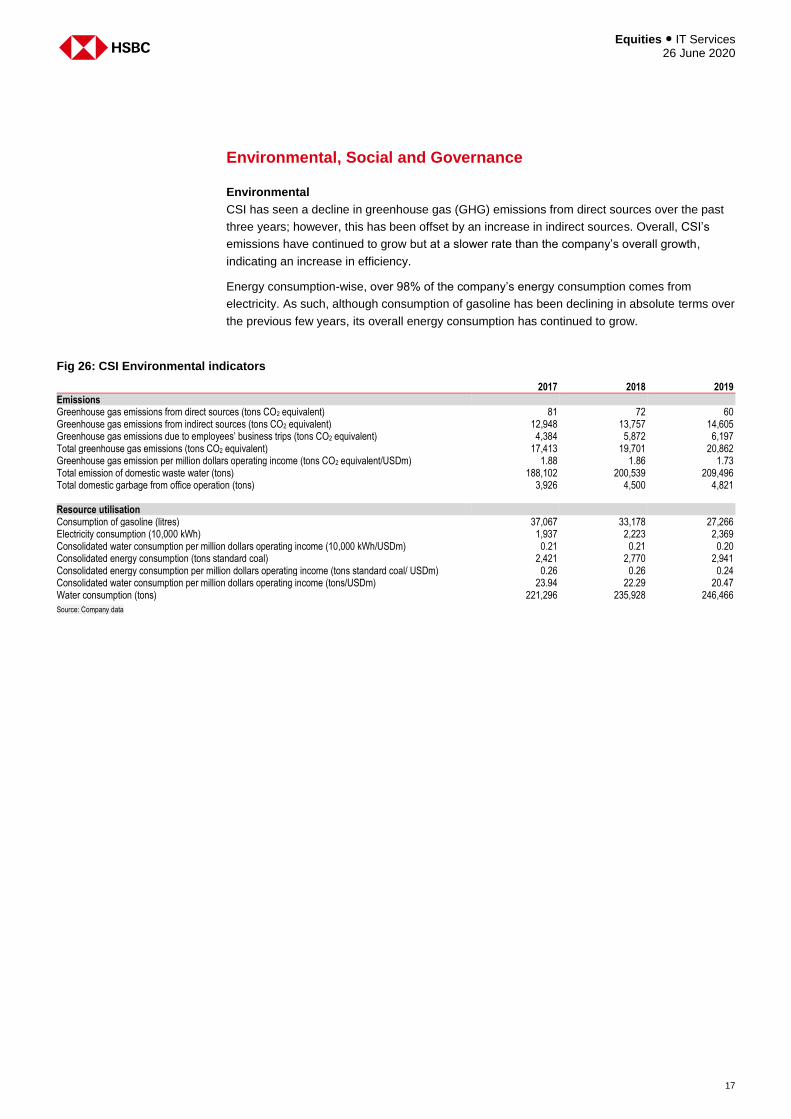
Environmental
CSI has seen a decline in greenhouse gas (GHG) emissions from direct sources over the past
three years; however, this has been offset by an increase in indirect sources. Overall, CSI’s
emissions have continued to grow but at a slower rate than the company’s overall growth,
indicating an increase in efficiency.
Energy consumption-wise, over 98% of the company’s energy consumption comes from
electricity. As such, although consumption of gasoline has been declining in absolute terms over
the previous few years, its overall energy consumption has continued to grow.
Fig 26: CSI Environmental indicators
2017 2018 2019
Emissions Greenhouse gas emissions from direct sources (tons CO2 equivalent) 81 72 60 Greenhouse gas emissions from indirect sources (tons CO2 equivalent) 12,948 13,757 14,605 Greenhouse gas emissions due to employees’ business trips (tons CO2 equivalent) 4,384 5,872 6,197 Total greenhouse gas emissions (tons CO2 equivalent) 17,413 19,701 20,862 Greenhouse gas emission per million dollars operating income (tons CO2 equivalent/USDm) 1.88 1.86 1.73 Total emission of domestic waste water (tons) 188,102 200,539 209,496 Total domestic garbage from office operation (tons) 3,926 4,500 4,821 Resource utilisation Consumption of gasoline (litres) 37,067 33,178 27,266 Electricity consumption (10,000 kWh) 1,937 2,223 2,369 Consolidated water consumption per million dollars operating income (10,000 kWh/USDm) 0.21 0.21 0.20 Consolidated energy consumption (tons standard coal) 2,421 2,770 2,941 Consolidated energy consumption per million dollars operating income (tons standard coal/ USDm) 0.26 0.26 0.24 Consolidated water consumption per million dollars operating income (tons/USDm) 23.94 22.29 20.47 Water consumption (tons) 221,296 235,928 246,466
Source: Company data
Equities ● IT Services 26 June 2020
18
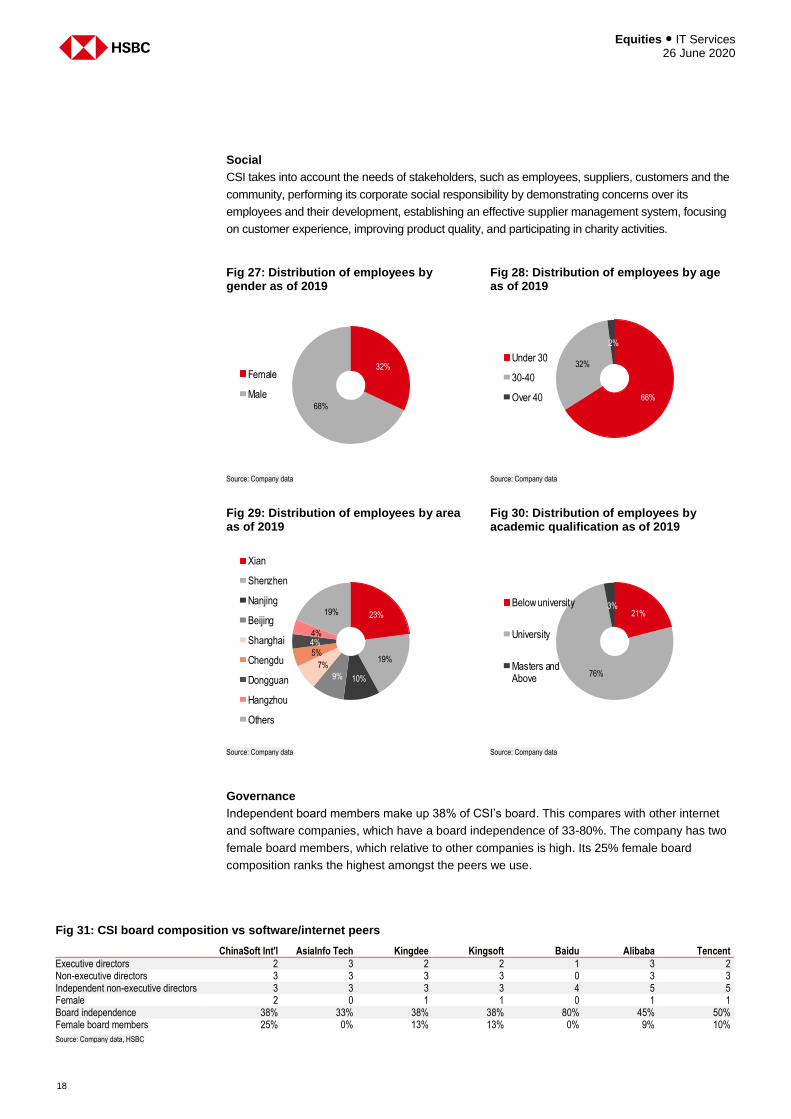
Social
CSI takes into account the needs of stakeholders, such as employees, suppliers, customers and the
community, performing its corporate social responsibility by demonstrating concerns over its
employees and their development, establishing an effective supplier management system, focusing
on customer experience, improving product quality, and participating in charity activities.
Fig 27: Distribution of employees by gender as of 2019
Fig 28: Distribution of employees by age as of 2019
Source: Company data Source: Company data
Fig 29: Distribution of employees by area as of 2019
Fig 30: Distribution of employees by academic qualification as of 2019
Source: Company data Source: Company data
Governance
Independent board members make up 38% of CSI’s board. This compares with other internet
and software companies, which have a board independence of 33-80%. The company has two
female board members, which relative to other companies is high. Its 25% female board
composition ranks the highest amongst the peers we use.
32%
68%
Female
Male 66%
32%
2%
Under 30
30-40
Over 40
23%
19%
10%9%
7%
5%4%4%
19%
Xian
Shenzhen
Nanjing
Beijing
Shanghai
Chengdu
Dongguan
Hangzhou
Others
21%
76%
3%Below university
University
Masters andAbove
Fig 31: CSI board composition vs software/internet peers
ChinaSoft Int'l AsiaInfo Tech Kingdee Kingsoft Baidu Alibaba Tencent
Executive directors 2 3 2 2 1 3 2 Non-executive directors 3 3 3 3 0 3 3 Independent non-executive directors 3 3 3 3 4 5 5 Female 2 0 1 1 0 1 1 Board independence 38% 33% 38% 38% 80% 45% 50% Female board members 25% 0% 13% 13% 0% 9% 10%
Source: Company data, HSBC
19
Equities ● IT Services 26 June 2020
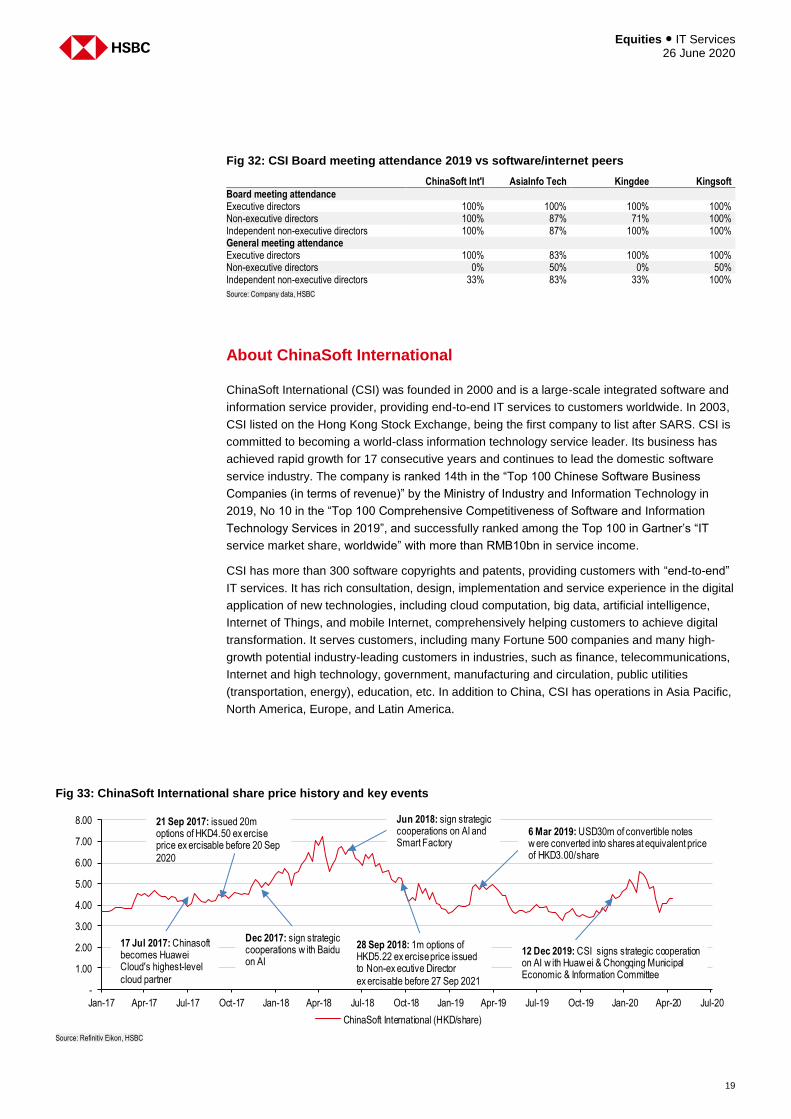
Fig 32: CSI Board meeting attendance 2019 vs software/internet peers
ChinaSoft Int'l AsiaInfo Tech Kingdee Kingsoft
Board meeting attendance Executive directors 100% 100% 100% 100% Non-executive directors 100% 87% 71% 100% Independent non-executive directors 100% 87% 100% 100% General meeting attendance Executive directors 100% 83% 100% 100% Non-executive directors 0% 50% 0% 50% Independent non-executive directors 33% 83% 33% 100%
Source: Company data, HSBC
About ChinaSoft International
ChinaSoft International (CSI) was founded in 2000 and is a large-scale integrated software and
information service provider, providing end-to-end IT services to customers worldwide. In 2003,
CSI listed on the Hong Kong Stock Exchange, being the first company to list after SARS. CSI is
committed to becoming a world-class information technology service leader. Its business has
achieved rapid growth for 17 consecutive years and continues to lead the domestic software
service industry. The company is ranked 14th in the “Top 100 Chinese Software Business
Companies (in terms of revenue)” by the Ministry of Industry and Information Technology in
2019, No 10 in the “Top 100 Comprehensive Competitiveness of Software and Information
Technology Services in 2019”, and successfully ranked among the Top 100 in Gartner’s “IT
service market share, worldwide” with more than RMB10bn in service income.
CSI has more than 300 software copyrights and patents, providing customers with “end-to-end”
IT services. It has rich consultation, design, implementation and service experience in the digital
application of new technologies, including cloud computation, big data, artificial intelligence,
Internet of Things, and mobile Internet, comprehensively helping customers to achieve digital
transformation. It serves customers, including many Fortune 500 companies and many high-
growth potential industry-leading customers in industries, such as finance, telecommunications,
Internet and high technology, government, manufacturing and circulation, public utilities
(transportation, energy), education, etc. In addition to China, CSI has operations in Asia Pacific,
North America, Europe, and Latin America.
Fig 33: ChinaSoft International share price history and key events
Source: Refinitiv Eikon, HSBC
-
1.00
2.00
3.00
4.00
5.00
6.00
7.00
8.00
Jan-17 Apr-17 Jul-17 Oct-17 Jan-18 Apr-18 Jul-18 Oct-18 Jan-19 Apr-19 Jul-19 Oct-19 Jan-20 Apr-20 Jul-20
ChinaSoft International (HKD/share)
12 Dec 2019: CSI signs strategic cooperation on AI w ith Huaw ei & Chongqing Municipal Economic & Information Committee
6 Mar 2019: USD30m of convertible notes w ere converted into shares at equivalent price of HKD3.00/share
28 Sep 2018: 1m options of HKD5.22 ex ercise price issued to Non-ex ecutive Director
ex ercisable before 27 Sep 2021
Jun 2018: sign strategic cooperations on AI and Smart Factory
Dec 2017: sign strategic cooperations w ith Baidu on AI
21 Sep 2017: issued 20m options of HKD4.50 ex ercise price ex ercisable before 20 Sep
2020
17 Jul 2017: Chinasoft becomes Huawei Cloud's highest-level
cloud partner

Equities ● IT Services 26 June 2020
20
Shareholding structure
The table below shows CSI’s management shareholdings as disclosed in the company’s latest
annual report and filings from Refinitiv Eikon.
Dr. Chen Yuhong is the Chairman and CEO of CSI. He has over 20 years of experience in the
software information industry. Prior to joining CSI on 25 April 2000, Dr. Chen worked at China
National Computer Software & Technology Service Corporation (CS&S) from October 1996 to
April 2000, subsequently was appointed vice president in June 1999 and senior vice president
of CNTC (中軟網絡信息技術有限公司) in December 2003. He has also been appointed a
director of ChinaSoft Resources Information Technology Services Limited.
Dr. Tang Zhenming is the senior vice president of CSI. He is responsible for CSI’s training
business. Dr. Tang obtained a doctorate degree in motor electronic control from the Beijing
Institute of Technology (北京理工大 學) in 1994. Prior to joining the company on 25 April 2000,
Dr. Tang was employed by the Beijing Institute of Technology Industrial Company (北京理工大
學產業總公司) as deputy general manager from May 1995 to July 1998 and by ChinaSoft Cyber
Information Technology Co., Ltd (Beijing) as deputy general manager from August 1998 to
March 2003. Dr. Tang was also employed by the American W&P Company, Beijing Office (美國
W&P公司北京辦事處) as an officer from December 1993 to March 1995.
Dr. Zhang Yaqin was appointed on 31 December 2008. He was previously the president of
Baidu from September 2014 to October 2019, in charge of autonomous and intelligent cloud
emerging business and basic technology systems, and also the chairman of the Baidu R&D
Centre in the US. Prior to joining Baidu, Dr. Zhang served various positions at Microsoft
Corporation from January 1999 to September 2014.
Mrs. Gavriella Schuster has over the past 24 years managed and deployed a number of
programmes and products, as well as licensing, pricing and go-to-market initiatives for
Microsoft Corporation.
Fig 34: ChinaSoft International Top 10 shareholders
Name of shareholder Shareholding interest Description
Chen Yuhong 15.98% Chairman & Chief Executive Officer Dr. Tang Zhenming 0.46% Senior Vice President Dr. Zhang Yaqin 0.06% Non-executive Director Mrs. Gavriella Schuster 0.04% Non-executive Director
Source: Company data, Refinitiv Eikon
Beyond the above, the top three institutional investors in CSI hold 13.2% of the company’s shares.
21
Eq
uitie
s ●
IT S
erv
ice
s
26
Ju
ne
20
20
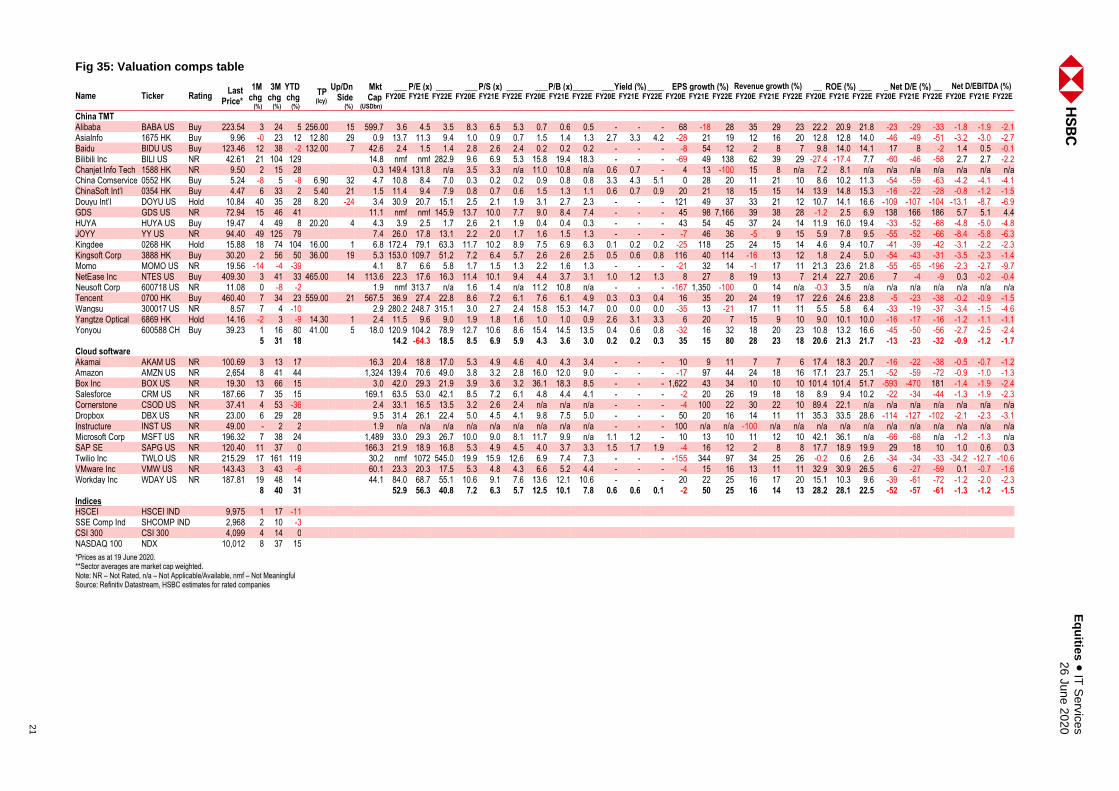
Fig 35: Valuation comps table
Name Ticker Rating Last
Price*
1M chg
(%)
3M chg
(%)
YTD chg
(%)
TP (lcy)
Up/Dn Side
(%)
Mkt Cap
(USDbn)
___ P/E (x) ____ ___ P/S (x) ____ ___ P/B (x) _____ ___Yield (%) ____ EPS growth (%) Revenue growth (%) __ ROE (%) ___ _ Net D/E (%) __ Net D/EBITDA (%) FY20E FY21E FY22E FY20E FY21E FY22E FY20E FY21E FY22E FY20E FY21E FY22E FY20E FY21E FY22E FY20E FY21E FY22E FY20E FY21E FY22E FY20E FY21E FY22E FY20E FY21E FY22E
China TMT Alibaba BABA US Buy 223.54 3 24 5 256.00 15 599.7 3.6 4.5 3.5 8.3 6.5 5.3 0.7 0.6 0.5 - - - 68 -18 28 35 29 23 22.2 20.9 21.8 -23 -29 -33 -1.8 -1.9 -2.1 AsiaInfo 1675 HK Buy 9.96 -0 23 12 12.80 29 0.9 13.7 11.3 9.4 1.0 0.9 0.7 1.5 1.4 1.3 2.7 3.3 4.2 -28 21 19 12 16 20 12.8 12.8 14.0 -46 -49 -51 -3.2 -3.0 -2.7 Baidu BIDU US Buy 123.46 12 38 -2 132.00 7 42.6 2.4 1.5 1.4 2.8 2.6 2.4 0.2 0.2 0.2 - - - -8 54 12 2 8 7 9.8 14.0 14.1 17 8 -2 1.4 0.5 -0.1 Bilibili Inc BILI US NR 42.61 21 104 129 14.8 nmf nmf 282.9 9.6 6.9 5.3 15.8 19.4 18.3 - - - -69 49 138 62 39 29 -27.4 -17.4 7.7 -60 -46 -58 2.7 2.7 -2.2 Chanjet Info Tech 1588 HK NR 9.50 2 15 28 0.3 149.4 131.8 n/a 3.5 3.3 n/a 11.0 10.8 n/a 0.6 0.7 - 4 13 -100 15 8 n/a 7.2 8.1 n/a n/a n/a n/a n/a n/a n/a China Comservice 0552 HK Buy 5.24 -8 5 -8 6.90 32 4.7 10.8 8.4 7.0 0.3 0.2 0.2 0.9 0.8 0.8 3.3 4.3 5.1 0 28 20 11 21 10 8.6 10.2 11.3 -54 -59 -63 -4.2 -4.1 -4.1 ChinaSoft Int’l 0354 HK Buy 4.47 6 33 2 5.40 21 1.5 11.4 9.4 7.9 0.8 0.7 0.6 1.5 1.3 1.1 0.6 0.7 0.9 20 21 18 15 15 14 13.9 14.8 15.3 -16 -22 -28 -0.8 -1.2 -1.5 Douyu Int’l DOYU US Hold 10.84 40 35 28 8.20 -24 3.4 30.9 20.7 15.1 2.5 2.1 1.9 3.1 2.7 2.3 - - - 121 49 37 33 21 12 10.7 14.1 16.6 -109 -107 -104 -13.1 -8.7 -6.9 GDS GDS US NR 72.94 15 46 41 11.1 nmf nmf 145.9 13.7 10.0 7.7 9.0 8.4 7.4 - - - 45 98 7,166 39 38 28 -1.2 2.5 6.9 138 166 186 5.7 5.1 4.4 HUYA HUYA US Buy 19.47 4 49 8 20.20 4 4.3 3.9 2.5 1.7 2.6 2.1 1.9 0.4 0.4 0.3 - - - 43 54 45 37 24 14 11.9 16.0 19.4 -33 -52 -68 -4.8 -5.0 -4.8 JOYY YY US NR 94.40 49 125 79 7.4 26.0 17.8 13.1 2.2 2.0 1.7 1.6 1.5 1.3 - - - -7 46 36 -5 9 15 5.9 7.8 9.5 -55 -52 -66 -8.4 -5.8 -6.3 Kingdee 0268 HK Hold 15.88 18 74 104 16.00 1 6.8 172.4 79.1 63.3 11.7 10.2 8.9 7.5 6.9 6.3 0.1 0.2 0.2 -25 118 25 24 15 14 4.6 9.4 10.7 -41 -39 -42 -3.1 -2.2 -2.3 Kingsoft Corp 3888 HK Buy 30.20 2 56 50 36.00 19 5.3 153.0 109.7 51.2 7.2 6.4 5.7 2.6 2.6 2.5 0.5 0.6 0.8 116 40 114 -16 13 12 1.8 2.4 5.0 -54 -43 -31 -3.5 -2.3 -1.4 Momo MOMO US NR 19.56 -14 -4 -39 4.1 8.7 6.6 5.8 1.7 1.5 1.3 2.2 1.6 1.3 - - - -21 32 14 -1 17 11 21.3 23.6 21.8 -55 -65 -196 -2.3 -2.7 -9.7 NetEase Inc NTES US Buy 409.30 3 41 33 465.00 14 113.6 22.3 17.6 16.3 11.4 10.1 9.4 4.4 3.7 3.1 1.0 1.2 1.3 8 27 8 19 13 7 21.4 22.7 20.6 7 -4 -9 0.3 -0.2 -0.4 Neusoft Corp 600718 US NR 11.08 0 -8 -2 1.9 nmf 313.7 n/a 1.6 1.4 n/a 11.2 10.8 n/a - - - -167 1,350 -100 0 14 n/a -0.3 3.5 n/a n/a n/a n/a n/a n/a n/a Tencent 0700 HK Buy 460.40 7 34 23 559.00 21 567.5 36.9 27.4 22.8 8.6 7.2 6.1 7.6 6.1 4.9 0.3 0.3 0.4 16 35 20 24 19 17 22.6 24.6 23.8 -5 -23 -38 -0.2 -0.9 -1.5 Wangsu 300017 US NR 8.57 7 4 -10 2.9 280.2 248.7 315.1 3.0 2.7 2.4 15.8 15.3 14.7 0.0 0.0 0.0 -35 13 -21 17 11 11 5.5 5.8 6.4 -33 -19 -37 -3.4 -1.5 -4.6 Yangtze Optical 6869 HK Hold 14.16 -2 3 -9 14.30 1 2.4 11.5 9.6 9.0 1.9 1.8 1.6 1.0 1.0 0.9 2.6 3.1 3.3 6 20 7 15 9 10 9.0 10.1 10.0 -16 -17 -16 -1.2 -1.1 -1.1 Yonyou 600588 CH Buy 39.23 1 16 80 41.00 5 18.0 120.9 104.2 78.9 12.7 10.6 8.6 15.4 14.5 13.5 0.4 0.6 0.8 -32 16 32 18 20 23 10.8 13.2 16.6 -45 -50 -56 -2.7 -2.5 -2.4 5 31 18 14.2 -64.3 18.5 8.5 6.9 5.9 4.3 3.6 3.0 0.2 0.2 0.3 35 15 80 28 23 18 20.6 21.3 21.7 -13 -23 -32 -0.9 -1.2 -1.7 Cloud software Akamai AKAM US NR 100.69 3 13 17 16.3 20.4 18.8 17.0 5.3 4.9 4.6 4.0 4.3 3.4 - - - 10 9 11 7 7 6 17.4 18.3 20.7 -16 -22 -38 -0.5 -0.7 -1.2 Amazon AMZN US NR 2,654 8 41 44 1,324 139.4 70.6 49.0 3.8 3.2 2.8 16.0 12.0 9.0 - - - -17 97 44 24 18 16 17.1 23.7 25.1 -52 -59 -72 -0.9 -1.0 -1.3 Box Inc BOX US NR 19.30 13 66 15 3.0 42.0 29.3 21.9 3.9 3.6 3.2 36.1 18.3 8.5 - - - 1,622 43 34 10 10 10 101.4 101.4 51.7 -593 -470 181 -1.4 -1.9 -2.4 Salesforce CRM US NR 187.66 7 35 15 169.1 63.5 53.0 42.1 8.5 7.2 6.1 4.8 4.4 4.1 - - - -2 20 26 19 18 18 8.9 9.4 10.2 -22 -34 -44 -1.3 -1.9 -2.3 Cornerstone CSOD US NR 37.41 4 53 -36 2.4 33.1 16.5 13.5 3.2 2.6 2.4 n/a n/a n/a - - - -4 100 22 30 22 10 89.4 22.1 n/a n/a n/a n/a n/a n/a n/a Dropbox DBX US NR 23.00 6 29 28 9.5 31.4 26.1 22.4 5.0 4.5 4.1 9.8 7.5 5.0 - - - 50 20 16 14 11 11 35.3 33.5 28.6 -114 -127 -102 -2.1 -2.3 -3.1 Instructure INST US NR 49.00 - 2 2 1.9 n/a n/a n/a n/a n/a n/a n/a n/a n/a - - - 100 n/a n/a -100 n/a n/a n/a n/a n/a n/a n/a n/a n/a n/a n/a Microsoft Corp MSFT US NR 196.32 7 38 24 1,489 33.0 29.3 26.7 10.0 9.0 8.1 11.7 9.9 n/a 1.1 1.2 - 10 13 10 11 12 10 42.1 36.1 n/a -66 -68 n/a -1.2 -1.3 n/a SAP SE SAPG US NR 120.40 11 37 0 166.3 21.9 18.9 16.8 5.3 4.9 4.5 4.0 3.7 3.3 1.5 1.7 1.9 -4 16 12 2 8 8 17.7 18.9 19.9 29 18 10 1.0 0.6 0.3 Twilio Inc TWLO US NR 215.29 17 161 119 30.2 nmf 1072 545.0 19.9 15.9 12.6 6.9 7.4 7.3 - - - -155 344 97 34 25 26 -0.2 0.6 2.6 -34 -34 -33 -34.2 -12.7 -10.6 VMware Inc VMW US NR 143.43 3 43 -6 60.1 23.3 20.3 17.5 5.3 4.8 4.3 6.6 5.2 4.4 - - - -4 15 16 13 11 11 32.9 30.9 26.5 6 -27 -59 0.1 -0.7 -1.6 Workday Inc WDAY US NR 187.81 19 48 14 44.1 84.0 68.7 55.1 10.6 9.1 7.6 13.6 12.1 10.6 - - - 20 22 25 16 17 20 15.1 10.3 9.6 -39 -61 -72 -1.2 -2.0 -2.3 8 40 31 52.9 56.3 40.8 7.2 6.3 5.7 12.5 10.1 7.8 0.6 0.6 0.1 -2 50 25 16 14 13 28.2 28.1 22.5 -52 -57 -61 -1.3 -1.2 -1.5 Indices HSCEI HSCEI IND 9,975 1 17 -11 SSE Comp Ind SHCOMP IND 2,968 2 10 -3 CSI 300 CSI 300 4,099 4 14 0 NASDAQ 100 NDX 10,012 8 37 15
*Prices as at 19 June 2020. **Sector averages are market cap weighted. Note: NR – Not Rated, n/a – Not Applicable/Available, nmf – Not Meaningful Source: Refinitiv Datastream, HSBC estimates for rated companies
Equities ● IT Services 26 June 2020
22
Disclosure appendix
Analyst Certification
The following analyst(s), economist(s), or strategist(s) who is(are) primarily responsible for this report, including any analyst(s)
whose name(s) appear(s) as author of an individual section or sections of the report and any analyst(s) named as the covering
analyst(s) of a subsidiary company in a sum-of-the-parts valuation certifies(y) that the opinion(s) on the subject security(ies) or
issuer(s), any views or forecasts expressed in the section(s) of which such individual(s) is(are) named as author(s), and any other
views or forecasts expressed herein, including any views expressed on the back page of the research report, accurately reflect
their personal view(s) and that no part of their compensation was, is or will be directly or indirectly related to the specific
recommendation(s) or views contained in this research report: Wei Sim and Neale Anderson
Important disclosures
Equities: Stock ratings and basis for financial analysis
HSBC and its affiliates, including the issuer of this report (“HSBC”) believes an investor's decision to buy or sell a stock should
depend on individual circumstances such as the investor's existing holdings, risk tolerance and other considerations and that
investors utilise various disciplines and investment horizons when making investment decisions. Ratings should not be used or
relied on in isolation as investment advice. Different securities firms use a variety of ratings terms as well as different rating
systems to describe their recommendations and therefore investors should carefully read the definitions of the ratings used in
each research report. Further, investors should carefully read the entire research report and not infer its contents from the rating
because research reports contain more complete information concerning the analysts' views and the basis for the rating.
From 23rd March 2015 HSBC has assigned ratings on the following basis:
The target price is based on the analyst’s assessment of the stock’s actual current value, although we expect it to take six to 12
months for the market price to reflect this. When the target price is more than 20% above the current share price, the stock will
be classified as a Buy; when it is between 5% and 20% above the current share price, the stock may be classified as a Buy or a
Hold; when it is between 5% below and 5% above the current share price, the stock will be classified as a Hold; when it is between
5% and 20% below the current share price, the stock may be classified as a Hold or a Reduce; and when it is more than 20%
below the current share price, the stock will be classified as a Reduce.
Our ratings are re-calibrated against these bands at the time of any 'material change' (initiation or resumption of coverage, change
in target price or estimates).
Upside/Downside is the percentage difference between the target price and the share price.
Prior to this date, HSBC’s rating structure was applied on the following basis:
For each stock we set a required rate of return calculated from the cost of equity for that stock’s domestic or, as appropriate,
regional market established by our strategy team. The target price for a stock represented the value the analyst expected the
stock to reach over our performance horizon. The performance horizon was 12 months. For a stock to be classified as Overweight,
the potential return, which equals the percentage difference between the current share price and the target price, including the
forecast dividend yield when indicated, had to exceed the required return by at least 5 percentage points over the succeeding 12
months (or 10 percentage points for a stock classified as Volatile*). For a stock to be classified as Underweight, the stock was
expected to underperform its required return by at least 5 percentage points over the succeeding 12 months (or 10 percentage
points for a stock classified as Volatile*). Stocks between these bands were classified as Neutral.
*A stock was classified as volatile if its historical volatility had exceeded 40%, if the stock had been listed for less than 12 months
(unless it was in an industry or sector where volatility is low) or if the analyst expected significant volatility. However, stocks which
we did not consider volatile may in fact also have behaved in such a way. Historical volatility was defined as the past month's
average of the daily 365-day moving average volatilities. In order to avoid misleadingly frequent changes in rating, however,
volatility had to move 2.5 percentage points past the 40% benchmark in either direction for a stock's status to change.

23
Equities ● IT Services 26 June 2020
Rating distribution for long-term investment opportunities
As of 25 June 2020, the distribution of all independent ratings published by HSBC is as follows:
For the purposes of the distribution above the following mapping structure is used during the transition from the previous to current rating
models: under our previous model, Overweight = Buy, Neutral = Hold and Underweight = Sell; under our current model Buy = Buy, Hold
= Hold and Reduce = Sell. For rating definitions under both models, please see “Stock ratings and basis for financial analysis” above.
For the distribution of non-independent ratings published by HSBC, please see the disclosure page available at
http://www.hsbcnet.com/gbm/financial-regulation/investment-recommendations-disclosures.
Share price and rating changes for long-term investment opportunities
ChinaSoft (0354.HK) share price performance HKD Vs
HSBC rating history
Rating & target price history
From To Date Analyst
N/A Buy 08 Jul 2019 Colin Liu
Target price Value Date Analyst
Price 1 5.59 08 Jul 2019 Colin Liu
Source: HSBC
Source: HSBC
To view a list of all the independent fundamental ratings disseminated by HSBC during the preceding 12-month period, please
use the following links to access the disclosure page:
Clients of Global Research and Global Banking and Markets: www.research.hsbc.com/A/Disclosures
Clients of HSBC Private Banking: www.research.privatebank.hsbc.com/Disclosures
HSBC & Analyst disclosures
Disclosure checklist
Company Ticker Recent price Price date Disclosure
CHINASOFT 0354.HK 4.51 24 Jun 2020 4, 6, 7
Source: HSBC
1 HSBC has managed or co-managed a public offering of securities for this company within the past 12 months.
2 HSBC expects to receive or intends to seek compensation for investment banking services from this company in the next 3
months.
3 At the time of publication of this report, HSBC Securities (USA) Inc. is a Market Maker in securities issued by this
company.
4 As of 31 May 2020, HSBC beneficially owned 1% or more of a class of common equity securities of this company.
5 As of 30 April 2020, this company was a client of HSBC or had during the preceding 12 month period been a client of
and/or paid compensation to HSBC in respect of investment banking services.
6 As of 30 April 2020, this company was a client of HSBC or had during the preceding 12 month period been a client of
and/or paid compensation to HSBC in respect of non-investment banking securities-related services.
2
3
4
5
6
7
8
Jun-
15
Jun-
16
Jun-
17
Jun-
18
Jun-
19
Jun-
20
Buy 55% ( 31% of these provided with Investment Banking Services )
Hold 36% ( 31% of these provided with Investment Banking Services )
Sell 9% ( 21% of these provided with Investment Banking Services )
Equities ● IT Services 26 June 2020
24
7 As of 30 April 2020, this company was a client of HSBC or had during the preceding 12 month period been a client of
and/or paid compensation to HSBC in respect of non-securities services.
8 A covering analyst/s has received compensation from this company in the past 12 months.
9 A covering analyst/s or a member of his/her household has a financial interest in the securities of this company, as
detailed below.
10 A covering analyst/s or a member of his/her household is an officer, director or supervisory board member of this
company, as detailed below.
11 At the time of publication of this report, HSBC is a non-US Market Maker in securities issued by this company and/or in
securities in respect of this company
12 As of 18 Jun 2020, HSBC beneficially held a net long position of more than 0.5% of this company’s total issued share
capital, calculated according to the SSR methodology.
13 As of 18 Jun 2020, HSBC beneficially held a net short position of more than 0.5% of this company’s total issued share
capital, calculated according to the SSR methodology. HSBC and its affiliates will from time to time sell to and buy from customers the securities/instruments, both equity and debt
(including derivatives) of companies covered in HSBC Research on a principal or agency basis or act as a market maker or
liquidity provider in the securities/instruments mentioned in this report.
Analysts, economists, and strategists are paid in part by reference to the profitability of HSBC which includes investment banking,
sales & trading, and principal trading revenues.
Whether, or in what time frame, an update of this analysis will be published is not determined in advance.
Non-U.S. analysts may not be associated persons of HSBC Securities (USA) Inc, and therefore may not be subject to FINRA
Rule 2241 or FINRA Rule 2242 restrictions on communications with the subject company, public appearances and trading
securities held by the analysts.
Economic sanctions imposed by the EU and OFAC prohibit transacting or dealing in new debt or equity of Russian SSI entities.
This report does not constitute advice in relation to any securities issued by Russian SSI entities on or after July 16 2014 and as
such, this report should not be construed as an inducement to transact in any sanctioned securities.
For disclosures in respect of any company mentioned in this report, please see the most recently published report on that company
available at www.hsbcnet.com/research. HSBC Private Banking clients should contact their Relationship Manager for queries
regarding other research reports. In order to find out more about the proprietary models used to produce this report, please contact
the authoring analyst.
Additional disclosures
1 This report is dated as at 26 June 2020.
2 All market data included in this report are dated as at close 19 June 2020, unless a different date and/or a specific time of
day is indicated in the report.
3 HSBC has procedures in place to identify and manage any potential conflicts of interest that arise in connection with its
Research business. HSBC's analysts and its other staff who are involved in the preparation and dissemination of
Research operate and have a management reporting line independent of HSBC's Investment Banking business.
Information Barrier procedures are in place between the Investment Banking, Principal Trading, and Research businesses
to ensure that any confidential and/or price sensitive information is handled in an appropriate manner.
4 You are not permitted to use, for reference, any data in this document for the purpose of (i) determining the interest
payable, or other sums due, under loan agreements or under other financial contracts or instruments, (ii) determining the
price at which a financial instrument may be bought or sold or traded or redeemed, or the value of a financial instrument,
and/or (iii) measuring the performance of a financial instrument or of an investment fund.
Production & distribution disclosures
1. This report was produced and signed off by the author on 25 Jun 2020 11:33 GMT.
2. In order to see when this report was first disseminated please see the disclosure page available at
https://www.research.hsbc.com/R/34/9j9TbPR
25
Equities ● IT Services 26 June 2020
Disclaimer Legal entities as at 22 June 2020
‘UAE’ HSBC Bank Middle East Limited, Dubai; ‘HK’ The Hongkong and Shanghai Banking Corporation Limited, Hong Kong;
‘TW’ HSBC Securities (Taiwan) Corporation Limited; 'CA' HSBC Securities (Canada) Inc.; HSBC France, S.A., Madrid, Milan,
Stockholm; ‘DE’ HSBC Trinkaus & Burkhardt AG, Düsseldorf; 000 HSBC Bank (RR), Moscow; ‘IN’ HSBC Securities and
Capital Markets (India) Private Limited, Mumbai; ‘JP’ HSBC Securities (Japan) Limited, Tokyo; ‘EG’ HSBC Securities Egypt
SAE, Cairo; ‘CN’ HSBC Investment Bank Asia Limited, Beijing Representative Office; The Hongkong and Shanghai Banking
Corporation Limited, Singapore Branch; The Hongkong and Shanghai Banking Corporation Limited, Seoul Securities
Branch; The Hongkong and Shanghai Banking Corporation Limited, Seoul Branch; HSBC Securities (South Africa) (Pty)
Ltd, Johannesburg; HSBC Bank plc, London, Tel Aviv; ‘US’ HSBC Securities (USA) Inc, New York; HSBC Yatirim Menkul
Degerler AS, Istanbul; HSBC México, SA, Institución de Banca Múltiple, Grupo Financiero HSBC; HSBC Bank Australia
Limited; HSBC Bank Argentina SA; HSBC Saudi Arabia Limited; The Hongkong and Shanghai Banking Corporation
Limited, New Zealand Branch incorporated in Hong Kong SAR; The Hongkong and Shanghai Banking Corporation Limited,
Bangkok Branch; PT Bank HSBC Indonesia; HSBC Qianhai Securities Limited; Banco HSBC S.A.
Issuer of report
The Hongkong and Shanghai Banking Corporation
Limited
Level 19, 1 Queen’s Road Central
Hong Kong SAR
Telephone: +852 2843 9111
Fax: +852 2596 0200
Website: www.research.hsbc.com
This document has been issued by The Hongkong and Shanghai Banking Corporation Limited (“HSBC”) in the conduct of its Hong Kong regulated business for the information of its institutional and
professional investor (as defined by Securities and Future Ordinance (Chapter 571)) customers; it is not intended for and should not be distributed to retail customers in Hong Kong. The Hongkong and
Shanghai Banking Corporation Limited is regulated by the Hong Kong Monetary Authority. All enquires by recipients in Hong Kong must be directed to your HSBC contact in Hong Kong. If it is received by
a customer of an affiliate of HSBC, its provision to the recipient is subject to the terms of business in place between the recipient and such affiliate. This document is not and should not be construed as an
offer to sell or the solicitation of an offer to purchase or subscribe for any investment. HSBC has based this document on information obtained from sources it believes to be reliable but which it has not
independently verified; HSBC makes no guarantee, representation or warranty and accepts no responsibility or liability as to its accuracy or completeness. Expressions of opinion are those of the Research
Division of HSBC only and are subject to change without notice. From time to time research analysts conduct site visits of covered issuers. HSBC policies prohibit research analysts from accepting payment
or reimbursement for travel expenses from the issuer for such visits. HSBC and its affiliates and/or their officers, directors and employees may have positions in any securities mentioned in this document
(or in any related investment) and may from time to time add to or dispose of any such securities (or investment). HSBC and its affiliates may act as market maker or have assumed an underwriting
commitment in the securities of companies discussed in this document (or in related investments), may sell them to or buy them from customers on a principal basis and may also perform or seek to perform
investment banking or underwriting services for or relating to those companies.
HSBC Securities (USA) Inc. accepts responsibility for the content of this research report prepared by its non-US foreign affiliate. All U.S. persons receiving and/or accessing this report and
wishing to effect transactions in any security discussed herein should do so with HSBC Securities (USA) Inc. in the United States and not with its non-US foreign affiliate, the issuer of this report.
In the UK this report may only be distributed to persons of a kind described in Article 19(5) of the Financial Services and Markets Act 2000 (Financial Promotion) Order 2005. The protections
afforded by the UK regulatory regime are available only to those dealing with a representative of HSBC Bank plc in the UK. In Singapore, this publication is distributed by The Hongkong and
Shanghai Banking Corporation Limited, Singapore Branch for the general information of institutional investors or other persons specified in Sections 274 and 304 of the Securities and Futures
Act (Chapter 289) (“SFA”) and accredited investors and other persons in accordance with the conditions specified in Sections 275 and 305 of the SFA. Only Economics or Currencies reports
are intended for distribution to a person who is not an Accredited Investor, Expert Investor or Institutional Investor as defined in SFA. The Hongkong and Shanghai Banking Corporation Limited,
Singapore Branch accepts legal responsibility for the contents of reports pursuant to Regulation 32C(1)(d) of the Financial Advisers Regulations. This publication is not a prospectus as defined
in the SFA. This publication is not a prospectus as defined in the SFA. It may not be further distributed in whole or in part for any purpose. The Hongkong and Shanghai Banking Corporation
Limited Singapore Branch is regulated by the Monetary Authority of Singapore. Recipients in Singapore should contact a "Hongkong and Shanghai Banking Corporation Limited, Singapore
Branch" representative in respect of any matters arising from, or in connection with this report. Please refer to The Hongkong and Shanghai Banking Corporation Limited Singapore Branch’s
website at www.business.hsbc.com.sg for contact details. In Australia, this publication has been distributed by The Hongkong and Shanghai Banking Corporation Limited (ABN 65 117 925 970,
AFSL 301737) for the general information of its “wholesale” customers (as defined in the Corporations Act 2001). Where distr ibuted to retail customers, this research is distributed by HSBC
Bank Australia Limited (ABN 48 006 434 162, AFSL No. 232595). These respective entities make no representations that the products or services mentioned in this document are available to
persons in Australia or are necessarily suitable for any particular person or appropriate in accordance with local law. No consideration has been given to the particular investment objectives,
financial situation or particular needs of any recipient. This publication is distributed in New Zealand by The Hongkong and Shanghai Banking Corporation Limited, New Zealand Branch
incorporated in Hong Kong SAR.
In Japan, this publication has been distributed by HSBC Securities (Japan) Limited. It may not be further distributed in whole or in part for any purpose. In Korea, this publication is distributed
by The Hongkong and Shanghai Banking Corporation Limited, Seoul Securities Branch ("HBAP SLS") for the general information of professional investors specified in Article 9 of the Financial
Investment Services and Capital Markets Act (“FSCMA”). This publication is not a prospectus as defined in the FSCMA. It may not be further distributed in whole or in part for any purpose.
HBAP SLS is regulated by the Financial Services Commission and the Financial Supervisory Service of Korea.
In Canada, this document has been distributed by HSBC Securities (Canada) Inc. (member IIROC), and/or its affiliates. The information contained herein is under no circumstances to be
construed as investment advice in any province or territory of Canada and is not tailored to the needs of the recipient. No securities commission or similar regulatory authority in Canada has
reviewed or in any way passed judgment upon these materials, the information contained herein or the merits of the securities described herein, and any representation to the contrary is an
offense. In Brazil, this document has been distributed by Banco HSBC S.A. ("HSBC Brazil"), and/or its affiliates. As required by Instruction No. 598/18 of the Securities and Exchange Commission
of Brazil (Comissão de Valores Mobiliários), potential conflicts of interest concerning (i) HSBC Brazil and/or its affiliates; and (ii) the analyst(s) responsible for authoring this report are stated on
the chart above labelled "HSBC & Analyst Disclosures".
If you are an HSBC Private Banking (“PB”) customer with approval for receipt of relevant research publications by an applicable HSBC legal entity, you are eligible to receive this publication. To
be eligible to receive such publications, you must have agreed to the applicable HSBC entity’s terms and conditions (“KRC Terms”) for access to the KRC, and the terms and conditions of any
other internet banking service offered by that HSBC entity through which you will access research publications using the KRC. Distribution of this publication is the sole responsibility of the
HSBC entity with whom you have agreed the KRC Terms.
If you do not meet the aforementioned eligibility requirements please disregard this publication and, if you are a customer of PB, please notify your Relationship Manager. Receipt of research publications is
strictly subject to the KRC Terms, which can be found at https://research.privatebank.hsbc.com/ – we draw your attention also to the provisions contained in the Important Notes section therein.
© Copyright 2020, The Hongkong and Shanghai Banking Corporation Limited, ALL RIGHTS RESERVED. No part of this publication may be reproduced, stored in a retrieval system, or
transmitted, on any form or by any means, electronic, mechanical, photocopying, recording, or otherwise, without the prior written permission of The Hongkong and Shanghai Banking Corporation
Limited. MCI (P) 077/12/2019, MCI (P) 016/02/2020
[1149424]
Europe
Analyst Nicolas Cote-Colisson +44 20 7991 6826 [email protected]
Analyst Antonin Baudry +33 1 56 52 43 25 [email protected]
Analyst Christian Fangmann +49 211 910 2002 [email protected]
Senior Analyst, Telecoms Services & Infrastructure Luigi Minerva +44 20 7991 6928 [email protected]
Analyst Olivier Moral +33 1 5652 4322 [email protected]
Analyst Adam Fox-Rumley, CFA +44 20 7991 6819 [email protected]
Americas
Analyst Christopher A Recouso +1 212 525 2279 [email protected]
Analyst Sunil Rajgopal +1 212 525 0267 [email protected]
Global Emerging Markets (GEMs)
Analyst Hervé Drouet +44 20 7991 6827 [email protected]
Asia
Head of Internet Research, Asia Pacific Binnie Wong +852 2822 2590 [email protected]
Head of Telecoms Research, Asia Pacific Neale Anderson +852 2996 6716 [email protected]
Head of Technology Research, Asia Pacific Frank Lee +852 2996 6916 [email protected]
Head of Research, India Yogesh Aggarwal +91 22 2268 1246 [email protected]
Analyst Vivek Gedda +91 22 6164 0693 [email protected]
Analyst Abhishek Pathak +91 22 6164 0690 [email protected]
Head of Research, Korea Ricky Seo +822 37068777 [email protected]
Analyst Darpan Thakkar +91 22 6164 0695 [email protected]
Analyst Piyush Choudhary, CFA +65 6658 0607 [email protected]
Analyst Wei Sim +852 2996 6602 [email protected]
Analyst Will Cho +822 3706 8765 [email protected]
Analyst Carol Juan +886 2 6631 2862 [email protected]
Associate Angus Lin +852 2996 6584 [email protected]
Associate Charlotte Wei +852 2996 6539 [email protected]
Associate Ritchie Sun +852 28224392 [email protected]
Associate Peishan Wang +852 3941 7008 [email protected]
Analyst, Internet Research Carson Lo, CFA +852 2822 4337 [email protected] Associate Cleo Zhang +852 2914 9935 [email protected] Associate Carol Hu +8862 6631 2869 [email protected]
Associate Chris Lee +8862 6631 2865 [email protected]
Associate Junhyun Kim +822 3706 8763 [email protected]
Specialist Sales
James Britton +44 207 991 5503 [email protected]
Kubilay Yalcin +49 211 9104880 [email protected]
Global Telecoms, Media & Technology Research Team