Embed Size (px)
Citation preview
1
This accepted author manuscript is copyrighted and published by
Elsevier. It is posted here by agreement between Elsevier and MTA.
The definitive version of the text was subsequently published in
Engineering Fracture Mechanics, 149, 2015, DOI:
10.1016/j.engfracmech.2015.06.060. Available under license CC-BY-
NC-ND.
Novel experimental procedure and determination of full displacement fields of
delaminating composite layer interfaces for evaluation of the mode II cohesive
law
Gergely Czél1,2*, Meisam Jalalvand1, Michael R. Wisnom1, Luis P. Canal3, Carlos D.
González4,5, Javier LLorca4,5
1Advanced Composites Centre for Innovation and Science, University of Bristol, Queen's Building,
BS8 1TR, Bristol, United Kingdom 2MTA–BME Research Group for Composite Science and Technology, Budapest University of
Technology and Economics, Műegyetem rkp. 3., H-1111 Budapest, Hungary 3Laboratory for Polymer and Composite Technology (LTC), Ecole Polytechnique Fédérale de
Lausanne (EPFL), Station 12, CH-1015 Lausanne, Switzerland 4 IMDEA Materials Institute, C/ Eric Kandel 2, 28906, Getafe, Madrid, Spain
5Department of Materials Science, Polytechnic University of Madrid, E. T. S. de Ingenieros de
Caminos. 28040 - Madrid, Spain
* corresponding author, e-mail: [email protected], Tel.: +44 (0) 117 33 15311,
Fax: +44 (0) 117 95 45360
Abstract
A novel mode II fracture test setup based on a simple tensile loading scenario with a
discontinuous ply specimen is proposed in the paper as the first step towards determination of the
cohesive law of composite layer interfaces. Key outputs of the procedure are the full displacement
fields obtained by correlation of high resolution SEM images taken during in-situ tensile tests.
Analysis of the full displacement fields at subsequent stress levels allow for unique analysis of the
damage zone and direct determination of the displacement jumps across the interface. The next

2
phase of the work is the evaluation of the shear stresses at the interface necessary to determine the
cohesive law.
Keywords:
1. Composites; 2. Cohesive zone modelling; 3. Delamination; In-situ SEM testing
Nomenclature
3PB three point bending
COD crack opening displacements
DCB double cantilever beam
DIC digital image correlation
EB electron beam
ENF end notched flexure
LVDT linear variable differential transformers
MMB mixed mode bending
SEM scanning electron microscope
UD unidirectional
VCCT virtual crack closure technique
3
1. Introduction
Cohesive crack models are one of the classical approaches for predicting and modelling
delamination in layered structures such as adhesively bonded joints [1]-[4] and composite laminates
[5]-[18]. The modelling technique was initially developed and implemented in FE codes for isotropic
materials such as concrete and metals [19]-[22], but spread quickly to composites. The main
advantage of this approach over alternative analysis techniques e.g. the virtual crack closure
technique (VCCT) is that it includes a nonlinear constitutive material model (cohesive law) that
combines crack initiation [23] and propagation [24] criteria and as a result, it can be applied for
problems with a variety of loading modes. Cohesive interface elements normally have zero thickness
and the interlaminar stress components are coupled to the displacement discontinuities (jumps)
across the faces of the deformed element through the cohesive law. Different types of cohesive laws
with different shapes e.g. bilinear [10], parabolic [25], exponential [26], trapezoidal [27] etc. were
proposed for different materials and validated against experiments. The structures’ modelled
responses were mostly in good agreement with the test results, and it seems that cohesive laws with
different shapes can give similar structural response [25],[28] especially if the crack is much longer
than the damage process zone. Most of the modellers therefore use the simplest bilinear shape for
the cohesive law and pay attention only to the interfacial shear strength and the fracture toughness.
Although, it has been shown that in some problems, the shape of the cohesive law can affect the
structural response significantly [29]-[31], the actual shape for composite layer interfaces was not
4
investigated extensively to date due to difficulties in measuring the very small displacements around
the crack tip.
Some researchers studied the cohesive law experimentally with less assumptions. This section
aims at giving a short overview of the most important test configurations applied. Sorensen et. al.
[32],[33] investigated the effect of fibre-bridging during mixed mode delamination propagation. They
derived mixed mode cohesive laws from J-integral values experimentally measured on special
specimens. Their experimental setup consists of a cantilever beam (supported with rollers against
rotation) incorporating an interlaminar notch at one end, where both layers are loaded with pure but
different bending moments. The displacements at the initial notch tip were measured with linear
variable differential transformers (LVDT). This complicated but mechanically sound setup is
activated by a cable and several rollers. De Moura et al [34] proposed a method for determination of
cohesive laws of adhesives experimentally using simple double cantilever beam (DCB) specimens but
it can only be applied for mode I loading. The crack opening displacements (COD) were monitored
with optical sensors. Fernandes et al [35] used end notched flexure (ENF) specimens under three
point bending to determine the mode II cohesive laws of composite bonded joints. The applied
external load and displacement were measured and the J-integral was worked out. Then, the cohesive
law was obtained based on derivation of the variation of J-integral versus the measured displacement
jump at the crack tip. The displacements of the initial crack tip were monitored with a digital image
correlation (DIC) system. Dourado et al [36] also executed ENF tests on carbon/epoxy composite
samples and determined the mode II cohesive law of the interface inversely by fitting FE data
(generated with different piecewise linear cohesive law parameters) to their test graphs. Cui et al [37]
applied the advanced but complicated mixed mode bending (MMB) test alignment to evaluate the
mixed mode constitutive laws of a 280 µm thick epoxy adhesive layer between woven carbon/epoxy
composite plates. The constitutive laws were calculated using a J-integral approach, and DIC
5
monitoring of the crack opening displacements at the initial position of the pre-crack in the
specimen.
The short review of the literature shows that no simple test setup was applied for determination
of mode II cohesive laws, and the deformations of the damage process zone were not analysed in
detail. Although DIC has been applied in some of the most recent studies [35],[37], this was only on
the macroscopic scale to record displacements at the initial crack tip and therefore the full
displacement fields of the interfaces were not reported. Most of the previous papers presented
investigations of ductile adhesives using a J-integral approach. The stress components were worked
out based on estimated or measured displacements at one point close to the initial tip of the crack
and the estimated J-integrals.
Micro-scale optical analysis of damage in composites became available recently due to
developments of suitable in-situ test apparatuses for simple loading scenarios such as tension,
compression and bending. Although in-situ testing was first adapted for the assessment of transverse
cracking of unidirectional composite layers [38]-[41], this technique offers scope for an in-depth
analysis of mode II damage process zones as well. Gonzalez and LLorca [38] investigated the damage
mechanisms in a transversely compressed unidirectional (UD) composite in-situ in a scanning
electron microscope (SEM) and identified the key parameters for failure modelling. Canal et al [39]
analysed the progression of a tensile transverse crack in a three point bending (3PB) UD composite
specimen by executing the tests in-situ in a SEM. Test results were correlated with the outcomes of
an embedded cell modelling study and showed good agreement. Canal et al [40] successfully applied
DIC on single SEM images in another study to analyse the micro-scale deformations during
transverse compression cracking of a UD composite specimen.
The idea behind the present research based on the indications of the literature survey is the
following: High resolution micrographs of delaminating composite layer interfaces can be obtained
6
in-situ in a SEM if a simple loading scenario is found. The SEM images of the deformed specimen
can be post-processed with DIC to establish the full displacement fields, which can be used in the
next phase for calculating the mode II cohesive law of the interface.
The wider scope of the research is to investigate the delamination initiation and propagation
phenomena in detail and propose a procedure by which, the displacement field of adjacent layers of a
composite plate made with a brittle epoxy matrix with a very thin interfacial layer can be captured at
subsequent stress levels. The displacement fields can then be used for analysis of the displacement
jumps as well as the traction (i.e. shear stress) across the interface and finally to evaluate the mode II
cohesive law. This methodology provides a deep insight into the deformations of a mode II damage
process zone and valuable information such as variation of displacement jump values all along the
interface. A novel aspect of the proposed approach is that the tractions and the displacement jumps
can be evaluated independently and more directly from the same high resolution displacement field
than with other reported techniques.
The overall research aims at exploring the actual shape of the mode II cohesive law of composite
layer interfaces. The specific aim of this paper is to present the first step towards the overall goal by
the development of a novel experimental procedure to obtain the full displacement field of
delaminating interfaces. The approach is to capture the displacements directly on the surface of a
progressively delaminating UD composite specimen in a simple loading scenario and analyse the
deformations on the micro-scale.
2. Experimental
This section gives a detailed description of the development of a novel test setup and design of
matching specimen geometry, which is suitable for in-depth analysis of the deformations around a
mode II interlaminar crack in a UD composite. The chosen mechanical testing, image acquisition,
post-processing and correlation procedures are discussed as well.
7
2.1. Development of the novel experimental setup
In order to study the longitudinal displacement field of delaminating composite layers under load
with high spatial resolution, the following conditions are necessary: (i) A digital image acquisition
device with appropriate magnification and resolution to provide high quality images for deformation
analysis (ii) A simple loading device, which can be suitably positioned for image acquisition (iii) The
mode II crack propagation during the mechanical test must be stable and allow time for image
acquisition at subsequent load steps (iv) The specimen surface of interest showing interlaminar
damage and crack propagation must be visible through the imaging system, (v) The observed
specimen surface must have features suitable for tracking by an image correlation software, to allow
post-processing.
All these requirements can be fulfilled and the displacements of delaminating composite layer
interfaces can be captured if a simple tensile test is executed in-situ in the vacuum chamber of a SEM
on a specially designed UD composite specimen showing stable mode II crack propagation due to
the presence of well positioned ply cuts (see Figure 1.a). The SEM images can be processed with
DIC to generate the full displacement field of the delaminating layers (see section 2.8 for more
details). The SEM is more suitable than an optical microscope for image acquisition, because it has
higher resolution and is able to tolerate small misalignment of the surface of interest. The SEM
utilised for the experiments is a Zeiss EVO MA 15 with a relatively large (365 mm (Ø) x 275 mm
length) cylindrical vacuum chamber which is able to accommodate a wide range of mechanical
testing modules. The simple tensile test was preferred over more complicated bending-based
techniques, because it requires less space and it is free of large displacements, therefore more suitable
for in-situ SEM testing.
2.2. Specimen design
8
UD tensile specimens made with cut central plies have been studied experimentally and
numerically by Cui et al. [42] to analyse delamination, a key failure mode in layered composites. It
was shown that when the specimen is under tension, the interlaminar normal stresses are small,
compressive and restricted to the vicinity of the initial cut. Jalalvand et al [43] analysed a similar
problem and reported, that the required stress for driving delamination is independent of the
interlaminar crack length. The mentioned analysis results indicate that the cut central layer UD
specimen design allows for unique interlaminar fracture conditions very close to pure mode II. The
discontinuous central layer UD specimens with continuous outer layers which can take the full load
after delamination initiation furthermore assures stable propagation of mode II interlaminar cracks,
allowing for image acquisition. Similar cut central layer but glass/carbon interlayer hybrid specimens,
which show stable central layer pull-out, were used earlier by Czél et al [44] to study the mode II
fracture toughness of hybrid composite interfaces. This layer-by-layer hybrid specimen type with a
cut central carbon/epoxy and continuous outer glass/epoxy layers was a good starting point for the
development of similar architecture but different size specimens suitable for in-situ testing in a SEM
chamber. In order to make the delamination of the specimen visible, the 1 mm thick cross-ply
glass/epoxy end tabs had to be bonded on the surfaces showing the glass and carbon layers (edges of
a specimen cut from a laminated plate). This was necessary because the in-situ tensile module can
accommodate specimens only one way round. The specimens were made by curing a 1.5 mm thick
laminated hybrid composite plate in an autoclave, and cutting it up into 1.5 mm wide sticks with a
diamond wheel to give them 1.5x1.5 mm square nominal cross sections. The end-tabs were bonded
on the cut edges of the sticks to let the interesting surfaces, showing the three layer hybrid structure
with a cut in the centre of the carbon layer, face towards the electron beam (EB) source when
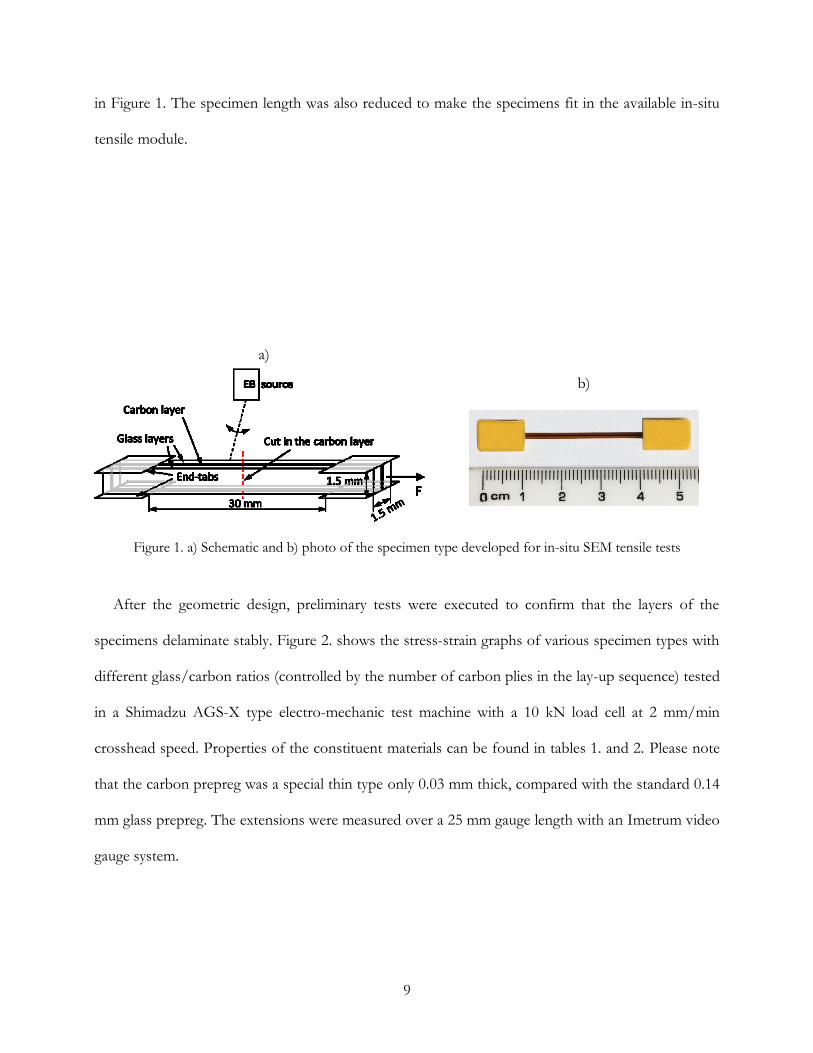
mounted in the SEM tensile module. A schematic of the specimen design and a photograph is shown
9
in Figure 1. The specimen length was also reduced to make the specimens fit in the available in-situ
tensile module.
a)
b)
Figure 1. a) Schematic and b) photo of the specimen type developed for in-situ SEM tensile tests
After the geometric design, preliminary tests were executed to confirm that the layers of the
specimens delaminate stably. Figure 2. shows the stress-strain graphs of various specimen types with
different glass/carbon ratios (controlled by the number of carbon plies in the lay-up sequence) tested
in a Shimadzu AGS-X type electro-mechanic test machine with a 10 kN load cell at 2 mm/min
crosshead speed. Properties of the constituent materials can be found in tables 1. and 2. Please note
that the carbon prepreg was a special thin type only 0.03 mm thick, compared with the standard 0.14
mm glass prepreg. The extensions were measured over a 25 mm gauge length with an Imetrum video
gauge system.
10
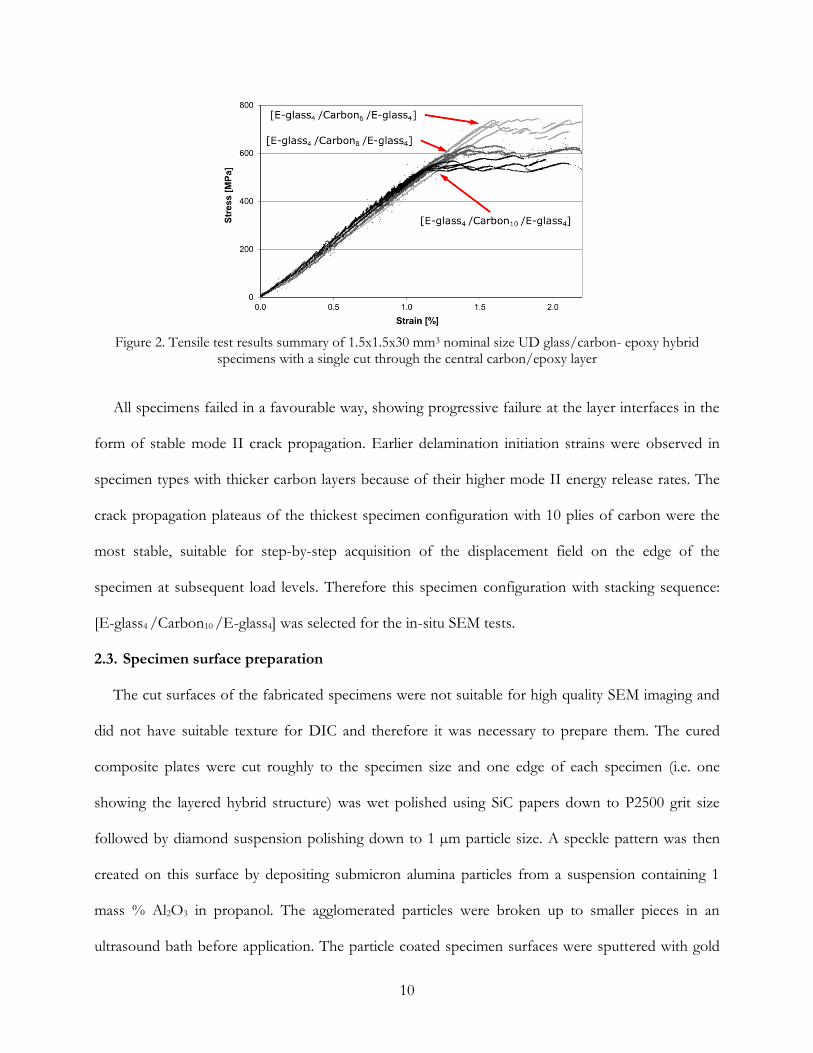
Figure 2. Tensile test results summary of 1.5x1.5x30 mm3 nominal size UD glass/carbon- epoxy hybrid
specimens with a single cut through the central carbon/epoxy layer
All specimens failed in a favourable way, showing progressive failure at the layer interfaces in the
form of stable mode II crack propagation. Earlier delamination initiation strains were observed in
specimen types with thicker carbon layers because of their higher mode II energy release rates. The
crack propagation plateaus of the thickest specimen configuration with 10 plies of carbon were the
most stable, suitable for step-by-step acquisition of the displacement field on the edge of the
specimen at subsequent load levels. Therefore this specimen configuration with stacking sequence:
[E-glass4 /Carbon10 /E-glass4] was selected for the in-situ SEM tests.
2.3. Specimen surface preparation
The cut surfaces of the fabricated specimens were not suitable for high quality SEM imaging and
did not have suitable texture for DIC and therefore it was necessary to prepare them. The cured
composite plates were cut roughly to the specimen size and one edge of each specimen (i.e. one
showing the layered hybrid structure) was wet polished using SiC papers down to P2500 grit size
followed by diamond suspension polishing down to 1 µm particle size. A speckle pattern was then
created on this surface by depositing submicron alumina particles from a suspension containing 1
mass % Al2O3 in propanol. The agglomerated particles were broken up to smaller pieces in an
ultrasound bath before application. The particle coated specimen surfaces were sputtered with gold
11
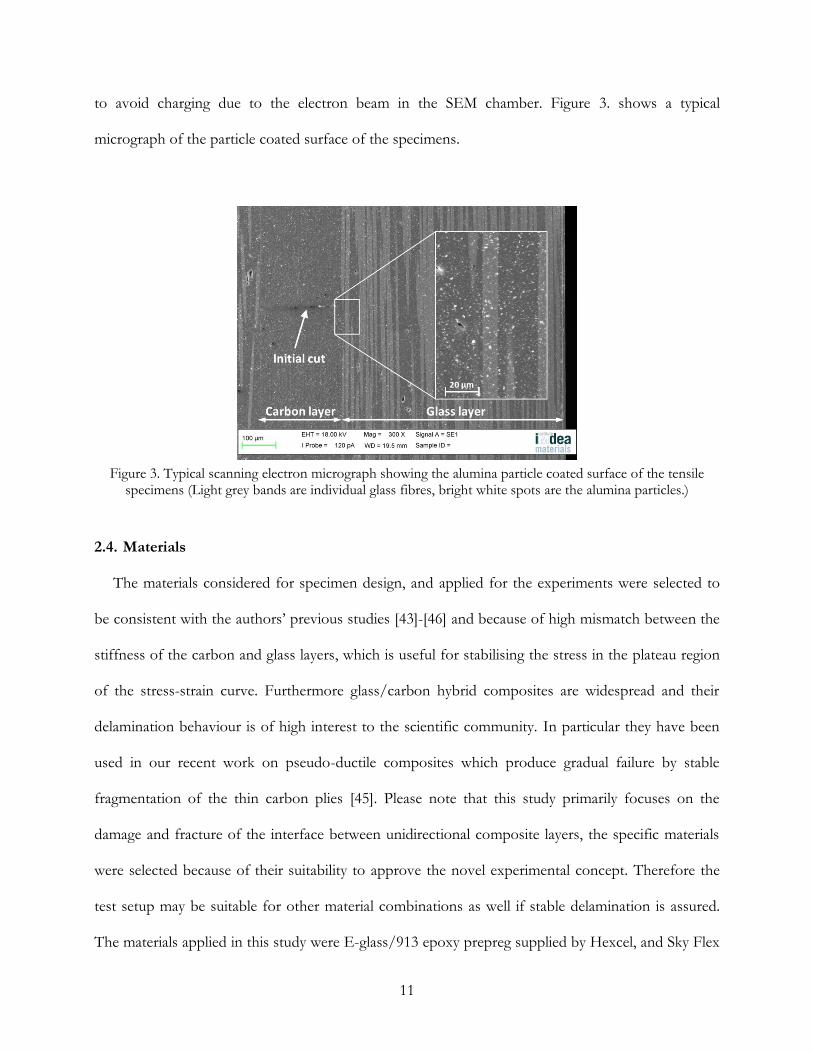
to avoid charging due to the electron beam in the SEM chamber. Figure 3. shows a typical
micrograph of the particle coated surface of the specimens.
Figure 3. Typical scanning electron micrograph showing the alumina particle coated surface of the tensile
specimens (Light grey bands are individual glass fibres, bright white spots are the alumina particles.)
2.4. Materials
The materials considered for specimen design, and applied for the experiments were selected to
be consistent with the authors’ previous studies [43]-[46] and because of high mismatch between the
stiffness of the carbon and glass layers, which is useful for stabilising the stress in the plateau region
of the stress-strain curve. Furthermore glass/carbon hybrid composites are widespread and their
delamination behaviour is of high interest to the scientific community. In particular they have been
used in our recent work on pseudo-ductile composites which produce gradual failure by stable
fragmentation of the thin carbon plies [45]. Please note that this study primarily focuses on the
damage and fracture of the interface between unidirectional composite layers, the specific materials
were selected because of their suitability to approve the novel experimental concept. Therefore the
test setup may be suitable for other material combinations as well if stable delamination is assured.
The materials applied in this study were E-glass/913 epoxy prepreg supplied by Hexcel, and Sky Flex
12
USN 020A carbon/epoxy prepregs from SK Chemicals made with high strength Pyrofil TR30
carbon fibres produced by Mitsubishi Rayon. Both resin systems in the hybrid laminates were 120°C
cure epoxies, which were found to be compatible, although no details were provided by the suppliers
on the chemical formulation of the resins. Good integrity of the hybrid laminates was confirmed
during composite processing, specimen fabrication and testing and no phase separation was
observed on micrographs. Material properties of the applied fibres and prepreg systems can be found
in tables 1. and 2.
Table 1. Fibre properties of the applied UD prepregs (based on manufacturer’s data)
Fibre type Manufacturer
Elastic modulus
Strain to failure
Tensile strength
Density
[GPa] [%] [GPa] [g/cm3]
Pyrofil TR30 carbon Mitsubishi Rayon 234 1.9 4.4 1.79
EC9 756 P109 E-glass Owens Corning 72 4.5 3.5 2.56
Table 2. Cured ply properties of the applied UD prepregs
Prepreg material Property
Fibre mass per unit area
Cured ply thickness
Fibre volume fraction
Initial elastic
modulus
Strain to failure
Interlaminar shear
strength
Unit [g/m2] [mm] [%] [GPa] [%] [MPa]
TR30 Carbon/ epoxy
Average 21.2[45] 0.029[45] 41[45] 101.7[47] 1.9[45] -
CoVa [%] 4.0[45] - - 2.75[47] 6.76[45] -
E-glass/ epoxy Average 192b 0.140[45] 54[45] 40b 3.7[48]/2.8[45]c 100[49]
CoV [%] - - - - - - aCoefficient of variation bBased on manufacturer’s data cMeasured on different specimen types in tension
2.5. In-situ tensile testing procedure
A Kammrath&Weiss tensile-compression module equipped with a 10 kN load cell was applied for
the in-situ tensile tests at crosshead speeds from 0.05 to 0.5 mm/min (higher speeds in the initial
elastic regime, lower speeds towards interlaminar crack initiation and propagation). The module
13
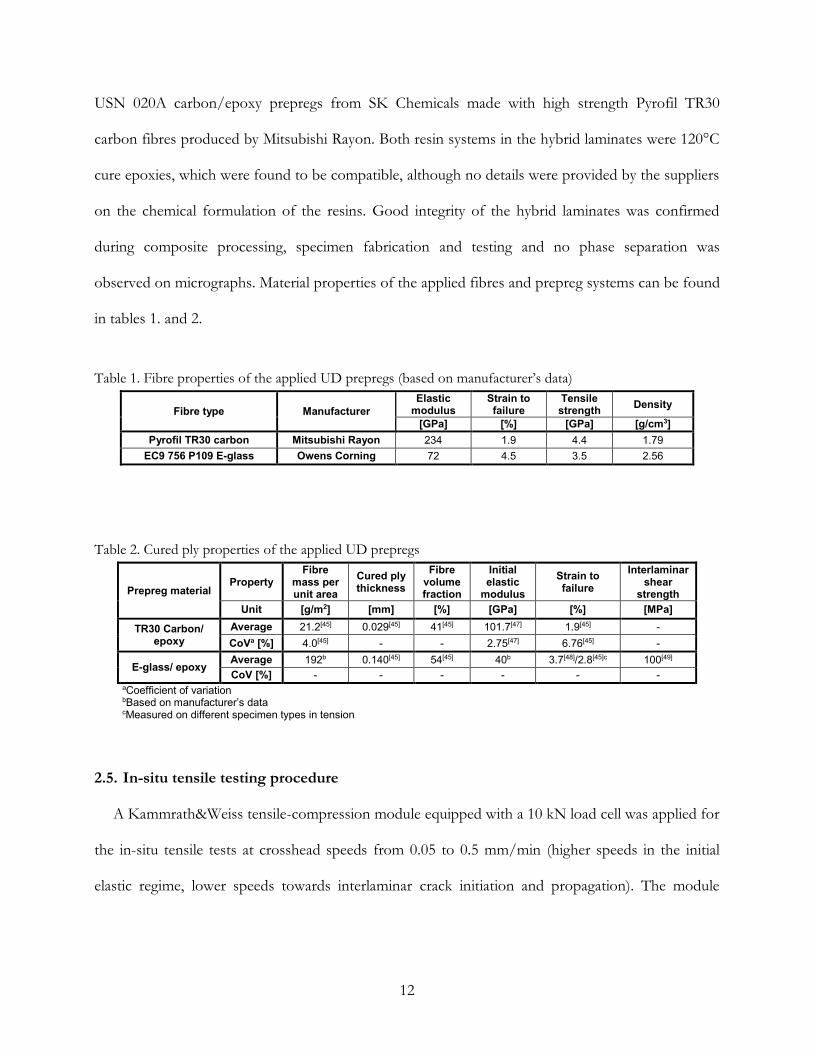
shown in Figure 4. was designed to move both grips aside with the same speed to keep the centre of
the specimen in the same position during the tensile test, making the image acquisition easier.
Figure 4. Photograph of the Kammrath&Weiss tensile module for in-situ testing in SEM (the separation
between the grips is ~30 mm)
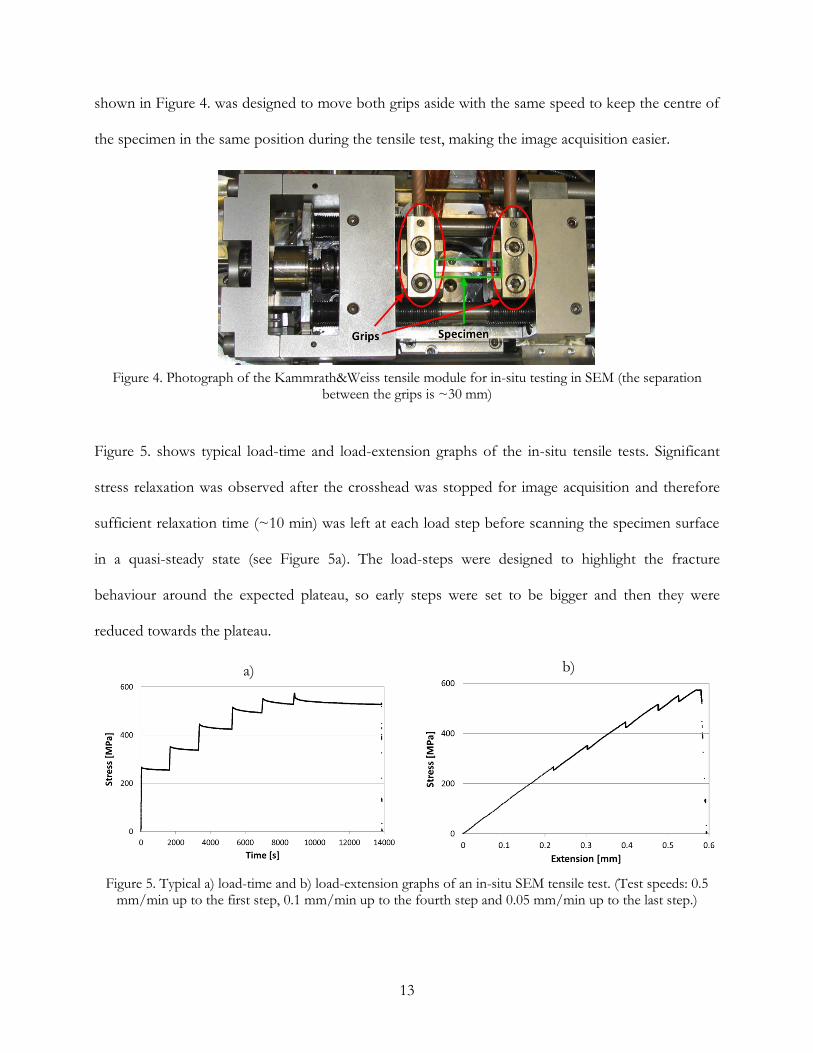
Figure 5. shows typical load-time and load-extension graphs of the in-situ tensile tests. Significant
stress relaxation was observed after the crosshead was stopped for image acquisition and therefore
sufficient relaxation time (~10 min) was left at each load step before scanning the specimen surface
in a quasi-steady state (see Figure 5a). The load-steps were designed to highlight the fracture
behaviour around the expected plateau, so early steps were set to be bigger and then they were
reduced towards the plateau.
a)
b)
Figure 5. Typical a) load-time and b) load-extension graphs of an in-situ SEM tensile test. (Test speeds: 0.5
mm/min up to the first step, 0.1 mm/min up to the fourth step and 0.05 mm/min up to the last step.)
14
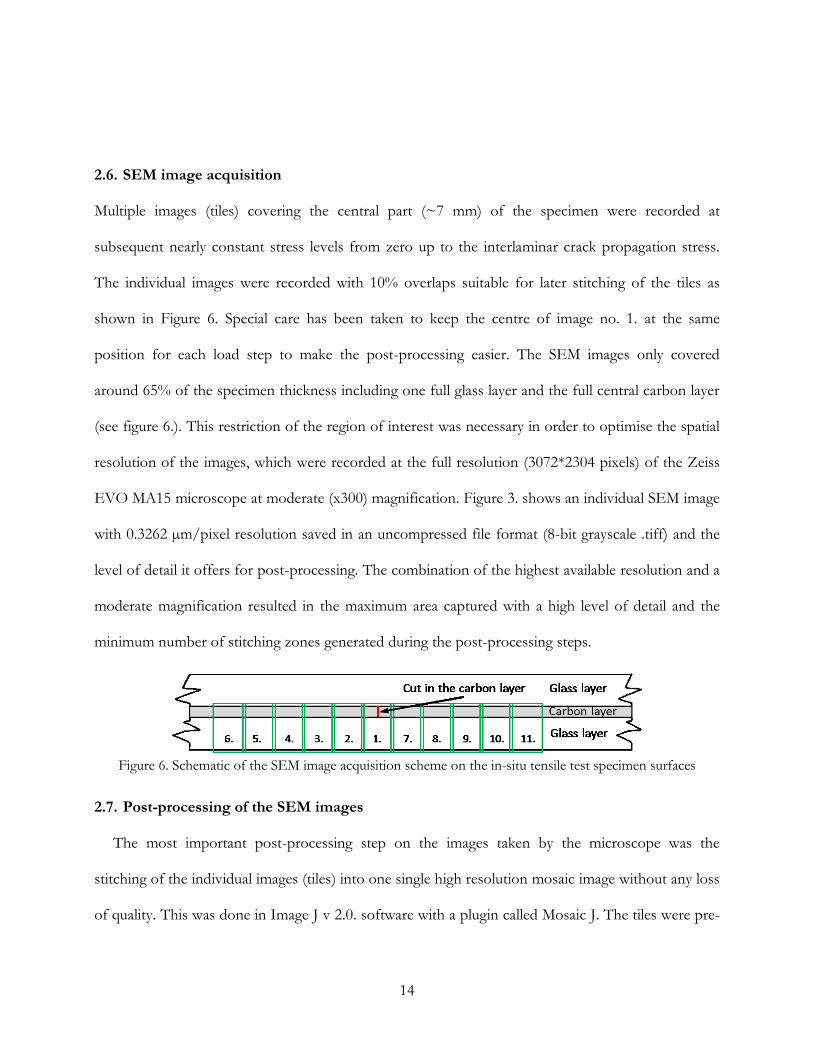
2.6. SEM image acquisition
Multiple images (tiles) covering the central part (~7 mm) of the specimen were recorded at
subsequent nearly constant stress levels from zero up to the interlaminar crack propagation stress.
The individual images were recorded with 10% overlaps suitable for later stitching of the tiles as
shown in Figure 6. Special care has been taken to keep the centre of image no. 1. at the same
position for each load step to make the post-processing easier. The SEM images only covered
around 65% of the specimen thickness including one full glass layer and the full central carbon layer
(see figure 6.). This restriction of the region of interest was necessary in order to optimise the spatial
resolution of the images, which were recorded at the full resolution (3072*2304 pixels) of the Zeiss
EVO MA15 microscope at moderate (x300) magnification. Figure 3. shows an individual SEM image
with 0.3262 µm/pixel resolution saved in an uncompressed file format (8-bit grayscale .tiff) and the
level of detail it offers for post-processing. The combination of the highest available resolution and a
moderate magnification resulted in the maximum area captured with a high level of detail and the
minimum number of stitching zones generated during the post-processing steps.
Figure 6. Schematic of the SEM image acquisition scheme on the in-situ tensile test specimen surfaces
2.7. Post-processing of the SEM images
The most important post-processing step on the images taken by the microscope was the
stitching of the individual images (tiles) into one single high resolution mosaic image without any loss
of quality. This was done in Image J v 2.0. software with a plugin called Mosaic J. The tiles were pre-
15
aligned manually, and then the built-in algorithm performed the fine adjustment of the overlapping
images allowing only for translations (rotation was blocked). The overlapping areas were “blended”
by the software to create an even smoother transition between the tiles. It was observed, that the tiles
had lower quality (became blurred) towards the corners so these parts of the stitching regions were
considered as possible weak spots for image correlation.
After stitching the tiles the mosaic images corresponding to subsequent stress levels were cropped
to the same pixel size in the general purpose image processing software Gimp 2 as this is required for
image correlation.
2.8. Correlation of the mosaic SEM images
Dantec Dynamic’s Istra 4D v 4.3 software was applied for correlating the mosaic images with a
spatial resolution of 0.3262 µm/pixel to work out the displacement fields of the tensile specimens.
The key parameters of the image correlation, the subset or facet size, (which is the size of the sub-
areas the correlation algorithm tracks) and grid spacing (which defines the points where output is
generated) were set to 17 pixels (5.55 µm) and 12 pixels (3.91 µm) respectively based on parametric
studies to maximise the number of correlated facets and improve the spatial resolution. The
optimum facet size was controlled by the particle size and distribution on the specimen surface and
the grid spacing was kept as low as possible to ensure the highest possible spatial resolution. As a
result a significant overlap was set between the adjacent subsets, which did not compromise the
independence of results for each subset [50].
3. Results and discussion
This section presents and explains the results of SEM image acquisition and DIC post-processing.
The stresses were calculated based on the original measured full cross-sectional area of the specimen.
3.1. High resolution mosaic images of the delaminating interfaces
16
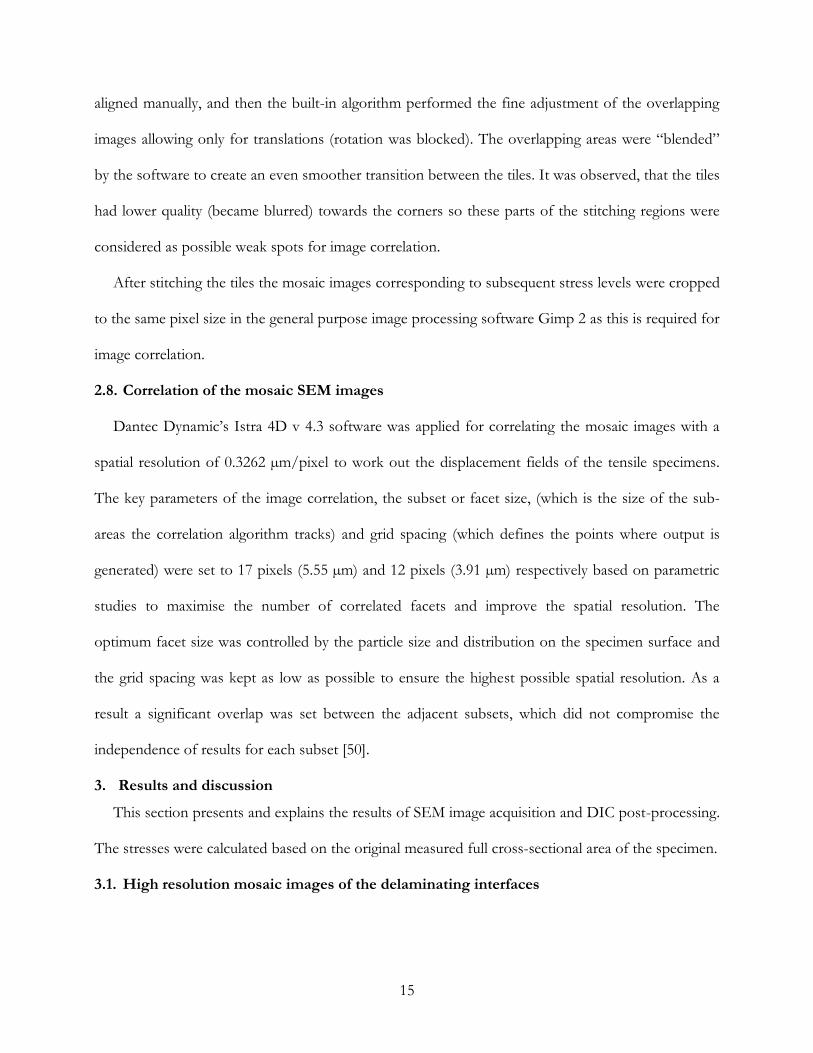
Since it is a unique opportunity to observe micrographs of delaminating composite interfaces at
subsequent stress levels it worth discussing some of the observations. Figure 7. shows the mosaic
image of one half of the scanned area of the specimen at two different stress levels at the early stage
of crack propagation. First of all the opening of the initial through thickness cut in the carbon layer
and the progress of the visible interlaminar crack tip can be seen. It is also worth noting, that the
mode II crack appears to be sharp at a given stress level (Section 1 on Figure 7.), but the newly
formed section (Section 2 on Figure 7.) of the same crack shows a completely different appearance
(i.e. shear hackles) at the next load step. This interesting behaviour suggests that the properties of an
interface may not be identical along the length therefore one single crack may show different
appearances along specific sections.
Figure 7. Mosaic images of the delaminating interfaces in a UD glass/carbon hybrid composite at two
different tensile stress levels
3.2. Full displacement fields
17
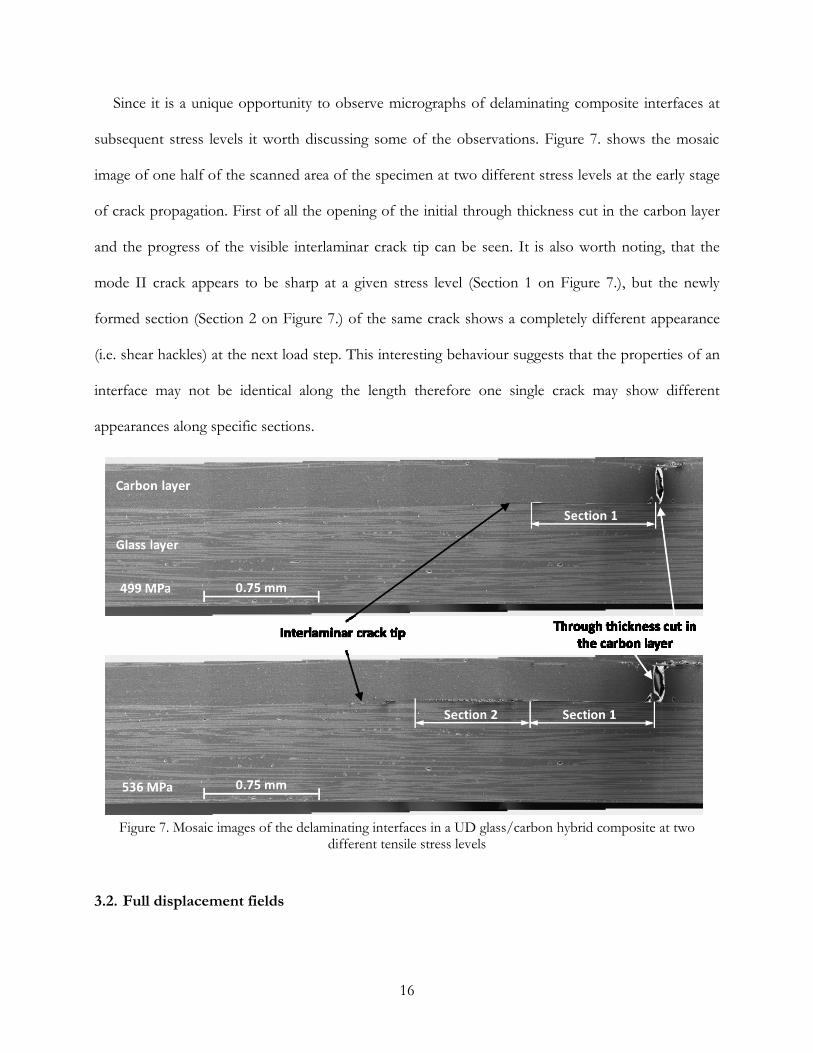
Figure 8. shows the full displacement fields at three different stress levels obtained by the image
correlation of mosaic scanning electron micrographs. The palette used is not suitable for quantitative
representation of the data (this is the reason for no colour scale), but very useful to show the overall
shape and correlation quality (degree of continuity, missing data etc.) of the displacement fields over
a relatively large area (~1x7 mm) of the specimen. The black spots in the correlated fields indicate
missing data due to unsuccessful correlation of the corresponding subset. It is obvious that the
opening central crack in the carbon layer resulted in a growing uncorrelated patch because the new
surfaces were not coated with gold and started to charge, therefore appearing bright (see Figure 7.).
The other reason for structured missing data is the stitch areas, which show up especially towards the
sides of the displacement fields. Despite a significant amount of missing data, Figure 8. confirms that
the image correlation algorithm was robust enough to work around the affected areas and therefore
the overall shape, continuity and accuracy of the field were not affected. The highlighted contours
make the discontinuities of the displacement field across the damaged interfaces highly visible and
visualize the deformed shape of the specimen surface. It is interesting to note that the displacements
are not homogeneous within the central carbon ply block. This allows for analysis of the shear
stresses in the next phase of the work.
18
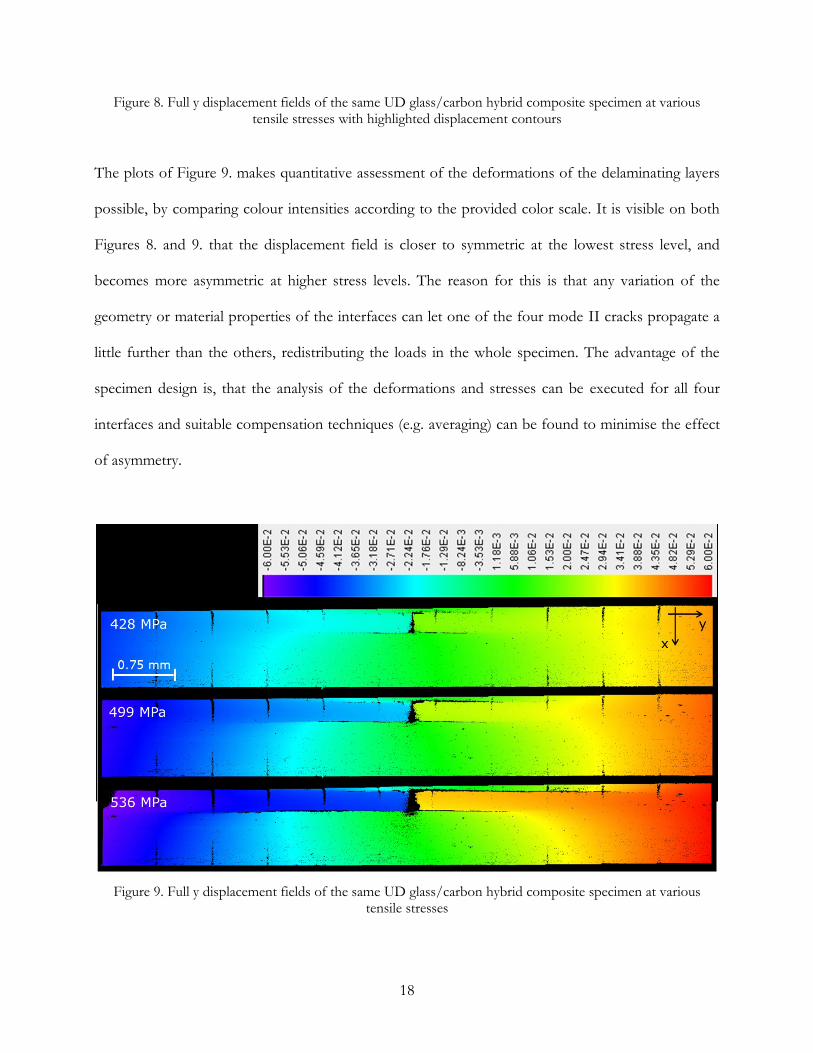
Figure 8. Full y displacement fields of the same UD glass/carbon hybrid composite specimen at various tensile stresses with highlighted displacement contours
The plots of Figure 9. makes quantitative assessment of the deformations of the delaminating layers
possible, by comparing colour intensities according to the provided color scale. It is visible on both
Figures 8. and 9. that the displacement field is closer to symmetric at the lowest stress level, and
becomes more asymmetric at higher stress levels. The reason for this is that any variation of the
geometry or material properties of the interfaces can let one of the four mode II cracks propagate a
little further than the others, redistributing the loads in the whole specimen. The advantage of the
specimen design is, that the analysis of the deformations and stresses can be executed for all four
interfaces and suitable compensation techniques (e.g. averaging) can be found to minimise the effect
of asymmetry.
Figure 9. Full y displacement fields of the same UD glass/carbon hybrid composite specimen at various
tensile stresses
19
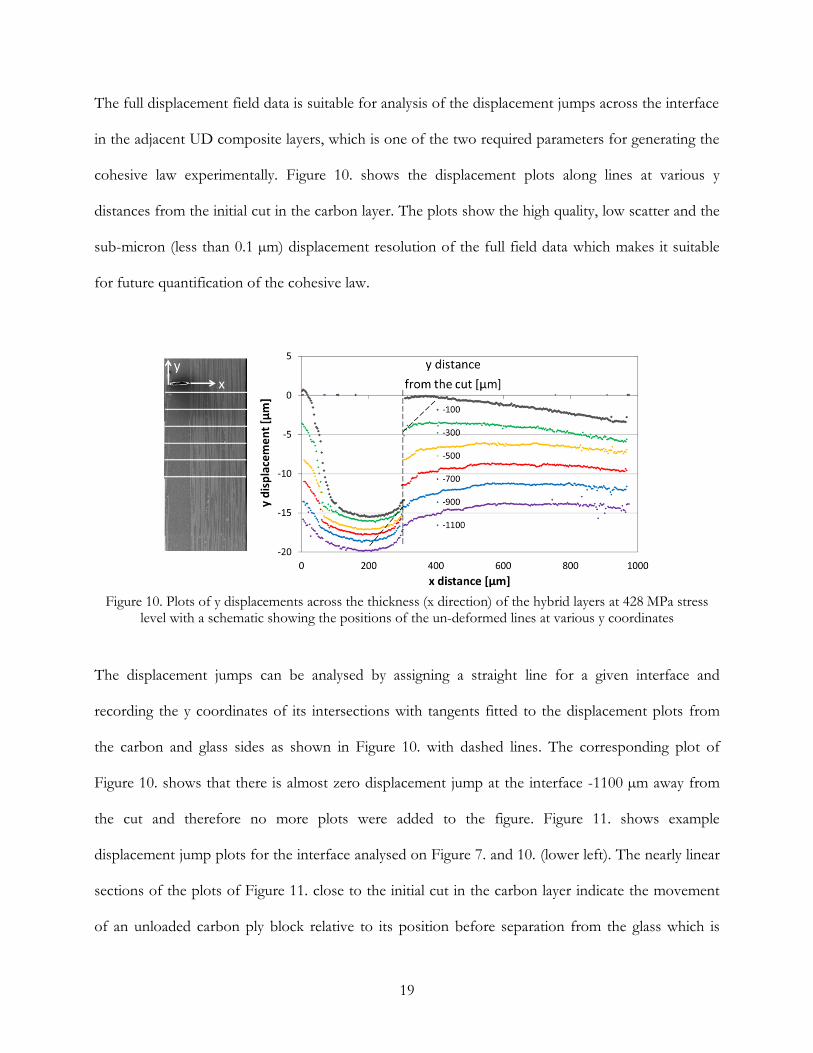
The full displacement field data is suitable for analysis of the displacement jumps across the interface
in the adjacent UD composite layers, which is one of the two required parameters for generating the
cohesive law experimentally. Figure 10. shows the displacement plots along lines at various y
distances from the initial cut in the carbon layer. The plots show the high quality, low scatter and the
sub-micron (less than 0.1 µm) displacement resolution of the full field data which makes it suitable
for future quantification of the cohesive law.
Figure 10. Plots of y displacements across the thickness (x direction) of the hybrid layers at 428 MPa stress
level with a schematic showing the positions of the un-deformed lines at various y coordinates
The displacement jumps can be analysed by assigning a straight line for a given interface and
recording the y coordinates of its intersections with tangents fitted to the displacement plots from
the carbon and glass sides as shown in Figure 10. with dashed lines. The corresponding plot of
Figure 10. shows that there is almost zero displacement jump at the interface -1100 µm away from
the cut and therefore no more plots were added to the figure. Figure 11. shows example
displacement jump plots for the interface analysed on Figure 7. and 10. (lower left). The nearly linear
sections of the plots of Figure 11. close to the initial cut in the carbon layer indicate the movement
of an unloaded carbon ply block relative to its position before separation from the glass which is
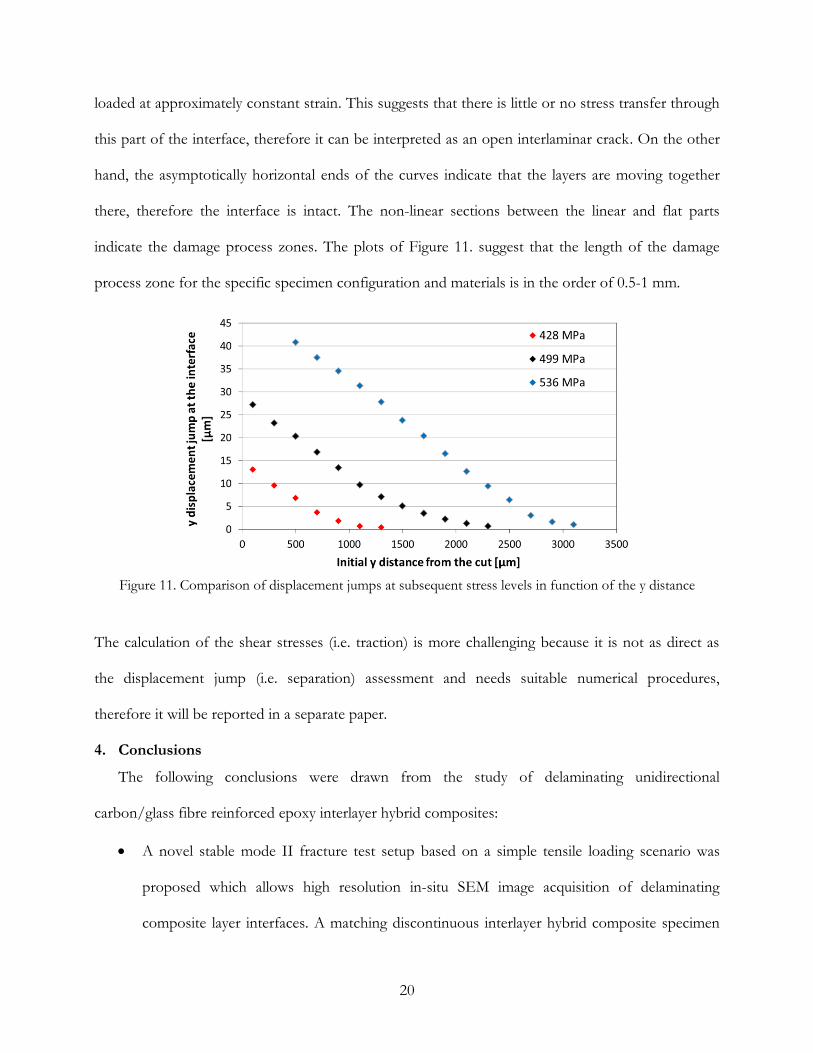
20
loaded at approximately constant strain. This suggests that there is little or no stress transfer through
this part of the interface, therefore it can be interpreted as an open interlaminar crack. On the other
hand, the asymptotically horizontal ends of the curves indicate that the layers are moving together
there, therefore the interface is intact. The non-linear sections between the linear and flat parts
indicate the damage process zones. The plots of Figure 11. suggest that the length of the damage
process zone for the specific specimen configuration and materials is in the order of 0.5-1 mm.
Figure 11. Comparison of displacement jumps at subsequent stress levels in function of the y distance
The calculation of the shear stresses (i.e. traction) is more challenging because it is not as direct as
the displacement jump (i.e. separation) assessment and needs suitable numerical procedures,
therefore it will be reported in a separate paper.
4. Conclusions
The following conclusions were drawn from the study of delaminating unidirectional
carbon/glass fibre reinforced epoxy interlayer hybrid composites:
A novel stable mode II fracture test setup based on a simple tensile loading scenario was
proposed which allows high resolution in-situ SEM image acquisition of delaminating
composite layer interfaces. A matching discontinuous interlayer hybrid composite specimen
21
type was developed which is capable of being tested in tension in-situ in an SEM and shows
stable mode II interlaminar crack propagation suitable for imaging at subsequent load steps.
A suitable surface preparation procedure including submicron alumina particle deposition
was found which makes digital image correlation possible on the acquired SEM images.
An optimised imaging methodology was developed which consists of recording the area of
interest with overlapped, high resolution SEM images at moderate magnification and
stitching them afterwards into mosaic images. This technique ensures the highest level of
detail and maximum covered area with minimum number of stitch lines.
The deformations of the composite layer interfaces were successfully captured at subsequent
stress levels during the in-situ tensile tests in a SEM. The full displacement fields of 1x7 mm
areas of the tested specimen were correlated on a 4 µm grid with better than 0.1 µm
displacement resolution.
The generated full displacement fields of composite layer interfaces undergoing damage
allowed for unique observations e.g. of the appearance of the mode II cracks, approximate
damage process zone length and direct quantitative analysis of the displacement jumps across
the interfaces.
The displacement data can be extensively post-processed and exploited to help understand
the mode II interfacial behaviour of composite laminates. Further research is planned to
develop suitable procedures for the analysis of the shear stresses at the interfaces which can
yield an experimentally determined mode II cohesive law.
5. Acknowledgement
This work was funded under the UK Engineering and Physical Sciences Research Council (EPSRC)
Programme Grant EP/I02946X/1 on High Performance Ductile Composite Technology in
collaboration with Imperial College, London, and by the EPSRC Building Global Engagements in
22
Research grant EP/K004581/1 in collaboration with Madrid Institute for Advanced Studies of
Materials (IMDEA Materials Institute) where the in-situ SEM tensile tests were executed. Gergely
Czél acknowledges the Hungarian Academy of Sciences for funding through the Post-Doctoral
Researcher Programme fellowship scheme. The authors thank Juan Carlos Rubalcaba for his help
with the in-situ SEM measurements.
Supporting data are available, subject to a non-disclosure agreement. Please contact the
corresponding author in the first instance.
6. References
[1] Camanho PP, Davila CG, Pinho ST. Fracture analysis of composite co-cured structural joints
using decohesion elements. Fatigue Fract Eng Mater Struct 2003;27:745–57.
[2] Blackman BRK, Hadavinia H, Kinloch AJ, Williams JG. The use of a cohesive zone model to
study the fracture of fibre composites and adhesively-bonded joints. Int J Fract 2003;119:25–46.
[3] Li S, Thouless MD, Waas AM, Schroeder JA, Zavattieri PD. Mixed-mode cohesive-zone models
for fracture of an adhesively bonded polymer–matrix composite. Eng Fract Mech 2006;73:64–
78.
[4] Goyal VK, Johnson ER, Goyal VK. Predictive strength-fracture model for composite bonded
joints. Compos Struct 2008;82:434–46.
[5] Wisnom MR. Modelling discrete failures in composites with interface elements. Composites Part
A 2010;41:795–805.
[6] Mi Y, Crisfield MA, Davies GAO, Hellweg H-B. Progressive delamination using interface
elements. J Compos Mater 1998;32:1246–72.
[7] Petrossian Z, Wisnom MR. Prediction of delamination initiation and growth from discontinuous
plies using interface elements. Compos A: Appl Sci Manufactur 1998;29A:503–15.
[8] Chen J, Crisfield M, Kinloch AJ, Busso EP, Matthews FL, Qiu Y. Predicting progressive
delamination of composite material specimens via interface elements. Mech Compos Mater
Struct 1999;6:301–17.
[9] Crisfield MA, Alfano G. Finite element interface models for the delamination analysis of
laminated composites: mechanical and computational issues. Int J Num Meth Eng
2000;50:1701–36.
[10] Camanho PP, Davila CG, De Moura MF. Numerical simulation of mixed-mode progressive
delamination in composite materials. J Compos Mater 2003;37:1415–24.
[11] Yang Q, Cox B, Cohesive models for damage evolution in laminated composites. Int J Fract
2005;133:107–37.
[12] Pinho ST, Ianucci L, Robinson P. Formulation and implementation of decohesion elements in
an explicit finite element code. Compos A: Appl Sci Manufactur 2006;37:778–89.
23
[13] Jiang WG, Hallett SR, Green BG, Wisnom MR. A concise interface constitutive law for analysis
of delamination and splitting in composite materials and its application to scaled notched tensile
specimens. Int J Num Meth Eng 2007;69:1982–95.
[14] Turon A, Davila CG, Camanho PP, Costa J. An engineering solution for mesh size effects in the
simulation of delamination using cohesive zone models. Eng Fract Mech 2007;74:1665–82.
[15] Turon A, Costa J, Camanho PP, Davila CG. Simulation of delamination in composites under
high-cycle fatigue. Compos A: Appl Sci Manufactur 2007;38:2270–82.
[16] Harper PW, Hallett SR. Cohesive zone length in numerical simulations of composite
delamination. Engineering Fracture Mechanics, 2008;75:4774-4792.
[17] Jalalvand M, Wisnom MR, Hosseini-Toudeshky H, Mohammadi B. Experimental and numerical
study of oblique transverse cracking in cross-ply laminates under tension. Composites Part A,
2014;67:140-148.
[18] Jalalvand M, Czél G, Wisnom MR. Numerical modelling of the damage modes in UD thin
carbon/glass hybrid laminates. Compos Sci Technol 2014;94:39–47.
[19] Elices M, Guinea GV, Gómez J, Planas J. The cohesive zone model advantages, limitations and
challenge. Eng Fract Mech 2002;69:137–63.
[20] Cornec A, Scheider I, Schwalbe KH. On the practical application of the cohesive model. Eng
Fract Mech 2003;70:1963–87.
[21] de Borst R. Numerical aspects of cohesive-zone models. Eng Fract Mech 2003;70:1743–57.
[22] Xie D, Waas AM. Discrete cohesive zone model for mixed-mode fracture using finite element
analysis. Eng Fract Mech 2006;73:1783–96.
[23] Brewer JC, Lagace PA. Quadratic Stress Criterion for Initiation of Delamination. J Compos
Mater 1988;22:1141–55.
[24] O’Brien T. Characterization of delamination onset and growth in a composite laminate. in
Damage in Composite Materials. Editor: K. Reifsnider, ASTM STP 1982:140–67.
[25] Corigliano A. Formulation, identification and use of interface models in the numerical analysis
of composite delamination. Int J Solids Struct 1993;30:2779–811.
[26] Van den Bosch MJ, Schreurs PJG, Geers MGD. An improved description of the exponential
Xu and Needleman cohesive zone law for mixed-mode decohesion. Eng Fract Mech
2006;73:1220–34.
[27] Tvergaard V, Hutchinson JW. The relation between crack growth resistance and fracture
process parameters in elastic-plastic solids. J Mech Phys Solids 1992;40:1377–97.
[28] Balzani C, Wagner W. An interface element for the simulation of delamination in unidirectional
fiber-reinforced composite laminates. Eng Fract Mech 2008;75:2597–615.
[29] Wisnom MR. Modelling of stable and unstable fracture of short beam shear specimens.
Composites 1994;25:394–400.
[30] Shet C, Chandra N. Effect of the shape of traction–displacement cohesive zone curves on the
fracture response. Mech Adv Mater Struct 2004;11:249–75.
[31] Sills RB, Thouless MD. The effect of cohesive-law parameters on mixed-mode fracture.
Engineering Fracture Mechanics, 2013;109:353-368.
[32] Sørensen BF, Kirkegaard P. Determination of mixed mode cohesive laws. Eng Fract Mech
2006;73:2642–61.
24
[33] Sørensen BF, Jacobsen TK. Characterizing delamination of fibre composites by mixed mode
cohesive laws. Compos Sci Technol 2009;69:445–56.
[34] De Moura MFSF, Gonçalves JPM, Magalhães AG. A straightforward method to obtain the
cohesive laws of bonded joints under mode I loading. Int J Adhes Adhes 2012;39:54–9.
[35] Fernandes RMRP, Chousal JAG, de Moura MFSF, Xavier J. Determination of cohesive laws of
composite bonded joints under mode II loading. Composites Part B: Engineering. 3013;52:269-
274.
[36] Dourado N, de Moura MFSF, de Morais AB, Pereira AB. Bilinear approximations to the mode
II delamination cohesive law using an inverse method. Mechanics of Materials, 2012;49:42-50.
[37] Cui H, Koussios S, Li Y, Beukers A. Constitutive law of adhesive layer measured with mixed
mode bending test. Engineering Fracture Mechanics 2014;127: 235–251.
[38] González C, LLorca J. Mechanical behavior of unidirectional fiber-reinforced polymers under
transverse compression: microscopic mechanisms and modeling. Compos Sci Technol
2007;67:2795–806.
[39] Canal LP, González C, Segurado J, LLorca J. Intraply fracture of fiber-reinforced composites:
Microscopic mechanisms and modelling. Composites Science and Technology. 2012;72:1223–
1232.
[40] Canal LP, González C, Molina-Aldareguía JM, Segurado J, LLorca J. Application of digital
image correlation at the microscale in fiber-reinforced composites Composites Part A: Applied
Science and Manufacturing, 2012;43:1630-1638.
[41] Mortell DJ. Tanner DA. McCarthy CT. In-situ SEM study of transverse cracking and
delamination in laminated composite materials. Composites Science and Technology.
2014;105:118–126.
[42] Cui W, Wisnom MR, Jones MI. An experimental and analytical study of delamination of
unidirectional specimens with cut central plies. J Reinf Plast Compos 1994;13:722-739.
[43] Jalalvand M, Czél G, Wisnom M. Damage analysis of pseudo-ductile thin-ply UD hybrid
composites – A new analytical method. Composites Part A: Applied Science and Manufacturing
2015;69:83-93.
[44] Czél G, Jalalvand M, Wisnom MR. Development of pseudo-ductile hybrid composites with
discontinuous carbon- and continuous glass prepregs. 2014. Paper presented at ECCM 16,
Seville, Spain.
[45] Czél G, Wisnom MR. Demonstration of pseudo-ductility in high performance glass-epoxy
composites by hybridisation with thin-ply carbon prepreg. Compos Part A Appl Sci Manuf
2013;52:23–30.
[46] Czél G, Jalalvand M, Wisnom MR. Demonstration of pseudo-ductility in unidirectional hybrid
composites made of discontinuous carbon/epoxy and continuous glass/epoxy plies.
Composites Part A: Applied Science and Manufacturing. 2015;72:75-84.
[47] Fuller J., Wisnom M. R.: Damage suppression in thin ply angle-ply carbon/epoxy laminates. The
19th International Conference on Composite Materials, Montreal: 2013.
[48] Wisnom M. R., Atkinson J. W.: Reduction in tensile and flexural strength of unidirectional glass
fibre-epoxy with increasing specimen size. Compos Struct 1997;38:405-411.

25
[49] Wisnom MR, Jones MI. Size Effects in Interlaminar Tensile and Shear Strength of
Unidirectional Glass Fibre-Epoxy. J Reinf Plast Compos 1996;15:2-15.
[50] Sutton MA, Orteu JJ, Schreier H. Image Correlation for Shape, Motion and Deformation
Measurements: Basic Concepts, Theory and Applications. Springer, New York, 2009.