Embed Size (px)
Citation preview

Accepted refereed manuscript of:
Rasid R, Brown J, Pratoomyot J, Monroig O & Shinn A (2017) Growth performance, nutrient
utilisation and body composition of Macrobrachium rosenbergii fed graded levels of phytic
acid, Aquaculture, 479, pp. 850-856.
DOI: 10.1016/j.aquaculture.2017.07.029
© 2017, Elsevier. Licensed under the Creative Commons Attribution-NonCommercial-
NoDerivatives 4.0 International http://creativecommons.org/licenses/by-nc-nd/4.0/
Growth performance, nutrient utilisation and body composition of Macrobrachium rosenbergii fed graded levels of phytic acid
Rasid, R.*1,2, Brown, J.H 1,3, Pratoomyot, J.4, Monroig, O.1 & Shinn, A.P.1,5
1 Institute of Aquaculture, Faculty of Natural Sciences, University of Stirling, Stirling FK9 4LA, Scotland, UK 2 School of Fisheries & Aquaculture Sciences, Universiti Malaysia Terengganu (UMT), 21300 Kuala Terengganu, Terengganu, Malaysia 3 The Grower, Association of Scottish Shellfish Growers, Stirling, Scotland, UK 4 Institute of Marine Science, Burapha University, Chonburi 20131, Thailand
5 Fish Vet Group Asia Limited, 57 / 1 Moo 6, Samed Sub-District, Muang Chonburi District, Chonburi Province, 20000, Thailand
*Author for correspondence
Rasina Rasid, School of Fisheries & Aquaculture Sciences, Universiti Malaysia Terengganu (UMT), 21300 Kuala Terengganu, Terengganu, Malaysia. Tel: +6011 1182 7273; E-mail: [email protected]
1
Accepted for publication in Aquaculture published by Elsevier. The original publication is available at: https://doi.org/10.1016/j.aquaculture.2017.07.029

ACCEPTED MANUSCRIPT
Abstract Information relating to the effects of phytic acid (PA), an anti-nutritional factor (ANF)
commonly found in plant protein ingredients, on the growth performance, feed conversion ratio
(FCR), nutrient utilisation and whole proximate composition in the Malaysian giant freshwater
prawn, Macrobrachium rosenbergii, is lacking. Replicate groups of M. rosenbergii (mean initial
carapace length of 6.03 ± 0.30 mm; mean initial weight of 0.29 ± 0.02 g; n = 20 per replicate
group) were fed graded levels of PA for 140 days. The basal diet, to which different levels of PA
were added to obtain 0.26 (control), 6.48, 11.28, 16.53, 21.45 and 26.16 g PA kg-1, contained
fishmeal, soy protein concentrate and wheat meal. Terminal sampling indicated that the growth
performance, FCR and survival did not differ significantly between the groups receiving the
different inclusions of PA within their diets. The apparent protein, lipid and energy utilisation
responded negatively, decreasing significantly (p<0.05) with an increasing inclusion of PA,
particularly within the groups of prawns fed diets with the highest inclusions of PA (i.e. 21.45–
26.16 g PA kg-1). The whole body composition of protein (p<0.04), lipid (p<0.01) and gross
energy (p<0.05) also decreased significantly with an increasing supplementation of PA, while the
ash content significantly increased (p<0.01), most notably in the groups of prawns receiving the
highest levels of dietary PA (26.16 g PA kg-1). In conclusion, inclusions of up to 11.28 g PA kg-1
appear safe but levels above this have negative impacts. The results show that PA had significant
effects on the nutrient utilisation and body compositions (p<0.05) but not on growth performance
and FCR (p>0.05) on the M. rosenbergii reared under the experimental conditions that were
employed here. Key words: Malaysian giant river prawn; anti-nutritional factors; aquafeed; crustacean diet; sodium phytate; sustainable feeds.
2
ACCEPTED MANUSCRIPT
1. Introduction
Over the last four decades, attention has been devoted to the possibility of increasing the
inclusion of plant protein sources into the artificial diets given to aquaculture species because of
the unpredictable and limited supply of fish meal. A major proportion of current research focuses
on freshwater prawn production, where the cost of feed is one of the major expenditures. The
current study sets out to explore sustainability by focusing on the substitution of fishmeal with
sustainable ingredients, i.e. plant proteins. Importantly, an increase in using plant protein
ingredients as an alternative protein source does not appear to be a viable option for the future
unless the feed formulation is addressed. One of the major problems limiting the use of plant
protein is the presence of anti-nutritional factors (ANFs), such as phytic acid (myo-inositol
hexakisphosphate, PA), commonly found in most plant protein ingredients such as soybean meal,
wheat meal etc (Storebakken et al., 2000; Francis et al., 2001). Phytic acid is a concern because
of its ability to form complexes with proteins potentially rendering them unavailable with the
consequential impacts on growth performances of the target species.
Civera & Guillaume (1989) reported poor feed efficiency and growth rate in Penaeus
vannamei which was markedly depressed by phytic phosphorus and sodium phytate (SP) in this
particular diet (i.e. 15 g kg-1). Sodium phytate, however, had no detrimental effect on the growth
rate or survival of Penaeus [syn. Marsupenaeus] japonicus (see Civera & Guillaume, 1989)
when incorporated into diets at levels of 20 g PA kg-1. The review of Francis et al. (2001) on the
effects of ANFs indicated that the growth and feed efficiency in commonly cultured fish species
were negatively affected by the inclusion of phytate containing ingredients in the diets. Similar
reductions in growth performance have also been seen in fish-based studies with both
herbivorous and carnivorous species. For example, rainbow trout, Oncorhynchus mykiss, fed
purified diets containing casein and gelatine with an inclusion of 5 g PA kg-1 for 150 d were
found to have a reduced growth rate (Spinelli et al., 1983). Depressed growth was also reported
for common carp (Cyprinus carpio), Chinook salmon (Oncorhynchus tshawytscha) and Atlantic
salmon (Salmo salar) when fed 15 g kg-1 sodium phytate for 105 d, 28.5 g PA kg-1 for 56 d, and
20.7 g kg-1 of SP for 80 d, respectively (Richardson et al., 1985; Hossain & Jauncey, 1993;
Denstadli et al., 2006).
To date, there has been no published work on the effects of PA on the freshwater prawn,
Macrobrachium rosenbergii. The nutritional implications and interference of PA in the diets on
growth and health of M. rosenbergii, therefore, are still not known. Hence, the aim of the present
3
ACCEPTED MANUSCRIPT
study was to investigate the effects of graded levels of PA included in experimental diets
presented to M. rosenbergii on their growth performances, feed conversion ratio (FCR), nutrient
utilisation and whole body chemical composition. 2. Material and methods 2.1. Diets
The experimental diets were prepared within the feed processing room at the Institute of
Aquaculture (IoA), University of Stirling (UoS), Scotland. Six diets, nominally control-PA0,
PA5, PA10, PA15, PA20 and PA25, differed only in their PA and corn starch content, which was
added to obtain nominal inclusion rates of 0, 5, 10, 15, 20 and 25 g PA kg-1 in the diet. Fishmeal,
soy protein concentrates and wheat meal were selected as the main ingredients in the present
study. The dry ingredients were ground to a powder using a hammer mill prior to mixing them in
a A200 Hobart Ltd mixer and adding PA, fish oil and water. The mixture was steam-pelleted
using a California Pellet Mill (Model CL2) with a 1.0 mm die. Pellets were dried for 24 h at
40°C, once cool, the diets were packed in labelled polythene bags and kept at 4°C. A chemo-
attractant, an aqueous solution of 15% trimethylamine (TMA), was then sprayed on to a week's
ration of each diet prior to feeding. The formulation and chemical analyses of the experimental
diets are shown in Table 1. 2.2. Prawns and experimental conditions
The experimental feed trial was conducted over a period of 140 days within the Prawn
Unit, Tropical Aquarium at IoA, UoS. A total of 120 specimens of M. rosenbergii (mean initial
weight of 0.29 ± 0.02 g; mean initial carapace length of 6.03 ± 0.30 mm) that had been reared
from a single brood of fertilised eggs (taken from a population of M. rosenbergii originally from
Malaysia but bred and reared in the Tropical Aquarium, Institute of Aquaculture, University of
Stirling) were randomly distributed between tanks. Twenty-four experimental tanks each with a
capacity of 26.4 L were used, with four tanks being assigned to each treatment (n = 6
treatments). Each prawn was placed in cylindrical mesh pot, 18 cm tall × 10.5 cm in diameter
with a volume of 1.53 L, with five such pots per experimental tank.
4
ACCEPTED MANUSCRIPT
The recirculating system was supplied with aerated water (i.e. dissolved oxygen consistently >5
mg L-1) regulated at 28.7 ± 0.4°С and delivered at a fixed rate of 1 L min-1 such that a water
depth of 17 cm was maintained in all experimental tanks. Water quality parameters (ammonia,
nitrite and nitrate) were maintained within acceptable levels for the culture of M. rosenbergii
(see Boyd & Zimmerman, 2000) using mechanical and biological filters. Total water hardness
was 120–180 mg l-1 and pH was 7.2-7.6. Photoperiod within the experimental facility was set at
12 h light. Moulting events and mortalities were recorded on a daily basis. Exuviae were noted
and left to allow the animal to naturally feed on throughout the experiment.
2.3. Sampling
Prior to the allocation of the prawns to the experimental tanks, 120 animals were selected
at random and taken as an initial sample (i.e. T0) to determine the proximate composition. The
prawns were euthanased by submerging them in iced water for 1 min; the samples were
subsequently frozen (-20°C) and kept until analysis. All the experimental prawns were
individually weighed and the carapace lengths were measured at the start of the trial and then
every 20 days thereafter. Excess water was gently blotted with soft paper towel from each animal
which was then weighed using a top pan balance (Combics 1, Sartorius) to the nearest 0.01 g.
The carapace length was measured from the posterior margin of the eye orbit to the base of the
carapace using a calibrated vernier calliper to the nearest 0.01 mm. The same procedure was
used throughout the entire experimental period to reduce sampling error. Prawns were starved for
24 h prior to each weighing event. All experimental animals were individually hand fed to
apparent satiation twice a day at 09:00 am and 16:00 pm. The daily intake of feed was recorded
and uneaten food was collected by siphoning each pot after each feed and used to precisely
calculate feed intake and their FCR. At the end of the experimental period, the prawns were
euthanased by immersion in iced water and then frozen (-20°C) until analysed. Faecal matter was
collected by siphoning twice per day and was pooled for each treatment. Faeces were centrifuged
(Centaur 2 Sanyo) at 2,268 × g for 10 min to separate and discard the supernatant and then were
frozen at -20°C and kept until the samples could be analysed.
5
ACCEPTED MANUSCRIPT
2.4. Chemical analyses
The nutrient composition analyses, including moisture, crude protein, crude lipid, crude
fibre and the ash contents of the experimental diets, faeces, whole body samples were conducted
following AOAC procedures (1995). The dry matter of diets and the homogenates of prawn
whole body were determined by drying at 105°C for 24 h. Crude protein was determined by the
Kjeldahl method (Tecator KjeltecTM 2300, Foss, Warrington, UK (total nitrogen × 6.25)), while
crude lipid was determined after acid hydrolysis followed by petroleum ether extraction
according to the Soxhlet method (Tecator Soxtec 2050, Foss, Warrington, UK). Ash was
determined gravimetrically after combustion at 600°C for 12 h. The measurement of crude fibre
was determined using the FOSS fibercaps system. Gross energy was analysed using an adiabatic
bomb calorimeter (Parr 6200, USA) and benzoic acid as a standard. For elemental analysis, the
samples were digested in 5 ml of 69% nitric acid using a MarsXpress microwave (CEM
Corporation, USA) for 30 min and then allowed to cool. Once cool, the samples were diluted to
10 ml with distilled water and then prepared for analysis by inductively coupled plasma-optical
emission spectrometry (ICP-OES) (Thermo Scientific, USA). The phosphorus (P) content of
each tissue, however, was determined using the protocol detailed by Allen (1989). The phytic
acid analysis was determined by Megazyme, K-Phyt 05/07 (Megazyme Inc., USA), a method
that involves acid extraction of inositol phosphates followed by treatment with a phytase that is
specific for PA (IP6) and the lower myo-inositol phosphates (i.e. IP2, IP3, IP4, IP5). Subsequent
treatment with alkaline phosphatase ensures the release of the final phosphate from myo-inositol
(IP1) which is relatively resistant to the reaction of phytase. The total phosphate released was
measured using a colorimetric method as described by Lowry & Lopez (1946). 2.5. Calculations
All experimental animals were weighed and measured at the beginning of the trial and
then every 20 days thereafter until the end of the 140-day trial (see Figure 1). The data obtained
were analysed for growth performance, feed intake, FCR, protein efficiency ratio (PER) and
nutrient utilisation. Growth performance was calculated as weight gain (mean final body weight
– mean initial body weight) and carapace length increment (mean final carapace length – mean
initial carapace length).
6
ACCEPTED MANUSCRIPT
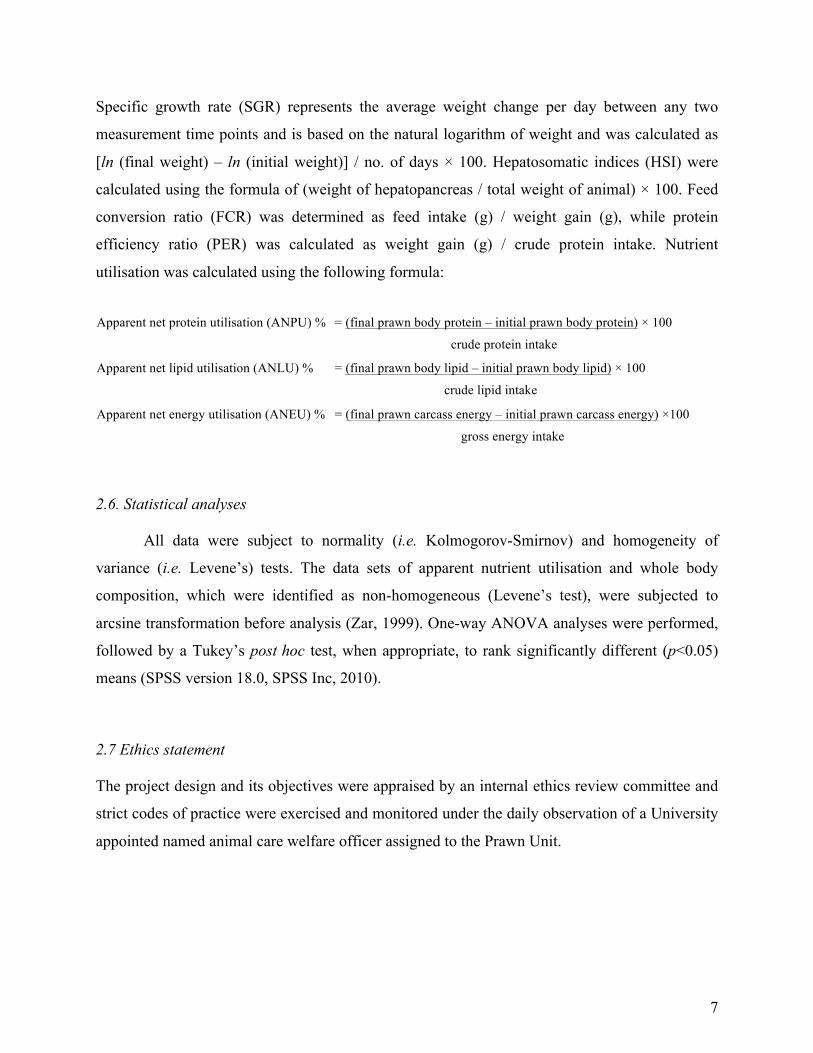
Specific growth rate (SGR) represents the average weight change per day between any two
measurement time points and is based on the natural logarithm of weight and was calculated as
[ln (final weight) – ln (initial weight)] / no. of days × 100. Hepatosomatic indices (HSI) were
calculated using the formula of (weight of hepatopancreas / total weight of animal) × 100. Feed
conversion ratio (FCR) was determined as feed intake (g) / weight gain (g), while protein
efficiency ratio (PER) was calculated as weight gain (g) / crude protein intake. Nutrient
utilisation was calculated using the following formula:
Apparent net protein utilisation (ANPU) % = (final prawn body protein – initial prawn body protein) × 100
crude protein intake Apparent net lipid utilisation (ANLU) % = (final prawn body lipid – initial prawn body lipid) × 100
crude lipid intake Apparent net energy utilisation (ANEU) % = (final prawn carcass energy – initial prawn carcass energy) ×100
gross energy intake 2.6. Statistical analyses
All data were subject to normality (i.e. Kolmogorov-Smirnov) and homogeneity of
variance (i.e. Levene’s) tests. The data sets of apparent nutrient utilisation and whole body
composition, which were identified as non-homogeneous (Levene’s test), were subjected to
arcsine transformation before analysis (Zar, 1999). One-way ANOVA analyses were performed,
followed by a Tukey’s post hoc test, when appropriate, to rank significantly different (p<0.05)
means (SPSS version 18.0, SPSS Inc, 2010). 2.7 Ethics statement The project design and its objectives were appraised by an internal ethics review committee and
strict codes of practice were exercised and monitored under the daily observation of a University
appointed named animal care welfare officer assigned to the Prawn Unit.
7
ACCEPTED MANUSCRIPT
3. Results 3.1. Diets
The main nutrients were consistent among the diets with approximately 908.0 g kg-1 dry
matter, 427.8 g kg-1 crude protein, 70.9 g kg-1 crude lipid and 19.5 kJ g-1 gross energy (Table 1).
The dietary PA content of the six experimental diets when analysed were close to the nominal
target values and were determined to be 0.26, 6.48, 11.28, 16.53, 21.45 and 26.16 g PA kg-1,
respectively. 3.2. Growth performance
Data on the growth, feed intake, FCR, PER and survival are presented in Tables 2 and 3.
The dietary inclusion of PA of up to 26.16 g kg-1 had no significant effects on the growth (i.e. in
a comparison of the increase in carapace length, weight gain and SGR) of M. rosenbergii when
compared to the controls. Differences in the weight of animals fed different inclusions of phytic
acid (PA) at each time point were tested for using one-way ANOVAs (Table 2). Dietary
treatments containing PA did not show any significant differences on the hepatosomatic index
(HSI) (Table 2). Survival over the 140-day trial was high at 85.0–95.0% regardless of the level
of dietary PA inclusion. The mortalities that did occur, however, were principally after weighing
events. Overall no significant effects of dietary PA level on feed intake and FCR were identified.
A one-way ANOVA comparing the different dietary treatments in each sample point showed no
significant effects between dietary PA and PER. 3.3. Apparent nutrient utilisation
Increasing dietary PA inclusions significantly decreased the nutrient utilisation of protein
(p<0.05), lipid (p<0.05) and energy (p<0.05; see Table 4). Prawns fed diets containing high
levels of dietary PA at 21.45–26.16 g PA kg-1 demonstrate significant lower ANPU (p<0.05) and
ANLU (p<0.05) values compared to prawns in the other groups and those in the controls. Similar
trends were found for ANLU with a decrease from 4.25% to −27.27% with increasing inclusion
levels of PA. Prawns fed the PA enriched experimental diets (16.53–26.16 g PA kg-1) resulted in
significantly lower ANLU values where negative values indicate lower levels of lipid that were
8
ACCEPTED MANUSCRIPT
retained in the carcass. Likewise, an increasing inclusion of dietary PA decreased ANEU from
13.51 to −2.74 kJ kg-1 (p<0.05). A dietary inclusion rate of 26.16 g PA kg-1 resulted in the
lowest, negative values of ANEU. 3.4. Whole body composition
There were significant effects on the protein, lipid, gross energy and ash content between
the treatment groups of M. rosenbergii fed the different levels of dietary PA diets while the
moisture content was not affected by the varied inclusion rates of PA (Table 5). The protein
content of the prawn receiving the experimental diet containing 26.16 g PA kg-1 were
significantly affected (p<0.05), with lower protein content than those prawns receiving the diet
containing 6.48 g PA kg-1. Likewise, the lipid content of the prawns receiving between 16.53 to
26.16 g PA kg-1 in their diets decreased significantly (p<0.01) and had lower levels of lipid than
the prawns in the other test and control groups. Prawns fed diets containing high levels of dietary
PA at 21.45–26.16 g PA kg-1 demonstrated significant lower (p<0.05) gross energy content in the
final carcass. In contrast to these results, the ash content of the whole body was found to increase
with an increasing inclusion of PA. Prawns fed the diet containing 16.53 to 26.16 g PA kg-1 had
a significantly higher ash content (p<0.01) than those prawns fed the diets containing no
inclusion of PA (control group) and between 6.48 to 11.28 g PA kg-1.
High PA levels (i.e. 21.45–26.16 g PA kg-1) were found to have negative effects (p<0.05)
on the whole body P concentration (Table 6). Linear regression analyses were conducted to
examine the relationship between calcium (Ca) concentration in the whole body and increasing
levels of dietary PA and an inverse trend was seen (p<0.005) with increasing PA inclusion. The
results of the linear regression model indicated Ca content was evidently elevated and linked to
the increasing PA inclusion (r2= 0.61, F (1, 9) = 14.1, p<0.005). There were no significant
differences between the groups for the zinc (Zn) (0.13%–0.19%), magnesium (Mg) (3.15%–
5.35%), potassium (K) (16.77%–19.95%) and sodium (Na) (5.00%–6.56%) content of the whole
body that varied little. The copper (Cu) content varied from 0.06 to 0.10% and the iron (Fe)
content from 0.03 to 0.08% with the highest observed levels for both trace elements being seen
in the M. rosenbergii group receiving the 11.28 g PA kg-1 diet. There were no significant
differences between the groups for either of these elements when tested for using a one-way
ANOVA.
9

ACCEPTED MANUSCRIPT
For the trace element manganese (Mn), there were no differences between experimental groups
and levels did not appear to be influenced by the level of PA within the diet. Graded inclusion of
PA resulted in a significant increase (p<0.05) in the ash concentration in the whole body of M.
rosenbergii, from 2.18% to 5.95%.
4. Discussion
Although the present study indicates that juvenile M. rosenbergii can tolerate up to 26.16
g PA kg-1 in their diet without adverse effects on growth, survival or on SGR and HSI, levels
exceeding 16.53 PA kg-1 appear to exert a series of negative impacts, with levels >20 g PA kg-1
resulting in a significant decrease in nutrient utilisation. Civera & Guillaume (1989) working
with juvenile P. vannamei found poor growth when 15 g kg-1 sodium phytate was added to their
diets for 28 d, whereas the inclusion of up to 20 g kg-1 had no apparent detrimental effect on the
growth performances or survival of juvenile P. japonicus. For the current trial, the growth of the
freshwater prawns was assessed every 20 days, to explore the performance of each group of
prawns throughout the 140-day trial. The regular collection of data (i.e. every 20 days) ensured
data for analysis, as opposed to only taking start and end weights which may have missed some
subtleties in growth between groups, but has an increased probability of complete data loss if
animals are lost. With regular growth assessments, however, there is a concern that handling
stress, despite the level of care exercised, may impact on growth. No significant differences in
growth were seen here but the sampling methodology cannot be ruled out as possible
contributory factor towards this. The findings from the current study suggest that M. rosenbergii
are able to tolerate higher levels of PA than are suggested for P. vannamei (Civera & Guillaume,
1989) and for a variety of fish species (Spinelli et al., 1983; Richardson et al., 1985; Hossain &
Jauncey, 1993; Denstadli et al., 2006). This is probably because M. rosenbergii are omnivorous
and can adjust to reductions in the nutritional value of prepared diets, i.e. in their protein source,
vitamin and mineral content, by increasing their consumption of available vegetation (Ling,
1969; Weidenbach, 1982). Successful replacement of fishmeal with plant protein is, however,
feasible in semi-intensive pond culture systems where there is a contribution from natural
productivity as has been observed by Tidwell et al. (1995) and by Tacon & Akiyama (1997). A
better understanding of the role of natural productivity to satisfy nutrient deficiencies
particularly, when using high plant protein diets containing high levels of anti-nutrients, to
decrease production cost is needed.
10
ACCEPTED MANUSCRIPT
In the present study, feed intake did not indicate any apparent adaptation to PA during the
experimental period. The feed intake pattern was approximately maintained for all groups.
Civera & Guillaume (1989) reported that the feed consumption of P. japonicus and P. vannamei
seemed to diminish markedly and demonstrated poor feed utilisation when fed diets containing
sodium phytate (15–20 g kg-1) for over 28 days. In the current study, diets were formulated to
meet the nutritional requirements of M. rosenbergii and TMA was used as a feed attractant. The
protein sources that were used were fishmeal and plant protein (i.e. soy protein concentrate and
wheat meal) used in a ratio of 1:1.5. The high concentration levels of protein and energy in the
diets possibly allowed for sufficient digestion and for metabolic purposes without causing
significant deleterious effects. If a lower level of protein and energy in the diet had been used,
then PA may have complexed with high quality dietary protein thereby reducing its availability.
Whether the lack of an effect of PA on feed intake is attributable to maintained palatability of the
formulated diet or physiological mechanisms remains to be elucidated.
By comparison, fish based studies, for example, that were conducted by Richardson et al.
(1985) reported that an inclusion of 25.8 g PA kg-1 significantly depressed PER in Chinook
salmon. In a marked contrast to this latter study, research conducted by Lin (2005) reported that
an inclusion of up to 20 g PA kg-1 did not significantly affect PER in juvenile cobia,
Rachycentron canadum. Despite the high inclusion of PA of up to 26.16 g PA kg-1, no significant
differences were observed for PER in M. rosenbergii (Table 3) among the treatment groups due
to the provision of sufficient protein in the diets. It is also essential to note that the source of
protein and therefore the variable inclusion of PA in various diets, as highlighted by Teskeredźić
et al. (1995), may play a role in the diversified results that are seen. In the present study,
fishmeal was used as the protein source as was also used in the fish-based studies conducted by
Riche & Garling (2004), Denstadli et al. (2006) and by Lin (2005). In the fish-based studies of
Spinelli et al. (1983), Richardson et al. (1985), Hossain & Jauncey (1993) and Sajjadi & Carter
(2004), and in the crustacean-based studies by Civera & Guillaume (1989) and Davis et al.
(1993), however, casein was the principal protein ingredient that was used. Intact proteins and
amino acids differ in their
11

ACCEPTED MANUSCRIPT
capacity for binding to PA as reviewed by Dendougui & Schwedt (2004). Casein forms “casein
micelles” and these structures are linked together with phosphate groups, demonstrating that they
may serve as a preferable substrate for binding to PA (IP6) (Horne, 1998). The extent to which
protein availability and digestion is inhibited by PA–protein interactions, therefore, will vary
between proteins due to differences in the total number of cationic groups available to participate
in binding with phytate (Adeola & Sands, 2003).
Results from the present study found that the inclusions of dietary PA statistically
affected protein (ANPU), lipid (ANLU) and energy (ANEU) utilisations (Table 4). The inclusion
of 26.16 g PA kg-1 evidently decreased protein utilisation by as much as three-fold when
compared to the levels determined for the M. rosenbergii within the control group. This agrees
with the early study of Hossain & Jauncey (1993) who determined that an inclusion of 10 g PA
kg-1 in the diet presented to common carp, Cyprinus carpio, depressed protein utilisation. The
results from Table 4 indicate that inclusion of PA in all the experimental diets did not affect
growth performance, however, PA included in diets at a rate of 21.45 - 26.16 g PA kg-1 were
seen to have an impact at the metabolic level. The chelation of PA with protein here does not
make available sufficient dietary protein for utilisation, as seen by the decreasing trend in ANPU
with an increasing inclusion of PA in the diet. The decrease in ANEU helps explain the observed
drop in ANPU. Lipid is an alternative energy source when protein is not available, in the present
study, however, it appears that the prawn are not able to utilise lipid as efficiently as protein and
this is seen by the marked decrease in ANLU in the prawn fed diets containing >16.53 PA kg-1.
Earlier studies conducted with Atlantic salmon by Denstadli et al. (2006) likewise found
that the digestibility of lipid in Atlantic salmon fed the highest PA level, i.e. 20.7 g PA kg-1, was
significantly reduced although the differences that were reported were minor when compared the
other treatment group and to the control. These latter authors suggested that the significant
decrease in lipid digestibility exhibited by Atlantic salmon might have been due to the reduced
bile acid concentration. There is, however, no evidence for the production of bile acids by
crustaceans (Boonyaratpalin, 1996). This suggests that the metabolic processes of emulsification,
digestion and transportation of lipids in crustaceans differ from fish species. Lipid transport in
shrimp, however, is accomplished primarily through high density lipoproteins (Boonyaratpalin,
1996). The ternary binding between lipase–mineral–PA which could reduce the capacity of
lipase to liberate fatty acids and thereby facilitate the digestion of lipids as indicated by Knuckles
(1988), is therefore the most probable explanation.
12
ACCEPTED MANUSCRIPT
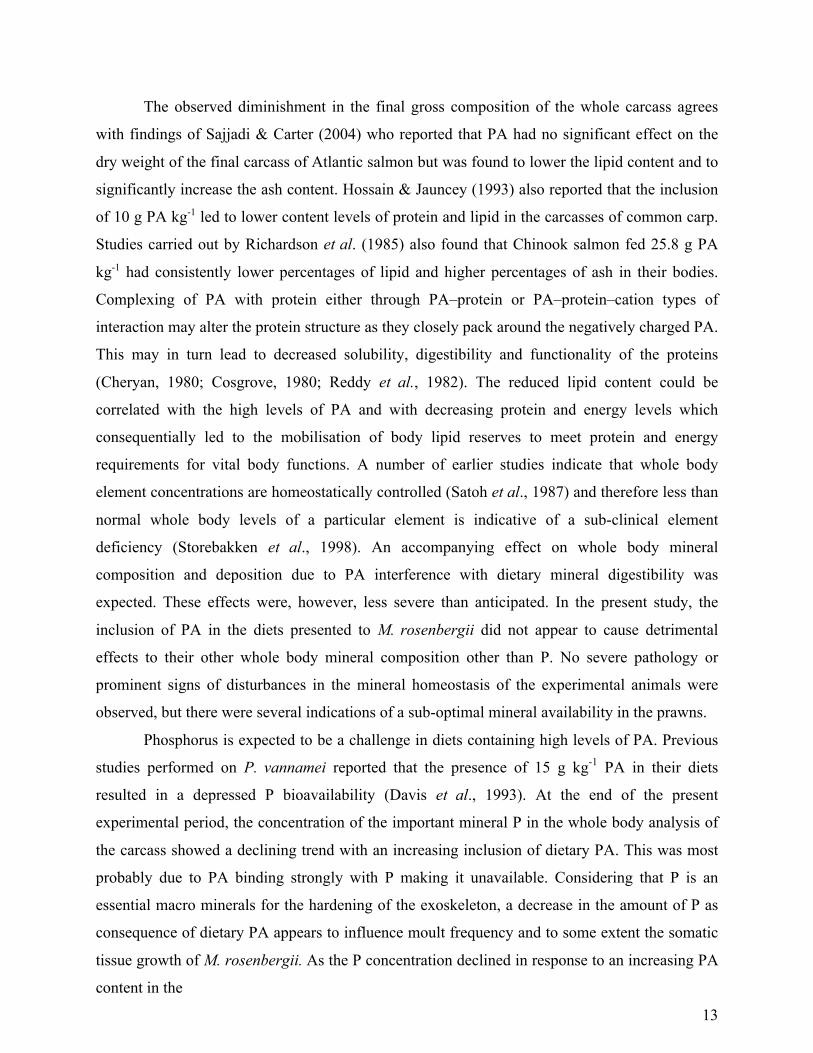
The observed diminishment in the final gross composition of the whole carcass agrees
with findings of Sajjadi & Carter (2004) who reported that PA had no significant effect on the
dry weight of the final carcass of Atlantic salmon but was found to lower the lipid content and to
significantly increase the ash content. Hossain & Jauncey (1993) also reported that the inclusion
of 10 g PA kg-1 led to lower content levels of protein and lipid in the carcasses of common carp.
Studies carried out by Richardson et al. (1985) also found that Chinook salmon fed 25.8 g PA
kg-1 had consistently lower percentages of lipid and higher percentages of ash in their bodies.
Complexing of PA with protein either through PA–protein or PA–protein–cation types of
interaction may alter the protein structure as they closely pack around the negatively charged PA.
This may in turn lead to decreased solubility, digestibility and functionality of the proteins
(Cheryan, 1980; Cosgrove, 1980; Reddy et al., 1982). The reduced lipid content could be
correlated with the high levels of PA and with decreasing protein and energy levels which
consequentially led to the mobilisation of body lipid reserves to meet protein and energy
requirements for vital body functions. A number of earlier studies indicate that whole body
element concentrations are homeostatically controlled (Satoh et al., 1987) and therefore less than
normal whole body levels of a particular element is indicative of a sub-clinical element
deficiency (Storebakken et al., 1998). An accompanying effect on whole body mineral
composition and deposition due to PA interference with dietary mineral digestibility was
expected. These effects were, however, less severe than anticipated. In the present study, the
inclusion of PA in the diets presented to M. rosenbergii did not appear to cause detrimental
effects to their other whole body mineral composition other than P. No severe pathology or
prominent signs of disturbances in the mineral homeostasis of the experimental animals were
observed, but there were several indications of a sub-optimal mineral availability in the prawns.
Phosphorus is expected to be a challenge in diets containing high levels of PA. Previous
studies performed on P. vannamei reported that the presence of 15 g kg-1 PA in their diets
resulted in a depressed P bioavailability (Davis et al., 1993). At the end of the present
experimental period, the concentration of the important mineral P in the whole body analysis of
the carcass showed a declining trend with an increasing inclusion of dietary PA. This was most
probably due to PA binding strongly with P making it unavailable. Considering that P is an
essential macro minerals for the hardening of the exoskeleton, a decrease in the amount of P as
consequence of dietary PA appears to influence moult frequency and to some extent the somatic
tissue growth of M. rosenbergii. As the P concentration declined in response to an increasing PA
content in the
13
ACCEPTED MANUSCRIPT
diet, there was an increase in the Ca content of the whole body of M. rosenbergii, suggesting a
strong close correlation between the two minerals and dietary PA. The results of the present
study are clearly in agreement with earlier studies conducted on shrimp species, i.e. M. japonicus
and P. vannamei. Civera & Guillaume (1989) reported similar findings where the ash (P) content
of the exoskeleton of M. japonicus, and for P. vannamei although but less clearly, was
significantly reduced while there was a simultaneous elevation in the Ca content.The
mechanisms involved are complex; it may involve calcification, absorption, and acid-base
balance. In addition, M. rosenbergii can uptake minerals from its aquatic surroundings; an
imbalance of these elements, therefore, could be compensated for immediately by an uptake by
active transport via the gills, skin or mouth (NRC, 1993; Davis & Kurmaly, 1993; Guillaume et
al., 2001). 5. Conclusion
The findings from the present study, which aimed to investigate the effects of increasing
PA levels up to 26.16 g PA kg-1, in diets fed to M. rosenbergii, resulted in significant decreases
in the protein, lipid and energy utilisations particularly in those animals receiving the highest
inclusion of PA. Inclusions of up to 11.28 g PA kg-1 appear safe to include, but levels exceeding
this, i.e. >16.53 PA kg-1 appear to exert a series of negative impacts. Significant changes in the
protein, lipid, gross energy and ash compositions of the carcass were also observed, again most
notably in those animals fed the diet containing the highest level of PA. These changes may have
a serious impact on meeting the nutritional requirements of M. rosenbergii, particularly when
fishmeal is substituted with protein derived from plant sources. Care, therefore, must be taken to
ensure that the levels of dietary PA in feeds for M. rosenbergii are sufficient to meet these
nutritional demands and are appropriate for optimal production. As an extension to this work,
trials exploring the addition of microbial phytase and its activity specifically in hydrolysing PA
when added as a supplement to practical diets containing high levels of plant protein that are fed
to M. rosenbergii were carried out and will be reported on in a future manuscript.
Acknowledgements This project forms part of a PhD programme of study funded by the Ministry of Higher
Education Malaysia and University Malaysia Terengganu (UMT). The author would like to
thank the staff in the Prawn Unit, Tropical Aquarium and Aquaculture Nutrition Laboratory,
Institute of Aquaculture, University of Stirling for their kind assistance with technical aspects of
this study.
14
ACCEPTED MANUSCRIPT References Adeola, O., Sands, J.S. 2003. Does supplemental dietary microbial phytase improve amino acid utilization? A perspective that it does not. J. Anim. Sci. 81 (2), 78-85. doi:/2003.8114_suppl_2E78x Allen, S.E., 1989. Chemical Analysis of Ecological Materials. Chapter 5. Nutrient elements. Second Edition. Blackwell Scientific Publications. pp 134-136. Association of Official Analytical Chemists (AOAC), 1995. Official Methods of Analysis of AOAC International (16th ed.), Arlington, VA. ISBN: 0935584544 Boonyaratpalin M., 1996. Nutritional requirements of commercially important shrimps in the tropics. In: Santiago, C.B., Coloso, R.M., Millamena, O.M. & Borlongan, I.G. (Eds.). Feeds for Small-Scale Aquaculture. Proceedings of the National Seminar-Workshop on Fish Nutrition and Feeds. Tigbauan, Iloilo, Philippines: SEAFDEC Aquaculture Department, 10-28. Boyd, C. & Zimmermann, S., 2000. Grow-out systems–water quality and soil management. In: New, M.B. & Valenti, W.C. (Eds.), Freshwater Prawn Culture. The Farming of Macrobrachium rosenbergii. Chapter 14. Blackwell Science, pp. 221-238. doi: 10.1002/9780470999554. Cheng, W.W. & Guillaume, J., 1984. Etude de la nutrition phosphocalcique de la crevette japonaise, Marsupenaeus japonicus (Bate). Comm. ICES, Mariculture Committee, 12, 1-14. Cheryan, M., 1980. Phytic acid interactions in food systems. CRC Cr. Rev. Food Sci. 13, 297-335. doi: 10.1080/10408398009527293. Civera, R. & Guillaume, J., 1989. Effect of sodium phytate on growth and tissue mineralization of Penaeus japonicus and Penaeus vannamei juveniles. Aquaculture 77, 145-156. doi: 10.1016/0044-8486(89)90198-1. Cosgrove, D.J., 1980. Inositol Phosphates: Their Chemistry, Biochemistry and Physiology. Elsevier Scientific, Amsterdam, pp 1-191. ISBN: 9780444418746. Davis, D.A. & Kurmaly, K., 1993. Advances in mineral nutrition for aquatic species. In: Proceedings of VICTAM International Conference Feed Production Tomorrow II. October 25th, 1993, Bangkok, Thailand. pp 1-16. Davis, D.A., Lawrence, A.L. & Gatlin III, D.M., 1993. Evaluation of dietary zinc requirement of Penaeus vannamei and effects of phytic acid on zinc and phosphorus bioavailability. J. World Aquacult. Soc. 24, 40-47. doi: 10.1111/j.1749-7345.1993.tb00148.x. Dendougui, F. & Schwedt, G., 2004. In vitro analysis of binding capacities of calcium to phytic acid in different food samples. Eur. Food Res. Technol. 219, 409-415. doi: 10.1007/s00217-004-0912-7 Denstadli, V., Skrede, A., Krogdahl, Å., Sahlstrøm, S. & Storebakken, T., 2006. Feed intake, feed conversion, digestibility, enzyme activities and intestinal structure in Atlantic salmon (Salmo salar L.) fed graded levels of phytic acid. Aquaculture 256, 365-376. doi: 10.1016/j.aquaculture.2006.02.021
15
ACCEPTED MANUSCRIPT Francis, G., Makkar, H.P.S. & Becker, K., 2001. Antinutritional factors present in plant-derived alternate fish feed ingredients and their effects in fish. Aquaculture 199, 197-227. doi: 10.1016/S0044-8486(01)00526-9. Guillaume, J., Kaushik, S., Bergot, P. & Mètailler, R., 2001. Nutrition and Feeding of Fish and Crustaceans. Springer–Praxis Publishing Ltd Chichester, UK: INRA/IFREMER. Horne, D.S., 1998. Casein interactions: casting light on the black boxes, the structure in dairy products. Int. Dairy J. 8, 171-177. doi:10.1016/S0958-6946(98)00040-5. Hossain, M.A. & Jauncey, K., 1993. The effects of varying dietary phytic acid, calcium and magnesium levels on the nutrition of common carp, Cyprinus carpio. In: Kaushik, S.J. & Luquet, P. (Eds), Fish Nutrition in Practice. Biarritz (France), June 24-27, 1991. INRA, Paris 1993, L Colloques, 61, 705-715. ISBN-10: 2738004490 / ISBN-13: 978-2738004499. Knuckles, B.L., 1988. Effect of phytate and other myo-inositol phosphate esters on lipase activity. J. Food Sci. 50, 250-252. doi: 10.1111/j.1365-2621.1988.tb10221.x. Lin, C., 2005. Effects of dietary phytic acid contents and dephytinized plant protein supplementation on growth and utilization of phosphorus, zinc and iron in juvenile cobia (Rachycentron canadum). Master Thesis. National Sun Yat-sen University, 1-95. (Available at http:///etd.lib.nsysu.edu.tw/ETD-db?ETD-search/viewetd? URN= etd0213106-170246 Ling, S.W., 1969. The general biology and development of Macrobrachium rosenbergii (De Man). FAO Fisheries Report 57 (3), 589-606. Lowry, O.H. & Lopez, J.A., 1946. The determination of inorganic phosphate in the presence of labile phosphate esters. J. Biol. Chem. 162, 421-428. Megazyme International, 2007. Phytic acid (phytate)/total phosphorus. Measured as phosphorus released by phytase and alkaline phosphatase. Megazyme International Ireland Ltd. Available at: http://secure.megazyme.com/downloads/en/data/K-PHYT.pdf. NRC (National Research Council), 1993. Nutrient Requirements of Fish. National Academy Press, Washington, DC, USA. Reddy, N.R., Sathe, S.K. & Salunkhe, D.K., 1982. Phytates in legumes and cereals. Adv. Food Res. 28, 1-92. Richardson, N.L., Higgs, D.A., Beames R.M. & McBride, J.R., 1985. Influence of dietary calcium, phosphorus, zinc and sodium phytate level on cataract incidence, growth and histopathology in juvenile chinook salmon (Oncorhynchus tshawytscha). J. Nutr. 115, 553-567. Riche, M. & Garling, D.L., 2004. Effect of phytic acid on growth and nitrogen retention in tilapia Oreochromis niloticus L. Aquacult. Nutr. 10, 389-400. Doi: 10.1111/j.1365-2095.2004.00314.x. Sajjadi, M. & Carter, C.G., 2004. Effect of phytic acid and phytase on feed intake, growth, digestibility, and trypsin activity in Atlantic salmon (Salmo salar L.). Aquacult. Nutr. 10, 135-142. doi: 10.1111/j.1365-2095.2003.00290.x.
16

ACCEPTED MANUSCRIPT
Satoh, S., Takeuchi, T. & Watanabe, T., 1987. Changes of mineral composition in whole body of rainbow trout during growth stages. Nippon Suisan Gakkaishi 53, 273-279. Spinelli, J., Houle, C.R. & Wekell, J.C., 1983. The effect of phytates on the growth of rainbow trout fed purified diets containing varying quantities of calcium and magnesium. Aquaculture 30, 71-83. doi: 10.1016/0044-8486(83)90153-9. Storebakken, T., Shearer, K.D. & Roem, A.J., 1998. Availability of protein, phosphorus and other elements in fishmeal, soy-protein concentrate and phytase-treated soy-protein-concentrate-based diets to Atlantic salmon, Salmo salar. Aquaculture 161, 365-379. Storebakken, T., Shearer, K.D. & Roem, A.J., 2000. Growth, uptake and retention of nitrogen and phosphorus, and absorption of other minerals in Atlantic salmon Salmo salar fed diets with fish meal and soy-protein concentrate as the main source of protein. Aquacult. Nutr. 6, 103-108. doi: 10.1046/j.1365-2095.2000.00135.x Tacon, A.G.J. & Akiyama, D.M., 1997. Feed ingredients. In: D’Abramo, L.R., Conklin, D.E. & Akiyama, D.M. (Eds.), Crustacean Nutrition. Advances in World Aquaculture. World Aquaculture Society, Baton Rouge, LA., 6, pp. 411-472. ISBN-13: 978-1888807004 / ISBN-10: 1888807008. Teskeredžić, Z., Higgs, D.A., Dosanjh, B.S., McBride, J.R., Hardy, R.W., Beames, R.M., Jones, J.D., Simell, M., Vaara, T. & Bridges, R.B., 1995. Assessment of undephytinized and dephytinized rapeseed protein concentrate as sources of dietary protein for juvenile rainbow trout (Oncorhynchus mykiss). Aquaculture 131, 261-277. doi: 10.1016/0044-8486(94)00334-K Tidwell, J.H., Webster, C.D., Sedlacek, J.D., Weston, P.A., Knight, W.L. & D’Abramo, L.R., 1995. Effects of complete and supplemental diets and organic pond fertilization on production of Macrobrachium rosenbergii and associated benthic macroinvertebrate populations. Aquaculture 138, 169-180. doi: 10.1016/0044-8486(95)01074-2 Weidenbach, R.P., 1982. Dietary components of prawns reared in Hawaiian ponds. In: New, M.B. (Ed.) Giant Prawn Farming. Developments in Aquaculture and Fisheries Sciences, 10, pp. 257-267. ISBN-10: 0444420932 / ISBN-13: 978-0444420930. Zar, J.H., 1999. Biostatistical Analysis. Prentice-Hall International Editions, London, U.K., 4th Edition. ISBN-13: 978-0130815422 / ISBN-10: 013081542X.
17

ACCEPTED MANUSCRIPT Table 1. Feed formulations and analysed chemical composition of the experimental diets presented to Macrobrachium rosenbergii.
Ingredients Diet 1 Diet 2 Diet 3 Diet 4 Diet 5 Diet 6 Formulations (g kg-1) Fishmeal1 320.0 320.0 320.0 320.0 320.0 320.0 Soy protein conc.2 285.0 285.0 285.0 285.0 285.0 285.0 Wheat meal 210.0 210.0 210.0 210.0 210.0 210.0 Corn starch 88.0 80.2 72.4 64.6 56.8 50.0 Fish oil3 40.0 40.0 40.0 40.0 40.0 40.0 Vitamin premix4 15.0 15.0 15.0 15.0 15.0 15.0 Mineral premix5 15.0 15.0 15.0 15.0 15.0 15.0 Yttrium oxide6 2.0 2.0 2.0 2.0 2.0 2.0 Carboxymethyl-
25.0 25.0 25.0 25.0 25.0 25.0 cellulose7
Phytic acid8 0.0 6.9 13.8 20.7 27.6 34.5
Chemical composition (g kg-1) Dry matter 908.5 908.3 908.1 908.4 907.5 907.4 Crude protein 429.4 426.7 425.9 428.8 427.3 428.5 Crude lipid 69.8 70.0 70.5 71.9 72.0 72.2 Crude fibre 20.6 20.4 19.5 20.1 18.8 19.0 Ash 68.5 69.2 69.7 70.2 70.7 71.1 NFE9 320.6 320.7 319.7 312.5 311.5 307.3 Gross energy10 19.7 19.6 19.6 19.6 19.5 19.0 Phytic acid 0.26 6.48 11.28 16.53 21.45 26.16 1Ewos Ltd; 2soy protein concentrate, BioMar UK Ltd; 3herring oil; 4per kg of diet: 1000 IU retinol palmitate; 4 mg
cholecalciferol; 7,000 mg tocopherol acetate; 1,500 mg vitamin K; 37,500 mg ascorbic acid; 4,250 mg vitamin B1; 3,000 mg vitamin B2; 1,250 mg vitamin B6; 1.25 mg vitamin B12; 5,250 mg calcium pantothenate; 12,500 mg niacin; 90 mg biotin; 1,000 mg folic acid; 74,050 mg choline chloride; 25,000 mg inositol; 200 mg ethoxyquin; 5per kg of diet: 472.77 g CaCO3; 0.3 g CaIO3.6H2O; 0.13 g CrCl3.6H2O; 0.48 g CoSO4.7H2O; 0.75 g CuSO4.5H2O; 25.0 g FeSO4.7H2O; 127.5 g MgSO4.7H2O; 2.54 g MnSO4.4H2O; 50.0 g KCl; 60.0 g NaCl; 5.5 g ZnSO4.4H2O; 6Sigma Aldrich (205168); 7Sigma Aldrich (C5013); 8phytic acid sodium salt hydrate from rice (Sigma Aldrich P8810); 9Nitrogen free extract; 10 (kJ g-1).
18
ACCEPTED MANUSCRIPT
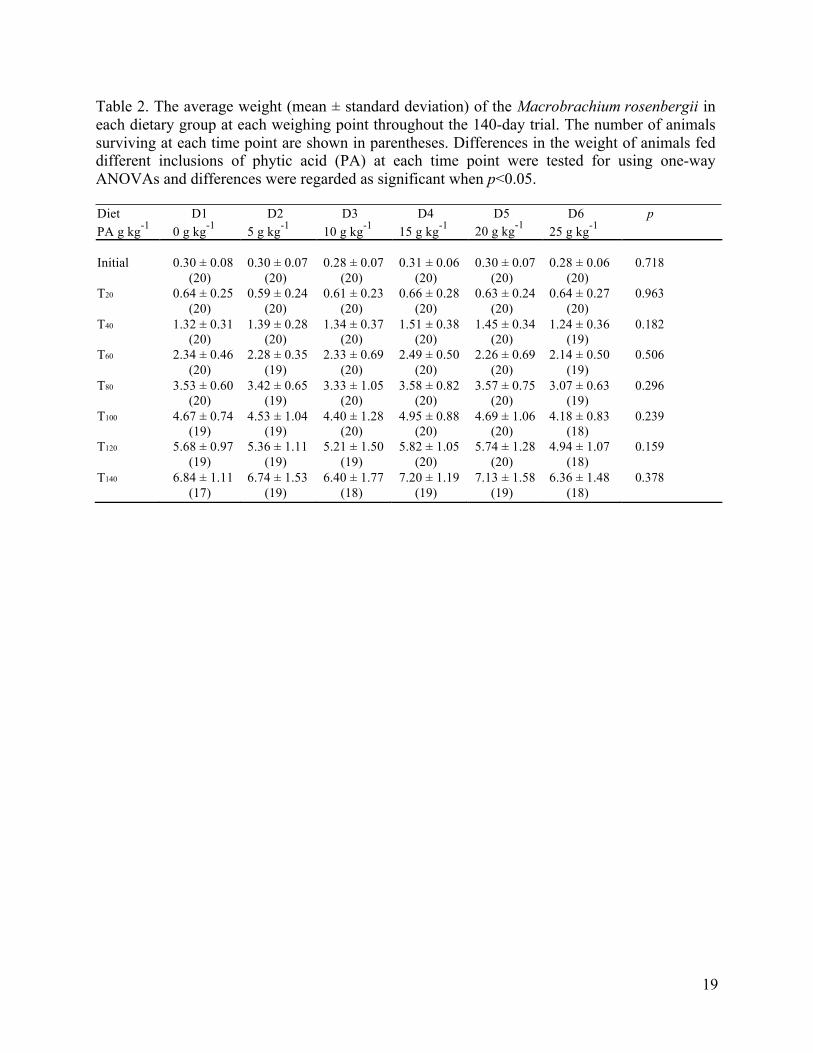
Table 2. The average weight (mean ± standard deviation) of the Macrobrachium rosenbergii in each dietary group at each weighing point throughout the 140-day trial. The number of animals surviving at each time point are shown in parentheses. Differences in the weight of animals fed different inclusions of phytic acid (PA) at each time point were tested for using one-way ANOVAs and differences were regarded as significant when p<0.05. Diet D1 D2 D3 D4 D5 D6 p PA g kg-1 0 g kg-1 5 g kg-1 10 g kg-1 15 g kg-1 20 g kg-1 25 g kg-1
Initial 0.30 ± 0.08 0.30 ± 0.07 0.28 ± 0.07 0.31 ± 0.06 0.30 ± 0.07 0.28 ± 0.06 0.718 (20) (20) (20) (20) (20) (20) T20 0.64 ± 0.25 0.59 ± 0.24 0.61 ± 0.23 0.66 ± 0.28 0.63 ± 0.24 0.64 ± 0.27 0.963 (20) (20) (20) (20) (20) (20) T40 1.32 ± 0.31 1.39 ± 0.28 1.34 ± 0.37 1.51 ± 0.38 1.45 ± 0.34 1.24 ± 0.36 0.182 (20) (20) (20) (20) (20) (19) T60 2.34 ± 0.46 2.28 ± 0.35 2.33 ± 0.69 2.49 ± 0.50 2.26 ± 0.69 2.14 ± 0.50 0.506 (20) (19) (20) (20) (20) (19) T80 3.53 ± 0.60 3.42 ± 0.65 3.33 ± 1.05 3.58 ± 0.82 3.57 ± 0.75 3.07 ± 0.63 0.296 (20) (19) (20) (20) (20) (19) T100 4.67 ± 0.74 4.53 ± 1.04 4.40 ± 1.28 4.95 ± 0.88 4.69 ± 1.06 4.18 ± 0.83 0.239 (19) (19) (20) (20) (20) (18) T120 5.68 ± 0.97 5.36 ± 1.11 5.21 ± 1.50 5.82 ± 1.05 5.74 ± 1.28 4.94 ± 1.07 0.159 (19) (19) (19) (20) (20) (18) T140 6.84 ± 1.11 6.74 ± 1.53 6.40 ± 1.77 7.20 ± 1.19 7.13 ± 1.58 6.36 ± 1.48 0.378 (17) (19) (18) (19) (19) (18)
19
ACCEPTED MANUSCRIPT
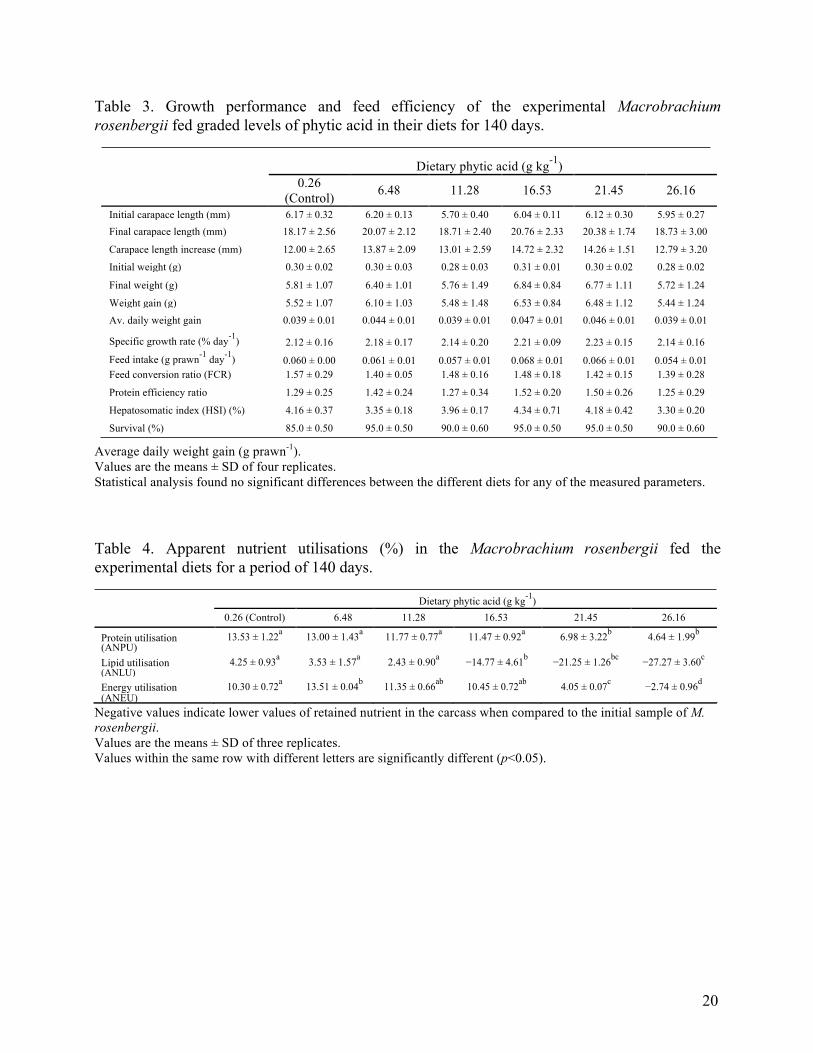
Table 3. Growth performance and feed efficiency of the experimental Macrobrachium rosenbergii fed graded levels of phytic acid in their diets for 140 days. Dietary phytic acid (g kg-1) 0.26 6.48 11.28 16.53 21.45 26.16 (Control)
Initial carapace length (mm) 6.17 ± 0.32 6.20 ± 0.13 5.70 ± 0.40 6.04 ± 0.11 6.12 ± 0.30 5.95 ± 0.27 Final carapace length (mm) 18.17 ± 2.56 20.07 ± 2.12 18.71 ± 2.40 20.76 ± 2.33 20.38 ± 1.74 18.73 ± 3.00
Carapace length increase (mm) 12.00 ± 2.65 13.87 ± 2.09 13.01 ± 2.59 14.72 ± 2.32 14.26 ± 1.51 12.79 ± 3.20
Initial weight (g) 0.30 ± 0.02 0.30 ± 0.03 0.28 ± 0.03 0.31 ± 0.01 0.30 ± 0.02 0.28 ± 0.02
Final weight (g) 5.81 ± 1.07 6.40 ± 1.01 5.76 ± 1.49 6.84 ± 0.84 6.77 ± 1.11 5.72 ± 1.24
Weight gain (g) 5.52 ± 1.07 6.10 ± 1.03 5.48 ± 1.48 6.53 ± 0.84 6.48 ± 1.12 5.44 ± 1.24 Av. daily weight gain 0.039 ± 0.01 0.044 ± 0.01 0.039 ± 0.01 0.047 ± 0.01 0.046 ± 0.01 0.039 ± 0.01
Specific growth rate (% day-1) 2.12 ± 0.16 2.18 ± 0.17 2.14 ± 0.20 2.21 ± 0.09 2.23 ± 0.15 2.14 ± 0.16 Feed intake (g prawn-1 day-1) 0.060 ± 0.00 0.061 ± 0.01 0.057 ± 0.01 0.068 ± 0.01 0.066 ± 0.01 0.054 ± 0.01 Feed conversion ratio (FCR) 1.57 ± 0.29 1.40 ± 0.05 1.48 ± 0.16 1.48 ± 0.18 1.42 ± 0.15 1.39 ± 0.28
Protein efficiency ratio 1.29 ± 0.25 1.42 ± 0.24 1.27 ± 0.34 1.52 ± 0.20 1.50 ± 0.26 1.25 ± 0.29
Hepatosomatic index (HSI) (%) 4.16 ± 0.37 3.35 ± 0.18 3.96 ± 0.17 4.34 ± 0.71 4.18 ± 0.42 3.30 ± 0.20
Survival (%) 85.0 ± 0.50 95.0 ± 0.50 90.0 ± 0.60 95.0 ± 0.50 95.0 ± 0.50 90.0 ± 0.60 Average daily weight gain (g prawn-1). Values are the means ± SD of four replicates. Statistical analysis found no significant differences between the different diets for any of the measured parameters. Table 4. Apparent nutrient utilisations (%) in the Macrobrachium rosenbergii fed the experimental diets for a period of 140 days. Dietary phytic acid (g kg-1) 0.26 (Control) 6.48 11.28 16.53 21.45 26.16
Protein utilisation 13.53 ± 1.22a 13.00 ± 1.43a 11.77 ± 0.77a 11.47 ± 0.92a 6.98 ± 3.22b 4.64 ± 1.99b
(ANPU)
Lipid utilisation 4.25 ± 0.93a 3.53 ± 1.57a 2.43 ± 0.90a −14.77 ± 4.61b −21.25 ± 1.26bc −27.27 ± 3.60c
(ANLU)
Energy utilisation 10.30 ± 0.72a 13.51 ± 0.04b 11.35 ± 0.66ab 10.45 ± 0.72ab 4.05 ± 0.07c −2.74 ± 0.96d
(ANEU) Negative values indicate lower values of retained nutrient in the carcass when compared to the initial sample of M. rosenbergii. Values are the means ± SD of three replicates. Values within the same row with different letters are significantly different (p<0.05).
20
ACCEPTED MANUSCRIPT
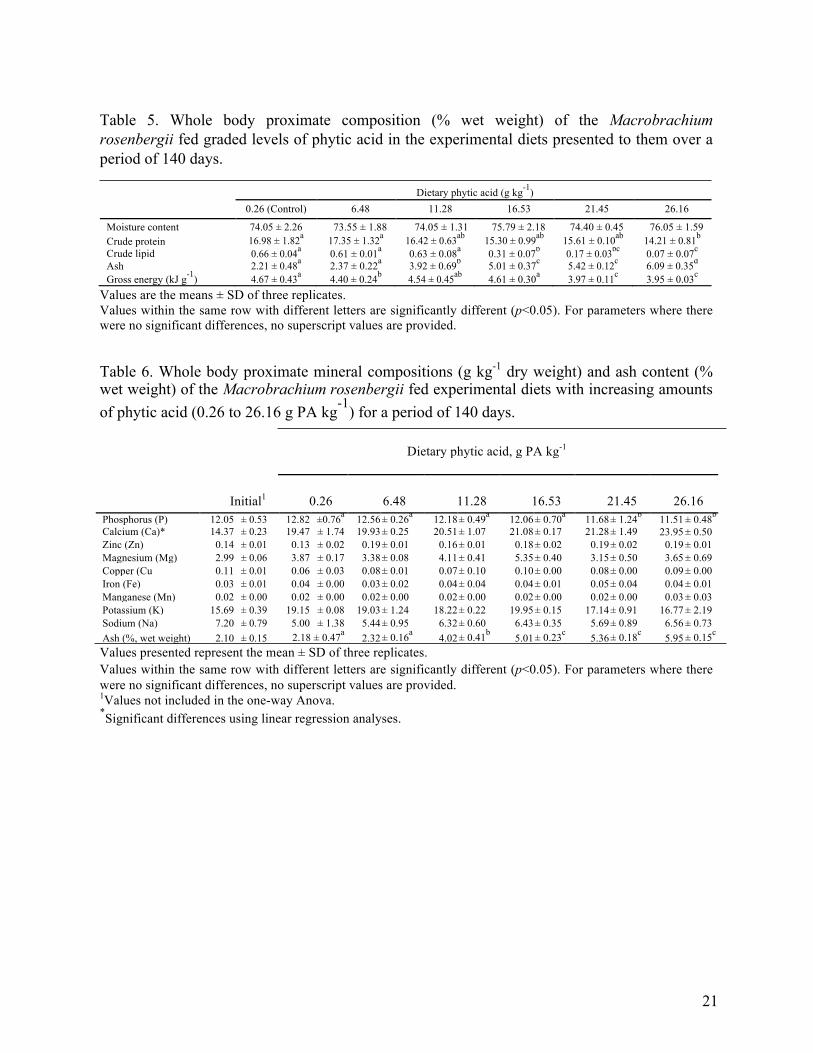
Table 5. Whole body proximate composition (% wet weight) of the Macrobrachium rosenbergii fed graded levels of phytic acid in the experimental diets presented to them over a period of 140 days.
Dietary phytic acid (g kg-1) 0.26 (Control) 6.48 11.28 16.53 21.45 26.16
Moisture content 74.05 ± 2.26 73.55 ± 1.88 74.05 ± 1.31 75.79 ± 2.18 74.40 ± 0.45 76.05 ± 1.59 Crude protein 16.98 ± 1.82a 17.35 ± 1.32a 16.42 ± 0.63ab 15.30 ± 0.99ab 15.61 ± 0.10ab 14.21 ± 0.81b
Crude lipid 0.66 ± 0.04a 0.61 ± 0.01a 0.63 ± 0.08a 0.31 ± 0.07b 0.17 ± 0.03bc 0.07 ± 0.07c
Ash 2.21 ± 0.48a 2.37 ± 0.22a 3.92 ± 0.69b 5.01 ± 0.37c 5.42 ± 0.12c 6.09 ± 0.35d
Gross energy (kJ g-1) 4.67 ± 0.43a 4.40 ± 0.24b 4.54 ± 0.45ab 4.61 ± 0.30a 3.97 ± 0.11c 3.95 ± 0.03c Values are the means ± SD of three replicates. Values within the same row with different letters are significantly different (p<0.05). For parameters where there were no significant differences, no superscript values are provided.
Table 6. Whole body proximate mineral compositions (g kg-1 dry weight) and ash content (% wet weight) of the Macrobrachium rosenbergii fed experimental diets with increasing amounts of phytic acid (0.26 to 26.16 g PA kg-1) for a period of 140 days.
Dietary phytic acid, g PA kg-1
Initial1
0.26 6.48 11.28 16.53 21.45 26.16
Phosphorus (P) 12.05 ± 0.53 12.82 ±0.76a 12.56 ± 0.26a 12.18 ± 0.49a 12.06 ± 0.70a 11.68 ± 1.24b 11.51 ± 0.48b
Calcium (Ca)* 14.37 ± 0.23 19.47 ± 1.74 19.93 ± 0.25 20.51 ± 1.07 21.08 ± 0.17 21.28 ± 1.49 23.95 ± 0.50 Zinc (Zn) 0.14 ± 0.01 0.13 ± 0.02 0.19 ± 0.01 0.16 ± 0.01 0.18 ± 0.02 0.19 ± 0.02 0.19 ± 0.01 Magnesium (Mg) 2.99 ± 0.06 3.87 ± 0.17 3.38 ± 0.08 4.11 ± 0.41 5.35 ± 0.40 3.15 ± 0.50 3.65 ± 0.69 Copper (Cu 0.11 ± 0.01 0.06 ± 0.03 0.08 ± 0.01 0.07 ± 0.10 0.10 ± 0.00 0.08 ± 0.00 0.09 ± 0.00 Iron (Fe) 0.03 ± 0.01 0.04 ± 0.00 0.03 ± 0.02 0.04 ± 0.04 0.04 ± 0.01 0.05 ± 0.04 0.04 ± 0.01 Manganese (Mn) 0.02 ± 0.00 0.02 ± 0.00 0.02 ± 0.00 0.02 ± 0.00 0.02 ± 0.00 0.02 ± 0.00 0.03 ± 0.03 Potassium (K) 15.69 ± 0.39 19.15 ± 0.08 19.03 ± 1.24 18.22 ± 0.22 19.95 ± 0.15 17.14 ± 0.91 16.77 ± 2.19 Sodium (Na) 7.20 ± 0.79 5.00 ± 1.38 5.44 ± 0.95 6.32 ± 0.60 6.43 ± 0.35 5.69 ± 0.89 6.56 ± 0.73 Ash (%, wet weight) 2.10 ± 0.15 2.18 ± 0.47a 2.32 ± 0.16a 4.02 ± 0.41b 5.01 ± 0.23c 5.36 ± 0.18c 5.95 ± 0.15c
Values presented represent the mean ± SD of three replicates. Values within the same row with different letters are significantly different (p<0.05). For parameters where there were no significant differences, no superscript values are provided. 1Values not included in the one-way Anova. *Significant differences using linear regression analyses.
21
ACCEPTED MANUSCRIPT
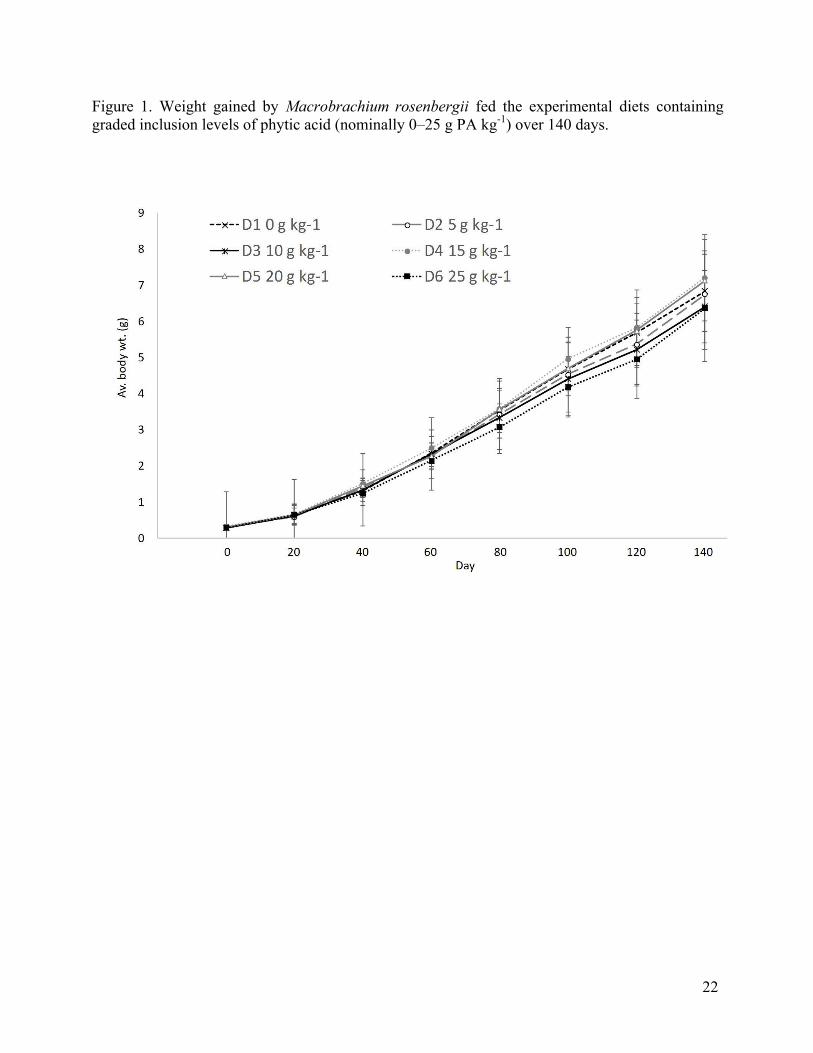
Figure 1. Weight gained by Macrobrachium rosenbergii fed the experimental diets containing graded inclusion levels of phytic acid (nominally 0–25 g PA kg-1) over 140 days.
22