Embed Size (px)
Citation preview

Elsevier Editorial System(tm) for Electric Power Systems Research Manuscript Draft Manuscript Number: EPSR-D-11-00523R1 Title: Characterisation of Power System Events on South African Transmission Power Lines Article Type: Research Paper Keywords: faults, causes, probability, lightning, birds, climate Corresponding Author: Mr Ulrich John Minnaar, M.Sc (Eng) Corresponding Author's Institution: First Author: Ulrich John Minnaar, M.Sc (Eng) Order of Authors: Ulrich John Minnaar, M.Sc (Eng); Trevor Gaunt, PhD; Fred Nicolls, PhD Abstract: Records of faults occurring on the South African power transmission system over a 16-year period have been collected. Over 12000 faults were analysed to find statistical relationships between local climate, key design parameters of the overhead lines, and the main causes of power system faults identified as bird streamers, lightning, fire and pollution. The results characterize the performance of the South African transmission system on a probabilistic basis and illustrate differences in fault cause statistics for the summer and winter rainfall areas of South Africa and for different times of the year and day. The analysis illustrates the effectiveness of bird guards on towers.
Dear Editor The manuscript entitled “Characterisation of Power System Events on South African Transmission Power Lines” by Ulrich Minnaar (corresponding author), Trevor Gaunt and Fred Nicolls, is hereby resubmitted to be considered for publication in the Electric Power Systems Research Journal. The original submission has been revised to take into account the comments made by the reviewers. All co-authors have seen and agree with the contents of the manuscript and we certify that the submission is original work and is not under review at any other publication. Kind Regards Ulrich Minnaar
Cover Letter

The main fault causes of transmission line faults in South Africa are lightning, fire
bird streamers and pollution.
Over 12000 faults have been analysed.
A method is presented relating transmission line faults to the regional climate
classified by the dominant rainfall type
The statistical significance is established of the differences between mean fault
frequencies for fault causes, climate, time of day and season
The effectiveness of bird guards is illustrated.
Highlights
1
Characterisation of Power System Events on South African Transmission Power Lines
UJ Minnaara,b
CT Gauntb and F Nicolls
b
a) Eskom Holdings, South Africa
b) University of Cape Town, Department of Electrical Engineering, Cape Town, South Africa
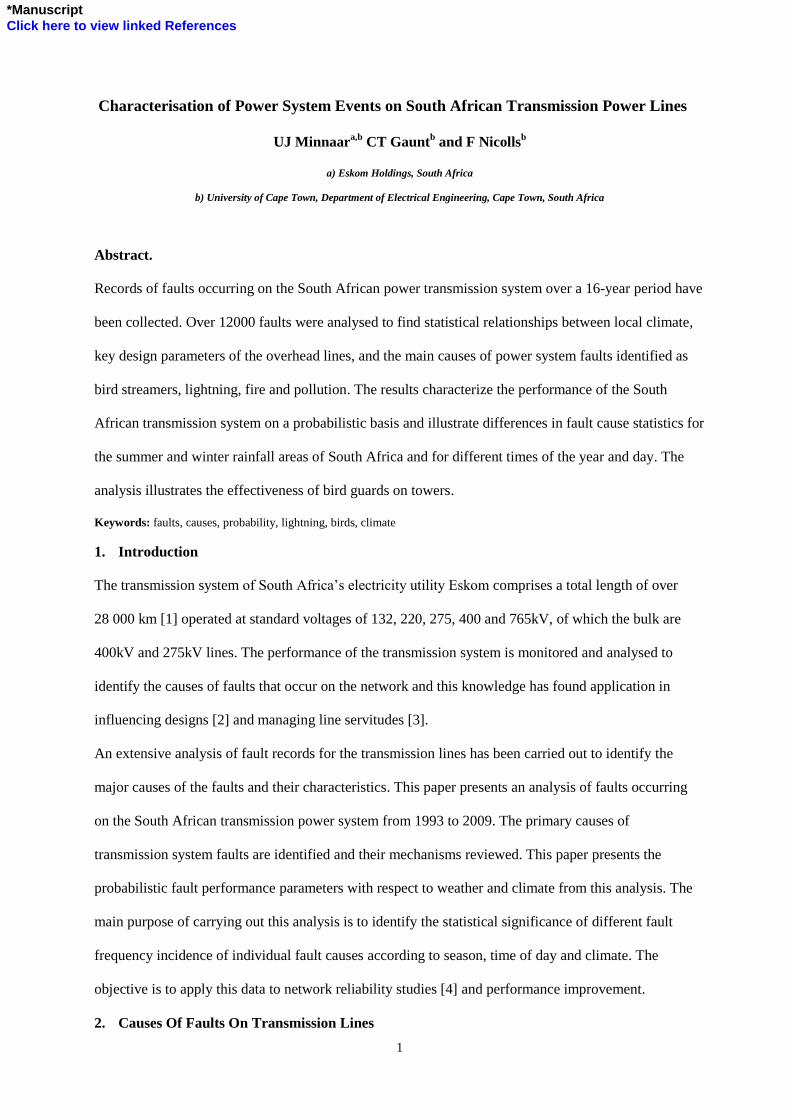
Abstract.
Records of faults occurring on the South African power transmission system over a 16-year period have
been collected. Over 12000 faults were analysed to find statistical relationships between local climate,
key design parameters of the overhead lines, and the main causes of power system faults identified as
bird streamers, lightning, fire and pollution. The results characterize the performance of the South
African transmission system on a probabilistic basis and illustrate differences in fault cause statistics for
the summer and winter rainfall areas of South Africa and for different times of the year and day. The
analysis illustrates the effectiveness of bird guards on towers.
Keywords: faults, causes, probability, lightning, birds, climate
1. Introduction
The transmission system of South Africa‟s electricity utility Eskom comprises a total length of over
28 000 km [1] operated at standard voltages of 132, 220, 275, 400 and 765kV, of which the bulk are
400kV and 275kV lines. The performance of the transmission system is monitored and analysed to
identify the causes of faults that occur on the network and this knowledge has found application in
influencing designs [2] and managing line servitudes [3].
An extensive analysis of fault records for the transmission lines has been carried out to identify the
major causes of the faults and their characteristics. This paper presents an analysis of faults occurring
on the South African transmission power system from 1993 to 2009. The primary causes of
transmission system faults are identified and their mechanisms reviewed. This paper presents the
probabilistic fault performance parameters with respect to weather and climate from this analysis. The
main purpose of carrying out this analysis is to identify the statistical significance of different fault
frequency incidence of individual fault causes according to season, time of day and climate. The
objective is to apply this data to network reliability studies [4] and performance improvement.
2. Causes Of Faults On Transmission Lines
*ManuscriptClick here to view linked References

2
2.1 Classification of Fault Causes
Vosloo investigated fault causes on the transmission system and concluded that the majority of
transmission network faults are “…in one way or another connected to natural phenomena such as
weather and climate or occurs as a consequence thereof.”[3]. In 2004 a list of primary fault causes and
sub-categories was introduced by Eskom to allow analysis of faults that could be traced to the root
cause of faults [3], as listed in table 1. Faults due to „other‟ causes include events due to occurrences
such as failure of hardware, poor workmanship, tree contact, impact of foreign objects, theft and
vandalism.
Wind and lightning have been identified as the two major weather-related causes of outages [5]. The
Eskom classification does not include wind as a major cause of faults in South Africa. Generally,
transmission systems are only affected by extreme wind conditions with a low frequency of occurrence.
2.2 Fault Data
A total of 12229 faults occurred on the Eskom transmission overhead lines during the period 1993 to
the end of 2009. Figure 1 illustrates the breakdown of fault causes according to the categories in table 1.
The four most significant individual causes of faults are birds, lightning, fire and pollution, together
causing 89% of all faults, including those not classified.
3. Characteristics of Major Fault Causes
3.1 Bird
Birds cause flashovers on power lines in three ways [6] along two different flashover paths illustrated in
figure 2.
3.1.1 Bird Streamer
Bird streamers were first identified as a cause of unknown transmission line faults in California in the
1920‟s [7]. Flashovers are caused by large birds (vultures, herons, hadeda ibis and the bigger raptors)
excreting long streamers which short circuit the air gap between the structure and the conductor [8].
Flashovers using simulated streamers have been successfully reproduced under laboratory conditions in
the USA [9] and South Africa [10].
Experiences with bird streamer flashover have been documented by Burnham in Florida [11], who
provided a list of characteristics associated with bird streamer occurrence. Single-phase-to-ground fault
3
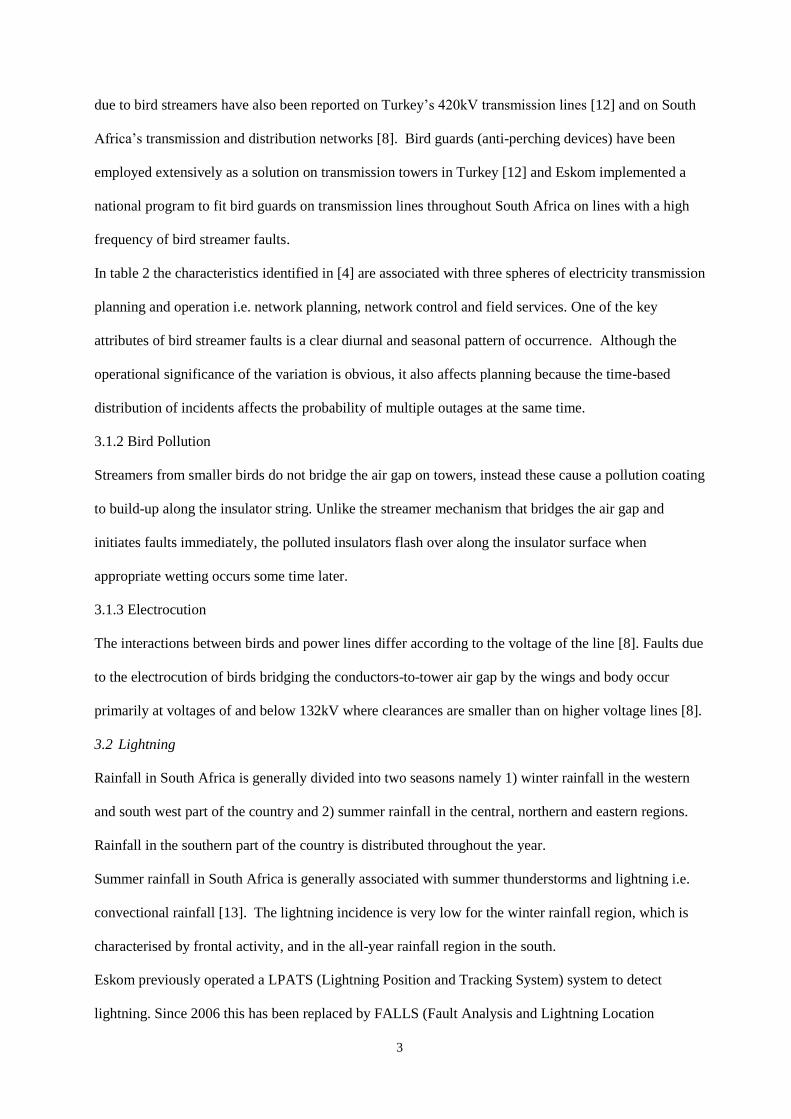
due to bird streamers have also been reported on Turkey‟s 420kV transmission lines [12] and on South
Africa‟s transmission and distribution networks [8]. Bird guards (anti-perching devices) have been
employed extensively as a solution on transmission towers in Turkey [12] and Eskom implemented a
national program to fit bird guards on transmission lines throughout South Africa on lines with a high
frequency of bird streamer faults.
In table 2 the characteristics identified in [4] are associated with three spheres of electricity transmission
planning and operation i.e. network planning, network control and field services. One of the key
attributes of bird streamer faults is a clear diurnal and seasonal pattern of occurrence. Although the
operational significance of the variation is obvious, it also affects planning because the time-based
distribution of incidents affects the probability of multiple outages at the same time.
3.1.2 Bird Pollution
Streamers from smaller birds do not bridge the air gap on towers, instead these cause a pollution coating
to build-up along the insulator string. Unlike the streamer mechanism that bridges the air gap and
initiates faults immediately, the polluted insulators flash over along the insulator surface when
appropriate wetting occurs some time later.
3.1.3 Electrocution
The interactions between birds and power lines differ according to the voltage of the line [8]. Faults due
to the electrocution of birds bridging the conductors-to-tower air gap by the wings and body occur
primarily at voltages of and below 132kV where clearances are smaller than on higher voltage lines [8].
3.2 Lightning
Rainfall in South Africa is generally divided into two seasons namely 1) winter rainfall in the western
and south west part of the country and 2) summer rainfall in the central, northern and eastern regions.
Rainfall in the southern part of the country is distributed throughout the year.
Summer rainfall in South Africa is generally associated with summer thunderstorms and lightning i.e.
convectional rainfall [13]. The lightning incidence is very low for the winter rainfall region, which is
characterised by frontal activity, and in the all-year rainfall region in the south.
Eskom previously operated a LPATS (Lightning Position and Tracking System) system to detect
lightning. Since 2006 this has been replaced by FALLS (Fault Analysis and Lightning Location
4
System) operated by the South African Weather Services due to the previous system reaching the end of
its life and not meeting operational requirements [14].
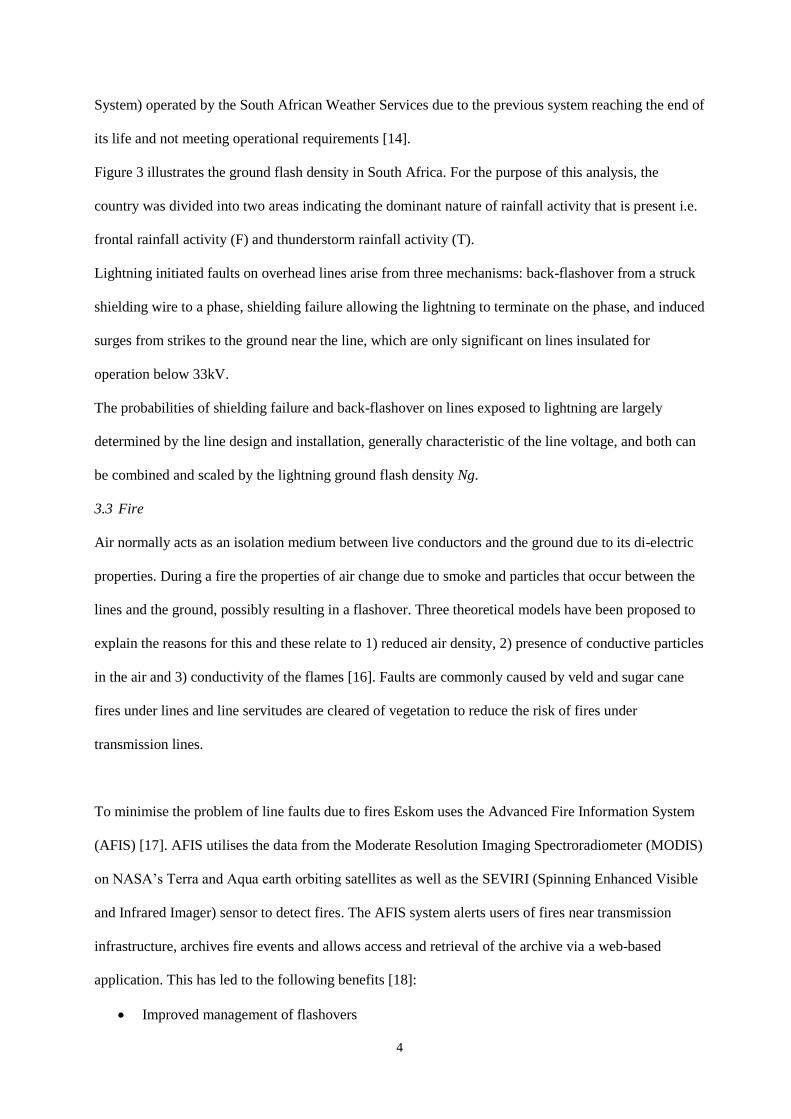
Figure 3 illustrates the ground flash density in South Africa. For the purpose of this analysis, the
country was divided into two areas indicating the dominant nature of rainfall activity that is present i.e.
frontal rainfall activity (F) and thunderstorm rainfall activity (T).
Lightning initiated faults on overhead lines arise from three mechanisms: back-flashover from a struck
shielding wire to a phase, shielding failure allowing the lightning to terminate on the phase, and induced
surges from strikes to the ground near the line, which are only significant on lines insulated for
operation below 33kV.
The probabilities of shielding failure and back-flashover on lines exposed to lightning are largely
determined by the line design and installation, generally characteristic of the line voltage, and both can
be combined and scaled by the lightning ground flash density Ng.
3.3 Fire
Air normally acts as an isolation medium between live conductors and the ground due to its di-electric
properties. During a fire the properties of air change due to smoke and particles that occur between the
lines and the ground, possibly resulting in a flashover. Three theoretical models have been proposed to
explain the reasons for this and these relate to 1) reduced air density, 2) presence of conductive particles
in the air and 3) conductivity of the flames [16]. Faults are commonly caused by veld and sugar cane
fires under lines and line servitudes are cleared of vegetation to reduce the risk of fires under
transmission lines.
To minimise the problem of line faults due to fires Eskom uses the Advanced Fire Information System
(AFIS) [17]. AFIS utilises the data from the Moderate Resolution Imaging Spectroradiometer (MODIS)
on NASA‟s Terra and Aqua earth orbiting satellites as well as the SEVIRI (Spinning Enhanced Visible
and Infrared Imager) sensor to detect fires. The AFIS system alerts users of fires near transmission
infrastructure, archives fire events and allows access and retrieval of the archive via a web-based
application. This has led to the following benefits [18]:
Improved management of flashovers

5
Better overview of fires and
Increased planning decision-support for vegetation management close to transmission lines.
3.4 Environmental Pollution of Insulators
The pollution flashover mechanism is mainly a function of the properties of the insulator surface. For
hydrophilic surfaces, such as glass and ceramics, the surface wets completely so that an electrolytic film
covers the insulator; hydrophobic surfaces, such as silicone rubber, cause the water to bead into separate
droplets preventing the formation of a continuous layer [19].
The two main pollution processes are [19]:
Pre-deposited pollution of salt and industrial particulates that accumulates over time and needs
to be wetted to form a conducting electrolyte. Although the effect of bird deposits is similar to
this effect, its classified under birds because it helps to identify mitigation approaches.
Instantaneous pollution that is already a conducting electrolyte.
Methods and techniques to assess the severity of pollution at a particular site include: surface deposit
technique to determine the level of pollution on an insulator, directional dust deposit gauges, site
severity classification and automated insulator pollution monitoring [19].
4. Analysing Faults In Relation To Weather And Climate
4.1 Analysis Methodology
This analysis proposes the characterisation of power system performance by weather and climate. Since
many of the causes of faults are characterised by seasonal or diurnal variation, the mean and variance of
the frequency of faults can be analysed for a 16-element matrix of time-of-year or season, and time-of-
day [20]. The steps of the analysis are:
Associate each transmission line to a rainfall area i.e. thunderstorm or frontal
Characterise transmission system fault records according to the major cause type identified (as
indicated in figure 3)
Characterise faults by time-of-day and seasonal quadrants.

6
For all causes of faults, the fault incidence is generally scaled by the line length, representing the
exposure to the stress or cause of fault. For this case the grid management regions names adopted in
Eskom serve as geographic indicators that can be used to link individual lines to the regional severity as
depicted in maps.
4.2 Management of Data
Fault data records were collated in spreadsheet format with standardised line descriptions, geospatial
information system (GIS) number assigned to lines, line length, line design and operating voltages, start
date and time of event, original fault description, assigned fault cause and sub-cause, and Eskom
Transmission grid region. The issues and processes documented for gathering and cleaning up the fault
data on the Eskom transmission network for analysis purposes include [3]:
A lack of knowledge concerning fault mechanisms in earlier years
Incorrect application of line naming convention
Changes in line configuration
Vague descriptions by operators, e.g. storm, where there is no indication of whether the fault is due
to a lightning strike or wetting of a polluted insulator and consequent fault
Recording of “fire” as a cause where investigation records indicated that the fire had been put out
prior to the fault occurring.
The data was complemented with data from the Eskom GIS database on transmission lines which
includes geographic co-ordinates for each transmission tower (longitude, latitude, height above sea
level).
The event spreadsheet was inspected to ensure that all relevant fields were populated, naming
conventions were standardised and the GIS number assigned matched the line description. The GIS
number assigned to lines was utilised as the reference for consistent linkage of events to lines.
The ground flash density (Ng) map as displayed in figure 3 illustrates Ng in 20 km squares. Ground
flash density per line is calculated for each square, and each tower within a square is assigned a value
for flash density equal to that for the square within which it is located. The flash density per line is
calculated by averaging Ng across the towers that comprise a transmission line.
A database was constructed that:

7
grouped Eskom‟s transmission grid regions according to the thunderstorm and frontal activity
areas illustrated in figure 3. The geographic areas assigned to the management regions can be
divided neatly with the southern and western grid management regions falling in the frontal
activity areas and the other four grid management regions falling into the thunderstorm activity
area;
linked the transmission lines with grid regions; and
linked fault data with respective transmission lines.
The construction of the database in this manner ensures that 1) data integrity is kept with respect to line
and regional data, and 2) event data can be analysed with respect to geographic context.
The original faults dataset consisting of 12229 events was reduced to 11753 for analysis due to:
Events occurring on lines without GIS numbers assigned, and
Events occurring on lines not described in the lines dataset extracted from the GIS database.
5. Transmission System Results and Discussion
The average fault frequency for the two rainfall areas depicted in table 3 shows that lines located within
the summer rainfall area of South Africa have a higher fault frequency than those within the frontal
activity area.
The fault frequency statistics for the major voltage levels are presented in figure 4. These results
provide indicative values of fault performance for transmission lines at the respective voltage levels
within the identified rainfall areas for planning future networks.
5.1 Fault Frequency by Rainfall Activity Area – 400kV lines
Lines operated at 400kV comprise the bulk of the South African Transmission system with extensive
exposure to both frontal and thunderstorm activity. Figure 4 illustrates quite clearly that the average
fault frequency for 400kV lines in the thunderstorm activity area is significantly higher than those
located in the frontal rainfall areas. Visually inspecting the fault frequency of 400kV lines based on the
primary fault causes shown in figure 5, shows the following:
The fault frequency for faults caused by fire and lightning is higher in the thunderstorm rainfall
area than in the frontal rainfall area
8
The fault frequency of pollution faults is higher in the frontal rainfall area compared with the
thunderstorm rainfall activity
There are insignificant differences in fault frequency for bird streamers and “other” fault causes
between the two rainfall areas
using the dominant rainfall activity as a climatic indicator for characterising faults appears to be
useful because rainfall and lightning are associated together in the thunderstorm region, and
rainfall and fire are indirectly related in that the absence of rain during the winter months leads
to dry conditions with high levels of light combustible fuels e.g. dry grass.
The frequency of faults due to fire, lightning and pollution are directly related to the existing local
climate as represented by the nature of the rainfall activity in the area. Further, this analysis provides a
clear indicator of the fault causes for which local climate plays a much smaller role in the frequency
with which they occur e.g. bird streamers.
This analysis identifies where relationships exist between local climate and causes of power system
faults. The impact of local climate on transmission line performance is illustrated by the differences in
overall line performance and the line performance for individual fault causes in the two climatic
regions.
5.2 Time-of-day and time-of-year analysis
The time-of-day and time-of-year analysis for networks and specific fault causes can be graphically
represented using bar charts that associate seasonal and time-of-day intervals with interruption indices
in a similar manner to the 4 by 4 matrix intervals proposed for system reliability studies [20]. Using a
limited number of fault causes and time-season categories ensures sufficient events for statistically
significant samples while achieving a useful distinction between them.
5.2.1 Bird Streamer
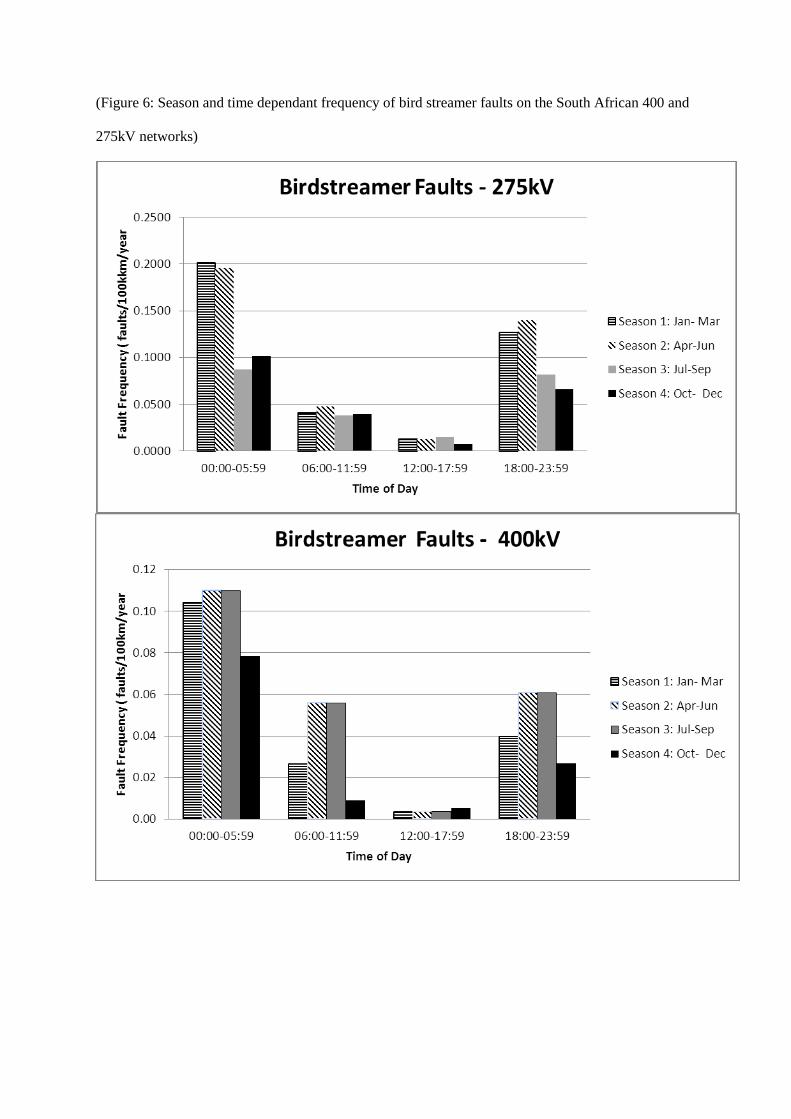
Figure 6 illustrates the diurnal and seasonal patterns commonly associated with bird streamers on the
400 and 275kV networks. Fault frequency on the 400kV network is at its peak of 0.11faults/100km/
year from January to September in the early hours of the morning until 06:00.
9
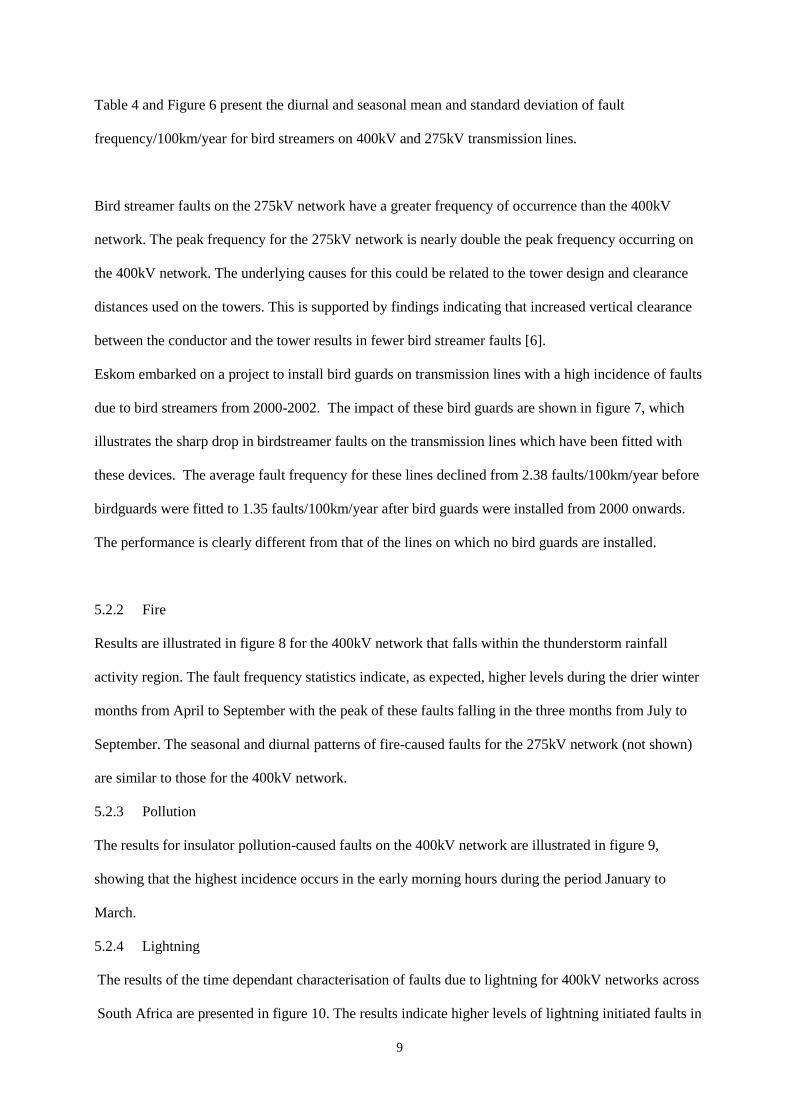
Table 4 and Figure 6 present the diurnal and seasonal mean and standard deviation of fault
frequency/100km/year for bird streamers on 400kV and 275kV transmission lines.
Bird streamer faults on the 275kV network have a greater frequency of occurrence than the 400kV
network. The peak frequency for the 275kV network is nearly double the peak frequency occurring on
the 400kV network. The underlying causes for this could be related to the tower design and clearance
distances used on the towers. This is supported by findings indicating that increased vertical clearance
between the conductor and the tower results in fewer bird streamer faults [6].
Eskom embarked on a project to install bird guards on transmission lines with a high incidence of faults
due to bird streamers from 2000-2002. The impact of these bird guards are shown in figure 7, which
illustrates the sharp drop in birdstreamer faults on the transmission lines which have been fitted with
these devices. The average fault frequency for these lines declined from 2.38 faults/100km/year before
birdguards were fitted to 1.35 faults/100km/year after bird guards were installed from 2000 onwards.
The performance is clearly different from that of the lines on which no bird guards are installed.
5.2.2 Fire
Results are illustrated in figure 8 for the 400kV network that falls within the thunderstorm rainfall
activity region. The fault frequency statistics indicate, as expected, higher levels during the drier winter
months from April to September with the peak of these faults falling in the three months from July to
September. The seasonal and diurnal patterns of fire-caused faults for the 275kV network (not shown)
are similar to those for the 400kV network.
5.2.3 Pollution
The results for insulator pollution-caused faults on the 400kV network are illustrated in figure 9,
showing that the highest incidence occurs in the early morning hours during the period January to
March.
5.2.4 Lightning
The results of the time dependant characterisation of faults due to lightning for 400kV networks across
South Africa are presented in figure 10. The results indicate higher levels of lightning initiated faults in
10
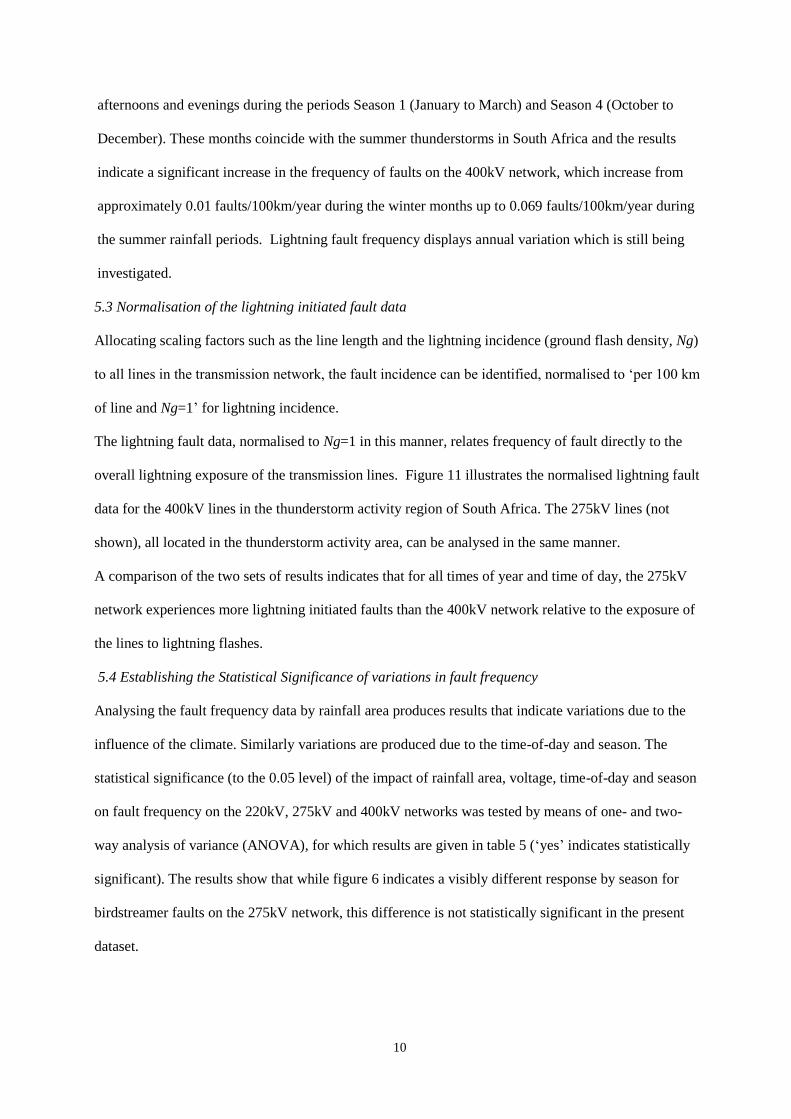
afternoons and evenings during the periods Season 1 (January to March) and Season 4 (October to
December). These months coincide with the summer thunderstorms in South Africa and the results
indicate a significant increase in the frequency of faults on the 400kV network, which increase from
approximately 0.01 faults/100km/year during the winter months up to 0.069 faults/100km/year during
the summer rainfall periods. Lightning fault frequency displays annual variation which is still being
investigated.
5.3 Normalisation of the lightning initiated fault data
Allocating scaling factors such as the line length and the lightning incidence (ground flash density, Ng)
to all lines in the transmission network, the fault incidence can be identified, normalised to „per 100 km
of line and Ng=1‟ for lightning incidence.
The lightning fault data, normalised to Ng=1 in this manner, relates frequency of fault directly to the
overall lightning exposure of the transmission lines. Figure 11 illustrates the normalised lightning fault
data for the 400kV lines in the thunderstorm activity region of South Africa. The 275kV lines (not
shown), all located in the thunderstorm activity area, can be analysed in the same manner.
A comparison of the two sets of results indicates that for all times of year and time of day, the 275kV
network experiences more lightning initiated faults than the 400kV network relative to the exposure of
the lines to lightning flashes.
5.4 Establishing the Statistical Significance of variations in fault frequency
Analysing the fault frequency data by rainfall area produces results that indicate variations due to the
influence of the climate. Similarly variations are produced due to the time-of-day and season. The
statistical significance (to the 0.05 level) of the impact of rainfall area, voltage, time-of-day and season
on fault frequency on the 220kV, 275kV and 400kV networks was tested by means of one- and two-
way analysis of variance (ANOVA), for which results are given in table 5 („yes‟ indicates statistically
significant). The results show that while figure 6 indicates a visibly different response by season for
birdstreamer faults on the 275kV network, this difference is not statistically significant in the present
dataset.

11
The 16-cell matrix allows statistically significant classification of fault frequency according to climate,
season and time-of-day for the major causes of faults. This is a quite different relationship from
considering all faults combined which do not show statistically significant variations.
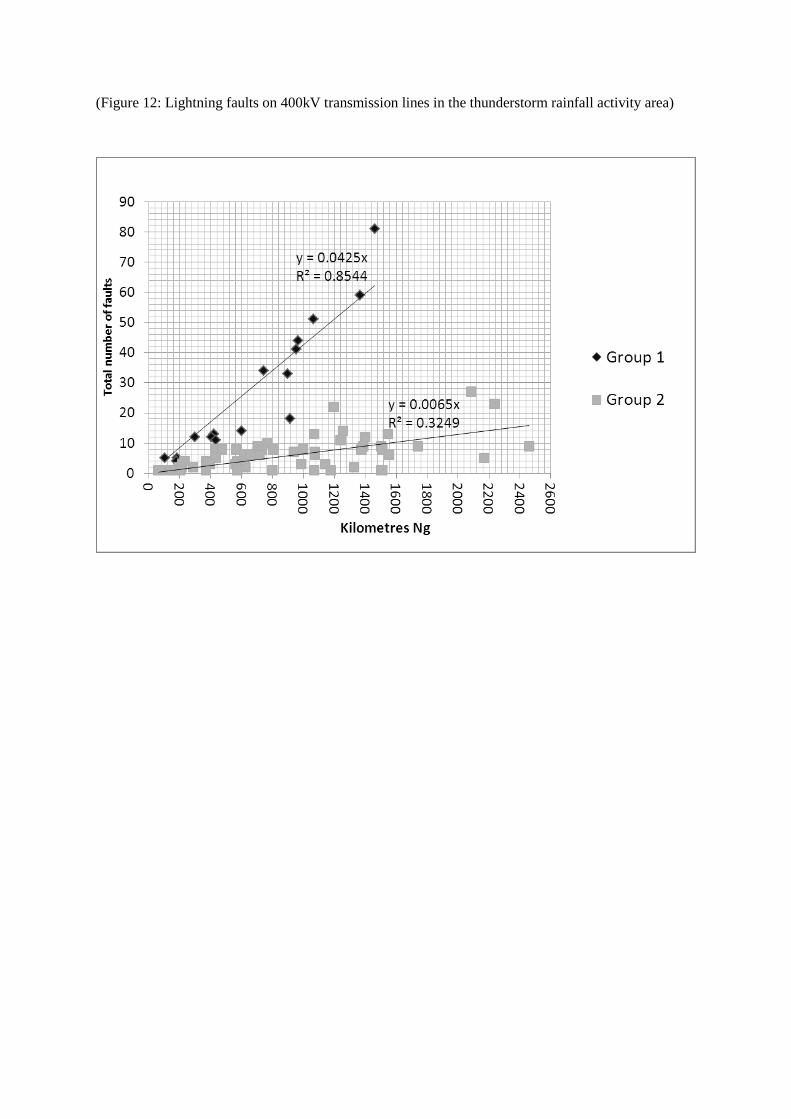
5.5 Analysis of a single class of faults
In addition to the analysis of the characteristic season and time of faults, the dataset allows analysis
within a single class of faults. For example, having defined the incidence of lightning faults on 400kV
lines in the thunderstorm region in terms of the faults/kmNg to remove the variation caused by line
length and lightning intensity, it was found there was significant scatter in the parameters. Figure 12
shows that there appears to be at least two (maybe more) families of lines with different failure
performance, separated by the dashed line. The population of lines was split according to the
performance to investigate whether common factors distinguish the groups from each other. It appears
there are such factors, including altitude and tower footing resistance, indicating the possibility of
improving line performance by intervention on existing lines and the specification of alternative tower
designs and installation parameters for future lines. Similar analysis still needs to be carried out for the
lightning incidence on lines of other voltages, regions and for other causes of fault.
6. Conclusions
The primary causes of faults on the South African transmission system are identified as fires, lightning
and bird streamers. An analysis method is presented that relates the frequency of faults on overhead
lines to the climate of the area in which the line is located and the causes of power system faults.
The effectiveness of birdguards in reducing fault frequency ascribed to birdstreamers has been clearly
demonstrated.
Faults analysed by time-of-day and time-of-year (season) provide fault frequency statistics that
represent more information than average annual frequency, taking the network performance into
account during different time periods. The statistical significance of the differences between mean fault
frequencies for fault causes, climate, time of day and season is established.

12
The information derived from the collection and analysis of fault frequency data leads to three very
different applications. One will be better modelling of the whole system's reliability, using interruption
duration and network loading data similarly classified by a 16-cell matrix, with substantial implications
for both planning and system operations. A second application group will be on design and selection of
parameters for specific lines and identifying lines with relatively poor performance needing to be
improved. Thirdly, the approach lays a foundation for future work to be conducted into reliability
analysis and electrical fault pattern recognition taking local geography, climate and power system
parameters into account.
Acknowledgements
The authors wish to acknowledge the contribution made by Hein Vosloo and his team in maintaining
meticulous data about faults and making this data available.

13
References
[1] Eskom Annual Report 2009, Eskom, 2009.
[2] L. Peter, R. Vajeth, Strategies for bating environmental influences on overhead lines to improve
quality of supply, IEEE PES Conference and Exposition in Africa, Durban, July 2005.
[3] H.F. Vosloo, The need for and contents of a life cycle management plan for Eskom transmission
line servitudes, MSc Dissertation, Department of Geography, Environmental and Energy Studies,
University of Johannesburg, Johannesburg, 2005.
[4] M. Edimu, C.T. Gaunt, R. Herman, Using probability distribution functions in reliability
analyses, Electric Power Systems Research, 81 (4), (2011), 915-921.
[5] K. Alvehag, L. Soder, A reliability model for distribution systems incorporating seasonal
variations in severe weather, IEEE Trans. on Power Delivery, 26, (2), (2011) 910-919.
[6] H.F. Vosloo, A.C. Britten, A.A. Burger, D. Muftic, The susceptibility of 400kV transmission
lines to bird streamers and bush fires: a definitive case study. Proceedings of the Cigré 6th
Southern African Regional Conference, Somerset West, August 2009.
[7] H. Michener, Where engineer and ornithologist meet: transmission line troubles caused by birds,
The Condor, May-June 1928.
[8] C. Van Rooyen, H. Vosloo, R. Harness, Watch the birdie: eliminating bird streamers as a cause
of faulting on transmission lines, IEEE Industry Applications Magazine, (2003) 55-60.
[9] H.J. West, J.E. Brown, A.L. Kinyon, Simulation of EHV transmission line flashovers initiated by
bird excretion, IEEE PES Winter meeting, 1971, Paper 71 TP 145-WR.
[10] A.A.Burger, K.J. Sadurski, Experimental investigation of bird initiated ac flashover mechanisms,
Cigré Study Committee 33-95 (Workgroup 07) Seminar, Mabula, South Africa, 1995.
[11] J.T. Burnham, Bird streamer flashovers on FPL transmission lines, IEEE Trans. on Power
Delivery, 10 (2) (1995)970-977.
[12] F. Iliceto, M. Babalioglu, F. Dabanli, Report of failures due to ice, wind and large birds
experienced on the 420kV lines of Turkey, Paper 111-15, Cigre Symposium 22-81, Stockholm,
1981.

14
[13] I. Jandrell, R. Blumenthal, R. Anderson, E. Trengrove, Recent lightning research in South Africa
with a special focus on kerunopathology, 16th International Symposium on High Voltage
Engineering, Cape Town, August 2009.
[14] R. Evert, G. Schulze, Impact of a new lightning detection and location system in South Africa,
Inaugural IEEE PES Conference and Exposition, Durban, South Africa, July 2005.
[15] Ground Flash Density Map, 1 March 2006 to 1 March 2010 (20km resolution) of South Africa,
Eskom, April 2010.
[16] A. Sukhnandan, D.A. Hoch, Fire induced flashovers of transmission lines: theoretical models, 6th
IEEE Africon Conference, George, South Africa, October 2002.
[17] D. Davies, F. Vosloo, P. Frost, S. Vannan, Near real-time fire alert system in South Africa: from
desktop to mobile service, DIS 2008, Cape Town South Africa.
[18] G. Mcferren, P. Frost, The Southern African fire information system, 6th International ISCRAM
International Conference, Gothenburg , Sweden, May 2009.
[19] R. Macey, W. Vosloo, C. de Tourreil “Chapter 4: Environmental Considerations”, The practical
guide to outdoor high voltage insulators, Eskom Power Series Volume 3, Crown Publications.
[20] R. Herman, C.T. Gaunt. Probabilistic interpretation of customer interruption cost (CIC) applied
to South African systems, PMAPS Conference, Singapore, June 2010.

Captions
Figure 1: Transmission Line Fault Causes - 12229 faults from 132 kV to 765kV
Figure 2: Two different flashover mechanisms and paths affected by bird excretion [5]
Figure 3: Ground flash density map of South Africa for 2006-2010 with frontal (F) and thunderstorm
(T) rainfall regions identified [15]
Figure 4: Fault frequency per 100 km per year per rainfall activity area
Figure 5: Average 400kV line fault frequency statistics by fault cause per 100 km per year
Figure 6: Season and time dependant frequency of bird streamer faults on the South African 400 and
275kV networks
Figure 7: Fault frequency on 400kV, 275kV and 220kV lines fitted with bird guards
Figure 8: Season and time dependant frequency of fire-caused faults on the South African 400kV
network
Figure 9: Season and time dependant frequency of pollution faults on the South African 400kV
network
Figure 10: Season and time dependant frequency of lightning faults on the South African 400kV
network
Figure 11: Season and time dependant frequency of lightning faults on the South African 400kV
network in the thunderstorm activity region normalised to Ng=1
Figure 12: Lightning faults on 400kV transmission lines in the thunderstorm rainfall activity area
Captions

(Figure 1: Transmission Line Fault Causes - 12229 faults from 132 kV to 765kV)
Bird
38%
Lightning
26%
Unclassified
5%
Fire
22%
Pollution
3%
Other
6%
Bird
Lightning
Fire
Pollution
Other
Unclassified
Figure(s)

(Figure 2: Two different flashover mechanisms and paths are demonstrated [5])

(Figure 3: Ground flash density (Ng) map with transmission lines of South Africa for 2006-2010) [15]

(Figure 4: Fault frequency per 100 km per year per rainfall activity area)

(Figure 5: Average 400kV line fault frequency statistics by fault cause per 100 km per year)
(Figure 6: Season and time dependant frequency of bird streamer faults on the South African 400 and
275kV networks)

(Figure 7: Fault frequency on 400kV, 275kV and 220kV lines fitted with bird guards)

(Figure 8: Season and time dependant frequency of fire-caused faults on the South African 400kV
network)

(Figure 9: Season and time dependant frequency of pollution faults on the South African 400kV
network)

(Figure 10: Season and time dependant frequency of lightning faults on the South African 400kV
network)

(Figure11: Season and time dependant frequency of lightning faults on the South African 400kV
network in the thunderstorm activity region normalised to Ng=1)
(Figure 12: Lightning faults on 400kV transmission lines in the thunderstorm rainfall activity area)

(Table 1: Causes of Transmission faults)
Primary Category Sub-Category
Bird Streamer
Pollution
Nest
Fire Veld
Cane
Refuse
Fynbos
Reed
Lightning
Pollution Bird pollution
Fire
Industrial
Marine
Tree Contact Alien
Indigenous
Unclassified
Other
Table(s)

(Table 2: Bird Streamer Event Characteristics associated with interested sector of electricity
transmission)
Interested
sector
Event characteristics
Fie
ld s
erv
ices
Presence of large bodied birds
A lack of natural roosting spots such as trees
Presence of dead or injured birds near structures after an outage
Outages which can be explained by bird behaviour and structure design:
o Birds prefer outside end of crossarms
o Birds avoid high voltage stress
o Birds avoid side of structure facing parallel lines
o Birds prefer side of structure facing water, lakes, swamps canals, fields etc.
o Structure must offer roost above energized parts
o Short air gaps are more susceptible
Features of flashed insulators/ hardware/ structure:
o Flashed insulator with dropping residue
o Absence of flashmark on insulator
o flashmark on crossarm or conductor hardware or only one end of an insulator
Net
wo
rk c
on
tro
l
Instantaneous relay actions with successful reclosure, limited to one or two per night tending to
occur in the same area
Net
wo
rk
pla
nn
ing
Bimodal temporal distribution of outages - distinct peaks at 06:00 and 22:00
Seasonal pattern related to presence of birds or their feeding habits

(Table 3: Fault Frequency Statistics)
Rainfall Activity
Total Line
Length (km)
Fault frequency
(faults/100km/year) Std Dev
Thunderstorm 18416 2.856 0.649
Frontal 7906 1.581 0.265
Whole country 26322 2.458 0.451

(Table 4: Season and time dependant characterisation (mean and standard deviation) of the frequency of
bird streamer faults on the South African 400 and 275kV networks)
S/I 00:00-05:59 06:00-11:59 12:00-17:59 18:00-23:59
400 kV
Season 1: Jan-Mar 0.104; 0.032 0.026; 0.018 0.003; 0.006 0.04; 0.024
Season 2: Apr-Jun 0.11; 0.055 0.056; 0.022 0.004; 0.006 0.061; 0.035
Season 3: Jul-Sep 0.064; 0.025 0.032; 0.014 0.005; 0.008 0.037; 0.02
Season 4: Oct-Dec 0.078; 0.034 0.009; 0.006 0.005; 0.007 0.027; 0.014
275 kV
Season 1: Jan-Mar 0.202; 0.074 0.041; 0.034 0.013; 0.186 0.129; 0.079
Season 2: Apr-Jun 0.196; 0.058 0.048; 0.031 0.013; 0.015 0.014; 0.064
Season 3: Jul-Sep 0.087; 0.038
0.0379;
0.0282
0.015; 0.015 0.082; 0.041
Season 4: Oct-Dec 0.101; 0.046 0.039; 0.035 0.007; 0.009 0.066; 0.034

(Table 5: Statistical Significance of factors influencing fault frequency)
Voltage level ( kV) Thunderstorm Region Frontal Region
Variable
All faults
Combined 220, 275, 400 Yes Yes
Season Time of Day Season Time of Day
Fire 220 na na No No
Lightning 220 na na No Yes
Fire 400 No No No Yes
Fire 275 No Yes na na
Lightning 400, 275 Yes Yes Yes No
Bird Streamers 400 Yes Yes Yes Yes
Bird Streamers 275, 220 No Yes No Yes
Pollution 400, 275, 220 No Yes No No
Other 400, 275, 220 No No No No
Electric Power Systems Research Journal 17 November 2011
Dear Editor,
Ms. Ref. No.: EPSR-D-11-00523
Title: Characterisation of Power System Events on South African Transmission Power Lines
Electric Power Systems Research
Responses to Reviewers’ comments
Thank you for the email message dated 9 October 2011 with the reviewers’ assessment of our
paper on characterising power line faults. We appreciate their constructive comments and we
have made changes to the paper as detailed below.
Regards,
Ulrich Minnaar
Corresponding author
Comments of Reviewer Response
Reviewer #1: The authors may wish to include more theoretical analysis of the stats listed in the paper. In its current form, the paper is more suitable for industrial conference.
The reviewer’s comment about the brevity of the theoretical details has encouraged us to expand these parts of the paper. We hope we have not erred too far in the other direction.
The results of the significance tests of the classified data and the value of the approach have been added as section 5.4. An extension of the theoretical analysis has been added in section 5.5.
There are also some further changes in response to a comment from the 2nd reviewer to report on some trend analysis.
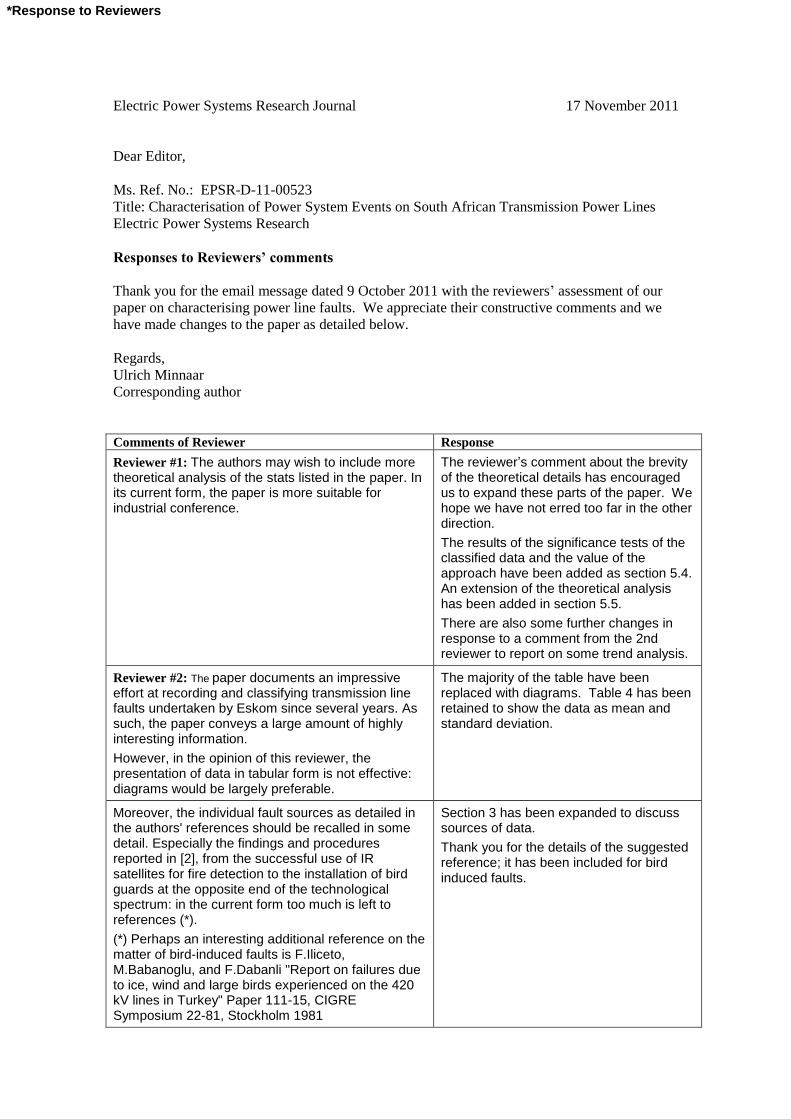
Reviewer #2: The paper documents an impressive effort at recording and classifying transmission line faults undertaken by Eskom since several years. As such, the paper conveys a large amount of highly interesting information.
However, in the opinion of this reviewer, the presentation of data in tabular form is not effective: diagrams would be largely preferable.
The majority of the table have been replaced with diagrams. Table 4 has been retained to show the data as mean and standard deviation.
Moreover, the individual fault sources as detailed in the authors' references should be recalled in some detail. Especially the findings and procedures reported in [2], from the successful use of IR satellites for fire detection to the installation of bird guards at the opposite end of the technological spectrum: in the current form too much is left to references (*).
(*) Perhaps an interesting additional reference on the matter of bird-induced faults is F.Iliceto, M.Babanoglu, and F.Dabanli "Report on failures due to ice, wind and large birds experienced on the 420 kV lines in Turkey" Paper 111-15, CIGRE Symposium 22-81, Stockholm 1981
Section 3 has been expanded to discuss sources of data.
Thank you for the details of the suggested reference; it has been included for bird induced faults.
*Response to Reviewers

Lastly, this reviewer feels that the authors should evidence possible long-term trends in fault rates and in their causes, or lack thereof, adding further value to an already interesting paper.
The long-term trend in bird streamer faults has been added in section 5.2.1. Other long term trends are still under investigation.
The conclusions are very short and only dwell on methodology; should be enlarged taking also into account the above remarks.
The conclusions have been expanded as recommended and, we think, are much improved by the suggestion.
Reviewer #3: Here are reported some suggestion for the paper:
- the description of letters F and T in Fig. 3 shall be reported also in the figure caption and not only along the text.
- Table 2 is not so straightforward, I suggest to rearrange it giving some more information in the table caption
The description of frontal ( F) and thunderstorm (T) regions is identified in fig. 3 caption.
Caption for table 2 has been corrected to be more descriptive.
I suggest to recall the references along the text without the author's name, since there's sometimes some misunderstanding. For example, at the end of page 2 you state "Van Rooyen et al [6]" and then on page 3 "Van Rooyen [6]" without et al. On page 2, furthermore, the Burnham paper is recalled without number. On page 5 it is stated "Vasloo reports [.]" without reference number. In order to uniform how to recall a paper I suggest to use only [reference number]
Changes have been made to recall references without the author’s name.
The reference list should be uniform, e.g. let's take into account reference number 4 and reference number 10: in reference number 4 the sequence of information is different than that in reference number 10. The former close with the page number, the latter with the year of publication. In the former the first letter of "Vol." is reported with capital letter in the latter the lower case is used. In the former the number of issued (No.) is reported in the latter it is not. In the latter the letters "pp" are indicated, in the former are not. Please check out the author's guide.
We apologise for the errors. All references have been reviewed and corrected where necessary