Embed Size (px)
Citation preview

10 October 2018Chief Investment Office GWMInvestment Research
Economic, social and financial market changes over the last 20 years and investment implications
Thinking strategically about Emerging Markets
A previous version of this report displayed an incorrect version of the table in Figure 42.

2 Thinking strategically about Emerging Markets – October 2018
Contents
03 Editorial
04 Chapter 01
Economic and social changes
17 Chapter 02
Financial market changes
22 Chapter 03
Investment implications
25 Methodological appendix
Editor-in-Chief Alejo Czerwonko
AuthorsJorge MariscalAlejo CzerwonkoChris MillerMichael BolligerBrennan Azevedo
Thinking strategically about Emerging MarketsThis report has been prepared by UBS Financial Services Inc. and UBS Switzerland AG. Please see important disclaimer and disclosures at the end of the document.
EditorAbe De Ramos
Project ManagementBrennan Azevedo
Desktop PublishingSrinivas Addugula*Sunil Vedangi*
* An employee of Cognizant Group. Cognizant staff provides support services to UBS.
Contactubs.com/cio
SubscribeFor more updates from the Chief Investment Office, please sign-up at www.ubs.com/cio-newsletter

3 Thinking strategically about Emerging Markets – October 2018
This year, like many others in the past de-cade, has not been a good one for emerg-ing market assets. Across developing coun-tries, the performance of bonds, stocks, and currencies has been poor in absolute levels and in general below that of their more developed counterparts. The headwinds they have faced this year include escalating trade tensions between the US and its ma-jor trading partners, rising US interest rates, and local and global political uncertainty as the anti-establishment, anti-globalization movements have colored electoral races worldwide. The underperformance has been particularly severe in Argentina and Turkey, where largely idiosyncratic vulnerabilities have been compounded by global shocks.
This paper invites the reader to look past the events of the moment and view emerging markets from a broader perspective. As we highlight in our three key messages below, we believe that through a steadfast, even-tempered approach, one can reap the ben-efits of the growing investment opportuni-ties offered by the world’s most dynamic set of regions.
To be sure, high sensitivity to external and domestic shocks has historically been a defin-ing factor of what constitutes an emerging market. Many international investors have thus come to regard emerging market assets more tactically than strategically, acquiring exposure when things are good and the mo-mentum is positive, and avoiding the “asset class” altogether when trouble hits. The ad-vent of the BRIC phenomenon – a market-ing idea conceived in the early 2000s based upon the rapid growth in Brazil, Russia, In-dia, and China – brought greater awareness to emerging markets, and came close to as-suring them a permanent seat in the global investment stadium. The heavy losses these
markets suffered during the global financial crisis reminded many of their cyclicality.
But a single-minded focus on the tribulations of emerging market assets risks ignoring not only the remarkable progress and transfor-mation emerging economies and societies have made, but also the greater depth and breadth of investment opportunities they of-fer. Consider that in the last 15 years emerg-ing economies have taken over one billion people out of poverty, more than the total population of the US and Western Europe combined. These countries are now respon-sible for the majority of the world’s GDP, as well as the bulk of global car sales and cell phone subscriptions. Their citizens are more intrepid, becoming the main source of growth in global tourism, and prominently populating classrooms at US universities. Emerging markets are also now minting bil-lionaires at a blistering pace, with the total number of ultra-wealthy individuals expand-ing by a factor of 14 since the year 2000, compared with the tripling of developed world billionaires over the same period. So whether investors decide to invest in emerging markets directly or not, they are increasingly exposed to their eco-nomic, financial, political, and even cul-tural sphere of influence.
Admittedly, a large component of this trans-formation owes to China’s size and rapid growth over the last two decades. But out-side China, emerging markets have also seen dramatic change, with countries like Brazil, Vietnam, Indonesia, and Russia making sig-nificant strides in their development path, while India is likely to maintain a growth edge over China in the years to come. This process of development convergence is still at an early stage given that the per-capita incomes, even in terms of purchasing power
Editorial
Jorge Mariscal Head of EM Investment Office
Thinking strategically about emerging markets

4 Thinking strategically about Emerging Markets – October 2018
parity, of populous countries such as China, Indonesia, and India are only a fraction that of the United States (one-third, one-fifth, and one-eighth, respectively).
Progress has also been swift in deepening fi-nancial markets. Since 2003, trading volumes in emerging market equities have expanded tenfold, compared with less than threefold in developed market equities, while trading vol-umes in emerging market bonds have nearly doubled as those of the US bond market have remained largely flat. The composition of these investments has also shifted meaning-fully. The amount of outstanding emerging market debt has grown largely due to ma-turing domestic markets, with sovereign and corporate debt issuance in local currencies far outpacing issuance in hard currency (i.e., US dollars). And in popular emerging market equity benchmarks, the technology sector dominates with a 30% weighting, double the weight of the materials and energy sec-tors combined and the flip side of what they were 15 years ago. These changes, and many others, hint at the need for a fresher outlook: The way to think about emerging market investing in the next 10 years should dif-fer from that of the past decade.
Not everything is good news, of course. No-tably, progress has been slow in the modern-ization of institutions. Efforts to strengthen the rule of law, control corruption, empower the marginalized, and promote accountabil-ity have been insufficient, and in some cases even retrogressed in the last 15 years. Other countries also confront acute macroeconom-ic vulnerabilities that make them susceptible to the US dollar’s strength and a tightening of monetary policy by developed market central banks. In addition, domestic debt levels have been on the rise since the global financial crisis, with the corporate segment seeing a large increase in leverage.
Yet, our analysis shows that, despite all the volatility and large drawdowns in emerging market assets over the last decade-and-a-half, the inclusion of these assets in a buy-and-hold, strategic global portfolio can improve the risk-reward balance, provided that exposure is diversified across corporate and sovereign bonds, equities, and curren-cies. In other words, while tactical asset allocation can take advantage of bouts of volatility, emerging market exposure should be seen as strategic in nature.
More than a traditional white paper, this re-port employs a chartbook approach to illus-trate demographic, social, economic, and fi-nancial change in emerging markets over the last two decades, and derives implications for portfolio strategy. Each chapter starts with the key takeaways, and each chart in-cludes a text box with a brief commentary on the data shown. We have always argued that emerging markets make for a long-term story with a positive trajectory. Through numbers, this paper reaffirms that story and lets the figures speak for themselves.
We hope you enjoy this format and find the content of this paper to be enlightening.
Jorge Mariscal
Jorge Mariscal Emerging Markets Chief Investment Officer
Editorial
5 Thinking strategically about Emerging Markets – October 2018
Chapter 1
Economic and social changes

6 Thinking strategically about Emerging Markets – October 2018
• The economic and social transformation in emerging markets over the last two decades has been extraordinary. Given the blistering pace of change in key indicators, many investors’ view of emerging markets is at least five if not 10 years out of date.
• Emerging markets now make up over 60% of the total global economic output, and over 70% of global GDP growth. They consume the majority of the world’s oil, copper, and iron ore, and are in-volved in over 50% of the total global trade in goods.
• Widespread inflation problems that characterized emerging economies are a thing of the past. In any given year over the past decade, fewer than 10 of the nearly 150 countries tracked by the IMF expe-rienced inflation rates over 20%. Emerging economies have also increased their rainy-day buffers in the form of foreign-exchange reserves, from 11% of GDP in 2000 to 24% in 2017.
• In the last two decades, living standards in emerging markets have seen an improvement rarely seen in the history of humanity. The percentage of their population earning the equivalent of less than USD 5 a day has plummeted from 76% in 2000 to 46% in 2017, and the enlarged middle class now makes up close to 50% of their total population. Life expectancy increased by 4.3 years during this period, and the percentage of deaths caused by communicable deceases plunged from 24% to 16%.
• The increase in spending power has allowed emerging market populations to become dominant global consumers. They now account for over 80% of global cell phone service subscriptions, and the number of international tourists from emerging markets has skyrocketed and is set to surpass those from the developed world in the near future.
• Economic strength is gradually translating into military might. Although they still lag their developed market peers, emerging markets’ share of global military expenditures has almost doubled in the last two decades, to surpass 40%. The quest for computing power superiority is also heating up. While China is still behind the US in terms of aggregate computing power of high-performance computers (HPC), it is now the global leader in terms of number of supercomputers deployed.
• Despite all this progress, a number of key metrics have worsened for emerging markets since the turn of the century. Debt levels are on the rise, a process that accelerated after the global financial crisis, with the leverage increase particularly acute in China. In addition, the quality of institutions leaves a lot to be desired, as emerging markets’ scores in various governance indicators have trended side-ways or fallen during this period. Perhaps surprisingly, there are now fewer emerging economies with floating currency regimes than there were two decades ago, as some countries have opted for quasi-floating regimes. Despite some progress in the aggregate current account position of Latin America, the surpluses emerging market heavyweights such as China, Malaysia and Russia used to enjoy in the early 2000s have significantly narrowed. Finally, the global economic model of ever greater economic integration is being put to the test with the emergence of anti-globalization political forces in several countries around the world, developed and emerging.
• Overall, developments in the last two decades have been unprecedented for emerging markets. Despite the many remaining challenges, most evidence points to further economic and social gains in years to come.
Key takeaways
7 Thinking strategically about Emerging Markets – October 2018
2000 20162014201220102008200620042002 2018E
65
60
50
30
40
55
35
45
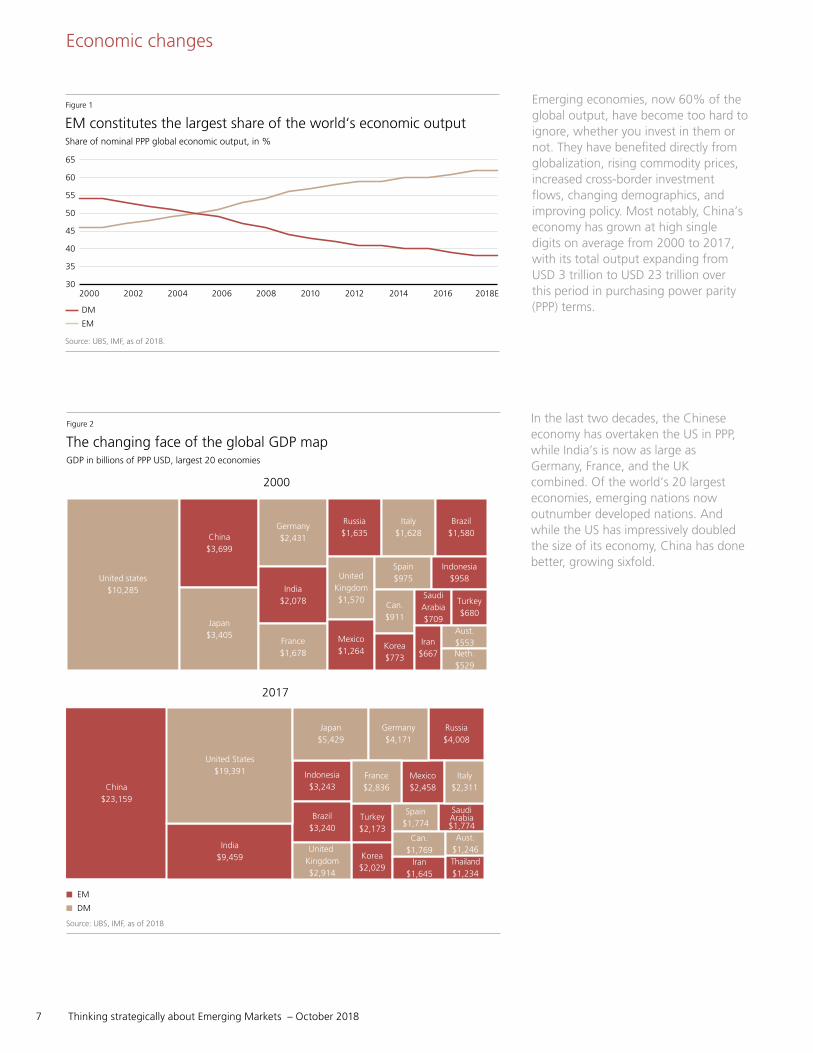
EM constitutes the largest share of the world‘s economic output
Source: UBS, IMF, as of 2018.
Figure 1
DM
EM
Share of nominal PPP global economic output, in %
The changing face of the global GDP map
Source: UBS, IMF, as of 2018
Figure 2
GDP in billions of PPP USD, largest 20 economies
2000
United states$10,285
Japan$3,405
France$1,678
India$2,078
China$3,699
Germany$2,431
Russia$1,635
Italy$1,628
Spain$975United
Kingdom$1,570
Mexico$1,264
Korea$773
Iran$667
SaudiArabia$709
Can.$911
Brazil$1,580
Indonesia$958
Turkey$680
Aust.$553Neth.$529
2017
China$23,159
United States$19,391
India$9,459
Japan$5,429
Indonesia$3,243
Brazil$3,240
United Kingdom$2,914
Germany$4,171
France$2,836
Turkey$2,173
Korea$2,029
Iran$1,645
Can.$1,769
Aust.$1,246
SaudiArabia$1,774
Spain$1,774
Italy$2,311
Russia$4,008
Mexico$2,458
Thailand$1,234
EM
DM
Emerging economies, now 60% of the global output, have become too hard to ignore, whether you invest in them or not. They have benefited directly from globalization, rising commodity prices, increased cross-border investment flows, changing demographics, and improving policy. Most notably, China’s economy has grown at high single digits on average from 2000 to 2017, with its total output expanding from USD 3 trillion to USD 23 trillion over this period in purchasing power parity (PPP) terms.
In the last two decades, the Chinese economy has overtaken the US in PPP, while India’s is now as large as Germany, France, and the UK combined. Of the world’s 20 largest economies, emerging nations now outnumber developed nations. And while the US has impressively doubled the size of its economy, China has done better, growing sixfold.
Economic changes

8 Thinking strategically about Emerging Markets – October 2018
The combined size of the middle class in emerging markets is approaching that of the developed world, and growing much faster. While China is an important driver of this growth, it is not the whole story. India, for example, now accounts for 7% of the world’s middle class, up from just 1% in 2000.
Poverty levels have collapsed in China and other emerging countries thanks to economic growth, low inflation, and income transfer programs. While most regions of the world have made significant progress in fighting poverty, according to the Brookings Institute, fragile African countries still face significant issues and will continue to need foreign aid to bring large portions of their population out of poverty.
In the last 10 years, emerging countries have provided the bulk of the growth of the world economy, though in recent years their gap versus developed economies has narrowed as China has slowed down. However, other countries may be in the early innings of reaching secular growth similar to China’s. While China’s GDP growth has slowed over the last several years, India’s has generally been on a more upward trend.
2000 20252020201520102005 2030
100
80
0
40
20
60
The EM middle class continues to grow, as well as its consumption power
Note: Computed by summing middle class headcount per country and dividing by total population per region/country.Source: UBS, The Brookings Institute, as of 2018.
Figure 3
DM China
EM
Share of population earning between $10 and $100 per person per day, in 2005 PPP USD
Total middle class consumption in 2017, USD trillions
DM
EM
China3.2
13.4
15.2
2018
2000 20252020201520102005 2030
100
80
40
0
60
20
EM making great strides in the fight against poverty
Source: UBS, The Brookings Institute, as of 2018.
Figure 4
China DM
EM Ex-China 2018
Share of population earning less than $5 per person per day, in 2005 PPP USD
100
90
70
50
40
30
20
10
0
80
60
2000 20162014201220102008200620042002 2018E
EM makes up 70% of global growth
Source: UBS, IMF, as of 2018.
Figure 5
DM
EM
Share of global economic output growth, in %
Economic changes

9 Thinking strategically about Emerging Markets – October 2018
2000 2014201220102008200620042002 2016
90
70
30
50
80
40
60
EM dominates commodity demand
Source: UBS, US EIA, WBMS, AME Group, Metalytics, Tex Report, UNCTAD, as of 2018.
Figure 6
Oil Iron ore
Copper
EM share of select commodities global consumption, in %
EM Mexico Indonesia Poland
23%
70%
19%
9%
43%
ThailandKorea Brazil RussiaIndiaSaudi Arabia
China
6,000
5,000
4,000
3,000
2,000
1,000
7,000
0
80
0
20
70
10
30
60
50
40
11% 14%
26%
10% 15%
21%
12%5%
22%
8%
17%
5%
15% 16% 15%
25% 25%
Most EM countries have improved their “rainy day” cushion
Note: Top 10 EM FX reserve holding countries are based on absolute USD reserves as of January 2018.Source: UBS, Bloomberg, as of 2018.
Figure 7
2000 reserves (% of GDP) 2017 reserves (USD bn, rhs)
2017 reserves (% of GDP)
FX reserves as a % of USD nominal GDP, top 10 EM FX reserves holders
1990 201620142010 201220082004 2006200220001994 1996 19981992
80
70
90
60
40
0
20
50
10
30
EM makes up half of global trade in goods
Source: UBS, Bloomberg, as of 2018.
Figure 8
EM
DM
Share of global trade in goods, in %
Emerging markets are now the biggest buyers of world’s copper, oil, and iron ore, and demand is still rising. China’s infrastructure boom has fueled this trend and will continue to do so as long as policy continues to support further investment in this area.
Most emerging economies have improved their “rainy day” cushion in the form of foreign exchange reserves. Although the aggregate amount has recently declined due to global rebalancing, it is still more than twice those of developed markets. China alone holds 40% of global reserves. Larger reserves are an additional tool for policymakers in emerging nations to contain the impact of external shocks to their financial markets and economies.
As companies have stretched their supply chains across the world, emerging markets’ share of total global trade (exports + imports) is now roughly equal the developed world’s, although these ratios have been stabilizing in the last few years. The future of global trade is, of course, in danger as protectionist trade and foreign policies have gained popularity among some Western countries, particularly the US and the UK.
Economic changes

10 Thinking strategically about Emerging Markets – October 2018
Military spending by emerging countries has been rising and now accounts for over 40% of the world’s total. China and Russia account for slightly less than 20% of the global total. While China has kept its military spending steady as a percentage of GDP since the start of the century, Russia has aggressively increased its own, from 3.5% to 5.4% of GDP (USD 10bn to USD 69b in absolute amounts). For comparison, the US has kept spending steady right around 3% of GDP over the same time frame.
Before the turn of the century, high inflation was the Achilles heel that plagued emerging economies. As the 21st century progressed, however, they have shown to be more successful in controlling inflation, owing to globalization forces as well as independent central banks implementing better inflation policy. On aggregate, inflation rates have been lower, and fewer countries have experienced hard-to-control, high inflation.
Perhaps surprisingly, the number of countries with floating currency regimes shrank significantly over the last 20 years, often in favor of quasi-floating regimes. A less significant trend was to move away from fixed currency regimes into less restrictive ones.
2000 20142010 20122006 200820042002 2016
100
80
40
0
60
20
Military strength follows economic might
Source: UBS, The World Bank, as of 2018.
Figure 9
DM EM ex-China
EM
Share of global military expenditures, in %
20152013201120092007200520032001199919971995 2017
40
30
20
10
50
0
60
40
0
20
50
10
30
EMs have largely tamed the inflation “beast”
Note: Based out of the total number of EM IMF member countries.Source: UBS, IMF, as of 2018.
Figure 10
EM Inflation
Countries with inflation over 20% (rhs)
EM GDP-weighted annual inflation and number of countries with inflation above 20%
1996 2016
100
0
20
80
40
60
Surprisingly, EMs have been adopting less flexible exchange rate regimes
Note: Fixed currencies are defined by the IMF in 1996 as pegged to single currency, pegged to composite of currencies; and in 2016 as no separate legal tender, currency board, and conventional peg. Floating currencies are defined by the IMF in 1996 as managed floating and independent floating; and in 2016 as floating and free floating. Limited Flexibility currencies are defined in 1996 as Limited Flexibility; and in 2016 as stabilized arrangement, crawling peg, crawl-like arrangement, pegged exchange rate with horizontal bands, and other managed arrangements.Source: UBS, IMF, as of 2018.
Figure 11
Fixed
Limited Flexibility
Proportion of EM countries with floating, fixed and limited flexibility exchange rate regimes, GDP-weighted, in %
Floating
Economic changes

11 Thinking strategically about Emerging Markets – October 2018
1999 2013 20152009 20112005 200720032001 2017
400
350
150
200
0
250
300
50
100
EM debt levels on the rise in the last 10 years, but still low compared to DM
Source: UBS, IIF, as of 2018.
Figure 12
DM Total Debt to GPD China Total Debt to GDP
EM Ex-China Total Debt to GDP
Debt to GDP, in %. Includes fin. corps., non-fin. corp., government, and household
2016
2017
2015
2014
2013
2012
2011
2010
200
9
200
8
2007
200
6
200
4
200
5
2003
2002
2001
200
0
199
9
2018
250
50
0
200
150
100
131 128 128143 144 142 141 142 144 147
165 164 163 170 180190
203 209 210 211
Non-financial corporate debt largely responsible for the increase in EM debt levels
Source: UBS, IIF, as of 2018.
Figure 13
Households
Non-fin corporates
Debt to GDP, in %
Government
Financial Corporates
Though emerging market debt levels are much lower than those of developed counterparts, they have risen steadily over the last two decades. The debt accummulation accelerated in the years following the global financial crisis, and the leverage increase has been particularly acute in China–the latter mostly concentrated in corporate and quasi-sovereign debt. China‘s central government debt to GDP is currently only 17%.
Corporate debt has led the rise in emerging market debt, increasing from around 75% of GDP in 2012 to 95% in 2016. Household debt rose, but at a slower pace; notably, China has five times more household debt today than it did in the beginning of 2010. The increase in leverage by governments and financial institutions has been on aggregate more moderate.
Economic changes
Social changes
EM JapanNigeria Russia
83%
3% 3% 3% 3% 2% 3% 2% 2% 2% 2% 2%
PakistanIndonesia BrazilUnitedStates
IndiaChina Mexico
90
50
0
20
30
80
10
40
81%
21%
2% 2% 2%
70
60
19% 17% 18%
5% 4%
The large majority of the global population resides in EM
Source: UBS, United Nations World Population Prospects, as of 2017.
Figure 14
2000
2015
Percent of total world population
Emerging countries’ share of the world population was already large two decades ago but it continues to rise as their life expectancy increases vis-à-vis the aging population in the developed world. From 2000 to 2015, emerging markets’ population grew by a staggering 23%, driven largely by India and China, while developed markets’ population grew only 5%.

12 Thinking strategically about Emerging Markets – October 2018
Social changes
Dire demographic trends are in the cards for much of the developed world and parts of the emerging markets in the years ahead. Latin America, Africa, and parts of Asia are fortunate enough to enjoy demographic tailwinds thanks to strong growth rates of the working-age population and declining dependency ratios. This “demographic bonus,” if accompanied by adequate investments in education, healthcare, and infrastructure, should support economic growth.
Similar dynamics can be seen in dependency ratios, a measure based on the number of individuals in economically dependent age groups (younger than 15 and older than 65) divided by the working-age population. Asia and Latin America enjoy some of the lowest ratios of economically dependent populations globally. Eastern Europe faces a more challenging reality.
–10 1510
1.7%
5.9%
5.8%
0.0%0.1%–3.1%
9.7%7.7%
3.7%
14.7%
–5.0%–4.2% 14.7%
14.2%
50-5 20
DM
Asia
Africa
Eastern Europe
2.2%–0.8%
–1.4%–1.5%
9.1%
4.1%
14.5%
14.6%
LatAm4.4%
7.9%10.2%
EM working population growth outpacing DM
Source: UBS, United Nations World Population Prospects, as of 2017.
Figure 15
2000–2005
2005–2010
Working population growth rates during the period, in %
2010–2015
2015–2020
2020–2025
203020252020201520102005200019951990 2035
6866
5650
100
70
30
50
80
90
40
60
DM
Asia
Africa
Latin America
Eastern Europe
EM offering still low dependency ratios
Source: UBS, United Nations World Population Prospects, as of 2017.
Figure 16
Dependency ratios (the ratio of people aged 65+ and –15 to individuals aged 15–64), in %
Over the last two decades, per capita income in PPP terms has increased 2x in emerging markets vs. 1.5x in developed markets. The improvements in GDP per capita have been remarkable in China and India, and solid in Russia and Brazil. This process of development convergence is still at an early stage given that the per-capita incomes of populous countries such as China, Indonesia, and India are only a fraction that of the United States (one-third, one-fifth, and one-eighth, respectively).China United
States
11,170 9,108
31,062
50,881
59,495
DMEM BrazilRussiaIndia Japan
5
4
3
2
1
6
0
70,000
40,000
0
20,000
50,000
10,000
30,000
2,918 2,018
42,659
60,000
16,624
7,174
27,900
7,894
17,086 15,500
36,433
26,850
Large per capita income gains for EM
Note: Aggregates are nominal GDP-weighted.Source: UBS, IMF, as of 2018.
Figure 17
2000 2000-2017 growth multiple (rhs)
2017
Per capita income, in PPP dollars, and 2000–2017 growth multiples

13 Thinking strategically about Emerging Markets – October 2018
Social changes
20102005200019951990 2015
90
50
60
0
20
30
70
80
10
40
DM
EM
Eurozone
US
Brazil
Russia
China
India
Still room for growth in internet penetration in EM
Note: Aggregates are nominal GDP weighted.Source: UBS, The World Bank, as of 2018.
Figure 19
Individuals using internet, % of population
While their healthcare expenditure remains modest relative to those of developed peers, emerging markets have enjoyed sizable gains in key healthcare outcomes over the last 15 years. Life expectancy is up 4.3 years versus 2.6 years in developed markets, though the gap remains large at 7.5 years. Emerging countries have also made strides in treating and preventing deaths caused by the spread of viruses and bacteria; communicable diseases now account for 16% of total deaths compared to 24% just 15 years ago.
While broadband internet penetration has risen rapidly, only 52% of the emerging market population had access to the technology in 2016. In countries like South Korea, Hungary, Malaysia, Kazakhstan, and Russia, internet penetration rates are comparable to those of the developed world. There is still significant room for progress in larger countries such as China, India, and Brazil.
EM DM
85
Healthcare expenditure Life expectancy Communicable diseases
75
60
65
70
80
EM DM
30
0
10
20
Improving EM healthcare outcomes despite still low spending
Note: For healthcare expenditures and life expectancy, aggregates are nominal GDP weighted. For communicable diseases, aggregates are calculated by dividing the number of each type of death by all deaths in each region.Source: UBS, World Health Organization, World Economic Outlook, as of 2018.
Figure 18
2015
Healthcare expenditure (as a % of GDP), life expectancy (in years), and communicable diseases (% of deaths caused by communicable diseases)
EM
5.1
7.4
DM
15
0
10
5
2000
12.7
9.6
80.7 24
16
7 7
68.9
73.2
78.1
The increasing number of international students in US universities brings economic, academic, and societal benefits to US. In 2016 alone, they contributed USD 39bn to the US economy. However, given the difficulty of staying in the US and other developed countries, these students usually end up returning to their home country, with their newly acquired knowledge and skills helping to advance their economies.
Figure 20
International students flocking to US universitiesNumber of international students in US schools, and as a percentage of total
2000 2005 2010 2015 2017
Int‘l students in US 514k 563k 692k 977k 1.1m
US Enrollment 14.8m 17.3m 20.4m 20.3m 20.2m
% Int‘l students 3.5% 3.3% 3.4% 4.8% 5.4%
China 11% 11% 18% 31% 32%
India 8% 14% 15% 14% 17%
South Korea 8% 9% 10% 7% 5%
Saudi Arabia 1% 1% 2% 6% 5%
Canada 5% 5% 4% 3% 3%
Vietnam 0% 1% 2% 2% 2%
Taiwan 6% 5% 4% 2% 2%
Japan 9% 7% 4% 2% 2%
Mexico 2% 2% 2% 2% 2%
Brazil 2% 1% 1% 2% 1%
Source: UBS, Institute of International Education, Open Doors Report, as of 2017.

14 Thinking strategically about Emerging Markets – October 2018
Social changes
Emerging markets are minting billionaires at a much faster pace. Between 2000 and 2017, their billionaire population grew 14 times, compared with three times in developed markets. According to a 2017 UBS/PwC study on billionaire wealth, the rise of Chinese entrepreneurs is helping Asia create one new billionaire every other day. While the US still holds the title for total wealth, if current trends continue, UBS/PwC estimates that Asia’s billionaires will hold more total wealth than US peers in four years.
The rising purchasing power of the emerging market middle class is reshaping global tourism as higher discretionary income allows for more international travel. China sets a stark example. In 2000, the US had 6x more international travelers than China; in 2010, China surpassed the US, and as of 2015 China had 50 million more international travelers than the US.
2000 2017
1,400
600
0
200
1,200
400
1000
800
2000 2017
7
3
0
1
6
2
5
4
Billionaire club is losing its exclusivity
Source: UBS/PwC 2017 Billionaires Report, as of 2018.
Figure 22
DM
EM
Number of billionaires, and billionaire wealth in trillions of USD
201020052000 2016
700
400
500
0
200
600
100
300
DM
EM
US
Eurozone
Brazil
Russia
India
China
Richer EM travelers venturing beyond their borders
Note: US has not reported 2016 departures, as of September 2018.Source: UBS, The World Bank, as of 2017.
Figure 21
International departures, in hundreds of thousands of people
China has been bringing new high-performance computers (HPC) to market, replacing those in developed countries, especially in the US; but China’s aggregate HPC computing performance still lags that of the US even though China has the lion’s share of the Top 500 HPCs. According to a 2017 report by the US NSA and DOE, the US needs to sharply increase investments in HPC R&D to keep pace with China on highly computational national defense issues like nuclear weapons.
2000 20162010 2012 2014200820062002 2004 2018
600
500
300
0
400
100
200
The race to the computer power summit is on
Source: UBS, TOP 500, as of 2018.
Figure 23
United States DM
China EM
Number of super computers

15 Thinking strategically about Emerging Markets – October 2018
Social changes
Chi
na
Au
stri
a
Un
ited
Sta
tes
Turk
ey
Taiw
an
Ital
y
Ger
man
y
Sou
th K
ore
a
Fran
ce
Spai
n
Jap
an
Pola
nd
Bel
giu
m
Swit
zerl
and
Net
herl
and
s
Un
ited
Kin
gd
om
30,000
4,000
0
2,000
25,000
1,000
3,000
… as well as for the conquest of the land
Source: UBS, International Union of Railways, as of 2018.
Figure 24
2000
2018
High-speed railway networks, in km of rails
2015
2014
2013
2012
2011
2010
200
9
200
8
2007
200
6
200
4
200
5
2003
2002
2001
200
0
199
9
2016
100
20
30
10
0
80
90
60
70
40
50
The lion‘s share of global mobile cell subscriptions comes from EM
Source: UBS, The World Bank, as of 2017.
Figure 25
EM
DM
Market share of cell phone subscriptions, in %
In just 15 years, China went from having no high-speed railway system to developing a network bigger than the rest of the world’s combined. Outside China, progress hasn’t been as impressive. South Korea, Turkey, and Taiwan have built decent high-speed rail infrastructure, but other emerging economies still lack access to this means of transport.
The global market for cell phones is dominated by emerging countries, where internet-enabled devices are often the only form of internet access for households. According to a 2017 Groupe Spécial Mobile Association report, the cost of smartphones can be the biggest barrier to accessing the internet; as poverty declines, more people in emerging markets should have access to the internet for the first time, allowing for increased penetration of the digital economy.
2016
2015
2014
2013
2012
2011
2010
200
8
200
9
2007
200
6
200
5
200
4
2003
2017
100
20
30
10
0
80
90
60
70
40
50
As well as the majority of the automobile manufacturing base
Source: UBS, OIAC, as of 2018.
Figure 26
EM
DM
Share of car production, in %
In a show of their growing manufacturing might, emerging countries produce the bulk of the cars in the world. Three of the top five car-producing countries globally are in emerging markets. In order, the world’s top car manufacturers are China, Japan, Germany, India, and South Korea.
16 Thinking strategically about Emerging Markets – October 2018
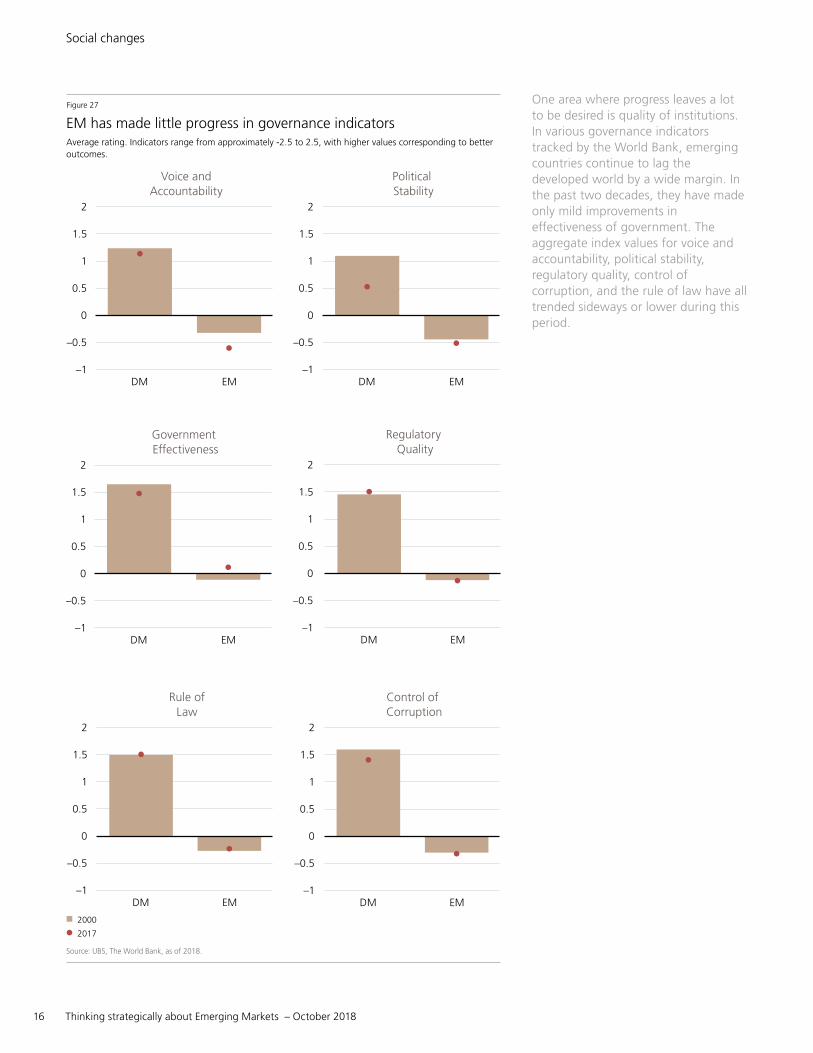
One area where progress leaves a lot to be desired is quality of institutions. In various governance indicators tracked by the World Bank, emerging countries continue to lag the developed world by a wide margin. In the past two decades, they have made only mild improvements in effectiveness of government. The aggregate index values for voice and accountability, political stability, regulatory quality, control of corruption, and the rule of law have all trended sideways or lower during this period.
Social changes
EM has made little progress in governance indicators
Source: UBS, The World Bank, as of 2018.
Figure 27
2017
Average rating. Indicators�range from approximately -2.5 to 2.5, with higher values corresponding to better outcomes.
2000
DM EM
2
–1
1
1.5
–0.5
0
0.5
Voice andAccountability
DM EM
2
–1
1
1.5
–0.5
0
0.5
Political Stability
DM EM
2
–1
1
1.5
–0.5
0
0.5
Government Effectiveness
DM EM
2
–1
1
1.5
–0.5
0
0.5
Regulatory Quality
DM EM
2
–1
1
1.5
–0.5
0
0.5
Rule ofLaw
DM EM
2
–1
1
1.5
–0.5
0
0.5
Control of Corruption

17 Thinking strategically about Emerging Markets – October 2018
Chapter 2
Financial market changes

18 Thinking strategically about Emerging Markets – October 2018
• The economic and social transformation in emerging markets has been accompanied by an increase in the size and liquidity of their asset markets.
• The market for tradable debt securities has grown more than tenfold, from USD 1.7 trillion in 2000 to USD 20.7 trillion in 2016. Issuers are making progress in addressing their past “original sin” of not borrowing in local currency. Today, the majority of tradable debt in emerging markets is in local currency. While trading volumes in the US bond market haven’t increased since 2000, those of EM bonds have expanded 1.75 times.
• Since 2003, the equity market capitalization in emerging countries has grown nearly eight times; in China, it has multiplied 10.9 times. By contrast, the equity market cap in the developed world has risen by just 2.8 times. Emerging markets currently make up 32% of the world’s equity market cap. Yet, the weight of EM equities remains at just 12.5% of the overall equities allocation in global portfolios, according to the Institute of International Finance.
• Global trading of foreign-exchange instruments denominated in EM currencies has expanded by 10 times since 2001. The Chinese yuan has evolved from being a practically irrelevant currency for global financial markets to being the eighth most traded currency worldwide. Now, the currencies of Mexico, Hong Kong, South Korea, Turkey, Russia, India, Brazil, and South Africa are among the 20 most traded globally.
• A back-of-the-envelope calculation projects the inventory of tradable emerging market debt could reach USD 60 trillion in the next decade, or nearly 85% of the current inventory of tradable devel-oped market debt. In a similar exercise, the market capitalization of emerging market equities, ex-cluding China, could reach USD 65 trillion in 10 years. Adding China based on its historical growth rates, this could reach nearly USD 120 trillion, or 132% of the current capitalization of developed market equities.
• In sum, emerging market assets are becoming increasingly hard to ignore for global investors.
Key takeaways

19 Thinking strategically about Emerging Markets – October 2018
Financial market changes
The market for tradable debt securities in emerging markets has grown considerably, from USD 1.7 trillion in 2000 to USD 20.7 trillion in 2016. Issuers are making progress addressing their “original sin” of not borrowing in local currency. Today, the majority of tradable sovereign and corporate debt in emerging markets are denominated in local currency. While currency mismatch remains an issue for some corporate and government balance sheets, the associated risk is much smaller than it used to be. We expect the share of local currency issuance to continue to rise in the years ahead.
Since 2003, trading volumes in emerging market bonds have expanded 1.75 times, while those of the US bond market have remained largely flat. As more bonds are issued in local currency, trading volumes have markedly increased during the period. Local-currency sovereign bonds now make up the lion’s share of trading volumes in emerging market debt.
2000
$1.7
$20.7
2016
25.0
0.0
5.0
20.0
10.0
15.0
EM debt markets are growing, largely on the back of maturingdomestic markets
Source: UBS, BIS (Bank for International Settlements), as of 2016.
Figure 28
Sovereign hard currency debt
Corporate hard currency debt
Value of tradable debt securities, in trillions of USD
Sovereign so currency debt
Corporate so currency debt
2000
2.8
4.9
2017
6.0
0.0
1.0
4.0
5.0
2.0
3.0
EM debt markets also becoming more liquid
Source: UBS, EMTA (Emerging Markets Traders Association), as of 2017.
Figure 29
Eurobonds - Sovereign
Eurobonds - Corporate
Annual debt trading volumes, by debt type, in trillions of USD
Eurobonds - Other
Local Markets - Local currency
Local Markets - Hard currency
Local Markets - Other Brady Bonds
Options and warrants
Loans
2003
$13.1 tr$3.6 tr
$20.9 tr
China
EM Ex-ChinaDM
DM
$59.3 tr
$28.4 tr
2017
60
80
0
20
40
Market cap growth of EM equities outpaced DM since 2003
Note: EM Ex-China includes frontier markets and Saudi Arabia. Data has not been examined on the company level to rule outdouble counting between exchanges.Source: UBS, World Federation of Exchanges, as of 2018.
Figure 30
Developed
EM Ex-China
Market capitalization, in trillions of USD
China
Since 2003, the market capitalization of emerging market equities has grown 7.9X – China’s by 10.9x – compared with 2.8x for developed market equities. Emerging countries now make up 32% of the world’s equity market cap. Yet, the weight of EM equities remains at just 12.5% of the overall equities allocation in global portfolios, according to the Institute of International Finance. Global investors are recognizing the importance of Chinese assets in their portfolios. MSCI included China-listed A-shares into its benchmark indices in June 2018. Although the initial inclusion factors are small, the change should boost global investors’ exposure to Chinese onshore assets, and we expect more to follow.

20 Thinking strategically about Emerging Markets – October 2018
2003
$19.4 tr$2.7 tr
$32.3 tr
ChinaEM Ex-China
DM
DM
$91.8 tr
$26.9 tr
2017
80
70
90
100
0
30
20
40
10
60
50
Trading volumes in EM equities nearly tripled since 2003
Source: UBS, World Federation of Exchanges, as of 2018.
Figure 31
Developed
EM Ex-China
Annual trading volumes, in trillions of USD
China
China DM Japan Canada Euronext
2.0 2.0
91.8
2.4
KoreaEMEx-China
UnitedKingdom
UnitedStates
India Germany
25
20
15
10
5
30
0
100
50
40
0
20
70
60
10
30
0.7 0.3 1.2
90
80
19.4
61.8
13.13.9 0.7
32.3
0.5 1.3 2.1 3.0 1.4 1.66.6
16.67.5
Trading volume in the Chinese equity market exploded
Source: UBS, World Federation of Exchanges, as of 2018.
Figure 32
2003 2003-2017 Growth Multiple (rhs)
2017
Annual trading volumes, in trillions of USD
2001
92
2016
1200
0
200
800
1000
400
600
955
FX trading volumes in EM have grown by 10 times since 2001
Note: Adjusted for local and cross-border inter-dealer double-counting.Source: UBS, BIS (Bank for International Settlements), as of 2018.
Figure 33
Turnover of over-the-counter foreign exchange instruments, by currency. “Net-net” basis, daily averages, in billions of US dollars
CNY
MXN
HKD
KRW
TRY
INR
RUB
BRL
ZAR
Other EM
CNYMXNHKDKRWTRYINRRUBBRLZAR
Other EM
Equity trading volumes in emerging markets have grown tenfold since 2003 – 27 times in China – compared with only 2.8x in developed markets. Emerging markets currently represent 29% of global equity trading volumes. This should grow alongside the rise in equity market capitalization over the coming years.
After China, India and South Korea have also seen a considerable deepening in their equity markets since 2003. Other emerging markets whose equity trading volumes exceeded USD 200bn in 2017 are South Korea, India, Brazil, South Africa, Turkey, Thailand, Russia, and Saudi Arabia.
Trading of over-the-counter foreign-exchange instruments denominated in emerging market currencies has expanded 10 times since 2001. The Chinese yuan has evolved from being a practically irrelevant currency for global financial markets to being the eighth most traded globally. Its addition to the IMF’s Special Drawing Rights basket of currencies in late 2016 should support its internationalization in the years ahead. Today, the currencies of Mexico, Hong Kong, South Korea, Turkey, Russia, India, Brazil, and South Africa are among the 20 most traded globally, according to the Bank for International Settlements.
Financial market changes

21 Thinking strategically about Emerging Markets – October 2018
Bear case Base case Bull case
63%
USD
tri
llion
s
86%
115%
80
70
90
100
0
30
20
40
10
60
50
EM tradable debt markets could grow to over USD 60 tn in a decade
Note: Base case extrapolates the average growth rate of EM debt trading markets of the last decade. Bull and bear cases adjust the average growth rate of the last decade by half a standard deviation.Source: UBS, BIS (Bank for International Settlements), as of October 2018.
Figure 34
Projected size of EM tradable debt markets ten years out in various scenarios, in USD trillionsThe numbers on top of each bar illustrate projected stock of EM tradable debt as a percentage of 2017 stock of DM tradable debt
EM Ex-China China
72%
354%350
0
150
100
200
50
300
250
165%
44%
132%
USD
tri
llion
s
29%
EM equity market cap could grow to over USD 180 tn in a decade
Note: Base case extrapolates the average growth rate of EM market cap of the last decade. Bull and bear cases adjust the average growth rate of the last decade by a quarter of a standard deviation.Source: UBS, World Federation of Exchanges, as of October 2018.
Figure 35
Projected size of EM equity market cap ten years out in various scenarios, in USD trillionsThe numbers on top of each bar illustrate projected EM market cap as a percentage of 2017 DM market cap
Bear case
Base case
Bull case
A back-of-the-envelope calculation projects that the stock of tradable emerging market debt could surpass USD 60 trillion in a decade’s time, or nearly 85% the current stock of tradable developed market debt.
A similar calculation sees the market cap of EM equities, excluding China, reaching USD 65 trillion in 10 years’ time, or nearly 70% of the current equity market cap in the developed world. Adding China and extrapolating the historical growth rates of its equity market, the capitalization of emerging market stocks could reach nearly USD 120 trillion in a decade, or 132% of the current equity market cap in the developed world.
Financial market changes

22 Thinking strategically about Emerging Markets – October 2018
Chapter 3
Investment implications

23 Thinking strategically about Emerging Markets – October 2018
• EM assets have, over the long term, added both risk and return to global portfolios to varying degrees.
• Historically, of all the EM asset classes, hard-currency sovereign and corporate bonds have offered the best risk-reward and greatest diversification benefits. Equities, local-currency bonds, and exchange rates have exhibited large fluctuations and thus have been preferred for market-timing strategies.
• The strong performance of EM hard-currency bonds has been partially linked to the global bull market in bonds for most of the life of the asset class; the future may be different, for debt and equity.
• The key is to build EM exposure in a diversified fashion, as part of a globally diversified portfolio by asset class and geography.
• Using historical returns, we show that the inclusion of a diversified EM portfolio composed of 40% equities, 25% hard-currency sovereign bonds, 25% corporate bonds, and 10% local-currency bonds would have shifted up the efficient frontier (i.e., the return-risk ratio) of a moderate risk global portfolio.
• We show how the risk-reward effect would vary depending on the degrees of EM exposure, and what these could be under hypothetical bull and bear scenarios.
• The central conclusion is that, subject to risk tolerance and return objectives, the strategic inclusion of a diversified EM portfolio can increase the overall performance of a global portfolio.
Key takeaways
24 Thinking strategically about Emerging Markets – October 2018
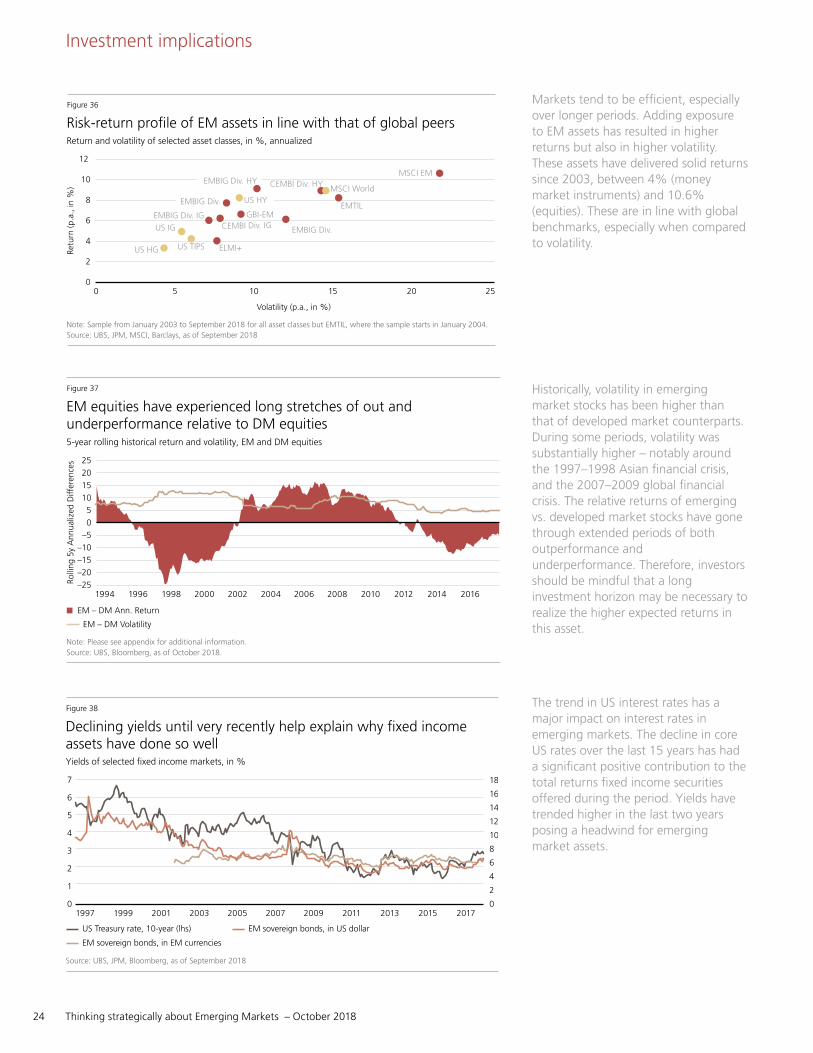
Markets tend to be efficient, especially over longer periods. Adding exposure to EM assets has resulted in higher returns but also in higher volatility. These assets have delivered solid returns since 2003, between 4% (money market instruments) and 10.6% (equities). These are in line with global benchmarks, especially when compared to volatility.
Historically, volatility in emerging market stocks has been higher than that of developed market counterparts. During some periods, volatility was substantially higher – notably around the 1997–1998 Asian financial crisis, and the 2007–2009 global financial crisis. The relative returns of emerging vs. developed market stocks have gone through extended periods of both outperformance and underperformance. Therefore, investors should be mindful that a long investment horizon may be necessary to realize the higher expected returns in this asset.
The trend in US interest rates has a major impact on interest rates in emerging markets. The decline in core US rates over the last 15 years has had a significant positive contribution to the total returns fixed income securities offered during the period. Yields have trended higher in the last two years posing a headwind for emerging market assets.
1994 201620142010 201220082004 2006200220001996 1998
20
15
10
25
5
–5
–25
–15
0
–20
–10
EM equities have experienced long stretches of out and underperformance relative to DM equities
Note: Please see appendix for additional information.Source: UBS, Bloomberg, as of October 2018.
Figure 37
Rolli
ng 5
y A
nnua
lized
Diff
eren
ces
EM – DM Volatility
5-year rolling historical return and volatility, EM and DM equities
EM – DM Ann. Return
2015201320112009200720052003200119991997 2017
16
14
12
10
8
6
4
2
18
0
7
5
0
3
6
2
1
4
Declining yields until very recently help explain why fixed income assets have done so well
Source: UBS, JPM, Bloomberg, as of September 2018
Figure 38
US Treasury rate, 10-year (lhs) EM sovereign bonds, in US dollar
EM sovereign bonds, in EM currencies
Yields of selected fixed income markets, in %
12
10
8
6
4
2
00 2015105 25
Volatility (p.a., in %)
EMBIG Div.CEMBI Div. IG
US HG US TIPS ELMI+
US IG
GBI-EM
CEMBI Div. HY MSCI World
MSCI EM
EMTIL
Retu
rn (p
.a.,
in %
)
EMBIG Div. HY
US HYEMBIG Div.
EMBIG Div. IG
Risk-return profile of EM assets in line with that of global peers
Note: Sample from January 2003 to September 2018 for all asset classes but EMTIL, where the sample starts in January 2004.Source: UBS, JPM, MSCI, Barclays, as of September 2018
Figure 36
Return and volatility of selected asset classes, in %, annualized
Investment implications

25 Thinking strategically about Emerging Markets – October 2018
Looking back at the last 15 years, most emerging market assets have recorded years of either stellar or dismal performance. Equity markets in Latin America, for example, had a very strong run between 2003 and 2007, ranking first globally for five consecutive years. More recently, they were among the worst performers. In global asset performance rankings, emerging markets have had bigger variations than developed markets, touching both ends of the return spectrum. Investors should therefore diversify their EM exposure across asset classes and regions.
His
toric
al R
etur
n
Historical Volatility
6.00
10
8
6
4
2
12
7.0 8.0 9.0 10.0 11.0
Adding EM assets to DM portfolios has allowed investors to have their cake and eat it too
Note: Please see appendix for additional information.Source: UBS, Thomson Reuters DataStream, as of October 2018.
Figure 40
Efficient frontier, historical return and volatility, in %
DM + EM Efficient Frontier
DM Efficient Frontier
US Cash DM Equity
DM IG Bonds EM Sov. Bonds EM Local Currency Bonds
EM EquityEM Corp. Bonds
DM Portfolio:
• US Cash - 5%• DM IG Bonds - 60%• DM Equity - 36%
DM + EM Portfolio:
• US Cash - 5%• DM IG Bonds - 56%• DM Equity - 19%• EM Sov. Bonds - 5%
• EM Corp. Bonds - 5%• EM Local Currency Bonds - 2%• EM Equity - 8%
Investment implications
Including emerging market assets in an investment portfolio not only opens more opportunities for diversification, but can also provide a higher return for the same amount of risk. The lower line in this figure shows the historical efficient frontier – that is, the set of optimal portfolios that offers the highest expected return for a defined level of risk – since 2003, for an investor who allocated only to developed market assets. The historical efficient frontier would have shifted upward by including EM assets in the investable universe.
Diversification matters, don’t put all your eggs in a single EM asset class
Note: Please see appendix for additional information.Source: UBS, JPM, Barclays, MSCI, Bloomberg, as of September 2018
Figure 39
Annual return by asset class, ranks (from 1 to 16, where 1 is the best and 16 the worst performing asset class)
0
2
4
6
8
10
12
14
16
2003 2004 2005 2006 2007 2008 2009 2010 2011 2012 2013 2014 2015 2016 2017 2018
CEMBI Diversified - CEEMEA EMBIG Diversified - Asia
GBI - EM - Latin AmericaUS IG
EMBIG Diversified - Europe CEMBI Diversified - Asia MSCI EM - Asia US HY
EMBIG Diversified - Latam GBI - EM - AsiaMSCI EM - Latin America US TIPS
CEMBI Diversified - Latin America GBI - EM - EuropeMSCI EM - EMEA MSCI World

26 Thinking strategically about Emerging Markets – October 2018
Investment implications
Some EM assets have more diversification value than others
Note: Please see appendix for additional information.Source: UBS, Thomson Reuters DataStream, as of October 2018.
Figure 41
Historical analysis, funding EM assets with 50% DM IG bonds and 50% DM Equities
0 50403010 20
Retu
rn
Shar
pe
Rat
io
EM Currencies10
6
0
8
2
4
0.9
0.6
0.3
0.7
0.8
0.4
0.5
0 50403010 20
Retu
rn
Shar
pe
Rat
io
EM Sov. Bonds10
6
0
8
2
4
0.9
0.6
0.3
0.7
0.8
0.4
0.5
Hist. Sharpe (rhs)Hist. Annual Return EM allocation, in %
EM allocation, in %
EM allocation, in %
EM allocation, in %
EM allocation, in %
EM allocation, in %
Hist. Sharpe (rhs)Hist. Annual Return
0 50403010 20
Retu
rn
Shar
pe
Rat
ioEM Local Currency Bonds
10
6
0
8
2
4
0.9
0.6
0.3
0.7
0.8
0.4
0.5
0 50403010 20
Retu
rn
Shar
pe
Rat
io
EM Corp. Bonds10
6
0
8
2
4
0.9
0.6
0.3
0.7
0.8
0.4
0.5
Hist. Sharpe (rhs)Hist. Annual Return
Hist. Sharpe (rhs)Hist. Annual Return
0 50403010 20
Retu
rn
Shar
pe
Rat
io
EM Equity10
6
0
8
2
4
0.9
0.6
0.3
0.7
0.8
0.4
0.5
0 50403010 20
Retu
rn
Shar
pe
Rat
io
EM Portfolio10
6
0
8
2
4
0.9
0.6
0.3
0.7
0.8
0.4
0.5
Hist. Sharpe (rhs)Hist. Annual Return
Hist. Sharpe (rhs)Hist. Annual Return
This figure shows the historical effect of diversifying a developed markets portfolio by adding emerging market assets, from 2003 to this date. The developed markets portfolio is made up of 50% investment grade bonds and 50% equity. In the sample period, the Sharpe ratio – the return earned per unit of volatility – of the DM-only portfolio was high compared to many other historical episodes, due partly to falling interest rates. Including EM sovereign and corporate bonds, or the diversified EM portfolio (which consists of 40% EM equity, 25% USD-denominated EM sovereign bonds, 25% USD-denominated EM corporate bonds, and 10% EM local currency bonds), improves the Sharpe ratio of the overall portfolio, while including EM currencies and local currency bonds would have decreased the risk-adjusted returns. Including EM equities would have increased the total return of the portfolio, though the risk-adjusted return would not have been as high due to the high volatility of EM equities over this period. Remember, this is based on history.

27 Thinking strategically about Emerging Markets – October 2018
Investment implications
Bull (14% EM) Base (10% EM) Bear (6% EM)
Figure 42
The optimal allocation to EM assets depends on risk and return objectives Scenario Analysis: Black-Litterman Optimization
Expected Returns
Asset Name Bull Base Bear Volatility (Base)
USD Cash 2.6% 2.6% 2.6% 0.5%
DM IG Bonds 2.5% 2.4% 2.3% 5.8%
DM Equity 8.3% 8.0% 7.7% 14.8%
EM Cash 3.7% 3.5% 3.2% 8.5%
EM Local Bonds 5.0% 4.6% 4.3% 13.2%
EM Sov. Bonds 4.4% 4.2% 3.9% 9.2%
EM Corp. Bonds 4.3% 4.1% 3.9% 8.2%
EM Equity 9.7% 9.1% 8.5% 22.0%
Diversified DM Portfolio 5.4% 5.2% 5.0% 8.8%
Diversified EM Portfolio 6.5% 6.1% 5.8% 13.1%
Combined Diversified DM and EM Portfolio 5.5% 5.3% 5.1% 9.0%
Note: The Combined Diversified DM and EM Portfolio's asset weights differ for each case, unlike the other portfolios and assets. The volatility figure represents base case volatility—bull case volatility is 9.0% and bear case volatility is 8.9%. The reason bear case volatility is lower than base case volatility is that the Black-Litterman optimization assigns a lower weight to EM assets in the bear case. See appendix for additional information.Source: UBS, Thomson Reuters DataStream, as of October 2018.
For investors with expectations other than our base case, the optimal allocation could look quite different. In the base case, an investor might want to include about 10% EM assets into their diversified allocation. However, there are estimation errors and uncertainties in all forecasts. If an investor believes strongly that EM will outperform or underperform DM assets, then they might want to adjust their allocation accordingly.The exercise presented here uses Black-Litterman optimization vs. the base case to test how the allocation might look if the expected EM returns were shifted upward or downward by half of the statistical uncertainty in the forecasts.
US Cash
DM Equity
EM Cash
DM IG Bonds EM Sov. Bonds
EM Local Bonds
5%5.7%
1.4%
3.6%
3.6%
5%4.0%
1.0%
2.5%2.5%
38%
43%
45%
40%42%
47%
1.4%
1.4%0.6%
2.3%5%
EM Equity
EM Corp. Bonds

28 Thinking strategically about Emerging Markets – October 2018
Methodological appendix
Country classification methodology:
Figures 1, 2, 3, 4, 5, 6, 7, 8, 9, 10, 11, 12, 13, 15, 16, 17, 18, 19, 20, 21, 22, 23, 24, 25, 26, 27, 28, 30, 31, 32, 33, 34, 35:
DM and EM classifications are based on IMF’s designations. They are not confined to strict criteria, economic or otherwise, but instead have evolved over time to provide meaningful organization of data. As of 2018, the EM classification was comprised of: Afghanistan, Albania, Algeria, Angola, Antigua and Barbuda, Argentina, Armenia, Azerbaijan, The Bahamas, Bahrain, Bangladesh, Barbados, Belarus, Belize, Benin, Bhutan, Bolivia, Bosnia and Herzegovina, Botswana, Brazil, Brunei Da-russalam, Bulgaria, Burkina Faso, Burundi, Cabo Verde, Cambodia, Cameroon, Central African Republic, Chad, Chile, China, Colombia, Comoros, Costa Rica, Côte d’Ivoire, Croatia, Czech Republic, Democratic Republic of the Congo, Djibouti, Domi-nica, Dominican Republic, Ecuador, Egypt, El Salvador, Equatorial Guinea, Eritrea, Ethiopia, Fiji, Gabon, The Gambia, Georgia, Ghana, Grenada, Guatemala, Guinea, Guinea-Bissau, Guyana, Haiti, Honduras, Hong Kong SAR, Hungary, India, Indonesia, Iran, Iraq, Jamaica, Jordan, Kazakhstan, Kenya, Kiribati, Kosovo, Korea, Kuwait, Kyrgyz Republic, Lao, Lebanon, Lesotho, Li-beria, Libya, Macao SAR, Macedonia, Madagascar, Malawi, Malaysia, Maldives, Mali, Marshall Islands, Mauritania, Mauritius, Mexico, Micronesia, Moldova, Mongolia, Montenegro, Morocco, Mozambique, Myanmar, Namibia, Nauru, Nepal, Nicaragua, Niger, Nigeria, Oman, Pakistan, Palau, Panama, Papua New Guinea, Paraguay, Peru, Philippines, Poland, Puerto Rico, Qatar, Republic of Congo, Romania, Russia, Rwanda, Samoa, São Tomé and Príncipe, Saudi Arabia, Senegal, Serbia, Seychelles, Sierra Leone, Singapore, Solomon Islands, Somalia, South Africa, South Sudan, Sri Lanka, St. Kitts and Nevis, St. Lucia, St. Vincent and the Grenadines, Sudan, Suriname, Swaziland, Syria, Taiwan Province of China, Tajikistan, Tanzania, Thailand, Timor-Leste, Togo, Tonga, Trinidad and Tobago, Tunisia, Turkey, Turkmenistan, Tuvalu, Uganda, Ukraine, United Arab Emirates, Uruguay, Uzbekistan, Vanuatu, Venezuela, Vietnam, Yemen, Zambia, Zimbabwe. The DM classification was comprised of: Australia, Austria, Belgium, Canada, Cyprus, Denmark, Estonia, Finland, France, Germany, Greece, Iceland, Ireland, Israel, Italy, Japan, Latvia, Lithuania, Luxembourg, Malta, Netherlands, New Zealand, Norway, Portugal, San Marino, Slovak Republic, Slovenia, Spain, Sweden, Switzerland, United Kingdom, United States. For our analysis, we categorized Czech Republic and Korea as EM, differing from the IMF’s classifications.
Figures 14, 15, 16:
DM and EM classifications are based on The United Nation’s classifications. The DM classification was comprised of: Eu-rope, N. America, Australia/New Zealand, and Japan. The EM classification was comprised of: Africa, Asia (ex-Japan), Latin America, and Caribbean.
Figure 29:
EMTA’s Emerging Markets definition is based on a broad definition that enables the organization to pursue projects involving countries in which the EM trading and investment community has shown significant interest.

29 Thinking strategically about Emerging Markets – October 2018
Methodological appendix
Chapter 3 methodology notes:
Figures 36, 37, 39, 40, 41, 42:
Total return in USD were considered in computations.
Figures 37, 40, 41 and 42:
The indices detailed below were used to model the respective asset classes:
Asset Class Index
USD Cash FTSE USD Euro Deposits 3M
DM IG Bonds BBG Barclays Global Aggregate
DM Equity MSCI World
EM Cash JPMorgan ELMI + Composite
EM Local Bonds JPM GBI-EM Global Diversified
EM Sovereign Bonds JPM EMBI Global Diversified
EM Corporate Bonds JPM CEMBI Broad Diversified
EM Equity MSCI Emerging Markets
Figure 37:
The figure illustrates the difference in 5-year rolling returns and volatilities between EM and DM equities. The volatilities are cal-culated using 5-year rolling windows of arithmetic monthly returns. The returns are calculated cumulatively over rolling 5-year windows, and are then annualized.
Figure 40:
The figure is calculated using historical returns and volatilities during the period from Jan. 2003 – Aug. 2018. The ‘DM efficient frontier’ is calculated by finding the unconstrained allocation with the highest return for a given volatility level, investing in just DM equity, DM IG bonds, and DM cash. The EM efficient frontier is calculated with the same approach, but including the EM assets as well. The EM pie chart is included for illustrative purposes, and constrained to contain EM exposure only through a diversified EM portfolio containing 40% equities, 25% hard currency sovereign bonds, 25% hard currency corporate bonds, and 10% local currency bonds. The EM pie chart does not sit on the EM efficient frontier, but does lie above the DM efficient frontier.
Figure 41:
The figure is calculated using historical returns and volatilities during the period from Jan. 2003 – Aug. 2018. The allocation on the far left of each chart contains no EM equities, and is 5% USD cash, 45% DM IG bonds and 50% DM equities. Different EM assets are added to this benchmark DM portfolio, funded pro rata from the 3 DM asset classes. The EM portfolio in the lower-right chart contains 40% EM equities, 25% EM USD sovereign bonds, 25% EM USD corporate bonds, and 10% EM local currency bonds.
Figure 42:
The figure uses our 7-year expected risk and return forecasts for all calculations. All allocations to EM in this example are assumed to occur with fixed proportions of 40% EM equities, 25% EM USD sovereign bonds, 25% EM USD corporate bonds, and 10% EM local currency bonds. The ‘base case‘ assumes a 10% allocation to EM assets in the overall diversified portfolio. The bull (bear) case returns are derived by adding (subtracting) ½ of the estimation uncertainty for EM assets from the expected returns. We then use the Black-Litterman framework, which takes these bull and bear returns along with uncertainty estimates for all asset classes to obtain a new set of asset class returns – these are displayed in the table. With the returns for a given scenario, we can then perform a mean-variance optimization to obtain the allocations shown in the pie charts at the bottom of the figure.

30 Thinking strategically about Emerging Markets – October 2018
Research publications from Chief Investment Office Global Wealth Management, formerly known as CIO Americas, Wealth Management, are published by UBS Global Wealth Management, a Business Division of UBS AG or an affiliate thereof (collectively, UBS). In certain countries UBS AG is referred to as UBS SA. This publication is for your information only and is not intended as an offer, or a solicitation of an offer, to buy or sell any investment or other specific product. The analysis contained herein does not constitute a personal recommendation or take into account the particular invest-ment objectives, investment strategies, financial situation and needs of any specific recipient. It is based on numerous assumptions. Different assumptions could result in materially different results. We recommend that you obtain financial and/or tax advice as to the implications (including tax) of investing in the manner described or in any of the products mentioned herein. Certain services and products are subject to legal restrictions and cannot be offered worldwide on an unre-stricted basis and/or may not be eligible for sale to all investors. All information and opinions expressed in this document were obtained from sources believed to be reliable and in good faith, but no representation or warranty, express or implied, is made as to its accuracy or completeness (other than disclo-sures relating to UBS). All information and opinions as well as any prices indicated are current only as of the date of this report, and are subject to change without notice. Opinions expressed herein may differ or be contrary to those expressed by other business areas or divisions of UBS as a result of using different assumptions and/or criteria. At any time, investment decisions (including whether to buy, sell or hold securities) made by UBS and its employees may differ from or be contrary to the opinions expressed in UBS research publications. Some investments may not be readily realizable since the market in the securities is illiquid and therefore valuing the investment and identifying the risk to which you are exposed may be dif-ficult to quantify. UBS relies on information barriers to control the flow of information contained in one or more areas within UBS, into other areas, units, divisions or affiliates of UBS. Futures and options trading is considered risky. Past perfor-mance of an investment is no guarantee for its future perfor-mance. Some investments may be subject to sudden and large falls in value and on realization you may receive back less than you invested or may be required to pay more. Changes in FX rates may have an adverse effect on the price, value or income of an investment. This report is for distribution only under such circumstances as may be permitted by applicable law.
Distributed to US persons by UBS Financial Services Inc. or UBS Securities LLC, subsidiaries of UBS AG. UBS Switzerland AG, UBS Deutschland AG, UBS Bank, S.A., UBS Brasil Administra-dora de Valores Mobiliarios Ltda, UBS Asesores Mexico, S.A. de C.V., UBS Securities Japan Co., Ltd, UBS Wealth Manage-ment Israel Ltd and UBS Menkul Degerler AS are affiliates of UBS AG. UBS Financial Services Incorporated of Puerto Rico is a subsidiary of UBS Financial Services Inc. UBS Financial Ser-vices Inc. accepts responsibility for the content of a report pre-pared by a non-US affiliate when it distributes reports to US persons. All transactions by a US person in the securities men-tioned in this report should be effected through a US-regis-tered broker dealer affiliated with UBS, and not through a non-US affiliate. The contents of this report have not been and will not be approved by any securities or investment authority in the United States or elsewhere. UBS Financial Services Inc. is not acting as a municipal advisor to any municipal entity or obligated person within the meaning of Section 15B of the Securities Exchange Act (the “Municipal Advisor Rule”) and the opinions or views contained herein are not intended to be, and do not constitute, advice within the meaning of the Municipal Advisor Rule.
UBS specifically prohibits the redistribution or reproduction of this material in whole or in part without the prior written per-mission of UBS. UBS accepts no liability whatsoever for any redistribution of this document or its contents by third parties.
Version as per April 2018.
© UBS 2018. The key symbol and UBS are among the regis-tered and unregistered trademarks of UBS. All rights reserved.
Emerging Market InvestmentsInvestors should be aware that Emerging Market assets are subject to, amongst others, potential risks linked to currency volatility, abrupt changes in the cost of capital and the eco-nomic growth outlook, as well as regulatory and socio-politi-cal risk, interest rate risk and higher credit risk. Assets can sometimes be very illiquid and liquidity conditions can abruptly worsen. Investors interested in holding bonds for a longer period are advised to select the bonds of those sover-eigns with the highest credit ratings (in the investment grade band). Such an approach should decrease the risk that an investor could end up holding bonds on which the sovereign has defaulted.
Disclaimer