Embed Size (px)
Citation preview
TTHHÈÈSSEE
En vue de l'obtention du
DDOOCCTTOORRAATT DDEE LL’’UUNNIIVVEERRSSIITTÉÉ DDEE TTOOUULLOOUUSSEE
Délivré par l'Université Toulouse III - Paul Sabatier Discipline ou spécialité : Géochimie isotopique
JURY
Jeroen Sonke - CNRS-CR1, OMP-CNRS, Toulouse (Directeur) Sovan Lek - Professeur UPS, UPS-EDB, Toulouse (Examinateur) Laurence Maurice - IRD-DR2, OMP-GET, Toulouse (Examinateur)
Jan Wiederhold - Recherche ETH, IBP, Zurich (Rapporteur) Jiubin Chen - Professeur CAS, SKLEG, Guiyang (Rapporteur)
Xinbin Feng - Professeur CAS, SKLEG, Guiyang (Examinateur)
Ecole doctorale : Sciences de l'Univers, de l'Environnement et de l'Espace
Unité de recherche : Géosciences Environnement Toulouse Directeur(s) de Thèse : Jeroen Sonke
Présentée et soutenue par Ruoyu Sun Le 16/09/2013
Titre : Les variations isotopiques du mercure dans le charbon et les produits de
combustion du charbon - Une évaluation de la traçabilité des émissions du mercure des centrales au charbon
Title : Mercury stable isotope variations in coal and coal combustion products - Evaluating the traceability of coal Hg emissions
Abstract
Abstract
Mercury (Hg) is a toxic, persistent and globally distributed pollutant. Since the industrial revolution,
human activities have augmented the global Hg cycle at the Earth’s surface by a factor of three. Hg
emissions from coal-fired power plants represent at present the largest single anthropogenic source.
However, quantitative tracing of the fate of coal Hg emissions from different countries or regions is a
challenging issue. The objective of this PhD dissertation was to use Hg stable isotope signatures to
address this problem. Firstly, we developed a combustion-trapping protocol to extract, purify and
pre-concentrate Hg from solid samples with low Hg levels such as coal and coal combustion
products. Purified coal Hg was then measured for its isotope compositions by high-precision
(~0.1‰, 2σ) multi-collector inductively coupled plasma mass spectrometry.
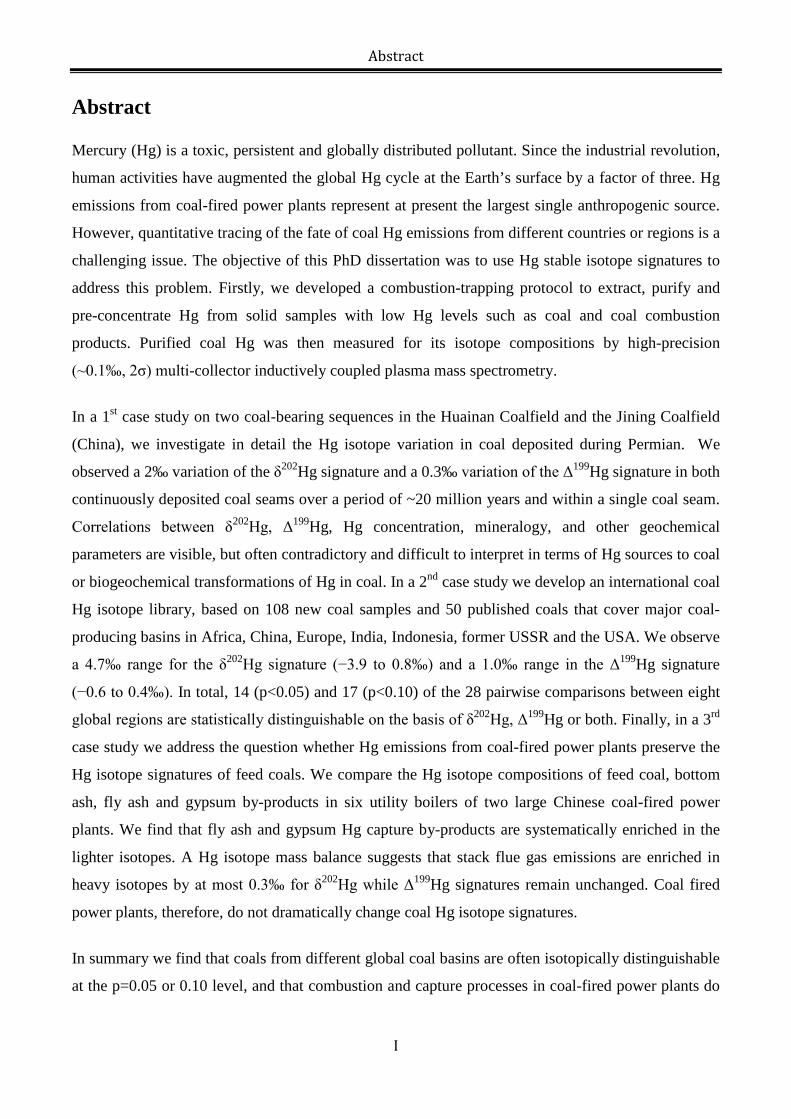
In a 1st case study on two coal-bearing sequences in the Huainan Coalfield and the Jining Coalfield
(China), we investigate in detail the Hg isotope variation in coal deposited during Permian. We
observed a 2‰ variation of the δ202Hg signature and a 0.3‰ variation of the Δ199Hg signature in both
continuously deposited coal seams over a period of ~20 million years and within a single coal seam.
Correlations between δ202Hg, Δ199Hg, Hg concentration, mineralogy, and other geochemical
parameters are visible, but often contradictory and difficult to interpret in terms of Hg sources to coal
or biogeochemical transformations of Hg in coal. In a 2nd case study we develop an international coal
Hg isotope library, based on 108 new coal samples and 50 published coals that cover major coal-
producing basins in Africa, China, Europe, India, Indonesia, former USSR and the USA. We observe
a 4.7‰ range for the δ202Hg signature (−3.9 to 0.8‰) and a 1.0‰ range in the Δ199Hg signature
(−0.6 to 0.4‰). In total, 14 (p<0.05) and 17 (p<0.10) of the 28 pairwise comparisons between eight
global regions are statistically distinguishable on the basis of δ202Hg, Δ199Hg or both. Finally, in a 3rd
case study we address the question whether Hg emissions from coal-fired power plants preserve the
Hg isotope signatures of feed coals. We compare the Hg isotope compositions of feed coal, bottom
ash, fly ash and gypsum by-products in six utility boilers of two large Chinese coal-fired power
plants. We find that fly ash and gypsum Hg capture by-products are systematically enriched in the
lighter isotopes. A Hg isotope mass balance suggests that stack flue gas emissions are enriched in
heavy isotopes by at most 0.3‰ for δ202Hg while Δ199Hg signatures remain unchanged. Coal fired
power plants, therefore, do not dramatically change coal Hg isotope signatures.
In summary we find that coals from different global coal basins are often isotopically distinguishable
at the p=0.05 or 0.10 level, and that combustion and capture processes in coal-fired power plants do
I
Abstract
not substantially change feed coal Hg isotope signatures. We consider these combined results to be
sufficiently promising to recommend detailed atmospheric Hg isotope tracer studies of coal plant Hg
emissions. However, we anticipate that the different gaseous and particulate forms of Hg in coal flue
gas emissions may carry more contrasting Hg isotope signatures than we estimated for bulk
emissions. Therefore, caution should be taken in near-field and far-field coal Hg emission tracing,
and additional studies on the Hg isotope signatures of coal plant Hg emissions are necessary.
II
Abstract
Résumé
Le mercure (Hg) est un élément toxique et récalcitrant dans notre environnement. Depuis la
révolution industrielle, les activités humains ont augmenté la quantité du Hg qui cycle à la surface de
la Terre d’un facteur trois. Les émissions du Hg des centrales au charbon représentent à elles-seules
la moitié de tous les émissions anthropiques du Hg. Désormais, le traçage quantitatif de ces
émissions des différentes régions du globe n’est pas simple. L’objectif de cette thèse a été d’explorer
les signatures isotopiques du Hg comme traceur potentiel des émissions du Hg des centrales au
charbon. Dans un premier temps un protocole d’extraction, purification et de pré-concentration du
Hg par voie de combustion et re-piégeage acide a été développé. Une fois purifie, le Hg a été analyse
par spectrométrie de masse à haute précision (~0.1‰, 2σ).
Dans une 1ier étude de cas, deux séquences géologiques de charbon du Carbonifère et Permien ont été
examinées dans les bassins de charbon de Huainan et Jining en Chine. Une variation de 2‰ de la
signature δ202Hg, et une variation de 0.3‰ de la signature Δ199Hg a été observé au sein d’une
séquence de charbon encompassant 20 millions d’années, mais egalement au sein d’une seule couche
de charbon. Ces variations isotopiques sont parfois corrélées entre eux, ou avec les teneurs en Hg ou
encore avec des paramètres minéralogiques et/ou géochimiques. Cependant il a été difficile
d’interpréter les tendences isotopiques de façon inéquivoque. Dans une 2ieme étude de cas, une
compilation isotopique du Hg dans les charbons a été établie par l’analyse de 108 nouveaux
échantillons de charbon, augmenté par les 50 valeurs déjà publiés. La compilation inclut des charbon
provenant de l’Afrique, Europe, Inde, Indonesie, l’ancien USSR et les USA. Une variation
isotopique de 4.7‰ de la signature δ202Hg, et une variation de 1.0‰ de la signature Δ199Hg est
observeé dans l’ensemble des charbon. 14 (p<0.05) and 17 (p<0.10) des 28 comparaisons possibles
entre les huit principales régions producteur du charbon du monde sont statistiquement différenciable
selon leurs δ202Hg, Δ199Hg ou les deux. Enfin, dans une 3ieme étude de cas, nous nous intéressons à la
question si les émissions du Hg à la cheminée d’un centrale au charbon préservent la signature
isotopique du charbon combusté. Afin d’y répondre les charbons, cendres résiduels, cendres volants,
et gypse de six chaudrons industriels de deux grand centrales de charbon chinoise ont été étudiés.
Nous observons que les produits secondaires des centrales, i.e. cendres et gypse, sont
systématiquement enrichis en isotopes légers par rapport au charbon combusté. Par conséquence, un
bilan de masse isotopique suggère que les émissions du Hg par la cheminée doivent être légèrement
enrichis en isotopes lourds, jusqu’à 0.3‰ (δ202Hg). En parallèle, les signatures Δ199Hg restent
III
Abstract
inchangées et on estime qu’en fin de compte que les centrales au charbon ne modifient pas
dramatiquement les signatures isotopiques caractéristiques des charbons combustés.
En résumé, nous observons que les charbons provenant du globe entier sont isotopiquement
discernable à un niveau de p de <0.05 ou <0.1. Les processus de combustion et de captage du Hg
dans les centrales au charbon ne modifient que minimalement les signatures isotopiques du Hg. Nous
considérons ces deux résultats suffisamment prometteur à fin de recommander des études plus
élaborées au sujet du traçage des émissions du Hg des centrales au charbon dans l’environnement. Il
sera important d’étudier les signatures isotopiques des formes gazeuses et particulaires du Hg dans
les panaches des centrales au charbon, afin de vérifier leur variation et évolution. La difficulté de
tracer les sources du Hg réside dans la modification de ses signatures isotopiques par les
transformations biogéochimiques omniprésentes dans l’atmosphère.
IV
Acknowledgments
Acknowledgments
The priority of my acknowledgements is to give my foremost appreciation to my supervisor Jeroen
Sonke for the priorities that he always gives to me. Without his advice, I would not have completed
this dissertation within the scheduled deadline. Throughout this dissertation, it contains his thousands
of corrections, thoughtful exploration and constructive suggestions. I will be always indebted to his
guidance and inspiration during the entire PhD study besides his further support for my future
research. Equal appreciation is given to other members of our Mercury Research Group at the OMP-
GET laboratory (Laurence Maurice, David Point, Lars-Eric Heimbürger, Cecile Dufour, Nicolas
Marusczak, Xuewu Fu, Jeremy Masbou, Maxime Enrico, Laure Laffont). The team collaboration for
method development and the passionate viewpoints discussed during our Club MIF form an
important part of this dissertation.
Most of my coal samples in this dissertation come from USTC Coal Laboratory led by Prof. Guijian
Liu, my former MSc supervisor. It is his generous share of samples that has made my research move
on. I am very grateful for his long-term support. I am also very grateful for other coal samples
donated by Harvey Belkin (USGS), Debasish Shome (India) and Oleg Pokrovsky (OMP-GET). I
would not have completed my experiments without the helps from the excellent engineers and
scientists in the Service de Chimie (Carole Causserand, Stéphane Audry), Service Salle Blanche
(Jonathan Prunier, Manuel Henry), Service ICPMS (Jérôme Chmeleff) and Service XRD (Damien
Guillaume) of OMP-GET, and in LCABIE of Pau University (David Amouroux and Sylvain Berail).
Their efforts are highly appreciated.
I thank the Chinese Scholarship Council for providing me three years of PhD scholarship, and
financial support of research grants ANR-09-JCJC-0035-01 from the French Agence Nationale de
Recherche and ERC-2010-StG_20091028 from the European Research Council for this dissertation.
Des remerciements spéciaux vont à mes collègues de bureau qui me font sentir que mon français
n'est pas aussi bon que je le pensais. Finally, I would like to thank my family. You are always my
emotional connection.
V
Table of contents
Table of Contents Abstract ................................................................................................................................................................ I
Résumé .............................................................................................................................................................. III
Acknowledgments ............................................................................................................................................... V
Table of Contents ................................................................................................................................................ A
List of abbreviations ............................................................................................................................................ E
Chapter 1. Introduction ........................................................................................................................................ 2
Chapitre 1. Introduction ....................................................................................................................................... 5
References ....................................................................................................................................................... 8
Chapter 2. Mercury (Hg) emission from coal combustion and its role in the global biogeochemical Hg cycle 10
2.1. Hg and its toxicology/epidemiology ....................................................................................................... 10
2.1.1. Hg and its physicochemical properties ............................................................................................ 10
2.1.2. Hg toxicology/epidemiology ........................................................................................................... 10
2.2. Hg geochemistry in coal and Hg emissions from coal combustion ........................................................ 11
2.2.1. Coal formation and coalification ..................................................................................................... 11
2.2.2. Coal as an energy base..................................................................................................................... 12
2.2.3. Hg geochemistry in coal .................................................................................................................. 14
2.2.4. Hg partitioning during coal combustion .......................................................................................... 15
2.2.5. Atmospheric Hg emissions from coal combustion .......................................................................... 16
2.3. Global Hg emissions and biogeochemical cycling ................................................................................. 17
References ..................................................................................................................................................... 21
Chapter 3. Theory of Hg isotope fractionation .................................................................................................. 27
3.1. General concepts................................................................................................................................... 27
3.1.1. Isotope effect ................................................................................................................................... 27
3.1.2. Isotope fractionation factor .............................................................................................................. 28
3.1.3. Delta value (δ) and conversion ........................................................................................................ 28
3.2. Literature review on Hg isotopes fractionation ...................................................................................... 29
3.3. Hg isotopes fractionation mechanisms ................................................................................................... 30
3.3.1. Mass dependent fractionation (MDF) .............................................................................................. 30
3.3.2. Mass independent fractionation (MIF) ............................................................................................ 31
A
Table of contents
References ..................................................................................................................................................... 35
Chapter 4. Sample descriptions and Hg isotope measurements ........................................................................ 40
4.1. Sample descriptions ................................................................................................................................ 40
4.1.1. Samples from continuous coal-bearing sequences .......................................................................... 40
4.1.2. World coal samples ......................................................................................................................... 43
4.1.3. Coal and coal combustion products ................................................................................................. 45
4.2. Hg stable isotope measurements............................................................................................................. 48
4.2.1. Instrumental mass bias..................................................................................................................... 50
4.2.2. Matrix effect .................................................................................................................................... 55
References ..................................................................................................................................................... 57
Chapter 5. A double-stage tube furnace – acid trapping protocol for the pre-concentration of mercury from solid samples for isotopic analysis (Analytical and Bioanalytical Chemistry, in press) ................................... 60
Chapter 6. Hg stable isotope variations in coal-bearing sequences and its implication for Hg sources and geochemistry in coal (article in preparation) ..................................................................................................... 71
6.1. Introduction ............................................................................................................................................ 73
6.2. Study area ............................................................................................................................................... 74
6.2.1. Coal-forming environment .............................................................................................................. 75
6.2.2. Coal-bearing sequences ................................................................................................................... 75
6.3. Samples and analyses ............................................................................................................................. 76
6.3.1. Sample collection ............................................................................................................................ 76
6.3.2. Analyses .......................................................................................................................................... 79
6.4. Results .................................................................................................................................................... 81
6.4.1. Hg concentrations ............................................................................................................................ 81
6.4.2 Hg isotope compositions .................................................................................................................. 83
6.5. Discussion .............................................................................................................................................. 86
6.5.1. ZJ coals ............................................................................................................................................ 86
6.5.2. DZ coals........................................................................................................................................... 87
6.5.3. Hg isotope compositions in natural cokes ....................................................................................... 89
6.6. Implications ............................................................................................................................................ 89
References ..................................................................................................................................................... 90
B
Table of contents
Chapter 7. Hg stable isotope compositions of selected world coals (article in preparation for Environmental Science and Technology) ................................................................................................................................... 96
7.1. Introduction ............................................................................................................................................ 98
7.2. Samples and analysis .............................................................................................................................. 99
7.2.1. Samples collection and processing .................................................................................................. 99
7.2.2. Hg and Hg isotope determinations ................................................................................................ 100
7.2.3. Blank, recovery and uncertainty .................................................................................................... 100
7.3. Results and discussions ........................................................................................................................ 101
7.3.1. Mercury isotope compositions ....................................................................................................... 101
7.3.2. Biogeochemical factors influencing Hg isotope compositions in coals ........................................ 112
7.3.3. Industrial processes influencing Hg isotope compositions of coal Hg emissions ......................... 119
7.3.4. Coal import-export flow control on a regional/national coal Hg isotope emission inventory ....... 120
7.4. Implications .......................................................................................................................................... 121
References ................................................................................................................................................... 122
Chapter 8. Mercury stable isotope fractionation in six utility boilers of two large coal-fired power plants (published article in Chemical Geology) ......................................................................................................... 127
Appendix A: supplementary data for Chapter 8 .............................................................................................. 137
Chapter 9. Conclusions and perspectives ........................................................................................................ 149
9.1. Conclusions .......................................................................................................................................... 149
9.2 Perspectives ........................................................................................................................................... 150
9.2.1. Species-specific Hg isotope compositions of coal Hg emissions .................................................. 151
9.2.2. Post-emission Hg isotope fractionation in coal flue gases ............................................................ 151
9.2.3. Geological controls on Hg isotope fractionation in coal deposits ................................................. 152
9.2.4. Reconstructing the historical evolution of anthropogenic Hg isotope emission signatures .......... 152
Chapitre 9. Conclusions et perspectives .......................................................................................................... 153
9.1. Conclusions .......................................................................................................................................... 153
9.2 Perspectives ........................................................................................................................................... 155
9.2.1. Les signatures isotopiques de formes spécifiques des émissions du Hg ....................................... 155
9.2.2. Post-emission Hg isotope fractionation in coal flue gases ............................................................ 155
9.2.3. L’origine des variations isotopiques du Hg d’un bassin de charbon. ............................................ 156
C

Table of contents
9.2.4. L’evolution historique des emissions isotopiques du Hg .............................................................. 156
References ................................................................................................................................................... 157
List of Figures ................................................................................................................................................. 158
List of Tables ................................................................................................................................................... 161
Appendix A: supplementary data for Chapter 7 .............................................................................................. 162
Appendix B: supplementary data for Chapter 7 .............................................................................................. 173
Figure B3. World coal import-export flow (short Million tons/yr) ................................................................. 174
Figure B4. A preliminary Hg isotope evolution model of world coals from 1815-2010 ................................ 175
D
List of abbreviations
List of abbreviations
AFS Atomic-fluorescence spectrometry
APCD Air pollution control device
CFUB Coal-fired utility boiler
CV Cold vapor
DMA Direct mercury analyzer
ESP Electrostatic precipitator
FGD Flue-gas desulfurization
GEM Gaseous elemental Hg(0)
GOM Gaseous oxidized Hg(II)
Hg Mercury
MC-ICPMS Multi-collector inductively coupled plasma mass spectrometry
MDF Mass dependent fractionation
MIF Mass independent fractionation
PBM Particulate-bound Hg(II)
TSP Total suspended particle
E

Chapter 1. Introduction
Chapter 1 Introduction
1
Chapter 1. Introduction
Chapter 1. Introduction
Mercury (Hg) is a persistent toxic element. Following Hg emission into the atmosphere from natural
and anthropogenic sources, atmospheric circulation can distribute Hg globally. Depending on its
chemical form and on atmospheric oxidants, the atmospheric lifetime of Hg ranges from several days
to more than one year. For millennia, and especially since the industrial revolution, human activities
such as gold mining, coal combustion and non-ferrous metallurgy have augmented the amount of Hg
in the Earth’s land-ocean-atmosphere system by a factor of three. Currently, anthropogenic Hg
emissions (~2000 tons/year) far surpass those derived from natural processes (~500 tons/year) such
as volcanic eruptions and soil degassing.
Mercury is a chalcophile element, and its concentration in coal is determined by many factors such
as coal rank, coal provenance, depositional environment of coal deposits and geological activities
during and after coal deposition. Sulfide minerals and organic matter are the main Hg carriers in
coal. In general, Hg is present at trace levels of 10-1000 ng/g in coal. However, the large volumes of
coal used in industrial processes have made coal the dominant Hg emission source. Hg emission
from stationary coal combustion, primarily coal-fired power plants, is the largest single source,
accounting at present for approximately half of all anthropogenic Hg emissions (~700-900 tons/year)
(Pacyna et al., 2010; Pirrone et al., 2010).
Quantitative assessment of the impact of coal Hg emission on local, regional and global ecosystems
is of substantial interest to environmental scientists and decision-makers. Moreover, with the
implementation of the first global, legally-binding UNEP treaty aimed at reducing anthropogenic Hg
emissions, the identification and traceability of coal Hg emissions from different countries or regions
is critically important. Hg stable isotope signatures are promising tracers of Hg sources and
biogeochemical transformations of Hg. Different Hg sources are characterized by distinct Hg isotope
compositions that can be resolved within the analytical uncertainty of modern mass spectrometers.
Biogeochemical processes have been shown to fractionate the seven stable Hg isotopes as a function
of mass, nuclear volume or nuclear magnetic moment. Most natural samples, including the coals
considered here, show Hg isotope variations that are controlled by mass dependent fractionation
(MDF, denoted by δ202Hg) and mass independent fractionation related to the magnetic isotope effect
(MIF, denoted by Δ199Hg and Δ201Hg). The objective of this PhD dissertation was to evaluate the
usefulness of Hg stable isotope signatures to 1) understand the origin of Hg in coal, and 2) trace coal-
fired power plant emissions from different global regions.
2
Chapter 1. Introduction
A 3‰ variation in δ202Hg and a 1‰ variation in Δ199Hg and Δ201Hg have been reported in worldwide
coal deposits (Biswas et al., 2008; Lefticariu et al., 2011; Sherman et al., 2012; Sun et al., 2013). In
addition, coals from different coal deposits are distinguishable by δ202Hg and Δ199Hg. This suggests
that atmospheric Hg emissions from coal combustion in different regions can be distinguished.
However, coal combustion processes, Hg inter-species transformations and Hg removal by air
pollution control devices in coal-fired power plants potentially generate coal Hg emissions that are
significantly different from coal in Hg isotope signatures. Therefore, for successful Hg emission
tracing, we need to know at least the following information:
1) Hg isotope signatures of major coal deposits and the ability to distinguish them from each other;
2) The degree to which the Hg isotope compositions are shifted between the emitted bulk flue gases
and feed coal;
3) The isotope signatures of gaseous and particulate Hg forms in bulk flue gases at the coal plant
smoke stack. This has important implications for near-field and far-field environmental Hg tracing as
different Hg species have varying atmospheric reactivities and life-times.
This PhD dissertation is divided into eight chapters to address the above outlined points. Chapters 2
and 3 respectively give a brief review on Hg emissions and cycling, and on Hg isotope fractionation
theory. Sampling protocols and Hg isotope measurement techniques are summarized in Chapter 4.
Chapters 5-8 contain the main scientific findings, organized in four scientific papers of which two
were published. Chapter 5 details a new analytical protocol for extracting Hg from solid samples of
low-level Hg. The solid samples were combusted in a tube furnace and trapped into acid solution
before measurement by multi-collector inductively coupled plasma mass spectrometry. In Chapter 6
we examine in detail the Hg isotope variations of the Huainan and Jining coal basins in China. We
find that natural processes caused a ~2‰ variation of δ202Hg and 0.35‰ of Δ199Hg among coal
seams deposited at the same location over a period of 20 Ma. Yet, the same variation is found back
within a single coal seam. Correlations between δ202Hg, Δ199Hg, Hg concentration, mineralogy, and
other geochemical parameters are visible, but often contradictory and difficult to interpret. In
Chapter 7, we develop a coal Hg isotope library by reporting the isotope compositions of 108 new
coal samples from major coal-producing basins in Africa, China, Europe, India, Indonesia, former
USSR and the USA, adding to the thusfar ~50 published coal samples. A 4.7‰ range in δ202Hg (−3.9
to 0.8‰) and a 1‰ range in Δ199Hg (−0.6 to 0.4‰) are observed. 14 (p<0.05) to 17 (p<0.1) of the 28
pairwise comparisons between eight global regions are statistically distinguishable on the basis of
3
Chapter 1. Introduction
δ202Hg, Δ199Hg or both. These findings justify the potential application of Hg isotope signatures to
coal Hg emission tracing. Chapter 8 addresses the question whether Hg emissions from coal-fired
power plants preserve the Hg isotope signatures of feed coals. To do so, we examined the Hg isotope
compositions of feed coals, bottom ash, fly ash and gypsum at six utility boilers of two modern
Chinese power plants. Results suggest that stack Hg emissions are only slightly enriched by up to
0.3‰ (δ202Hg) in the heavier Hg isotopes relative to feed coal. Moreover, we are able to develop a
generalized Hg isotope fractionation model that relates stack emission δ202Hg to feed coal δ202Hg and
Hg removal efficiencies of electrostatic precipitator and wet flue-gas desulfurization emission
control technologies.
We conclude in Chapter 9 by summarizing our main findings as follows. The Hg isotope
compositions of coal are sufficiently different to distinguish Chinese coals from African, European,
Indian and Mongolian coals at p<0.05, and from Indonesian, former USSR, and the USA coals at
p<0.10. Overall, half of all global coal deposits are isotopically distinguishable (p<0.05). We
evaluated whether coal combustion in coal-fired power plants changes Hg isotope signatures from
feed coal to stack emissions, and find that the changes are minor (δ202Hg, <0.3‰) to negligible
(Δ199Hg). We consider these combined results to be sufficiently promising to recommend detailed
atmospheric Hg isotope tracer studies of coal plant Hg emissions. Nevertheless, as we note in
Chapter 9, the different gaseous and particulate forms of Hg emitted from coal plants may carry
contrasting Hg isotope signatures. Published work on Hg deposition near a coal plant also points at
rapid post-emission changes in Hg isotope signatures (Sherman et al., 2012). More work is needed to
address both of these uncertainties. An in-depth exploration of Hg isotope variations in individual
coal mines and across a single coal seam point at a complex interplay between multiple factors,
including the coal depositional environment, conditions of coalification and post-depositional Hg
dynamics. No conclusive relationship between Hg isotope signatures and these factors could be
made.
4
Chapter 1. Introduction
Chapitre 1. Introduction
Le mercure (Hg) est un élément toxique et persistent dans notre environnement. Suite aux émissions
naturels et anthropiques du Hg, les courant atmosphériques le distribuent a travers du globe. Selon la
forme chimique du Hg et la présence des oxydants, le temps de résidence du Hg dans l’atmosphère
varie de quelques jours a plus d’un an. Pendant des millénaires, et en particulier depuis la révolution
industrielle, les activités humains tels que l’orpaillage, la combustion du charbon ou les activités
métallurgiques ont augmente les teneurs en Hg à la surface de notre planète par un facteur trois.
Aujourd’hui, les émissions anthropiques du Hg (~2000 tonnes/an) dépassent largement les émissions
naturels (~500 tonnes/an) tels que les éruptions volcaniques et le dégazage des sols.
Le Hg, élément chalcophile, est présent dans le charbon ou son concentration est détermine par le
type et l’origine du charbon, l’environnement de déposition du charbon, et les conditions
géologiques pendant et après la formation du charbon. Les minéraux soufrés et la matière organique
sont les phases porteuses du Hg dans le charbon. Typiquement, les teneurs du Hg dans le charbon
sont de l’ordre de 10-1000 ng/g. L les grandes quantités du charbon utilisé par les industries ont
propulsé ce secteur comme émetteur du Hg numéro un. En particulier, l’émission du Hg par les
centrales au charbon est la première source du Hg vers l’atmosphère et représente à elle seule la
moitié des émissions anthropiques du Hg (~700-900 tonnes/an) (Pacyna et al., 2010; Pirrone et al.,
2010).
L’évaluation quantitative de l’impact des émissions du Hg par les centrales au charbon sur
l’environnement local, régional et globale est devenue une priorité pour les scientifiques et les
décideurs en politique d’environnement. La mise en action de la première traité internationale,
élaboré sous les auspices de l’UNEP en 2013, sur la réduction des émissions anthropiques du Hg
demande des outils adaptés à l’identification et le traçage des différents émissions du Hg provenant
des régions du monde. Depuis 2001, la recherche scientifique a montré que les signatures isotopiques
du Hg sont des traceurs promettants des sources du Hg et des transformations biogéochimiques du
Hg. Différentes sources naturels et anthropiques du Hg ont souvent des signatures isotopiques qui
sont suffisamment différents pour être résolues par la spectrométrie de masse moderne. Des
processus biogéochimiques ont été montrés de séparer les sept isotopes stable du Hg en fonction de
leur masse, volume nucléaire, ou leur moment magnétique nucléaire lors des transformations
partièlles. La majorité des échantillons naturels, les charbons étudiés ici inclus, montrent des
fractionnements isotopiques soit dépendents de la masse (MDF, représenté par δ202Hg), ou
5
Chapter 1. Introduction
indépendants de la masse des isotopes (MIF, représenté par Δ199Hg and Δ201Hg). Les objectives
principales de ces travaux de thèse ont été d’évaluer l’applicabilité des signatures isotopiques du Hg
à 1) comprendre l’origine du Hg dans les charbons, et 2) tracer les émissions du Hg des centrales au
charbon de différentes régions du monde.
Deux études précédentes ont montrés des variations isotopiques de 3‰ du δ202Hg et de 1‰ du
Δ199Hg et Δ201Hg dans des charbons d’origines différentes (Biswas et al., 2008; Lefticariu et al.,
2011; Sherman et al., 2012; Sun et al., 2013). Ces résultats suggérèrent que les émissions du Hg des
centrales au charbon de différentes régions du monde sont potentiellement traçable. Cependant la
combustion du charbon comprend des transformations des formes physicochimiques du Hg et une
dépollution partièlle des gaz de combustion qui peuvent dans son ensemble modifier les signatures
isotopiques du charbon. Afin d’évaluer la traçabilité des émissions du Hg des centrales au charbon, il
est désormais nécessaire de comprendre les aspects suivants :
1) Les signatures isotopiques du Hg dans les charbons alimentant les centrales au charbon.
2) L’amplitude du fractionnement isotopique eventuelle entre le charbon et les emissions du charbon
à la cheminee d’une centrale au charbon.
3) Les signatures isotopiques des formes gazeuses et particulaires du Hg émis par les centrales au
charbon. Ceci a un impact sur le traçage de ces émissions vers l’environnement locale (formes
particulaires) et globale (formes gazeuses), car les différentes formes du Hg ont des demi-vies
atmosphériques très contrastés.
Cette thèse a été organisé en huit Chapitres afin de traiter les objectifs établies ci-dessus. Chapitres 2
et 3 dressent l’état de l’art sur les émissions et cycle biogéochimique du Hg, et sur la théorie du
fractionnement isotopique du Hg respectivement. Chapitre 4 résume les protocoles de mesure des
rapports isotopiques par spectrométrie de masse. Les Chapitres 5-8 résument les principaux résultats
scientifiques organises sous quatre publications scientifiques de rang A (dont 2 publies). Chapitre 5
détaille un nouveau protocole d’extraction du Hg par méthode de combustion et piégeage acide,
adapté aux charbons et d’autres échantillons solides de faible teneurs en Hg. Le Chaptire 6 explore
les variations isotopiques du mercure au sein d’une seule mine de charbon, et au sein d’une seule
couche de charbon dans le bassin d’Huainan et d’Jining en Chine. Nous observons une variation de
~2‰ en δ202Hg et de 0.35‰ en Δ199Hg tout au long des couches de charbon déposés pendant 20
millions d’années. Des corrélations entre δ202Hg, Δ199Hg, concentrations en Hg, minéralogie, et
6
Chapter 1. Introduction
autres paramètres géochimiques sont observés, mais parfois contradictoires et difficile à interpréter.
Le Chapitre 7 présente une libraire de signatures isotopiques du Hg dans les charbons basé sur ~50
données publies auparavant, et 108 nouvelles mésures de nombreuses basins de charbon mondiales,
incluant, l’Afrique, la Chine, l’Europe, l’Inde, l’Indonésie, la Mongolie, l’ancient USSR et les Etats-
Unis. Nous observons une variation isotopique de 4.7‰ en δ202Hg (−3.9 a 0.8‰) et de 1‰ en
Δ199Hg (−0.6 a 0.4‰). 14 (p<0.05) à 28 (p<0.1) des 28 comparaisons possibles entre les huit
principales régions producteur du charbon du monde sont statistiquement différenciable selon leurs
δ202Hg, Δ199Hg ou les deux. Cette observation justifie pleinement l’application potentiel de tracer les
émissions du Hg provenant des centrales au charbon du monde. Le Chapitre 8 examine la question si
les émissions du Hg des centrales au charbon préservent les signatures isotopiques des charbons
combustés. Nous avons étudiés les compositions isotopiques du Hg dans les charbons, les cendres
résiduels, les cendres volants et le gypse de six chaudrons de deux grands centrales de charbon
Chinoises. Les résultats montrent que les émissions du Hg par la cheminée sont enrichis au
maximum de 0.3‰ en δ202Hg par rapport au Hg dans le charbon combusté. Nous avons également
pu établir un modèle du fractionnement isotopique du Hg dans les centrales de charbon, lequel
estime le δ202Hg des émissions en fonction du δ202Hg du charbon et les techniques de lavage de gaz
comme la précipitation électrostatique et le désulfurisation.
Le Chapitre 9 conclue la thèse en résumant les avancées et perspectives principales. Nous proposons
que les signatures isotopiques du Hg dans les charbon du globe sont suffisamment différents qu’on
peut distinguer par exemple le charbon Chinois des charbons Africains, Européens, Indiens et
Mongoliens (avec une intervalle de confiance de 95%), et des charbons Indonésiens, Américains et
Russes (avec une intervalle de confiance de 90%). Plus de la moitié de tous les charbons du globe,
organises par régions, sont différenciable par leurs signature isotopiques du Hg. Notre évaluation du
fractionnement isotopique du Hg dans les centrales de charbons mêmes montre que cet artefact est
mineur (δ202Hg, <0.3‰) à négligeable (Δ199Hg). Nous considérons que l’ensemble de ces deux
résultats est assez prometteur pour recommander des études plus approfondis sur le traçage des
émissions du Hg des centrales au charbon à l’échelle de notre planète. Désormais, comme nous le
soulignons dans le Chapitre 8, les différentes formes gazeuses et particulaires du Hg sortant des
cheminées peuvent avoir des signatures isotopiques très contrastes. Une étude publiée récemment
contraste les signatures isotopiques des dépôts du Hg par précipitation humide dans l’environnement
locale d’un centrale à charbon avec les signatures du charbon combusté, et trouve qu’elles ne
ressemblent pas. Des études supplémentaires sur les formes du Hg sortant de la cheminée et sur les
transformations atmosphériques du Hg doivent être fait afin de comprendre ces observations. Notre
7
Chapter 1. Introduction
exploration des variations isotopiques du Hg au sein d’une seule mine et couche de charbon montre
des interactions complexes entre l’environnement de déposition de charbon, la charbonification
même, et les processus géologiques post-dépositionels. Des relations claires entre ces facteurs et les
signatures isotopiques des charbons nous échappent pour l’instant.
References
Biswas, A., Blum, J.D., Bergquist, B.A., Keeler, G.J., Xie, Z., 2008. Natural Mercury Isotope Variation in
Coal Deposits and Organic Soils. Environmental Science & Technology 42, 8303-8309.
Lefticariu, L., Blum, J.D., Gleason, J.D., 2011. Mercury Isotopic Evidence for Multiple Mercury Sources in
Coal from the Illinois Basin. Environmental Science & Technology 45, 1724-1729.
Pirrone, N., Cinnirella, S., Feng, X., Finkelman, R.B., Friedli, H.R., Leaner, J., Mason, R., Mukherjee, A.B.,
Stracher, G.B., Streets, D.G., Telmer, K., 2010. Global mercury emissions to the atmosphere from
anthropogenic and natural sources. Atmospheric Chemistry and Physics 10, 5951-5964.
Pacyna, E.G., Pacyna, J.M., Sundseth, K., Munthe, J., Kindbom, K., Wilson, S., Steenhuisen, F., Maxson, P.,
2010. Global emission of mercury to the atmosphere from anthropogenic sources in 2005 and
projections to 2020. Atmospheric Environment 44, 2487-2499.
Sherman, L.S., Blum, J.D., Keeler, G.J., Demers, J.D., Dvonch, J.T., 2012. Investigation of Local Mercury
Deposition from a Coal-Fired Power Plant Using Mercury Isotopes. Environmental Science &
Technology
Sun, R., Heimbürger, L.-E., Sonke, J.E., Liu, G., Amouroux, D., Berail, S., 2013. Mercury stable isotope
fractionation in six utility boilers of two large coal-fired power plants. Chemical Geology 336, 103-
111.
8

Chapter 2. Mercury (Hg) emission from coal combustion and its role in the global biogeochemical Hg cycle
Chapter 2
Mercury (Hg) emission from coal combustion and its role in the global biogeochemical Hg cycle
9
Chapter 2. Mercury (Hg) emission from coal combustion and its role in the global biogeochemical Hg cycle
Chapter 2. Mercury (Hg) emission from coal combustion and its role in
the global biogeochemical Hg cycle
2.1. Hg and its toxicology/epidemiology
2.1.1. Hg and its physicochemical properties
Mercury (Hg) is a naturally occurring d-block element with atomic number 80 and approximate
atomic weight 200.59. It is the only metal that is in liquid state at standard temperature and pressure.
Elemental Hg has a unique electronic configuration of [Xe] 4f14 5d10 6s2, in which electrons occupy
all the available 1s, 2s, 2p, 3s, 3p, 3d, 4s, 4p, 4d, 4f, 5s, 5p, 5d and 6s subshells. The presence of the
filled 4f shell poorly screens the nuclear charge and thus enhances the attractive force between 6s
shell electrons and the nucleus. Hg has three redox states in nature: 0, I and II. Different Hg forms
can be transformed between each other. For example, Hg(0) can be oxidized into Hg(II) by
atmospheric oxidants such as OH, halogen radicals and ozone. Aqueous forms of Hg(II) can be
reduced into Hg(0) by specific ligands of organic matter, photochemistry and biotic reactions
(Holmes et al., 2010; Selin, 2009; Zhang, 2006). Hg of zero valence state is in form of Hg(0) vapor
or liquid metal, whereas Hg(I) and Hg(II) are in form of inorganic and organic complexes. Due to the
filled electronic structure, gaseous Hg(0) is rather stable under natural condition and has an
atmospheric lifetime ranging from several months to >1 year (Selin et al., 2008). The high volatility
and mobility of atmospheric Hg(0) make it a globally transported pollutant (Mason et al., 1994).
Hg(I) usually forms simple compounds by metal-metal bonds, such as Hg2(II), and has a high
tendency to be further oxidized to Hg(II). Hg(II) is the most common oxidation state in nature and
forms stable derivatives with the anions of chalcogens and halogens, such as HgS, HgSe, HgCl2 and
HgI2. Hg in most naturally occurring minerals (e.g. cinnabar, metacinnabar, HgS) is also in the form
of Hg(II). In addition, Hg(II) forms organo-mercury complexes, in formulas of HgR2 or HgRX (R=
aryl or alkyl; X=halide or acetate), observed in various environmental compartments.
Monomethylmercury (CH3Hg, abbreviated as MMHg), produced from inorganic Hg(II) by biotic
and/or abiotic processes, is a potent neurotoxin (Hsu-Kim et al., 2013).
2.1.2. Hg toxicology/epidemiology
Modern research interest in Hg toxicology and epidemiology dates back to the 1950s MMHg
poisoning incident in Minamata Bay, Japan (Harada, 1995; McAlpine and Araki, 1958). The general
10
Chapter 2. Mercury (Hg) emission from coal combustion and its role in the global biogeochemical Hg cycle
human population is commonly exposed to low or moderate doses of MMHg through consumption
of fish (Sunderland, 2007). MMHg exposure can cause a variety of adverse effects on human health
such as sensory disturbances, ataxia, dysarthria, constriction of the visual field, auditory disturbances
and tremor as seen in Minamata disease (Harada, 1995). Moreover, MMHg can affect the
neurological development of infants even when pregnant women are subjected to low-level MMHg
exposure (Davidson et al., 2004).
A reference dose for fetal MMHg neurotoxicity (defined as the estimate of daily MMHg exposure to
a human population that is likely without appreciable risk of deleterious effects during a lifetime) has
been reviewed and established by the National Research Council of the US National Academy of
Sciences (NRC/NAS, 2000). The reference dose level for women of childbearing age and infants by
the United States Environmental Protection Agency (US EPA) is 5.8 μg/l Hg in cord blood, which is
translated to 0.1 μg Hg per kg bodyweight per day (μg/kg bw/day) or 1.4 μg/g Hg in human hair.
Twenty percent of women in the United States surpass the US EPA guidelines. Public health
institutions in developed countries commonly provide fish consumption advisories for citizens. The
World Health Organization recommends a provisional tolerable MMHg intake of 3.3 μg/kg bw/week
for adults, which corresponds to approximately 7 μg/g Hg in human hair.
However, fish consumption has a variety of health benefits when dietary MMHg is present at low
levels because of the nutrient components in fish (e.g. n-3 polyunsaturated fatty acids) (Daniels et al.,
2004). Therefore, it is important to balance the trade-offs between health benefits from fish
consumption and potential MeHg exposure risks (Egeland and Middaugh, 1997). Nevertheless,
limiting anthropogenic Hg emissions to our environment can only have beneficial effects on human
(child neurodevelopment) and wildlife health.
2.2. Hg geochemistry in coal and Hg emissions from coal combustion
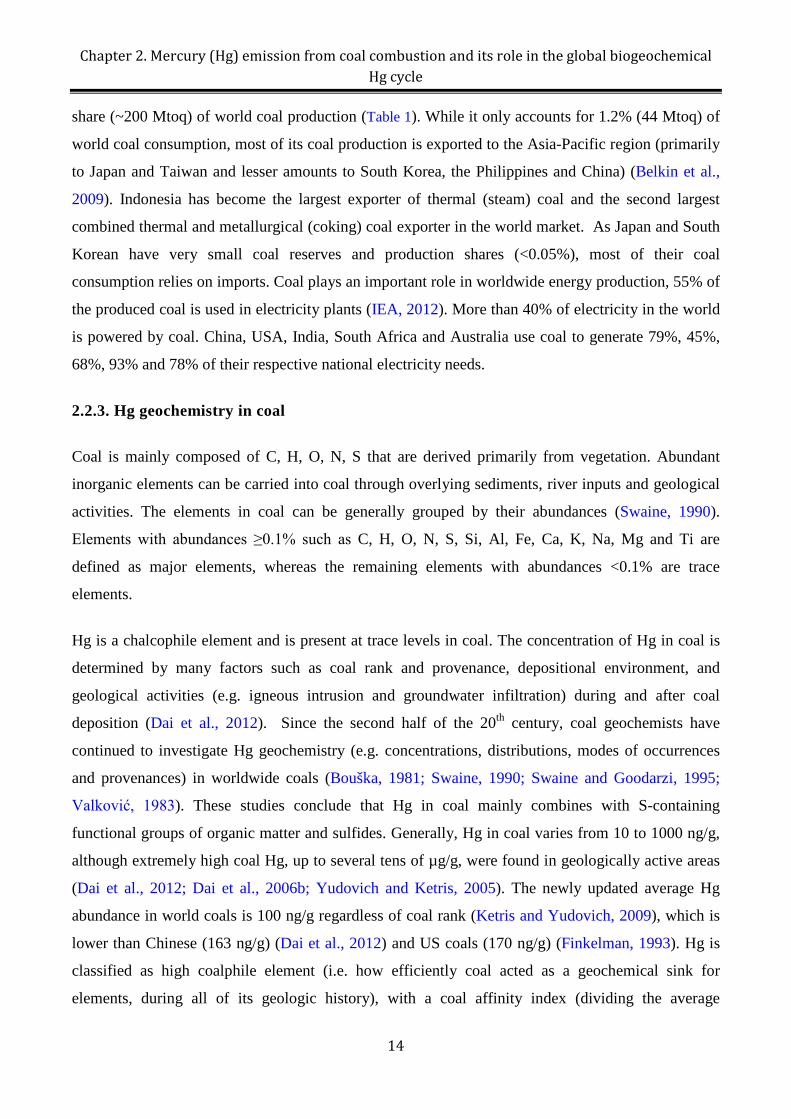
2.2.1. Coal formation and coalification
Coal is a combustible, sedimentary and organic rock formed from prehistoric vegetation remains that
accumulated in swamps and peat bogs. The build-up of sediments (silt, sand, mud) and multi-phases
of tectonic movements buried these decayed vegetations at great depth where they were subjected to
high temperature/pressure and subsequently evolved from peat to coal. According to the organic
maturity of coal, it can be divided into two broad ranks: low-rank coal (i.e. brown coal including
lignite and sub-bituminous coal) and high-rank coal (i.e. hard coal including bituminous coal and
11
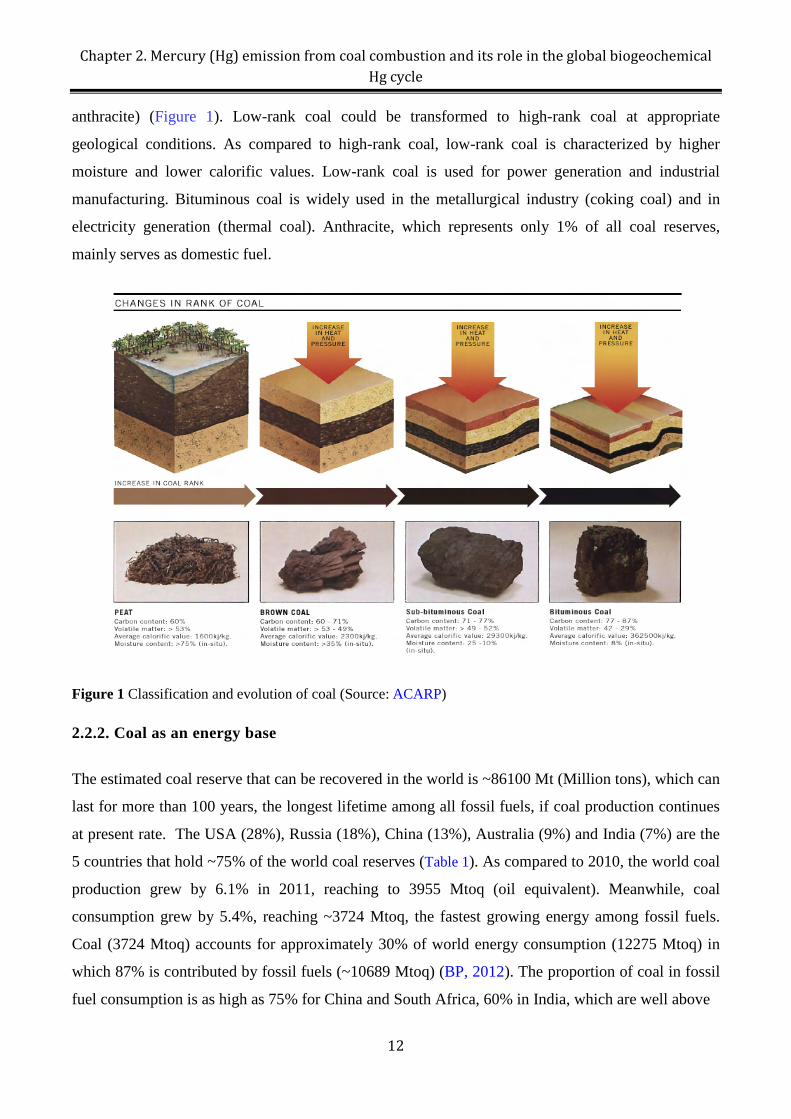
Chapter 2. Mercury (Hg) emission from coal combustion and its role in the global biogeochemical Hg cycle
anthracite) (Figure 1). Low-rank coal could be transformed to high-rank coal at appropriate
geological conditions. As compared to high-rank coal, low-rank coal is characterized by higher
moisture and lower calorific values. Low-rank coal is used for power generation and industrial
manufacturing. Bituminous coal is widely used in the metallurgical industry (coking coal) and in
electricity generation (thermal coal). Anthracite, which represents only 1% of all coal reserves,
mainly serves as domestic fuel.
Figure 1 Classification and evolution of coal (Source: ACARP)
2.2.2. Coal as an energy base
The estimated coal reserve that can be recovered in the world is ~86100 Mt (Million tons), which can
last for more than 100 years, the longest lifetime among all fossil fuels, if coal production continues
at present rate. The USA (28%), Russia (18%), China (13%), Australia (9%) and India (7%) are the
5 countries that hold ~75% of the world coal reserves (Table 1). As compared to 2010, the world coal
production grew by 6.1% in 2011, reaching to 3955 Mtoq (oil equivalent). Meanwhile, coal
consumption grew by 5.4%, reaching ~3724 Mtoq, the fastest growing energy among fossil fuels.
Coal (3724 Mtoq) accounts for approximately 30% of world energy consumption (12275 Mtoq) in
which 87% is contributed by fossil fuels (~10689 Mtoq) (BP, 2012). The proportion of coal in fossil
fuel consumption is as high as 75% for China and South Africa, 60% in India, which are well above
12
Chapter 2. Mercury (Hg) emission from coal combustion and its role in the global biogeochemical Hg cycle
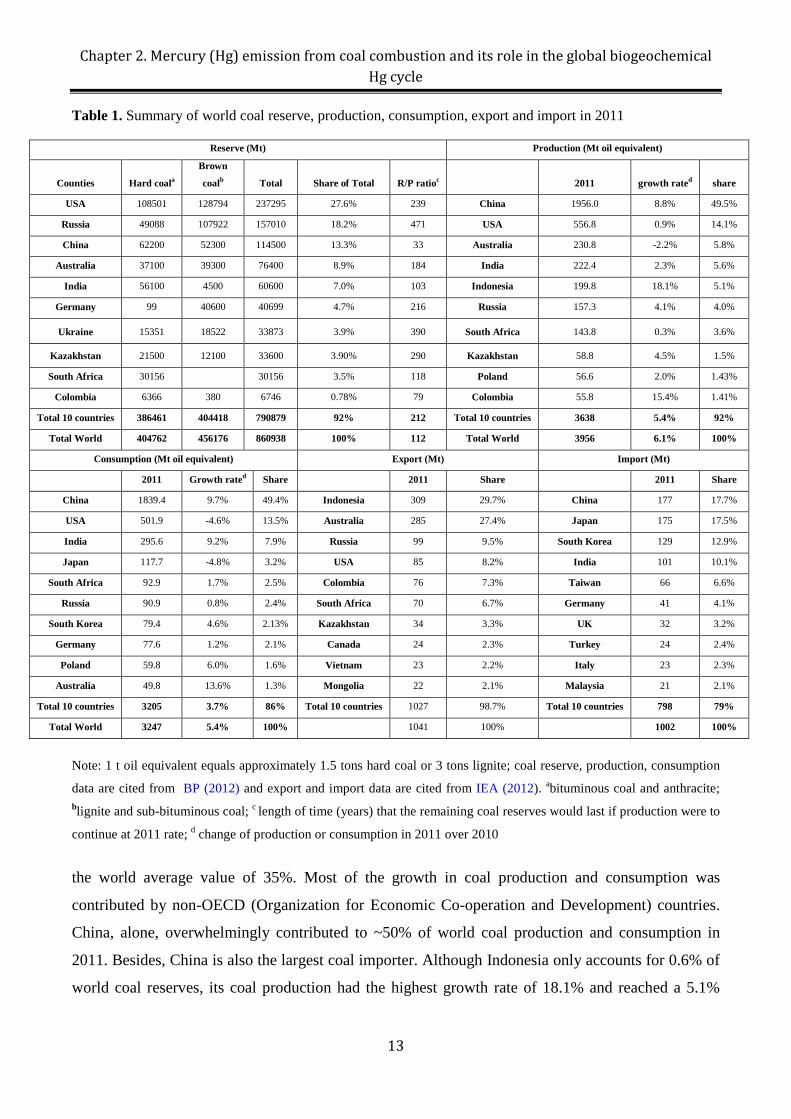
Table 1. Summary of world coal reserve, production, consumption, export and import in 2011
Reserve (Mt) Production (Mt oil equivalent)
Counties Hard coala
Brown
coalb Total Share of Total R/P ratioc
2011 growth rated share
USA 108501 128794 237295 27.6% 239 China 1956.0 8.8% 49.5%
Russia 49088 107922 157010 18.2% 471 USA 556.8 0.9% 14.1%
China 62200 52300 114500 13.3% 33 Australia 230.8 -2.2% 5.8%
Australia 37100 39300 76400 8.9% 184 India 222.4 2.3% 5.6%
India 56100 4500 60600 7.0% 103 Indonesia 199.8 18.1% 5.1%
Germany 99 40600 40699 4.7% 216 Russia 157.3 4.1% 4.0%
Ukraine 15351 18522 33873 3.9% 390 South Africa 143.8 0.3% 3.6%
Kazakhstan 21500 12100 33600 3.90% 290 Kazakhstan 58.8 4.5% 1.5%
South Africa 30156
30156 3.5% 118 Poland 56.6 2.0% 1.43%
Colombia 6366 380 6746 0.78% 79 Colombia 55.8 15.4% 1.41%
Total 10 countries 386461 404418 790879 92% 212 Total 10 countries 3638 5.4% 92%
Total World 404762 456176 860938 100% 112 Total World 3956 6.1% 100%
Consumption (Mt oil equivalent) Export (Mt) Import (Mt)
2011 Growth rated Share
2011 Share
2011 Share
China 1839.4 9.7% 49.4% Indonesia 309 29.7% China 177 17.7%
USA 501.9 -4.6% 13.5% Australia 285 27.4% Japan 175 17.5%
India 295.6 9.2% 7.9% Russia 99 9.5% South Korea 129 12.9%
Japan 117.7 -4.8% 3.2% USA 85 8.2% India 101 10.1%
South Africa 92.9 1.7% 2.5% Colombia 76 7.3% Taiwan 66 6.6%
Russia 90.9 0.8% 2.4% South Africa 70 6.7% Germany 41 4.1%
South Korea 79.4 4.6% 2.13% Kazakhstan 34 3.3% UK 32 3.2%
Germany 77.6 1.2% 2.1% Canada 24 2.3% Turkey 24 2.4%
Poland 59.8 6.0% 1.6% Vietnam 23 2.2% Italy 23 2.3%
Australia 49.8 13.6% 1.3% Mongolia 22 2.1% Malaysia 21 2.1%
Total 10 countries 3205 3.7% 86% Total 10 countries 1027 98.7% Total 10 countries 798 79%
Total World 3247 5.4% 100%
1041 100%
1002 100%
Note: 1 t oil equivalent equals approximately 1.5 tons hard coal or 3 tons lignite; coal reserve, production, consumption
data are cited from BP (2012) and export and import data are cited from IEA (2012). abituminous coal and anthracite; blignite and sub-bituminous coal; c length of time (years) that the remaining coal reserves would last if production were to
continue at 2011 rate; d change of production or consumption in 2011 over 2010
the world average value of 35%. Most of the growth in coal production and consumption was
contributed by non-OECD (Organization for Economic Co-operation and Development) countries.
China, alone, overwhelmingly contributed to ~50% of world coal production and consumption in
2011. Besides, China is also the largest coal importer. Although Indonesia only accounts for 0.6% of
world coal reserves, its coal production had the highest growth rate of 18.1% and reached a 5.1%
13
Chapter 2. Mercury (Hg) emission from coal combustion and its role in the global biogeochemical Hg cycle
share (~200 Mtoq) of world coal production (Table 1). While it only accounts for 1.2% (44 Mtoq) of
world coal consumption, most of its coal production is exported to the Asia-Pacific region (primarily
to Japan and Taiwan and lesser amounts to South Korea, the Philippines and China) (Belkin et al.,
2009). Indonesia has become the largest exporter of thermal (steam) coal and the second largest
combined thermal and metallurgical (coking) coal exporter in the world market. As Japan and South
Korean have very small coal reserves and production shares (<0.05%), most of their coal
consumption relies on imports. Coal plays an important role in worldwide energy production, 55% of
the produced coal is used in electricity plants (IEA, 2012). More than 40% of electricity in the world
is powered by coal. China, USA, India, South Africa and Australia use coal to generate 79%, 45%,
68%, 93% and 78% of their respective national electricity needs.
2.2.3. Hg geochemistry in coal
Coal is mainly composed of C, H, O, N, S that are derived primarily from vegetation. Abundant
inorganic elements can be carried into coal through overlying sediments, river inputs and geological
activities. The elements in coal can be generally grouped by their abundances (Swaine, 1990).
Elements with abundances ≥0.1% such as C, H, O, N, S, Si, Al, Fe, Ca, K, Na, Mg and Ti are
defined as major elements, whereas the remaining elements with abundances <0.1% are trace
elements.
Hg is a chalcophile element and is present at trace levels in coal. The concentration of Hg in coal is
determined by many factors such as coal rank and provenance, depositional environment, and
geological activities (e.g. igneous intrusion and groundwater infiltration) during and after coal
deposition (Dai et al., 2012). Since the second half of the 20th century, coal geochemists have
continued to investigate Hg geochemistry (e.g. concentrations, distributions, modes of occurrences
and provenances) in worldwide coals (Bouška, 1981; Swaine, 1990; Swaine and Goodarzi, 1995;
Valković, 1983). These studies conclude that Hg in coal mainly combines with S-containing
functional groups of organic matter and sulfides. Generally, Hg in coal varies from 10 to 1000 ng/g,
although extremely high coal Hg, up to several tens of µg/g, were found in geologically active areas
(Dai et al., 2012; Dai et al., 2006b; Yudovich and Ketris, 2005). The newly updated average Hg
abundance in world coals is 100 ng/g regardless of coal rank (Ketris and Yudovich, 2009), which is
lower than Chinese (163 ng/g) (Dai et al., 2012) and US coals (170 ng/g) (Finkelman, 1993). Hg is
classified as high coalphile element (i.e. how efficiently coal acted as a geochemical sink for
elements, during all of its geologic history), with a coal affinity index (dividing the average
14
Chapter 2. Mercury (Hg) emission from coal combustion and its role in the global biogeochemical Hg cycle
elemental abundance in coal on ash basis by that in sedimentary rocks) of more than 10 (Ketris and
Yudovich, 2009). The higher the coal affinity index of a given element, the higher is the contribution
of its authigenic fraction (organic matter or micro-minerals), and the lower is the contribution of its
clastogenic fraction (macro-minerals in alumino- and silicatic-forms). Therefore, authigenic minerals
(primary sulfides such as pyrite) and organic matter are the main Hg carriers in coal, and their
contributions to whole coal Hg vary according to the coal-forming environment. In some coals
extremely enriched in Hg, Hg can occur as cinnabar (HgS) and metallic Hg (Piedad-Sánchez et al.,
2004; Yudovich and Ketris, 2005). Other minerals such as marcasite (Hower et al., 2008), Au
minerals (Seredin, 2004; Seredin and Finkelman, 2008), Pb, Zn and Se minerals (galena, sphalerite,
clausthalite) (Dai et al., 2006b; Hower and Robertson, 2003), getchellite (Dai et al., 2006a), calcite
and chlorite (Zhang et al., 2004) are also detected in coal with varying Hg levels.
Low-temperature fluids such as deep-circulating meteoric waters are enriched in many kinds of
transition metals (notably chalcophile elements As, Hg, Zn and Pb), and can penetrate coal seams
along surrounding faults. As a rule of thumb, late-stage pyrite (or secondary pyrite, in cleat-, vein-,
fracture-infilling and massive bedding forms, with Hg concentrations up to 100 μg/g) derived from
mineralization of epigenetic low-temperature fluids is found to be the main Hg phase in high Hg
coals (Diehl et al., 2004; Kolker, 2012). In contrast, pyrite in the from of framboidal aggregates,
which are hollow nuclei and vesicles that formed during coal diagenesis, are commonly much less
enriched in Hg, generally less than 1 μg/g. Hg in pyrite exists in the form of solid solutions
(Finkelman, 1994). Hg containing pyrite distributed throughout the coal matrix is commonly rejected
during pulverizing processes before coal combustion in power plants. In doing so, sulfur along with
Hg in coal will be significantly reduced. In addition, coal beneficiation at coal clean plants before
coal delivery to power plants also serves to reduce Hg in coal.
2.2.4. Hg partitioning during coal combustion
The behavior of elements during coal combustion in a coal-fired utility boiler (CFUB, i.e. boiler at a
coal fired electricity plant) can be generally classified into three categories: non-volatile, semi-
volatile and volatile (Meij, 1994). Like Cl and F, Hg is classified as a volatile element. A large
portion of Hg in CFUB exists as gaseous Hg(0) and is not readily concentrated in ash fractions
(Hassett and Eylands, 1999). For the CFUBs installed with electrostatic precipitator (ESP) and wet
flue-gas desulfurization (WFGD) systems, the Hg emission can be significantly reduced (Hower et
al., 2010; Lee et al., 2006). Taking a >20 years case study in the Netherlands as an example, Hg is
15
Chapter 2. Mercury (Hg) emission from coal combustion and its role in the global biogeochemical Hg cycle
partitioned as follows: <1% in the bottom ash, 49% in the fly ash collected in the ESP, 17% in the
FGD gypsum, 9% in the sludge of the wastewater treatment plant, <1% in the effluent of the
wastewater treatment plant, <1% in fly dust (leaving the stack), and 25% as gaseous Hg in the flue
gases and emitted into the air (Meij and te Winkel, 2006; Meij et al., 2002). Thus, the total removal
efficiency of CFUB with ESP+WFGD is ca. 75%. In addition, for CFUB with additional selective
catalytic reduction (SCR for NOx reduction), the total Hg removal efficiency can reach up to 90%.
The Hg partitioning in different coal combustion residuals is primarily determined by the Hg
speciation in flue gas. Hg speciation in itself largely depends on feed coal ranks (in terms of elements
such as Cl and S that dominate the conversion of Hg(0) to Hg(II)), combustion systems conditions
(in terms of unburned carbon in fly ash) and operating condition of ESP and WFGD (in terms of
temperature, the compositions of limestone slurry etc.) (Gale et al., 2008; Niksa et al., 2001; Zhang
et al., 2012). In coal combustion flue gas, Hg exists in three operational forms: gaseous elemental
Hg(0) (GEM), gaseous oxidized Hg(II) (GOM), and particulate-bound Hg(II) (PBM). The main
physicochemical processes acting during the combustion assembly can be divided into four stages: 1)
thermal reduction of matrix Hg(II) in feed coal and vaporization of generated GEM in the boiler at
1200-1500 °C; 2) partial oxidation of GEM below 600 °C into GOM and PBM compounds, of which
PBM is quantitatively removed with fly ash in the ESPs; 3) partial dissolution of residual GOM
compounds into the limestone slurry and subsequent incorporation into WFGD products (mainly
gypsum) and 4) the emission of remaining gaseous Hg (primarily GEM and GOM) contained in flue
gas into the atmosphere.
2.2.5. Atmospheric Hg emissions from coal combustion
The combustion of fossil fuels (primarily coal) in stationary combustion facilities such as utility,
industrial and residential boilers is the single largest anthropogenic Hg emission source globally.
According to estimations of Pacyna and co-workers, coal atmospheric Hg emissions account for 60%
of total anthropogenic Hg in 1990 (1295 out of 2140 t) (Pacyna and Pacyna, 1996), 77% in 1995
(1475 out of 1910 t) (Pacyna and Pacyna, 2002) , and then 65% in 2000 (1422 out of 2190 t) (Pacyna
et al., 2006) and 45% in 2005 (880 out of 1930 t) (Pacyna et al., 2010). The decreased trend of Hg
emissions from fossil fuels relates to the expansion of air pollution control devices (ESP, FGD)
which largely countered increasing Hg emissions due to the increasing coal consumption. As
compared to other anthropogenic Hg sources, the Hg emission inventory from stationary fuel
combustion is the most accurate with the lowest uncertainty of ±25%. Globally, China, India and the
16
Chapter 2. Mercury (Hg) emission from coal combustion and its role in the global biogeochemical Hg cycle
USA have the largest Hg emission inventories from stationary fuel combustion besides other
anthropogenic sources (Pacyna et al., 2010). On average, the major chemical forms of Hg species in
coal combustion emissions are GEM (50%), followed by GOM (40%) and then PBM (10%). As coal
Hg emissions dominate global Hg emissions, the same speciation is estimated for global
anthropogenic Hg emissions (53%, 47% and 10%, respectively, for GEM, GOM and PBM, Pacyna
et al., 2010).
Nowadays, nearly half of the Hg emissions from anthropogenic sources in China (600-800 t/yr)
derive from coal combustion (Pacyna et al., 2010; Pirrone et al., 2010; Streets et al., 2005; Wu et al.,
2006). Hg emissions from coal combustion were stable at 200-210 t during 1995-2001, but increased
to 257 t in 2003 and 334 t in 2005, with an annual average growth rate of 5.1 % per year during a
decade (1995-2005) (Wang et al., 2000; Wu et al., 2006). Correspondingly, coal consumption for
coal-fired power plants was 446 Mt in 1995 (31% of total coal consumption of 1460 Mt) and
doubled to 1050 Mt in 2005 (40% of total coal consumption of 2650 Mt), with an annual average
growth rate of ~9%. Among various coal combustion facilities, Hg emissions from coal-fired power
plants had the largest annual growth rate of 7% that increased from 63 Mt in 1995 to 125 Mt in 2005
(Streets et al., 2009). The recent 2008 estimation of power plant Hg emissions, using a chlorine-
based probabilistic model, was 102.5 t (P50) within a confidence interval of 71.7 (P10) -183 t (P90)
(Zhang et al., 2012). Different scenarios have been proposed for estimating the future power plant
Hg emissions which will largely depend on the amount of fuel (mainly coal) consumption and the
implementation and effectiveness of air pollution control devices.
2.3. Global Hg emissions and biogeochemical cycling
Hg emissions include contributions from natural and anthropogenic sources. Geological Hg
emissions derived from volcanic and hydrothermal activity and Hg-enriched crusts are the primary
natural sources, estimated to be between 90 and 700 t/yr (Bagnato et al., 2011; Nriagu and Becker,
2003; Pyle and Mather, 2003; Varekamp and Buseck, 1986). For millennia, especially after the
industrial revolution (1850 AD), human activities such as mining and fossil fuel combustion greatly
augmented Hg emissions to the atmosphere. At present, anthropogenic Hg emissions far surpass
natural Hg emissions. Earlier estimations of present-day primary anthropogenic Hg emissions vary
between 1900 and 4000 t/yr (Lamborg et al., 2002; Mason et al., 1994; Mason and Sheu, 2002;
Pacyna et al., 2010; Pirrone et al., 2010; Sunderland and Mason, 2007). Recent estimation of
anthropogenic Hg emissions converge to 1930-2320 t/yr (Pacyna et al., 2010; Pirrone et al., 2010;
17
Chapter 2. Mercury (Hg) emission from coal combustion and its role in the global biogeochemical Hg cycle
Streets et al., 2011). Besides Hg emissions from coal combustion, other dominant sources include
artisanal small-scale gold mining, non-ferrous metals manufacturing, cement production, waste
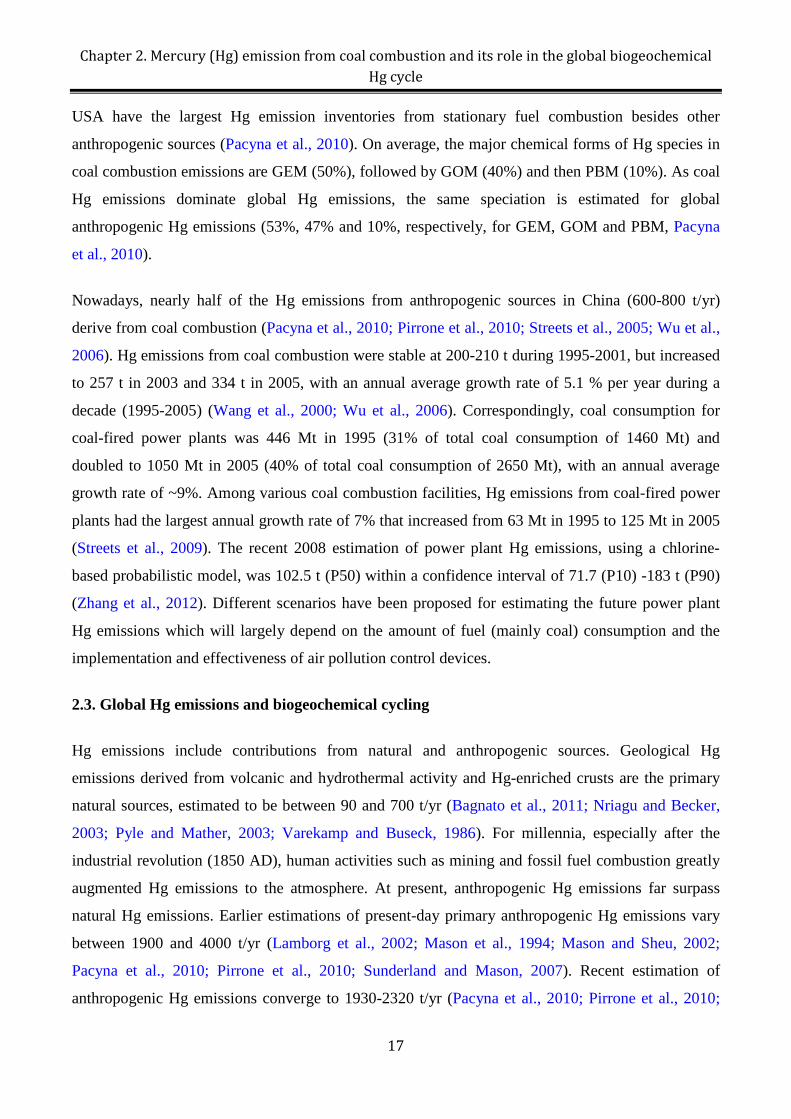
disposal and caustic soda production (Figure 2A). Geographically, anthropogenic Hg emissions in
Europe and North America decreased significantly since the 1990s, accounting for <25% of total
anthropogenic Hg emissions, whereas anthropogenic Hg emissions in Asia have increased
substantially to 50-70% (Figure 2B), particularly in China and India.
Following atmospheric deposition of primary natural and anthropogenic Hg to land and ocean
surfaces, a portion of Hg termed secondary natural and anthropogenic Hg or ‘legacy Hg’, can be re-
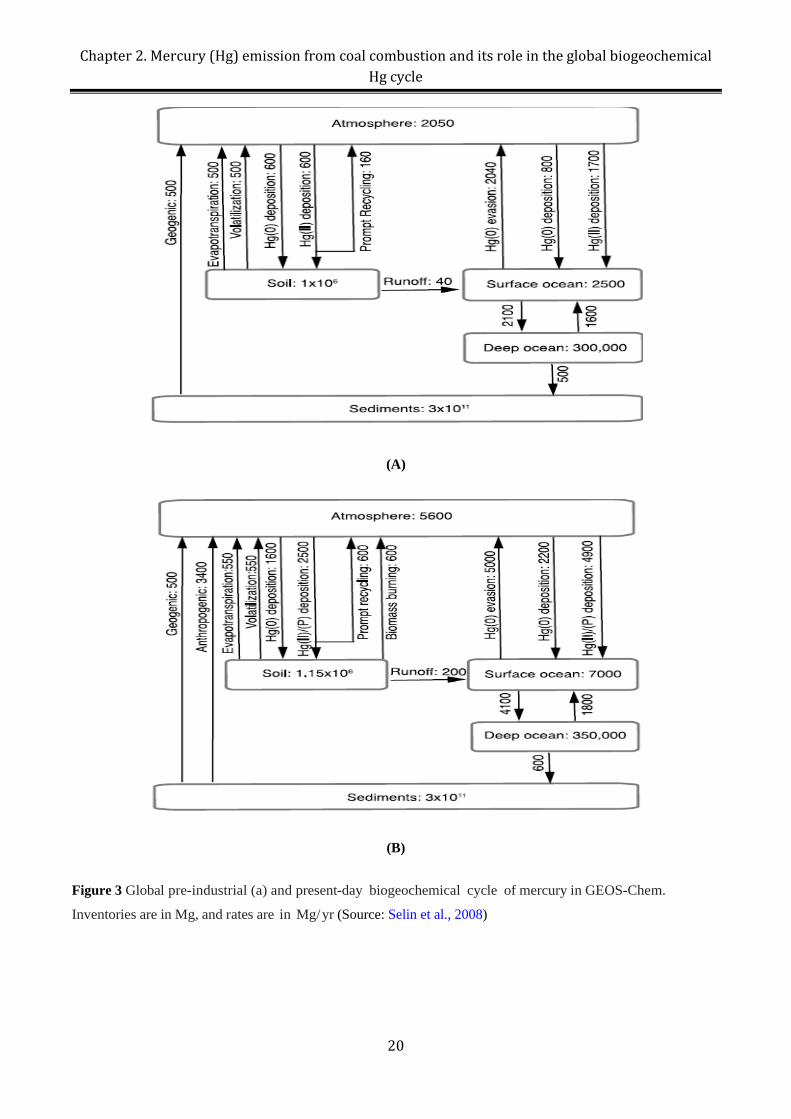
emitted back into the atmosphere (Figure 3). Secondary Hg sources derive from re-emission of
newly and historically deposited Hg on vegetation, land and water surfaces. A well-known Canadian
enriched Hg isotope field experiment (METAALICUS) (Hintelmann et al., 2002) has shown that the
newly deposited atmospheric Hg (II) to terrestrial surfaces is more available for Hg re-emission
(termed as prompt recycling) on a timescale of days to months than the historical Hg stored in soil
and vegetation on a timescale of centuries to millennia. It is estimated that prompt cycling Hg
accounts for 5-60% of atmospherically deposited Hg. Selin et al. (2008) estimated a value of 600 t/yr
for prompt recycling Hg. Hg incorporated into soils can be reduced to Hg(0) vapor by a series of
abiotic and biotic processes and re-emitted into the atmosphere. Evapotranspiration and volatilization
are the main processes to mobilize Hg in soil water and solid soil pools, which emit comparable Hg
fluxes of ~550 t/yr. Large re-emissions of Hg, with a flux of ~5000 t/yr, occur from the oceans
through Hg(0) evasion (Selin et al., 2008). By incorporating 4000 years of historic Hg emissions, a
recent model study suggests that the contribution of re-emitted legacy Hg is much larger than thus far
appreciated (Amos et al., 2013). The estimated legacy Hg contribution to modern atmospheric Hg
deposition is as large as 60%, and the accumulated legacy Hg in the surface ocean contributed by
North American and European (31%) outweighs Asian contributions (18%).
Atmospheric Hg deposition to land and surface oceans will eventually be buried in deep ocean
sediments at a time-scale of centuries to millennia. By parameterizing Hg inventory and Hg transfer
rates, various global 3-D land-ocean-atmosphere Hg models have been developed to simulate the
biogeochemical cycling of Hg (Figure 3) (Seigneur et al., 2001; Selin, 2009; Selin et al., 2008;
Streets et al., 2011). These models fit well to the general observations on the distribution of Hg
species on the earth, and are able to predict the response of atmosphere-ocean-terrestrial systems to
future Hg emission fluctuations.
18
Chapter 2. Mercury (Hg) emission from coal combustion and its role in the global biogeochemical Hg cycle
Figure 2 Trends in Hg emissions by (a) source types and (b) world regions (Source: Streets et al., 2011)
19
Chapter 2. Mercury (Hg) emission from coal combustion and its role in the global biogeochemical Hg cycle
(A)
(B)
Figure 3 Global pre-industrial (a) and present-day biogeochemical cycle of mercury in GEOS-Chem.
Inventories are in Mg, and rates are in Mg/yr (Source: Selin et al., 2008)
20
Chapter 2. Mercury (Hg) emission from coal combustion and its role in the global biogeochemical Hg cycle
References
ACARP, Underground Coal Australian Coal Association Research Program. accessed by
http://www.acarp.com.au/index.aspx.
Amos, H.M., Jacob, D.J., Streets, D.G., Sunderland, E.M., 2013. Legacy impacts of all-time anthropogenic
emissions on the global mercury cycle. Global Biogeochem. Cycles 27, 410-421.
Bagnato, E., Aiuppa, A., Parello, F., Allard, P., Shinohara, H., Liuzzo, M., Giudice, G., 2011. New clues on
the contribution of Earth’s volcanism to the global mercury cycle. Bulletin of Volcanology 73, 497-
510.
Belkin, H.E., Tewalt, S.J., Hower, J.C., Stucker, J.D., O'Keefe, J.M.K., 2009. Geochemistry and petrology of
selected coal samples from Sumatra, Kalimantan, Sulawesi, and Papua, Indonesia. International
Journal of Coal Geology 77, 260-268.
Bouška, V., 1981. Geochemistry of coal. Elsevier Scientific Pub. Co.
BP, 2012. BP (Petroleum British) Statistical Review of World Energy (2011).
Dai, S., Ren, D., Chou, C.-L., Finkelman, R.B., Seredin, V.V., Zhou, Y., 2012. Geochemistry of trace
elements in Chinese coals: A review of abundances, genetic types, impacts on human health, and
industrial utilization. International Journal of Coal Geology 94, 3-21.
Dai, S., Ren, D., Chou, C.-L., Li, S., Jiang, Y., 2006a. Mineralogy and geochemistry of the No. 6 Coal
(Pennsylvanian) in the Junger Coalfield, Ordos Basin, China. International Journal of Coal Geology
66, 253-270.
Dai, S., Zeng, R., Sun, Y., 2006b. Enrichment of arsenic, antimony, mercury, and thallium in a Late Permian
anthracite from Xingren, Guizhou, Southwest China. International Journal of Coal Geology 66, 217-
226.
Daniels, J., Longnecker, M., Rowland, A., Golding, J., 2004. Fish intake during pregnancy and early cognitive
development of offspring. Epidemiology 15, 394-402.
Davidson, P.W., Myers, G.J., Weiss, B., 2004. Mercury Exposure and Child Development Outcomes.
Pediatrics 113, 1023-1029.
Diehl, S.F., Goldhaber, M.B., Hatch, J.R., 2004. Modes of occurrence of mercury and other trace elements in
coals from the warrior field, Black Warrior Basin, Northwestern Alabama. International Journal of
Coal Geology 59, 193-208.
Egeland, G.M., Middaugh, J.P., 1997. Balancing Fish Consumption Benefits with Mercury Exposure. Science
278, 1904-1905.
Finkelman, R.B., 1993. Trace and minor elements in coal in: M.H. Engel, S.M. (Ed.), Org. Geochem. Plenum,
New York, pp. 593-607.
Finkelman, R.B., 1994. Modes of occurrence of potentially hazardous elements in coal: levels of confidence.
Fuel Processing Technology 39, 21-34.
21
Chapter 2. Mercury (Hg) emission from coal combustion and its role in the global biogeochemical Hg cycle
Gale, T.K., Lani, B.W., Offen, G.R., 2008. Mechanisms governing the fate of mercury in coal-fired power
systems. Fuel Processing Technology 89, 139-151.
Harada, M., 1995. Minamata Disease: Methylmercury Poisoning in Japan Caused by Environmental Pollution.
Critical Reviews of Toxicology 25, 1-24.
Hassett, D.J., Eylands, K.E., 1999. Mercury capture on coal combustion fly ash. Fuel 78, 243-248.
Hintelmann, H., Harris, R., Heyes, A., Hurley, J.P., Kelly, C.A., Krabbenhoft, D.P., Lindberg, S., Rudd,
J.W.M., Scott, K.J., St.Louis, V.L., 2002. Reactivity and Mobility of New and Old Mercury
Deposition in a Boreal Forest Ecosystem during the First Year of the METAALICUS Study.
Environmental Science & Technology 36, 5034-5040.
Holmes, C.D., Jacob, D.J., Corbitt, E.S., Mao, J., Yang, X., Talbot, R., Slemr, F., 2010. Global atmospheric
model for mercury including oxidation by bromine atoms. Atmos. Chem. Phys 10, 12037-12057.
Hower, J.C., Campbell, J.L., Teesdale, W.J., Nejedly, Z., Robertson, J.D., 2008. Scanning proton microprobe
analysis of mercury and other trace elements in Fe-sulfides from a Kentucky coal. International
Journal of Coal Geology 75, 88-92.
Hower, J.C., Robertson, J.D., 2003. Clausthalite in coal. International Journal of Coal Geology 53, 219-225.
Hower, J.C., Senior, C.L., Suuberg, E.M., Hurt, R.H., Wilcox, J.L., Olson, E.S., 2010. Mercury capture by
native fly ash carbons in coal-fired power plants. Progress Energy Combustion Science 36, 510-529.
Hsu-Kim, H., Kucharzyk, K.H., Zhang, T., Deshusses, M.A., 2013. Mechanisms Regulating Mercury
Bioavailability for Methylating Microorganisms in the Aquatic Environment: A Critical Review.
Environmental Science & Technology 47, 2441-2456.
IEA, 2012. Key World Energy Statistics 2012.
Ketris, M.P., Yudovich, Y.E., 2009. Estimations of Clarkes for Carbonaceous biolithes: World averages for
trace element contents in black shales and coals. International Journal of Coal Geology 78, 135-148.
Kolker, A., 2012. Minor element distribution in iron disulfides in coal: A geochemical review. International
Journal of Coal Geology 94, 32-43.
Lamborg, C.H., Fitzgerald, W.F., Damman, A.W.H., Benoit, J.M., Balcom, P.H., Engstrom, D.R., 2002.
Modern and historic atmospheric mercury fluxes in both hemispheres: Global and regional mercury
cycling implications. Global Biogeochemical Cycles 16, 1104.
Lee, S.J., Seo, Y.-C., Jang, H.-N., Park, K.-S., Baek, J.-I., An, H.-S., Song, K.-C., 2006. Speciation and mass
distribution of mercury in a bituminous coal-fired power plant. Atmospheric Environment 40, 2215-
2224.
Mason, R.P., Fitzgerald, W.F., Morel, F.M.M., 1994. The biogeochemical cycling of elemental mercury:
Anthropogenic influences. Geochimica et Cosmochimica Acta 58, 3191-3198.
Mason, R.P., Sheu, G.R., 2002. Role of the ocean in the global mercury cycle. Global Biogeochemical Cycles
16, 1093.
22
Chapter 2. Mercury (Hg) emission from coal combustion and its role in the global biogeochemical Hg cycle
McAlpine, D., Araki, S., 1958. Minamata disease an unusual neurological disorder caused by contaminated
fish. The Lancet 272, 629-631.
Meij, R., 1994. Trace element behavior in coal-fired power plants. Fuel Processing Technology 39, 199-217.
Meij, R., te Winkel, H., 2006. Mercury emissions from coal-fired power stations: The current state of the art
in the Netherlands. Science of Total Environment 368, 393-396.
Meij, R., Vredenbregt, L.H.J., Winkel, H.T., 2002. The fate and behavior of mercury in coal-fired power
plants. Journal of Air & Waste Management Association 52, 185.
Niksa, S., Helble, J.J., Fujiwara, N., 2001. Kinetic Modeling of Homogeneous Mercury Oxidation: The
Importance of NO and H2O in Predicting Oxidation in Coal-Derived Systems. Environmental Science
& Technology 35, 3701-3706.
NRC/NAS, 2000. Toxicological Effects of Methylmercury. National Research Council/National Academy of
Sciences. Washington, DC.
Nriagu, J., Becker, C., 2003. Volcanic emissions of mercury to the atmosphere: global and regional
inventories. Science of Total Environment 304, 3-12.
Pacyna, E.G., Pacyna, J.M., 2002. Global Emission of Mercury from Anthropogenic Sources in 1995. Water,
Air, & Soil Pollution 137, 149-165.
Pacyna, E.G., Pacyna, J.M., Steenhuisen, F., Wilson, S., 2006. Global anthropogenic mercury emission
inventory for 2000. Atmospheric Environment 40, 4048-4063.
Pacyna, E.G., Pacyna, J.M., Sundseth, K., Munthe, J., Kindbom, K., Wilson, S., Steenhuisen, F., Maxson, P.,
2010. Global emission of mercury to the atmosphere from anthropogenic sources in 2005 and
projections to 2020. Atmospheric Environment 44, 2487-2499.
Pacyna, J.M., Pacyna, E.P., 1996. Global emissions of mercury to the atmosphere. Emissions
from anthropogenic sources, A Report for the Arctic Monitoring and Assessment Programme
(AMAP), Oslo, Norway.
Piedad-Sánchez, N., Izart, A., Martı́nez, L., Suárez-Ruiz, I., Elie, M., Menetrier, C., 2004. Paleothermicity in
the Central Asturian Coal Basin, North Spain. International Journal of Coal Geology 58, 205-229.
Pirrone, N., Cinnirella, S., Feng, X., Finkelman, R.B., Friedli, H.R., Leaner, J., Mason, R., Mukherjee, A.B.,
Stracher, G.B., Streets, D.G., Telmer, K., 2010. Global mercury emissions to the atmosphere from
anthropogenic and natural sources. Atmospheric Chemistry and Physics 10, 5951-5964.
Pyle, D.M., Mather, T.A., 2003. The importance of volcanic emissions for the global atmospheric mercury
cycle. Atmospheric Environment 37, 5115-5124.
Seigneur, C., Karamchandani, P., Lohman, K., Vijayaraghavan, K., Shia, R.-L., 2001. Multiscale modeling of
the atmospheric fate and transport of mercury. Journal of Geophysical Research 106, 27795-27809.
Selin, N.E., 2009. Global Biogeochemical Cycling of Mercury: A Review. Annual Review of Environment
and Resources 34, 43-63.
23
Chapter 2. Mercury (Hg) emission from coal combustion and its role in the global biogeochemical Hg cycle
Selin, N.E., Jacob, D.J., Yantosca, R.M., Strode, S., Jaeglé, L., Sunderland, E.M., 2008. Global 3-D land-
ocean-atmosphere model for mercury: Present-day versus preindustrial cycles and anthropogenic
enrichment factors for deposition. Global Biogeochemical Cycles 22, GB2011.
Seredin, V.V., 2004. The Au-PGE mineralization at the Pavlovsk brown coal deposit, Primorye. Geology of
Ore Deposits 46, 36-63.
Seredin, V.V., Finkelman, R.B., 2008. Metalliferous coals: A review of the main genetic and geochemical
types. International Journal of Coal Geology 76, 253-289.
Streets, D.G., Devane, M.K., Lu, Z., Bond, T.C., Sunderland, E.M., Jacob, D.J., 2011. All-Time Releases of
Mercury to the Atmosphere from Human Activities. Environmental Science & Technology 45, 10485-
10491.
Streets, D.G., Hao, J., Wang, S., Wu, Y., 2009. Mercury emissions from coal combustion in China, in: Mason,
R., Pirrone, N. (Eds.), Mercury Fate and Transport in the Global Atmosphere. Springer US, pp. 51-65.
Streets, D.G., Hao, J., Wu, Y., Jiang, J., Chan, M., Tian, H., Feng, X., 2005. Anthropogenic mercury
emissions in China. Atmospheric Environment 39, 7789-7806.
Sunderland, E.M., 2007. Mercury Exposure from Domestic and Imported Estuarine and Marine Fish in the
U.S. Seafood Market. Environmental Health Perspectives 115, 235-242.
Sunderland, E.M., Mason, R.P., 2007. Human impacts on open ocean mercury concentrations. Global
Biogeochemical Cycles 21, GB4022.
Swaine, D.J., 1990. Trace elements in coal. Butterworth.
Swaine, D.J., Goodarzi, F., 1995. Environmental Aspects of Trace Elements in Coal. Kluwer Academic
Publishers, Dordrecht.
Valković, V., 1983. Trace elements in coal. CRC Press.
Varekamp, J.C., Buseck, P.R., 1986. Global mercury flux from volcanic and geothermal sources. Applid
Geochemistry 1, 65-73.
Wang, Q., Shen, W., Ma, Z., 2000. Estimation of Mercury Emission from Coal Combustion in China.
Environmental Science & Technology 34, 2711-2713.
Wu, Y., Wang, S., Streets, D.G., Hao, J., Chan, M., Jiang, J., 2006. Trends in Anthropogenic Mercury
Emissions in China from 1995 to 2003. Environmental Science & Technology 40, 5312-5318.
Yudovich, Y.E., Ketris, M.P., 2005. Mercury in coal: a review: Part 1. Geochemistry. International Journal of
Coal Geology 62, 107-134.
Zhang, H., 2006. Photochemical Redox Reactions of Mercury, in: Atwood, D. (Ed.), Recent Developments in
Mercury Science. Springer Berlin / Heidelberg, pp. 37-79.
Zhang, J., Ren, D., Zhu, Y., Chou, C.-L., Zeng, R., Zheng, B., 2004. Mineral matter and potentially hazardous
trace elements in coals from Qianxi Fault Depression Area in southwestern Guizhou, China.
International Journal of Coal Geology 57, 49-61.
24

Chapter 2. Mercury (Hg) emission from coal combustion and its role in the global biogeochemical Hg cycle
Zhang, L., Wang, S., Meng, Y., Hao, J., 2012. Influence of Mercury and Chlorine Content of Coal on Mercury
Emissions from Coal-Fired Power Plants in China. Environmental Science & Technology 46, 6385-
6392.
25
Chapter 3. Theory of Hg isotope fractionation
Chapter 3 Theory of Hg isotope fractionation
26
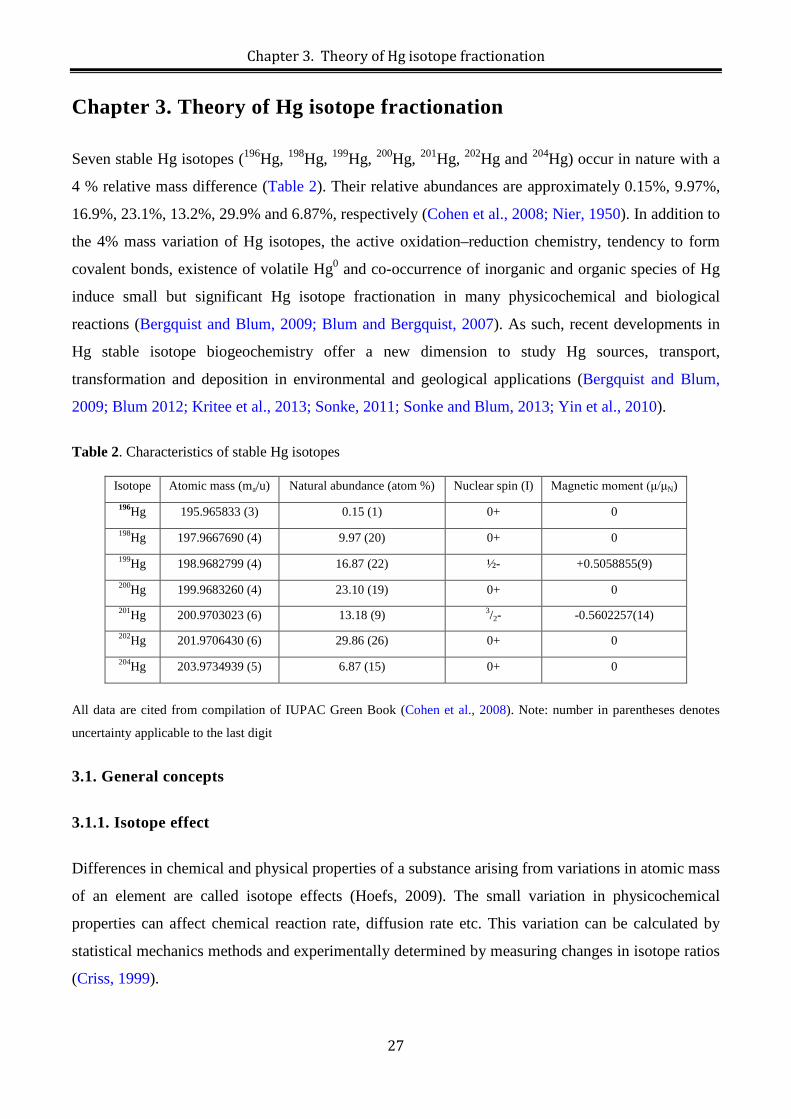
Chapter 3. Theory of Hg isotope fractionation
Chapter 3. Theory of Hg isotope fractionation
Seven stable Hg isotopes (196Hg, 198Hg, 199Hg, 200Hg, 201Hg, 202Hg and 204Hg) occur in nature with a
4 % relative mass difference (Table 2). Their relative abundances are approximately 0.15%, 9.97%,
16.9%, 23.1%, 13.2%, 29.9% and 6.87%, respectively (Cohen et al., 2008; Nier, 1950). In addition to
the 4% mass variation of Hg isotopes, the active oxidation–reduction chemistry, tendency to form
covalent bonds, existence of volatile Hg0 and co-occurrence of inorganic and organic species of Hg
induce small but significant Hg isotope fractionation in many physicochemical and biological
reactions (Bergquist and Blum, 2009; Blum and Bergquist, 2007). As such, recent developments in
Hg stable isotope biogeochemistry offer a new dimension to study Hg sources, transport,
transformation and deposition in environmental and geological applications (Bergquist and Blum,
2009; Blum 2012; Kritee et al., 2013; Sonke, 2011; Sonke and Blum, 2013; Yin et al., 2010).
Table 2. Characteristics of stable Hg isotopes
Isotope Atomic mass (ma/u) Natural abundance (atom %) Nuclear spin (I) Magnetic moment (μ/μN) 196Hg 195.965833 (3) 0.15 (1) 0+ 0 198Hg 197.9667690 (4) 9.97 (20) 0+ 0 199Hg 198.9682799 (4) 16.87 (22) ½- +0.5058855(9) 200Hg 199.9683260 (4) 23.10 (19) 0+ 0 201Hg 200.9703023 (6) 13.18 (9) 3/2- -0.5602257(14) 202Hg 201.9706430 (6) 29.86 (26) 0+ 0 204Hg 203.9734939 (5) 6.87 (15) 0+ 0
All data are cited from compilation of IUPAC Green Book (Cohen et al., 2008). Note: number in parentheses denotes
uncertainty applicable to the last digit
3.1. General concepts
3.1.1. Isotope effect
Differences in chemical and physical properties of a substance arising from variations in atomic mass
of an element are called isotope effects (Hoefs, 2009). The small variation in physicochemical
properties can affect chemical reaction rate, diffusion rate etc. This variation can be calculated by
statistical mechanics methods and experimentally determined by measuring changes in isotope ratios
(Criss, 1999).
27
Chapter 3. Theory of Hg isotope fractionation
3.1.2. Isotope fractionation factor
The isotope fractionation factor is defined as the ratio of the abundances of two isotopes in substance
A divided by the corresponding ratio in substance B. For Hg isotopes, the fractionation factor is
expressed as:
A
xxx/198 xxx 198xxx/198 A
A-B xxx/198 xxx 198B B
H ( Hg / Hg)Hg ( Hg / Hg)
R gR
α = = [1]
where XXX is a Hg isotope mass other than the reference isotope 198Hg.
3.1.3. Delta value (δ) and conversion
The measured isotope ratios of samples are commonly anchored to a common reference standard
(e.g. NIST SRM 3133 for Hg isotopes) to facilitate data inter-comparison. Relative isotope ratio
differences from the NIST 3133 standard on the per mil (‰) scale are defined by the delta (δ)
notation as follows (Blum and Bergquist, 2007):
( )( )
XXX 198xxx/198Sample SampleXXX
xxx/198 XXX 198NIST 3133 NIST 3133
Hg HgR Hgδ Hg ( ) 1 1000 1 1000
R Hg Hg Hg− ×
= = − ׉ [2]
For two substances, A and B, whose δ values are expressed as:
xxx/198xxx 3A
A xxx/198standard
HgHg ( 1) 10Hg
RR
δ = − × [3]
/1983B
B /198standard
HgHg ( 1) 10Hg
xxxxxx
xxx
RR
δ = − × [4]
Their δ values and fractionation factor α between A and B can be related by:
/198 3/198 A A
A-B /198 3B A
R Hg 10 Hg 1HgR Hg 10 Hg 1
xxx xxxxxx
xxx xxx
−
−
δ +α = =
δ + [5]
which can be approximated, for small δ values (<10‰), to another form by taking the logarithm on
both sides:
28
Chapter 3. Theory of Hg isotope fractionation
/198 3A B A Bln Hg 10 ( Hg Hg ) xxx xxx xxx−−α × δ − δ [6]
As most of fractionation factors α approach unity, another useful simplification can be obtained:
/198 /198A B A Bln Hg Hg 1xxx xxx− −α α − [7]
Although not recommended by IPUAC (Coplen, 2011), in some publications, the epsilon notation (Ɛ)
is used to represent fractionation factors on the ‰ scale:
/198 /198A-B A-BHg 1000 ( Hg 1)xxx xxx= × −ε α [8]
The following equations are used to convert δ value using 202Hg as reference isotope into δ value
using 198Hg as reference isotope:
xxx/202 xxx/198 202/198Hg Hg Hgδ δ − δ [9]
/202 /198Hg Hgxxx xxx∆ ∆ [10]
The capital Delta notation (Δ) for MIF is explained in Section 3.3.2
3.2. Literature review on Hg isotopes fractionation
Mercury isotope fractionation was observed in laboratory-controlled experiments as early as one
century ago. By evaporating liquid Hg onto a cooled surface positioned at low pressure conditions,
Bronsted and von Hevesy (1920) precisely measured the density of residual and condensed Hg
relative to original liquid Hg using a pycnometry (density) method with <1 ppm uncertainty. In the
first set of experiments with ~14% Hg evasion, they found a density depletion by a factor of
0.999980 in the condensed vapor phase. In the second experiment with ~75% Hg evasion, a density
depletion of 0.999990 (density in residual liquid was 1.000031) was observed. This indicates that
lighter Hg isotopes with a higher evaporation rate escape faster than heavier ones and the degree to
which evaporation fractionates Hg isotopes could be quantified. Shortly afterwards, more detail
evaporation and condensation experiments were performed (Brönsted and von Hevesy, 1921;
Mulliken and Harkins, 1922), in which one order of magnitude larger density fractionation was
observed. Although several studies tried to measure Hg isotope compositions of natural systems in
the following eight decades (Haeffner, 1953; Jackson, 2001; Koval et al., 1977; Kuznetsov and
Obolenskii, 1980; Obolenskii and Doilnitsyn, 1976), their data are either questionable or subjected to
29
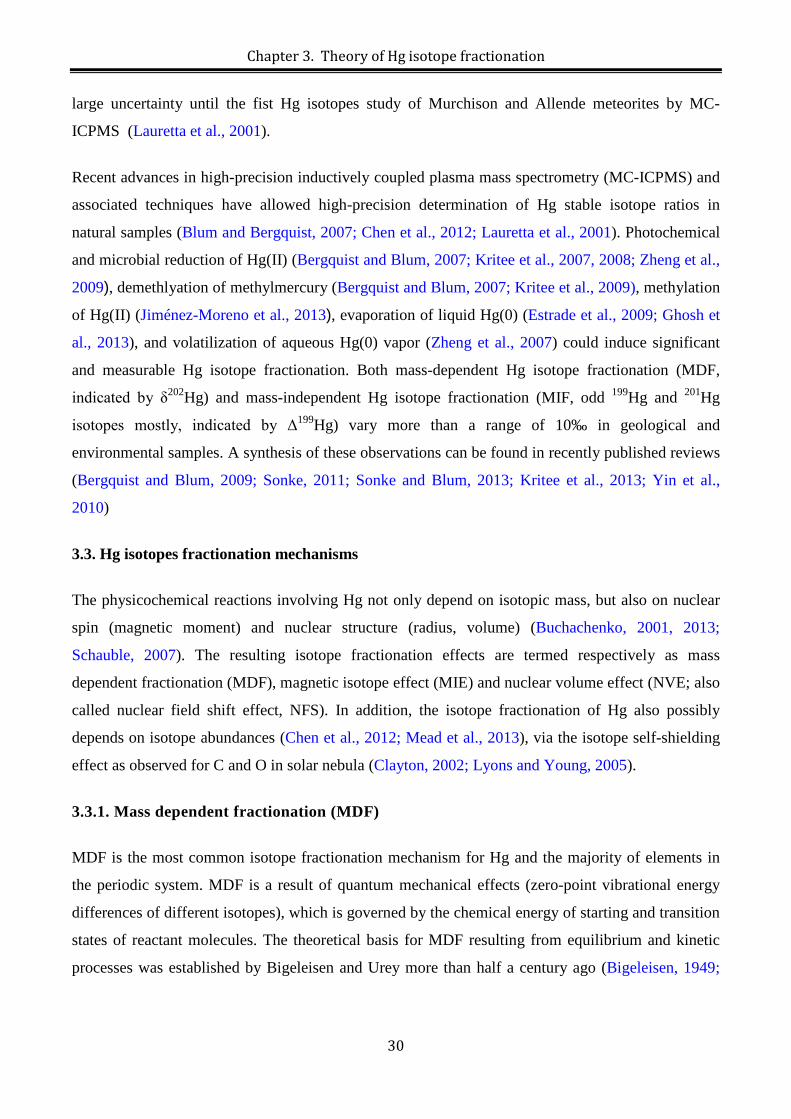
Chapter 3. Theory of Hg isotope fractionation
large uncertainty until the fist Hg isotopes study of Murchison and Allende meteorites by MC-
ICPMS (Lauretta et al., 2001).
Recent advances in high-precision inductively coupled plasma mass spectrometry (MC-ICPMS) and
associated techniques have allowed high-precision determination of Hg stable isotope ratios in
natural samples (Blum and Bergquist, 2007; Chen et al., 2012; Lauretta et al., 2001). Photochemical
and microbial reduction of Hg(II) (Bergquist and Blum, 2007; Kritee et al., 2007, 2008; Zheng et al.,
2009), demethlyation of methylmercury (Bergquist and Blum, 2007; Kritee et al., 2009), methylation
of Hg(II) (Jiménez-Moreno et al., 2013), evaporation of liquid Hg(0) (Estrade et al., 2009; Ghosh et
al., 2013), and volatilization of aqueous Hg(0) vapor (Zheng et al., 2007) could induce significant
and measurable Hg isotope fractionation. Both mass-dependent Hg isotope fractionation (MDF,
indicated by δ202Hg) and mass-independent Hg isotope fractionation (MIF, odd 199Hg and 201Hg
isotopes mostly, indicated by Δ199Hg) vary more than a range of 10‰ in geological and
environmental samples. A synthesis of these observations can be found in recently published reviews
(Bergquist and Blum, 2009; Sonke, 2011; Sonke and Blum, 2013; Kritee et al., 2013; Yin et al.,
2010)
3.3. Hg isotopes fractionation mechanisms
The physicochemical reactions involving Hg not only depend on isotopic mass, but also on nuclear
spin (magnetic moment) and nuclear structure (radius, volume) (Buchachenko, 2001, 2013;
Schauble, 2007). The resulting isotope fractionation effects are termed respectively as mass
dependent fractionation (MDF), magnetic isotope effect (MIE) and nuclear volume effect (NVE; also
called nuclear field shift effect, NFS). In addition, the isotope fractionation of Hg also possibly
depends on isotope abundances (Chen et al., 2012; Mead et al., 2013), via the isotope self-shielding
effect as observed for C and O in solar nebula (Clayton, 2002; Lyons and Young, 2005).
3.3.1. Mass dependent fractionation (MDF)
MDF is the most common isotope fractionation mechanism for Hg and the majority of elements in
the periodic system. MDF is a result of quantum mechanical effects (zero-point vibrational energy
differences of different isotopes), which is governed by the chemical energy of starting and transition
states of reactant molecules. The theoretical basis for MDF resulting from equilibrium and kinetic
processes was established by Bigeleisen and Urey more than half a century ago (Bigeleisen, 1949;
30
Chapter 3. Theory of Hg isotope fractionation
Bigeleisen and Mayer, 1947; Urey, 1947). MDF factors for different Hg isotope ratios can be
described by:
xxx/198 202/198A B A BHg ( g )H β− −= αα [11]
Where the exponent β varies depending upon the process. For equilibrium isotope exchange:
xxx 198
202 198
1 1m Hg m Hg
mg H1 1
m H g
−
β =
−
[12]
For kinetic fractionation:
xxx
198
202
198
m Hglnm Hgm Hglnm Hg
β = [13]
Eq. 11 can be rewritten in δ’ form:
'xxx/198 '202/198Hg Hgδ = β×δ [14]
where δ’ and δ are related by:
xxx/198
xxx/198
xxx/198sample
xxx/198NIST3133
xxx/198sample
xxx/198NIST3133
R Hg' Hg ln 1000
R Hg
R Hg1 1000 Hg
R Hg
δ = ×
− × = δ
[15]
Eq. 14 allows the construction of three-isotope plots with a reference MDF line (Figure 4). This
curve is very important to identify the underlying MDF or MIF fractionation mechanism (Sonke,
2011; Young et al., 2002). For MDF, the data set will be plotted against the reference MDF line with
slopes varying as a function of δxxxHg. Significant departures (>0.1 ‰) from a reference MDF line
imply a potential MIF.
3.3.2. Mass independent fractionation (MIF)
31
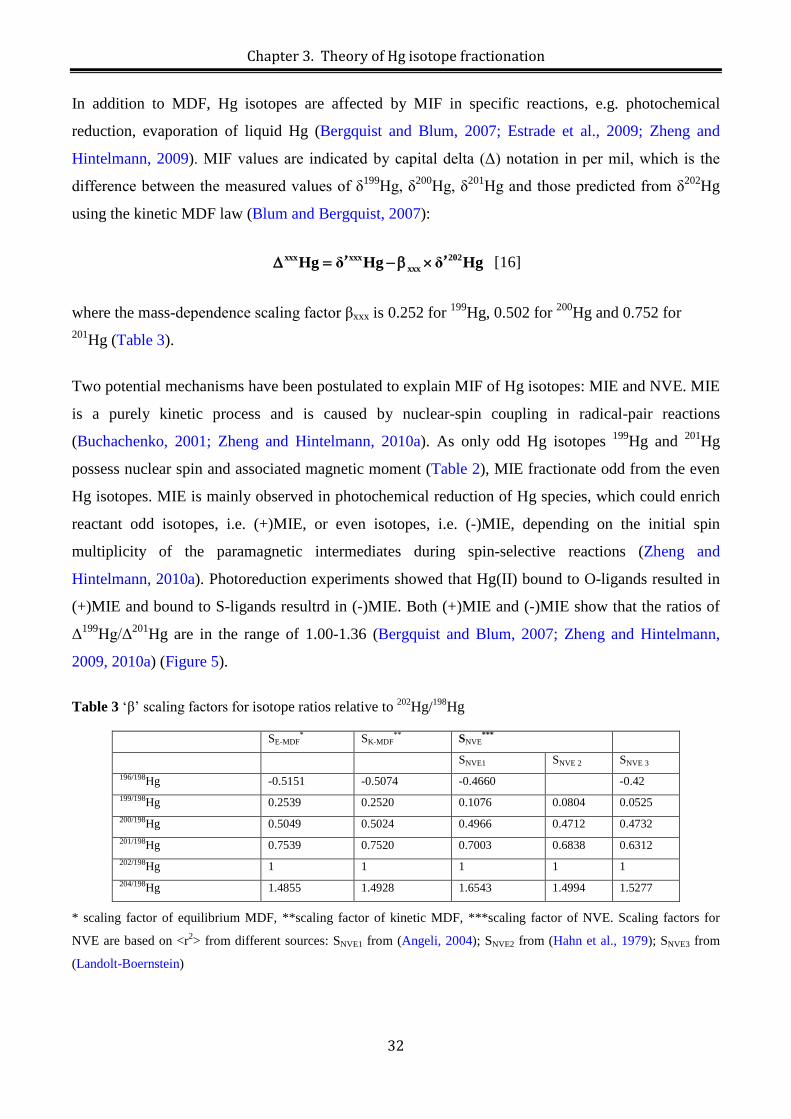
Chapter 3. Theory of Hg isotope fractionation
In addition to MDF, Hg isotopes are affected by MIF in specific reactions, e.g. photochemical
reduction, evaporation of liquid Hg (Bergquist and Blum, 2007; Estrade et al., 2009; Zheng and
Hintelmann, 2009). MIF values are indicated by capital delta (Δ) notation in per mil, which is the
difference between the measured values of δ199Hg, δ200Hg, δ201Hg and those predicted from δ202Hg
using the kinetic MDF law (Blum and Bergquist, 2007):
xxx xxx 202xxxHg δ Hg δ Hg∆ = −β ×’ ’ [16]
where the mass-dependence scaling factor βxxx is 0.252 for 199Hg, 0.502 for 200Hg and 0.752 for 201Hg (Table 3).
Two potential mechanisms have been postulated to explain MIF of Hg isotopes: MIE and NVE. MIE
is a purely kinetic process and is caused by nuclear-spin coupling in radical-pair reactions
(Buchachenko, 2001; Zheng and Hintelmann, 2010a). As only odd Hg isotopes 199Hg and 201Hg
possess nuclear spin and associated magnetic moment (Table 2), MIE fractionate odd from the even
Hg isotopes. MIE is mainly observed in photochemical reduction of Hg species, which could enrich
reactant odd isotopes, i.e. (+)MIE, or even isotopes, i.e. (-)MIE, depending on the initial spin
multiplicity of the paramagnetic intermediates during spin-selective reactions (Zheng and
Hintelmann, 2010a). Photoreduction experiments showed that Hg(II) bound to O-ligands resulted in
(+)MIE and bound to S-ligands resultrd in (-)MIE. Both (+)MIE and (-)MIE show that the ratios of
Δ199Hg/Δ201Hg are in the range of 1.00-1.36 (Bergquist and Blum, 2007; Zheng and Hintelmann,
2009, 2010a) (Figure 5).
Table 3 ‘β’ scaling factors for isotope ratios relative to 202Hg/198Hg
SE-MDF
* SK-MDF** SNVE
***
SNVE1 SNVE 2 SNVE 3
196/198Hg -0.5151 -0.5074 -0.4660 -0.42 199/198Hg 0.2539 0.2520 0.1076 0.0804 0.0525 200/198Hg 0.5049 0.5024 0.4966 0.4712 0.4732 201/198Hg 0.7539 0.7520 0.7003 0.6838 0.6312 202/198Hg 1 1 1 1 1 204/198Hg 1.4855 1.4928 1.6543 1.4994 1.5277
* scaling factor of equilibrium MDF, **scaling factor of kinetic MDF, ***scaling factor of NVE. Scaling factors for
NVE are based on <r2> from different sources: SNVE1 from (Angeli, 2004); SNVE2 from (Hahn et al., 1979); SNVE3 from
(Landolt-Boernstein)
32
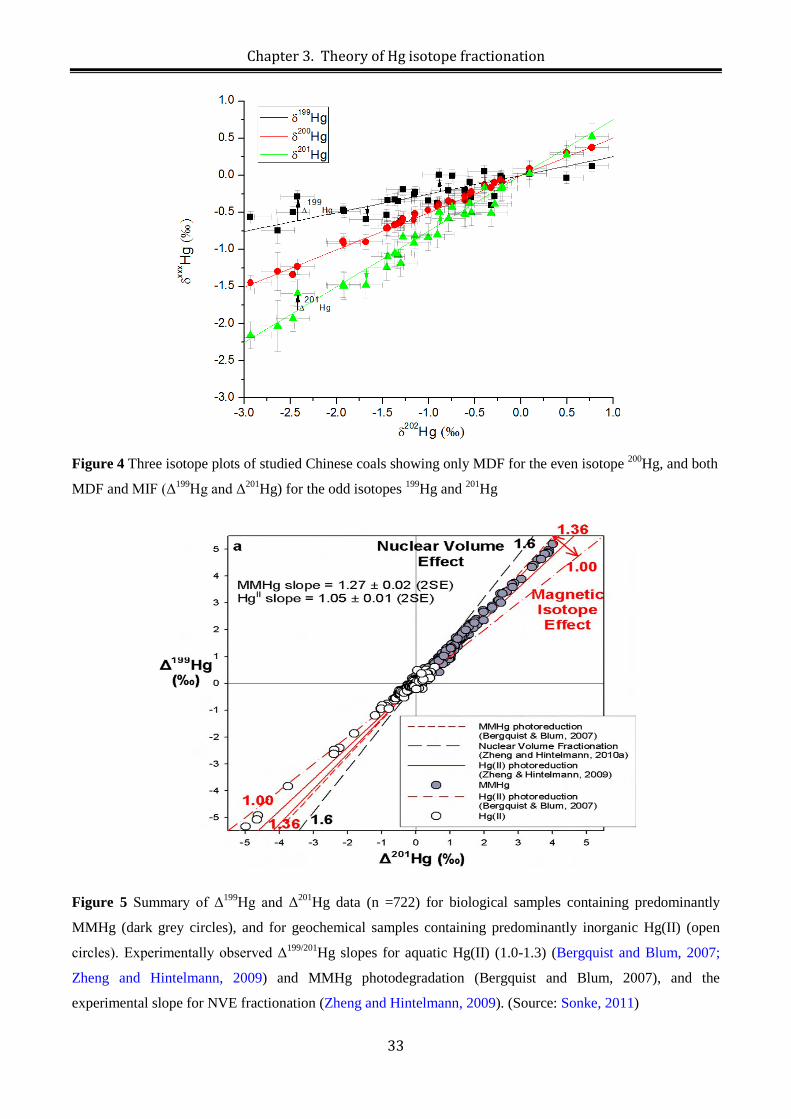
Chapter 3. Theory of Hg isotope fractionation
Figure 4 Three isotope plots of studied Chinese coals showing only MDF for the even isotope 200Hg, and both
MDF and MIF (Δ199Hg and Δ201Hg) for the odd isotopes 199Hg and 201Hg
Figure 5 Summary of Δ199Hg and Δ201Hg data (n =722) for biological samples containing predominantly
MMHg (dark grey circles), and for geochemical samples containing predominantly inorganic Hg(II) (open
circles). Experimentally observed Δ199/201Hg slopes for aquatic Hg(II) (1.0-1.3) (Bergquist and Blum, 2007;
Zheng and Hintelmann, 2009) and MMHg photodegradation (Bergquist and Blum, 2007), and the
experimental slope for NVE fractionation (Zheng and Hintelmann, 2009). (Source: Sonke, 2011)
33
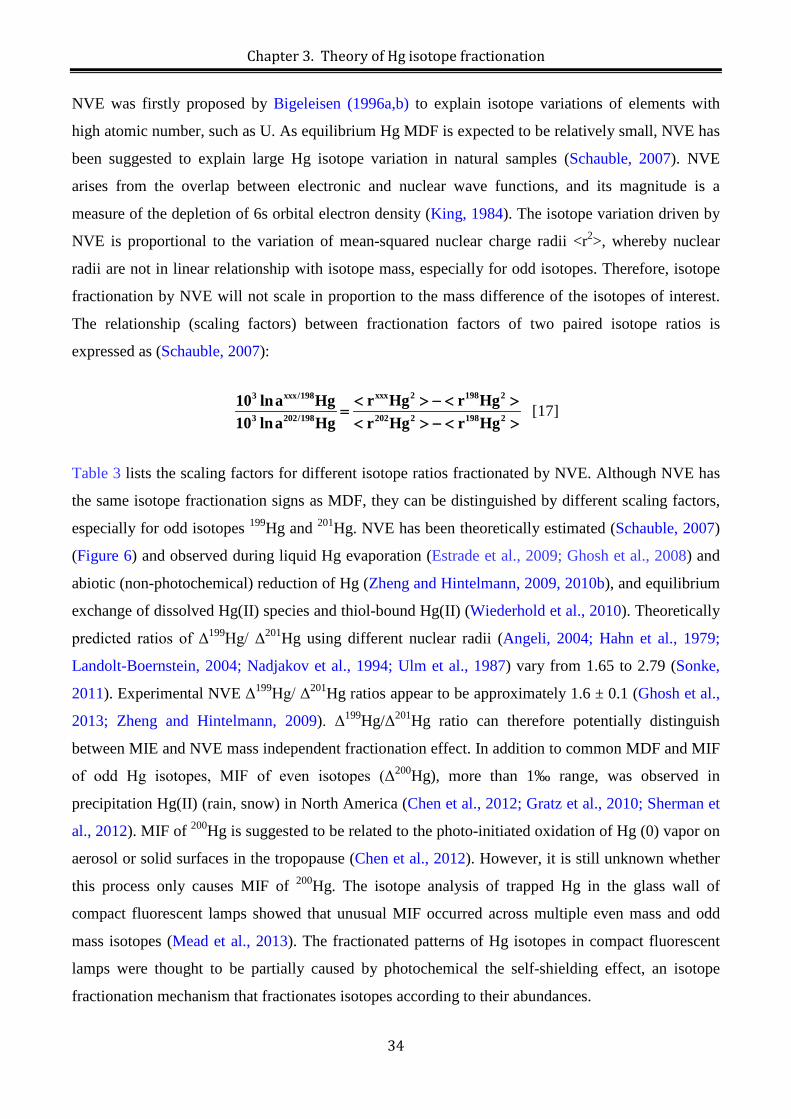
Chapter 3. Theory of Hg isotope fractionation
NVE was firstly proposed by Bigeleisen (1996a,b) to explain isotope variations of elements with
high atomic number, such as U. As equilibrium Hg MDF is expected to be relatively small, NVE has
been suggested to explain large Hg isotope variation in natural samples (Schauble, 2007). NVE
arises from the overlap between electronic and nuclear wave functions, and its magnitude is a
measure of the depletion of 6s orbital electron density (King, 1984). The isotope variation driven by
NVE is proportional to the variation of mean-squared nuclear charge radii <r2>, whereby nuclear
radii are not in linear relationship with isotope mass, especially for odd isotopes. Therefore, isotope
fractionation by NVE will not scale in proportion to the mass difference of the isotopes of interest.
The relationship (scaling factors) between fractionation factors of two paired isotope ratios is
expressed as (Schauble, 2007):
xxx 2 198 23 xxx/198
3 202/198 202 2 198 2
r Hg r Hg10 lna Hg10 lna Hg r Hg r Hg
< > − < >=< > − < >
[17]
Table 3 lists the scaling factors for different isotope ratios fractionated by NVE. Although NVE has
the same isotope fractionation signs as MDF, they can be distinguished by different scaling factors,
especially for odd isotopes 199Hg and 201Hg. NVE has been theoretically estimated (Schauble, 2007)
(Figure 6) and observed during liquid Hg evaporation (Estrade et al., 2009; Ghosh et al., 2008) and
abiotic (non-photochemical) reduction of Hg (Zheng and Hintelmann, 2009, 2010b), and equilibrium
exchange of dissolved Hg(II) species and thiol-bound Hg(II) (Wiederhold et al., 2010). Theoretically
predicted ratios of Δ199Hg/ Δ201Hg using different nuclear radii (Angeli, 2004; Hahn et al., 1979;
Landolt-Boernstein, 2004; Nadjakov et al., 1994; Ulm et al., 1987) vary from 1.65 to 2.79 (Sonke,
2011). Experimental NVE Δ199Hg/ Δ201Hg ratios appear to be approximately 1.6 ± 0.1 (Ghosh et al.,
2013; Zheng and Hintelmann, 2009). Δ199Hg/Δ201Hg ratio can therefore potentially distinguish
between MIE and NVE mass independent fractionation effect. In addition to common MDF and MIF
of odd Hg isotopes, MIF of even isotopes (Δ200Hg), more than 1‰ range, was observed in
precipitation Hg(II) (rain, snow) in North America (Chen et al., 2012; Gratz et al., 2010; Sherman et
al., 2012). MIF of 200Hg is suggested to be related to the photo-initiated oxidation of Hg (0) vapor on
aerosol or solid surfaces in the tropopause (Chen et al., 2012). However, it is still unknown whether
this process only causes MIF of 200Hg. The isotope analysis of trapped Hg in the glass wall of
compact fluorescent lamps showed that unusual MIF occurred across multiple even mass and odd
mass isotopes (Mead et al., 2013). The fractionated patterns of Hg isotopes in compact fluorescent
lamps were thought to be partially caused by photochemical the self-shielding effect, an isotope
fractionation mechanism that fractionates isotopes according to their abundances.
34
Chapter 3. Theory of Hg isotope fractionation
Figure 6 Fractionation factor (1000*ln β202-198Hg) for Hg-bearing molecules relative to Hg(0) vapor. The solid
line denotes MDF and dotted line denotes NVE (Source: Schauble, 2007)
References
Angeli, I., 2004. A consistent set of nuclear rms charge radii: properties of the radius surface R(N,Z). At. Data
Nucl. Data Tables 87, 185-206.
Bergquist, B.A., Blum, J.D., 2007. Mass-Dependent and -Independent Fractionation of Hg Isotopes by
Photoreduction in Aquatic Systems. Science 318, 417-420.
Bergquist, B.A., Blum, J.D., 2009. The Odds and Evens of Mercury Isotopes: Applications of Mass-
Dependent and Mass-Independent Isotope Fractionation. Elements 5, 353-357.
Bigeleisen, J., 1949. The Relative Reaction Velocities of Isotopic Molecules. The Journal of Chemical Physics
17, 675-678.
Bigeleisen, J., 1996a. Nuclear Size and Shape Effects in Chemical Reactions. Isotope Chemistry of the Heavy
Elements. J. Am. Chem. Soc. 118, 3676-3680.
Bigeleisen, J., 1996b. Temperature dependence of the isotope chemistry of the heavy elements. Proceedings of
the National Academy of Sciences of the United States of America 93, 9393-9396.
Bigeleisen, J., Mayer, M.G., 1947. Calculation of Equilibrium Constants for Isotopic Exchange Reactions.
The Journal of Chemical Physics 15, 261-267.
Blum, J., Bergquist, B., 2007. Reporting of variations in the natural isotopic composition of mercury. Anal.
Bioanal. Chem. 388, 353-359.
Blum, J., 2012. Applications of stable mercury isotopes to biogeochemistry. In Baskaran, M. (Ed),
Handbook of Environmental Isotope Geochemistry. Springer Berlin Heidelberg, pp 229-245.
Brönsted, J.N., von Hevesy, G., 1920. The separation of the isotopes of mercury. Nature 106, 144.
35
Chapter 3. Theory of Hg isotope fractionation
Brönsted, J.N., von Hevesy, G., 1921. Uber die trennung der isotopen des quecksilbers. Z. Phys. Chem. 99,
189-206.
Buchachenko, A.L., 2001. Magnetic Isotope Effect: Nuclear Spin Control of Chemical Reactions. The Journal
of Physical Chemistry A 105, 9995-10011.
Buchachenko, A.L., 2013. Mass-Independent Isotope Effects. The Journal of Physical Chemistry B 117,
2231-2238.
Chen, J., Hintelmann, H., Feng, X., Dimock, B., 2012. Unusual fractionation of both odd and even mercury
isotopes in precipitation from Peterborough, ON, Canada. Geochimica et Cosmochimica Acta 90, 33-
46.
Clayton, R.N., 2002. Solar System: Self-shielding in the solar nebula. Nature 415, 860-861.
Cohen, E.R., Cvitas, T., Frey, J.G., Holmström, B., Kuchitsu, K., Marquardt, R., Mills, I., Pavese, F., Quack,
M., J. Stohner, Strauss, H.L., Takami, M., Thor, A.J., 2008. Quantities, Units and Symbols in Physical
Chemistry, IUPAC Green Book, 3rd Edition, 2nd Printing. IUPAC & RSC Publishing, Cambridge.
Coplen,T.B., 2011. Guidelines and recommended terms for expression of stable-isotope-ratio and gas-ratio
measurement results. Rapid Communications in Mass Spectrometry 25, 2538-2560.
Criss, R.E., 1999. Principles of stable isotope distribution. Oxford University Press.
Estrade, N., Carignan, J., Sonke, J.E., Donard, O.F.X., 2009. Mercury isotope fractionation during liquid-
vapor evaporation experiments. Geochimica et Cosmochimica Acta 73, 2693-2711.
Ghosh, S., Schauble, E.A., Lacrampe Couloume, G., Blum, J.D., Bergquist, B.A., 2013. Estimation of nuclear
volume dependent fractionation of mercury isotopes in equilibrium liquid–vapor evaporation
experiments. Chem. Geol. 336, 5-12.
Ghosh, S., Xu, Y., Humayun, M., Odom, L., 2008. Mass-independent fractionation of mercury isotopes in the
environment. Geochem. Geophys. Geosyst. 9, Q03004.
Gratz, L.E., Keeler, G.J., Blum, J.D., Sherman, L.S., 2010. Isotopic Composition and Fractionation of
Mercury in Great Lakes Precipitation and Ambient Air. Environmental Science & Technology 44,
7764-7770.
Haeffner, E., 1953. A Method of Changing the Isotope Abundance in Mercury. Nature 172, 775-776.
Hahn, A.A., Miller, J.P., Powers, R.J., Zehnder, A., Rushton, A.M., Welsh, R.E., Kunselman, A.R., Roberson,
P., Walter, H.K., 1979. An experimental study of muonic X-ray transitions in mercury isotopes. Nucl.
Phys. A 314, 361-386.
Hoefs, J., 2009. Stable Isotope Geochemistry (6th Edition). Springer-Verlag, Berlin Heidelberg.
Jackson, T.A., 2001. Variations in the isotope composition of mercury in a freshwater sediment sequence and
food web. Can. J. Fish. Aquat. Sci. 58, 185-196.
Jiménez-Moreno, M., Perrot, V., Epov, V., Monperrus, M., Amouroux, D., 2013. Chemical kinetic isotope
fractionation of mercury during abiotic methylation of Hg(II) by methylcobalamin in aqueous chloride
media 336, 26-36.
King, W.H., 1984. Isotope shifts in atomic spectra. Plenum Press, New York.
36
Chapter 3. Theory of Hg isotope fractionation
Koval, N.A., Zakharchenko, V.V., Savin, O.R., Vinogradov, V.I., Shkurdoda, V.A., Simonovskii, V.I., 1977.
Problem of natural fractionation of mercury isotopes. Doklady Akademii Nauk SSSR 235, 936-938.
Kritee, K., Blum, J.D., Johnson, M.W., Bergquist, B.A., Barkay, T., 2007. Mercury stable isotope
fractionation during reduction of Hg(II) to Hg(0) by mercury resistant microorganisms.
Environmental Science & Technology 4, 1889-1895.
Kritee, K., Blum, J.D., Barkay, T., 2008. Mercury stable isotope fractionation during reduction of Hg(II) by
different microbial pathways. Environmental Science & Technology 42, 9171-9177.
Kritee, K., Barkay, T., Blum, J.D., 2009. Mass dependent stable isotope fractionation of mercury during mer
mediated microbial degradation of monomethylmercury. Geochimica et Cosmochimica Acta 73 (5),
1285-1296.
Kritee, K., Blum, J.D., Barkay, T., Barkay, T., 2013. Microbial stable isotope fractionation of mercury: A
synthesis of present understanding and future directions 336, 13-25.
Kuznetsov, V.V., Obolenskii, A.A., 1980. Possible mechanism of the natural fractionation of mercury
isotopes. Doklady Akademii Nauk SSSR 252, 459-460.
Landolt-Boernstein, 2004. Numerical Data and Functional Relationships in Science and Technology. Group I:
Elementary Particles, Nuclei and Atoms, Volume 20. Nuclear Charge Radii. Springer, Heidelberg.
Lauretta, D.S., Klaue, B., Blum, J.D., Buseck, P.R., 2001. Mercury abundances and isotopic compositions in
the Murchison (CM) and Allende (CV) carbonaceous chondrites. Geochimica et Cosmochimica Acta
65, 2807-2818.
Lyons, J.R., Young, E.D., 2005. CO self-shielding as the origin of oxygen isotope anomalies in the early solar
nebula. Nature 435, 317-320.
Mead, C., Lyons, J.R., Johnson, T.M., Anbar, A.D., 2013. Unique Hg Stable Isotope Signatures of Compact
Fluorescent Lamp-Sourced Hg. Environmental Science & Technology 47, 2542-2547.
Mulliken, R.S., Harkins, W.D., 1922. The separation of isotopes. Theory of resolution of isotopic mixtures by
diffusion and similar processes. Experimental separation of mercury by evaporation in a vacuum. J.
Am. Chem. Soc. 44, 37-65.
Nadjakov, E.G., Marinova, K.P., Gangrsky, Y.P., 1994. Systematics of Nuclear Charge Radii. At. Data Nucl.
Data Tables 56, 133-157.
Nier, A.O., 1950. A Redetermination of the Relative Abundances of the Isotopes of Neon, Krypton,
Rubidium, Xenon, and Mercury. Physical Review 79, 450.
Obolenskii, A.A., Doilnitsyn, E.F., 1976. Natural fractionation of mercury isotopes. Akademiya Nauk SSSR
Doklady 230, 701-704.
Schauble, E.A., 2007. Role of nuclear volume in driving equilibrium stable isotope fractionation of mercury,
thallium, and other very heavy elements. Geochimica et Cosmochimica Acta 71, 2170-2189.
Sherman, L.S., Blum, J.D., Keeler, G.J., Demers, J.D., Dvonch, J.T., 2012. Investigation of Local Mercury
Deposition from a Coal-Fired Power Plant Using Mercury Isotopes. Environmental Science &
Technology
37
Chapter 3. Theory of Hg isotope fractionation
Sonke, J.E., 2011. A global model of mass independent mercury stable isotope fractionation. Geochimica et
Cosmochimica Acta 75, 4577-4590.
Sonke, J.E., Blum, J.D., 2013. Advances in mercury stable isotope biogeochemistry. Chem. Geol. 336, 1-4.
Ulm, G., Bhattacherjee, S.K., Dabkiewicz, P., Huber, G., Kluge, H.J., Kühl, T., Lochmann, H., Otten, E.W.,
Wendt, K., Ahmad, S.A., Klempt, W., Neugart, R., 1987. Isotope shift of182Hg and an update of
nuclear moments and charge radii in the isotope range181Hg-206Hg Zeitschrift für Physik A: Atomic
Nuclei 325, 247-259.
Urey, H.C., 1947. The thermodynamic properties of isotopic substances. Journal of the Chemical Society
(Resumed), 562-581.
Wiederhold, J.G., Cramer, C.J., Daniel, K., Infante, I., Bourdon, B., Kretzschmar, R., 2010. Equilibrium
Mercury Isotope Fractionation between Dissolved Hg(II) Species and Thiol-Bound Hg.
Environmental Science & Technology 44, 4191-4197.
Yin, R., Feng, X., Shi, W., 2010. Application of the stable-isotope system to the study of sources and fate of
Hg in the environment: A review. Applied Geochemistry 25: 1467-1477.
Young, E.D., Galy, A., Nagahara, H., 2002. Kinetic and equilibrium mass-dependent isotope fractionation
laws in nature and their geochemical and cosmochemical significance. Geochimica et Cosmochimica
Acta 66, 1095-1104.
Zheng, W., Foucher. D, Hintelmann, H., 2007. Mercury isotope fractionation during volatilization of Hg(0)
from solution into the gas phase. Journal of Analytical Atomic Spectrometry 22: 1097-1104.
Zheng, W., Hintelmann, H., 2009. Mercury isotope fractionation during photoreduction in natural water is
controlled by its Hg/DOC ratio. Geochimica et Cosmochimica Acta 73, 6704-6715.
Zheng, W., Hintelmann, H., 2010a. Isotope Fractionation of Mercury during Its Photochemical Reduction by
Low-Molecular-Weight Organic Compounds. The Journal of Physical Chemistry A 114, 4246-4253.
Zheng, W., Hintelmann, H., 2010b. Nuclear Field Shift Effect in Isotope Fractionation of Mercury during
Abiotic Reduction in the Absence of Light. The Journal of Physical Chemistry A 114, 4238-4245.
38
Chapter 4. Sample descriptions and Hg isotope measurements
Chapter 4
Sample descriptions and Hg isotope measurements
39
Chapter 4. Sample descriptions and Hg isotope measurements
Chapter 4. Sample descriptions and Hg isotope measurements
4.1. Sample descriptions
In line with the objectives of this thesis, the collected samples are generally divided into three
categories: coal from continuous coal-bearing sequences (Anhui, China); mined coal from worldwide
coal deposits and; coal and coal combustion products (bottom ash, fly ash, gypsum) from typical
Chinese power plants.
4.1.1. Samples from continuous coal-bearing sequences
In order to investigate the temporal variations of Hg isotope signatures with the evolution of coal
deposits, coal samples from different coal seams in a complete coal-bearing sequence were sampled
in the Huainan Coalfield, Anhui Province, China. Coal associated sandstone and mudstone were
sampled to trace the detrital Hg source isotope composition in coal. We also sampled natural cokes
metamorphosed by elevated heat and pressure derived from magmatic intrusions, with the aim to
characterize the influence of geological processes on the fractionation of Hg isotopes in coal.
4.1.1.1. Study area and geological settings
The Permian coal-bearing sequences in the Zhuji Coal Mine (Huainan Coalfield, Anhui Province)
and Daizhuang Coal Mine (Jining Coalfield, Shandong Province) were selected for this study (Figure
7). Both coal mines produce low sulfur bituminous coals that are widely used in power plants of East
China.
The data from 88 boreholes drilled during the exploration period showed that there are 28 coal seams
in the Permian strata, and 9 coal seams in the Carboniferous strata (Figure 8) (Sun et al., 2010a). The
Taiyuan Formation (with a thickness ranging from 112.1 to 114.2 m; 113 m on average) in the upper
part of the Carboniferous strata comprises 7–9 thin, unworkable coal seams. The Permian strata
comprise the Shanxi Formation (with a thickness ranging from 52.6 to 82.3 m; 67.5 m on average),
the Lower Shihezi Formation (with a thickness ranging from 480.6 to 554.7 m; 517.7 m on average),
the Upper Shihezi Formation (with a thickness ranging from 116.7 to 162.1 m; 145.6 m on average)
and the Shiqianfeng Formation (with a thickness ranging from 210.3 to 256.2 m; 233.6 m on
average). The average total thickness of the Permian coal-bearing sequences is about 964.4 m. Coal
seams of 17-1, 16-2 13-1, 11 (split into 11-2, 11-1) in the Upper Shihezi Formation, 8, 7-2, 6, 5 (split
into 5-2, 5-1), 4 (split into 4-2, 4-1) in the Lower Shihezi Formaton and 3 in the Shanxi Formation
40
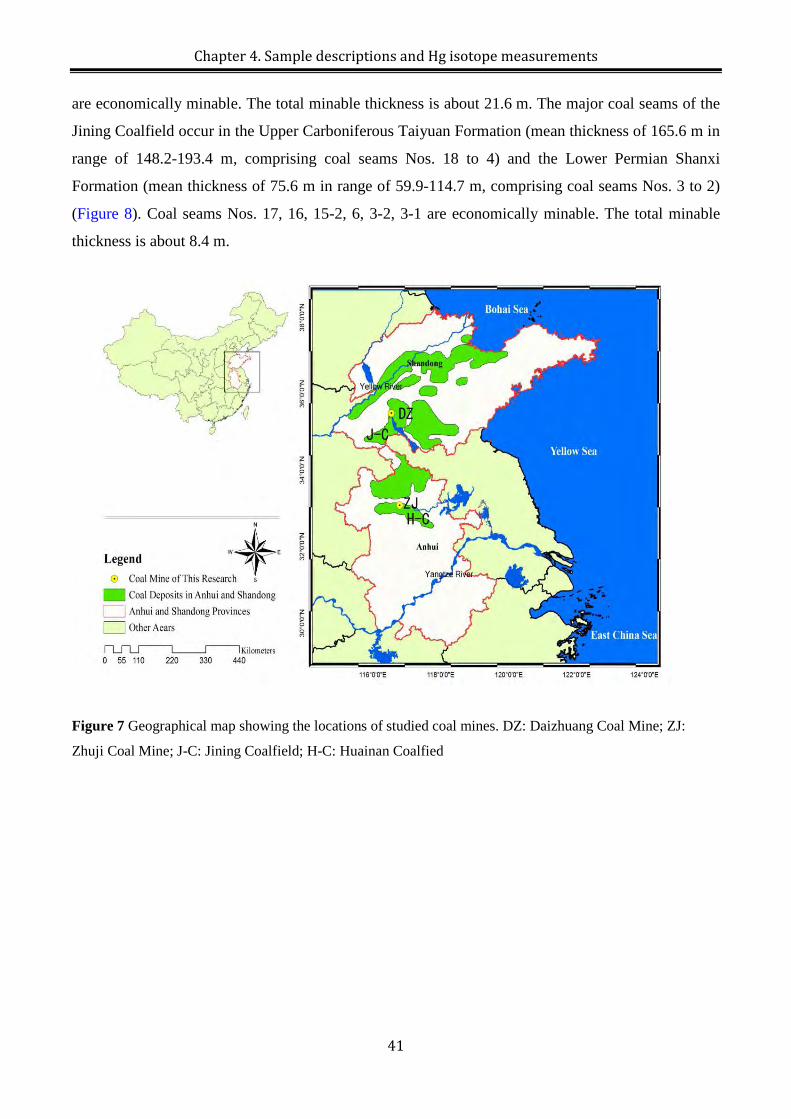
Chapter 4. Sample descriptions and Hg isotope measurements
are economically minable. The total minable thickness is about 21.6 m. The major coal seams of the
Jining Coalfield occur in the Upper Carboniferous Taiyuan Formation (mean thickness of 165.6 m in
range of 148.2-193.4 m, comprising coal seams Nos. 18 to 4) and the Lower Permian Shanxi
Formation (mean thickness of 75.6 m in range of 59.9-114.7 m, comprising coal seams Nos. 3 to 2)
(Figure 8). Coal seams Nos. 17, 16, 15-2, 6, 3-2, 3-1 are economically minable. The total minable
thickness is about 8.4 m.
Figure 7 Geographical map showing the locations of studied coal mines. DZ: Daizhuang Coal Mine; ZJ:
Zhuji Coal Mine; J-C: Jining Coalfield; H-C: Huainan Coalfied
41
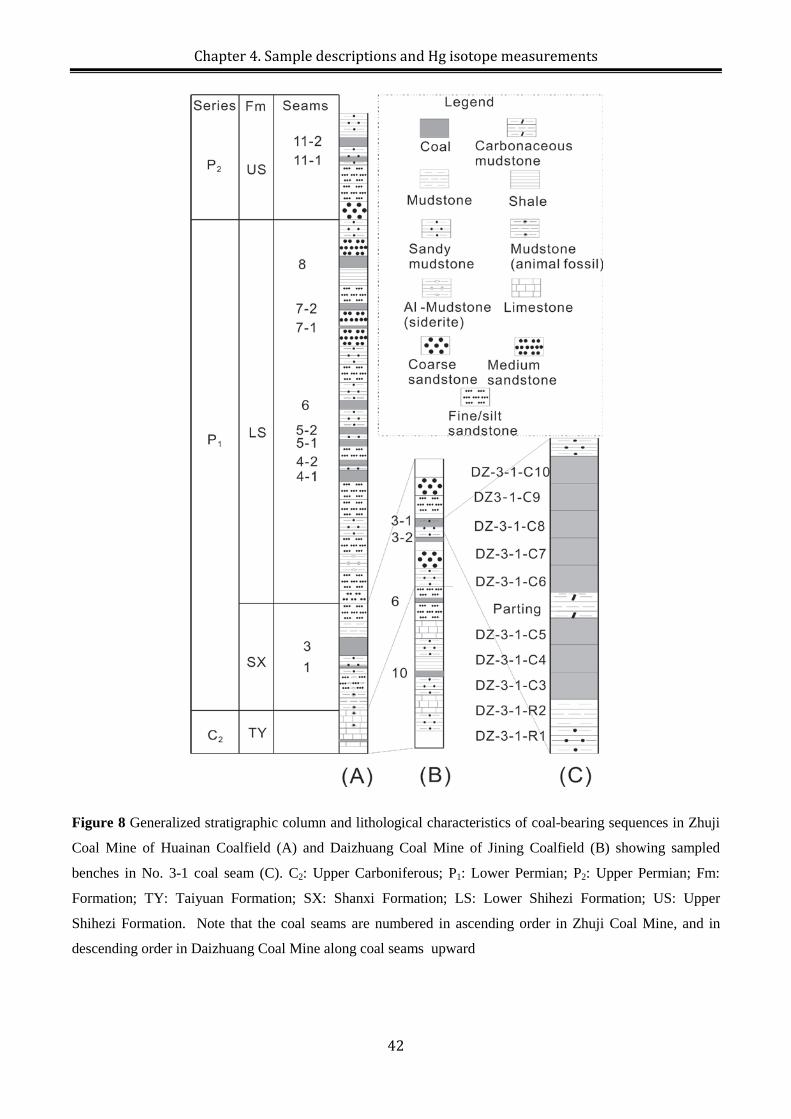
Chapter 4. Sample descriptions and Hg isotope measurements
Figure 8 Generalized stratigraphic column and lithological characteristics of coal-bearing sequences in Zhuji
Coal Mine of Huainan Coalfield (A) and Daizhuang Coal Mine of Jining Coalfield (B) showing sampled
benches in No. 3-1 coal seam (C). C2: Upper Carboniferous; P1: Lower Permian; P2: Upper Permian; Fm:
Formation; TY: Taiyuan Formation; SX: Shanxi Formation; LS: Lower Shihezi Formation; US: Upper
Shihezi Formation. Note that the coal seams are numbered in ascending order in Zhuji Coal Mine, and in
descending order in Daizhuang Coal Mine along coal seams upward
42
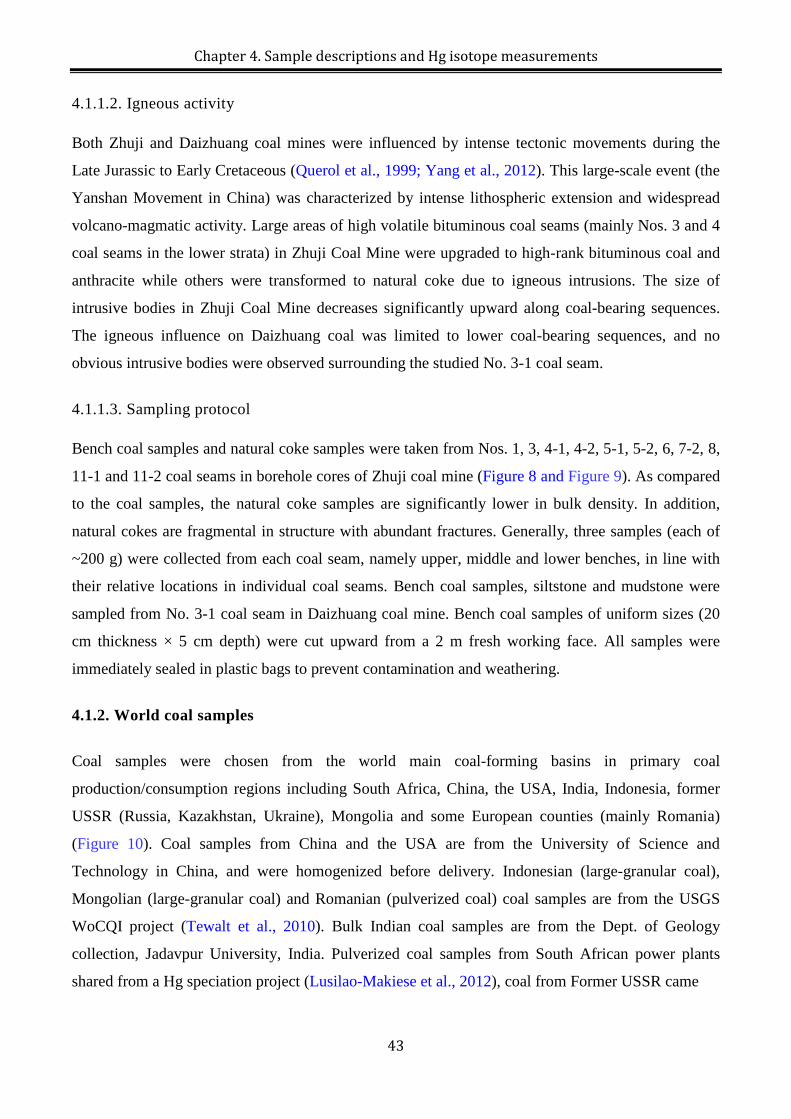
Chapter 4. Sample descriptions and Hg isotope measurements
4.1.1.2. Igneous activity
Both Zhuji and Daizhuang coal mines were influenced by intense tectonic movements during the
Late Jurassic to Early Cretaceous (Querol et al., 1999; Yang et al., 2012). This large-scale event (the
Yanshan Movement in China) was characterized by intense lithospheric extension and widespread
volcano-magmatic activity. Large areas of high volatile bituminous coal seams (mainly Nos. 3 and 4
coal seams in the lower strata) in Zhuji Coal Mine were upgraded to high-rank bituminous coal and
anthracite while others were transformed to natural coke due to igneous intrusions. The size of
intrusive bodies in Zhuji Coal Mine decreases significantly upward along coal-bearing sequences.
The igneous influence on Daizhuang coal was limited to lower coal-bearing sequences, and no
obvious intrusive bodies were observed surrounding the studied No. 3-1 coal seam.
4.1.1.3. Sampling protocol
Bench coal samples and natural coke samples were taken from Nos. 1, 3, 4-1, 4-2, 5-1, 5-2, 6, 7-2, 8,
11-1 and 11-2 coal seams in borehole cores of Zhuji coal mine (Figure 8 and Figure 9). As compared
to the coal samples, the natural coke samples are significantly lower in bulk density. In addition,
natural cokes are fragmental in structure with abundant fractures. Generally, three samples (each of
~200 g) were collected from each coal seam, namely upper, middle and lower benches, in line with
their relative locations in individual coal seams. Bench coal samples, siltstone and mudstone were
sampled from No. 3-1 coal seam in Daizhuang coal mine. Bench coal samples of uniform sizes (20
cm thickness × 5 cm depth) were cut upward from a 2 m fresh working face. All samples were
immediately sealed in plastic bags to prevent contamination and weathering.
4.1.2. World coal samples
Coal samples were chosen from the world main coal-forming basins in primary coal
production/consumption regions including South Africa, China, the USA, India, Indonesia, former
USSR (Russia, Kazakhstan, Ukraine), Mongolia and some European counties (mainly Romania)
(Figure 10). Coal samples from China and the USA are from the University of Science and
Technology in China, and were homogenized before delivery. Indonesian (large-granular coal),
Mongolian (large-granular coal) and Romanian (pulverized coal) coal samples are from the USGS
WoCQI project (Tewalt et al., 2010). Bulk Indian coal samples are from the Dept. of Geology
collection, Jadavpur University, India. Pulverized coal samples from South African power plants
shared from a Hg speciation project (Lusilao-Makiese et al., 2012), coal from Former USSR came
43
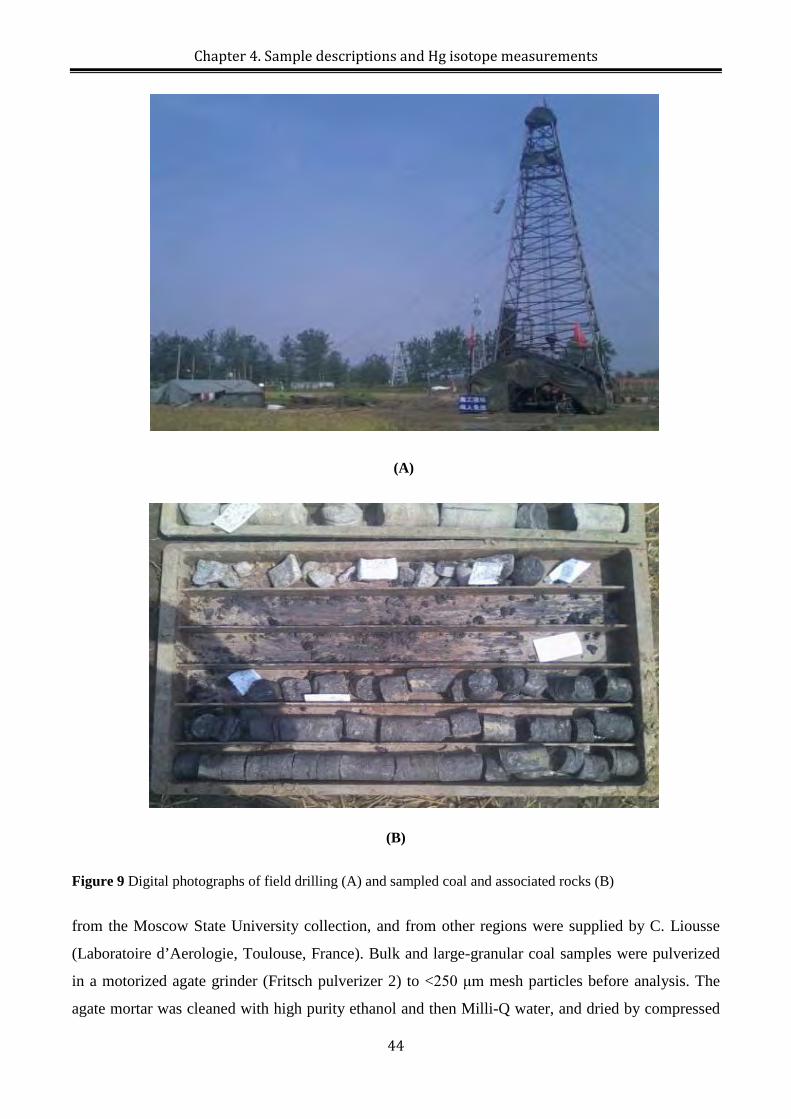
Chapter 4. Sample descriptions and Hg isotope measurements
(A)
(B)
Figure 9 Digital photographs of field drilling (A) and sampled coal and associated rocks (B)
from the Moscow State University collection, and from other regions were supplied by C. Liousse
(Laboratoire d’Aerologie, Toulouse, France). Bulk and large-granular coal samples were pulverized
in a motorized agate grinder (Fritsch pulverizer 2) to <250 μm mesh particles before analysis. The
agate mortar was cleaned with high purity ethanol and then Milli-Q water, and dried by compressed
44
Chapter 4. Sample descriptions and Hg isotope measurements
air before processing each sample. In between samples, ~15 g Hg-clean quartz sand was processed in
the same way as coal samples to monitor and minimize the possible cross-contamination.
Figure 10 The geographical locations of world coal samples
4.1.3. Coal and coal combustion products
4.1.3.1. Site Description
Huainan City is located in north Anhui Province, China. It is known as "Thermal Power Three
Gorges", and is the energy base of Eastern China. The estimated total coal reserves of the Huainan
coalfield are approximately 44,000 Mt and have recently transformed Huainan City from a coal
supplier to an electricity producer (Sun et al., 2010a). At present there are three main power plants
(others are under construction) with a total capacity of nearly 10,000 MW and an electric power
output of > 80 billion KWh/yr. The increasing coal production (~100 Mt in the year 2010) in several
dozens of coal mines and large coal consumption (~27 Mt in the year 2010) in Huainan coal-fired
power plants have generated environmental challenges such as air pollution control and the disposal
of coal combustion by-products. Emission data showed that SO2 and dust emission in Huainan city
were 119 Mt and 33 Mt respectively in the year 2005, corresponding to an increase of 28% and 12%
relative to the year 2000 (NAE&NAC, 2008). Moreover, the generated amount of coal waste (fly ash
45
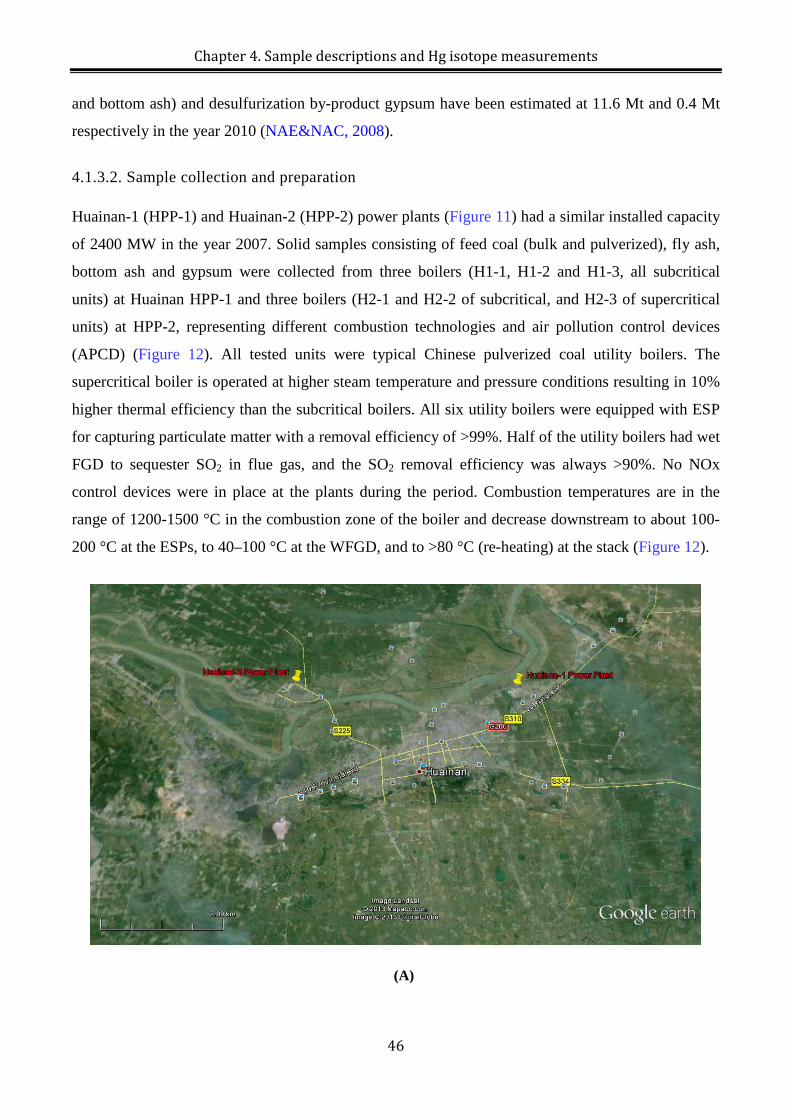
Chapter 4. Sample descriptions and Hg isotope measurements
and bottom ash) and desulfurization by-product gypsum have been estimated at 11.6 Mt and 0.4 Mt
respectively in the year 2010 (NAE&NAC, 2008).
4.1.3.2. Sample collection and preparation
Huainan-1 (HPP-1) and Huainan-2 (HPP-2) power plants (Figure 11) had a similar installed capacity
of 2400 MW in the year 2007. Solid samples consisting of feed coal (bulk and pulverized), fly ash,
bottom ash and gypsum were collected from three boilers (H1-1, H1-2 and H1-3, all subcritical
units) at Huainan HPP-1 and three boilers (H2-1 and H2-2 of subcritical, and H2-3 of supercritical
units) at HPP-2, representing different combustion technologies and air pollution control devices
(APCD) (Figure 12). All tested units were typical Chinese pulverized coal utility boilers. The
supercritical boiler is operated at higher steam temperature and pressure conditions resulting in 10%
higher thermal efficiency than the subcritical boilers. All six utility boilers were equipped with ESP
for capturing particulate matter with a removal efficiency of >99%. Half of the utility boilers had wet
FGD to sequester SO2 in flue gas, and the SO2 removal efficiency was always >90%. No NOx
control devices were in place at the plants during the period. Combustion temperatures are in the
range of 1200-1500 °C in the combustion zone of the boiler and decrease downstream to about 100-
200 °C at the ESPs, to 40–100 °C at the WFGD, and to >80 °C (re-heating) at the stack (Figure 12).
(A)
46
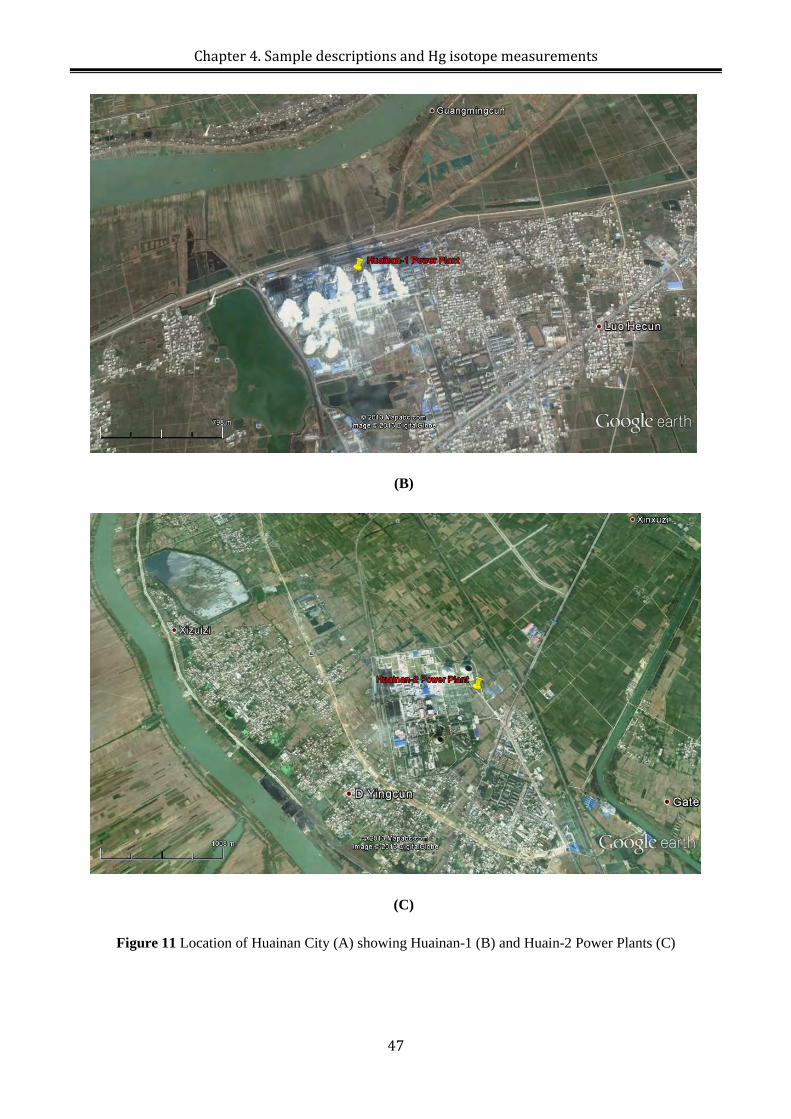
Chapter 4. Sample descriptions and Hg isotope measurements
(B)
(C)
Figure 11 Location of Huainan City (A) showing Huainan-1 (B) and Huain-2 Power Plants (C)
47
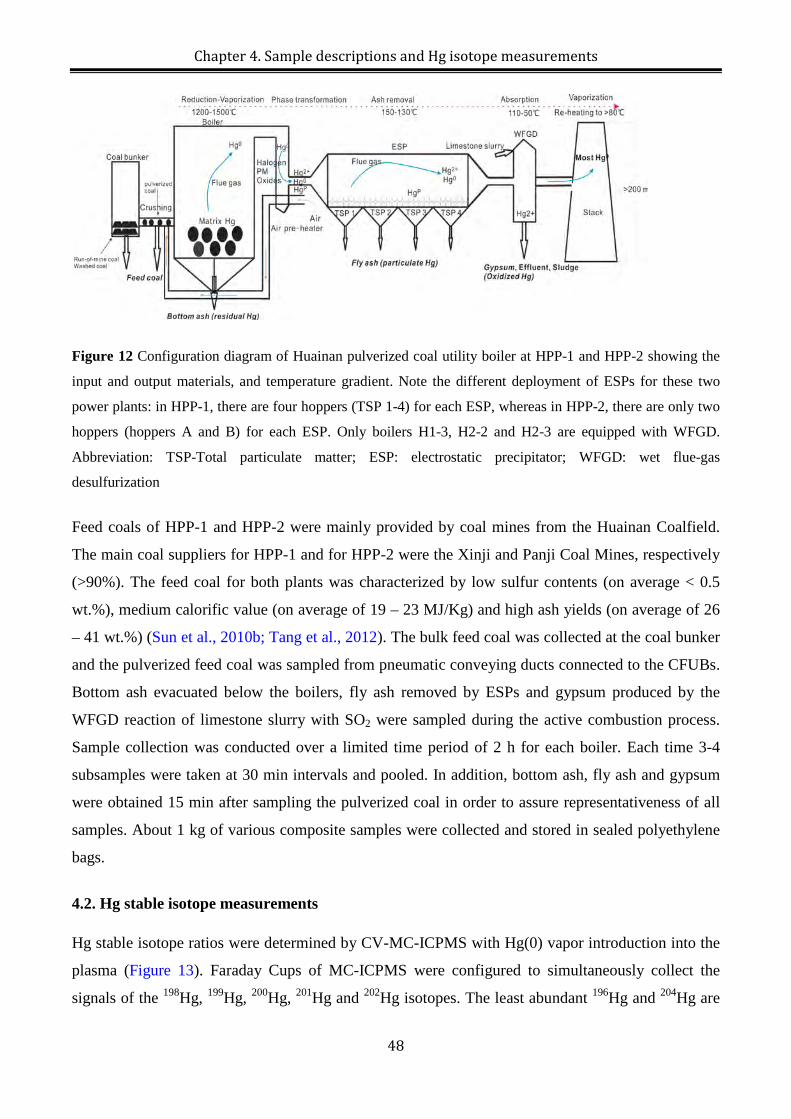
Chapter 4. Sample descriptions and Hg isotope measurements
Figure 12 Configuration diagram of Huainan pulverized coal utility boiler at HPP-1 and HPP-2 showing the
input and output materials, and temperature gradient. Note the different deployment of ESPs for these two
power plants: in HPP-1, there are four hoppers (TSP 1-4) for each ESP, whereas in HPP-2, there are only two
hoppers (hoppers A and B) for each ESP. Only boilers H1-3, H2-2 and H2-3 are equipped with WFGD.
Abbreviation: TSP-Total particulate matter; ESP: electrostatic precipitator; WFGD: wet flue-gas
desulfurization
Feed coals of HPP-1 and HPP-2 were mainly provided by coal mines from the Huainan Coalfield.
The main coal suppliers for HPP-1 and for HPP-2 were the Xinji and Panji Coal Mines, respectively
(>90%). The feed coal for both plants was characterized by low sulfur contents (on average < 0.5
wt.%), medium calorific value (on average of 19 – 23 MJ/Kg) and high ash yields (on average of 26
– 41 wt.%) (Sun et al., 2010b; Tang et al., 2012). The bulk feed coal was collected at the coal bunker
and the pulverized feed coal was sampled from pneumatic conveying ducts connected to the CFUBs.
Bottom ash evacuated below the boilers, fly ash removed by ESPs and gypsum produced by the
WFGD reaction of limestone slurry with SO2 were sampled during the active combustion process.
Sample collection was conducted over a limited time period of 2 h for each boiler. Each time 3-4
subsamples were taken at 30 min intervals and pooled. In addition, bottom ash, fly ash and gypsum
were obtained 15 min after sampling the pulverized coal in order to assure representativeness of all
samples. About 1 kg of various composite samples were collected and stored in sealed polyethylene
bags.
4.2. Hg stable isotope measurements
Hg stable isotope ratios were determined by CV-MC-ICPMS with Hg(0) vapor introduction into the
plasma (Figure 13). Faraday Cups of MC-ICPMS were configured to simultaneously collect the
signals of the 198Hg, 199Hg, 200Hg, 201Hg and 202Hg isotopes. The least abundant 196Hg and 204Hg are
48
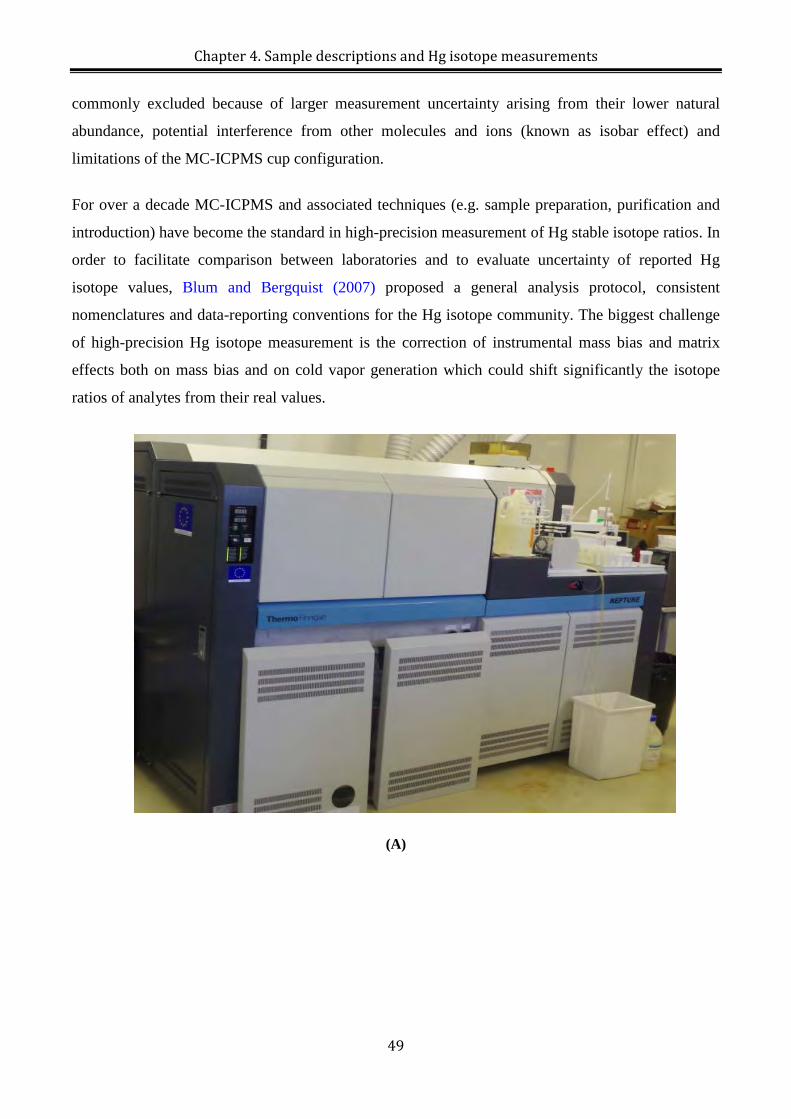
Chapter 4. Sample descriptions and Hg isotope measurements
commonly excluded because of larger measurement uncertainty arising from their lower natural
abundance, potential interference from other molecules and ions (known as isobar effect) and
limitations of the MC-ICPMS cup configuration.
For over a decade MC-ICPMS and associated techniques (e.g. sample preparation, purification and
introduction) have become the standard in high-precision measurement of Hg stable isotope ratios. In
order to facilitate comparison between laboratories and to evaluate uncertainty of reported Hg
isotope values, Blum and Bergquist (2007) proposed a general analysis protocol, consistent
nomenclatures and data-reporting conventions for the Hg isotope community. The biggest challenge
of high-precision Hg isotope measurement is the correction of instrumental mass bias and matrix
effects both on mass bias and on cold vapor generation which could shift significantly the isotope
ratios of analytes from their real values.
(A)
49
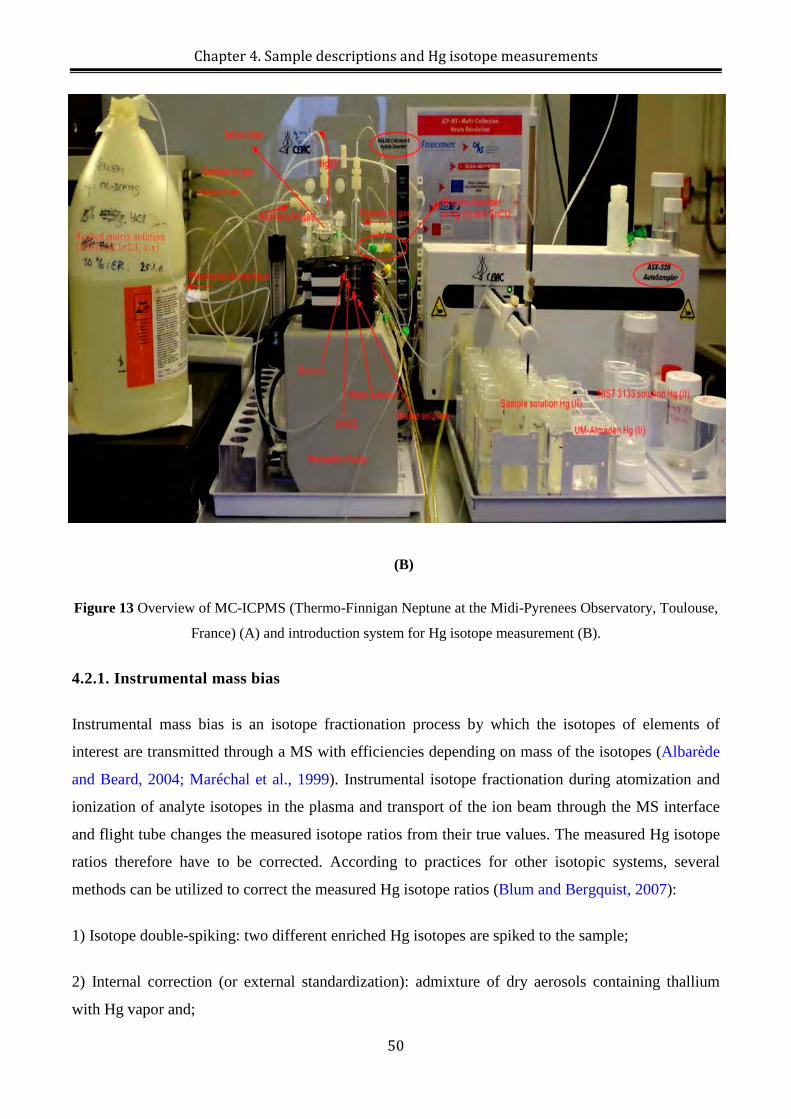
Chapter 4. Sample descriptions and Hg isotope measurements
(B)
Figure 13 Overview of MC-ICPMS (Thermo-Finnigan Neptune at the Midi-Pyrenees Observatory, Toulouse,
France) (A) and introduction system for Hg isotope measurement (B).
4.2.1. Instrumental mass bias
Instrumental mass bias is an isotope fractionation process by which the isotopes of elements of
interest are transmitted through a MS with efficiencies depending on mass of the isotopes (Albarède
and Beard, 2004; Maréchal et al., 1999). Instrumental isotope fractionation during atomization and
ionization of analyte isotopes in the plasma and transport of the ion beam through the MS interface
and flight tube changes the measured isotope ratios from their true values. The measured Hg isotope
ratios therefore have to be corrected. According to practices for other isotopic systems, several
methods can be utilized to correct the measured Hg isotope ratios (Blum and Bergquist, 2007):
1) Isotope double-spiking: two different enriched Hg isotopes are spiked to the sample;
2) Internal correction (or external standardization): admixture of dry aerosols containing thallium
with Hg vapor and;
50
Chapter 4. Sample descriptions and Hg isotope measurements
3) Sample-standard bracketing (SSB): bracketing the sample with NIST 3133 during the
measurement session.
Most of the corrections for Hg isotope ratios are based on methods 2) and/or 3) (Blum and Bergquist,
2007). Recently, the isotope double-spiking method has been used, which gave an even smaller
uncertainty for isotope ratios (Bartov et al., 2012; Mead and Johnson, 2010).
4.2.1.1. Internal standard correction
The mass-dependent transmission of isotopes in MS can be depicted by a general phenomenological
theory by assuming that transmission is a function of mass. Three mass-dependent fractionation laws
have been proposed for internal correction: linear, power and exponential (Albarède and Beard,
2004; Maréchal et al., 1999). Because a linear correction is inconsistent between the ratio of two
isotope ratios, the latter two laws are usually applied for mass bias correction, which are two
particular cases of the generalized power law (Albarède and Beard, 2004; Maréchal et al., 1999).
Following Albarede and Beard (2004), assuming that the transmission T(iM) of isotope beams at
mass iM is a function of the mass difference (ΔMn= iMn- r1Mn, n is an arbitrary number) between iMn
and a reference mass r1Mn:
( )1
1 1 1
rr r ri i n n i n n 2
n
ln ( M)ln ( M)=ln ( M)+ ( M M ) O( M M )M
∂− + −
∂T
T T [18]
where O stands for the terms of order and:
11
1
i(r )i(r )
i(r )nln ( M)=lnN
T [19]
which represents the number of isotope ions (n) received by collectors relative to the number of
isotope atoms (N) introduced into the MS. To the first order, the mass bias can be approximated as:
11 1
1 1
11
i i
i /rii i rr ri i n nm
r r i i/riT
rr
n nR( M) N nln ( M)-ln ( M)=ln ln ln ln u( M M )
N R( M) nNN
= = = −
TT T
T[20]
51
Chapter 4. Sample descriptions and Hg isotope measurements
i/r1Rm and i/r1RT are the measured and true isotope ratios, respectively, and the parameter u stands for
the derivative at M = r1M, and is a mass-independent coefficient. When n=1, Eq. 20 corresponds to
power fractionation law:
r ri i1 1i /ri
u( M M) ( M M)mi/ri
T
R e gR
− −= = [21]
Eq. 18 can be rewritten as:
( ) ( ) ( )1
1 1 1
rr r ri i i n n 2ln ( M)ln T( M)=ln ( M)+ exp n ln M exp n ln M O( M M )
exp n ln M∂ − + − ∂
TT [22]
When n→0, Eq. 22 is approximated as:
( ) ( )1
1 1 1 1 1
rr r r r ri i iln ( M)ln T( M)=lnT( M)+ ln M ln M lnT( M)+u M ln M ln M
ln M∂
− = −∂T [23]
By arranging Eq. 23, we can obtain:
1
1 1
i /ri i irm
r ri/riT
R M Mln Mu ln f lnR M M
= = [24]
which can be rewritten as:
1
i /ri ifm
ri/riT
R M( )R M
= [25]
where f =ur1M is the mass fractionation coefficient. To the first order, the mass fractionation per amu
is:
1 1
i /ri i /rim m
i/ri i /riuT T
r ri i
R R1 lnR R lne ln g u
( M M) ( M M)
−= = =
− − [26]
for the power fractionation law and is
52
Chapter 4. Sample descriptions and Hg isotope measurements
1 1 1
1 1 1 1 1
11 1
i /ri i /ri i /rim m m
i/ri i /ri i /ri i /ri i /rim m T T T
i/ri i /ri r r rT Tr r r r i ri i i i
rr r
R R Rln ln lnR R R R R1 lnR R fM M M u
MM M M M M M M M Mln( )ln(1 )MM M
−= = = =
− − − −+
[27]
for the exponential fraction law.
We can derive a second set of isotope ratio j/r2R, similar to Eqs. 21 and 25, using power and
exponential law, respectively:
2 j r2
2
j/ru( M M)m
j/rT
R eR
−= [28]
2
2 2
j/r jfm
j/r rT
R M( )R M
= [29]
For the power fractionation law, taking logarithm on both sides of Eqs. 21 and 28, and dividing Eq.
22 by Eq. 29 gives the slope Si/rij/r2 of the lni/r1Rm vs. lnj/r2Rm array:
1 1 1 11
22 2 2 2
i /r i /r i /r rii /rm Tj/rj/r j/r j/r rj
m T
ln R ln R lg g M M Sln R ln R lg g M M
− −= =
− − [30]
Similarly, for exponential fractionation law, the slope Si/rij/r2 is
1 1 1 11
22 2 2 2
i /r i /r i /r rii /rm Tj/rj/r j/r j/r rj
m T
ln R ln R f ln M ln M Sln R ln R f ln M ln M
− −= =
− − [31]
During Hg isotope measurement, a dry Tl aerosol (NIST SRM 997; 205Tl/203Tl = 2.38714) generated
by a desolvating nebulizer (e.g., Aridus II from Cetac in this work) is mixed with the sample Hg
vapor in a gas-liquid separator, and then they are simultaneously introduced into the plasma (Blum
and Bergquist, 2007). In this case, we can substitute the isotopes in Eqs. 30 and 31 using Hg and Tl
isotopes:
xxx/198
205/203
xxx/198 xxx/198 Hg xxx 198xxx/198m T205/203205/203 205/203 205 203Tl
m T
ln R Hg ln R Hg ln g M Hg M Hg Sln R Tl ln R Tl M Tl M Tlln g
− −= =
− − [32]
53
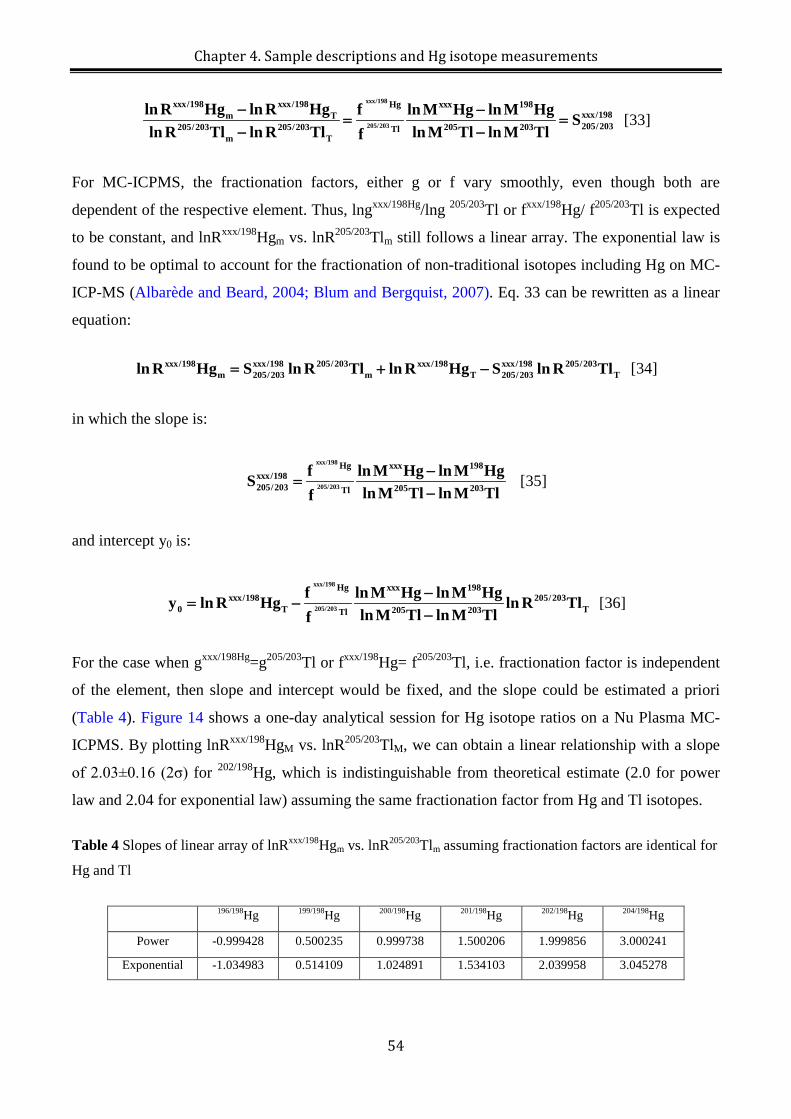
Chapter 4. Sample descriptions and Hg isotope measurements
xxx/198
205/203
xxx/198 xxx/198 Hg xxx 198xxx/198m T205/203205/203 205/203 205 203Tl
m T
ln R Hg ln R Hg f ln M Hg ln M Hg Sln R Tl ln R Tl ln M Tl ln M Tlf
− −= =
− − [33]
For MC-ICPMS, the fractionation factors, either g or f vary smoothly, even though both are
dependent of the respective element. Thus, lngxxx/198Hg/lng 205/203Tl or fxxx/198Hg/ f205/203Tl is expected
to be constant, and lnRxxx/198Hgm vs. lnR205/203Tlm still follows a linear array. The exponential law is
found to be optimal to account for the fractionation of non-traditional isotopes including Hg on MC-
ICP-MS (Albarède and Beard, 2004; Blum and Bergquist, 2007). Eq. 33 can be rewritten as a linear
equation:
xxx/198 xxx/198 205/203 xxx/198 xxx/198 205/203m 205/203 m T 205/203 Tln R Hg S ln R Tl ln R Hg S ln R Tl= + − [34]
in which the slope is:
xxx/198
205/203
Hg xxx 198xxx/198205/203 205 203Tl
f ln M Hg ln M HgSln M Tl ln M Tlf
−=
− [35]
and intercept y0 is:
xxx/198
205/203
Hg xxx 198xxx/198 205/203
0 T T205 203Tl
f ln M Hg ln M Hgy ln R Hg ln R Tlln M Tl ln M Tlf
−= −
− [36]
For the case when gxxx/198Hg=g205/203Tl or fxxx/198Hg= f205/203Tl, i.e. fractionation factor is independent
of the element, then slope and intercept would be fixed, and the slope could be estimated a priori
(Table 4). Figure 14 shows a one-day analytical session for Hg isotope ratios on a Nu Plasma MC-
ICPMS. By plotting lnRxxx/198HgM vs. lnR205/203TlM, we can obtain a linear relationship with a slope
of 2.03±0.16 (2σ) for 202/198Hg, which is indistinguishable from theoretical estimate (2.0 for power
law and 2.04 for exponential law) assuming the same fractionation factor from Hg and Tl isotopes.
Table 4 Slopes of linear array of lnRxxx/198Hgm vs. lnR205/203Tlm assuming fractionation factors are identical for
Hg and Tl
196/198Hg 199/198Hg 200/198Hg 201/198Hg 202/198Hg 204/198Hg
Power -0.999428 0.500235 0.999738 1.500206 1.999856 3.000241
Exponential -1.034983 0.514109 1.024891 1.534103 2.039958 3.045278
54
Chapter 4. Sample descriptions and Hg isotope measurements
Figure 14 Plot of ln202/198Hg vs. ln205/203Tl of NIST 3133 Hg standard, secondary standard (UM-Almaden,
BCR176R, NIST2685b) and samples (coal, coal combustion residuals) in a one-day analytical session on Nu
plasma, Pau University, France. All the solutions were measured at ~1 ng/g. The dashed lines represent the
δ202/198Hg values of samples and secondary standards relative to NIST 3133 Hg standard.
4.2.1.2. Sample-standard bracketing
In this method, the mass bias of an unknown sample is linearly interpolated between those of two
NIST 3133 standards measured before and after the sample (Blum and Bergquist, 2007). This
method is more precise when mass fractionation changes smoothly between standards and sample.
The sample and standard should be purified and analyzed under similar conditions to exclude matrix
effects which could shift the Hg mass bias fractionation factor irregularly (Albarède and Beard,
2004). Detailed formula deviations can be found in the experimental section of Chapter 5.
4.2.2. Matrix effect
Sample matrix can shift Hg isotope ratios through spectral (isobaric effect) and non-spectral
interferences.
4.2.2.1. Isobaric effect
55
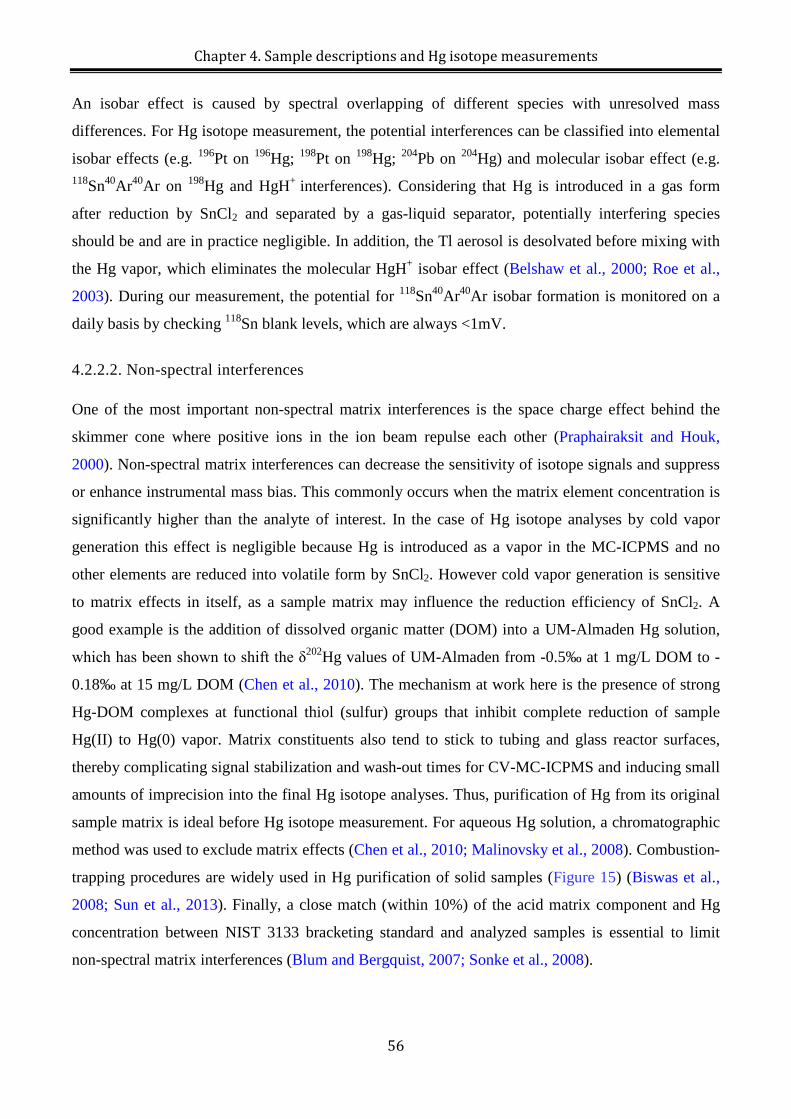
Chapter 4. Sample descriptions and Hg isotope measurements
An isobar effect is caused by spectral overlapping of different species with unresolved mass
differences. For Hg isotope measurement, the potential interferences can be classified into elemental
isobar effects (e.g. 196Pt on 196Hg; 198Pt on 198Hg; 204Pb on 204Hg) and molecular isobar effect (e.g. 118Sn40Ar40Ar on 198Hg and HgH+ interferences). Considering that Hg is introduced in a gas form
after reduction by SnCl2 and separated by a gas-liquid separator, potentially interfering species
should be and are in practice negligible. In addition, the Tl aerosol is desolvated before mixing with
the Hg vapor, which eliminates the molecular HgH+ isobar effect (Belshaw et al., 2000; Roe et al.,
2003). During our measurement, the potential for 118Sn40Ar40Ar isobar formation is monitored on a
daily basis by checking 118Sn blank levels, which are always <1mV.
4.2.2.2. Non-spectral interferences
One of the most important non-spectral matrix interferences is the space charge effect behind the
skimmer cone where positive ions in the ion beam repulse each other (Praphairaksit and Houk,
2000). Non-spectral matrix interferences can decrease the sensitivity of isotope signals and suppress
or enhance instrumental mass bias. This commonly occurs when the matrix element concentration is
significantly higher than the analyte of interest. In the case of Hg isotope analyses by cold vapor
generation this effect is negligible because Hg is introduced as a vapor in the MC-ICPMS and no
other elements are reduced into volatile form by SnCl2. However cold vapor generation is sensitive
to matrix effects in itself, as a sample matrix may influence the reduction efficiency of SnCl2. A
good example is the addition of dissolved organic matter (DOM) into a UM-Almaden Hg solution,
which has been shown to shift the δ202Hg values of UM-Almaden from -0.5‰ at 1 mg/L DOM to -
0.18‰ at 15 mg/L DOM (Chen et al., 2010). The mechanism at work here is the presence of strong
Hg-DOM complexes at functional thiol (sulfur) groups that inhibit complete reduction of sample
Hg(II) to Hg(0) vapor. Matrix constituents also tend to stick to tubing and glass reactor surfaces,
thereby complicating signal stabilization and wash-out times for CV-MC-ICPMS and inducing small
amounts of imprecision into the final Hg isotope analyses. Thus, purification of Hg from its original
sample matrix is ideal before Hg isotope measurement. For aqueous Hg solution, a chromatographic
method was used to exclude matrix effects (Chen et al., 2010; Malinovsky et al., 2008). Combustion-
trapping procedures are widely used in Hg purification of solid samples (Figure 15) (Biswas et al.,
2008; Sun et al., 2013). Finally, a close match (within 10%) of the acid matrix component and Hg
concentration between NIST 3133 bracketing standard and analyzed samples is essential to limit
non-spectral matrix interferences (Blum and Bergquist, 2007; Sonke et al., 2008).
56
Chapter 4. Sample descriptions and Hg isotope measurements
Figure 15 Overview of combustion-trapping system for Hg purification (for more detail, refer to Chapter 5)
References
Albarède, F., Beard, B., 2004. Analytical Methods for Non-Traditional Isotopes, in: Clark M. Johnson, Beard,
B.L., Albarède, F. (Eds.), Geochemistry of non-traditional stable isotopes. Reviews in Mineralogy and
Geochemistry, pp. 113-152.
Bartov, G., Deonarine, A., Johnson, T.M., Ruhl, L., Vengosh, A., Hsu-Kim, H., 2012. Environmental Impacts
of the Tennessee Valley Authority Kingston Coal Ash Spill. 1. Source Apportionment Using Mercury
Stable Isotopes. Environmental Science & Technology 47, 2092-2099.
Belshaw, N.S., Zhu, X.K., Guo, Y., O’Nions, R.K., 2000. High precision measurement of iron isotopes by
plasma source mass spectrometry. International Journal of Mass spectrometry 197, 191-195.
Biswas, A., Blum, J.D., Bergquist, B.A., Keeler, G.J., Xie, Z., 2008. Natural Mercury Isotope Variation in
Coal Deposits and Organic Soils. Environmental Science & Technology 42, 8303-8309.
Blum, J., Bergquist, B., 2007. Reporting of variations in the natural isotopic composition of mercury.
Analytical and Bioanalytic Chemistry 388, 353-359.
Chen, J., Hintelmann, H., Dimock, B., 2010. Chromatographic pre-concentration of Hg from dilute aqueous
solutions for isotopic measurement by MC-ICP-MS. Journal of Analytical Atomic Spectrometry 25,
1402-1409.
Lusilao-Makiese, J., Tessier, E., Amouroux, D., Tutu, H., Chimuka, L., Cukrowska, E.M., 2012. Speciation of
mercury in South African coals. Toxicological & Environmental Chemistry 94, 1688-1706.
Malinovsky, D., Sturgeon, R.E., Yang, L., 2008. Anion-Exchange Chromatographic Separation of Hg for
Isotope Ratio Measurements by Multicollector ICPMS. Analytic Chemistry 80, 2548-2555.
Maréchal, C.N., Télouk, P., Albarède, F., 1999. Precise analysis of copper and zinc isotopic compositions by
plasma-source mass spectrometry. Chemical Geology 156, 251-273.
Mead, C., Johnson, T.M., 2010. Hg stable isotope analysis by the double-spike method. Analytical and
Bioanalytic Chemistry 397, 1529-1538.
57
Chapter 4. Sample descriptions and Hg isotope measurements
NAE&NAC, 2008. Energy Futures and Urban Air Pollution Challenges for China and the United States.
National Academy of Engineering and National Research Council, Washington, DC.
Praphairaksit, N., Houk, R.S., 2000. Reduction of Space Charge Effects in Inductively Coupled Plasma Mass
Spectrometry Using a Supplemental Electron Source inside the Skimmer: Ion Transmission and Mass
Spectral Characteristics. Analytic Chemistry 72, 2356-2361.
Querol, X., Alastuey, A., Lopez-Soler, A., Plana, F., Zeng, R., Zhao, J., Zhuang, X., 1999. Geological controls
on the quality of coals from the West Shandong mining district, Eastern China. International Journal
of Coal Geology 42, 63-88.
Roe, J.E., Anbar, A.D., Barling, J., 2003. Nonbiological fractionation of Fe isotopes: evidence of an
equilibrium isotope effect. Chemical Geology 195, 69-85.
Sonke, J.E., Zambardi, T., Toutain, J.-P., 2008. Indirect gold trap-MC-ICP-MS coupling for Hg stable isotope
analysis using a syringe injection interface. Journal of Analytical Atomic Spectrometry 23, 569-573.
Sun, R., Heimbürger, L.-E., Sonke, J.E., Liu, G., Amouroux, D., Berail, S., 2013. Mercury stable isotope
fractionation in six utility boilers of two large coal-fired power plants. Chemical Geology 336, 103-
111.
Sun, R., Liu, G., Zheng, L., Chou, C.-L., 2010a. Characteristics of coal quality and their relationship with
coal-forming environment: A case study from the Zhuji exploration area, Huainan coalfield, Anhui,
China. Energy 35, 423-435.
Sun, R., Liu, G., Zheng, L., Chou, C.-L., 2010b. Geochemistry of trace elements in coals from the Zhuji Mine,
Huainan Coalfield, Anhui, China. International Journal of Coal Geology 81, 81-96.
Tang, Q., Liu, G., Yan, Z., Sun, R., 2012. Distribution and fate of environmentally sensitive elements (arsenic,
mercury, stibium and selenium) in coal-fired power plants at Huainan, Anhui, China. Fuel 95, 334-
339.
Tewalt, S.J., Belkin, H.E., SanFilipo, J.R., Merrill, M.D., Palmer, C.A., Warwick, P.D., Karlsen, A.W.,
Finkelman, R.B., Park, A.J., comp., 2010. Chemical analyses in the World Coal Quality Inventory,
version 1, U.S. Geological Survey p. 4.
Yang, M., Liu, G., Sun, R., Chou, C.-L., Zheng, L., 2012. Characterization of intrusive rocks and REE
geochemistry of coals from the Zhuji Coal Mine, Huainan Coalfield, Anhui, China. International
Journal of Coal Geology 94, 283-295.
58
Chapter 5. A double-stage tube furnace – acid trapping protocol for the pre-concentration of mercury from solid samples for isotopic analysis
Chapter 5
A double-stage tube furnace – acid trapping protocol for the pre-concentration of mercury from solid samples for isotopic analysis
59
Chapter 5. A double-stage tube furnace – acid trapping protocol for the pre-concentration of mercury from solid samples for isotopic analysis
Chapter 5. A double-stage tube furnace – acid trapping protocol for
the pre-concentration of mercury from solid samples for isotopic
analysis (Analytical and Bioanalytical Chemistry, in press)
Résumé
Ce Chapitre résume le protocole d’extraction, purification and pré-concentration du Hg pour
l’analyse isotopique. La méthode a été développé pour des échantillons solides divers tel que le
charbon, des roches, cendres, tourbes et schistes noirs ayant des teneurs en Hg de <5 ng/g à 10 μg/g.
Suivant des optimisations du mélange acide (HNO3/HCl), flux et type de gaz vecteur, et rampe de
température, nous recommandons l’utilisation de 40% (v/v) 2HNO3/1HCl dans le piège acide, 25
ml/min O2 en gaz vecteur et un programme dynamique de rampe de température (15 °C/min for 25-
150 °C and 600-900 °C; 2.5 °C/min for 150-600 °C) pour le 1ier four de combustion. Le 2ieme four, le
pyrolyseur, est maintenu à 1000 °C durant tous les extractions du Hg. Nous avons testé et effectué
340 extractions de Hg durant 20 mois, montrant une efficacité d’extraction de 89% (médiane) pour
les différents types d’échantillons. L’extraction des matériaux de référence montre une absence de
biais isotopique pour des rendements entre 81-102%. Ce protocole a l’avantage d’être rapide (3.5h),
d’éviter le transfert de la matrice vers le piège acide, et permets une analyse directe des compositions
isotopiques par spectrométrie de masse après dilution à 20% (v/v) acide. Cependant, nous avons
remarqué des transferts rares de l’iode de la matrice du charbon vers le piège acide, posant des
problèmes de réduction du Hg dans le générateur à vapeur froide du spectromètre de masse.
60
Chapter 5. A double-stage tube furnace – acid trapping protocol for the pre-concentration of mercury from solid samples for isotopic analysis
61
Chapter 5. A double-stage tube furnace – acid trapping protocol for the pre-concentration of mercury from solid samples for isotopic analysis
62
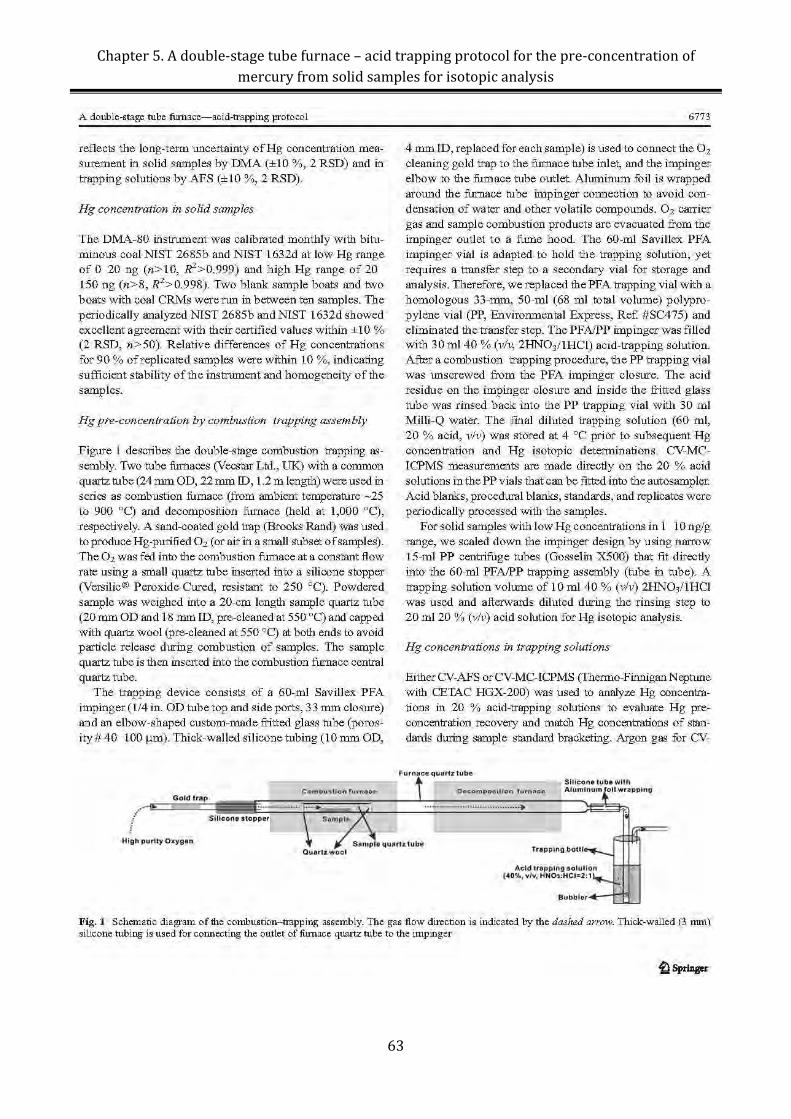
Chapter 5. A double-stage tube furnace – acid trapping protocol for the pre-concentration of mercury from solid samples for isotopic analysis
63
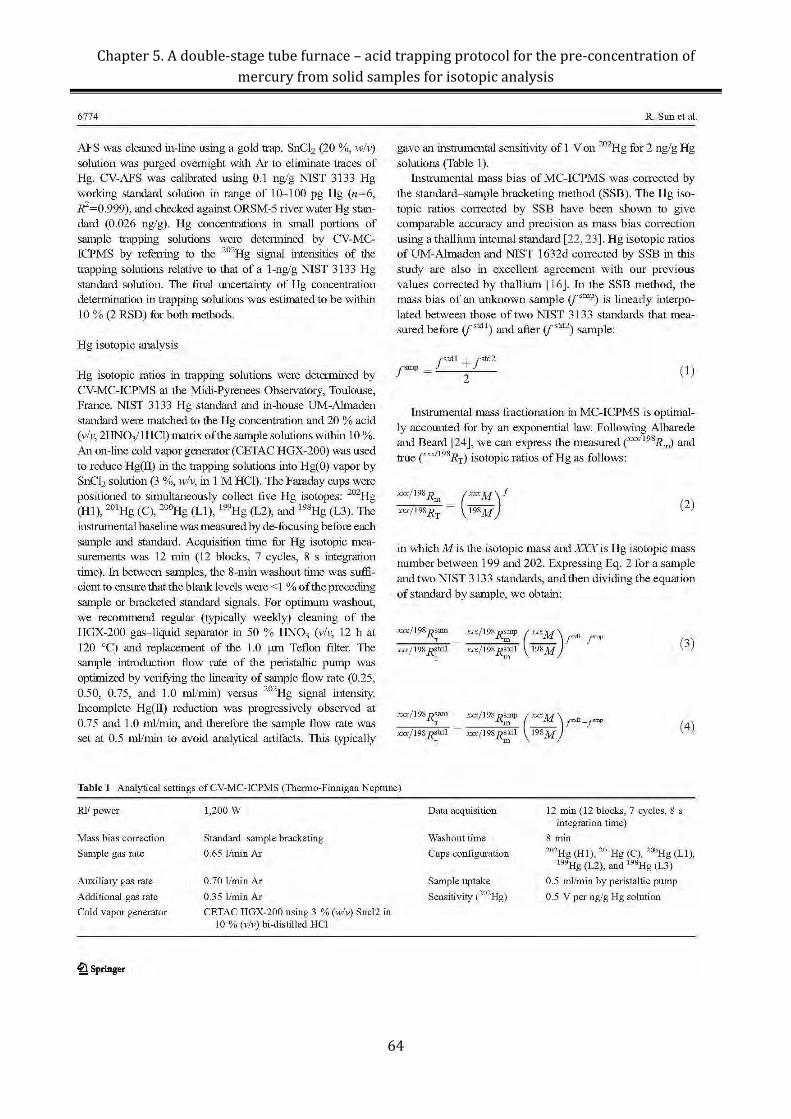
Chapter 5. A double-stage tube furnace – acid trapping protocol for the pre-concentration of mercury from solid samples for isotopic analysis
64
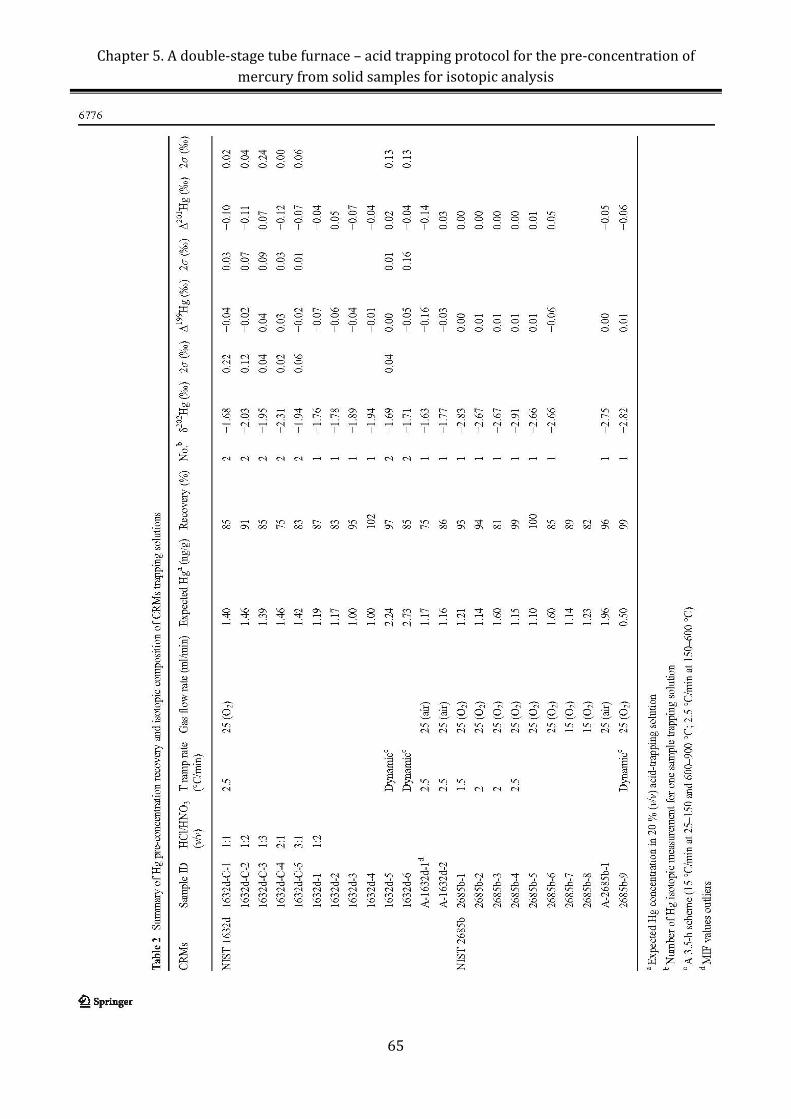
Chapter 5. A double-stage tube furnace – acid trapping protocol for the pre-concentration of mercury from solid samples for isotopic analysis
65
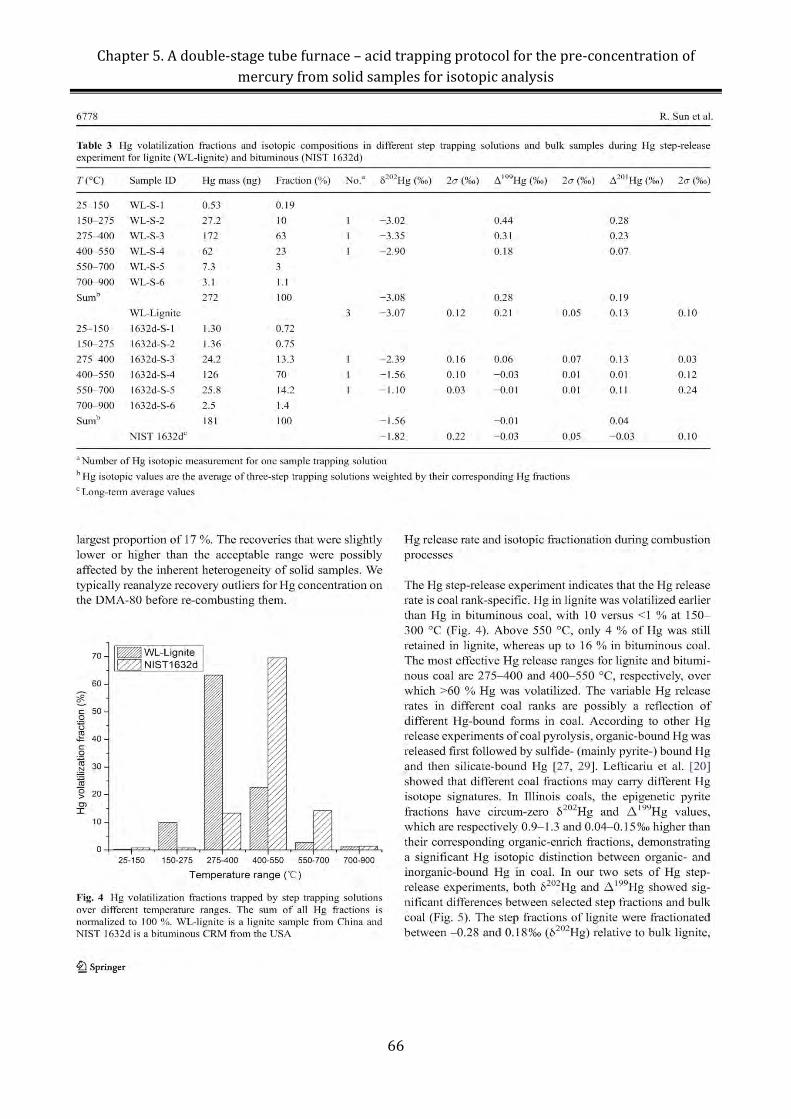
Chapter 5. A double-stage tube furnace – acid trapping protocol for the pre-concentration of mercury from solid samples for isotopic analysis
66
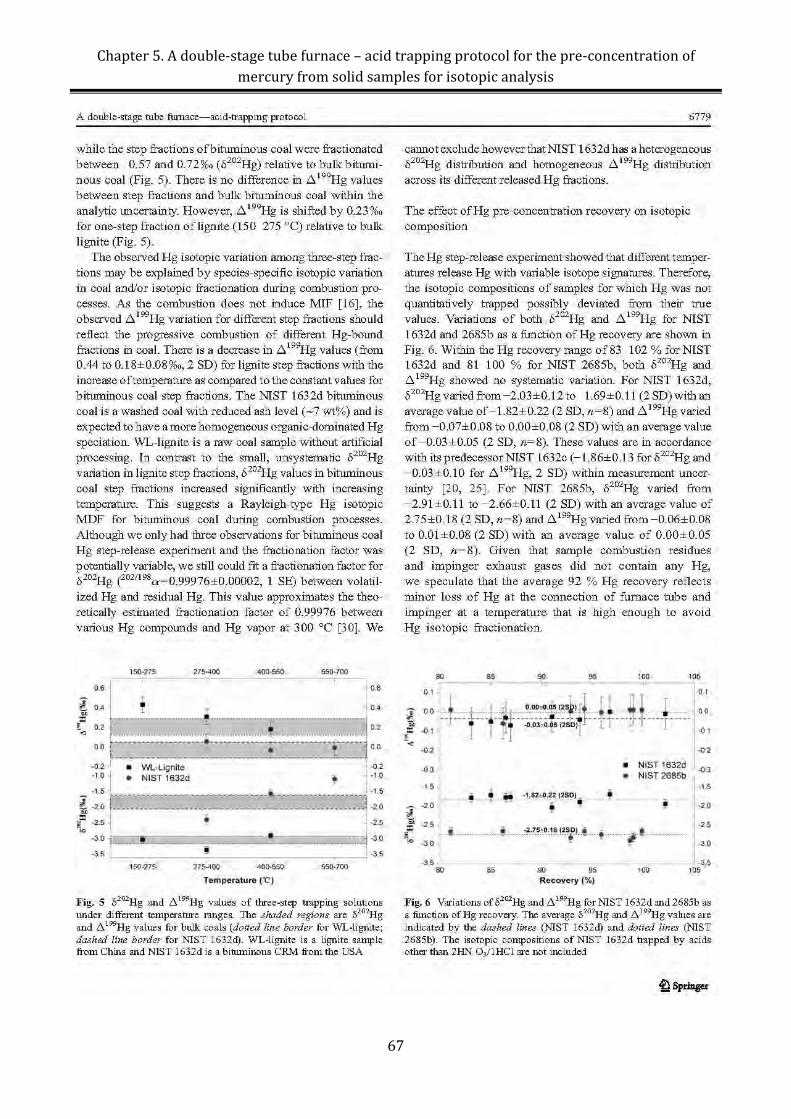
Chapter 5. A double-stage tube furnace – acid trapping protocol for the pre-concentration of mercury from solid samples for isotopic analysis
67
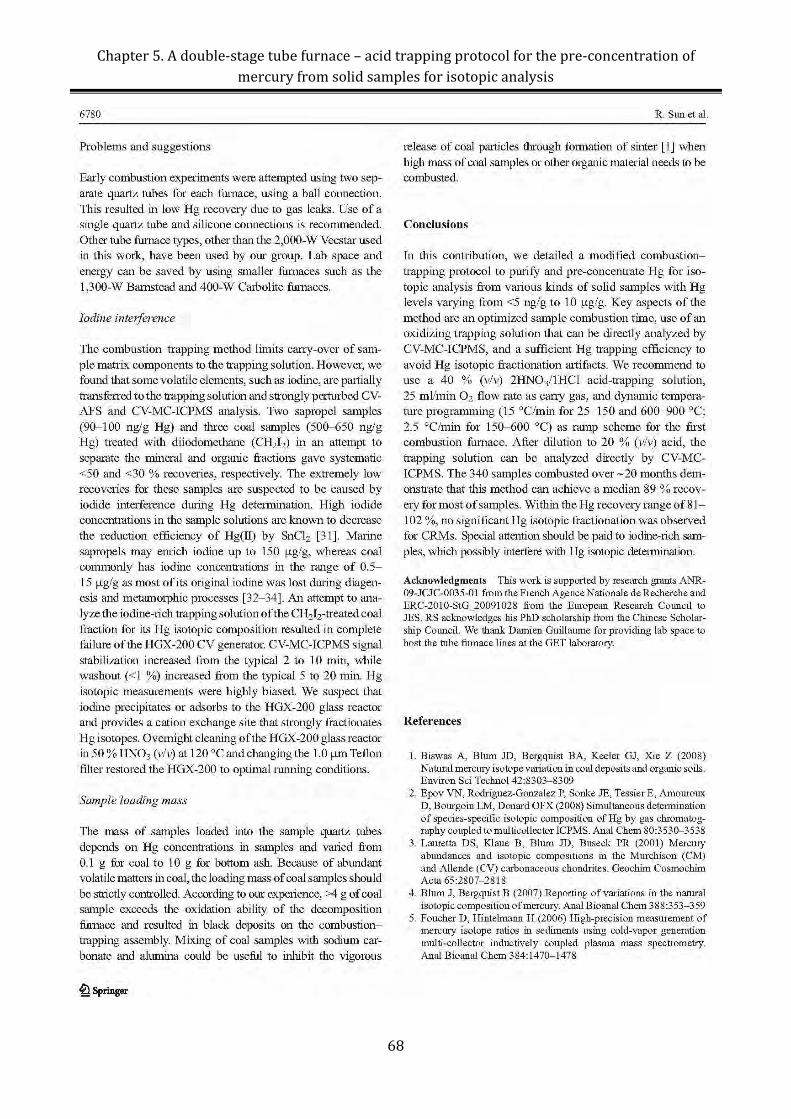
Chapter 5. A double-stage tube furnace – acid trapping protocol for the pre-concentration of mercury from solid samples for isotopic analysis
68
Chapter 5. A double-stage tube furnace – acid trapping protocol for the pre-concentration of mercury from solid samples for isotopic analysis
69
Chapter 6. Hg stable isotope variations in coal-bearing sequences and its implication for Hg sources and geochemistry in coal
Chapter 6
Hg stable isotope variations in coal-bearing sequences and its implication for Hg sources and geochemistry in coal
70
Chapter 6. Hg stable isotope variations in coal-bearing sequences and its implication for Hg sources and geochemistry in coal
Chapter 6. Hg stable isotope variations in coal-bearing sequences
and its implication for Hg sources and geochemistry in coal (article
in preparation)
Résumé
Ce Chapitre fait l’objet d’une étude de cas sur le fractionnement isotopique du Hg au sein d’une
séquence de charbons déposé au même endroit géographique. Le but était d’explorer les signatures
isotopiques du Hg comme traceurs des sources ou processus du Hg dans le charbon. Nous observons
une variation ~2‰ en δ202Hg (−1.62 to 0.44±0.12‰, 2SD, n=18) et de 0.35‰ en Δ199Hg (−0.12 to
0.22±0.08‰, 2SD, n=18) au sein des couches de charbons déposées pendant 20 Ma (Mine de Zhuji,
basin de Huainan, province d’Anhui, Chine). Une même variation est observée au sein d’une seule
couche de charbon (mine de Daizhuang, basin de Jining, province de Shandong, Chine). Une
corrélation entre le δ202Hg et 1/Hg a Zhuji suggère une mélange binaire entre deux sources de Hg,
témoignant d’un décalage dans la source dominante du Hg dans le bassin de Huainan. Dans la
couche de charbon de Daizhuang aucune relation claire ne parait entre δ202Hg vs. 1/Hg. Enfin, des
cokes naturels, une forme métamorphosé du charbon au contact avec des intrusions magmatiques,
montre un fort fractionnement isotopique dépendent de la masse, avec δ202Hg élevé (0.70 to
0.91±0.12‰, 2SD, n=2) ou plus bas (−4.00 to −3.47±0.12‰, 2SD, n=3).
71
Chapter 6. Hg stable isotope variations in coal-bearing sequences and its implication for Hg sources and geochemistry in coal
Hg stable isotope variations in coal-bearing sequences and its implication for Hg sources and
geochemistry in coal
Sun Ruoyu1*, Sonke E. Jeroen1, Liu Guijian2
1Observatoire Midi-Pyrénées, Laboratoire Géosciences Environnement Toulouse,
CNRS/IRD/Université de Toulouse, France
2CAS Key Laboratory of Crust-Mantle Materials and Environment, School of Earth and Space
Sciences, University of Science and Technology of China, Hefei, Anhui 230026, China
Abstract
The sources and geochemical processes that control mercury (Hg) occurrences in coal deposits are a
topic of debate. Hg stable isotope signatures are a useful tool to trace Hg provenances and
transformation mechanisms. Here, we explore the variations in Hg isotope compositions in coal
benches of a single coal seam (Daizhuang Coal Mine, Jining Coalfield, Shandong Province), and
coals seams of a 20 Ma spanning coal-bearing sequence (Zhuji Coal Mine, Huainan Coalfield, Anhui
Province) to assess the potential of using Hg isotope ratios as the geochemical tracer in coal deposits.
Coal benches of the Daizhuang No. 3-1 coal seam varied from −2.34 to −0.25±0.12‰ in δ202Hg
(2SD, n=8), with no significant mass independent Hg isotope fractionation (MIF) in most samples
(−0.04 to 0.12±0.08‰ for Δ199Hg, 2SD, n=8). In contrast, Zhuji coal seams were enriched in the
heavier Hg isotopes (−1.62 to 0.44±0.12‰ for δ202Hg, 2SD, n=18), with significant MIF in the
younger No’s 7-11 coal seams (from 0.06 to 0.22±0.08‰ for Δ199Hg, 2SD, n=7). Increasing trends
were seen for both Hg concentrations and δ202Hg going from older to younger Zhuji coal seams. The
significant (r2=0.77, p=0.002) correlation of δ202Hg vs. 1/Hg suggests that Hg in Zhuji coal possibly
reflects the mixing of two end-members with distinct δ202Hg. Natural cokes, a metamorphosed form
of coal, have either distinctly higher (0.7 to 0.91±0.12‰, 2SD, n=2) or lower δ202Hg (−4.00 to
−3.47±0.12‰, 2SD, n=3) than coal samples, demonstrating that significant Hg isotope fractionation
occurred when coals were subjected to the perturbation of magmatic intrusions.
*Corresponding author: Ruoyu Sun, E-mail: [email protected]
72

Chapter 6. Hg stable isotope variations in coal-bearing sequences and its implication for Hg sources and geochemistry in coal
6.1. Introduction
Mercury (Hg) is a naturally occurring toxic element. As a geological sink for atmospheric, aquatic,
sedimentary and hydrothermal Hg inputs, coal is commonly several folds enriched in Hg as
compared to sedimentary host rocks (Dai et al., 2012a; Ketris and Yudovich, 2009) In some
geological-active areas such as Southwest China and Eastern Russia, Hg can be locally enriched by
several orders of magnitude through coal matrix sequestration of Hg-bearing hydrothermal fluids
(Yudovich and Ketris, 2005). The utilization of coal for heat and electricity generation and for
industrial production of raw materials has emitted large amounts of historically fixed Hg to the
atmosphere (Pacyna et al., 2010) At present, coal combustion contributes to approximate half of
anthropogenic Hg emissions into the atmosphere, with an annual emission flux of 700-900 tons
(Pacyna et al., 2010; Pirrone et al., 2010; Streets et al., 2011).
Extensive studies have been conducted on Hg abundances, affinities and geological provenances in
coal and its associated rocks (i.e. coal roof, parting and floor) (e.g. Hower et al., 2005b; Quick et al.,
2003; Toole-O'Neil et al., 1999; Yudovich and Ketris, 2005; Zheng et al., 2007a, and references
therein). Hg in coal varies significantly, up to several orders of magnitude, among different
countries, coal basins, coal mines and even benches within individual coal seams. Although Hg
affinities for coal also vary largely, the reduced-sulfur groups in plant-derived organic matter and
inorganic sulfide minerals (primarily pyrite) are commonly identified as the main Hg carriers in coal
(Diehl et al., 2004b; Hower et al., 2008; Yudovich and Ketris, 2005). The controlling factors that
influence Hg accumulation and migration in coal-forming swamps are still a matter of debate, and
quantitative tracing of primary Hg sources in coal seams is subject to large uncertainty (Toole-O'Neil
et al., 1999; Yudovich and Ketris, 2005). Therefore, an appropriate and robust tracer is needed to
help constrain the geochemical controls on Hg occurrences in coal.
Recent advances in multiple collectors inductively coupled plasma mass spectrometry (MC-ICPMS)
and associated techniques (e.g. sample preparation, purification and introduction) have allowed high-
precision determination of Hg stable isotope ratios in natural samples with Hg concentrations down
to ultra-trace levels (Blum and Bergquist, 2007; Chen et al., 2010; Lauretta et al., 2001). Both mass-
dependent Hg isotope fractionation (MDF, indicated by δ202Hg) and mass-independent Hg isotope
fractionation (MIF, odd 199Hg and 201Hg isotopes mostly, indicated by Δ199Hg) vary within a range of
10‰ in geological and environmental samples (Bergquist and Blum, 2009; Sonke, 2011, Yin et al.,
2010). In addition, observations on atmospheric precipitations (snow and rain) also show up to 1‰
73
Chapter 6. Hg stable isotope variations in coal-bearing sequences and its implication for Hg sources and geochemistry in coal
variation of MIF of even Hg isotopes (indicated by Δ200Hg) (Chen et al., 2012; Gratz et al., 2010;
Sherman et al., 2011). Measurable Hg MDF is caused by most biogeochemical processes that affect
Hg, such as reduction (biotic and abiotic), oxidation, adsorption, condensation, evaporation,
volatilization, methylation and demethylation (Bergquist and Blum, 2007; Estrade et al., 2009; Kritee
et al., 2007; Zheng et al., 2007b; Zheng and Hintelmann, 2010). Previous work has shown that
significant Hg isotope variation, as large as 3.5‰ for δ202Hg and 1‰ for Δ199Hg, occurs in coal
deposits worldwide (Biswas et al., 2008; Lefticariu et al., 2011; Sherman et al., 2011; Sun et al.,
2013a). By using the combination of δ202Hg and Δ199Hg signatures, it has been demonstrated that
coals from different countries, coal deposits and coal seams are broadly distinguishable (Biswas et
al., 2008; Lefticariu et al., 2011). In addition, the main Hg carriers, i.e. hydrothermal pyrite and
organic matter, may possess characteristic and distinguishable Hg isotope signatures (Lefticariu et
al., 2011). These observations highlight the potential of Hg isotope signatures to trace Hg sources
and occurrences in coal, and to understand the geochemical processes controlling Hg migration and
accumulation in coal basins.
Here, we systematically collected low-sulfur (<1 wt.%) coal samples, natural cokes, and coal
associated rocks from 12 Permian coal seams in two well-documented coal-bearing strata of Huainan
Coalfield and Jining Coalfield, North China (Figure 7). Our study focuses on: 1) Hg isotope
characterization of coals deposited in different coalfields and coal-forming periods; 2) identification
of Hg provenances and geochemical processes occurring during and after coal deposition and; 3) the
impact of high-temperature magmatic intrusion events on Hg isotope fractionation in coal.
6.2. Study area
The Huainan Coalfield and Jining Coalfield, located respectively in northern Anhui and western
Shandong provinces, are ones of the most active coal-producing districts in China (Figure 7).
Abundant Permo-Carboniferous bituminous coal with middle-high volatile matters (35-40 wt.%, dry
ash-free basis) and calorific values (20-30 kJ/kg, dry basis) occur underground in both coalfields
(Liu et al., 2005; Sun et al., 2010a, b). The Zhuji Coal Mine (ZJ, covering an area of 45 Km2 with a
coal reserve of 947 Mt) and Daizhuang Coal Mine (DZ, covering an area of 66 Km2 with a coal
reserve 370 Mt) in these two coalfields were selected in the present study. The sampled coals
generally have <1 wt.% total sulfur contents (average values is ~0.5% for No’s. 1 to 11-2 coal seams
of ZJ and ~0.7% for No. 3-1 coal seam of DZ, Figure 8), classifying them as low-sulfur coal. Coal
macerals are dominated by vitrinite (>50%) followed by inertinite (<30%) and liptinite (<10%). In
74
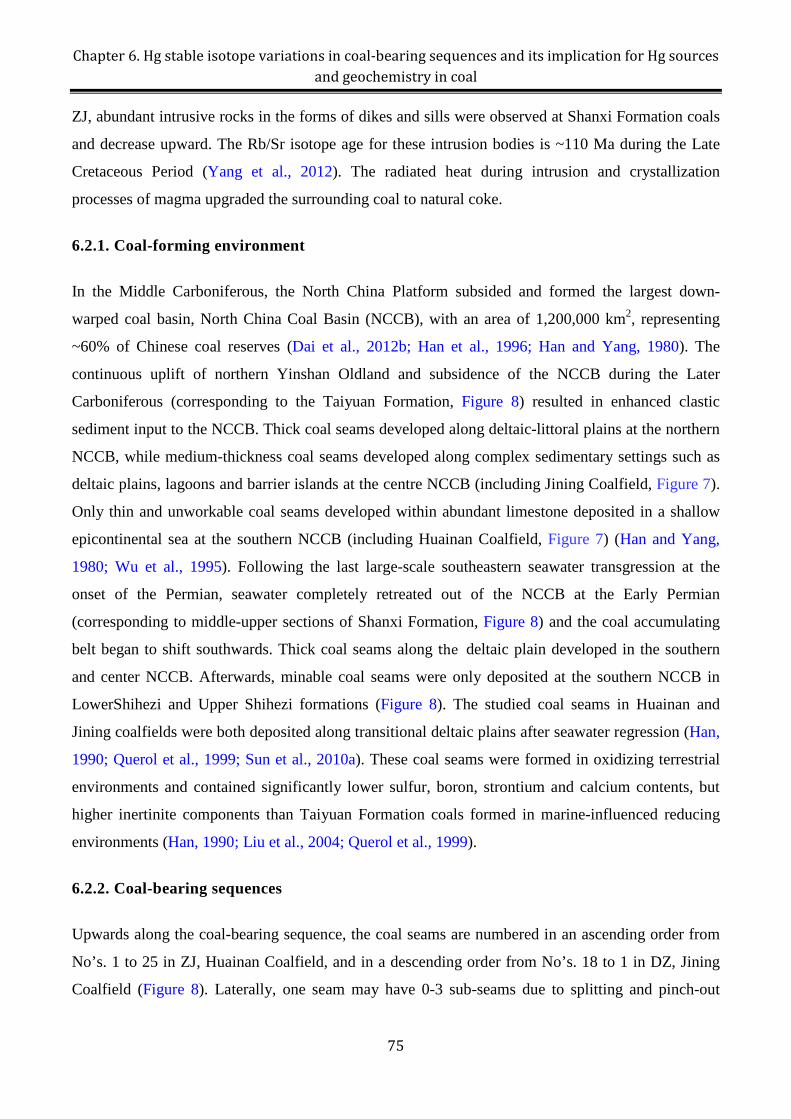
Chapter 6. Hg stable isotope variations in coal-bearing sequences and its implication for Hg sources and geochemistry in coal
ZJ, abundant intrusive rocks in the forms of dikes and sills were observed at Shanxi Formation coals
and decrease upward. The Rb/Sr isotope age for these intrusion bodies is ~110 Ma during the Late
Cretaceous Period (Yang et al., 2012). The radiated heat during intrusion and crystallization
processes of magma upgraded the surrounding coal to natural coke.
6.2.1. Coal-forming environment
In the Middle Carboniferous, the North China Platform subsided and formed the largest down-
warped coal basin, North China Coal Basin (NCCB), with an area of 1,200,000 km2, representing
~60% of Chinese coal reserves (Dai et al., 2012b; Han et al., 1996; Han and Yang, 1980). The
continuous uplift of northern Yinshan Oldland and subsidence of the NCCB during the Later
Carboniferous (corresponding to the Taiyuan Formation, Figure 8) resulted in enhanced clastic
sediment input to the NCCB. Thick coal seams developed along deltaic-littoral plains at the northern
NCCB, while medium-thickness coal seams developed along complex sedimentary settings such as
deltaic plains, lagoons and barrier islands at the centre NCCB (including Jining Coalfield, Figure 7).
Only thin and unworkable coal seams developed within abundant limestone deposited in a shallow
epicontinental sea at the southern NCCB (including Huainan Coalfield, Figure 7) (Han and Yang,
1980; Wu et al., 1995). Following the last large-scale southeastern seawater transgression at the
onset of the Permian, seawater completely retreated out of the NCCB at the Early Permian
(corresponding to middle-upper sections of Shanxi Formation, Figure 8) and the coal accumulating
belt began to shift southwards. Thick coal seams along the deltaic plain developed in the southern
and center NCCB. Afterwards, minable coal seams were only deposited at the southern NCCB in
LowerShihezi and Upper Shihezi formations (Figure 8). The studied coal seams in Huainan and
Jining coalfields were both deposited along transitional deltaic plains after seawater regression (Han,
1990; Querol et al., 1999; Sun et al., 2010a). These coal seams were formed in oxidizing terrestrial
environments and contained significantly lower sulfur, boron, strontium and calcium contents, but
higher inertinite components than Taiyuan Formation coals formed in marine-influenced reducing
environments (Han, 1990; Liu et al., 2004; Querol et al., 1999).
6.2.2. Coal-bearing sequences
Upwards along the coal-bearing sequence, the coal seams are numbered in an ascending order from
No’s. 1 to 25 in ZJ, Huainan Coalfield, and in a descending order from No’s. 18 to 1 in DZ, Jining
Coalfield (Figure 8). Laterally, one seam may have 0-3 sub-seams due to splitting and pinch-out
75
Chapter 6. Hg stable isotope variations in coal-bearing sequences and its implication for Hg sources and geochemistry in coal
effects. The Carboniferous coal seams in Huainan Coalfield are thin and unworkable. The Permian
strata in ZJ comprise coal seams No’s. 1-3 in the Shanxi Formation (mean thickness of 67.5 m in
range of 52.6-82.3 m), No’s. 4-9 in the Lower Shihezi Formaton (mean thickness of 517.7 m in range
of 480.6-554.7 m) and No’s. 10-25 in the Upper Shihezi Formation (mean thickness of 145.6 m in
range of 116.7-162.1 m). Coal seams of No’s. 17-1, 16-2, 13-1, 11 (splitting into 11-2 and 11-1), 8,
7-2, 6, 5 (splitting into 5-2 and 5-1), 4 (splitting into 4-2 and 4-1) and 3 are economically minable.
The total minable thickness is about 21.6 m. The major coal seams of the Jining Coalfield occurred
in the Upper Carboniferous Taiyuan Formation (mean thickness of 165.6 m in range of 148.2-193.4
m, comprising coal seams No’s. 18 to 4) and the Lower Permian Shanxi Formation (mean thickness
of 75.6 m in range of 59.9-114.7 m, comprising coal seams No’s. 3 to 2). Coal seams No’s. 17, 16,
15-2, 6, 3-2, 3-1 are economically minable. The total minable thickness is about 8.4 m. A detailed
description of stratigraphic and lithological characteristics of coal-bearing sequences in both coal
mines can be found elsewhere (Liu et al., 2005; Sun et al., 2010a, b).
6.3. Samples and analyses
6.3.1. Sample collection
Two sampling strategies were used for sample collection. In the first one, 43 bench coal samples and
5 natural coke samples were taken from No’s. 1, 3, 4-1, 4-2, 5-1, 5-2, 6, 7-2, 8, 11-1 and 11-2 coal
seams in borehole cores of ZJ (Table 5, Table 6 and Figure 8). Most of the samples were collected
from coal seams in borehole #12-8 (the distribution of boreholes can be found in Figure 2 of Sun et
al., 2010b).
Table 5 Ash yield, sulfur and iron content, Hg concentration and δ13C values of coal and coke samples in the
Zhuji Coal Mine, Huainan Coalfield
Coal seam Sample ID Sample lithology Ash yield (%) S (%) Fe (%) Hg (ng/g) δ13C 2σ
11-2
ZJ-12-8-11-2U Coal 15.5 0.36 1.72 59 -24.2 ZJ-12-8-11-2M Coal 38.9 0.57 1.95 168 -24.5 ZJ-12-8-11-2D Coal 17.2 0.29 1.94 57 -24.3 ZJ-7-8-11-2U Coal 14.3 0.37 0.59 71 -24.4 ZJ-7-8-11-2M Coal 33.3 0.63 2.01 357
ZJ-7-8-11-2D Coal 13.2 0.31 1.15 51
11-1 ZJ-7-8-11-1U Coal 25.4 0.69 2.23 144
-24.4 0.07 ZJ-7-8-11-1M Coal 26.5 0.53 2.92 93 ZJ-7-8-11-1D Coal 22.9 0.59 0.85 228
8 ZJ-12-8-8U Coal 18.7 0.61 1.55 169 -23.1 ZJ-12-8-8M Coal 19.1 0.23 1.54 55 -24.2 ZJ-12-8-8D Coal 19.6 0.3 2.18 47 -24.0 1.1
7-2 ZJ-12-8-7-2U Coal 21.7 0.26 2.23 38 -24.0 ZJ-12-8-7-2M Coal 21.9 0.29 1.29 25 -26.0 0.2 ZJ-12-8-7-2D Coal 18.5 0.24 1.83 42 -24.2
76
Chapter 6. Hg stable isotope variations in coal-bearing sequences and its implication for Hg sources and geochemistry in coal
ZJ-20-4-7-2U Coal 24.3 0.19 1.95 149 -23.8 ZJ-20-4-7-2M Coal 14.0 0.27 0.90 48
ZJ-20-4-7-2D Coal 16.5 0.26 10.01 63 ZJ-12-6-7-2-U-J Natural coke 18.0 52
6
ZJ-12-6-6U Coal 15.3 0.32 6.93 43 -24.6 ZJ-12-6-6M Coal 22.3 0.3 3.30 75
ZJ-12-6-6D Coal 27.4 0.25 6.62 36 ZJ-12-8-6U Coal 21.2 0.41 1.68 150 -24.8 ZJ-12-8-6M Coal 27.6 0.82 4.25 125 -23.7 ZJ-12-8-6D Coal 24.6 0.43 2.89 52 -24.0
5-2 ZJ-12-8-5-2U Coal 17.1 0.55 2.88 54 -24.2 ZJ-12-8-5-2M Coal 21.5 0.37 2.06 51 -24.2 ZJ-12-8-5-2D Coal 16.7 0.5 1.48 27 -24.5
5-1 ZJ-12-8-5-1U Coal 26.7 0.9 4.17 163 -23.6 ZJ-12-8-5-1M Coal 21.1 0.37 1.92 44 -26.1 ZJ-12-8-5-1D Coal 21.6 0.54 2.87 52 -26.0
4-2
ZJ-12-8-4-2U Coal 28.8 0.1 4.49 22 -24.2 ZJ-12-8-4-2M Coal 19.0 0.2 1.48 55 -24.1 ZJ-12-8-4-2D Coal 13.9 0.56 0.41 23 -24.9 ZJ-14-5-4-2-D-J Natural coke 10.8 0.43 0.86 23
4-1 ZJ-12-8-4-1U Coal 15.0 0.45 1.15 36 -24.4 ZJ-12-8-4-1M Coal 18.8 0.41 2.05 31 -24.5 ZJ-12-8-4-1D Coal 21.2 0.37 1.99 37 -23.9
3
ZJ-12-6-3U Coal 26.6 0.64 3.89 98 ZJ-12-6-3M Coal 17.8 0.31 3.14 21 ZJ-12-6-3D Coal 11.1 0.29 1.91 17 -24.6 ZJ-E4-3U Coal 0.29 0.45 39 ZJ-8+1-3U-J Natural coke 54.8 0.11 1.99 75 ZJ-8-5-3U-J Natural coke 17.5 0.27 0.32 445 ZJ-8-5-3D-J Natural coke 37.5 0.27 0.69 103
1 ZJ-9+1-1U Coal 47.3 0.32 2 95 ZJ-9+1-1M Coal 74.7 0.14 5.69 104 ZJ-9+1-1D Coal 65.6 0.32 4.56 113
Note: sample ID indicates the name of the coal mine followed by borehole number, coal seam number and relative location of
bench (and sample lithology). ZJ: Zhuji Coal Mine; U, M and D: the upper, middle and lower benches of each coal seam; J:
natural coke; n1: sample replicates for Hg concentration determination; n2-replicate analyses of the sample for δ13C
Additional samples from other boreholes were sampled to complement the unavailable coal seams in
borehole #12-8 due to undesirable coal-forming environments, and to increase the representativeness
of coal seams. Generally, three samples (each of ~200 g) were collected from each coal seam,
namely upper, middle and lower benches, in line with their relative locations in individual coal
seams. As compared to the coal samples, the natural coke samples are significantly lower in bulk
density. In addition, natural cokes are fragmental in structure with abundant fracture development.
Intrusive dikes of granite porphyry and gabbro can be found in contact with cokes or as interlayer
between coal associated rocks. In the second sampling, 8 bench coal samples (DZ-3-1-C3 to DZ-3-1-
C10), 1 siltstone (DZ-3-1-R1) and 1 mudstone (DZ-3-1-R2) that underlie coal benches were sampled
from No. 3-1 coal seam in DZ (Table 7 and Figure 8). An interlayer of mudstone and carbonaceous
mudstone parting (~20 cm) occurred between coal benches DZ-3-1-C5 and DZ-3-1-C6. Bench
coalsamples of uniform sizes (20 cm thickness × 5 cm depth) were cut upward from a 2 m fresh
working face. All samples were immediately sealed in plastic bags to prevent contamination and
77
Chapter 6. Hg stable isotope variations in coal-bearing sequences and its implication for Hg sources and geochemistry in coal
weathering. Upon transport to the laboratory, bulk samples were air-dried, crushed and sieved to
<120 μm particles for subsequent analyses. Table 6 Hg isotope compositions of coal and coke samples in Zhuji Coal Mine, Huainan Coalfield
Sample ID Hg (ng/g)
δ199Hg (‰)
2σ (‰)
δ200Hg (‰)
2σ (‰)
δ201Hg (‰)
2σ (‰)
δ202Hg (‰)
2σ (‰)
Δ199Hg (‰)
2σ (‰)
Δ200Hg (‰)
2σ (‰)
Δ201Hg (‰)
2σ (‰)
ZJ-12-8-11-2 95 0.19 0.27 0.39 0.44 0.31 0.08 0.05 0.06 ZJ-7-8-11-2 160 -0.06 -0.20 -0.31 -0.49 0.06 0.05 0.06
ZJ-7-8-11-1U 144 -0.01 0.09 -0.14 0.09 -0.10 0.12 -0.31 0.15 0.07 0.05 0.02 0.02 0.14 0.01 ZJ-7-8-11-1M 93 -0.08 -0.38 -0.54 -0.93 0.16 0.09 0.16
ZJ-12-8-8 90 0.04 -0.06 -0.01 -0.19 0.09 0.03 0.13 ZJ-12-8-7-2 35 0.04 0.02 -0.02 0.03 -0.08 0.06 -0.21 0.08 0.09 0.04 0.08 0.01 0.07 0.00 ZJ-20-4-7-2 87 0.06 0.03 -0.25 0.03 -0.27 0.01 -0.66 0.01 0.22 0.03 0.08 0.04 0.23 0.02 ZJ-12-6-6 51 -0.06 0.03 -0.06 0.02 -0.09 0.01 -0.19 0.04 -0.01 0.04 0.04 0.04 0.05 0.04 ZJ-12-8-6 109 -0.20 -0.33 -0.52 -0.71 -0.03 0.02 0.02
ZJ-12-8-5-2 44 -0.18 0.04 -0.40 0.04 -0.63 0.09 -0.91 0.15 0.05 0.00 0.06 0.03 0.06 0.02 ZJ-12-8-5-1 86 -0.07 0.04 -0.13 0.02 -0.23 0.05 -0.30 0.03 0.00 0.03 0.02 0.01 0.00 0.07 ZJ-12-8-4-2 33 0.06 0.09 0.10 0.05 0.19 0.13 0.15 0.04 0.02 0.08 0.03 0.03 0.08 0.11 ZJ-12-8-4-1 35 -0.27 0.03 -0.59 0.00 -0.85 0.01 -1.27 0.01 0.05 0.02 0.05 0.01 0.10 0.02 ZJ-12-6-3 45 -0.21 -0.36 -0.61 -0.78 -0.02 0.02 -0.02 ZJ-E4-3U 39 -0.28 0.07 -0.33 0.05 -0.69 0.12 -0.63 0.03 -0.12 0.07 -0.01 0.04 -0.21 0.09 ZJ-9+1-1U 95 -0.29 0.11 -0.85 0.06 -1.25 0.21 -1.62 0.10 0.11 0.08 -0.04 0.01 -0.03 0.14 ZJ-9+1-1M 104 -0.12 0.02 -0.35 0.06 -0.57 0.01 -0.68 0.06 0.05 0.00 -0.01 0.03 -0.06 0.06 ZJ-9+1-1D 113 -0.21 0.05 -0.36 0.00 -0.68 0.02 -0.75 0.01 -0.02 0.04 0.01 0.01 -0.12 0.01 ZJ-8-5-3U-J 445 0.17 0.04 0.39 0.07 0.49 0.19 0.91 0.05 -0.06 0.02 -0.07 0.04 -0.20 0.15 ZJ-8-5-3D-J 103 -0.90 0.07 -2.03 0.08 -3.09 0.12 -4.00 0.07 0.11 0.05 -0.02 0.04 -0.09 0.07 ZJ-8+1-3U-J 75 -0.72 0.10 -1.74 0.12 -2.53 0.21 -3.47 0.10 0.15 0.08 0.00 0.07 0.08 0.13
ZJ-14-5-4-2-D-J 23 -0.80 0.04 -1.99 0.01 -2.87 0.12 -3.93 0.06 0.19 0.02 -0.01 0.02 0.09 0.07 ZJ-12-6-7-2-U-J 52 0.17 0.03 0.35 0.08 0.52 0.15 0.70 0.05 -0.01 0.02 0.00 0.05 0.00 0.11
Table 7 Hg concentrations and isotope compositions of coal and rock samples in Daizhuang Coal Mine,
Jining Coalfield
Sample ID Hg (ng/g)
Sample Lithology
δ199Hg (‰)
2σ (‰)
δ200Hg (‰)
2σ (‰)
δ201Hg (‰)
2σ (‰)
δ202Hg (‰)
2σ (‰)
Δ199Hg (‰)
2σ (‰)
Δ200Hg (‰)
2σ (‰)
Δ201Hg (‰)
2σ (‰)
DZ-3-1-R1 39 Sandstone -0.19 0.04 -0.34 0.03 -0.51 0.02 -0.70 0.03 -0.01 0.04 0.01 0.01 0.02 0.04 DZ-3-1-R2 205 Mudstone -0.24 0.03 -0.37 0.07 -0.58 0.03 -0.79 0.05 -0.04 0.04 0.02 0.10 0.01 0.01 DZ-3-1-C3 104 Coal -0.48 0.01 -1.16 0.02 -1.62 0.04 -2.34 0.05 0.11 0.02 0.02 0.05 0.14 0.01 DZ-3-1-C4 139 Coal -0.34 0.05 -0.85 0.01 -1.29 0.02 -1.82 0.03 0.12 0.06 0.07 0.02 0.09 0.01 DZ-3-1-C5 754 Coal -0.22 0.02 -0.45 0.03 -0.77 0.01 -1.05 0.03 0.05 0.02 0.08 0.05 0.03 0.03 DZ-3-1-C6 86 Coal -0.02 0.02 -0.01 0.06 -0.11 0.05 -0.12 0.08 0.01 0.00 0.05 0.02 -0.02 0.02 DZ-3-1-C7 114 Coal -0.10 0.08 -0.16 0.14 -0.38 0.11 -0.50 0.10 0.02 0.05 0.09 0.08 0.00 0.03 DZ-3-1-C8 85 Coal -0.01 0.08 -0.07 0.00 -0.16 0.03 -0.25 0.00 0.05 0.08 0.05 0.00 0.03 0.03 DZ-3-1-C9 578 Coal -0.35 0.01 -0.78 0.02 -1.13 0.04 -1.65 0.01 0.07 0.02 0.05 0.02 0.11 0.04
DZ-3-1-C10 522 Coal -0.31 0.04 -0.67 0.03 -1.03 0.07 -1.43 0.12 0.05 0.07 0.05 0.09 0.05 0.02
DZ-3-1-C5-F 630 Coal float fraction -0.32 0.04 -0.69 0.02 -1.03 0.07 -1.45 0.05 0.04 0.03 0.03 0.00 0.06 0.04
DZ-3-1-C9-F 500 Coal float fraction -0.47 0.01 -0.85 0.04 -1.31 0.03 -1.69 0.04 -0.04 0.00 0.00 0.01 -0.03 0.02
DZ-3-1-C10-F 500 Coal float fraction -0.40 0.01 -0.69 0.02 -1.10 0.00 -1.43 0.01 -0.04 0.01 0.03 0.02 -0.02 0.00
Note: referring to Figure 8 (c) for sample locations
78
Chapter 6. Hg stable isotope variations in coal-bearing sequences and its implication for Hg sources and geochemistry in coal
6.3.2. Analyses
6.3.2.1. Mineralogical analysis and float-sink experiments
Mineralogical analysis of the raw coal samples and rocks was performed on a Inel CPS120 X-ray
powder diffractometer (XRD) with a Co-Kα radiation, 40 kV Voltage and 25 mA current. The XRD
pattern was recorded over a 2θ interval of 2-120°, with a step size of 0.03. Two samples with the
highest Hg concentrations in coal benches in DZ (DZ-3-1-C5, DZ-3-1-C9, Table 7) were found to
contain pyritic phases. In order to test whether pyrite and organic matter of coal have different Hg
isotope compositions, float-sink experiments were conducted on both coal benches and on a third
high Hg coal bench DZ-3-1-C10. About 0.5 g of each coal sample was well mixed with reagent-
grade diiodomethane (CH2I2) solvent with a density of 3.3 g/ml and densimetrically separated 24
hours before collecting the float and sink fractions onto two separate filter papers. The float and sink
fractions were then air-dried in a fume hood.
6.3.2.2. Hg concentrations
A direct combustion mercury analyzer (Milestone DMA-80) consisting of a decomposition furnace,
catalyst tube, amalgamator and atomic absorption spectrometer was used to analyze Hg
concentrations in solid samples. Hg concentrations of periodically analyzed bituminous coal
standards NIST 2685b and NIST 1632d had mean Hg values of 156±10 ng/g (2SD, n = 34) and
90±10 ng/g (2SD, n = 20), respectively, in excellent agreement with certified values. Relative
standard deviations of Hg concentrations for replicated samples were within 10% 2RSD.
6.3.2.3. Hg isotope determination
Hg in solid samples was pre-concentrated into acidic aqueous solution, according to the combustion-
trapping method described in Sun et al. (2013a). Briefly, Hg in solid samples was thermally
volatilized in a pure oxygen stream using a temperature-programmed combustion furnace (25-900
°C). A second furnace, kept at 1000 °C, decomposes combustion products before collecting Hg into
a 30 ml 40% (v/v) acid-filled impinger (2HNO3/1HCl, double distilled). Hg in float fractions of
float-sink experiments was pre-concentrated by a modified combustion-trapping method that uses a
DMA-80 catalyst tube in the second furnace (kept at 680 °C) to absorb iodine from the
diiodomethane treatment. We didn’t concentrate sufficient Hg from the sink minerals for Hg isotope
analysis. Procedural blanks and bituminous coal standards NIST 1632d and NIST 2685b were
periodically processed with the solid samples. Some coal benches in the same coal seam of ZJ were
79
Chapter 6. Hg stable isotope variations in coal-bearing sequences and its implication for Hg sources and geochemistry in coal
combined for pre-concentrating sufficient Hg for isotope analysis. All the trapping solutions were
analyzed for Hg concentrations by cold vapor atomic fluorescence spectrometry (CV-AFS, Brooks
Rand Model III) before Hg isotope analysis to evaluate Hg pre-concentration recovery and match Hg
concentrations of standards for sample-standard bracketing on CV-MC-ICPMS. The trapping
solutions of samples and standards were adjusted to a Hg concentration of 1-2 ng/g in 20% (v/v
2HNO3/1HCl) acidic solutions. Recoveries for all the samples and procedural standards were in the
range of 80-120% and procedural blanks had negligible Hg concentrations (<0.03 ng/g) relative to
samples and procedural standards.
A CV-MC-ICPMS (Cetac HGX-200 coupled to a Thermo-Finnigan Neptune) at the Observatoire
Midi-Pyrenees (France) was used to determine Hg isotope ratios in sample trapping solutions. The
detailed analytic protocol can be found in Sun et al. (2013a). Hg isotope composition is expressed in
delta notation referenced to the bracketed NIST 3133 Hg standard (Blum and Bergquist, 2007):
( ) ( )( )198 198
Sample NIST 3133δ Hg ( ) Hg Hg Hg Hg 1 1000XXX XXX XXX= − ׉
Where XXX is Hg isotope mass between 199 and 202, (XXXHg/198Hg)sample is the measured isotope
ratio of the sample, and (XXXHg/198Hg)NIST 3133 is the average isotope ratio of the bracketing Hg
standard solutions measured before and after each sample. In the following, only δ202Hg values are
discussed to represent MDF. MIF values are indicated by capital delta (Δ) notation in permil, which
is the difference between the measured values of δ199Hg, δ200Hg, δ201Hg and those predicted from
δ202Hg using the kinetic MDF law (Blum and Bergquist, 2007) :
202Hg δ Hg δ Hgxxx xxxxxx∆ = −β ×
Where the mass-dependence scaling factor βxxx is 0.252 for 199Hg, 0.502 for 200Hg and 0.752 for 201Hg.
The long-term external uncertainty of the method was determined by repeated analyses of the in-
house UM-Almaden standard, which yielded an average δ202Hg value of −0.53±0.12‰ (2SD, n=33)
for δ202Hg and −0.02±0.05‰ (2SD, n=33) for Δ199Hg, in agreement with published values (Blum
and Bergquist, 2007). The measured δ202Hg and Δ199Hg of four independent combustions of
procedural bituminous coal standard NIST 1632d were −1.74 ± 0.12‰ (2SD, n=4) and −0.08 ±
0.08‰ (2SD, n=4), respectively, which were similar to our previous reported values (Sun et al.,
80
Chapter 6. Hg stable isotope variations in coal-bearing sequences and its implication for Hg sources and geochemistry in coal
2013b) and its predecessor NIST 1632c as analyzed by others (Lefticariu et al., 2011; Sherman et al.,
2011). The largest of either the 2SD (i.e. δ202Hg uncertainty=0.12‰, Δ199Hg uncertainty=0.08‰) of
the isotope compositions for the procedural standards NIST 1632d and UM-Almaden or the 2SD on
sample replicates (n=2) was taken as the analytical uncertainty of sample isotope compositions.
6.3.2.4. Other analyses
The carbon isotope compositions in coals were determined by a MAT-251 gas source mass
spectrometer with dual inlet system at the State Key Laboratory of Loess and Quaternary Geology,
CAS (Xian, China). The coal samples were treated to remove carbonates by 2M HCl and then were
combusted in a sealed quartz tube in the presence of silver foil and cupric oxide to produce CO2 for
carbon isotope analyses. Carbon isotope ratios are expressed in delta notation (δ13C) in permil
deviation relative to the PDB standard (Table 5). The uncertainty of δ13C values is <0.2‰ (2SD).
Ash yield, total sulfur and iron contents of samples (Table 5) were determined using methods
described in Sun et al., (2010b), with 2SD uncertainties <10%.
6.4. Results
6.4.1. Hg concentrations
Total Hg concentrations in ZJ coals range from 17 to 357 ng/g with an average value of 79± 66 ng/g
(1SD, n=43) (Table 5), which is comparable to averaged world coals of 100 ng/g Hg (Ketris and
Yudovich, 2009) but is only half of the average Hg content of Chinese coals of 163 ng/g Hg (Dai et
al., 2012a). Broadly, there is an increasing trend in Hg concentrations in minable coal seams from
No’s. 3 to 11-2 in ZJ (Figure 16). The No. 3-1 coals of Shanxi Formation in DZ have an average Hg
concentration of 298±256 ng/g (1SD, n=8, in a range of 85-754 ng/g), which is approximately 4
times that of ZJ coals (Table 7). However, excluding the three highest Hg containing coal benches
(i.e. DZ-3-1-C5, DZ-3-1-C9 and DZ-3-1-C10), Hg concentrations in the remaining benches are
rather homogeneous (85-139 ng/g). Coal benches DZ-3-1-C5 and DZ-3-1-C9 are the only samples
that were identified with pyrite phases. Therefore, the significant enrichment of Hg in these three
benches likely suggests pyrite to be the host phase (Diehl et al., 2004b; Hower et al., 2005a;
Yudovich and Ketris, 2005). Only one coke sample (ZJ-8-5-3U-J, Table 5) was found to have
significant Hg enrichment (445 ng/g) as compared to coal.
81
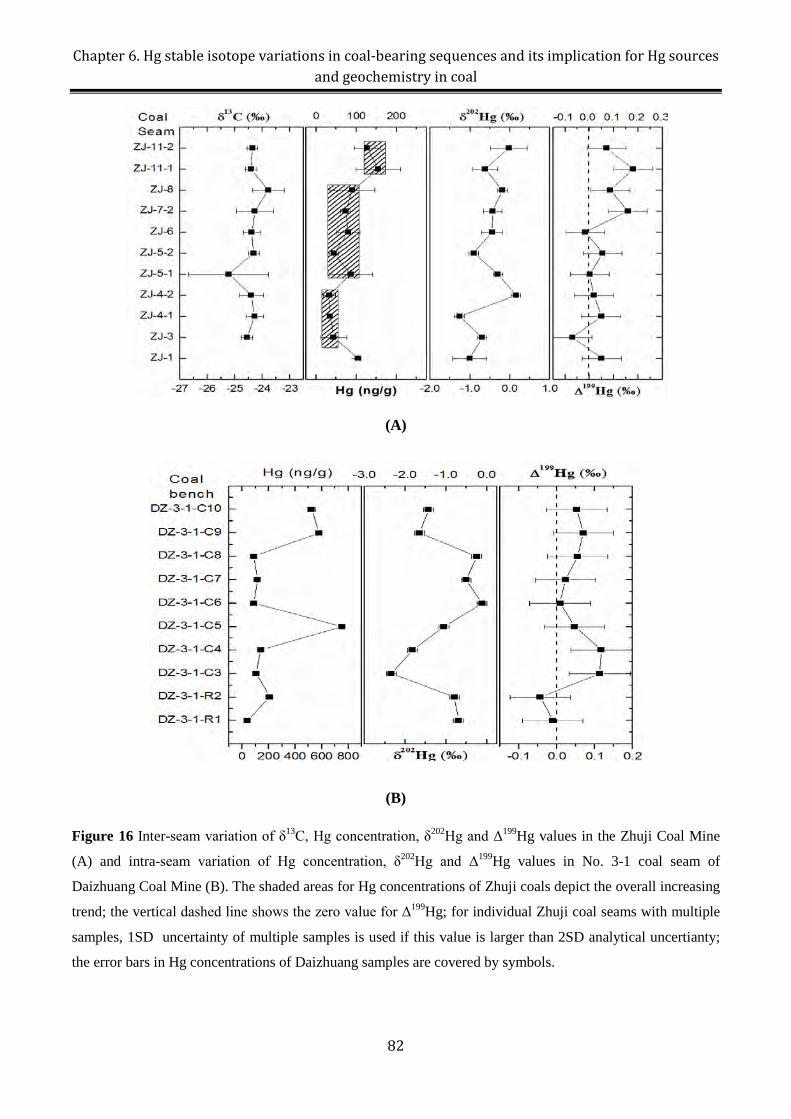
Chapter 6. Hg stable isotope variations in coal-bearing sequences and its implication for Hg sources and geochemistry in coal
(A)
(B)
Figure 16 Inter-seam variation of δ13C, Hg concentration, δ202Hg and Δ199Hg values in the Zhuji Coal Mine
(A) and intra-seam variation of Hg concentration, δ202Hg and Δ199Hg values in No. 3-1 coal seam of
Daizhuang Coal Mine (B). The shaded areas for Hg concentrations of Zhuji coals depict the overall increasing
trend; the vertical dashed line shows the zero value for Δ199Hg; for individual Zhuji coal seams with multiple
samples, 1SD uncertainty of multiple samples is used if this value is larger than 2SD analytical uncertianty;
the error bars in Hg concentrations of Daizhuang samples are covered by symbols.
82
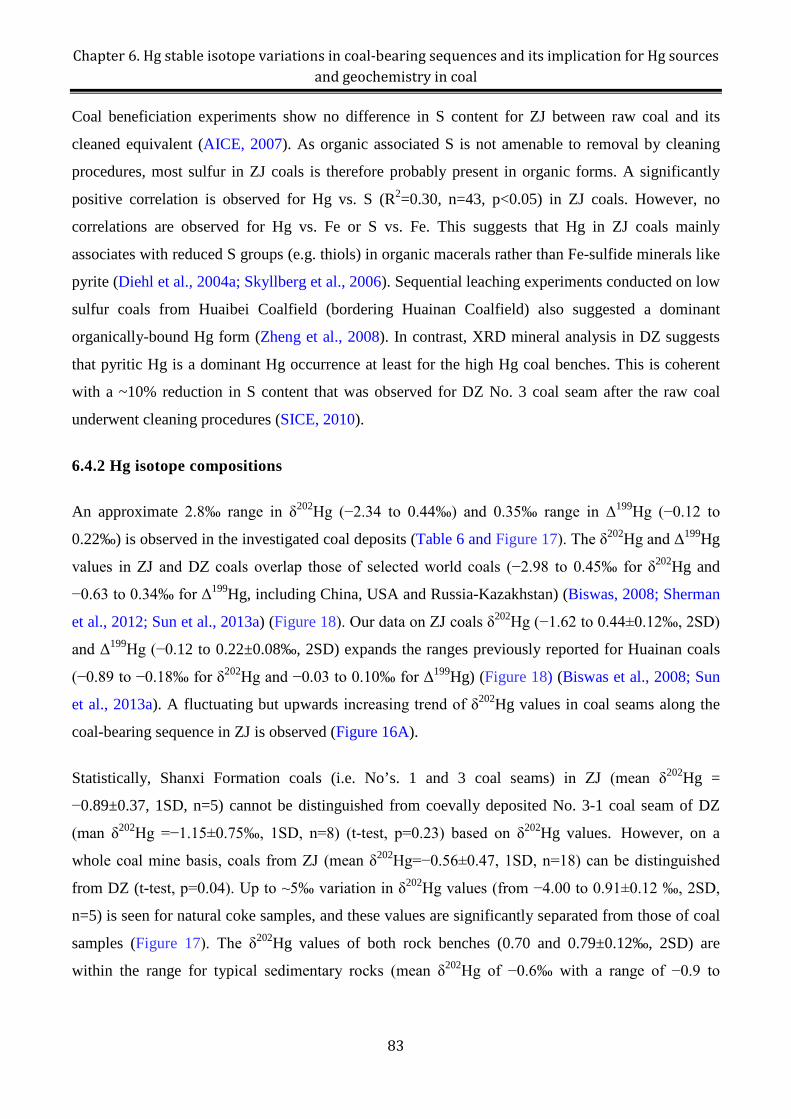
Chapter 6. Hg stable isotope variations in coal-bearing sequences and its implication for Hg sources and geochemistry in coal
Coal beneficiation experiments show no difference in S content for ZJ between raw coal and its
cleaned equivalent (AICE, 2007). As organic associated S is not amenable to removal by cleaning
procedures, most sulfur in ZJ coals is therefore probably present in organic forms. A significantly
positive correlation is observed for Hg vs. S (R2=0.30, n=43, p<0.05) in ZJ coals. However, no
correlations are observed for Hg vs. Fe or S vs. Fe. This suggests that Hg in ZJ coals mainly
associates with reduced S groups (e.g. thiols) in organic macerals rather than Fe-sulfide minerals like
pyrite (Diehl et al., 2004a; Skyllberg et al., 2006). Sequential leaching experiments conducted on low
sulfur coals from Huaibei Coalfield (bordering Huainan Coalfield) also suggested a dominant
organically-bound Hg form (Zheng et al., 2008). In contrast, XRD mineral analysis in DZ suggests
that pyritic Hg is a dominant Hg occurrence at least for the high Hg coal benches. This is coherent
with a ~10% reduction in S content that was observed for DZ No. 3 coal seam after the raw coal
underwent cleaning procedures (SICE, 2010).
6.4.2 Hg isotope compositions
An approximate 2.8‰ range in δ202Hg (−2.34 to 0.44‰) and 0.35‰ range in Δ199Hg (−0.12 to
0.22‰) is observed in the investigated coal deposits (Table 6 and Figure 17). The δ202Hg and Δ199Hg
values in ZJ and DZ coals overlap those of selected world coals (−2.98 to 0.45‰ for δ202Hg and
−0.63 to 0.34‰ for Δ199Hg, including China, USA and Russia-Kazakhstan) (Biswas, 2008; Sherman
et al., 2012; Sun et al., 2013a) (Figure 18). Our data on ZJ coals δ202Hg (−1.62 to 0.44±0.12‰, 2SD)
and Δ199Hg (−0.12 to 0.22±0.08‰, 2SD) expands the ranges previously reported for Huainan coals
(−0.89 to −0.18‰ for δ202Hg and −0.03 to 0.10‰ for Δ199Hg) (Figure 18) (Biswas et al., 2008; Sun
et al., 2013a). A fluctuating but upwards increasing trend of δ202Hg values in coal seams along the
coal-bearing sequence in ZJ is observed (Figure 16A).
Statistically, Shanxi Formation coals (i.e. No’s. 1 and 3 coal seams) in ZJ (mean δ202Hg =
−0.89±0.37, 1SD, n=5) cannot be distinguished from coevally deposited No. 3-1 coal seam of DZ
(man δ202Hg =−1.15±0.75‰, 1SD, n=8) (t-test, p=0.23) based on δ202Hg values. However, on a
whole coal mine basis, coals from ZJ (mean δ202Hg=−0.56±0.47, 1SD, n=18) can be distinguished
from DZ (t-test, p=0.04). Up to ~5‰ variation in δ202Hg values (from −4.00 to 0.91±0.12 ‰, 2SD,
n=5) is seen for natural coke samples, and these values are significantly separated from those of coal
samples (Figure 17). The δ202Hg values of both rock benches (0.70 and 0.79±0.12‰, 2SD) are
within the range for typical sedimentary rocks (mean δ202Hg of −0.6‰ with a range of −0.9 to
83
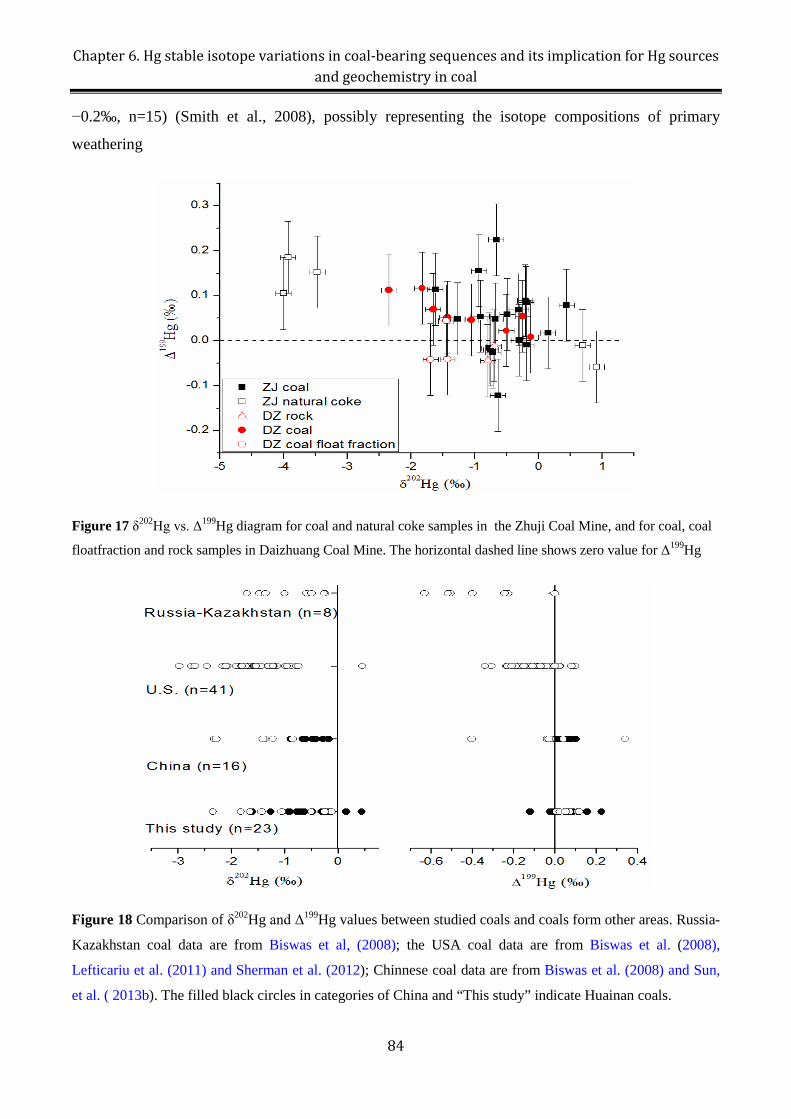
Chapter 6. Hg stable isotope variations in coal-bearing sequences and its implication for Hg sources and geochemistry in coal
−0.2‰, n=15) (Smith et al., 2008), possibly representing the isotope compositions of primary
weathering
Figure 17 δ202Hg vs. Δ199Hg diagram for coal and natural coke samples in the Zhuji Coal Mine, and for coal, coal
floatfraction and rock samples in Daizhuang Coal Mine. The horizontal dashed line shows zero value for Δ199Hg
Figure 18 Comparison of δ202Hg and Δ199Hg values between studied coals and coals form other areas. Russia-
Kazakhstan coal data are from Biswas et al, (2008); the USA coal data are from Biswas et al. (2008),
Lefticariu et al. (2011) and Sherman et al. (2012); Chinnese coal data are from Biswas et al. (2008) and Sun,
et al. ( 2013b). The filled black circles in categories of China and “This study” indicate Huainan coals.
84
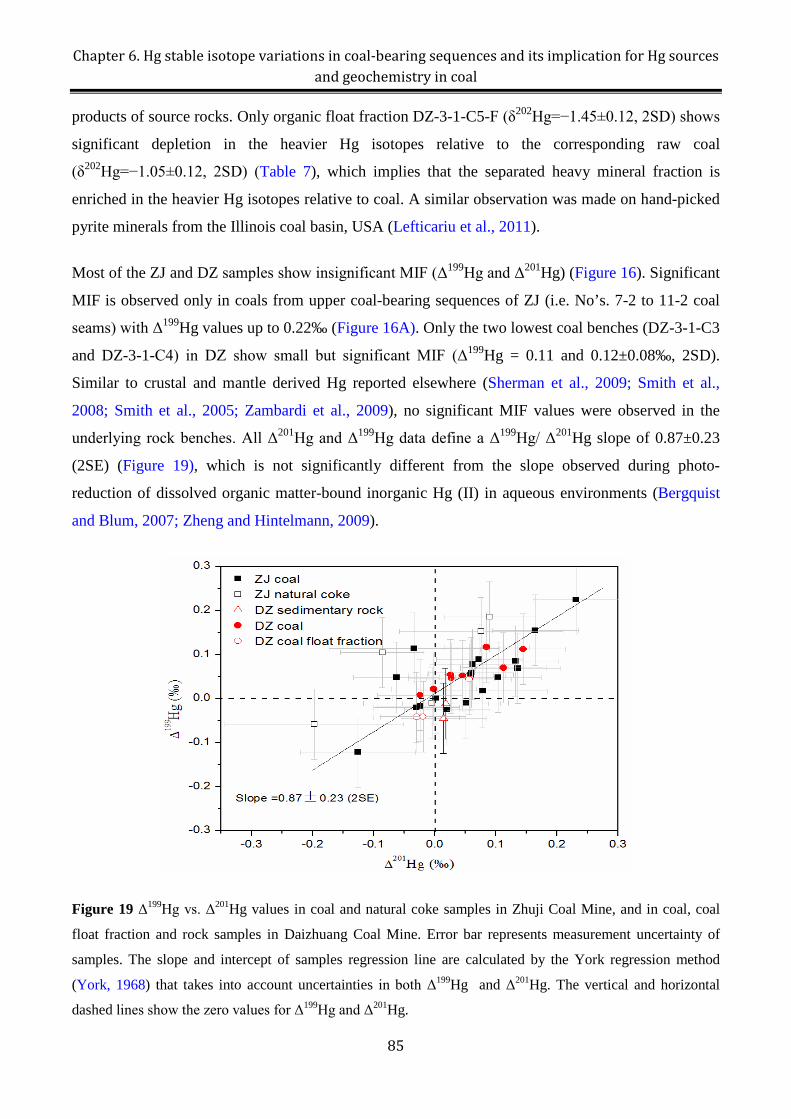
Chapter 6. Hg stable isotope variations in coal-bearing sequences and its implication for Hg sources and geochemistry in coal
products of source rocks. Only organic float fraction DZ-3-1-C5-F (δ202Hg=−1.45±0.12, 2SD) shows
significant depletion in the heavier Hg isotopes relative to the corresponding raw coal
(δ202Hg=−1.05±0.12, 2SD) (Table 7), which implies that the separated heavy mineral fraction is
enriched in the heavier Hg isotopes relative to coal. A similar observation was made on hand-picked
pyrite minerals from the Illinois coal basin, USA (Lefticariu et al., 2011).
Most of the ZJ and DZ samples show insignificant MIF (Δ199Hg and Δ201Hg) (Figure 16). Significant
MIF is observed only in coals from upper coal-bearing sequences of ZJ (i.e. No’s. 7-2 to 11-2 coal
seams) with Δ199Hg values up to 0.22‰ (Figure 16A). Only the two lowest coal benches (DZ-3-1-C3
and DZ-3-1-C4) in DZ show small but significant MIF (Δ199Hg = 0.11 and 0.12±0.08‰, 2SD).
Similar to crustal and mantle derived Hg reported elsewhere (Sherman et al., 2009; Smith et al.,
2008; Smith et al., 2005; Zambardi et al., 2009), no significant MIF values were observed in the
underlying rock benches. All Δ201Hg and Δ199Hg data define a Δ199Hg/ Δ201Hg slope of 0.87±0.23
(2SE) (Figure 19), which is not significantly different from the slope observed during photo-
reduction of dissolved organic matter-bound inorganic Hg (II) in aqueous environments (Bergquist
and Blum, 2007; Zheng and Hintelmann, 2009).
Figure 19 Δ199Hg vs. Δ201Hg values in coal and natural coke samples in Zhuji Coal Mine, and in coal, coal
float fraction and rock samples in Daizhuang Coal Mine. Error bar represents measurement uncertainty of
samples. The slope and intercept of samples regression line are calculated by the York regression method
(York, 1968) that takes into account uncertainties in both Δ199Hg and Δ201Hg. The vertical and horizontal
dashed lines show the zero values for Δ199Hg and Δ201Hg.
85
Chapter 6. Hg stable isotope variations in coal-bearing sequences and its implication for Hg sources and geochemistry in coal
6.5. Discussion
Hg isotope compositions in coal are a combined result of different Hg sources and biogeochemical
processes that occurred during and after coal deposition (Biswas et al., 2008; Lefticariu et al., 2011).
Coal-forming plants, sediments sources, depositional environments, coalification degrees, and
hydrothermal alteration control the concentration and distribution of Hg in coal (Dai et al., 2012a;
Ren et al., 1999). Therefore, these factors also likely determine the Hg isotope compositions of coal.
6.5.1. ZJ coals
A 3‰ variation in δ13C values, from −26.1 to −23.1‰, is observed in ZJ coals with no systematic
trend along coal-bearing sequences (Table 5 and Figure 16A). Most of the δ13C values in coals (25
out of 29) vary between −25 and −23.5‰. The small variation in δ13C values indicates a limited
fluctuation of coal-forming plant species (primary C3 plants such as Cordaitopsida, Lepidode-ndron,
Pteridosperm, Ginkgopsida and Filicinae between 250-300 Ma), a contemporaneous climate, and a
similar degree of coalification (Bechtel et al., 2002; Holdgate et al., 2009). No correlation is
observed between Hg concentrations and δ13C values for ZJ coals, which indicates that the coal Hg
levels were not primarily controlled by plant species. Terrestrial plants, which were brought by
floods or lived within the coal-forming basin, were the major materials to form coal deposits. It is
difficult to estimate Hg concentration and Hg isotope compositions of ancient plants living during
the Late Paleozoic Period (~300 Ma). Terrestrial plants mainly sequester atmospheric Hg through
dry/wet Hg deposition (Graydon et al., 2009; Yudovich and Ketris, 2005). Hg isotope compositions
of plants were probably inherited by coals during coal formation.
No obvious relationship exists between Hg concentrations and δ202Hg values in all ZJ coal samples.
However, when the coal samples from an individual coal seam are averaged, a significant negative
correlation is observed for δ202Hg vs. 1/Hg (R2 = 0.77, n = 9, p=0.002, excluding coal seams No’s. 1
and 4-2) (see explanation in legend of Figure 20). Considering the differences in depositional
environments and source rocks for ZJ coal deposit, spanning ~20 Ma, this correlation is quite
remarkable. This correlation can potentially be explained by mixing of two Hg end-members, i.e. a
Hg depleted end-member with lower δ202Hg (<−1.3‰) and a Hg enriched end-member with higher
δ202Hg exceeding zero. Along coal seams from Shanxi Formation (No’s. 1-3) to Lower Shihezi
Formation (No’s. 4 to 8) in ZJ, the depositional environments evolved from a subaqueous deltaic
plain environment to a lower deltaic plain environment (Sun et al., 2010a, b). The coal seam No. 11
86
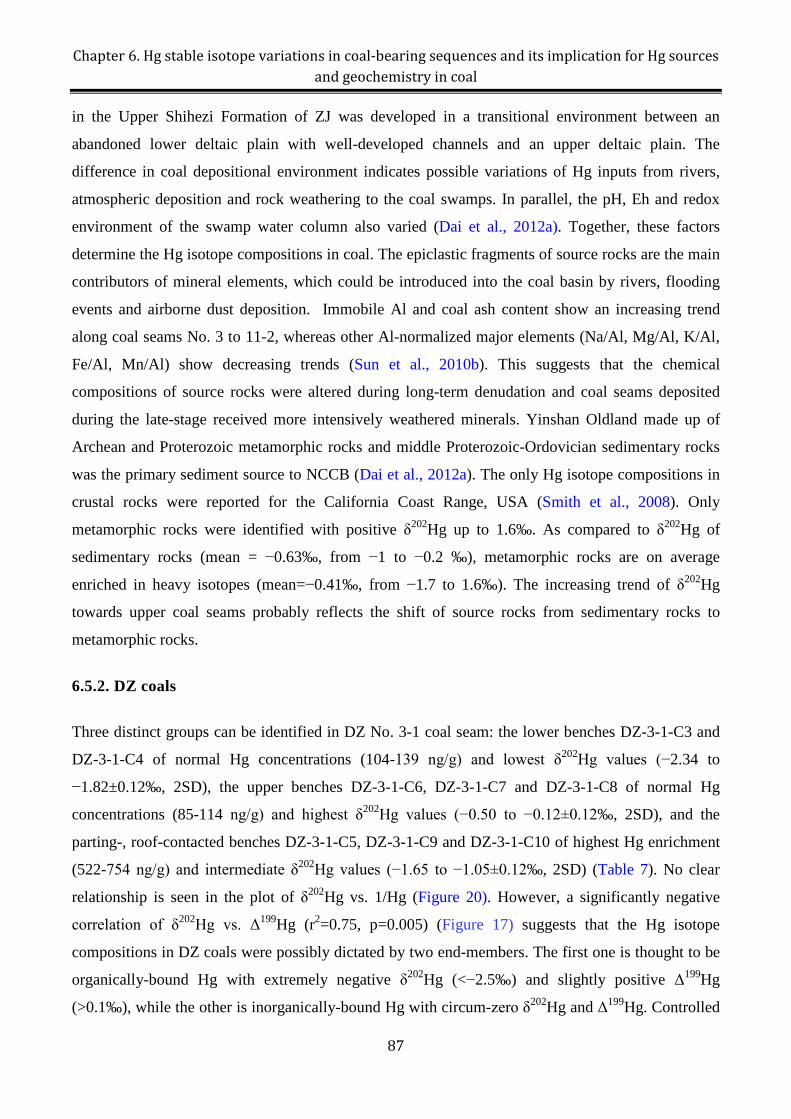
Chapter 6. Hg stable isotope variations in coal-bearing sequences and its implication for Hg sources and geochemistry in coal
in the Upper Shihezi Formation of ZJ was developed in a transitional environment between an
abandoned lower deltaic plain with well-developed channels and an upper deltaic plain. The
difference in coal depositional environment indicates possible variations of Hg inputs from rivers,
atmospheric deposition and rock weathering to the coal swamps. In parallel, the pH, Eh and redox
environment of the swamp water column also varied (Dai et al., 2012a). Together, these factors
determine the Hg isotope compositions in coal. The epiclastic fragments of source rocks are the main
contributors of mineral elements, which could be introduced into the coal basin by rivers, flooding
events and airborne dust deposition. Immobile Al and coal ash content show an increasing trend
along coal seams No. 3 to 11-2, whereas other Al-normalized major elements (Na/Al, Mg/Al, K/Al,
Fe/Al, Mn/Al) show decreasing trends (Sun et al., 2010b). This suggests that the chemical
compositions of source rocks were altered during long-term denudation and coal seams deposited
during the late-stage received more intensively weathered minerals. Yinshan Oldland made up of
Archean and Proterozoic metamorphic rocks and middle Proterozoic-Ordovician sedimentary rocks
was the primary sediment source to NCCB (Dai et al., 2012a). The only Hg isotope compositions in
crustal rocks were reported for the California Coast Range, USA (Smith et al., 2008). Only
metamorphic rocks were identified with positive δ202Hg up to 1.6‰. As compared to δ202Hg of
sedimentary rocks (mean = −0.63‰, from −1 to −0.2 ‰), metamorphic rocks are on average
enriched in heavy isotopes (mean=−0.41‰, from −1.7 to 1.6‰). The increasing trend of δ202Hg
towards upper coal seams probably reflects the shift of source rocks from sedimentary rocks to
metamorphic rocks.
6.5.2. DZ coals
Three distinct groups can be identified in DZ No. 3-1 coal seam: the lower benches DZ-3-1-C3 and
DZ-3-1-C4 of normal Hg concentrations (104-139 ng/g) and lowest δ202Hg values (−2.34 to
−1.82±0.12‰, 2SD), the upper benches DZ-3-1-C6, DZ-3-1-C7 and DZ-3-1-C8 of normal Hg
concentrations (85-114 ng/g) and highest δ202Hg values (−0.50 to −0.12±0.12‰, 2SD), and the
parting-, roof-contacted benches DZ-3-1-C5, DZ-3-1-C9 and DZ-3-1-C10 of highest Hg enrichment
(522-754 ng/g) and intermediate δ202Hg values (−1.65 to −1.05±0.12‰, 2SD) (Table 7). No clear
relationship is seen in the plot of δ202Hg vs. 1/Hg (Figure 20). However, a significantly negative
correlation of δ202Hg vs. Δ199Hg (r2=0.75, p=0.005) (Figure 17) suggests that the Hg isotope
compositions in DZ coals were possibly dictated by two end-members. The first one is thought to be
organically-bound Hg with extremely negative δ202Hg (<−2.5‰) and slightly positive Δ199Hg
(>0.1‰), while the other is inorganically-bound Hg with circum-zero δ202Hg and Δ199Hg. Controlled
87
Chapter 6. Hg stable isotope variations in coal-bearing sequences and its implication for Hg sources and geochemistry in coal
experiments show that under equilibrium conditions thiol-bound Hg is enriched in the lighter Hg
isotopes by ~0.6‰ (δ202Hg) relative to dissolved Hg(II) species (Wiederhold et al., 2010). Therefore,
it is possible that the lighter Hg isotopes in coal swamp water were preferentially removed by the
decayed organic matters. Photo-reduction of in-situ organic-bound Hg(II) or incorporation of
recycled atmospheric and fluvial Hg with positive Δ199Hg into decayed organic matters might
explain the supposed >0.1‰ Δ199Hg of organically-bound Hg.
Figure 20 Plot of δ202Hg vs. 1/Hg in Zhuji and Daizhuang coals. Coal samples ZJ-12-8-4-2 and ZJ-9+1-1 in
circles are treated as the outliers. ZJ-12-8-4-2 has positive δ202Hg and is possibly affected by magmatic
intrusion (see Section 4.3 in text); ZJ+9+1-1 is an unworkable coal seam and has an extremely high ash yield
(Table 5).
Float fractions for upper two coal benches (DZ-3-1-C9-F and DZ-3-1-C10-F) have the same Hg
isotope compositions as raw coals (Table 7), indicating Hg input from extraneous sources probably
occurred at early-stages of coal formation, and the late-stage diagenesis and metamorphic processes
homogenized Hg isotope compositions in both coal benches. In contrast, another float fraction from
the highest Hg containing bench DZ-3-1-C6 had 0.4‰ lower δ202Hg than raw coal (Table 7). This
implies that the mineral fraction (primary pyrite as indicated by XRD) has a higher δ202Hg value than
raw coal, which is similar to Illinois coals where epigenetic pyrite samples of circum-zero δ202Hg
88
Chapter 6. Hg stable isotope variations in coal-bearing sequences and its implication for Hg sources and geochemistry in coal
values are 0.9-1.3‰ higher than their corresponding organic matter rich coal fractions (Lefticariu et
al., 2011).
6.5.3. Hg isotope compositions in natural cokes
Natural coke samples in ZJ have either distinctly higher (0.7 to 0.91±0.12‰, 2SD) or lower δ202Hg
(−4.00 to −3.47±0.12‰, 2SD) than coal samples (-1.62 to 0.44±0.12‰, 2SD) (Figure 17), which
suggests that significant Hg isotope fractionation probably happened during the coal to coke
transformation processes. The intensive magmatic intrusion occurred during the Late Cretaceous at
ZJ and upgraded a large area of coal seams (primarily at lower No’s. 3 and 4 coal seams) into natural
coke (Yang et al., 2012). When the Permian coal seams were subjected to thermal perturbations from
magmatic intrusion, a part, even all of the Hg in coal would be lost (Finkelman et al., 1998). The
volatilized Hg was supposed to enrich lighter Hg isotopes and the complementary heavier isotopes
were enriched in Hg-depleted coke. However, our coke samples are on average enriched ~2 times in
Hg (140 ng/g) compared to coal, which implies that secondary Hg enrichment processes possibly
occurred to cokes following Hg volatilization from intruded coal (Finkelman et al., 1998). The
hydrothermal system derived from magmatic intrusions is a common factor to contribute to Hg
enrichment in coal (Dai et al., 2012a; Diehl et al., 2004b). In coal seam No. 3 of borehole 8-5, the
upward lithologies are coke (DZ-8-5-3U-J and DZ-8-5-3D-J, Table 7), gabbro dike and sandstone.
Although pyrite phases were not identified in neither ZJ-8-5-3u-J nor ZJ-8-5-3D-J by XRD,
postdating cross-cutting pyrite veins were observed in overlying sandstone, indicating a local
hydrothermal system development. The extremely high Hg concentration in ZJ-8-5-3u-J (445 ng/g)
possibly reflects a hydrothermal Hg delivery. Some cokes (e.g. ZJ-8-5-3D-J, ZJ-8+1-3U-J and ZJ-
14-5-4-2D-J, Table 7) of lowest δ202Hg values probably captured large proportions of Hg vapor
volatilized from intruded coal. The well-developed porous structure of cokes could enhance their
adsorption ability to Hg vapor after ambient temperatures decreased.
6.6. Implications
This study explored Hg isotope ratios to understand the possible mechanisms that control Hg
occurrences in coal. The results have potential applications for geochemical and environmental
tracing. The increasing δ202Hg values from older to younger coal seams of ZJ suggests a progressive
shift of the coal swamp source rocks from sedimentary to metamorphic rocks. The negative
correlation of δ202Hg vs. Δ199Hg in DZ coals suggests that the Hg isotope variation in a single coal
89
Chapter 6. Hg stable isotope variations in coal-bearing sequences and its implication for Hg sources and geochemistry in coal
seam were possibly controlled by the proportion of organic and inorganic-bound Hg. The prominent
MIF values observed in certain coal seams may find application in the identification and stratigraphic
inter-correlation of coal seams (traditionally using chemical characteristics and bio- or geo-markers),
especially of splitting coal seams (e.g. No. 11-1 vs. 11-2), during coal exploration and exploitation
(Dai et al., 2011; Kosanke, 1947; Ward, 2002). The significant Hg isotope fractionation between
cokes and coal will be useful to distinguish Hg emissions from coal and coke combustion.
Acknowledgements
This work is supported by research grants ANR-09-JCJC-0035-01 from the French Agence
Nationale de Recherche and ERC-2010-StG_20091028 from the European Research Council to JES.
RS acknowledges his PhD scholarship from the Chinese Scholarship Council.
References
AICE, 2007. Anhui Institution of Coal Exploration: Zhuji coal exploration report.
Bechtel, A., Sachsenhofer, R.F., Gratzer, R., Lücke, A., Püttmann, W., 2002. Parameters determining the
carbon isotopic composition of coal and fossil wood in the Early Miocene Oberdorf lignite seam
(Styrian Basin, Austria). Organic Geochemistry 33, 1001-1024.
Bergquist, B.A., Blum, J.D., 2007. Mass-Dependent and -Independent Fractionation of Hg Isotopes by
Photoreduction in Aquatic Systems. Science 318, 417-420.
Bergquist, B.A., Blum, J.D., 2009. The Odds and Evens of Mercury Isotopes: Applications of Mass-
Dependent and Mass-Independent Isotope Fractionation. Elements 5, 353-357.
Biswas, A., Blum, J.D., Bergquist, B.A., Keeler, G.J., Xie, Z., 2008. Natural Mercury Isotope Variation in
Coal Deposits and Organic Soils. Environmental Science & Technology 42, 8303-8309.
Blum, J., Bergquist, B., 2007. Reporting of variations in the natural isotopic composition of mercury. Analytic
and Bioanalytic Chemistry 388, 353-359.
Chen, J., Hintelmann, H., Dimock, B., 2010. Chromatographic pre-concentration of Hg from dilute aqueous
solutions for isotopic measurement by MC-ICP-MS. Journal of Analytical Atomic Spectrometry 25,
1402-1409.
Chen, J., Hintelmann, H., Feng, X., Dimock, B., 2012. Unusual fractionation of both odd and even mercury
isotopes in precipitation from Peterborough, ON, Canada. Geochimica et Cosmochimica Acta 90, 33-
46.
Dai, S., Ren, D., Chou, C.-L., Finkelman, R.B., Seredin, V.V., Zhou, Y., 2012a. Geochemistry of trace
elements in Chinese coals: A review of abundances, genetic types, impacts on human health, and
industrial utilization. International Journal of Coal Geology 94, 3-21.
90
Chapter 6. Hg stable isotope variations in coal-bearing sequences and its implication for Hg sources and geochemistry in coal
Dai, S., Wang, X., Seredin, V.V., Hower, J.C., Ward, C.R., O'Keefe, J.M.K., Huang, W., Li, T., Li, X., Liu,
H., Xue, W., Zhao, L., 2012b. Petrology, mineralogy, and geochemistry of the Ge-rich coal from the
Wulantuga Ge ore deposit, Inner Mongolia, China: New data and genetic implications. International
Journal of Coal Geology 90–91, 72-99.
Dai, S., Wang, X., Zhou, Y., Hower, J.C., Li, D., Chen, W., Zhu, X., Zou, J., 2011. Chemical and
mineralogical compositions of silicic, mafic, and alkali tonsteins in the late Permian coals from the
Songzao Coalfield, Chongqing, Southwest China. Chemical Geology 282, 29-44.
Diehl, S.F., Goldhaber, M.B., Hatch, J.R., 2004a. Modes of occurrence of mercury and other trace elements in
coals from the warrior field, Black Warrior Basin, Northwestern Alabama. International Journal of
Coal Geology 59, 193-208.
Diehl, S.F., Goldhaber, M.B., Hatch, J.R., 2004b. Modes of occurrence of mercury and other trace elements in
coals from the warrior field, Black Warrior Basin, Northwestern Alabama. International Journal of
Coal Geology 59, 193-208.
Estrade, N., Carignan, J., Sonke, J.E., Donard, O.F.X., 2009. Mercury isotope fractionation during liquid-
vapor evaporation experiments. Geochimica et Cosmochimica Acta 73, 2693-2711.
Finkelman, R.B., Bostick, N.H., Dulong, F.T., Senftle, F.E., Thorpe, A.N., 1998. Influence of an igneous
intrusion on the inorganic geochemistry of a bituminous coal from Pitkin County, Colorado.
International Journal of Coal Geology 36, 223-241.
Gratz, L.E., Keeler, G.J., Blum, J.D., Sherman, L.S., 2010. Isotopic Composition and Fractionation of
Mercury in Great Lakes Precipitation and Ambient Air. Environmental Science & Technology 44,
7764-7770.
Graydon, J.A., St. Louis, V.L., Hintelmann, H., Lindberg, S.E., Sandilands, K.A., Rudd, J.W.M., Kelly, C.A.,
Tate, M.T., Krabbenhoft, D.P., Lehnherr, I., 2009. Investigation of Uptake and Retention of
Atmospheric Hg(II) by Boreal Forest Plants Using Stable Hg Isotopes. Environmental Science &
Technology 43, 4960-4966.
Haitzer, M., Aiken, G.R., Ryan, J.N., 2002. Binding of Mercury(II) to Dissolved Organic Matter: The Role of
the Mercury-to-DOM Concentration Ratio. Environmental Science & Technology 36, 3564-3570.
Haitzer, M., Aiken, G.R., Ryan, J.N., 2003. Binding of Mercury(II) to Aquatic Humic Substances: Influence
of pH and Source of Humic Substances. Environmental Science & Technology 37, 2436-2441.
Han, D., Ren, D., Yanbin, W., Jin, K., Mao, H., Qin, Y., 1996. Coal Petrology of China. China University of
Mining & Technology Press.
Han, D., Yang, Q., 1980. Coal Geology of China, Vol. 2. Coal Industry Publishing House, Beijing.
Han, S., Gill, G.A., Lehman, R.D., Choe, K.-Y., 2006. Complexation of mercury by dissolved organic matter
in surface waters of Galveston Bay, Texas. Marine Chemistry 98, 156-166.
Han, S.F., 1990. Coal-forming conditions and coalfield prediction in Huaibei-Huainan region. Geological
Publishing House, Beijing.
91
Chapter 6. Hg stable isotope variations in coal-bearing sequences and its implication for Hg sources and geochemistry in coal
Hesterberg, D., Chou, J.W., Hutchison, K.J., Sayers, D.E., 2001. Bonding of Hg(II) to Reduced Organic
Sulfur in Humic Acid As Affected by S/Hg Ratio. Environmental Science & Technology 35, 2741-
2745.
Holdgate, G.R., McGowran, B., Fromhold, T., Wagstaff, B.E., Gallagher, S.J., Wallace, M.W., Sluiter, I.R.K.,
Whitelaw, M., 2009. Eocene–Miocene carbon-isotope and floral record from brown coal seams in the
Gippsland Basin of southeast Australia. Global and Planetary Change 65, 89-103.
Hower, J.C., Campbell, J.L., Teesdale, W.J., Nejedly, Z., Robertson, J.D., 2008. Scanning proton microprobe
analysis of mercury and other trace elements in Fe-sulfides from a Kentucky coal. International
Journal of Coal Geology 75, 88-92.
Hower, J.C., Eble, C.F., Quick, J.C., 2005a. Mercury in Eastern Kentucky coals: Geologic aspects and
possible reduction strategies. International Journal of Coal Geology 62, 223-236.
Hower, J.C., Mastalerz, M., Drobniak, A., Quick, J.C., Eble, C.F., Zimmerer, M.J., 2005b. Mercury content of
the Springfield coal, Indiana and Kentucky. International Journal of Coal Geology 63, 205-227.
Ketris, M.P., Yudovich, Y.E., 2009. Estimations of Clarkes for Carbonaceous biolithes: World averages for
trace element contents in black shales and coals. International Journal of Coal Geology 78, 135-148.
Kosanke, R.M., 1947. Plant Microfossils in Correlation of Coal Beds. The Journal of Geology 55, 280-284.
Kritee, K., Blum, J.D., Barkay, T., 2008. Mercury Stable Isotope Fractionation during Reduction of Hg(II) by
Different Microbial Pathways. Environmental Science & Technology 42, 9171-9177.
Kritee, K., Blum, J.D., Johnson, M.W., Bergquist, B.A., Barkay, T., 2007. Mercury Stable Isotope
Fractionation during Reduction of Hg(II) to Hg(0) by Mercury Resistant Microorganisms.
Environmental Science & Technology 41, 1889-1895.
Lauretta, D.S., Klaue, B., Blum, J.D., Buseck, P.R., 2001. Mercury abundances and isotopic compositions in
the Murchison (CM) and Allende (CV) carbonaceous chondrites. Geochimica et Cosmochimica Acta
65, 2807-2818.
Lefticariu, L., Blum, J.D., Gleason, J.D., 2011. Mercury Isotopic Evidence for Multiple Mercury Sources in
Coal from the Illinois Basin. Environmental Science & Technology 45, 1724-1729.
Liu, G., Yang, P., Peng, Z., Chou, C.-L., 2004. Petrographic and geochemical contrasts and environmentally
significant trace elements in marine-influenced coal seams, Yanzhou mining area, China. Journal of
Asian Earth Sciences 23, 491-506.
Liu, G., Zheng, L., Gao, L., Zhang, H., Peng, Z., 2005. The characterization of coal quality from the Jining
coalfield. Energy 30, 1903-1914.
Pacyna, E.G., Pacyna, J.M., Sundseth, K., Munthe, J., Kindbom, K., Wilson, S., Steenhuisen, F., Maxson, P.,
2010. Global emission of mercury to the atmosphere from anthropogenic sources in 2005 and
projections to 2020. Atmospheric Environment 44, 2487-2499.
92
Chapter 6. Hg stable isotope variations in coal-bearing sequences and its implication for Hg sources and geochemistry in coal
Pirrone, N., Cinnirella, S., Feng, X., Finkelman, R.B., Friedli, H.R., Leaner, J., Mason, R., Mukherjee, A.B.,
Stracher, G.B., Streets, D.G., Telmer, K., 2010. Global mercury emissions to the atmosphere from
anthropogenic and natural sources. Atmospheric Chemistry and Physics 10, 5951-5964.
Querol, X., Alastuey, A., Lopez-Soler, A., Plana, F., Zeng, R., Zhao, J., Zhuang, X., 1999. Geological controls
on the quality of coals from the West Shandong mining district, Eastern China. International Journal
of Coal Geology 42, 63-88.
Quick, J.Q., Brill, T.B., Tabet, D.T., 2003. Mercury in US coal: observations using the COALQUAL and ICR
data. Environmental Geology 43, 247-259.
Ren, D., Zhao, F., Wang, Y., Yang, S., 1999. Distributions of minor and trace elements in Chinese coals.
International Journal of Coal Geology 40, 109-118.
Sherman, L.S., Blum, J.D., Keeler, G.J., Demers, J.D., Dvonch, J.T., 2012. Investigation of Local Mercury
Deposition from a Coal-Fired Power Plant Using Mercury Isotopes. Environmental Science &
Technology
Sherman, L.S., Blum, J.D., Nordstrom, D.K., McCleskey, R.B., Barkay, T., Vetriani, C., 2009. Mercury
isotopic composition of hydrothermal systems in the Yellowstone Plateau volcanic field and Guaymas
Basin sea-floor rift. Earth and Planetary Science Letters 279, 86-96.
SICE, 2010. Shandong Institution of Coal Exploration: Daizhuang coal exploration report.
Skyllberg, U., Bloom, P.R., Qian, J., Lin, C.-M., Bleam, W.F., 2006. Complexation of Mercury(II) in Soil
Organic Matter: EXAFS Evidence for Linear Two-Coordination with Reduced Sulfur Groups.
Environmental Science & Technology 40, 4174-4180.
Smith, C.N., Kesler, S.E., Blum, J.D., Rytuba, J.J., 2008. Isotope geochemistry of mercury in source rocks,
mineral deposits and spring deposits of the California Coast Ranges, USA. Earth and Planetary
Science Letters 269, 399-407.
Smith, C.N., Kesler, S.E., Klaue, B., Blum, J.D., 2005. Mercury isotope fractionation in fossil hydrothermal
systems. Geology 33, 825-828.
Sonke, J.E., 2011. A global model of mass independent mercury stable isotope fractionation. Geochimica et
Cosmochimica Acta 75, 4577-4590.
Streets, D.G., Devane, M.K., Lu, Z., Bond, T.C., Sunderland, E.M., Jacob, D.J., 2011. All-Time Releases of
Mercury to the Atmosphere from Human Activities. Environmental Science & Technology 45,
10485-10491.
Sun, R., Heimbürger, L.-E., Sonke, J.E., Liu, G., Amouroux, D., Berail, S., 2013a. Mercury stable isotope
fractionation in six utility boilers of two large coal-fired power plants. Chemical Geology 336, 103-
111.
Sun, R., Enrico, M., Heimbürger, L.-E., Scott, C., Sonke, J.E., 2013b. A double-stage tube furnace – acid
trapping protocol for the pre-concentration of mercury from solid samples for isotopic analysis.
Analytical and Bioanalytic Chemistry. DOI: 10.1007/s00216-013-7152-2.
93
Chapter 6. Hg stable isotope variations in coal-bearing sequences and its implication for Hg sources and geochemistry in coal
Sun, R., Liu, G., Zheng, L., Chou, C.-L., 2010a. Characteristics of coal quality and their relationship with
coal-forming environment: A case study from the Zhuji exploration area, Huainan coalfield, Anhui,
China. Energy 35, 423-435.
Sun, R., Liu, G., Zheng, L., Chou, C.-L., 2010b. Geochemistry of trace elements in coals from the Zhuji Mine,
Huainan Coalfield, Anhui, China. International Journal of Coal Geology 81, 81-96.
Toole-O'Neil, B., Tewalt, S.J., Finkelman, R.B., Akers, D.J., 1999. Mercury concentration in coal--unraveling
the puzzle. Fuel 78, 47-54.
Ward, C.R., 2002. Analysis and significance of mineral matter in coal seams. International Journal of Coal
Geology 50, 135-168.
Wiederhold, J.G., Cramer, C.J., Daniel, K., Infante, I., Bourdon, B., Kretzschmar, R., 2010. Equilibrium
Mercury Isotope Fractionation between Dissolved Hg(II) Species and Thiol-Bound Hg.
Environmental Science & Technology 44, 4191-4197.
Wu, F.D., Chen, Z.H., Zhang, S.L., Ge, L.G., 1995. Transgressions during Permo-Carboniferous Period in
North China. Geoscience 9, 284-292.
Yang, M., Liu, G., Sun, R., Chou, C.-L., Zheng, L., 2012. Characterization of intrusive rocks and REE
geochemistry of coals from the Zhuji Coal Mine, Huainan Coalfield, Anhui, China. International
Journal of Coal Geology 94, 283-295.
Yin, R., Feng, X., Shi, W., 2010. Application of the stable-isotope system to the study of sources and fate of
Hg in the environment: A review. Applied Geochemistry 25: 1467-1477.
Yudovich, Y.E., Ketris, M.P., 2005. Mercury in coal: a review: Part 1. Geochemistry. International Journal of
Coal Geology 62, 107-134.
Zambardi, T., Sonke, J.E., Toutain, J.P., Sortino, F., Shinohara, H., 2009. Mercury emissions and stable
isotopic compositions at Vulcano Island (Italy). Earth and Planetary Science Letters 277, 236-243.
Zheng, L., Liu, G., Qi, C., Zhang, Y., Wong, M., 2008. The use of sequential extraction to determine the
distribution and modes of occurrence of mercury in Permian Huaibei coal, Anhui Province, China.
International Journal of Coal Geology 73, 139-155.
Zheng, L.G., Liu, G.J., Chou, C.L., 2007a. The distribution, occurrence and environmental effect of mercury
in Chinese coals. Science of Total Environment 384, 374-383.
Zheng, W., Foucher, D., Hintelmann, H., 2007b. Mercury isotope fractionation during volatilization of Hg(0)
from solution into the gas phase. Journal of Analytical Atomic Spectrometry 22, 1097-1104.
Zheng, W., Hintelmann, H., 2009. Mercury isotope fractionation during photoreduction in natural water is
controlled by its Hg/DOC ratio. Geochimica et Cosmochimica Acta 73, 6704-6715.
Zheng, W., Hintelmann, H., 2010. Nuclear Field Shift Effect in Isotope Fractionation of Mercury during
Abiotic Reduction in the Absence of Light. The Journal of Physical Chemistry A 114, 4238-4245.
94
Chapter 7. Hg stable isotope compositions of selected world coals
Chapter 7
Hg stable isotope compositions of selected world coals
95
Chapter 7. Hg stable isotope compositions of selected world coals
Chapter 7. Hg stable isotope compositions of selected world coals
(article in preparation for Environmental Science and Technology)
Résumé
Ce Chapitre résume une compilation isotopique du Hg dans des charbons, basé sur 108 nouveaux
échantillons de charbon provenant des basins importants en Afrique, Chine, Europe, Inde, Indonésie,
l’ancien Russie et les USA et ~50 charbons déjà publiés. Nous observons une variation isotopique de
4.7‰ en δ202Hg (−3.9 a 0.8‰) et de 1‰ en Δ199Hg (−0.6 a 0.4‰). La moitié des 28 comparaisons
possibles entre les huit principales régions producteur du charbon du monde sont statistiquement
différenciable selon leurs δ202Hg, Δ199Hg ou les deux (p<0.05). Nous y en déduisons l’application
potentiel des signatures isotopiques du Hg en tant que traceurs des émissions du Hg des centrales au
charbon. Dans un deuxième temps, il parait que la signature Δ199Hg augmente avec la
charbonification (du lignite au sous-bitumineux au bitumineux à l’anthracite) et avec l’âge de
déposition (du Cénozoïque au Mésozoïque au Paléozoïque)
96
Chapter 7. Hg stable isotope compositions of selected world coals
Hg stable isotope compositions of selected world coals
Ruoyu Sun 1*, Jeroen Sonke 1, Harvey Belkin2, Guijian Liu 3, Debasish Shome 4, Ewa Cukrowska 5,
Oleg Pokrovsky1
1Observatoire Midi-Pyrénées, Laboratoire Géosciences Environnement Toulouse,
CNRS/IRD/Université de Toulouse, France
2U.S. Geological Survey, 956 National Center, Reston, VA 20192, USA
3CAS Key Laboratory of Crust-Mantle Materials and Environment, School of Earth and Space
Sciences, University of Science and Technology of China, Hefei, Anhui 230026, China
4 Dept. of Geology, Jadavpur University, India
5Molecular Sciences Institute, School of Chemistry, University of the Witwatersrand, P.Bag X3,
WITS 2050, Johannesburg, South Africa
Abstract
Hg emissions from coal combustion contribute approximately half (~700-900 tons/year) of all
anthropogenic Hg emissions to the atmosphere. With the implementation of the first global, legally-
binding UNEP treaty aimed at reducing anthropogenic Hg emissions, the identification and
traceability of coal Hg emissions from different countries or regions is critically important. Here, we
present a coal Hg isotope library by reporting the isotope composition of 108 new coal samples from
major coal-producing basins in Africa, China, Europe, India, Indonesia, former USSR and the USA,
adding to the thus far ~50 published coal samples. A 4.7‰ range in δ202Hg (−3.9 to 0.8‰) and a 1‰
range in Δ199Hg (−0.6 to 0.4‰) are observed. 14 (p<0.05) to 17 (p<0.1) of the 28 pairwise
comparisons between eight global regions are statistically distinguishable on the basis of δ202Hg,
Δ199Hg or both. This highlights the potential application of Hg isotope signatures to coal Hg
emission tracing. Significant correlations were observed between Hg isotope compositions (δ202Hg
or Δ199Hg) and Hg concentration, coal rank or coal-forming ages, suggesting geochemical and
source-related controls. Industrial processes (e.g. coal washing and combustion) may shift the
isotope compositions of coal Hg.
*Corresponding author: Ruoyu Sun, E-mail: [email protected]
97
Chapter 7. Hg stable isotope compositions of selected world coals
7.1. Introduction
Mercury (Hg) is a persistent toxic element. Once released from natural and anthropogenic sources, it
can be transported globally by atmospheric circulation before being deposited. Following deposition,
a portion of Hg will be transformed into neurotoxic methylmercury (MeHg). Methylmercury can be
bioaccumulated and biomagnified stepwise along food chains and poses a great threat to the health of
humans and wild life. Mercury is commonly present at trace levels of 10-1000 ng/g in coal (Dai et
al., 2012; Ketris and Yudovich, 2009). However, the large volumes of coal used in industrial
processes have made coal become the dominant Hg emission source. On a global scale, coal
contributed more than a quarter of the cumulative anthropogenic Hg emissions (21500 tons) between
1850 and 2008 (Streets et al., 2011). Mercury emissions from stationary coal combustion facilities,
primarily coal-fired utility boilers (CFUBs), have soared over the recent two decades, especially in
developing countries (e.g. China, India South Africa), and have reached 700-900 tons/yr at present,
representing approximately half of the anthropogenic Hg emissions into the atmosphere (Pacyna et
al., 2006b; Pacyna et al., 2010; Pirrone et al., 2010; Streets et al., 2011). In addition, considerable
amounts of Hg are removed from CFUB flue gases into fly ash, gypsum and waste water, and may
potentially contaminate the local environment (Yang et al., 2012)
Quantitative assessment of the impact of coal Hg emission on local, regional and global ecosystems
is of substantial interest to environmental scientists and decision-makers. Moreover, with the
implementation of the first global, legally-binding treaty aiming at reducing anthropogenic Hg
emissions, a distinction of coal Hg emissions from different countries or regions is critically
important. Global Hg chemistry and transport models have been used to estimate the trans-boundary
impact of Hg emissions (Seigneur et al., 2004; Selin et al., 2008). Measured Hg/CO ratios have been
used as tracers for long-range Asian Hg emissions (Weiss-Penzias et al., 2007). However, a widely
applicable chemical source tracing signature for coal Hg emissions has not been developed thus far.
Over one decade of Hg stable isotope research has shown that the various Hg isotope signatures
carry information on Hg sources and environmental transformations (Sonke and Blum, 2013).
Incomplete Hg transformations in natural and man-made environments separate the seven stable Hg
isotopes as a function of isotope mass, nuclear volume or nuclear magnetic moment (Bergquist and
Blum, 2007; Estrade et al., 2009). Additional isotope fractionation mechanisms, including nuclear
self-shielding, are suspected to exist (Mead and Johnson, 2010). Most natural samples, including the
coals considered here, show Hg isotope variations that are controlled by mass dependent
98
Chapter 7. Hg stable isotope compositions of selected world coals
fractionation (MDF, denoted by δ202Hg) and mass independent fractionation (MIF, denoted by
Δ199Hg or Δ201Hg) related to the magnetic isotope effect.
Published Hg isotope signatures in coals have revealed a 3‰ variation in δ202Hg and a 1‰ variation
in Δ199Hg (Biswas et al., 2008; Lefticariu et al., 2011; Sun et al., 2013a). Two important observations
have strengthened the potential application of Hg isotope signatures as CFUB Hg emission tracers.
Firstly, different coal basins can be distinguished using the combined δ202Hg and Δ199Hg isotope
signatures (Biswas et al., 2008; Lefticariu et al., 2011). Secondly, the Hg isotopic shift between Hg
in feed coal and CFUB flue gas Hg emissions are small (<0.3‰) and predictable for δ202Hg, and
absent for Δ199Hg (Sun et al., 2013a). We did point out in the latter study that the various gaseous
elemental Hg (GEM), gaseous oxidized Hg (GOM) and particle bound Hg (PBM) species in flue gas
may carry different δ202Hg signatures. GEM is enriched in the heavier Hg isotopes, whereas GOM
and PBM are in the lighter Hg isotopes. Hg isotope evidences show that precipitation (snow and rain
water), soils and lichens were possibly contaminated by local and regional coal combustion Hg
emissions (Biswas et al., 2008; Chen et al., 2012; Estrade et al., 2010, 2011; Sherman et al., 2012). In
addition, the environmental compartments in the vicinity of coal-fired power plants showed
contrasting Hg isotope signatures as compared to those far away from coal combustion emissions
(Estrade et al., 2010, 2011; Sherman et al., 2011). However, our current tracing to coal Hg is still
based on speculations and limited Hg isotope data of world selected coal specimens.
In this study, we develop a coal Hg isotope library by analyzing 108 new coal samples, adding to
~50 published coal samples (Biswas et al., 2008; Lefticariu et al., 2011; Sun et al., 2013a). The coal
samples cover the main coal-producing basins in ten countries and coals formed from the
Carboniferous to the Tertiary. We group the Hg isotope signatures (δ202Hg and Δ199Hg) in coals of
different regions. The natural (hydrothermal fluids, magmatic intrusion events) and artificial
processes (coal washing, pyrite rejection, combustion, combustion products removal) that potentially
shift the Hg isotope signatures in original coals are discussed.
7.2. Samples and analysis
7.2.1. Samples collection and processing
Coal samples were chosen from the world main coal-forming basins in primary coal
production/consumption regions including South Africa, China, the USA, India, Indonesia, Former
USSR (Russia, Kazakhstan, Ukraine), Mongolia and some European counties (mainly Romania)
99
Chapter 7. Hg stable isotope compositions of selected world coals
(Figure 10). Coal samples from China and the USA are from the University of Science and
Technology in China, and were homogenized before delivery. Indonesian (large-granular coal),
Mongolian (large-granular coal) and Romanian (pulverized coal) coal samples are from the USGS
WoCQI project (Tewalt et al., 2010). Bulk Indian coal samples are from the Dept. of Geology
collection, Jadavpur University, India. Pulverized coal samples from South African power plants are
from the Witwatersrand University collection (Lusilao-Makiese et al., 2012), coals from former
USSR are from the Moscow State University collection, and from other regions were supplied by C.
Liousse (Laboratoire d’Aerologie, Toulouse, France). Bulk and large-granular coal samples were
pulverized in a motorized agate grinder (Fritsch pulverizer 2) to <150 μm particles before analysis.
The agate mortar was cleaned with high purity ethanol and then Milli-Q water, and dried by
compressed air before processing each sample. In between samples, ~15 g Hg-clean quartz sand was
processed in the same way as coal samples to monitor and minimize the possible cross-
contamination.
7.2.2. Hg and Hg isotope determinations
Hg concentrations in solid samples were determined by a combustion atomic absorption technique
(Milestone DMA-80). Hg extraction and purification for isotope analyses were performed following
a double-stage tube furnace combustion and acid trapping protocol. Trapping solutions were
analyzed by cold vapor atomic fluorescence spectrometry (CV-AFS, Brooks Rand Model III)
following EPA protocols (EPA-1631E, 2002). Hg isotope ratios in trapping solutions of CRMs and
samples (diluted to 20% (v/v) acid with a Hg concentration range of 1-2.5 ng/g) were determined by
cold vapor multi-collector inductively coupled plasma mass spectrometry (Thermo-Finnigan
Neptune) at the Midi-Pyrenees Observatory, Toulouse, France. The detailed protocols for Hg
concentration, extraction and isotope analysis can be found in Sun et al. (2013b).
7.2.3. Blank, recovery and uncertainty
The cross-contamination of Hg during sample pulverization and homogeneity was <1% of processed
samples (typically >200 ng Hg), as evaluated by clean quartz sand crushed in-between samples.
Besides, Hg concentrations in acid blanks and procedural blanks prepared along with samples were
consistently <0.03 ng/g, which is insignificant (<5%) as compared to trapping solutions of
combusted certified reference materials (CRM, NIST SRM 2685b and 1632d) and samples. All
analyzed CRMs and samples have Hg extraction recoveries between 80% and 120%, reflecting
quantitative Hg transfer from solid samples to trapping solutions in the limits of DMA-80 and AFS
100
Chapter 7. Hg stable isotope compositions of selected world coals
measurement uncertainties (±10%, 2RSD). The long-term external uncertainty of the method was
determined by repeated analyses of the UM-Almaden standard at various Hg concentrations (1-2.5
ng/g in 20% of 2HNO3/1HCl, v/v,) during different analysis sessions over 2011 and 2012. The
average value is −0.57±0.11‰ (2SD, n=53) for δ202Hg and −0.02±0.06‰ (2SD, n=53) for Δ199Hg
(Table A1 in Appendix A). The measured δ202Hg and Δ199Hg for long-term combusted procedural
NIST 1632d are −1.79±0.17‰ (2SD, n=10) and −0.04±0.05‰ (2SD, n=10), and for NIST 2685b are
−2.75±0.18‰ (2SD, n=11) and 0.01±0.05‰ (2SD, n=10) (Table A1 in Appendix A). The largest
values of the 2SD (e.g. δ202Hg uncertainty = 0.18‰, Δ199Hg uncertainty = 0.06‰ and Δ201Hg
uncertainty = 0.08‰) of the Hg isotope compositions for the procedural CRMs and UM-Almaden
were taken as the analytical uncertainties of sample Hg isotope compositions. If uncertainties of
replicate sample Hg isotope compositions were higher than these uncertainties, then the sample
replicates uncertainties applied.
7.3. Results and discussions
Background information, Hg concentrations and Hg isotope compositions in the studied 115 samples
(108 coal, 3 natural coke, 2 fly ash, 1 sapropel, 1 shungite) are summarized in Table A1 in Appendix
A, along with coal samples reported elsewhere.
7.3.1. Mercury isotope compositions
A 4.7‰ variation in δ202Hg values (−3.90 to 0.77±0.18‰, 2SD) is observed in the studied world
coals, which significantly expands the previously reported δ202Hg range of 3.4% (−2.98 to 0.45‰)
(Figure B1 in Appendix B). The MIF variation, both Δ199Hg (−0.55 to 0.33±0.06‰, 2SD) and
Δ201Hg (−0.48 to 0.25±0.08‰, 2SD) are similar to the previously reported 1% range (−0.63 to
0.34‰ for Δ199Hg and −0.53 to 0.29‰ for Δ201Hg). The Δ199Hg and Δ201Hg data set in our studied
coals define a Δ199Hg/Δ201Hg slope of 1.10±0.03 (2SE, n=108, P<0.001) (Figure 21A). By
incorporating previously reported coals, we obtain a Δ199Hg/Δ201Hg slope of 1.09±0.02 (2SE, n=155,
P<0.001) (Figure 21B). The Δ199Hg/Δ201Hg slope of world coals is within those (1.0-1.3) produced
during photo-reduction of Hg(II)-organic matter species in aqueous environments (Bergquist and
Blum, 2007; Zheng and Hintelmann, 2009).
101
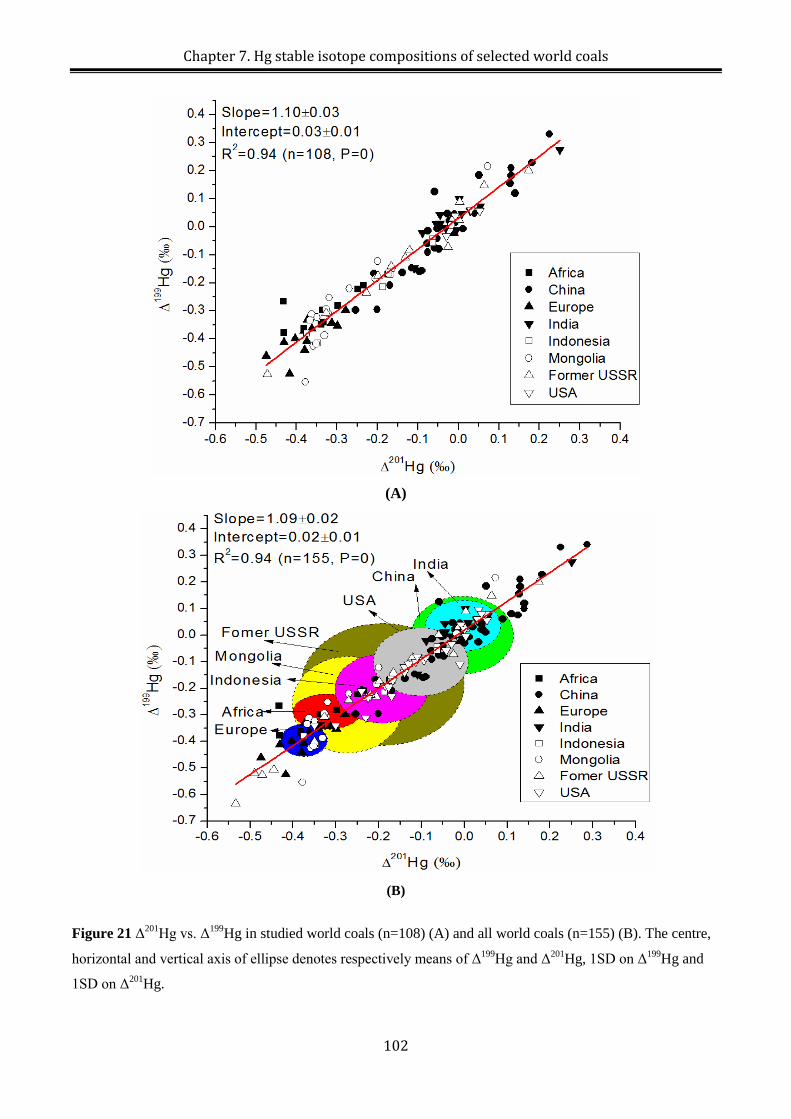
Chapter 7. Hg stable isotope compositions of selected world coals
(A)
(B)
Figure 21 Δ201Hg vs. Δ199Hg in studied world coals (n=108) (A) and all world coals (n=155) (B). The centre,
horizontal and vertical axis of ellipse denotes respectively means of Δ199Hg and Δ201Hg, 1SD on Δ199Hg and
1SD on Δ201Hg.
102
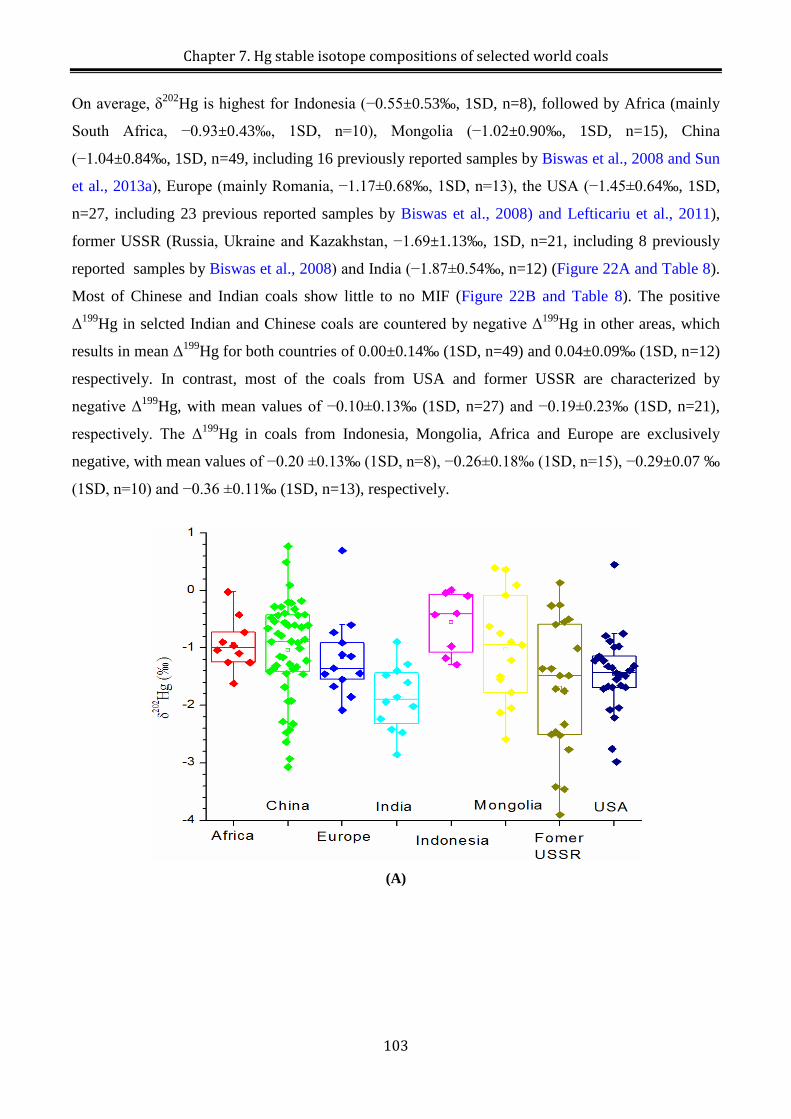
Chapter 7. Hg stable isotope compositions of selected world coals
On average, δ202Hg is highest for Indonesia (−0.55±0.53‰, 1SD, n=8), followed by Africa (mainly
South Africa, −0.93±0.43‰, 1SD, n=10), Mongolia (−1.02±0.90‰, 1SD, n=15), China
(−1.04±0.84‰, 1SD, n=49, including 16 previously reported samples by Biswas et al., 2008 and Sun
et al., 2013a), Europe (mainly Romania, −1.17±0.68‰, 1SD, n=13), the USA (−1.45±0.64‰, 1SD,
n=27, including 23 previous reported samples by Biswas et al., 2008) and Lefticariu et al., 2011),
former USSR (Russia, Ukraine and Kazakhstan, −1.69±1.13‰, 1SD, n=21, including 8 previously
reported samples by Biswas et al., 2008) and India (−1.87±0.54‰, n=12) (Figure 22A and Table 8).
Most of Chinese and Indian coals show little to no MIF (Figure 22B and Table 8). The positive
Δ199Hg in selcted Indian and Chinese coals are countered by negative Δ199Hg in other areas, which
results in mean Δ199Hg for both countries of 0.00±0.14‰ (1SD, n=49) and 0.04±0.09‰ (1SD, n=12)
respectively. In contrast, most of the coals from USA and former USSR are characterized by
negative Δ199Hg, with mean values of −0.10±0.13‰ (1SD, n=27) and −0.19±0.23‰ (1SD, n=21),
respectively. The Δ199Hg in coals from Indonesia, Mongolia, Africa and Europe are exclusively
negative, with mean values of −0.20 ±0.13‰ (1SD, n=8), −0.26±0.18‰ (1SD, n=15), −0.29±0.07 ‰
(1SD, n=10) and −0.36 ±0.11‰ (1SD, n=13), respectively.
(A)
103
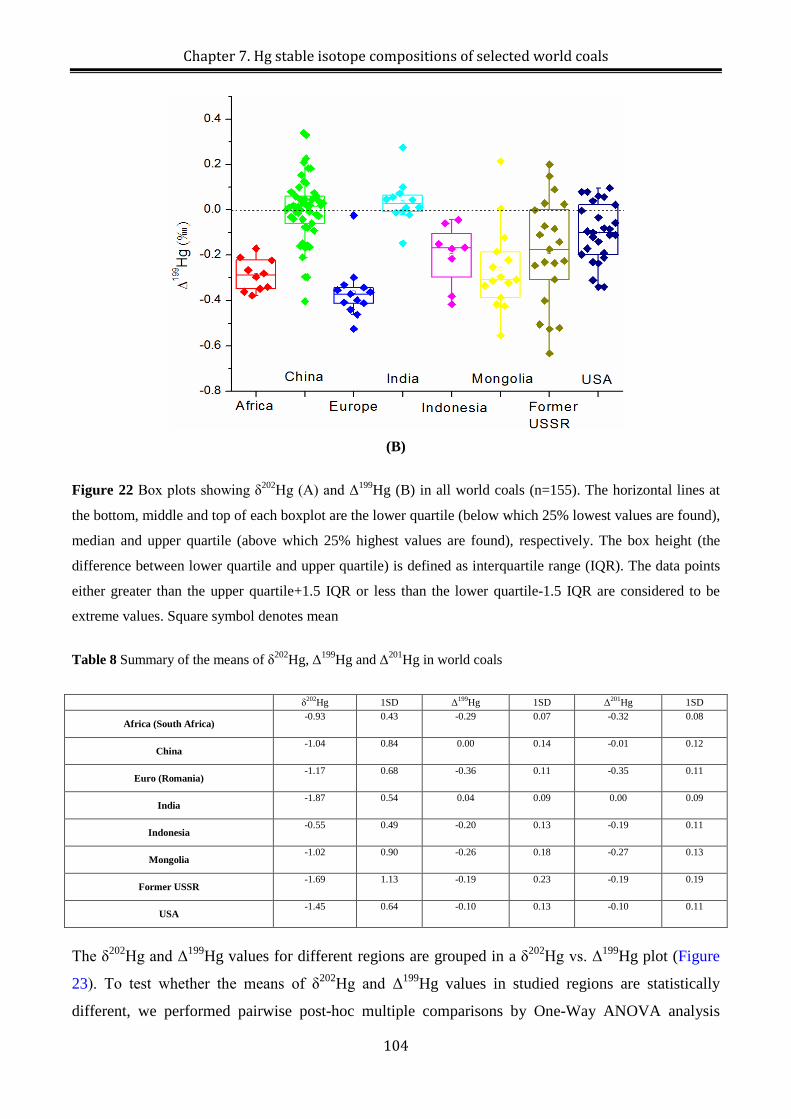
Chapter 7. Hg stable isotope compositions of selected world coals
(B)
Figure 22 Box plots showing δ202Hg (A) and Δ199Hg (B) in all world coals (n=155). The horizontal lines at
the bottom, middle and top of each boxplot are the lower quartile (below which 25% lowest values are found),
median and upper quartile (above which 25% highest values are found), respectively. The box height (the
difference between lower quartile and upper quartile) is defined as interquartile range (IQR). The data points
either greater than the upper quartile+1.5 IQR or less than the lower quartile-1.5 IQR are considered to be
extreme values. Square symbol denotes mean
Table 8 Summary of the means of δ202Hg, Δ199Hg and Δ201Hg in world coals
δ202Hg 1SD Δ199Hg 1SD Δ201Hg 1SD
Africa (South Africa) -0.93 0.43 -0.29 0.07 -0.32 0.08
China -1.04 0.84 0.00 0.14 -0.01 0.12
Euro (Romania) -1.17 0.68 -0.36 0.11 -0.35 0.11
India -1.87 0.54 0.04 0.09 0.00 0.09
Indonesia -0.55 0.49 -0.20 0.13 -0.19 0.11
Mongolia -1.02 0.90 -0.26 0.18 -0.27 0.13
Former USSR -1.69 1.13 -0.19 0.23 -0.19 0.19
USA -1.45 0.64 -0.10 0.13 -0.10 0.11
The δ202Hg and Δ199Hg values for different regions are grouped in a δ202Hg vs. Δ199Hg plot (Figure
23). To test whether the means of δ202Hg and Δ199Hg values in studied regions are statistically
different, we performed pairwise post-hoc multiple comparisons by One-Way ANOVA analysis
104
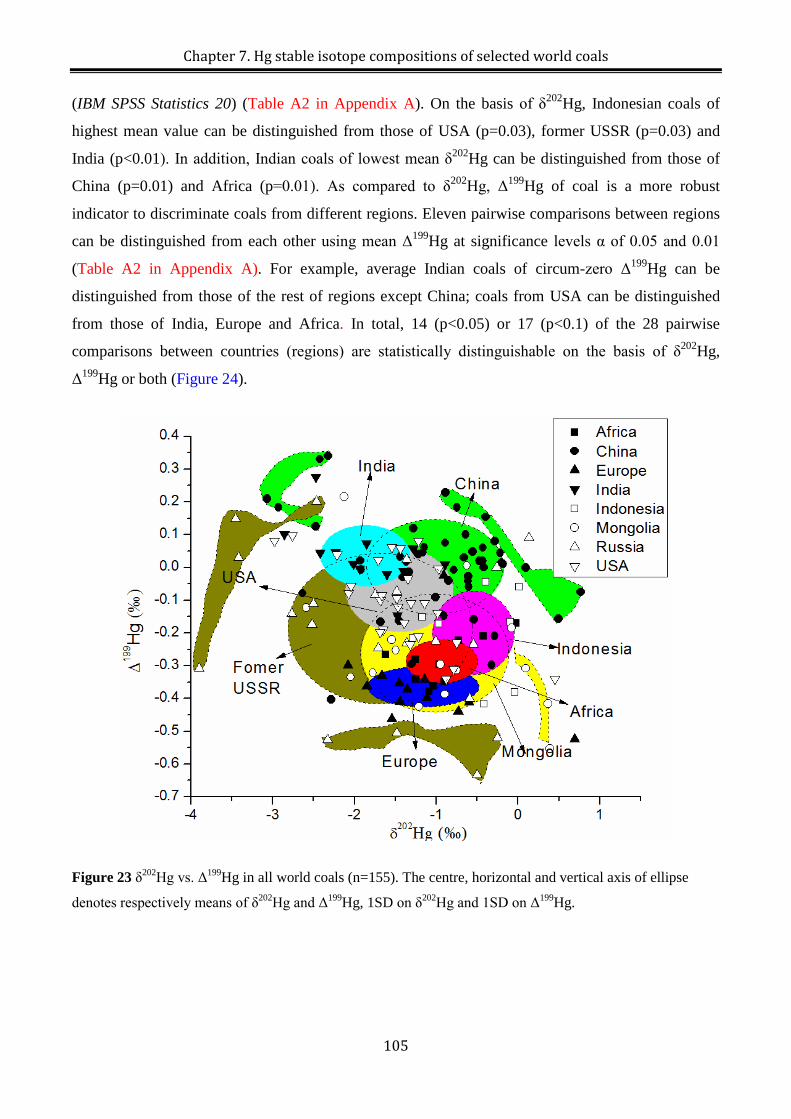
Chapter 7. Hg stable isotope compositions of selected world coals
(IBM SPSS Statistics 20) (Table A2 in Appendix A). On the basis of δ202Hg, Indonesian coals of
highest mean value can be distinguished from those of USA (p=0.03), former USSR (p=0.03) and
India (p<0.01). In addition, Indian coals of lowest mean δ202Hg can be distinguished from those of
China (p=0.01) and Africa (p=0.01). As compared to δ202Hg, Δ199Hg of coal is a more robust
indicator to discriminate coals from different regions. Eleven pairwise comparisons between regions
can be distinguished from each other using mean Δ199Hg at significance levels α of 0.05 and 0.01
(Table A2 in Appendix A). For example, average Indian coals of circum-zero Δ199Hg can be
distinguished from those of the rest of regions except China; coals from USA can be distinguished
from those of India, Europe and Africa. In total, 14 (p<0.05) or 17 (p<0.1) of the 28 pairwise
comparisons between countries (regions) are statistically distinguishable on the basis of δ202Hg,
Δ199Hg or both (Figure 24).
Figure 23 δ202Hg vs. Δ199Hg in all world coals (n=155). The centre, horizontal and vertical axis of ellipse
denotes respectively means of δ202Hg and Δ199Hg, 1SD on δ202Hg and 1SD on Δ199Hg.
105
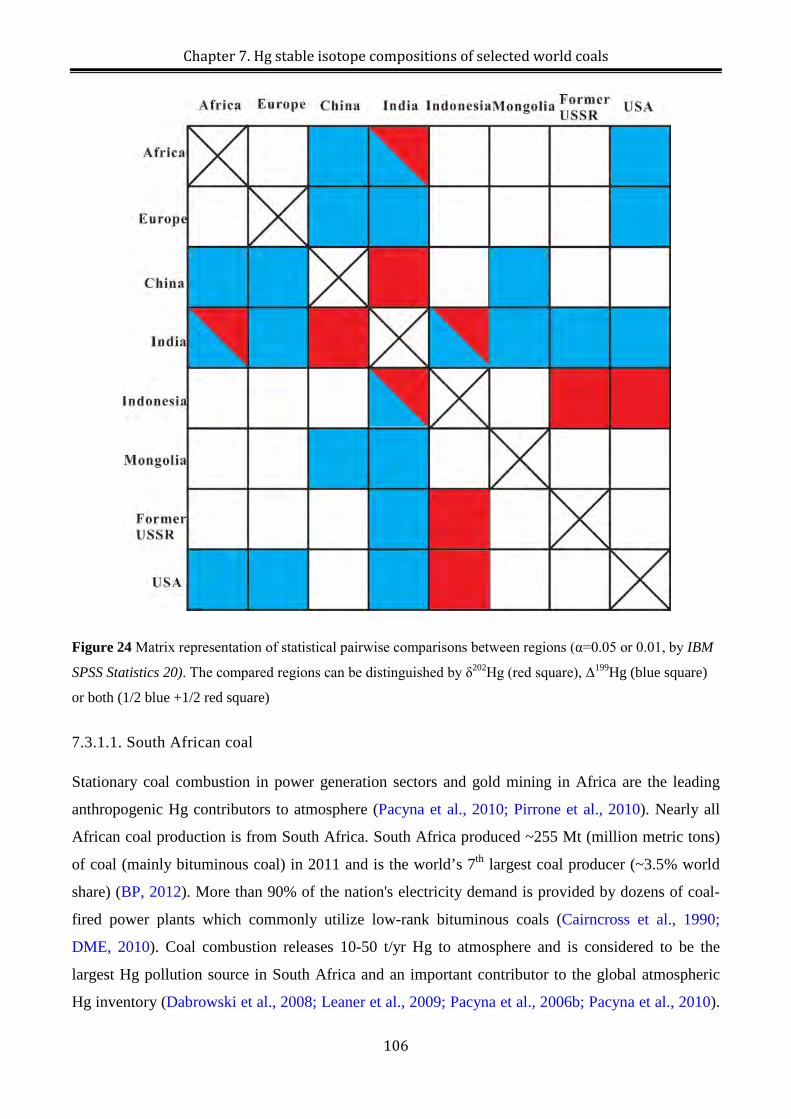
Chapter 7. Hg stable isotope compositions of selected world coals
Figure 24 Matrix representation of statistical pairwise comparisons between regions (α=0.05 or 0.01, by IBM
SPSS Statistics 20). The compared regions can be distinguished by δ202Hg (red square), Δ199Hg (blue square)
or both (1/2 blue +1/2 red square)
7.3.1.1. South African coal
Stationary coal combustion in power generation sectors and gold mining in Africa are the leading
anthropogenic Hg contributors to atmosphere (Pacyna et al., 2010; Pirrone et al., 2010). Nearly all
African coal production is from South Africa. South Africa produced ~255 Mt (million metric tons)
of coal (mainly bituminous coal) in 2011 and is the world’s 7th largest coal producer (~3.5% world
share) (BP, 2012). More than 90% of the nation's electricity demand is provided by dozens of coal-
fired power plants which commonly utilize low-rank bituminous coals (Cairncross et al., 1990;
DME, 2010). Coal combustion releases 10-50 t/yr Hg to atmosphere and is considered to be the
largest Hg pollution source in South Africa and an important contributor to the global atmospheric
Hg inventory (Dabrowski et al., 2008; Leaner et al., 2009; Pacyna et al., 2006b; Pacyna et al., 2010).
106
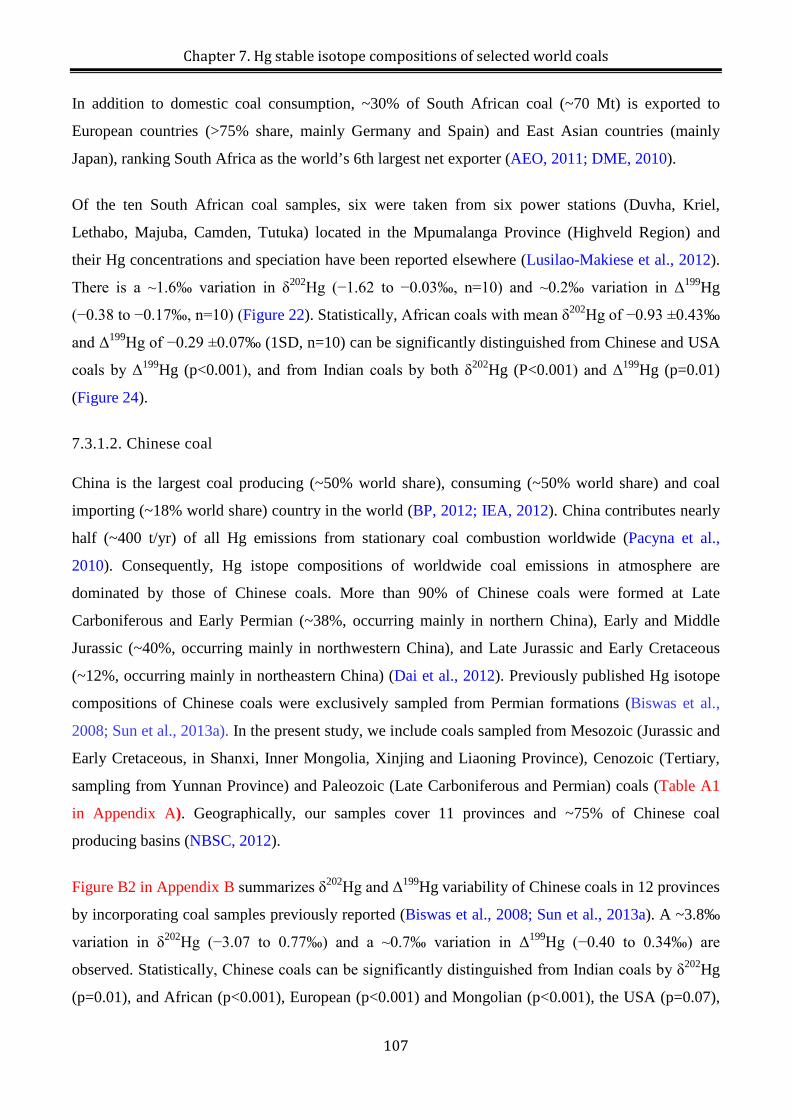
Chapter 7. Hg stable isotope compositions of selected world coals
In addition to domestic coal consumption, ~30% of South African coal (~70 Mt) is exported to
European countries (>75% share, mainly Germany and Spain) and East Asian countries (mainly
Japan), ranking South Africa as the world’s 6th largest net exporter (AEO, 2011; DME, 2010).
Of the ten South African coal samples, six were taken from six power stations (Duvha, Kriel,
Lethabo, Majuba, Camden, Tutuka) located in the Mpumalanga Province (Highveld Region) and
their Hg concentrations and speciation have been reported elsewhere (Lusilao-Makiese et al., 2012).
There is a ~1.6‰ variation in δ202Hg (−1.62 to −0.03‰, n=10) and ~0.2‰ variation in Δ199Hg
(−0.38 to −0.17‰, n=10) (Figure 22). Statistically, African coals with mean δ202Hg of −0.93 ±0.43‰
and Δ199Hg of −0.29 ±0.07‰ (1SD, n=10) can be significantly distinguished from Chinese and USA
coals by Δ199Hg (p<0.001), and from Indian coals by both δ202Hg (P<0.001) and Δ199Hg (p=0.01)
(Figure 24).
7.3.1.2. Chinese coal
China is the largest coal producing (~50% world share), consuming (~50% world share) and coal
importing (~18% world share) country in the world (BP, 2012; IEA, 2012). China contributes nearly
half (~400 t/yr) of all Hg emissions from stationary coal combustion worldwide (Pacyna et al.,
2010). Consequently, Hg istope compositions of worldwide coal emissions in atmosphere are
dominated by those of Chinese coals. More than 90% of Chinese coals were formed at Late
Carboniferous and Early Permian (~38%, occurring mainly in northern China), Early and Middle
Jurassic (~40%, occurring mainly in northwestern China), and Late Jurassic and Early Cretaceous
(~12%, occurring mainly in northeastern China) (Dai et al., 2012). Previously published Hg isotope
compositions of Chinese coals were exclusively sampled from Permian formations (Biswas et al.,
2008; Sun et al., 2013a). In the present study, we include coals sampled from Mesozoic (Jurassic and
Early Cretaceous, in Shanxi, Inner Mongolia, Xinjing and Liaoning Province), Cenozoic (Tertiary,
sampling from Yunnan Province) and Paleozoic (Late Carboniferous and Permian) coals (Table A1
in Appendix A). Geographically, our samples cover 11 provinces and ~75% of Chinese coal
producing basins (NBSC, 2012).
Figure B2 in Appendix B summarizes δ202Hg and Δ199Hg variability of Chinese coals in 12 provinces
by incorporating coal samples previously reported (Biswas et al., 2008; Sun et al., 2013a). A ~3.8‰
variation in δ202Hg (−3.07 to 0.77‰) and a ~0.7‰ variation in Δ199Hg (−0.40 to 0.34‰) are
observed. Statistically, Chinese coals can be significantly distinguished from Indian coals by δ202Hg
(p=0.01), and African (p<0.001), European (p<0.001) and Mongolian (p<0.001), the USA (p=0.07),
107
Chapter 7. Hg stable isotope compositions of selected world coals
former USSR (p=0.06) and Indonesian (p=0.09) coals by Δ199Hg (Table A2 in Appendix A and
Figure 24). A few of the coal deposits in China are characterized by significantly positive and
negative MIF. For example, coals from Inner Mongolia have positive Δ199Hg of 0.20±0.02‰ (1SD,
n=2), whereas coals from Henan and Shanxi Provinces are dominated by negative Δ199Hg with
values of −0.28±0.12‰ (1SD, n=2) and −0.10±0.19‰ (1SD, n=7), respectively.
Being able to distinguish coal Hg emissions from different provinces has important implication for
local and regional Hg tracing in China. Figure 25 shows the variations of δ202Hg and Δ199Hg in
different provinces. Based on the combined signatures of δ202Hg and Δ199Hg, we can distinguish
coals from the main coal-producing provinces, i.e. Inner Mongolia (26% national share), Shanxi
(23% share), Henan (5% share), Guizhou (4% share), Anhui (3% share).
Figure 25 δ202Hg vs. Δ199Hg in all Chinese coals (n=49).
7.3.1.3. European (Romania) coal
Anthropogenic Hg emissions in Europe (excluding former USSR) have decreased significantly since
the 1990s and stabilized at ~120 t/yr of which coal combustion in power plants and residential
boilers is still the largest contributor (Pacyna et al., 2006a; Streets et al., 2011). The top
anthropogenic Hg emitting countries are Poland, Yugoslavia and Romania in Eastern Europe, and
Germany, Spain, France, Italy and the United Kingdom in Western Europe (Pacyna et al., 2006a).
Our European coal samples were mainly from Romania. Only one coal sample was obtained from
France and Germany. Coal deposits in Germany and Romania were mainly formed in the Cenozoic
108
Chapter 7. Hg stable isotope compositions of selected world coals
and in ranks of subbituminous coal and lignite. Germany, which has an estimated coal reserve of
~40000 Mt (4.7% world share) is a moderate coal producing (1.1% world share) and consuming
(~2.1% world share) country. Romania also has abundant coal deposits (~290 Mt) and 30-40% of its
electricity relies on coal. France produces and consumes little coal as 80% of its electricity
production is from nuclear plants. Most of consumed coal in Eastern Europe is imported from South
Africa, South America, Australia, former USSR and the USA (Figure B3 in Appendix B). Coal
samples from Romania were collected in 2001 under the USGS WoCQI project (Tewalt et al., 2010),
and included 10 active mines (Valea de Brazi, Uricani, Barbateni, Lupeni, Paroseni, Vulcan,
Aninoasa, Livezeni, Lonea, and Petrila) in the Jiu Valley. The geochemistry, mineralogy and organic
petrography of these Oligocene bituminous coals can be found in Belkin et al., (2010).
There is a ~3.8‰ variation in δ202Hg (−2.08 to 0.70‰) and ~0.5‰ variation in Δ199Hg (−0.52 to
0.02‰) in European coals. By looking at box plots of European coals in Figure 22, one Romanian
coal (R11) has very abnormally positive δ202Hg (0.70±0.18‰, 2SD), and one French coal formed in
Carboniferous has typical Δ199Hg (−0.02±0.06‰, 2SD). Coals from Europe have the lowest Δ199Hg
values (mean=−0.36±0.11‰, 1SD, n=13) and can be statistically distinguished from China
(P<0.001), India (P<0.001) and USA (P<0.001). However, European coals cannot be distinguished
from other regions by δ202Hg (mean=−1.17±0.68‰, 1SD, n=13).
7.3.1.4. Indian coal
India is the world’s 4th coal producing (5.6% world share) and 3rd coal consuming country (7.9%
world share). The discrepancy between coal production and consumption implies that India has to
import a large amount of coal (~100 Mt/yr) from other coal exporters (e.g. Indonesia and Australia)
to satisfy its domestic need (Figure B3 in Appendix B). Coal combustion in thermal power plants is
also the most dominant anthropogenic Hg source to the atmosphere (Mukherjee et al., 2009; Pacyna
et al., 2010).
Indian coals show a ~2‰ variation in δ202Hg (−2.86 to −0.89‰) and ~0.4‰ variation in Δ199Hg
(−0.15 to 0.28‰). Indian coals were characterized by the lowest δ202Hg (−1.87±0.54‰, n=12), and
are distinguishable from coals of Indonesia (p<0.001), Africa (p<0.001) and China (p=0.01) with the
highest mean δ202Hg. In addition, MIF (−0.02 to 0.10‰ for Δ199Hg) is not significant in Indian coals
except for two samples from the Jharia coal basin (i.e. JB-3 and JR-3 with Δ199Hg of 0.28‰ and
−0.15%, respectively) (Figure 22B). On average, Δ199Hg in Indian coals is the highest (0.04±0.09‰,
109
Chapter 7. Hg stable isotope compositions of selected world coals
1SD, n=12). Except Chinese coals, Indian coals can be distinguished from all other coal producing
regions by Δ199Hg (Figure 24).
7.3.1.5. Indonesian coal
With ~0.6% world coal reserve, Indonesia has become the world’s 5th largest coal producing country
(5.1% world share) and the largest coal exporting country (~30% world share) (IEA, 2012).
Approximate 70-90% of the mined coal (~250-300 Mt) in Indonesia is exported primarily to Asia-
Pacific region (Japan, China and South Korea) (AEO, 2011; EIA, 2012; IEA, 2012) (Figure 5). Most
of Indonesian coals were formed during the Cenozoic (Paleogene and Neogene) and are of low to
moderate ranks (Belkin et al., 2009). The eight coal samples from Indonesia, sampled during the
USGS WoCQI project, were taken from the main coal-producing areas (Sumatra, Kalimantan,
Sulawesi and Papua) with ranks of sub-bituminous and high volatile bituminous coal. A detailed
description of the geochemistry and petrology of these coal samples was reported elsewhere (Belkin
et al., 2009).
In Indonesian coals, ~1.3‰ range in δ202Hg (−1.29 to 0.01‰) and ~0.4‰ in Δ199Hg (−0.42 to -
0.04‰) are observed (Figure 22). The δ202Hg in Indonesian coals is highest (−0.55±0.49‰, 1SD,
n=8) as compared to other regions, and is distinguishable from Indian (p<0.001), the USA (p=0.03)
and former USSR coals (p=0.03). On the basis of Δ199Hg (mean=−0.20±0.14‰, 1SD, n=8),
Indonesian coals can only be distinguished from Indian coal (p=0.03)
7.3.1.6. Mongolian coal
The International Energy Statistics 2008 of the EIA reported ~2500 Mt of total recoverable coals in
Mongolia (EIA, 2012). Recent coal survey reports estimated that the potential coal reserve in
Mongolia is >100 billion tons, accounting for ~10% of world coal reserves (M.L., 2013). Due to
poor infrastructure, coal production was only 30 Mt in 2011 of which >60% was exported primarily
to China. Coal production and export are expected to increase significantly in the near future because
of electricity demands in China. Mongolian coals were deposited in freshwater environments with
relatively low sulfur contents and were mainly hosted in Permian (low-rank bituminous coal) and
Cretaceous fomations (lignite) (Erdenetsogt et al., 2009). The 15 analyzed Mongolian samples were
selected from the 37 coals of the USGS WoCQI (Tewalt et al., 2010).
Mogolian coals show a ~3‰ variation in δ202Hg (−2.59 to 0.39‰) and ~0.8‰ variation in Δ199Hg
(−0.55 to 0.22‰) (Figure 22). Due to the predominantly negative Δ199Hg (−0.26±0.18‰, 1SD,
110
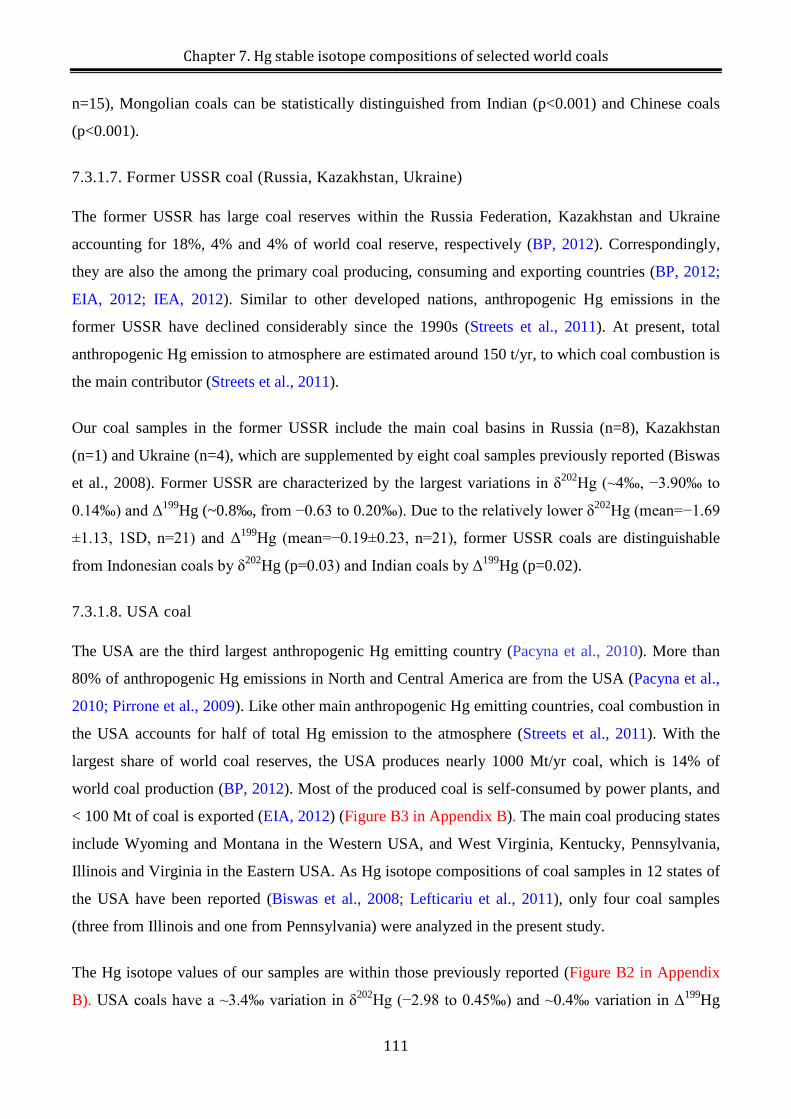
Chapter 7. Hg stable isotope compositions of selected world coals
n=15), Mongolian coals can be statistically distinguished from Indian (p<0.001) and Chinese coals
(p<0.001).
7.3.1.7. Former USSR coal (Russia, Kazakhstan, Ukraine)
The former USSR has large coal reserves within the Russia Federation, Kazakhstan and Ukraine
accounting for 18%, 4% and 4% of world coal reserve, respectively (BP, 2012). Correspondingly,
they are also the among the primary coal producing, consuming and exporting countries (BP, 2012;
EIA, 2012; IEA, 2012). Similar to other developed nations, anthropogenic Hg emissions in the
former USSR have declined considerably since the 1990s (Streets et al., 2011). At present, total
anthropogenic Hg emission to atmosphere are estimated around 150 t/yr, to which coal combustion is
the main contributor (Streets et al., 2011).
Our coal samples in the former USSR include the main coal basins in Russia (n=8), Kazakhstan
(n=1) and Ukraine (n=4), which are supplemented by eight coal samples previously reported (Biswas
et al., 2008). Former USSR are characterized by the largest variations in δ202Hg (~4‰, −3.90‰ to
0.14‰) and Δ199Hg (~0.8‰, from −0.63 to 0.20‰). Due to the relatively lower δ202Hg (mean=−1.69
±1.13, 1SD, n=21) and Δ199Hg (mean=−0.19±0.23, n=21), former USSR coals are distinguishable
from Indonesian coals by δ202Hg (p=0.03) and Indian coals by Δ199Hg (p=0.02).
7.3.1.8. USA coal
The USA are the third largest anthropogenic Hg emitting country (Pacyna et al., 2010). More than
80% of anthropogenic Hg emissions in North and Central America are from the USA (Pacyna et al.,
2010; Pirrone et al., 2009). Like other main anthropogenic Hg emitting countries, coal combustion in
the USA accounts for half of total Hg emission to the atmosphere (Streets et al., 2011). With the
largest share of world coal reserves, the USA produces nearly 1000 Mt/yr coal, which is 14% of
world coal production (BP, 2012). Most of the produced coal is self-consumed by power plants, and
< 100 Mt of coal is exported (EIA, 2012) (Figure B3 in Appendix B). The main coal producing states
include Wyoming and Montana in the Western USA, and West Virginia, Kentucky, Pennsylvania,
Illinois and Virginia in the Eastern USA. As Hg isotope compositions of coal samples in 12 states of
the USA have been reported (Biswas et al., 2008; Lefticariu et al., 2011), only four coal samples
(three from Illinois and one from Pennsylvania) were analyzed in the present study.
The Hg isotope values of our samples are within those previously reported (Figure B2 in Appendix
B). USA coals have a ~3.4‰ variation in δ202Hg (−2.98 to 0.45‰) and ~0.4‰ variation in Δ199Hg
111
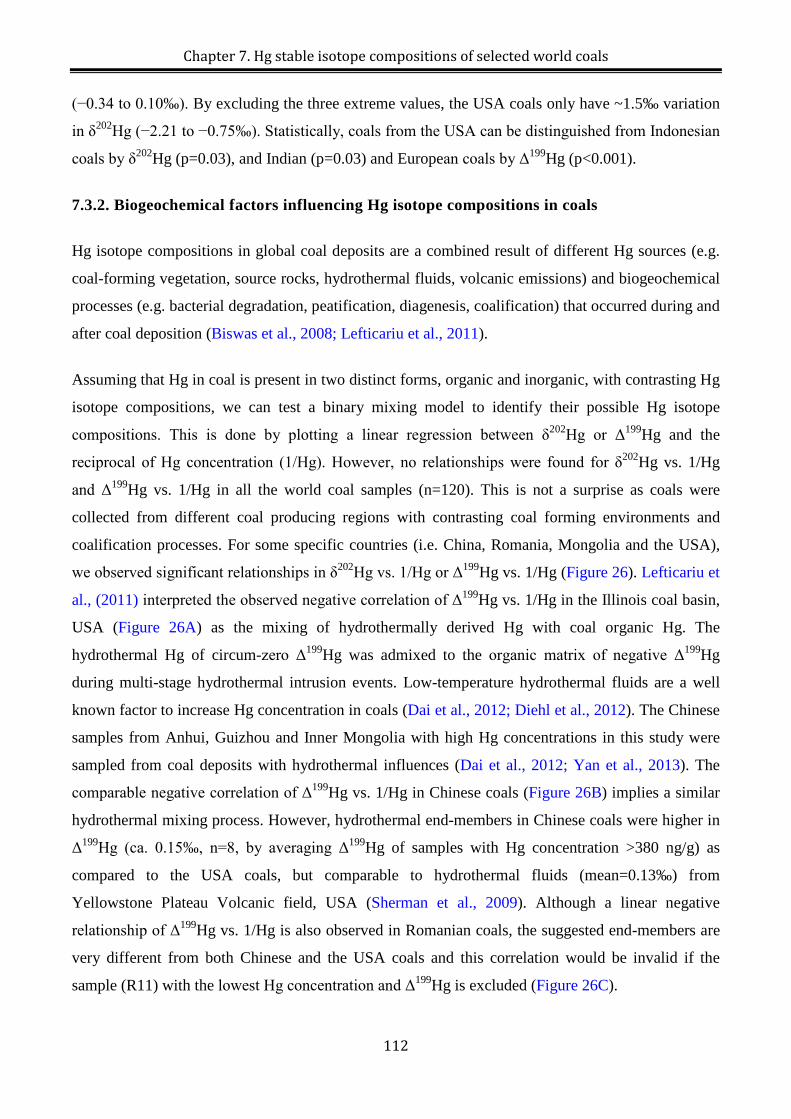
Chapter 7. Hg stable isotope compositions of selected world coals
(−0.34 to 0.10‰). By excluding the three extreme values, the USA coals only have ~1.5‰ variation
in δ202Hg (−2.21 to −0.75‰). Statistically, coals from the USA can be distinguished from Indonesian
coals by δ202Hg (p=0.03), and Indian (p=0.03) and European coals by Δ199Hg (p<0.001).
7.3.2. Biogeochemical factors influencing Hg isotope compositions in coals
Hg isotope compositions in global coal deposits are a combined result of different Hg sources (e.g.
coal-forming vegetation, source rocks, hydrothermal fluids, volcanic emissions) and biogeochemical
processes (e.g. bacterial degradation, peatification, diagenesis, coalification) that occurred during and
after coal deposition (Biswas et al., 2008; Lefticariu et al., 2011).
Assuming that Hg in coal is present in two distinct forms, organic and inorganic, with contrasting Hg
isotope compositions, we can test a binary mixing model to identify their possible Hg isotope
compositions. This is done by plotting a linear regression between δ202Hg or Δ199Hg and the
reciprocal of Hg concentration (1/Hg). However, no relationships were found for δ202Hg vs. 1/Hg
and Δ199Hg vs. 1/Hg in all the world coal samples (n=120). This is not a surprise as coals were
collected from different coal producing regions with contrasting coal forming environments and
coalification processes. For some specific countries (i.e. China, Romania, Mongolia and the USA),
we observed significant relationships in δ202Hg vs. 1/Hg or Δ199Hg vs. 1/Hg (Figure 26). Lefticariu et
al., (2011) interpreted the observed negative correlation of Δ199Hg vs. 1/Hg in the Illinois coal basin,
USA (Figure 26A) as the mixing of hydrothermally derived Hg with coal organic Hg. The
hydrothermal Hg of circum-zero Δ199Hg was admixed to the organic matrix of negative Δ199Hg
during multi-stage hydrothermal intrusion events. Low-temperature hydrothermal fluids are a well
known factor to increase Hg concentration in coals (Dai et al., 2012; Diehl et al., 2012). The Chinese
samples from Anhui, Guizhou and Inner Mongolia with high Hg concentrations in this study were
sampled from coal deposits with hydrothermal influences (Dai et al., 2012; Yan et al., 2013). The
comparable negative correlation of Δ199Hg vs. 1/Hg in Chinese coals (Figure 26B) implies a similar
hydrothermal mixing process. However, hydrothermal end-members in Chinese coals were higher in
Δ199Hg (ca. 0.15‰, n=8, by averaging Δ199Hg of samples with Hg concentration >380 ng/g) as
compared to the USA coals, but comparable to hydrothermal fluids (mean=0.13‰) from
Yellowstone Plateau Volcanic field, USA (Sherman et al., 2009). Although a linear negative
relationship of Δ199Hg vs. 1/Hg is also observed in Romanian coals, the suggested end-members are
very different from both Chinese and the USA coals and this correlation would be invalid if the
sample (R11) with the lowest Hg concentration and Δ199Hg is excluded (Figure 26C).
112
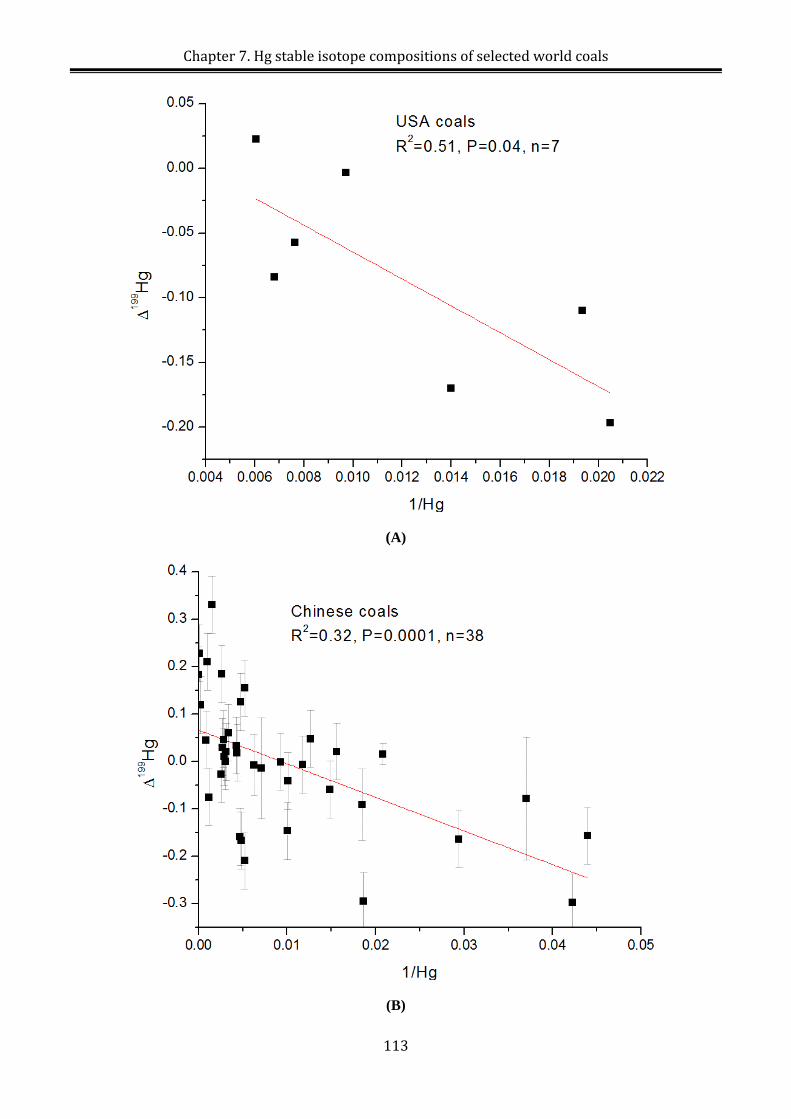
Chapter 7. Hg stable isotope compositions of selected world coals
(A)
(B)
113
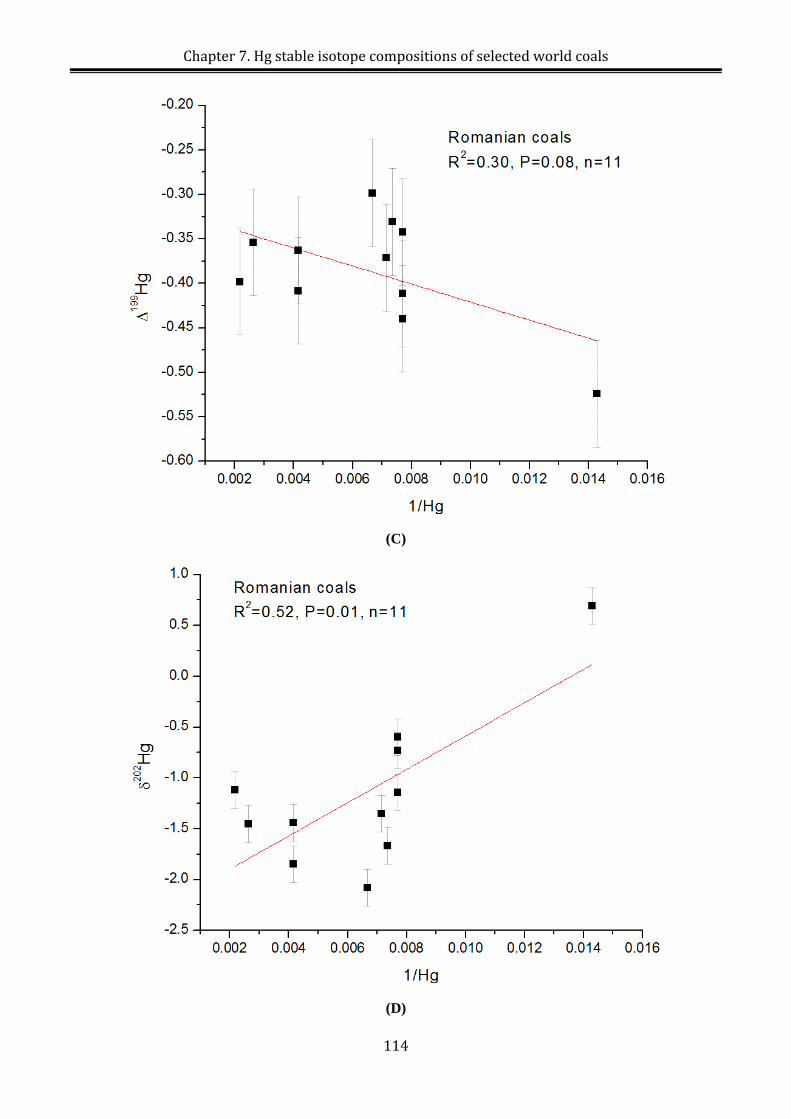
Chapter 7. Hg stable isotope compositions of selected world coals
(C)
(D)
114
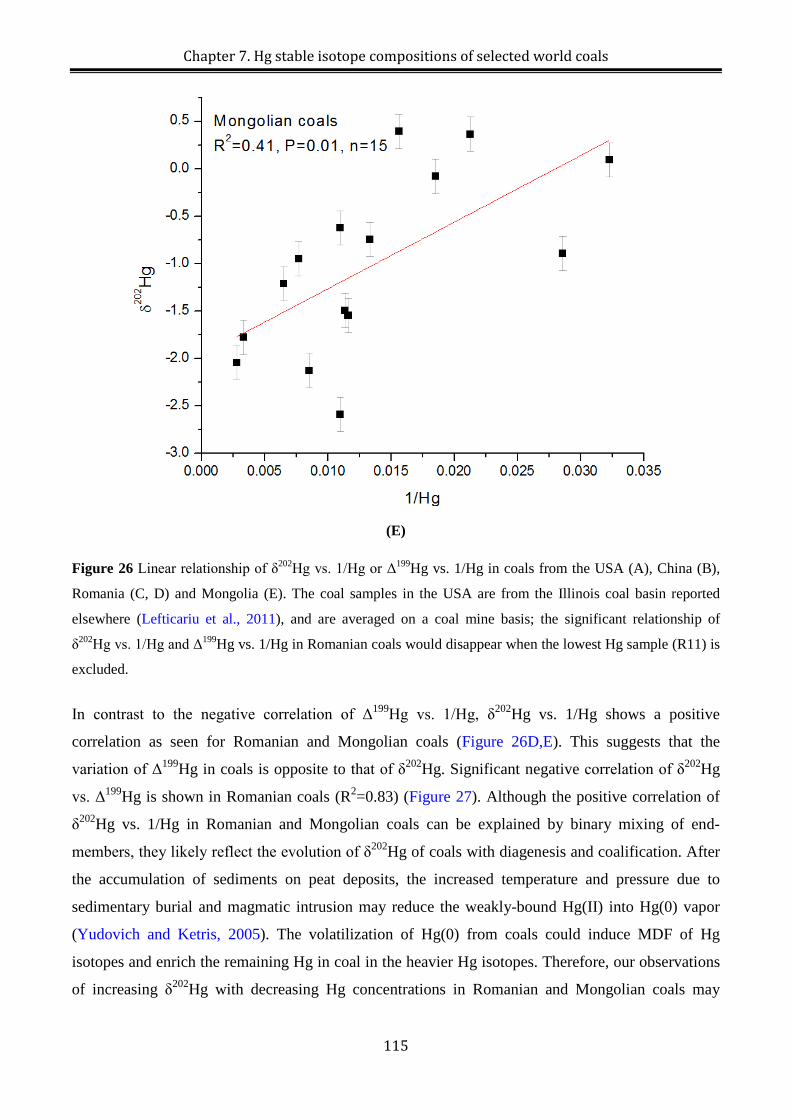
Chapter 7. Hg stable isotope compositions of selected world coals
(E)
Figure 26 Linear relationship of δ202Hg vs. 1/Hg or Δ199Hg vs. 1/Hg in coals from the USA (A), China (B),
Romania (C, D) and Mongolia (E). The coal samples in the USA are from the Illinois coal basin reported
elsewhere (Lefticariu et al., 2011), and are averaged on a coal mine basis; the significant relationship of
δ202Hg vs. 1/Hg and Δ199Hg vs. 1/Hg in Romanian coals would disappear when the lowest Hg sample (R11) is
excluded.
In contrast to the negative correlation of Δ199Hg vs. 1/Hg, δ202Hg vs. 1/Hg shows a positive
correlation as seen for Romanian and Mongolian coals (Figure 26D,E). This suggests that the
variation of Δ199Hg in coals is opposite to that of δ202Hg. Significant negative correlation of δ202Hg
vs. Δ199Hg is shown in Romanian coals (R2=0.83) (Figure 27). Although the positive correlation of
δ202Hg vs. 1/Hg in Romanian and Mongolian coals can be explained by binary mixing of end-
members, they likely reflect the evolution of δ202Hg of coals with diagenesis and coalification. After
the accumulation of sediments on peat deposits, the increased temperature and pressure due to
sedimentary burial and magmatic intrusion may reduce the weakly-bound Hg(II) into Hg(0) vapor
(Yudovich and Ketris, 2005). The volatilization of Hg(0) from coals could induce MDF of Hg
isotopes and enrich the remaining Hg in coal in the heavier Hg isotopes. Therefore, our observations
of increasing δ202Hg with decreasing Hg concentrations in Romanian and Mongolian coals may
115
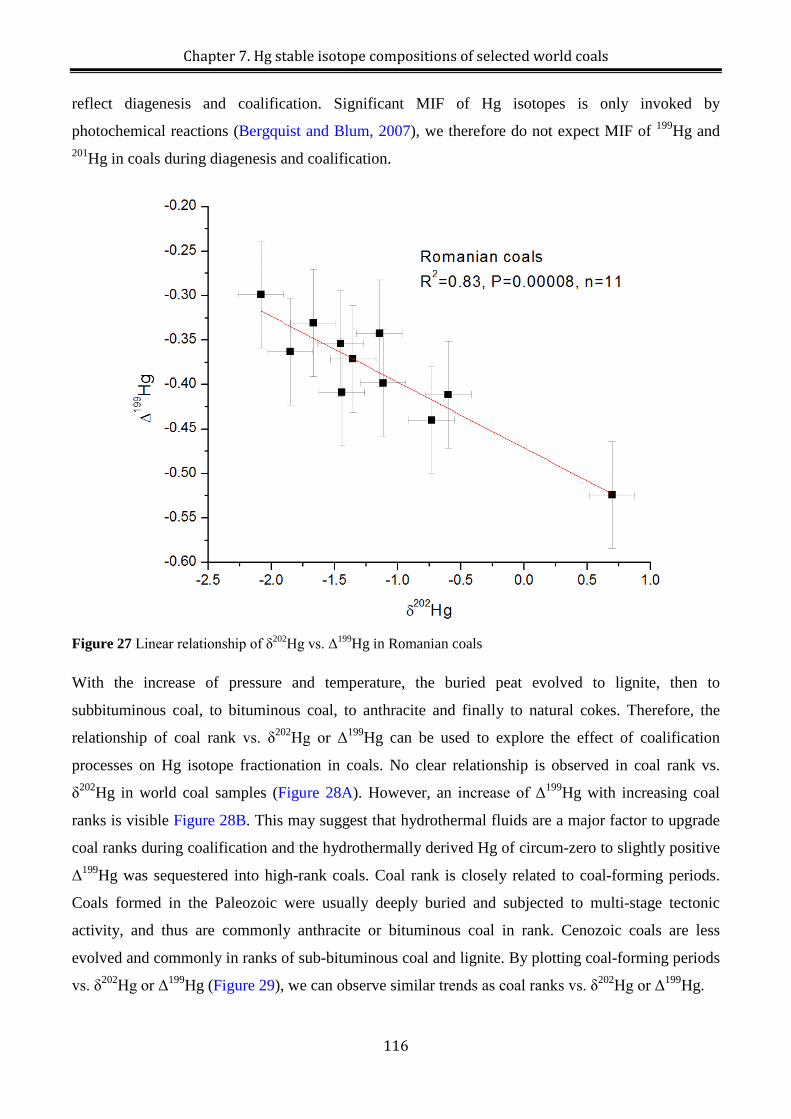
Chapter 7. Hg stable isotope compositions of selected world coals
reflect diagenesis and coalification. Significant MIF of Hg isotopes is only invoked by
photochemical reactions (Bergquist and Blum, 2007), we therefore do not expect MIF of 199Hg and 201Hg in coals during diagenesis and coalification.
Figure 27 Linear relationship of δ202Hg vs. Δ199Hg in Romanian coals
With the increase of pressure and temperature, the buried peat evolved to lignite, then to
subbituminous coal, to bituminous coal, to anthracite and finally to natural cokes. Therefore, the
relationship of coal rank vs. δ202Hg or Δ199Hg can be used to explore the effect of coalification
processes on Hg isotope fractionation in coals. No clear relationship is observed in coal rank vs.
δ202Hg in world coal samples (Figure 28A). However, an increase of Δ199Hg with increasing coal
ranks is visible Figure 28B. This may suggest that hydrothermal fluids are a major factor to upgrade
coal ranks during coalification and the hydrothermally derived Hg of circum-zero to slightly positive
Δ199Hg was sequestered into high-rank coals. Coal rank is closely related to coal-forming periods.
Coals formed in the Paleozoic were usually deeply buried and subjected to multi-stage tectonic
activity, and thus are commonly anthracite or bituminous coal in rank. Cenozoic coals are less
evolved and commonly in ranks of sub-bituminous coal and lignite. By plotting coal-forming periods
vs. δ202Hg or Δ199Hg (Figure 29), we can observe similar trends as coal ranks vs. δ202Hg or Δ199Hg.
116
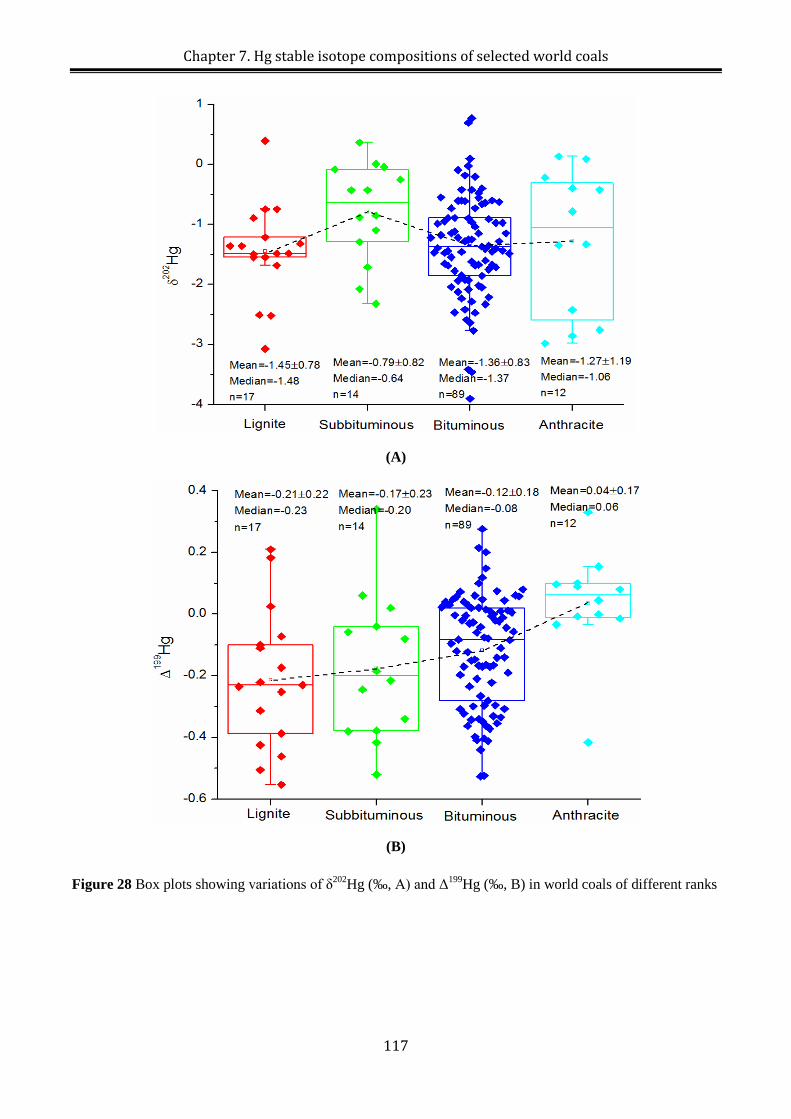
Chapter 7. Hg stable isotope compositions of selected world coals
(A)
(B)
Figure 28 Box plots showing variations of δ202Hg (‰, A) and Δ199Hg (‰, B) in world coals of different ranks
117
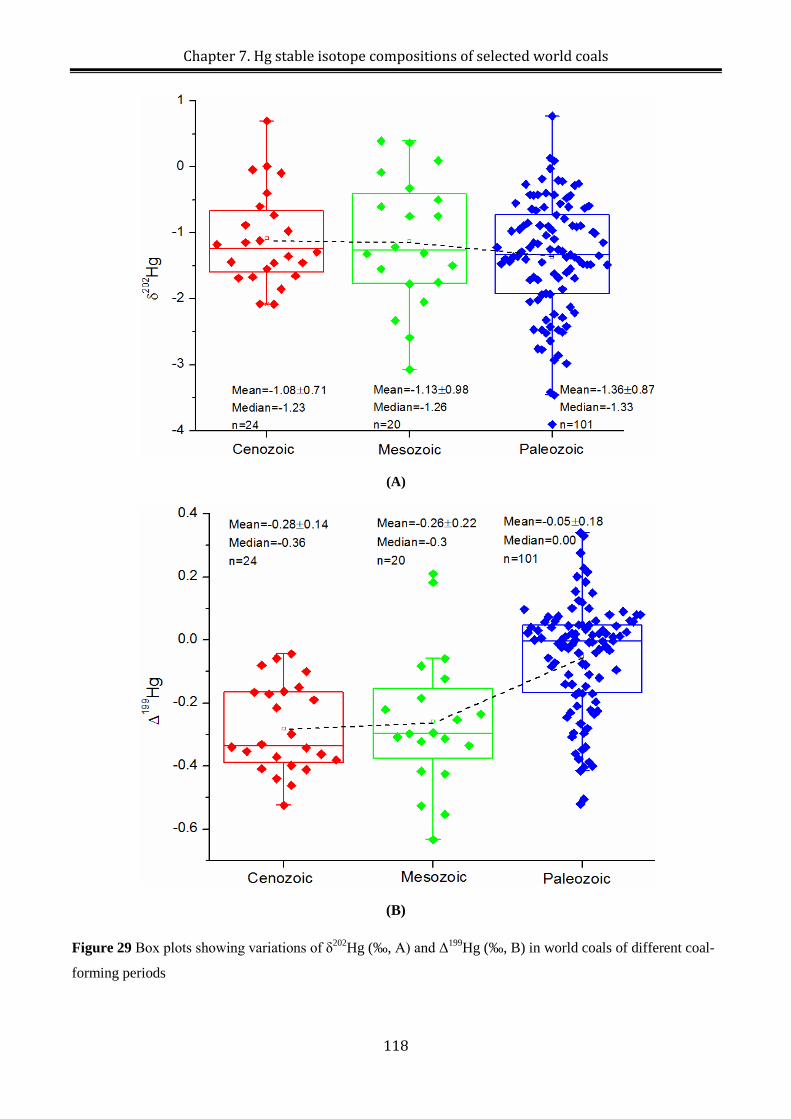
Chapter 7. Hg stable isotope compositions of selected world coals
(A)
(B)
Figure 29 Box plots showing variations of δ202Hg (‰, A) and Δ199Hg (‰, B) in world coals of different coal-
forming periods
118
Chapter 7. Hg stable isotope compositions of selected world coals
7.3.3. Industrial processes influencing Hg isotope compositions of coal Hg emissions
Before application of Hg isotope signatures to trace Hg emission from coals, it should be noted that a
number of industrial processes during coal preparation and utilization potentially fractionate Hg
isotopes in coal, and thus generate coal related products (e.g. stack flue gas in coal-fired power
plants) with Hg isotope compositions that are significantly different from raw coals. As most of the
produced coals are combusted in CFUB of power plants for electricity generation, we will discuss
below the Hg isotope fractionation caused by coal preparation and combustion
7.3.3.1 Coal preparation
Coal cleaning before combustion in CFUB is a low-cost, common practice for power plants to
remove pyritic sulfur and ash along with their associated hazardous air pollutants including Hg
(Akers, 1996). Due to the high affinity of Hg with pyrite, 10-70% of coal Hg can be removed,
depending on different coal cleaning techniques and physicochemical characteristics of coal (Pavlish
et al., 2003). Different Hg-binding components in coal were shown to carry different Hg isotope
compositions (Lefticariu et al., 2011). These authors found that pyrite has circum-zero δ202Hg and
Δ199Hg which is enriched by 0.9-1.3‰ and 0.04-0.15‰, respectively, relative to their corresponding
organic Hg components in coal. This suggests that the removal of pyrite fractions during coal
preparation would possibly decrease δ202Hg and Δ199Hg of coal. The degree to which δ202Hg and
Δ199Hg in cleaned coal are fractionated from raw coal is determined by the Hg removal efficiency,
and the differences of δ202Hg and Δ199Hg between raw coal and coal rejections (primarily pyrite).
δ202Hg and Δ199Hg in clean coal can be estimated by Hg isotope mass balance for δ202Hg and Δ199Hg:
202 199 202 199 202 199RC RC CC CC CC PY CR CRHg ( Hg )= Hg ( Hg ) Hg ( Hg )δ δ ϕ δ ϕ∆ ∆ × + ∆ ×
CC CR 1ϕ ϕ+ =
where subscript RC, CC and CR stand for raw coal, clean coal and coal rejections, respectively.
Given Hg removal fraction in coal rejections (φCR), δ202Hg and Δ199Hg in coal rejections (assuming
to be zero, identical to those of pyrite), δ202Hg and Δ199Hg in clean coal can be expressed as:
7.3.3.2. Coal combustion in CFUBs
202 199202 199 RC RC
CC CCCR
Hg ( Hg )Hg ( Hg )=(1 )
δδϕ∆
∆−
119
Chapter 7. Hg stable isotope compositions of selected world coals
By measuring the Hg isotope compositions of feed coal, bottom ash, fly ash, and desulfurization by-
product gypsum, Sun et al., (2013a) used a Hg isotope mass balance equation to infer that coal
combustion flue gases emitted at the stack are enriched by at most 0.3‰ in δ202Hg relative to feed
coal. No obvious MIF of Hg isotopes was observed during coal combustion and downstream
transport of combusted flue gases through air pollution control devices (APCD, i.e. electrostatic
precipitators, ESP; Wet flue gas desulphurization systems, WFGD). Significant Hg isotope
fractionation probably occurs during coal combustion in CFUBs, i.e.GEM transformation into GOM
and PBM during downstream transport of flue gases. Depending on the types of combustion boilers,
varying proportions of feed coal Hg can be retained in the boiler or bottom ash. Previous studies
(Pavlish et al., 2003; Streets et al., 2009) concluded that Hg retention is negligible (1-2%) for
pulverized boilers, which are the dominant boiler type. However, other boiler types such as stoker
boilers and fluidized-bed boilers can have >7% Hg retention. A 7% retention would be too low to
shift the Hg isotope compositions of the generated GEM from those of feed coal given the high
temperatures (>500 °C) (Schauble, 2007).
Another important Hg isotope fractionation processes happens between the outlet of boiler and the
inlet of APCDs where a fraction of GEM is oxidized into GOM and PBM. For CFUBs equipped with
ESP and WFGD, the produced PBM and GOM will be sequentially removed with fly ash in the ESP
and with gypsum in WFGD. Emitted flue gases are in such case primarily composed of GEM. Our
observations on PBM (fly ash) and GOM (gypsum) show that they are significantly enriched in the
lighter Hg isotopes relative to feed coals, suggesting the emitted GEM to be enriched in the heavier
Hg isotopes by up to 0.3‰ (Sun et al., 2013a). Preliminary direct species-specific Hg isotope
measurement on stack emission components let to an identical conclusion (Khawaja et al., 2010).
However, the fractionation mechanisms, extent, and signs among GEM, GOM and PBM species in
emitted flue gas should be further explored, as they are critical in near-field and far-field coal Hg
emission tracing.
7.3.4. Coal import-export flow control on a regional/national coal Hg isotope emission
inventory
In order to distinguish coal Hg emissions from different regions, it is necessary to develop a Hg
isotope emission inventory of combusted coals on a regional/national basis. Specific countries that
rely on coal import from other regions (Figure B3 in Appendix B) can be expected to have different
Hg isotope compositions of coal emissions than those based on use of indigenous coals only. This
depends on the ratio of exported and indigenous coal consumption and their differences in Hg
120
Chapter 7. Hg stable isotope compositions of selected world coals
isotope compositions. For the regions that are indistinguishable based on δ202Hg and Δ199Hg (Figure
24), Hg isotope change in consumed coals due to coal import-export trades is thought to be small,
whereas significant Hg isotope change can be seen among distinguishable regions when imported
coal becomes comparable to or exceeds indigenous coal consumption. For example, the import of
South African coals to Europe does not seem to significantly shift the Hg isotope compositions of
European coals due to similar Hg isotope compositions. Although export of South African coals to
India has increased recently, its share relative to the large coal production in India is very small and
can’t significantly change the Hg isotope compositions of Indian coal Hg emissions.
7.4. Implications
The coal Hg isotope library we created has been an important first step in tracing coal Hg emissions.
The significant differences in δ202Hg and Δ199Hg between regions allow us to distinguish coal Hg
emissions from different regions. Combing historical coal production statistics, coal import-export
statistics, and Hg removal efficiencies by APCDs during coal combustion, we can reconstruct an all-
time historical evolution of the Hg isotope compositions of atmospheric coal Hg emissions. Where
we have enough information, such a Hg isotope emission inventory can be made on a
regional/national basis. We can then start to understand and explain the Hg isotope information in
natural archives such as peat, sediment and ice cores or soils and biomonitors. A preliminary Hg
isotope evolution model of world coals from 1815-2010 is shown in Figure B4 of Appendix B.
δ202Hg in world coals progressively decreases from ~−1.2‰ at the dawn of the industrial revolution
to ~−1.35‰ during the world war II, and then returned back to ~−1.2‰ in the new millennium. In
contrast, Δ199Hg and Δ201Hg in world coal emissions progressively increased from ~−0.3 to ~−0.1 ‰.
We expect that Δ199Hg and Δ201Hg of world coal Hg emissions have similar values and trends of
world coals, as pre- and post-combustion processes do not shift Δ199Hg and Δ201Hg of coal Hg
emissions relative to raw coals. However, δ202Hg in world coal emissions is difficult to estimate
without the information on Hg removal efficiencies of pre- and post-combustion processes. Pyrite Hg
removal before coal combustion enriches combusted coals in the lighter Hg isotopes relative to raw
coals, whereas Hg removal by APCDs enriches coal Hg emissions in the heavier Hg isotopes.
Acknowledgements
This work is supported by research grants ANR-09-JCJC-0035-01 from the French Agence
Nationale de Recherche and ERC-2010-StG_20091028 from the European Research Council to JES.
RS acknowledges his PhD scholarship from the Chinese Scholarship Council.
121
Chapter 7. Hg stable isotope compositions of selected world coals
References
AEO, 2011. Annual Energy Outlook Report: Flows By Importing Regions and Exporting Countries.
Akers, D.J., 1996. Coal cleaning controls HAP emissions. Journal Name: Power Engineering (Barrington);
Journal Volume: 100; Journal Issue: 6; Other Information: PBD: Jun 1996, Medium: X; Size: pp. 33-
36.
Belkin, H.E., Tewalt, S.J., Hower, J.C., Stucker, J.D., O'Keefe, J.M.K., 2009. Geochemistry and petrology of
selected coal samples from Sumatra, Kalimantan, Sulawesi, and Papua, Indonesia. International
Journal of Coal Geology 77, 260-268.
Belkin, H.E., Tewalt, S.J., Hower, J.C., Stucker, J.D., O'Keefe, J.M.K., Tatu, C.A., Buia, G., 2010.
Petrography and geochemistry of Oligocene bituminous coal from the Jiu Valley, Petroşani basin
(southern Carpathian Mountains), Romania. International Journal of Coal Geology 82, 68-80.
Bergquist, B.A., Blum, J.D., 2007. Mass-Dependent and -Independent Fractionation of Hg Isotopes by
Photoreduction in Aquatic Systems. Science 318, 417-420.
Biswas, A., Blum, J.D., Bergquist, B.A., Keeler, G.J., Xie, Z., 2008. Natural Mercury Isotope Variation in
Coal Deposits and Organic Soils. Environmental Science & Technology 42, 8303-8309.
BP, 2012. BP (Petroleum British) Statistical Review of World Energy (2011).
Cairncross, B., Hart, R.J., Willis, J.P., 1990. Geochemistry and sedimentology of coal seams from the Permian
Witbank Coalfield, South Africa; a means of identification. International Journal of Coal Geology 16,
309-325.
Chen, J., Hintelmann, H., Feng, X., Dimock, B., 2012. Unusual fractionation of both odd and even mercury
isotopes in precipitation from Peterborough, ON, Canada. Geochimica et Cosmochimica Acta 90, 33-
46.
Dabrowski, J.M., Ashton, P.J., Murray, K., Leaner, J.J., Mason, R.P., 2008. Anthropogenic mercury emissions
in South Africa: Coal combustion in power plants. Atmospheric Environment 42, 6620-6626.
Dai, S., Ren, D., Chou, C.-L., Finkelman, R.B., Seredin, V.V., Zhou, Y., 2012. Geochemistry of trace
elements in Chinese coals: A review of abundances, genetic types, impacts on human health, and
industrial utilization. International Journal of Coal Geology 94, 3-21.
Diehl, S.F., Goldhaber, M.B., Koenig, A.E., Lowers, H.A., Ruppert, L.F., 2012. Distribution of arsenic,
selenium, and other trace elements in high pyrite Appalachian coals: Evidence for multiple episodes
of pyrite formation. International Journal of Coal Geology 94, 238-249.
DME, 2010. Digest of South African Energy Statistics 2009. Department of Minerals and Energy Pretoria
EIA, 2012. International Energy Statistics 2008: coal, in: Administration, U.S.E.I. (Ed.).
EPA-1631E, 2002. Mercury in Water by Oxidation, Purge and Trap, and Cold Vapor Atomic Fluorescence
Spectrometry.
122
Chapter 7. Hg stable isotope compositions of selected world coals
Erdenetsogt, B.-O., Lee, I., Bat-Erdene, D., Jargal, L., 2009. Mongolian coal-bearing basins: Geological
settings, coal characteristics, distribution, and resources. International Journal of Coal Geology 80, 87-
104.
Estrade, N., Carignan, J., Donard, O.F.X., 2010. Isotope Tracing of Atmospheric Mercury Sources in an
Urban Area of Northeastern France. Environmental Science & Technology 44, 6062-6067.
Estrade, N., Carignan, J., Donard, O.F.X., 2011. Tracing and Quantifying Anthropogenic Mercury Sources in
Soils of Northern France Using Isotopic Signatures. Environmental Science & Technology 45, 1235-
1242.
Estrade, N., Carignan, J., Sonke, J.E., Donard, O.F.X., 2009. Mercury isotope fractionation during liquid-
vapor evaporation experiments. Geochimica et Cosmochimica Acta 73, 2693-2711.
IEA, 2012. Key World Energy Statistics 2012.
Ketris, M.P., Yudovich, Y.E., 2009. Estimations of Clarkes for Carbonaceous biolithes: World averages for
trace element contents in black shales and coals. International Journal of Coal Geology 78, 135-148.
Leaner, J., Dabrowski, J., Mason, R., Resane, T., Richardson, M., Ginster, M., Gericke, G., Petersen, C.,
Masekoameng, E., Ashton, P., Murray, K., 2009. Mercury emissions from point sources in South
Africa, in: Mason, R., Pirrone, N. (Eds.), Mercury Fate and Transport in the Global Atmosphere.
Springer US, pp. 113-130.
Lefticariu, L., Blum, J.D., Gleason, J.D., 2011. Mercury Isotopic Evidence for Multiple Mercury Sources in
Coal from the Illinois Basin. Environmental Science & Technology 45, 1724-1729.
Lusilao-Makiese, J., Tessier, E., Amouroux, D., Tutu, H., Chimuka, L., Cukrowska, E.M., 2012. Speciation of
mercury in South African coals. Toxicological & Environmental Chemistry 94, 1688-1706.
M.L., 2013. Mongolia 2013: Coal & Power generation Mining leader 22-27.
Mead, C., Johnson, T.M., 2010. Hg stable isotope analysis by the double-spike method. Analytical and
Bioanalytic Chemistry 397, 1529-1538.
Mukherjee, A., Bhattacharya, P., Sarkar, A., Zevenhoven, R., 2009. Mercury emissions from industrial
sources in India and its effects in the environment, in: Mason, R., Pirrone, N. (Eds.), Mercury Fate and
Transport in the Global Atmosphere. Springer US, pp. 81-112.
NBSC, 2012. Statistical bulletin of national economic and social development in 2011, People's Republic of
China Beijing.
Pacyna, E.G., Pacyna, J.M., Fudala, J., Strzelecka-Jastrzab, E., Hlawiczka, S., Panasiuk, D., 2006a. Mercury
emissions to the atmosphere from anthropogenic sources in Europe in 2000 and their scenarios until
2020. Science of Total Environment 370, 147-156.
Pacyna, E.G., Pacyna, J.M., Steenhuisen, F., Wilson, S., 2006b. Global anthropogenic mercury emission
inventory for 2000. Atmospheric Environment 40, 4048-4063.
Pacyna, E.G., Pacyna, J.M., Sundseth, K., Munthe, J., Kindbom, K., Wilson, S., Steenhuisen, F., Maxson, P.,
2010. Global emission of mercury to the atmosphere from anthropogenic sources in 2005 and
projections to 2020. Atmospheric Environment 44, 2487-2499.
123
Chapter 7. Hg stable isotope compositions of selected world coals
Pavlish, J.H., Sondreal, E.A., Mann, M.D., Olson, E.S., Galbreath, K.C., Laudal, D.L., Benson, S.A., 2003.
Status review of mercury control options for coal-fired power plants. Fuel Processing Technology 82,
89-165.
Pirrone, N., Cinnirella, S., Feng, X., Finkelman, R., Friedli, H., Leaner, J., Mason, R., Mukherjee, A.,
Stracher, G., Streets, D., Telmer, K., 2009. Global Mercury Emissions to the Atmosphere from
Natural and Anthropogenic Sources, in: Mason, R., Pirrone, N. (Eds.), Mercury Fate and Transport in
the Global Atmosphere. Springer US, pp. 1-47.
Pirrone, N., Cinnirella, S., Feng, X., Finkelman, R.B., Friedli, H.R., Leaner, J., Mason, R., Mukherjee, A.B.,
Stracher, G.B., Streets, D.G., Telmer, K., 2010. Global mercury emissions to the atmosphere from
anthropogenic and natural sources. Atmospheric Chemistry and Physics 10, 5951-5964.
Schauble, E.A., 2007. Role of nuclear volume in driving equilibrium stable isotope fractionation of mercury,
thallium, and other very heavy elements. Geochimica et Cosmochimica Acta 71, 2170-2189.
Seigneur, C., Vijayaraghavan, K., Lohman, K., Karamchandani, P., Scott, C., 2004. Global Source Attribution
for Mercury Deposition in the United States. Environmental Science & Technology 38, 555-569.
Selin, N.E., Jacob, D.J., Yantosca, R.M., Strode, S., Jaeglé, L., Sunderland, E.M., 2008. Global 3-D land-
ocean-atmosphere model for mercury: Present-day versus preindustrial cycles and anthropogenic
enrichment factors for deposition. Global Biogeochemical Cycles 22, GB2011.
Sherman, L.S., Blum, J.D., Keeler, G.J., Demers, J.D., Dvonch, J.T., 2011. Investigation of Local Mercury
Deposition from a Coal-Fired Power Plant Using Mercury Isotopes. Environmental Science &
Technology 46, 382-390.
Sherman, L.S., Blum, J.D., Keeler, G.J., Demers, J.D., Dvonch, J.T., 2012. Investigation of Local Mercury
Deposition from a Coal-Fired Power Plant Using Mercury Isotopes. Environmental Science &
Technology
Sherman, L.S., Blum, J.D., Nordstrom, D.K., McCleskey, R.B., Barkay, T., Vetriani, C., 2009. Mercury
isotopic composition of hydrothermal systems in the Yellowstone Plateau volcanic field and Guaymas
Basin sea-floor rift. Earth and Planetary Science Letters 279, 86-96.
Sonke, J.E., Blum, J.D., 2013. Advances in mercury stable isotope biogeochemistry. Chem. Geol. 336, 1-4.
Streets, D.G., Devane, M.K., Lu, Z., Bond, T.C., Sunderland, E.M., Jacob, D.J., 2011. All-Time Releases of
Mercury to the Atmosphere from Human Activities. Environmental Science & Technology 45, 10485-
10491.
Streets, D.G., Hao, J., Wang, S., Wu, Y., 2009. Mercury emissions from coal combustion in China, in: Mason,
R., Pirrone, N. (Eds.), Mercury Fate and Transport in the Global Atmosphere. Springer US, pp. 51-65.
Sun, R., Heimbürger, L.-E., Sonke, J.E., Liu, G., Amouroux, D., Berail, S., 2013a. Mercury stable isotope
fractionation in six utility boilers of two large coal-fired power plants. Chemical Geology 336, 103-
111.
124
Chapter 7. Hg stable isotope compositions of selected world coals
Sun, R., Enrico, M., Heimbürger, L.-E., Scott, C., Sonke, J.E., 2013b. A double-stage tube furnace – acid
trapping protocol for the pre-concentration of mercury from solid samples for isotopic analysis.
Analytical and Bioanalytical Chemistry DOI: 10.1007/s00216-013-7152-2.
Tewalt, S.J., Belkin, H.E., SanFilipo, J.R., Merrill, M.D., Palmer, C.A., Warwick, P.D., Karlsen, A.W.,
Finkelman, R.B., Park, A.J., comp., 2010. Chemical analyses in the World Coal Quality Inventory,
version 1, U.S. Geological Survey: p. 4.
Weiss-Penzias, P., Jaffe, D., Swartzendruber, P., Hafner, W., Chand, D., Prestbo, E., 2007. Quantifying Asian
and biomass burning sources of mercury using the Hg/CO ratio in pollution plumes observed at the
Mount Bachelor observatory. Atmospheric Environment 41, 4366-4379.
Yan, Z., Liu, G., Sun, R., Wu, D., Wu, B., Zhou, C., 2013. Mercury distribution in coals influenced by
magmatic intrusions, and surface waters from the Huaibei Coal Mining District, Anhui, China.
Applied Geochemistry 33, 298-305.
Yang, Y., Huang, Q., Wang, Q., 2012. Ignoring Emissions of Hg from Coal Ash and Desulfurized Gypsum
Will Lead to Ineffective Mercury Control in Coal-Fired Power Plants in China. Environmental
Science & Technology 46, 3058-3059.
Yudovich, Y.E., Ketris, M.P., 2005. Mercury in coal: a review: Part 1. Geochemistry. International Journal of
Coal Geology 62, 107-134.
Zheng, W., Hintelmann, H., 2009. Mercury isotope fractionation during photoreduction in natural water is
controlled by its Hg/DOC ratio. Geochimica et Cosmochimica Acta 73, 6704-6715.
125
Chapter 8. Mercury stable isotope fractionation in six utility boilers of two large coal-fired power plants
Chapter 8
Mercury stable isotope fractionation in six utility boilers of two large coal-fired power plants
126
Chapter 8. Mercury stable isotope fractionation in six utility boilers of two large coal-fired power plants
Chapter 8. Mercury stable isotope fractionation in six utility boilers of
two large coal-fired power plants (published article in Chemical
Geology)
Résumé
Ce Chapitre adresse la question si la combustion du charbon dans les centrales au charbon modifie
oui ou non la composition isotopique de ses émissions du Hg. Nous avons mesuré la composition
isotopique du Hg dans les charbons, les cendres résiduels et volants, et le gypse produit par la
désulfurisation des gaz. Par rapport au charbon combusté, les cendres et gypse sont tous enrichis en
isotopes légers du Hg. Par conséquence la signature isotopique des émissions du Hg par la cheminée,
calculeé par bilan de masse, est légèrement enrichi en isotopes lourds (δ202Hg <0.3‰), mais reste
inchangé pour la signature Δ199Hg.
127
Chapter 8. Mercury stable isotope fractionation in six utility boilers of two large coal-fired power plants
128
Chapter 8. Mercury stable isotope fractionation in six utility boilers of two large coal-fired power plants
129
Chapter 8. Mercury stable isotope fractionation in six utility boilers of two large coal-fired power plants
130
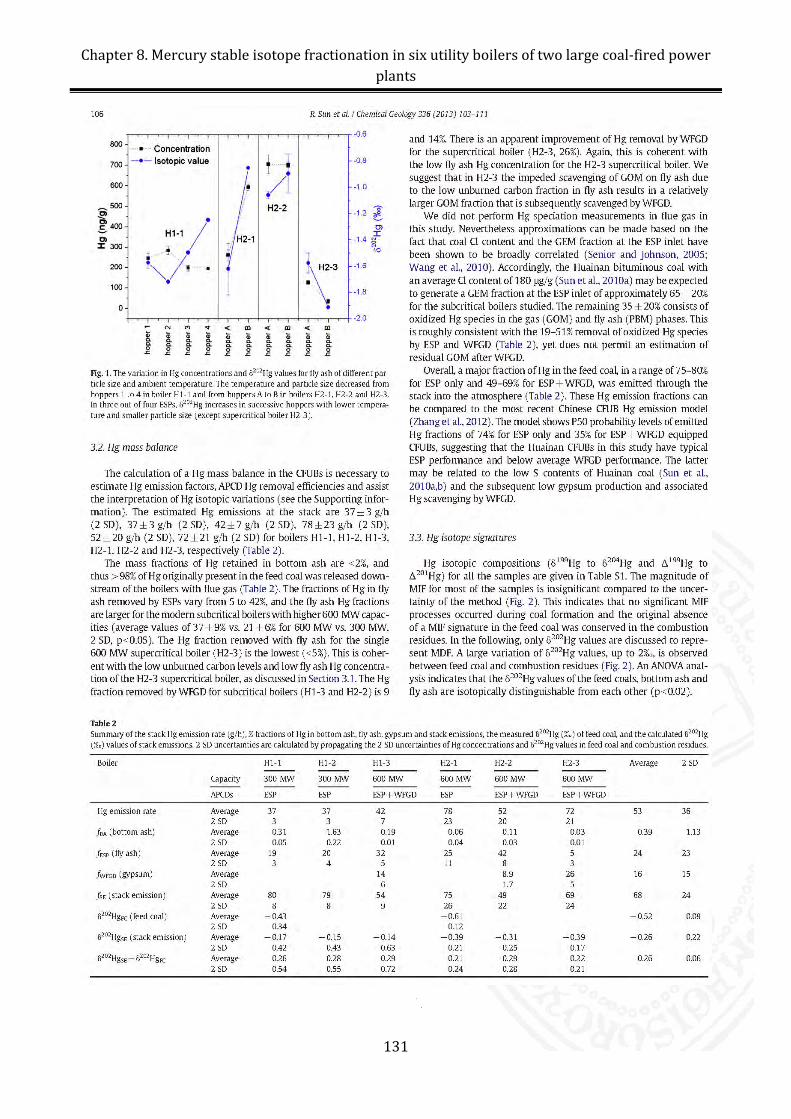
Chapter 8. Mercury stable isotope fractionation in six utility boilers of two large coal-fired power plants
131
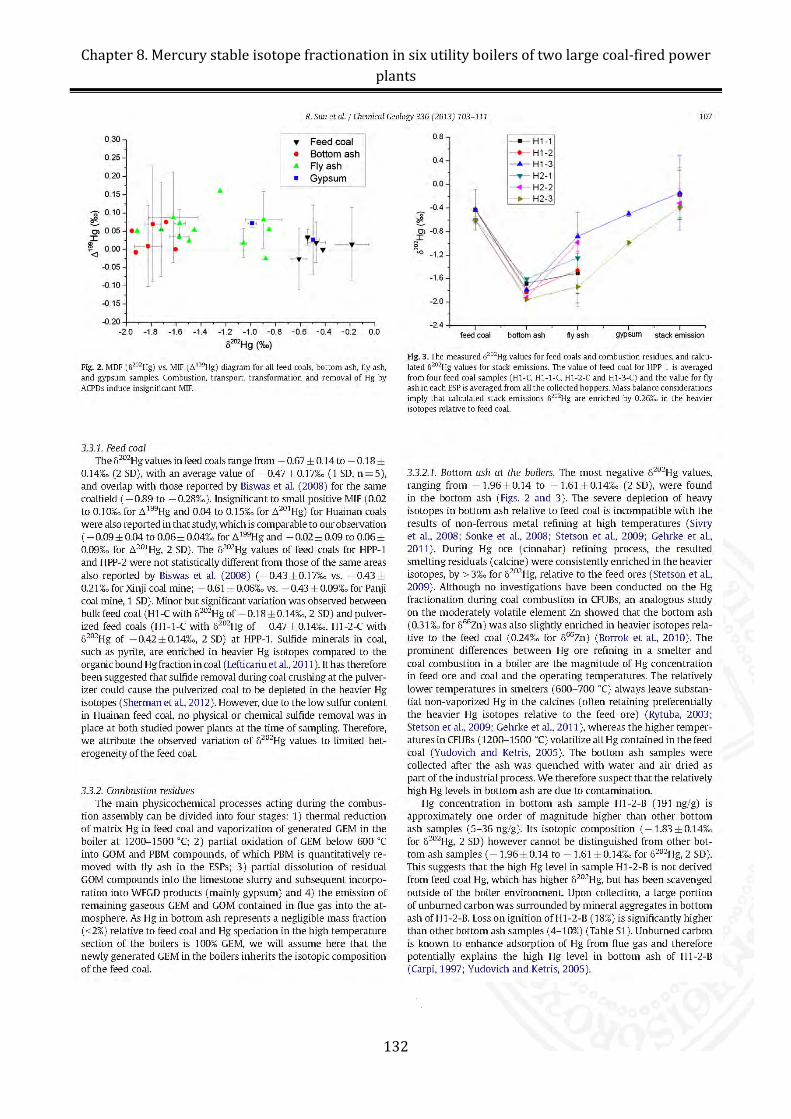
Chapter 8. Mercury stable isotope fractionation in six utility boilers of two large coal-fired power plants
132
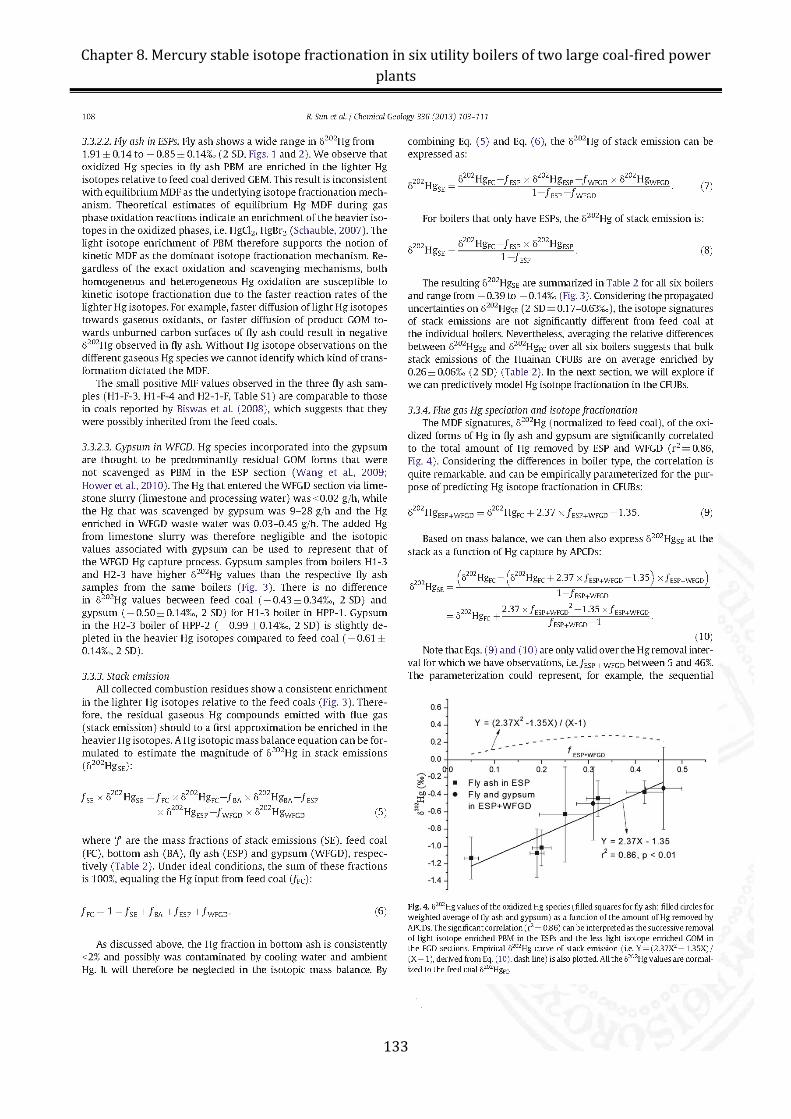
Chapter 8. Mercury stable isotope fractionation in six utility boilers of two large coal-fired power plants
133
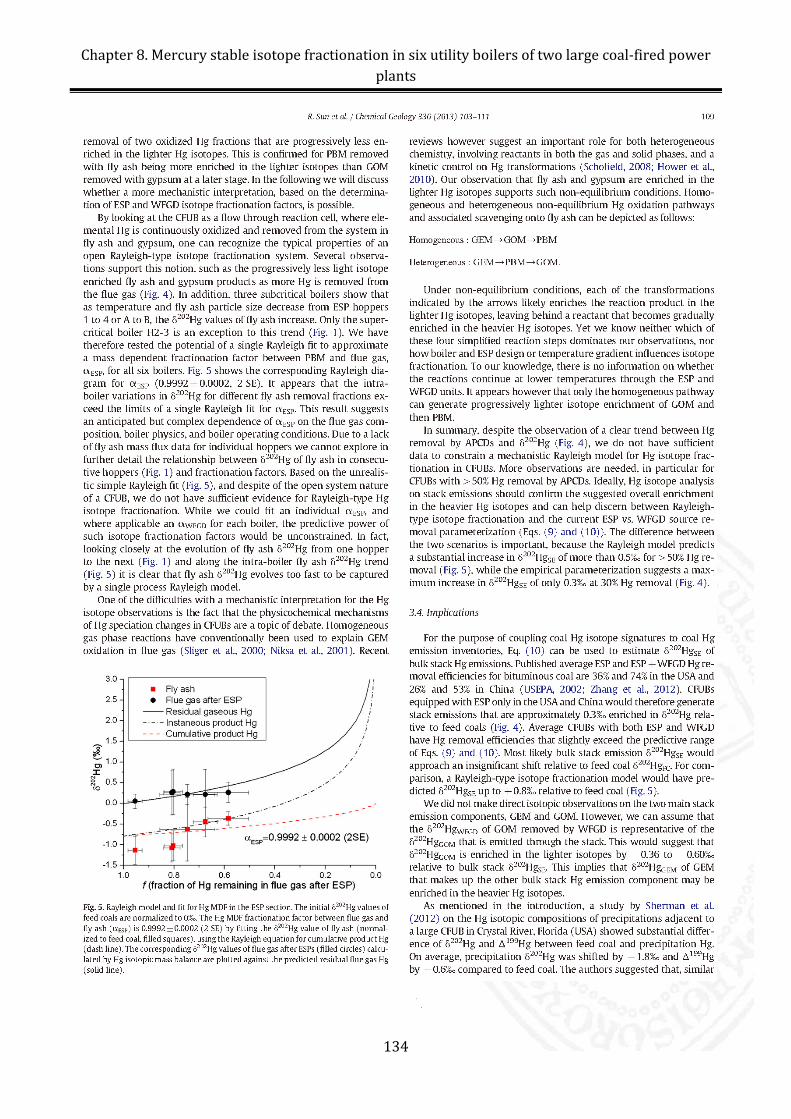
Chapter 8. Mercury stable isotope fractionation in six utility boilers of two large coal-fired power plants
134
Chapter 8. Mercury stable isotope fractionation in six utility boilers of two large coal-fired power plants
135
Chapter 8. Mercury stable isotope fractionation in six utility boilers of two large coal-fired power plants
136
Chapter 8. Mercury stable isotope fractionation in six utility boilers of two large coal-fired power plants
Appendix A: supplementary data for Chapter 8
137
Chapter 8. Mercury stable isotope fractionation in six utility boilers of two large coal-fired power plants
138
Chapter 8. Mercury stable isotope fractionation in six utility boilers of two large coal-fired power plants
139
Chapter 8. Mercury stable isotope fractionation in six utility boilers of two large coal-fired power plants
140
Chapter 8. Mercury stable isotope fractionation in six utility boilers of two large coal-fired power plants
141
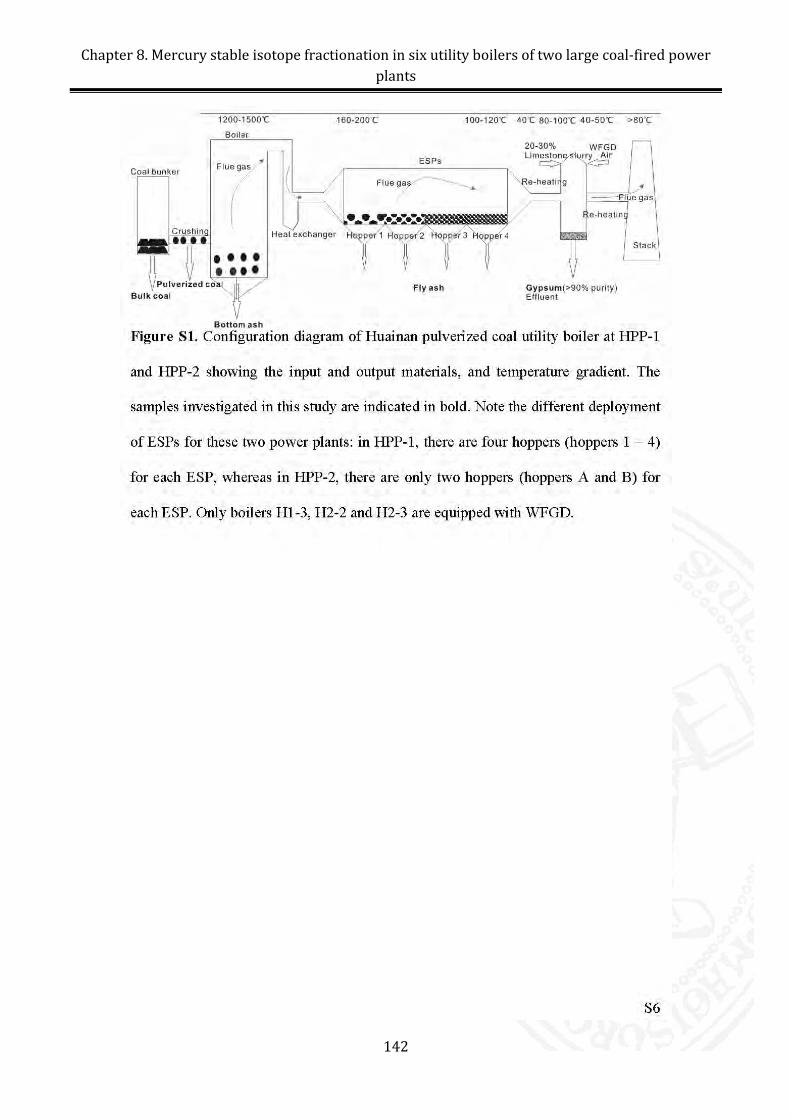
Chapter 8. Mercury stable isotope fractionation in six utility boilers of two large coal-fired power plants
142
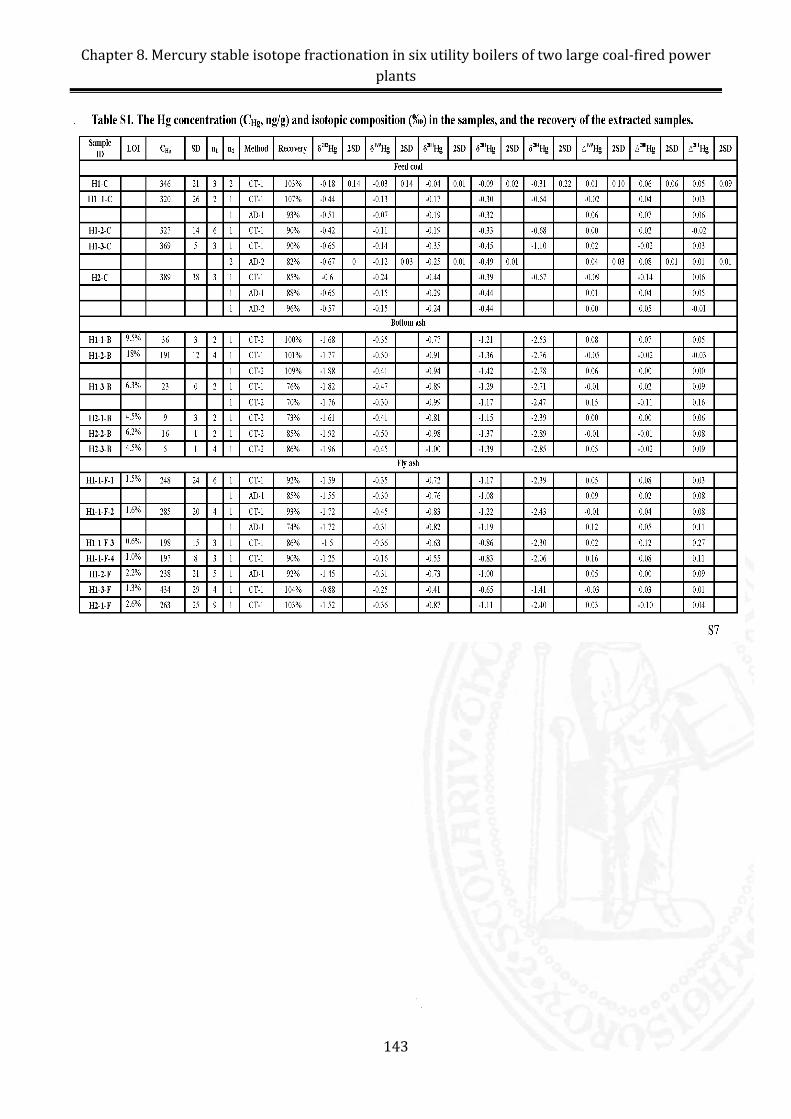
Chapter 8. Mercury stable isotope fractionation in six utility boilers of two large coal-fired power plants
143
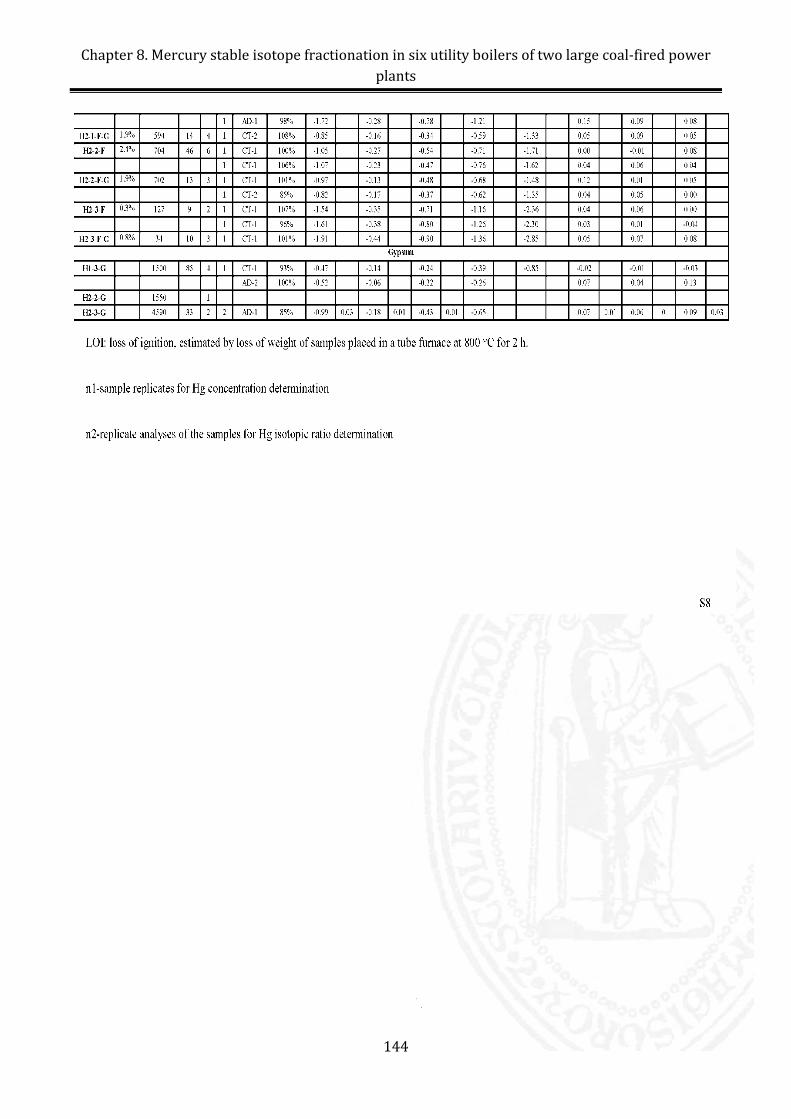
Chapter 8. Mercury stable isotope fractionation in six utility boilers of two large coal-fired power plants
144
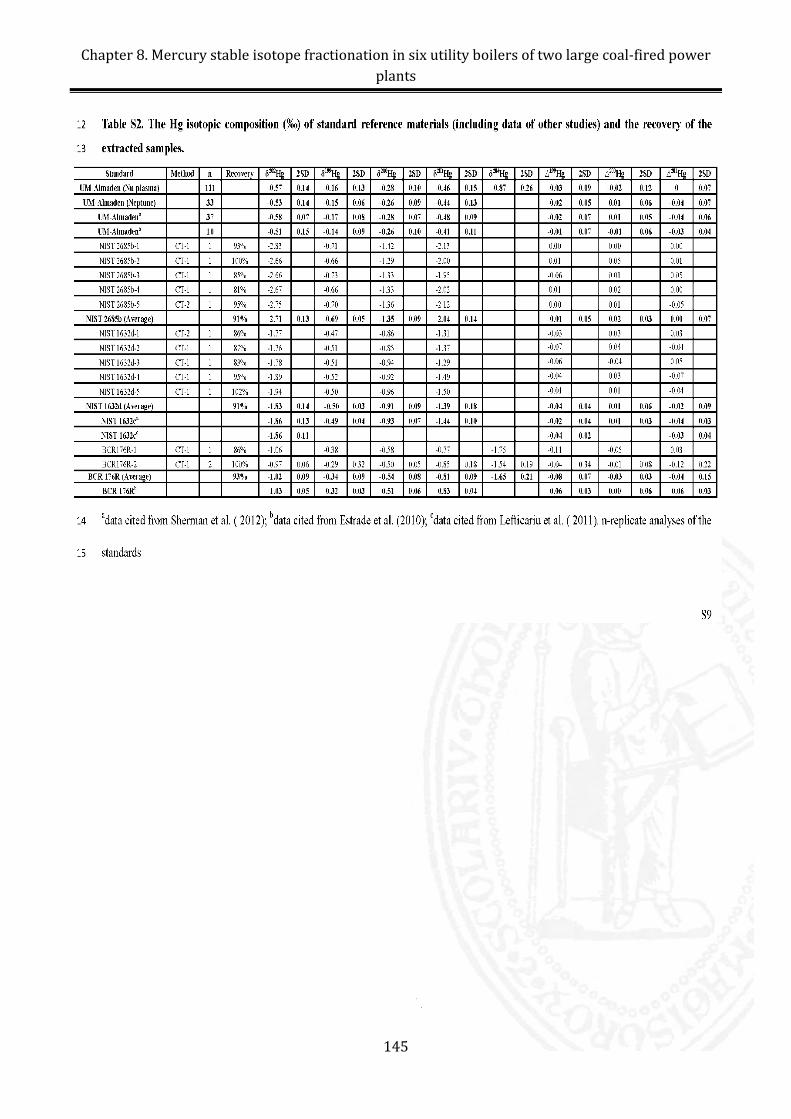
Chapter 8. Mercury stable isotope fractionation in six utility boilers of two large coal-fired power plants
145
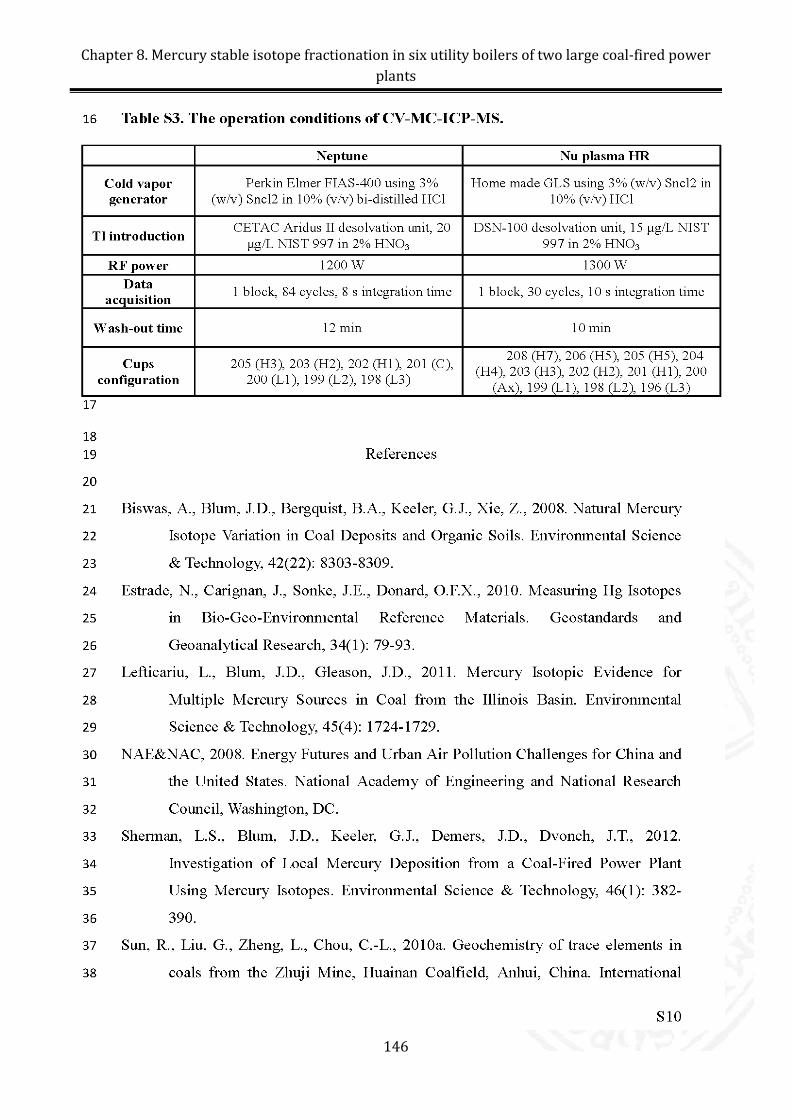
Chapter 8. Mercury stable isotope fractionation in six utility boilers of two large coal-fired power plants
146
Chapter 8. Mercury stable isotope fractionation in six utility boilers of two large coal-fired power plants
147
Chapter 9. Conclusions and perspectives
Chapter 9 Conclusions and perspectives
148
Chapter 9. Conclusions and perspectives
Chapter 9. Conclusions and perspectives
The goal of this PhD dissertation was to assess the use of Hg stable isotope signatures to trace the
largest anthropogenic Hg emission source, coal fired power plants. We first developed an in-house
customized Hg purification and preconcentration (combustion-trapping) method to subsequently
analyze Hg isotope compositions by MC-ICPMS. Coals from worldwide coal basins and coal
combustion residuals (i.e. bottom ash, fly ash and desulfurization gypsum) from coal-fired power
plants were studied. A global coal Hg isotope library with wide spatial and temporal coverage was
developed, and included more than 150 coal samples. In-situ sampling in coal-fired power plants
allowed us to evaluate whether coal combustion shifts the Hg isotope compositions in emitted flue
gases relative to original coals. Finally, a case study on the Hg isotope variation in a single coal mine
and coal bench were done to assess the origin of Hg in coal. In this chapter we summarize our main
findings, and indicate the perspectives that follow from our conclusions.
9.1. Conclusions
1. In Chapter 5, we detailed an in-house modified combustion-trapping protocol to extract, purify and
pre-concentrate Hg for isotope analysis from various kinds of solid samples (coal, coal associated
rocks, fly ash, bottom ash, peat and black shale) with Hg levels varying from <5 ng/g to 10 μg/g.
Following controlled experiments on the optimum HNO3/HCl acid ratio, carrier gas type and its flow
rate, and temperature ramp, we recommend to use a 40% (v/v) 2HNO3/1HCl as acid trapping
solution, 25 ml/min O2 flow rate as carrier gas and a dynamic temperature program (15 °C/min for
25-150 °C and 600-900 °C; 2.5 °C/min for 150-600 °C) for the first combustion furnace. The second
decomposition furnace is held at 1000 °C at all times. Our tested 340 samples over 20 months
demonstrate that this method can achieve a median 89% extraction recovery of Hg for sample types
as diverse as coals, peat or marine sedimentary rocks. No significant Hg isotope fractionation was
observed for CRMs within the Hg recovery range of 81-102%. This protocol has the advantages of a
short sample processing time (~3.5 hours), limited transfer of residual sample matrix into the Hg
trapping solution and direct measurement by CV-MC-ICPMS after diluting the trapping solution to
20% (v/v) acid. However, special attention should be paid to iodine-rich samples that possibly
suppress cold vapor generation of Hg for isotope determination.
2. In Chapter 6, we investigated the fractionation extent of Hg isotopes in coals deposited at the same
geographical location at different coal-forming periods. The objective was to test the potential of
using Hg isotope signatures to trace the sources and geochemical processes of Hg in coal deposits.
149
Chapter 9. Conclusions and perspectives
We found that natural processes caused a ~2‰ variation of δ202Hg (−1.62 to 0.44±0.12‰, 2SD,
n=18) and 0.35‰ of Δ199Hg (−0.12 to 0.22±0.08‰, 2SD, n=18) among coal seams deposited at the
same location over a period of ~20 Ma (Zhuji Coal Mine, Huainan Coalfield, Anhui Province). A
similar range of variation was observed within a single coal seam (Daizhuang Coal Mine, Jining
Coalfield, Shandong Province). Correlation between δ202Hg and 1/Hg in Zhuji coals suggests a
binary mixing of Hg end-members, suggesting that over 20 Ma of coal deposition the dominant Hg
source shifted. However, no definitive conclusions are obtained for δ202Hg vs. 1/Hg in Daizhuang
coals. The distinctly higher (0.70 to 0.91±0.12‰, 2SD, n=2) and lower δ202Hg (−4.00 to
−3.47±0.12‰, 2SD, n=3) in natural cokes, a metamorphosed form of coal, suggests that significant
Hg MDF occurred when coals were subjected to the perturbation of magmatic intrusion.
3. We developed a global coal Hg isotope library in Chapter 7. We measured Hg isotope
compositions in 108 new coal samples from major coal-producing basins in Africa, China, Europe,
India, Indonesia, Former USSR and the USA, adding to ~50 published coal samples. We observed a
4.7‰ range in δ202Hg (−3.9 to 0.8‰) and a 1‰ range in Δ199Hg (−0.6 to 0.4‰). Half of the 28
pairwise comparisons between eight coal-producing regions are statistically distinguishable on the
basis of δ202Hg, Δ199Hg or both (p<0.05). This underlines the potential application of Hg isotope
signatures to coal Hg emission tracing. In addition, we observe that with the increase of coal rank
(from lignite to subbituminous to bituminous to anthracite) and with decreasing coal deposition ages
(from Cenozoic to Mesozoic to Paleozoic), the Δ199Hg signature increases stepwise, suggesting
source-ralted controls on Hg isotope compositons in coals.
4. In Chapter 8 we investigate whether coal combustion processes in CFUB shift Hg isotope
signatures from feed coal to stack Hg emissions. We measured the Hg isotope compositions in feed
coals, bottom ash, fly ash and desulfurization by-product gypsum. Relative to feed coal with δ202Hg
ranging from −0.67 to −0.18‰, oxidized Hg species in bottom ash and fly ash are enriched in lighter
isotopes with δ202Hg from −1.96 to −0.82‰. Flue gas desulphurization by-product gypsum shows
δ202Hg from −0.99 to −0.47‰. The calculated isotopic shift of stack Hg emissions relative to feed
coals is minor for δ202Hg (<0.3‰) and negligible for Δ199Hg.
9.2 Perspectives
Apart from the method development and exploration of the origin of Hg in coal, the most important
outcome of this PhD research project is in the field of environmental tracing of coal Hg emissions.
Our observations that numerous global coal producing regions can be distinguished based on their
150
Chapter 9. Conclusions and perspectives
coal Hg isotope signatures, and that those signatures are largely preserved into coal plant Hg
emissions hold promise for quantitative tracing of coal Hg emissions. Here we address in detail the
opportunities and caveats of ‘what should be investigated next’.
9.2.1. Species-specific Hg isotope compositions of coal Hg emissions
Hg emissions from coal plant stacks consist of three operationally defined forms: gaseous elemental
Hg, GEM; gaseous oxidized Hg, GOM, and particle bound Hg, PBM (i.e. residual fly ash). Due to
varying atmospheric reactivity and life-time of Hg species, species-specific Hg isotopic information
has important implications for near-field (PBM and GOM) and far-field (GEM) coal Hg emission
tracing. In chapter 8, we speculated that the GEM, GOM and PBM in coal flue gas emission may
carry contrasting Hg isotope signatures. Based on our analysis of fly ash and gypsum, we suggested
that PBM and GOM are possibly enriched in the lighter Hg isotopes relative to feed coals, and
consequently GEM must be enriched in the heavier Hg isotopes. However, we did not make direct
species-specific Hg isotope measurements on stack emission components. The only pre-liminary
species-specific Hg isotope measurement on flue gas of a CFUB indicates ~3.5‰ variation of MDF
in δ202Hg and negligible MIF (Khawaja et al., 2010). Relative to bulk Hg flue gas, these authors
found indeed that GOM is enriched in the lighter Hg isotopes and GEM is enriched in heavier Hg
isotopes. These observations are in agreement with our speculation. We suggest that more in-situ
measurements on stack emissions are needed to better constrain the fractionation signs and extent in
different Hg species of coal combustion flue gases.
9.2.2. Post-emission Hg isotope fractionation in coal flue gases
A field study by Sherman et al. (2012) showed that δ202Hg and Δ199Hg signatures in wet precipitation
downwind from a CFUB in Florida (USA) were substantially different from those of regional
background Hg and the combusted feed coals. On average, wet precipitation δ202Hg was shifted by
−1.8‰ and Δ199Hg by +0.6‰ as compared to feed coal. Hg isotope fractionation within CFUB and
in-cloud Hg transformations following flue gases emission were suggested to be the underlying
reasons. In Chapter 8, we suggested that GOM and PBM in emitted flue gases have respectively the
δ202Hg of fly ash and gypsum, and thus explain part of the observed δ202Hg in their wet precipitation
samples. Due to the absence of photochemical Hg MIF during coal combustion and downstream
transport of flue gases through APCDs, the inherited Δ199Hg of flue gases from feed coals is
significantly lower than observed Δ199Hg in precipitation samples. Therefore, additional in-plume
and in-cloud Hg isotope fractionation is still needed to explain the precipitation Hg MIF. One
151
Chapter 9. Conclusions and perspectives
possible pathway to imprint precipitation Hg(II) with significantly positive Δ199Hg is photochemical
reduction of aqueous Hg(II)-DOM (dissolved organic matter) complexes in cloud droplets. This
plausible explanation requires further field and experimental study.
9.2.3. Geological controls on Hg isotope fractionation in coal deposits
In Chapter 6, we tested the potential of using Hg isotope compositions to trace Hg sources and
geochemical processes involving Hg during and after coal deposition. We observed that thermal
perturbations derived from magmatic intrusion events could significantly fractionate Hg isotopes
between coal and natural coke. However, it is difficult to identify whether/which sources or
geochemical processes generated the ~2‰ δ202Hg variation in either a single seam or continuously
deposited seams. In Chapter 7, we also observed some interesting relationships between δ202Hg or
Δ199Hg vs. Hg concentrations, coal ranks and coal-forming ages in specific world regions. Due to
complex Hg occurrences in coals and an unknown interplay between multiple factors including coal
depositional environment, post-depositional Hg dynamics and coalification pathways, we are
currently unable to meaningfully interpret our observations. Other elemental, isotope or
mineralogical parameters could be used to help constrain the Hg isotope biogeochemistry of coal
deposits.
9.2.4. Reconstructing the historical evolution of anthropogenic Hg isotope emission
signatures
The coal Hg isotope library we created has been an important first step in tracing coal Hg emissions.
With a few exceptions (German, UK and Australian coal) the library covers over 70% of past and
future coal basins. Combining historical coal production statistics, coal import-export statistics, Hg
removal efficiencies by APCDs during coal combustion, we can now start to reconstruct an all-time
historical evolution of the Hg isotope compositions of atmospheric coal Hg emissions. Where we
have enough information, such an isotope emission inventory can be made on a regional/national
basis. We suggest that a similar ‘library’ type approach should be taken for other anthropogenic Hg
emission sectors, such as non-ferrous metal smelting, cement production, chlor-alkali industries, and
gold and silver mining. Once we know the historical geographical patterns of anthropogenic and
natural Hg isotope emissions, we can then confront and better understand the Hg isotope information
from natural archives such as peat, sediment and ice cores or soils and biomonitors.
152
Chapter 9. Conclusions and perspectives
Chapitre 9. Conclusions et perspectives
Le but principal de ces travaux de thèse a été l’exploration des signatures isotopiques du Hg en tant
que traceur des émissions du Hg par les centrales au charbon. Nous avons d’abord développé une
méthode d’extraction, de purification et de pré-concentration adapté au charbon, afin d’analyser sa
composition isotopique par spectrométrie de masse. Ensuite nous avons exploré les variations
isotopiques des charbons globaux et les produits de combustion (i.e. cendres résiduels et volants,
gypse) des centrales au charbon. Une compilation isotopique du Hg dans des charbons, incluant plus
de 150 charbons et une grande variation spatiotemporelle, a été établie. L’échantillonnage in-situ des
centrales au charbon a permis d’étudier les éventuelles modifications des signatures isotopiques du
Hg des émissions par rapport au charbon combusté. Enfin, une étude cas sur la variation isotopique
de Hg de 20 millions d’années de dépôts de charbon au même endroit géographique a permis
d’explorer l’isotopie du Hg comme traceur des sources et des processus du Hg dans le charbon. Dans
ce Chapitre nous résumons nos observations et interprétations, et nous discutons les perspectives
pour la suite.
9.1. Conclusions
1. Le Chapitre 5 résume le protocole d’extraction, purification and pré-concentration du Hg pour
l’analyse isotopique. La méthode a été développée pour des échantillons solides divers tel que le
charbon, des roches, cendres, tourbes et schistes noirs ayant des teneurs en Hg de <5 ng/g à 10 μg/g.
Suivant des optimisations du mélange acide (HNO3/HCl), flux et type de gaz vecteur, et rampe de
température, nous recommandons l’utilisation de 40% (v/v) 2HNO3/1HCl dans le piège acide, 25
ml/min O2 en gaz vecteur et un programme dynamique de rampe de température (15 °C/min for 25-
150 °C and 600-900 °C; 2.5 °C/min for 150-600 °C) pour le 1ier four de combustion. Le 2ieme four, le
pyrolyseur, est maintenu à 1000 °C durant toutes les extractions du Hg. Nous avons testé et effectué
340 extractions de Hg durant 20 mois, montrant une efficacité d’extraction de 89% (médiane) pour
les différents types d’échantillons. L’extraction des matériaux de référence montre une absence de
biais isotopique pour des rendements entre 81-102%. Ce protocole a l’avantage d’être rapide (3.5h),
d’éviter le transfert de la matrice vers le piège acide, et permet une analyse directe des compositions
isotopiques par spectrométrie de masse après dilution à 20% (v/v) acide. Cependant, nous avons
remarqué des transferts de l’iode de la matrice du charbon vers le piège acide, posant des problèmes
de réduction du Hg dans le générateur à vapeur froide du spectromètre de masse.
153
Chapter 9. Conclusions and perspectives
2. Le Chapitre 6 fait l’objet d’une étude de cas sur le fractionnement isotopique du Hg au sein d’une
séquence de charbons déposé au même endroit géographique. Le but était d’explorer les signatures
isotopiques du Hg comme traceurs des sources ou processus du Hg dans le charbon. Nous observons
une variation ~2‰ en δ202Hg (−1.62 to 0.44±0.12‰, 2SD, n=18) et de 0.35‰ en Δ199Hg (−0.12 to
0.22±0.08‰, 2SD, n=18) au sein des couches de charbons déposées pendant 20 Ma (Mine de Zhuji,
basin de Huainan, province d’Anhui, Chine). Une même variation est observée au sein d’une seule
couche de charbon (mine de Daizhuang, basin de Jining, province de Shandong, Chine). Une
corrélation entre le δ202Hg et 1/Hg à Zhuji suggère une mélange binaire entre deux sources de Hg,
témoignant d’un décalage dans la source dominante du Hg dans le bassin de Huainan. Dans la
couche de charbon de Daizhuang aucune relation claire né parait entre δ202Hg vs. 1/Hg. Enfin, des
cokes naturels, une forme métamorphosée du charbon au contact avec des intrusions magmatiques,
montre un fort fractionnement isotopique dépendent de la masse, avec δ202Hg élevé (0.70 to
0.91±0.12‰, 2SD, n=2) ou plus bas (−4.00 to −3.47±0.12‰, 2SD, n=3).
3. Le Chapitre 6 résume la compilation isotopique du Hg dans des charbons, basé sur 108 nouveaux
échantillons de charbon provenant des basins importants en Afrique, Chine, Europe, Inde, Indonésie,
l’ancienne USSR et les USA et ~50 charbons déjà publiés. Nous observons une variation isotopique
de 4.7‰ en δ202Hg (−3.9 a 0.8‰) et de 1‰ en Δ199Hg (−0.6 a 0.4‰). La moitié des 28 comparaisons
possibles entre les huit principales régions productrices du charbon du monde sont statistiquement
différenciable selon leurs δ202Hg, Δ199Hg ou les deux (p<0.05). Nous y en déduisons l’application
potentielle des signatures isotopiques du Hg en tant que traceurs des émissions du Hg des centrales
au charbon. Dans un deuxième temps, il parait que la signature Δ199Hg augmente avec la
charbonification (du lignite au sous-bitumineux au bitumineux à l’anthracite) et avec l’âge de dépôt
(du Cénozoïque au Mésozoïque au Paléozoïque).
4. Le Chapitre 8 adresse question si la combustion du charbon dans les centrales au charbon modifie
oui ou non la composition isotopique de ses émissions du Hg. Nous avons mesuré la composition
isotopique du Hg dans les charbons, les cendres résiduels et volants, et le gypse produit par la
désulfurisation des gaz. Par rapport au charbon combusté, les cendres et gypse sont tous enrichis en
isotopes légers du Hg. Par conséquence la signature isotopique des émissions du Hg par la cheminée,
calcule par bilan de masse, est légèrement enrichi en isotopes lourds (δ202Hg <0.3‰), mais reste
inchangé pour la signature Δ199Hg.
154
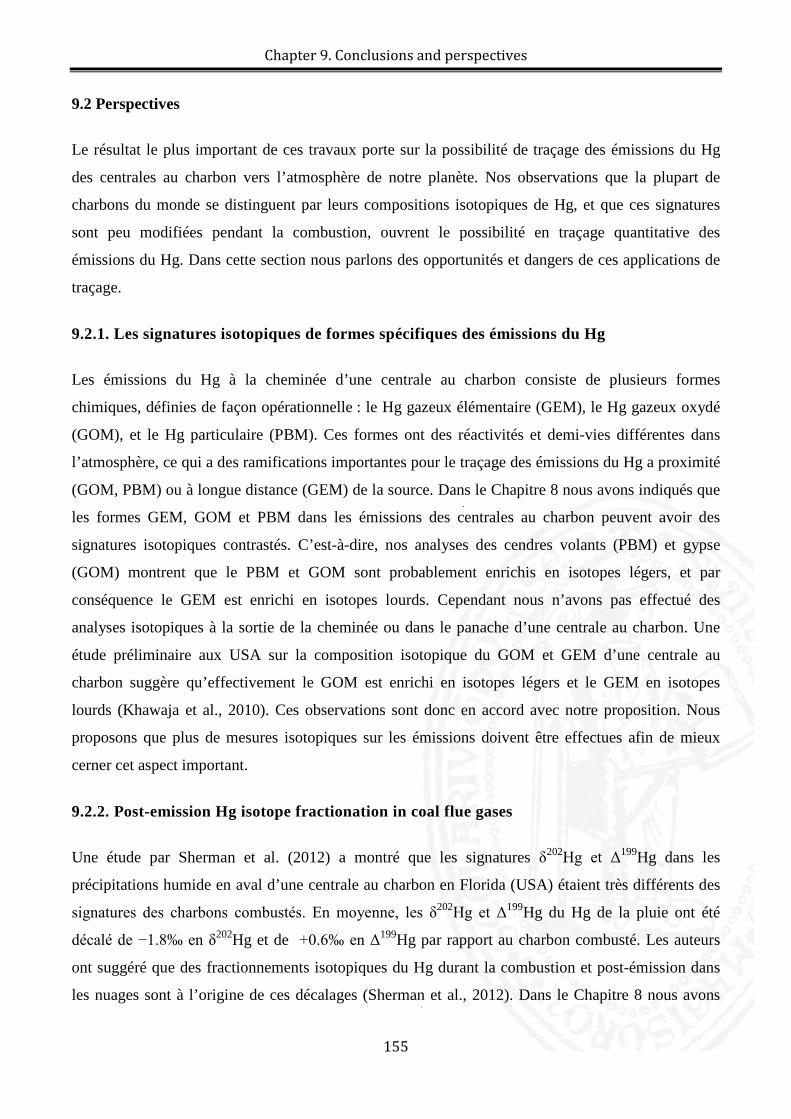
Chapter 9. Conclusions and perspectives
9.2 Perspectives
Le résultat le plus important de ces travaux porte sur la possibilité de traçage des émissions du Hg
des centrales au charbon vers l’atmosphère de notre planète. Nos observations que la plupart de
charbons du monde se distinguent par leurs compositions isotopiques de Hg, et que ces signatures
sont peu modifiées pendant la combustion, ouvrent le possibilité en traçage quantitative des
émissions du Hg. Dans cette section nous parlons des opportunités et dangers de ces applications de
traçage.
9.2.1. Les signatures isotopiques de formes spécifiques des émissions du Hg
Les émissions du Hg à la cheminée d’une centrale au charbon consiste de plusieurs formes
chimiques, définies de façon opérationnelle : le Hg gazeux élémentaire (GEM), le Hg gazeux oxydé
(GOM), et le Hg particulaire (PBM). Ces formes ont des réactivités et demi-vies différentes dans
l’atmosphère, ce qui a des ramifications importantes pour le traçage des émissions du Hg a proximité
(GOM, PBM) ou à longue distance (GEM) de la source. Dans le Chapitre 8 nous avons indiqués que
les formes GEM, GOM et PBM dans les émissions des centrales au charbon peuvent avoir des
signatures isotopiques contrastés. C’est-à-dire, nos analyses des cendres volants (PBM) et gypse
(GOM) montrent que le PBM et GOM sont probablement enrichis en isotopes légers, et par
conséquence le GEM est enrichi en isotopes lourds. Cependant nous n’avons pas effectué des
analyses isotopiques à la sortie de la cheminée ou dans le panache d’une centrale au charbon. Une
étude préliminaire aux USA sur la composition isotopique du GOM et GEM d’une centrale au
charbon suggère qu’effectivement le GOM est enrichi en isotopes légers et le GEM en isotopes
lourds (Khawaja et al., 2010). Ces observations sont donc en accord avec notre proposition. Nous
proposons que plus de mesures isotopiques sur les émissions doivent être effectues afin de mieux
cerner cet aspect important.
9.2.2. Post-emission Hg isotope fractionation in coal flue gases
Une étude par Sherman et al. (2012) a montré que les signatures δ202Hg et Δ199Hg dans les
précipitations humide en aval d’une centrale au charbon en Florida (USA) étaient très différents des
signatures des charbons combustés. En moyenne, les δ202Hg et Δ199Hg du Hg de la pluie ont été
décalé de −1.8‰ en δ202Hg et de +0.6‰ en Δ199Hg par rapport au charbon combusté. Les auteurs
ont suggéré que des fractionnements isotopiques du Hg durant la combustion et post-émission dans
les nuages sont à l’origine de ces décalages (Sherman et al., 2012). Dans le Chapitre 8 nous avons
155
Chapter 9. Conclusions and perspectives
suggéré que les émissions du PBM et GOM, fractions dominantes vis-à-vis les dépôts du Hg à
proximité de la centrale au charbon, sont enrichis en isotopes légers, permettant d’expliquer le
décalage de −1.8‰ en δ202Hg. Les mesures préliminaires de Khawaja et al. (2010) sur le GOM emit
par une centrale au charbon confirme cette interprétation. Cependant le décalage de la signature
Δ199Hg de +0.6‰ entre le GOM/PBM émits et la pluie demande l’intervention d’un processus
photochimique lequel ne peut pas avoir lieu dans la centrale au charbon même. Par conséquence une
étape, post-émission, de photoreduction partielle du GOM doit intervenir afin d’expliquer ce
décalage en MIF. L’endroit le plus probable de cette étape de photochimie est dans les gouttelettes de
nuages. Vue la rapidité, en moins d’une heure, de la modification de la signature Δ199Hg entre
cheminée et pluie tombé, ce processus de photochimie atmosphérique peut sérieusement compliquer
le traçage des émissions du Hg des centrales au charbon. Plus d’études sont souhaitables dans ce
domaine.
9.2.3. L’origine des variations isotopiques du Hg d’un bassin de charbon.
Le Chapitre 6 documente en détail les variations isotopiques du Hg au sein d’un bassin de charbon,
et au sein d’une seule couche de charbon. Nous avons remarqué que la perturbation thermique
provenant des intrusions magmatiques fractionne significativement les isotopes du Hg entre charbon
et coke. Cependant, il a été difficile d’identifier si l’origine des 2‰ de variation en δ202Hg a travers
du bassin mais également au sein de la couche de charbon unique est dû au changement de sources
du Hg ou des transformations spécifiques du Hg. Dans la compilation des signatures isotopiques du
charbon du Chapitre 7 nous avons noté des relations intéressants entre δ202Hg ou Δ199Hg et les
teneurs en Hg, type de charbon, et âge de dépôt. Malheureusement à ce stade d’exploration nous ne
sommes pas capable d’identifier les causes et effets de ces variations isotopiques, autre que les
observations faits. Des études plus approfondies peuvent être souhaitable afin de mieux comprendre
ces variations.
9.2.4. L’evolution historique des emissions isotopiques du Hg
La compilation isotopique du Hg dans des charbons constitue une 1iere étape dans le traçage des
émissions du Hg des centrales au charbon. Sauf quelques exceptions (charbon Allemands, Anglais et
Australien), la compilation couvre 70% des bassins de charbon globaux. En considérant la
production historique du charbon par pays, les statistiques sur les imports/exports du charbon, les
mesures de captage du Hg dans les centrales au charbon, nous pouvons commencer à reconstruire
l’évolution historique des signatures isotopiques du Hg des émissions liées au secteur du charbon. Si
156
Chapter 9. Conclusions and perspectives
nécessaire cette reconstruction peut être faite pour des régions ou nations. Nous proposons qu’une
compilation similaire soit établie pour d’autres secteurs industrielles, tel que la métallurgie, le
ciment, l’industrie chlore-alkali, et l’orpaillage. Une fois l’évolution isotopique de tous ces secteurs
reconstruit, nous pouvons mieux comprendre les signatures isotopiques observes dans les archives
naturels tel que les tourbières, les sédiments, la glace, ou les sols ou encore les biomoniteurs.
References
Khawaja, S.N., Odom, L., Landing, W., 2010. Isotopic Variations of Mercury Emitted by Coal Fired Power
Plant Gases, AGU, San Francisco.
Sherman, L.S., Blum, J.D., Keeler, G.J., Demers, J.D., Dvonch, J.T., 2012. Investigation of Local Mercury
Deposition from a Coal-Fired Power Plant Using Mercury Isotopes. Environmental Science &
Technology
157
List of Figures
List of Figures
Figure 1 Classification and evolution of coal (Source: ACARP) .......................................................................12
Figure 2 Trends in Hg emissions by (a) source types and (b) world regions (Source: Streets et al., 2011) .......19
Figure 3 Global pre-industrial (a) and present-day biogeochemical cycle of mercury in GEOS-Chem. Inventories are in Mg, and rates are in Mg/yr (Source: Selin et al., 2008) .....................................................20
Figure 4 Three isotope plots of studied Chinese coals showing only MDF for the even isotope 200Hg, and both MDF and MIF (Δ199Hg and Δ201Hg) for the odd isotopes 199Hg and 201Hg ........................................................33
Figure 5 Summary of Δ199Hg and Δ201Hg data (n =722) for biological samples containing predominantly MMHg (dark grey circles), and for geochemical samples containing predominantly inorganic Hg(II) (open circles). Experimentally observed Δ199/201Hg slopes for aquatic Hg(II) (1.0-1.3) (Bergquist and Blum, 2007; Zheng and Hintelmann, 2009) and MMHg photodegradation (Bergquist and Blum, 2007), and the experimental slope for NVE fractionation (Zheng and Hintelmann, 2009). (Source: Sonke, 2011)..................33
Figure 6 Fractionation factor (1000*ln β202-198Hg) for Hg-bearing molecules relative to Hg(0) vapor. The solid line denotes MDF and dotted line denotes NVE (Source: Schauble, 2007) .......................................................35
Figure 7 Geographical map showing the locations of studied coal mines. DZ: Daizhuang Coal Mine; ZJ: Zhuji Coal Mine; J-C: Jining Coalfield; H-C: Huainan Coalfied ................................................................................41
Figure 8 Generalized stratigraphic column and lithological characteristics of coal-bearing sequences in Zhuji Coal Mine of Huainan Coalfield (A) and Daizhuang Coal Mine of Jining Coalfield (B) showing sampled benches in No. 3-1 coal seam (C). C2: Upper Carboniferous; P1: Lower Permian; P2: Upper Permian; Fm: Formation; TY: Taiyuan Formation; SX: Shanxi Formation; LS: Lower Shihezi Formation; US: Upper Shihezi Formation. Note that the coal seams are numbered in ascending order in Zhuji Coal Mine, and in descending order in Daizhuang Coal Mine along coal seams upward ..............................................................42
Figure 9 Digital photographs of field drilling (A) and sampled coal and associated rocks (B) .........................44
Figure 10 The geographical locations of world coal samples ............................................................................45
Figure 11 Location of Huainan City (A) showing Huainan-1 (B) and Huain-2 Power Plants (C) .....................47
Figure 12 Configuration diagram of Huainan pulverized coal utility boiler at HPP-1 and HPP-2 showing the input and output materials, and temperature gradient. Note the different deployment of ESPs for these two power plants: in HPP-1, there are four hoppers (TSP 1-4) for each ESP, whereas in HPP-2, there are only two hoppers (hoppers A and B) for each ESP. Only boilers H1-3, H2-2 and H2-3 are equipped with WFGD. Abbreviation: TSP-Total particulate matter; ESP: electrostatic precipitator; WFGD: wet flue-gas desulfurization ....................................................................................................................................................48
Figure 13 Overview of MC-ICPMS (Thermo-Finnigan Neptune at the Midi-Pyrenees Observatory, Toulouse, France) (A) and introduction system for Hg isotope measurement (B). ............................................................50
Figure 14 Plot of ln202/198Hg vs. ln205/203Tl of NIST 3133 Hg standard, secondary standard (UM-Almaden, BCR176R, NIST2685b) and samples (coal, coal combustion residuals) in a one-day analytical session on Nu plasma, Pau University, France. All the solutions were measured at ~1 ng/g. The dashed lines represent the δ202/198Hg values of samples and secondary standards relative to NIST 3133 Hg standard. ..............................55
158
List of Figures
Figure 15 Overview of combustion-trapping system for Hg purification (for more detail, refer to Chapter 5) .57
Figure 16 Inter-seam variation of δ13C, Hg concentration, δ202Hg and Δ199Hg values in the Zhuji Coal Mine (A) and intra-seam variation of Hg concentration, δ202Hg and Δ199Hg values in No. 3-1 coal seam of Daizhuang Coal Mine (B). The shaded areas for Hg concentrations of Zhuji coals depict the overall increasing trend; the vertical dashed line shows the zero value for Δ199Hg; for individual Zhuji coal seams with multiple samples, 1SD uncertainty of multiple samples is used if this value is larger than 2SD analytical uncertianty; the error bars in Hg concentrations of Daizhuang samples are covered by symbols. ........................................82
Figure 17 δ202Hg vs. Δ199Hg diagram for coal and natural coke samples in the Zhuji Coal Mine, and for coal, coal floatfraction and rock samples in Daizhuang Coal Mine. The horizontal dashed line shows zero value for Δ199Hg .................................................................................................................................................................84
Figure 18 Comparison of δ202Hg and Δ199Hg values between studied coals and coals form other areas. Russia-Kazakhstan coal data are from Biswas et al, (2008); the USA coal data are from Biswas et al. (2008), Lefticariu et al. (2011) and Sherman et al. (2012); Chinnese coal data are from Biswas et al. (2008) and Sun, et al. ( 2013b). The filled black circles in categories of China and “This study” indicate Huainan coals. .........84
Figure 19 Δ199Hg vs. Δ201Hg values in coal and natural coke samples in Zhuji Coal Mine, and in coal, coal float fraction and rock samples in Daizhuang Coal Mine. Error bar represents measurement uncertainty of samples. The slope and intercept of samples regression line are calculated by the York regression method (York, 1968) that takes into account uncertainties in both Δ199Hg and Δ201Hg. The vertical and horizontal dashed lines show the zero values for Δ199Hg and Δ201Hg. ................................................................................85
Figure 20 Plot of δ202Hg vs. 1/Hg in Zhuji and Daizhuang coals. Coal samples ZJ-12-8-4-2 and ZJ-9+1-1 in circles are treated as the outliers. ZJ-12-8-4-2 has positive δ202Hg and is possibly affected by magmatic intrusion (see Section 4.3 in text); ZJ+9+1-1 is an unworkable coal seam and has an extremely high ash yield (Table 5). ............................................................................................................................................................88
Figure 21 Δ201Hg vs. Δ199Hg in studied world coals (n=108) (A) and all world coals (n=155) (B). The centre, horizontal and vertical axis of ellipse denotes respectively means of Δ199Hg and Δ201Hg, 1SD on Δ199Hg and 1SD on Δ201Hg. .................................................................................................................................................102
Figure 22 Box plots showing δ202Hg (A) and Δ199Hg (B) in all world coals (n=155). The horizontal lines at the bottom, middle and top of each boxplot are the lower quartile (below which 25% lowest values are found), median and upper quartile (above which 25% highest values are found), respectively. The box height (the difference between lower quartile and upper quartile) is defined as interquartile range (IQR). The data points either greater than the upper quartile+1.5 IQR or less than the lower quartile-1.5 IQR are considered to be extreme values. Square symbol denotes mean .................................................................................................104
Figure 23 δ202Hg vs. Δ199Hg in all world coals (n=155). The centre, horizontal and vertical axis of ellipse denotes respectively means of δ202Hg and Δ199Hg, 1SD on δ202Hg and 1SD on Δ199Hg. .................................105
Figure 24 Matrix representation of statistical pairwise comparisons between regions (α=0.05 or 0.01, by IBM SPSS Statistics 20). The compared regions can be distinguished by δ202Hg (red square), Δ199Hg (blue square) or both (1/2 blue +1/2 red square) ....................................................................................................................106
Figure 25 δ202Hg vs. Δ199Hg in all Chinese coals (n=49). ................................................................................108
Figure 26 Linear relationship of δ202Hg vs. 1/Hg or Δ199Hg vs. 1/Hg in coals from the USA (A), China (B), Romania (C, D) and Mongolia (E). The coal samples in the USA are from the Illinois coal basin reported
List of Figures
elsewhere (Lefticariu et al., 2011), and are averaged on a coal mine basis; the significant relationship of δ202Hg vs. 1/Hg and Δ199Hg vs. 1/Hg in Romanian coals would disappear when the lowest Hg sample (R11) is excluded. ...........................................................................................................................................................115
Figure 27 Linear relationship of δ202Hg vs. Δ199Hg in Romanian coals ...........................................................116
Figure 28 Box plots showing variations of δ202Hg (‰, A) and Δ199Hg (‰, B) in world coals of different ranks ..........................................................................................................................................................................117
Figure 29 Box plots showing variations of δ202Hg (‰, A) and Δ199Hg (‰, B) in world coals of different coal-forming periods ................................................................................................................................................118
160
List of Tables
List of Tables
Table 1. Summary of world coal reserve, production, consumption, export and import in 2011 ......................13
Table 2. Characteristics of stable Hg isotopes ....................................................................................................27
Table 3 ‘β’ scaling factors for isotope ratios relative to 202Hg/198Hg ..................................................................32
Table 4 Slopes of linear array of lnRxxx/198Hgm vs. lnR205/203Tlm assuming fractionation factors are identical for Hg and Tl ............................................................................................................................................................54
Table 5 Ash yield, sulfur and iron content, Hg concentration and δ13C values of coal and coke samples in the Zhuji Coal Mine, Huainan Coalfield ..................................................................................................................76
Table 6 Hg isotope compositions of coal and coke samples in Zhuji Coal Mine, Huainan Coalfield ...............78
Table 7 Hg concentrations and isotope compositions of coal and rock samples in Daizhuang Coal Mine, Jining Coalfield .............................................................................................................................................................78
Table 8 Summary of the means of δ202Hg, Δ199Hg and Δ201Hg in world coals ................................................104
161
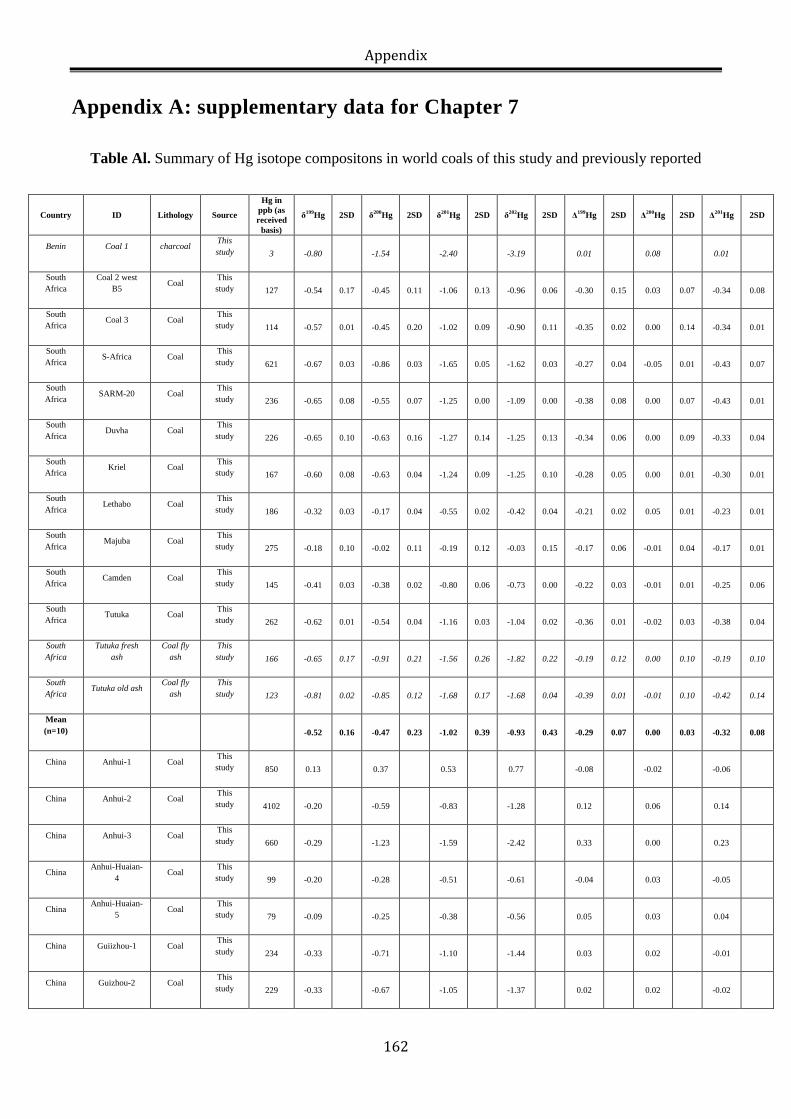
Appendix
Appendix A: supplementary data for Chapter 7
Table Al. Summary of Hg isotope compositons in world coals of this study and previously reported
Country ID Lithology Source
Hg in ppb (as received
basis)
δ199Hg 2SD δ200Hg 2SD δ201Hg 2SD δ202Hg 2SD Δ199Hg 2SD Δ200Hg 2SD Δ201Hg 2SD
Benin Coal 1 charcoal This study 3 -0.80 -1.54 -2.40 -3.19 0.01 0.08 0.01
South Africa
Coal 2 west B5 Coal
This study 127 -0.54 0.17 -0.45 0.11 -1.06 0.13 -0.96 0.06 -0.30 0.15 0.03 0.07 -0.34 0.08
South Africa
Coal 3 Coal This study 114 -0.57 0.01 -0.45 0.20 -1.02 0.09 -0.90 0.11 -0.35 0.02 0.00 0.14 -0.34 0.01
South Africa
S-Africa Coal This study 621 -0.67 0.03 -0.86 0.03 -1.65 0.05 -1.62 0.03 -0.27 0.04 -0.05 0.01 -0.43 0.07
South Africa
SARM-20 Coal This study 236 -0.65 0.08 -0.55 0.07 -1.25 0.00 -1.09 0.00 -0.38 0.08 0.00 0.07 -0.43 0.01
South Africa
Duvha Coal This study 226 -0.65 0.10 -0.63 0.16 -1.27 0.14 -1.25 0.13 -0.34 0.06 0.00 0.09 -0.33 0.04
South Africa
Kriel Coal This study 167 -0.60 0.08 -0.63 0.04 -1.24 0.09 -1.25 0.10 -0.28 0.05 0.00 0.01 -0.30 0.01
South Africa
Lethabo Coal This study 186 -0.32 0.03 -0.17 0.04 -0.55 0.02 -0.42 0.04 -0.21 0.02 0.05 0.01 -0.23 0.01
South Africa
Majuba Coal This study 275 -0.18 0.10 -0.02 0.11 -0.19 0.12 -0.03 0.15 -0.17 0.06 -0.01 0.04 -0.17 0.01
South Africa
Camden Coal This study 145 -0.41 0.03 -0.38 0.02 -0.80 0.06 -0.73 0.00 -0.22 0.03 -0.01 0.01 -0.25 0.06
South Africa
Tutuka Coal This study 262 -0.62 0.01 -0.54 0.04 -1.16 0.03 -1.04 0.02 -0.36 0.01 -0.02 0.03 -0.38 0.04
South Africa
Tutuka fresh ash
Coal fly ash
This study 166 -0.65 0.17 -0.91 0.21 -1.56 0.26 -1.82 0.22 -0.19 0.12 0.00 0.10 -0.19 0.10
South Africa
Tutuka old ash Coal fly
ash This study 123 -0.81 0.02 -0.85 0.12 -1.68 0.17 -1.68 0.04 -0.39 0.01 -0.01 0.10 -0.42 0.14
Mean (n=10)
-0.52 0.16 -0.47 0.23 -1.02 0.39 -0.93 0.43 -0.29 0.07 0.00 0.03 -0.32 0.08
China Anhui-1 Coal This study 850 0.13 0.37 0.53 0.77 -0.08 -0.02 -0.06
China Anhui-2 Coal This study 4102 -0.20 -0.59 -0.83 -1.28 0.12 0.06 0.14
China Anhui-3 Coal This study 660 -0.29 -1.23 -1.59 -2.42 0.33 0.00 0.23
China Anhui-Huaian-
4 Coal
This study 99 -0.20 -0.28 -0.51 -0.61 -0.04 0.03 -0.05
China Anhui-Huaian-
5 Coal This study 79 -0.09 -0.25 -0.38 -0.56 0.05 0.03 0.04
China Guiizhou-1 Coal This study 234 -0.33 -0.71 -1.10 -1.44 0.03 0.02 -0.01
China Guizhou-2 Coal This study 229 -0.33 -0.67 -1.05 -1.37 0.02 0.02 -0.02
162
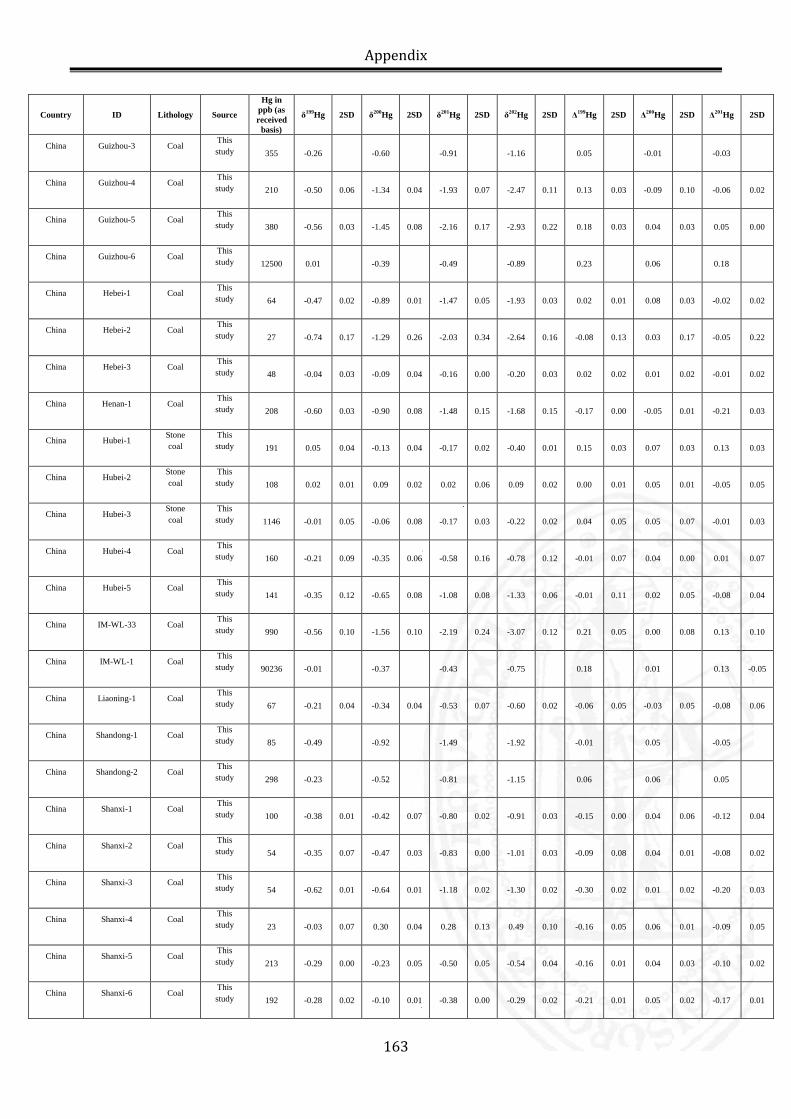
Appendix
Country ID Lithology Source
Hg in ppb (as received
basis)
δ199Hg 2SD δ200Hg 2SD δ201Hg 2SD δ202Hg 2SD Δ199Hg 2SD Δ200Hg 2SD Δ201Hg 2SD
China Guizhou-3 Coal This study 355 -0.26 -0.60 -0.91 -1.16 0.05 -0.01 -0.03
China Guizhou-4 Coal This study 210 -0.50 0.06 -1.34 0.04 -1.93 0.07 -2.47 0.11 0.13 0.03 -0.09 0.10 -0.06 0.02
China Guizhou-5 Coal This study 380 -0.56 0.03 -1.45 0.08 -2.16 0.17 -2.93 0.22 0.18 0.03 0.04 0.03 0.05 0.00
China Guizhou-6 Coal This study 12500 0.01 -0.39 -0.49 -0.89 0.23 0.06 0.18
China Hebei-1 Coal This study 64 -0.47 0.02 -0.89 0.01 -1.47 0.05 -1.93 0.03 0.02 0.01 0.08 0.03 -0.02 0.02
China Hebei-2 Coal This study 27 -0.74 0.17 -1.29 0.26 -2.03 0.34 -2.64 0.16 -0.08 0.13 0.03 0.17 -0.05 0.22
China Hebei-3 Coal This study 48 -0.04 0.03 -0.09 0.04 -0.16 0.00 -0.20 0.03 0.02 0.02 0.01 0.02 -0.01 0.02
China Henan-1 Coal This study 208 -0.60 0.03 -0.90 0.08 -1.48 0.15 -1.68 0.15 -0.17 0.00 -0.05 0.01 -0.21 0.03
China Hubei-1 Stone coal
This study 191 0.05 0.04 -0.13 0.04 -0.17 0.02 -0.40 0.01 0.15 0.03 0.07 0.03 0.13 0.03
China Hubei-2 Stone coal
This study 108 0.02 0.01 0.09 0.02 0.02 0.06 0.09 0.02 0.00 0.01 0.05 0.01 -0.05 0.05
China Hubei-3 Stone coal
This study 1146 -0.01 0.05 -0.06 0.08 -0.17 0.03 -0.22 0.02 0.04 0.05 0.05 0.07 -0.01 0.03
China Hubei-4 Coal This study 160 -0.21 0.09 -0.35 0.06 -0.58 0.16 -0.78 0.12 -0.01 0.07 0.04 0.00 0.01 0.07
China Hubei-5 Coal This study 141 -0.35 0.12 -0.65 0.08 -1.08 0.08 -1.33 0.06 -0.01 0.11 0.02 0.05 -0.08 0.04
China IM-WL-33 Coal This study 990 -0.56 0.10 -1.56 0.10 -2.19 0.24 -3.07 0.12 0.21 0.05 0.00 0.08 0.13 0.10
China IM-WL-1 Coal This study 90236 -0.01 -0.37 -0.43 -0.75 0.18 0.01 0.13 -0.05
China Liaoning-1 Coal This study 67 -0.21 0.04 -0.34 0.04 -0.53 0.07 -0.60 0.02 -0.06 0.05 -0.03 0.05 -0.08 0.06
China Shandong-1 Coal This study 85 -0.49 -0.92 -1.49 -1.92 -0.01 0.05 -0.05
China Shandong-2 Coal This study 298 -0.23 -0.52 -0.81 -1.15 0.06 0.06 0.05
China Shanxi-1 Coal This study 100 -0.38 0.01 -0.42 0.07 -0.80 0.02 -0.91 0.03 -0.15 0.00 0.04 0.06 -0.12 0.04
China Shanxi-2 Coal This study 54 -0.35 0.07 -0.47 0.03 -0.83 0.00 -1.01 0.03 -0.09 0.08 0.04 0.01 -0.08 0.02
China Shanxi-3 Coal This study 54 -0.62 0.01 -0.64 0.01 -1.18 0.02 -1.30 0.02 -0.30 0.02 0.01 0.02 -0.20 0.03
China Shanxi-4 Coal This study 23 -0.03 0.07 0.30 0.04 0.28 0.13 0.49 0.10 -0.16 0.05 0.06 0.01 -0.09 0.05
China Shanxi-5 Coal This study 213 -0.29 0.00 -0.23 0.05 -0.50 0.05 -0.54 0.04 -0.16 0.01 0.04 0.03 -0.10 0.02
China Shanxi-6 Coal This study 192 -0.28 0.02 -0.10 0.01 -0.38 0.00 -0.29 0.02 -0.21 0.01 0.05 0.02 -0.17 0.01
163
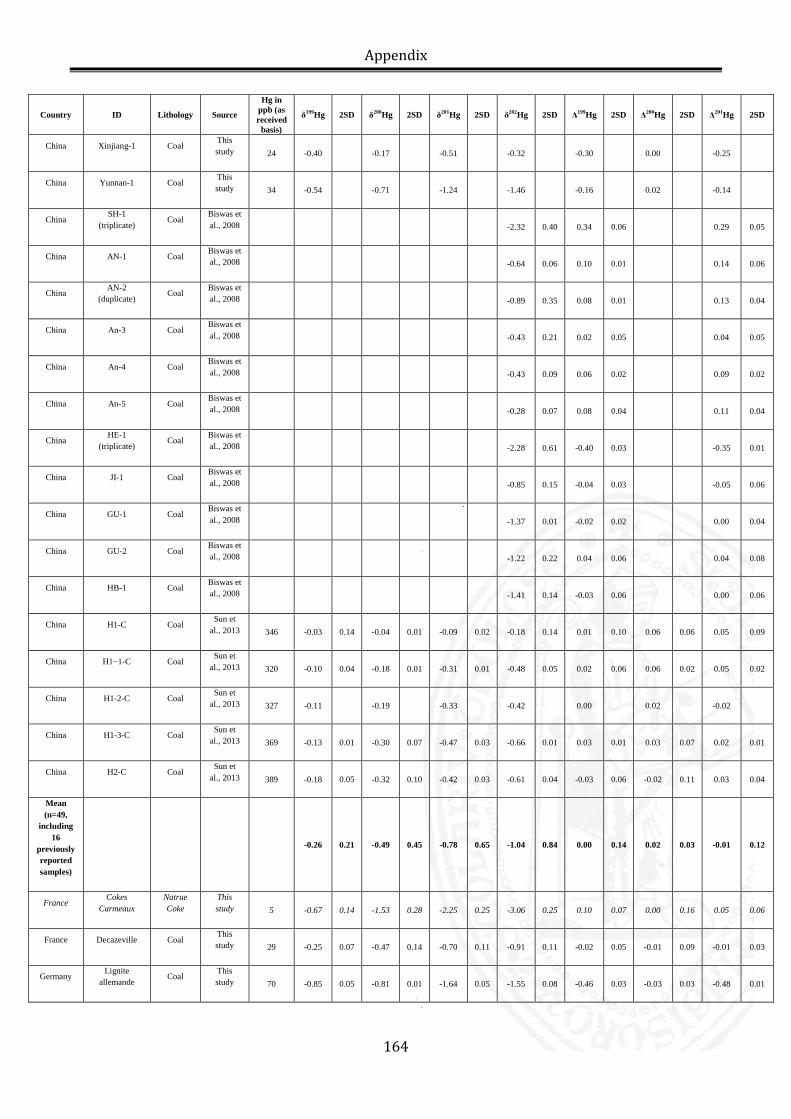
Appendix
Country ID Lithology Source
Hg in ppb (as received
basis)
δ199Hg 2SD δ200Hg 2SD δ201Hg 2SD δ202Hg 2SD Δ199Hg 2SD Δ200Hg 2SD Δ201Hg 2SD
China Xinjiang-1 Coal This study 24 -0.40 -0.17 -0.51 -0.32 -0.30 0.00 -0.25
China Yunnan-1 Coal This study 34 -0.54 -0.71 -1.24 -1.46 -0.16 0.02 -0.14
China SH-1
(triplicate) Coal
Biswas et al., 2008
-2.32 0.40 0.34 0.06 0.29 0.05
China AN-1 Coal Biswas et al., 2008
-0.64 0.06 0.10 0.01 0.14 0.06
China AN-2 (duplicate)
Coal Biswas et al., 2008
-0.89 0.35 0.08 0.01 0.13 0.04
China An-3 Coal Biswas et al., 2008
-0.43 0.21 0.02 0.05 0.04 0.05
China An-4 Coal Biswas et al., 2008
-0.43 0.09 0.06 0.02 0.09 0.02
China An-5 Coal Biswas et al., 2008
-0.28 0.07 0.08 0.04 0.11 0.04
China HE-1 (triplicate)
Coal Biswas et al., 2008
-2.28 0.61 -0.40 0.03 -0.35 0.01
China JI-1 Coal Biswas et al., 2008
-0.85 0.15 -0.04 0.03 -0.05 0.06
China GU-1 Coal Biswas et al., 2008
-1.37 0.01 -0.02 0.02 0.00 0.04
China GU-2 Coal Biswas et al., 2008
-1.22 0.22 0.04 0.06 0.04 0.08
China HB-1 Coal Biswas et al., 2008
-1.41 0.14 -0.03 0.06 0.00 0.06
China H1-C Coal Sun et
al., 2013 346 -0.03 0.14 -0.04 0.01 -0.09 0.02 -0.18 0.14 0.01 0.10 0.06 0.06 0.05 0.09
China H1−1-C Coal Sun et
al., 2013 320 -0.10 0.04 -0.18 0.01 -0.31 0.01 -0.48 0.05 0.02 0.06 0.06 0.02 0.05 0.02
China H1-2-C Coal Sun et
al., 2013 327 -0.11 -0.19 -0.33 -0.42 0.00 0.02 -0.02
China H1-3-C Coal Sun et al., 2013 369 -0.13 0.01 -0.30 0.07 -0.47 0.03 -0.66 0.01 0.03 0.01 0.03 0.07 0.02 0.01
China H2-C Coal Sun et
al., 2013 389 -0.18 0.05 -0.32 0.10 -0.42 0.03 -0.61 0.04 -0.03 0.06 -0.02 0.11 0.03 0.04
Mean (n=49,
including 16
previously reported samples)
-0.26 0.21 -0.49 0.45 -0.78 0.65 -1.04 0.84 0.00 0.14 0.02 0.03 -0.01 0.12
France Cokes
Carmeaux Natrue Coke
This study 5 -0.67 0.14 -1.53 0.28 -2.25 0.25 -3.06 0.25 0.10 0.07 0.00 0.16 0.05 0.06
France Decazeville Coal This study 29 -0.25 0.07 -0.47 0.14 -0.70 0.11 -0.91 0.11 -0.02 0.05 -0.01 0.09 -0.01 0.03
Germany Lignite allemande
Coal This study 70 -0.85 0.05 -0.81 0.01 -1.64 0.05 -1.55 0.08 -0.46 0.03 -0.03 0.03 -0.48 0.01
164
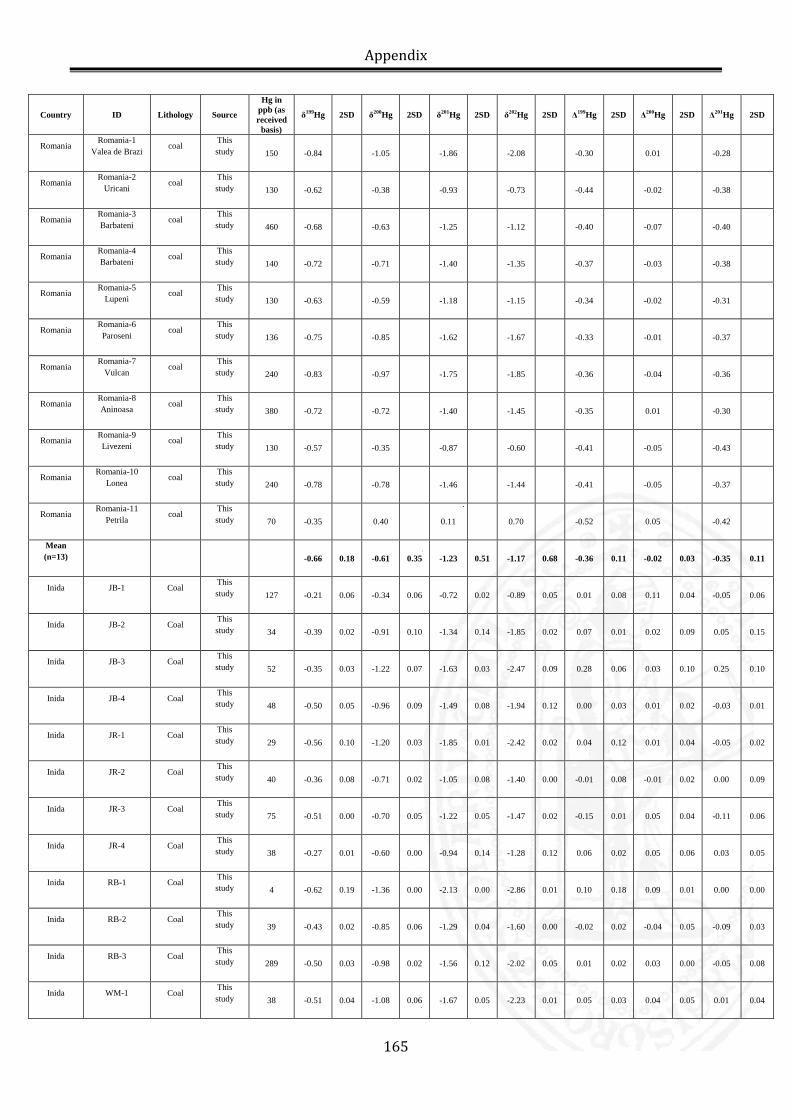
Appendix
Country ID Lithology Source
Hg in ppb (as received
basis)
δ199Hg 2SD δ200Hg 2SD δ201Hg 2SD δ202Hg 2SD Δ199Hg 2SD Δ200Hg 2SD Δ201Hg 2SD
Romania Romania-1
Valea de Brazi coal
This study 150 -0.84 -1.05 -1.86 -2.08 -0.30 0.01 -0.28
Romania Romania-2
Uricani coal
This study 130 -0.62 -0.38 -0.93 -0.73 -0.44 -0.02 -0.38
Romania Romania-3 Barbateni
coal This study 460 -0.68 -0.63 -1.25 -1.12 -0.40 -0.07 -0.40
Romania Romania-4 Barbateni coal
This study 140 -0.72 -0.71 -1.40 -1.35 -0.37 -0.03 -0.38
Romania Romania-5 Lupeni
coal This study 130 -0.63 -0.59 -1.18 -1.15 -0.34 -0.02 -0.31
Romania Romania-6 Paroseni
coal This study 136 -0.75 -0.85 -1.62 -1.67 -0.33 -0.01 -0.37
Romania Romania-7
Vulcan coal
This study 240 -0.83 -0.97 -1.75 -1.85 -0.36 -0.04 -0.36
Romania Romania-8 Aninoasa coal
This study 380 -0.72 -0.72 -1.40 -1.45 -0.35 0.01 -0.30
Romania Romania-9 Livezeni
coal This study 130 -0.57 -0.35 -0.87 -0.60 -0.41 -0.05 -0.43
Romania Romania-10
Lonea coal
This study 240 -0.78 -0.78 -1.46 -1.44 -0.41 -0.05 -0.37
Romania Romania-11
Petrila coal
This study 70 -0.35 0.40 0.11 0.70 -0.52 0.05 -0.42
Mean (n=13)
-0.66 0.18 -0.61 0.35 -1.23 0.51 -1.17 0.68 -0.36 0.11 -0.02 0.03 -0.35 0.11
Inida JB-1 Coal This study 127 -0.21 0.06 -0.34 0.06 -0.72 0.02 -0.89 0.05 0.01 0.08 0.11 0.04 -0.05 0.06
Inida JB-2 Coal This study 34 -0.39 0.02 -0.91 0.10 -1.34 0.14 -1.85 0.02 0.07 0.01 0.02 0.09 0.05 0.15
Inida JB-3 Coal This study 52 -0.35 0.03 -1.22 0.07 -1.63 0.03 -2.47 0.09 0.28 0.06 0.03 0.10 0.25 0.10
Inida JB-4 Coal This study 48 -0.50 0.05 -0.96 0.09 -1.49 0.08 -1.94 0.12 0.00 0.03 0.01 0.02 -0.03 0.01
Inida JR-1 Coal This study 29 -0.56 0.10 -1.20 0.03 -1.85 0.01 -2.42 0.02 0.04 0.12 0.01 0.04 -0.05 0.02
Inida JR-2 Coal This study 40 -0.36 0.08 -0.71 0.02 -1.05 0.08 -1.40 0.00 -0.01 0.08 -0.01 0.02 0.00 0.09
Inida JR-3 Coal This study 75 -0.51 0.00 -0.70 0.05 -1.22 0.05 -1.47 0.02 -0.15 0.01 0.05 0.04 -0.11 0.06
Inida JR-4 Coal This study 38 -0.27 0.01 -0.60 0.00 -0.94 0.14 -1.28 0.12 0.06 0.02 0.05 0.06 0.03 0.05
Inida RB-1 Coal This study 4 -0.62 0.19 -1.36 0.00 -2.13 0.00 -2.86 0.01 0.10 0.18 0.09 0.01 0.00 0.00
Inida RB-2 Coal This study 39 -0.43 0.02 -0.85 0.06 -1.29 0.04 -1.60 0.00 -0.02 0.02 -0.04 0.05 -0.09 0.03
Inida RB-3 Coal This study 289 -0.50 0.03 -0.98 0.02 -1.56 0.12 -2.02 0.05 0.01 0.02 0.03 0.00 -0.05 0.08
Inida WM-1 Coal This study 38 -0.51 0.04 -1.08 0.06 -1.67 0.05 -2.23 0.01 0.05 0.03 0.04 0.05 0.01 0.04
165
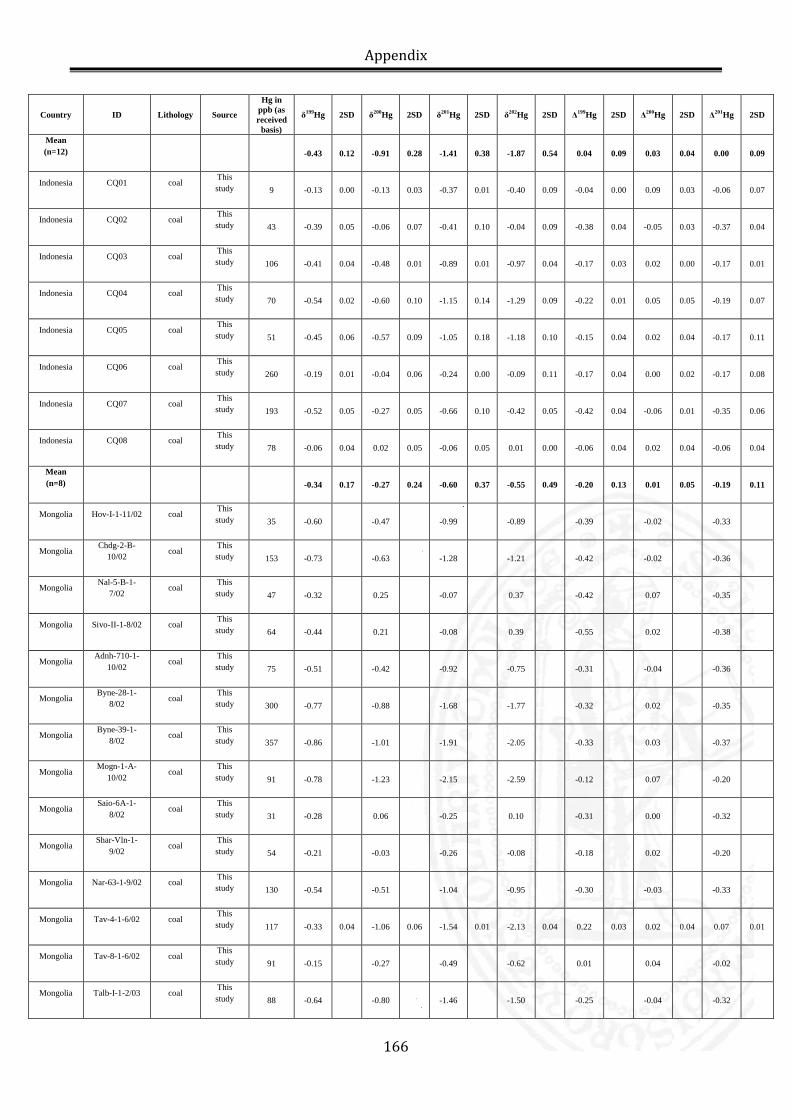
Appendix
Country ID Lithology Source
Hg in ppb (as received
basis)
δ199Hg 2SD δ200Hg 2SD δ201Hg 2SD δ202Hg 2SD Δ199Hg 2SD Δ200Hg 2SD Δ201Hg 2SD
Mean (n=12)
-0.43 0.12 -0.91 0.28 -1.41 0.38 -1.87 0.54 0.04 0.09 0.03 0.04 0.00 0.09
Indonesia CQ01 coal This study 9 -0.13 0.00 -0.13 0.03 -0.37 0.01 -0.40 0.09 -0.04 0.00 0.09 0.03 -0.06 0.07
Indonesia CQ02 coal This study 43 -0.39 0.05 -0.06 0.07 -0.41 0.10 -0.04 0.09 -0.38 0.04 -0.05 0.03 -0.37 0.04
Indonesia CQ03 coal This study 106 -0.41 0.04 -0.48 0.01 -0.89 0.01 -0.97 0.04 -0.17 0.03 0.02 0.00 -0.17 0.01
Indonesia CQ04 coal This study 70 -0.54 0.02 -0.60 0.10 -1.15 0.14 -1.29 0.09 -0.22 0.01 0.05 0.05 -0.19 0.07
Indonesia CQ05 coal This study 51 -0.45 0.06 -0.57 0.09 -1.05 0.18 -1.18 0.10 -0.15 0.04 0.02 0.04 -0.17 0.11
Indonesia CQ06 coal This study 260 -0.19 0.01 -0.04 0.06 -0.24 0.00 -0.09 0.11 -0.17 0.04 0.00 0.02 -0.17 0.08
Indonesia CQ07 coal This study 193 -0.52 0.05 -0.27 0.05 -0.66 0.10 -0.42 0.05 -0.42 0.04 -0.06 0.01 -0.35 0.06
Indonesia CQ08 coal This study 78 -0.06 0.04 0.02 0.05 -0.06 0.05 0.01 0.00 -0.06 0.04 0.02 0.04 -0.06 0.04
Mean (n=8)
-0.34 0.17 -0.27 0.24 -0.60 0.37 -0.55 0.49 -0.20 0.13 0.01 0.05 -0.19 0.11
Mongolia Hov-I-1-11/02 coal This study 35 -0.60 -0.47 -0.99 -0.89 -0.39 -0.02 -0.33
Mongolia Chdg-2-B-
10/02 coal This study 153 -0.73 -0.63 -1.28 -1.21 -0.42 -0.02 -0.36
Mongolia Nal-5-B-1-7/02
coal This study 47 -0.32 0.25 -0.07 0.37 -0.42 0.07 -0.35
Mongolia Sivo-II-1-8/02 coal This study 64 -0.44 0.21 -0.08 0.39 -0.55 0.02 -0.38
Mongolia Adnh-710-1-
10/02 coal
This study 75 -0.51 -0.42 -0.92 -0.75 -0.31 -0.04 -0.36
Mongolia Byne-28-1-
8/02 coal This study 300 -0.77 -0.88 -1.68 -1.77 -0.32 0.02 -0.35
Mongolia Byne-39-1-8/02
coal This study 357 -0.86 -1.01 -1.91 -2.05 -0.33 0.03 -0.37
Mongolia Mogn-1-A-
10/02 coal
This study 91 -0.78 -1.23 -2.15 -2.59 -0.12 0.07 -0.20
Mongolia Saio-6A-1-
8/02 coal
This study 31 -0.28 0.06 -0.25 0.10 -0.31 0.00 -0.32
Mongolia Shar-Vln-1-
9/02 coal
This study 54 -0.21 -0.03 -0.26 -0.08 -0.18 0.02 -0.20
Mongolia Nar-63-1-9/02 coal This study 130 -0.54 -0.51 -1.04 -0.95 -0.30 -0.03 -0.33
Mongolia Tav-4-1-6/02 coal This study 117 -0.33 0.04 -1.06 0.06 -1.54 0.01 -2.13 0.04 0.22 0.03 0.02 0.04 0.07 0.01
Mongolia Tav-8-1-6/02 coal This study 91 -0.15 -0.27 -0.49 -0.62 0.01 0.04 -0.02
Mongolia Talb-I-1-2/03 coal This study 88 -0.64 -0.80 -1.46 -1.50 -0.25 -0.04 -0.32
166
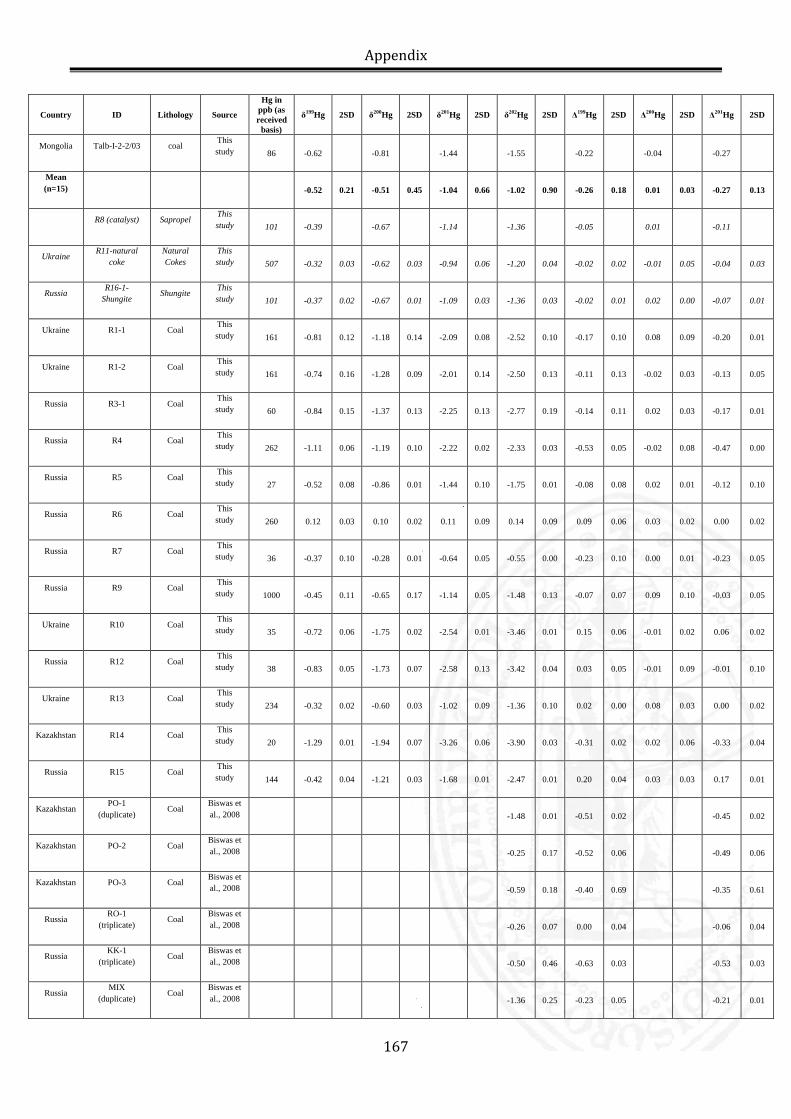
Appendix
Country ID Lithology Source
Hg in ppb (as received
basis)
δ199Hg 2SD δ200Hg 2SD δ201Hg 2SD δ202Hg 2SD Δ199Hg 2SD Δ200Hg 2SD Δ201Hg 2SD
Mongolia Talb-I-2-2/03 coal This study 86 -0.62 -0.81 -1.44 -1.55 -0.22 -0.04 -0.27
Mean (n=15)
-0.52 0.21 -0.51 0.45 -1.04 0.66 -1.02 0.90 -0.26 0.18 0.01 0.03 -0.27 0.13
R8 (catalyst) Sapropel This study 101 -0.39 -0.67 -1.14 -1.36 -0.05 0.01 -0.11
Ukraine R11-natural
coke Natural Cokes
This study 507 -0.32 0.03 -0.62 0.03 -0.94 0.06 -1.20 0.04 -0.02 0.02 -0.01 0.05 -0.04 0.03
Russia R16-1-Shungite
Shungite This study 101 -0.37 0.02 -0.67 0.01 -1.09 0.03 -1.36 0.03 -0.02 0.01 0.02 0.00 -0.07 0.01
Ukraine R1-1 Coal This study 161 -0.81 0.12 -1.18 0.14 -2.09 0.08 -2.52 0.10 -0.17 0.10 0.08 0.09 -0.20 0.01
Ukraine R1-2 Coal This study 161 -0.74 0.16 -1.28 0.09 -2.01 0.14 -2.50 0.13 -0.11 0.13 -0.02 0.03 -0.13 0.05
Russia R3-1 Coal This study 60 -0.84 0.15 -1.37 0.13 -2.25 0.13 -2.77 0.19 -0.14 0.11 0.02 0.03 -0.17 0.01
Russia R4 Coal This study 262 -1.11 0.06 -1.19 0.10 -2.22 0.02 -2.33 0.03 -0.53 0.05 -0.02 0.08 -0.47 0.00
Russia R5 Coal This study 27 -0.52 0.08 -0.86 0.01 -1.44 0.10 -1.75 0.01 -0.08 0.08 0.02 0.01 -0.12 0.10
Russia R6 Coal This study 260 0.12 0.03 0.10 0.02 0.11 0.09 0.14 0.09 0.09 0.06 0.03 0.02 0.00 0.02
Russia R7 Coal This study 36 -0.37 0.10 -0.28 0.01 -0.64 0.05 -0.55 0.00 -0.23 0.10 0.00 0.01 -0.23 0.05
Russia R9 Coal This study 1000 -0.45 0.11 -0.65 0.17 -1.14 0.05 -1.48 0.13 -0.07 0.07 0.09 0.10 -0.03 0.05
Ukraine R10 Coal This study 35 -0.72 0.06 -1.75 0.02 -2.54 0.01 -3.46 0.01 0.15 0.06 -0.01 0.02 0.06 0.02
Russia R12 Coal This study 38 -0.83 0.05 -1.73 0.07 -2.58 0.13 -3.42 0.04 0.03 0.05 -0.01 0.09 -0.01 0.10
Ukraine R13 Coal This study 234 -0.32 0.02 -0.60 0.03 -1.02 0.09 -1.36 0.10 0.02 0.00 0.08 0.03 0.00 0.02
Kazakhstan R14 Coal This study 20 -1.29 0.01 -1.94 0.07 -3.26 0.06 -3.90 0.03 -0.31 0.02 0.02 0.06 -0.33 0.04
Russia R15 Coal This study 144 -0.42 0.04 -1.21 0.03 -1.68 0.01 -2.47 0.01 0.20 0.04 0.03 0.03 0.17 0.01
Kazakhstan PO-1
(duplicate) Coal
Biswas et al., 2008
-1.48 0.01 -0.51 0.02 -0.45 0.02
Kazakhstan PO-2 Coal Biswas et al., 2008
-0.25 0.17 -0.52 0.06 -0.49 0.06
Kazakhstan PO-3 Coal Biswas et al., 2008
-0.59 0.18 -0.40 0.69 -0.35 0.61
Russia RO-1
(triplicate) Coal
Biswas et al., 2008
-0.26 0.07 0.00 0.04 -0.06 0.04
Russia KK-1
(triplicate) Coal
Biswas et al., 2008
-0.50 0.46 -0.63 0.03 -0.53 0.03
Russia MIX
(duplicate) Coal
Biswas et al., 2008
-1.36 0.25 -0.23 0.05 -0.21 0.01
167
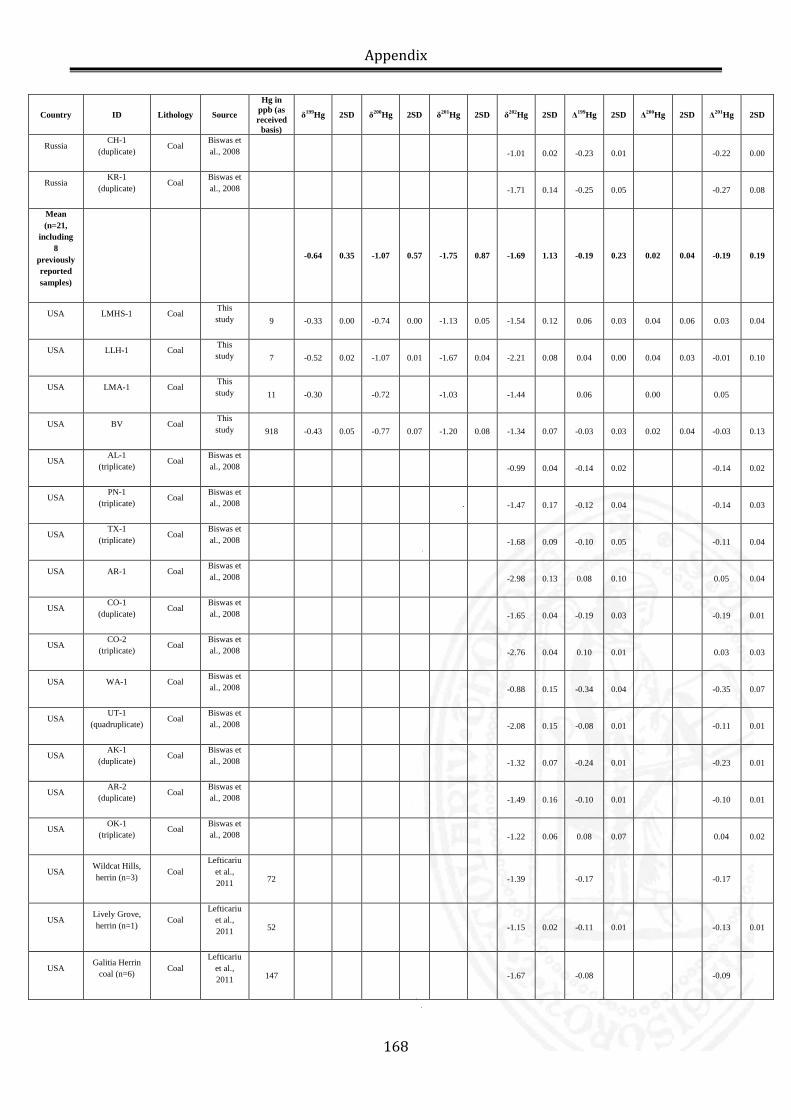
Appendix
Country ID Lithology Source
Hg in ppb (as received
basis)
δ199Hg 2SD δ200Hg 2SD δ201Hg 2SD δ202Hg 2SD Δ199Hg 2SD Δ200Hg 2SD Δ201Hg 2SD
Russia CH-1
(duplicate) Coal
Biswas et al., 2008
-1.01 0.02 -0.23 0.01 -0.22 0.00
Russia KR-1
(duplicate) Coal
Biswas et al., 2008
-1.71 0.14 -0.25 0.05 -0.27 0.08
Mean (n=21,
including 8
previously reported samples)
-0.64 0.35 -1.07 0.57 -1.75 0.87 -1.69 1.13 -0.19 0.23 0.02 0.04 -0.19 0.19
USA LMHS-1 Coal This study 9 -0.33 0.00 -0.74 0.00 -1.13 0.05 -1.54 0.12 0.06 0.03 0.04 0.06 0.03 0.04
USA LLH-1 Coal This study 7 -0.52 0.02 -1.07 0.01 -1.67 0.04 -2.21 0.08 0.04 0.00 0.04 0.03 -0.01 0.10
USA LMA-1 Coal This study 11 -0.30 -0.72 -1.03 -1.44 0.06 0.00 0.05
USA BV Coal This study 918 -0.43 0.05 -0.77 0.07 -1.20 0.08 -1.34 0.07 -0.03 0.03 0.02 0.04 -0.03 0.13
USA AL-1
(triplicate) Coal
Biswas et al., 2008
-0.99 0.04 -0.14 0.02 -0.14 0.02
USA PN-1 (triplicate)
Coal Biswas et al., 2008
-1.47 0.17 -0.12 0.04 -0.14 0.03
USA TX-1
(triplicate) Coal
Biswas et al., 2008
-1.68 0.09 -0.10 0.05 -0.11 0.04
USA AR-1 Coal Biswas et al., 2008
-2.98 0.13 0.08 0.10 0.05 0.04
USA CO-1
(duplicate) Coal
Biswas et al., 2008
-1.65 0.04 -0.19 0.03 -0.19 0.01
USA CO-2
(triplicate) Coal Biswas et al., 2008
-2.76 0.04 0.10 0.01 0.03 0.03
USA WA-1 Coal Biswas et al., 2008
-0.88 0.15 -0.34 0.04 -0.35 0.07
USA UT-1
(quadruplicate) Coal
Biswas et al., 2008
-2.08 0.15 -0.08 0.01 -0.11 0.01
USA AK-1
(duplicate) Coal
Biswas et al., 2008
-1.32 0.07 -0.24 0.01 -0.23 0.01
USA AR-2
(duplicate) Coal Biswas et al., 2008
-1.49 0.16 -0.10 0.01 -0.10 0.01
USA OK-1 (triplicate)
Coal Biswas et al., 2008
-1.22 0.06 0.08 0.07 0.04 0.02
USA Wildcat Hills, herrin (n=3)
Coal Lefticariu
et al., 2011 72 -1.39 -0.17 -0.17
USA Lively Grove, herrin (n=1)
Coal Lefticariu
et al., 2011 52 -1.15 0.02 -0.11 0.01 -0.13 0.01
USA Galitia Herrin
coal (n=6) Coal Lefticariu
et al., 2011 147 -1.67 -0.08 -0.09
168
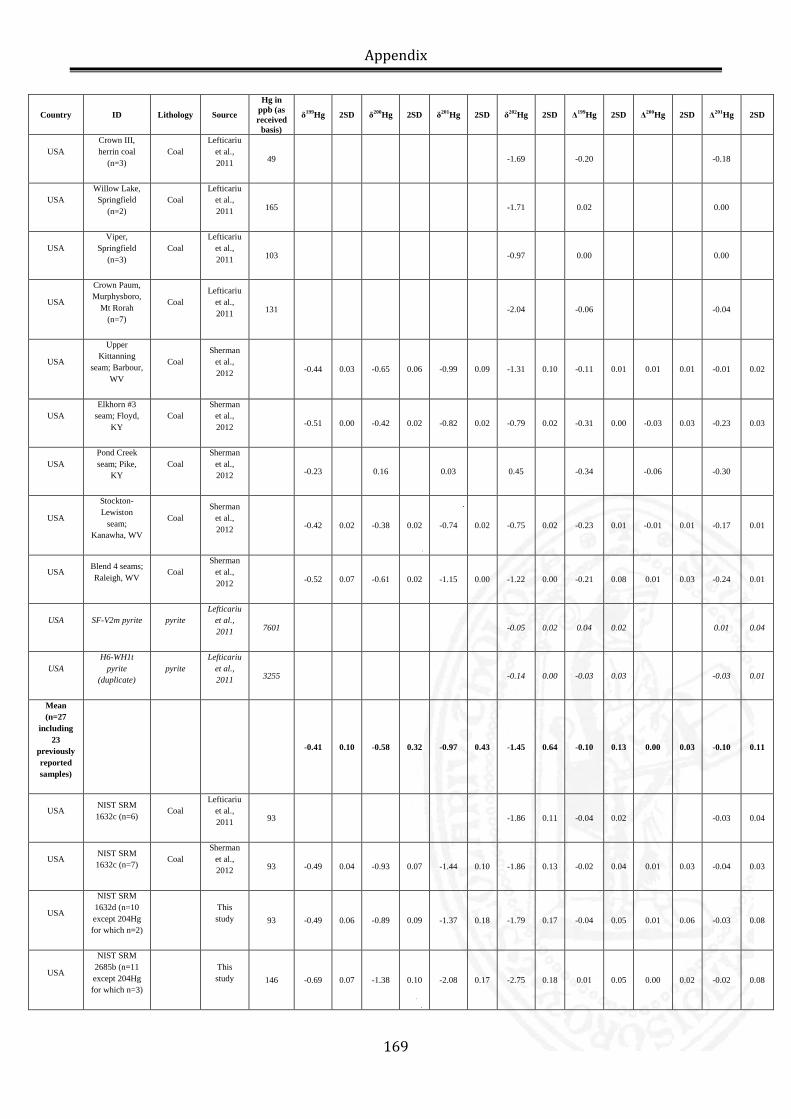
Appendix
Country ID Lithology Source
Hg in ppb (as received
basis)
δ199Hg 2SD δ200Hg 2SD δ201Hg 2SD δ202Hg 2SD Δ199Hg 2SD Δ200Hg 2SD Δ201Hg 2SD
USA Crown III, herrin coal
(n=3) Coal
Lefticariu et al., 2011 49 -1.69 -0.20 -0.18
USA Willow Lake, Springfield
(n=2) Coal
Lefticariu et al., 2011 165 -1.71 0.02 0.00
USA Viper,
Springfield (n=3)
Coal Lefticariu
et al., 2011 103 -0.97 0.00 0.00
USA
Crown Paum, Murphysboro,
Mt Rorah (n=7)
Coal Lefticariu
et al., 2011 131 -2.04 -0.06 -0.04
USA
Upper Kittanning
seam; Barbour, WV
Coal Sherman
et al., 2012 -0.44 0.03 -0.65 0.06 -0.99 0.09 -1.31 0.10 -0.11 0.01 0.01 0.01 -0.01 0.02
USA Elkhorn #3
seam; Floyd, KY
Coal Sherman
et al., 2012 -0.51 0.00 -0.42 0.02 -0.82 0.02 -0.79 0.02 -0.31 0.00 -0.03 0.03 -0.23 0.03
USA Pond Creek seam; Pike,
KY Coal
Sherman et al., 2012 -0.23 0.16 0.03 0.45 -0.34 -0.06 -0.30
USA
Stockton-Lewiston
seam; Kanawha, WV
Coal Sherman
et al., 2012 -0.42 0.02 -0.38 0.02 -0.74 0.02 -0.75 0.02 -0.23 0.01 -0.01 0.01 -0.17 0.01
USA Blend 4 seams; Raleigh, WV
Coal Sherman
et al., 2012 -0.52 0.07 -0.61 0.02 -1.15 0.00 -1.22 0.00 -0.21 0.08 0.01 0.03 -0.24 0.01
USA SF-V2m pyrite pyrite Lefticariu
et al., 2011 7601 -0.05 0.02 0.04 0.02 0.01 0.04
USA H6-WH1t
pyrite (duplicate)
pyrite Lefticariu
et al., 2011 3255 -0.14 0.00 -0.03 0.03 -0.03 0.01
Mean (n=27
including 23
previously reported samples)
-0.41 0.10 -0.58 0.32 -0.97 0.43 -1.45 0.64 -0.10 0.13 0.00 0.03 -0.10 0.11
USA NIST SRM 1632c (n=6)
Coal Lefticariu
et al., 2011 93 -1.86 0.11 -0.04 0.02 -0.03 0.04
USA NIST SRM 1632c (n=7) Coal
Sherman et al., 2012 93 -0.49 0.04 -0.93 0.07 -1.44 0.10 -1.86 0.13 -0.02 0.04 0.01 0.03 -0.04 0.03
USA
NIST SRM 1632d (n=10 except 204Hg for which n=2)
This study 93 -0.49 0.06 -0.89 0.09 -1.37 0.18 -1.79 0.17 -0.04 0.05 0.01 0.06 -0.03 0.08
USA
NIST SRM 2685b (n=11 except 204Hg for which n=3)
This study 146 -0.69 0.07 -1.38 0.10 -2.08 0.17 -2.75 0.18 0.01 0.05 0.00 0.02 -0.02 0.08
169

Appendix
Country ID Lithology Source
Hg in ppb (as received
basis)
δ199Hg 2SD δ200Hg 2SD δ201Hg 2SD δ202Hg 2SD Δ199Hg 2SD Δ200Hg 2SD Δ201Hg 2SD
USA USGS CLB-1
(n=2)
This study 200 -0.38 0.01 -0.64 0.08 -1.05 0.02 -1.29 0.06 -0.04 0.01 0.01 0.06 -0.07 0.01
USA UM-Almaden
(n=53)
This study
-0.16 0.08 -0.27 0.10 -0.47 0.15 -0.57 0.11 -0.02 0.06 0.01 0.05 -0.05 0.07
170
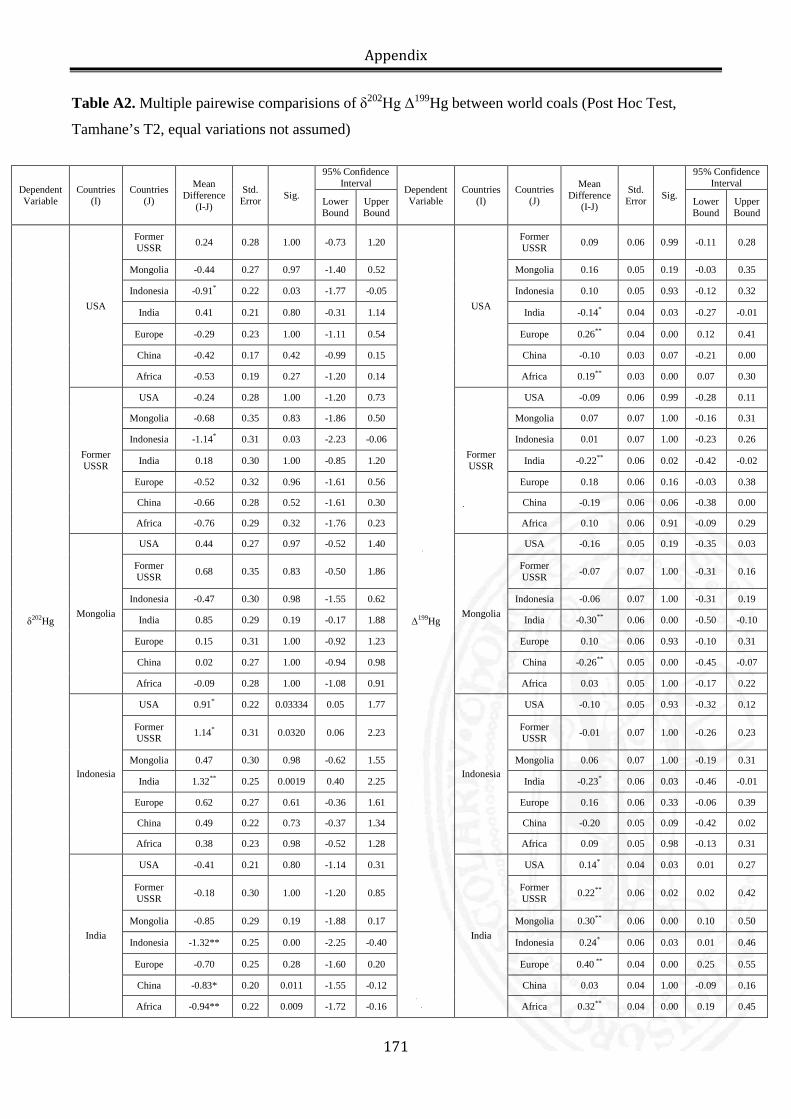
Appendix
Table A2. Multiple pairewise comparisions of δ202Hg Δ199Hg between world coals (Post Hoc Test,
Tamhane’s T2, equal variations not assumed)
Dependent Variable
Countries (I)
Countries (J)
Mean Difference
(I-J)
Std. Error Sig.
95% Confidence Interval Dependent
Variable Countries
(I) Countries
(J)
Mean Difference
(I-J)
Std. Error Sig.
95% Confidence Interval
Lower Bound
Upper Bound
Lower Bound
Upper Bound
δ202Hg
USA
Former USSR 0.24 0.28 1.00 -0.73 1.20
Δ199Hg
USA
Former USSR 0.09 0.06 0.99 -0.11 0.28
Mongolia -0.44 0.27 0.97 -1.40 0.52 Mongolia 0.16 0.05 0.19 -0.03 0.35
Indonesia -0.91* 0.22 0.03 -1.77 -0.05 Indonesia 0.10 0.05 0.93 -0.12 0.32
India 0.41 0.21 0.80 -0.31 1.14 India -0.14* 0.04 0.03 -0.27 -0.01
Europe -0.29 0.23 1.00 -1.11 0.54 Europe 0.26** 0.04 0.00 0.12 0.41
China -0.42 0.17 0.42 -0.99 0.15 China -0.10 0.03 0.07 -0.21 0.00
Africa -0.53 0.19 0.27 -1.20 0.14 Africa 0.19** 0.03 0.00 0.07 0.30
Former USSR
USA -0.24 0.28 1.00 -1.20 0.73
Former USSR
USA -0.09 0.06 0.99 -0.28 0.11
Mongolia -0.68 0.35 0.83 -1.86 0.50 Mongolia 0.07 0.07 1.00 -0.16 0.31
Indonesia -1.14* 0.31 0.03 -2.23 -0.06 Indonesia 0.01 0.07 1.00 -0.23 0.26
India 0.18 0.30 1.00 -0.85 1.20 India -0.22** 0.06 0.02 -0.42 -0.02
Europe -0.52 0.32 0.96 -1.61 0.56 Europe 0.18 0.06 0.16 -0.03 0.38
China -0.66 0.28 0.52 -1.61 0.30 China -0.19 0.06 0.06 -0.38 0.00
Africa -0.76 0.29 0.32 -1.76 0.23 Africa 0.10 0.06 0.91 -0.09 0.29
Mongolia
USA 0.44 0.27 0.97 -0.52 1.40
Mongolia
USA -0.16 0.05 0.19 -0.35 0.03
Former USSR 0.68 0.35 0.83 -0.50 1.86 Former
USSR -0.07 0.07 1.00 -0.31 0.16
Indonesia -0.47 0.30 0.98 -1.55 0.62 Indonesia -0.06 0.07 1.00 -0.31 0.19
India 0.85 0.29 0.19 -0.17 1.88 India -0.30** 0.06 0.00 -0.50 -0.10
Europe 0.15 0.31 1.00 -0.92 1.23 Europe 0.10 0.06 0.93 -0.10 0.31
China 0.02 0.27 1.00 -0.94 0.98 China -0.26** 0.05 0.00 -0.45 -0.07
Africa -0.09 0.28 1.00 -1.08 0.91 Africa 0.03 0.05 1.00 -0.17 0.22
Indonesia
USA 0.91* 0.22 0.03334 0.05 1.77
Indonesia
USA -0.10 0.05 0.93 -0.32 0.12
Former USSR 1.14* 0.31 0.0320 0.06 2.23 Former
USSR -0.01 0.07 1.00 -0.26 0.23
Mongolia 0.47 0.30 0.98 -0.62 1.55 Mongolia 0.06 0.07 1.00 -0.19 0.31
India 1.32** 0.25 0.0019 0.40 2.25 India -0.23* 0.06 0.03 -0.46 -0.01
Europe 0.62 0.27 0.61 -0.36 1.61 Europe 0.16 0.06 0.33 -0.06 0.39
China 0.49 0.22 0.73 -0.37 1.34 China -0.20 0.05 0.09 -0.42 0.02
Africa 0.38 0.23 0.98 -0.52 1.28 Africa 0.09 0.05 0.98 -0.13 0.31
India
USA -0.41 0.21 0.80 -1.14 0.31
India
USA 0.14* 0.04 0.03 0.01 0.27
Former USSR -0.18 0.30 1.00 -1.20 0.85 Former
USSR 0.22** 0.06 0.02 0.02 0.42
Mongolia -0.85 0.29 0.19 -1.88 0.17 Mongolia 0.30** 0.06 0.00 0.10 0.50
Indonesia -1.32** 0.25 0.00 -2.25 -0.40 Indonesia 0.24* 0.06 0.03 0.01 0.46
Europe -0.70 0.25 0.28 -1.60 0.20 Europe 0.40 ** 0.04 0.00 0.25 0.55
China -0.83* 0.20 0.011 -1.55 -0.12 China 0.03 0.04 1.00 -0.09 0.16
Africa -0.94** 0.22 0.009 -1.72 -0.16 Africa 0.32** 0.04 0.00 0.19 0.45
171
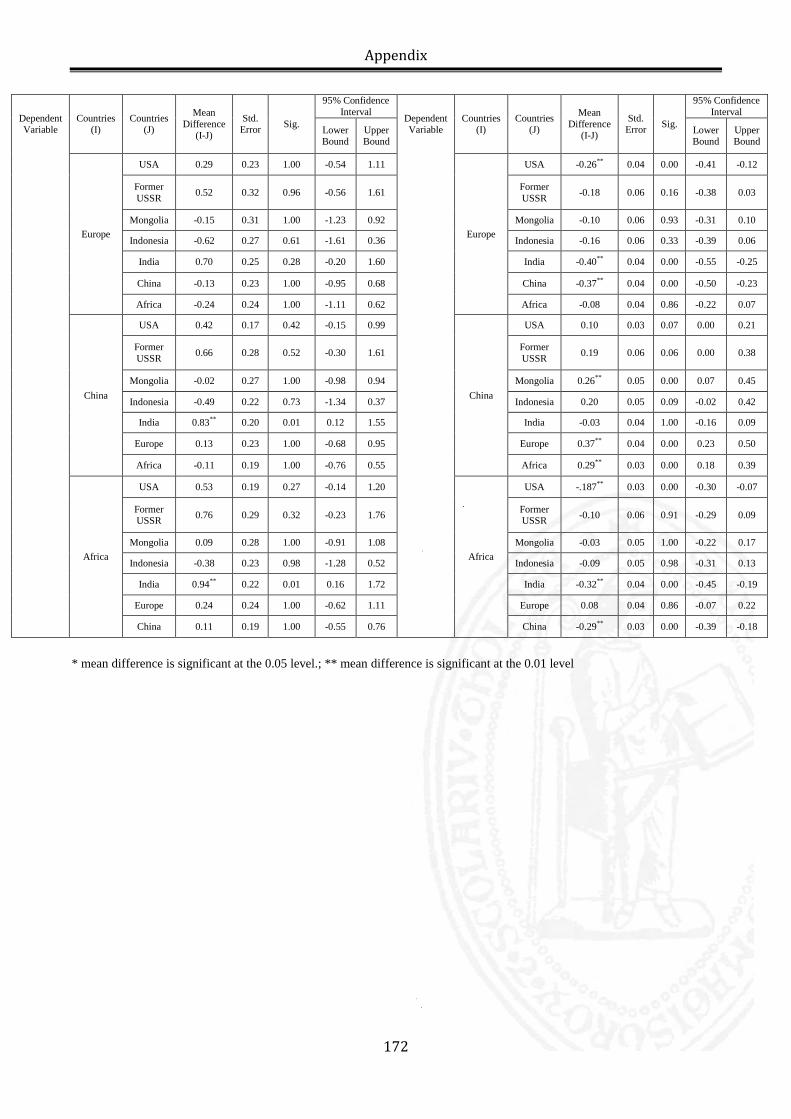
Appendix
Dependent Variable
Countries (I)
Countries (J)
Mean Difference
(I-J)
Std. Error Sig.
95% Confidence Interval Dependent
Variable Countries
(I) Countries
(J)
Mean Difference
(I-J)
Std. Error Sig.
95% Confidence Interval
Lower Bound
Upper Bound
Lower Bound
Upper Bound
Europe
USA 0.29 0.23 1.00 -0.54 1.11
Europe
USA -0.26** 0.04 0.00 -0.41 -0.12
Former USSR 0.52 0.32 0.96 -0.56 1.61 Former
USSR -0.18 0.06 0.16 -0.38 0.03
Mongolia -0.15 0.31 1.00 -1.23 0.92 Mongolia -0.10 0.06 0.93 -0.31 0.10
Indonesia -0.62 0.27 0.61 -1.61 0.36 Indonesia -0.16 0.06 0.33 -0.39 0.06
India 0.70 0.25 0.28 -0.20 1.60 India -0.40** 0.04 0.00 -0.55 -0.25
China -0.13 0.23 1.00 -0.95 0.68 China -0.37** 0.04 0.00 -0.50 -0.23
Africa -0.24 0.24 1.00 -1.11 0.62 Africa -0.08 0.04 0.86 -0.22 0.07
China
USA 0.42 0.17 0.42 -0.15 0.99
China
USA 0.10 0.03 0.07 0.00 0.21
Former USSR 0.66 0.28 0.52 -0.30 1.61 Former
USSR 0.19 0.06 0.06 0.00 0.38
Mongolia -0.02 0.27 1.00 -0.98 0.94 Mongolia 0.26** 0.05 0.00 0.07 0.45
Indonesia -0.49 0.22 0.73 -1.34 0.37 Indonesia 0.20 0.05 0.09 -0.02 0.42
India 0.83** 0.20 0.01 0.12 1.55 India -0.03 0.04 1.00 -0.16 0.09
Europe 0.13 0.23 1.00 -0.68 0.95 Europe 0.37** 0.04 0.00 0.23 0.50
Africa -0.11 0.19 1.00 -0.76 0.55 Africa 0.29** 0.03 0.00 0.18 0.39
Africa
USA 0.53 0.19 0.27 -0.14 1.20
Africa
USA -.187** 0.03 0.00 -0.30 -0.07
Former USSR 0.76 0.29 0.32 -0.23 1.76 Former
USSR -0.10 0.06 0.91 -0.29 0.09
Mongolia 0.09 0.28 1.00 -0.91 1.08 Mongolia -0.03 0.05 1.00 -0.22 0.17
Indonesia -0.38 0.23 0.98 -1.28 0.52 Indonesia -0.09 0.05 0.98 -0.31 0.13
India 0.94** 0.22 0.01 0.16 1.72 India -0.32** 0.04 0.00 -0.45 -0.19
Europe 0.24 0.24 1.00 -0.62 1.11 Europe 0.08 0.04 0.86 -0.07 0.22
China 0.11 0.19 1.00 -0.55 0.76 China -0.29** 0.03 0.00 -0.39 -0.18
* mean difference is significant at the 0.05 level.; ** mean difference is significant at the 0.01 level
172
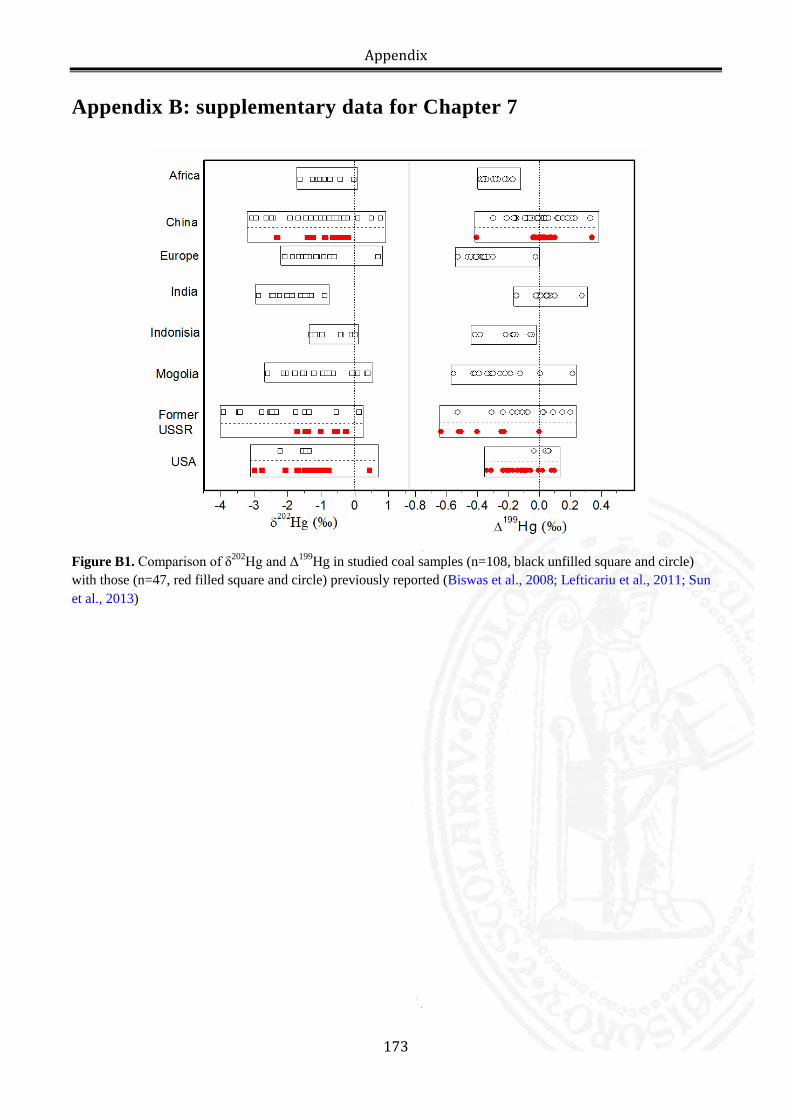
Appendix
Appendix B: supplementary data for Chapter 7
Figure B1. Comparison of δ202Hg and Δ199Hg in studied coal samples (n=108, black unfilled square and circle) with those (n=47, red filled square and circle) previously reported (Biswas et al., 2008; Lefticariu et al., 2011; Sun et al., 2013)
173
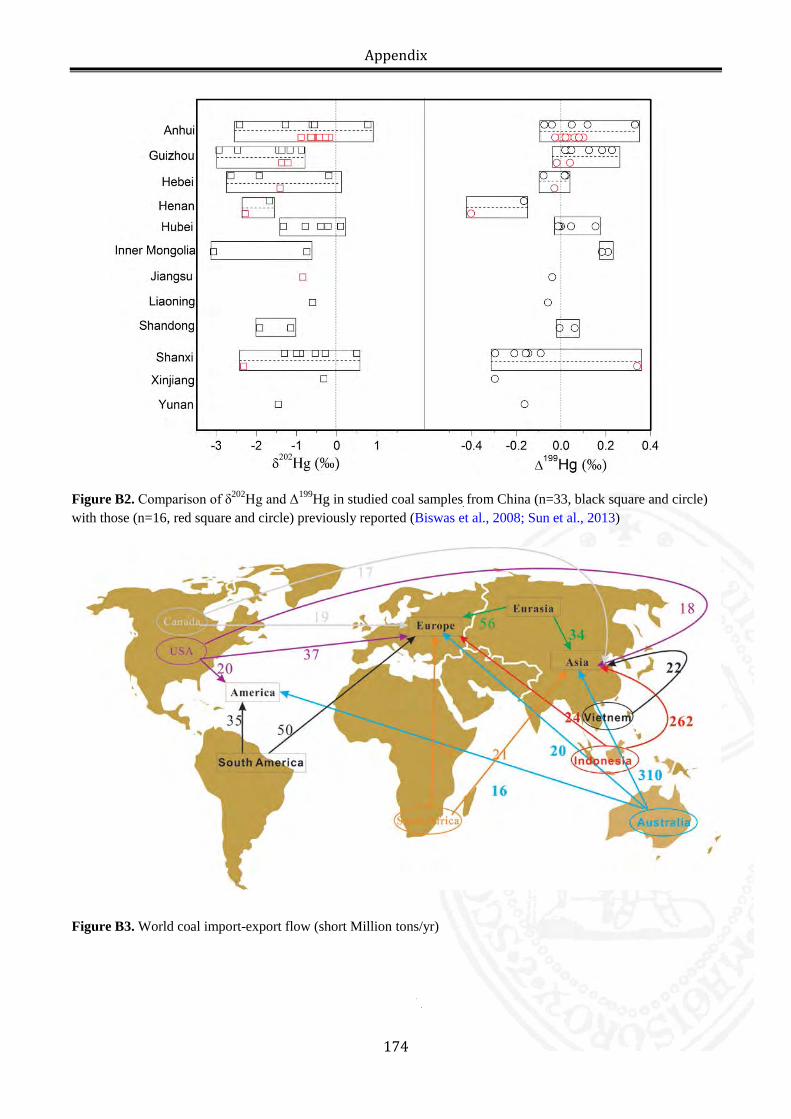
Appendix
Figure B2. Comparison of δ202Hg and Δ199Hg in studied coal samples from China (n=33, black square and circle) with those (n=16, red square and circle) previously reported (Biswas et al., 2008; Sun et al., 2013)
Figure B3. World coal import-export flow (short Million tons/yr)
174
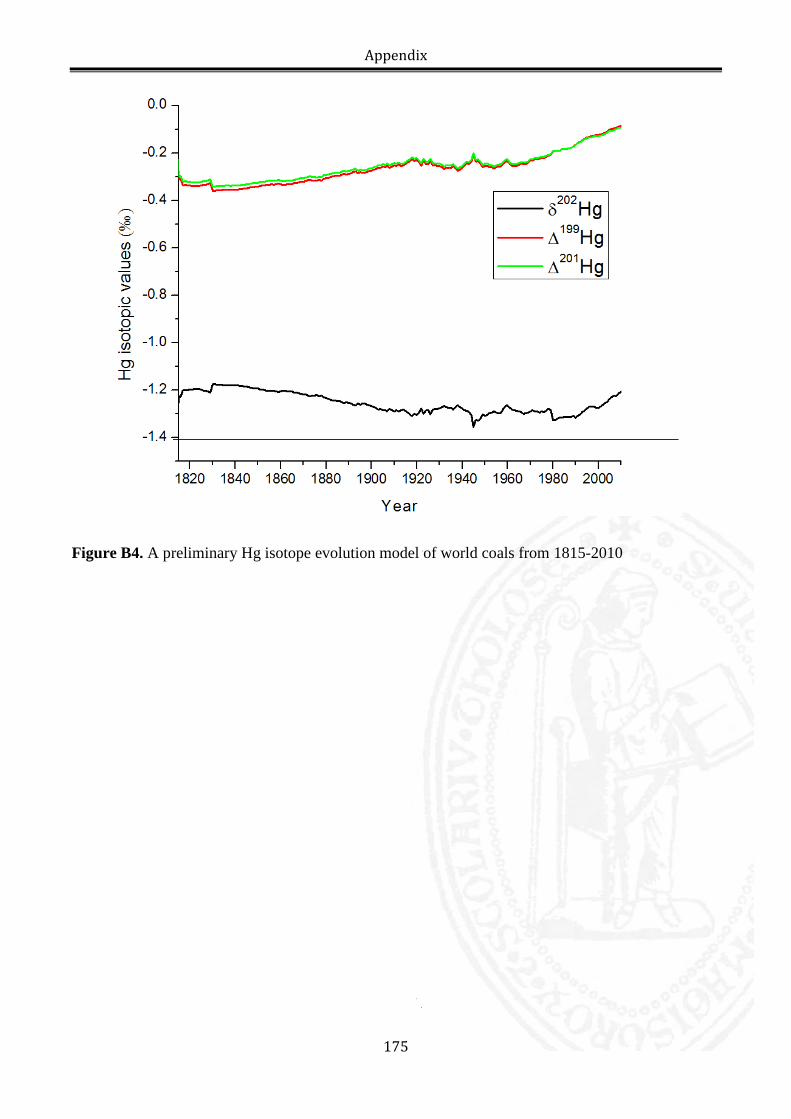
Appendix
Figure B4. A preliminary Hg isotope evolution model of world coals from 1815-2010
175
Résumé Le mercure (Hg) est un élément toxique et récalcitrant dans notre environnement. Depuis la révolution industrielle, les activités humains ont augmenté la quantité du Hg qui cycle à la surface de la Terre d’un facteur trois. Les émissions du Hg des centrales au charbon représentent à elles-seules la moitié de tous les émissions anthropiques du Hg. Désormais, le traçage quantitatif de ces émissions des différentes régions du globe n’est pas simple. L’objectif de cette thèse a été d’explorer les signatures isotopiques du Hg comme traceur potentiel des émissions du Hg des centrales au charbon. Dans un premier temps un protocole d’extraction, purification et de pré-concentration du Hg par voie de combustion et re-piégeage acide a été développé. Une fois purifie, le Hg a été analyse par spectrométrie de masse à haute précision (~0.1‰, 2σ). En résumé, nous observons que les charbons provenant du globe entier sont isotopiquement discernable à un niveau de p de <0.05 ou <0.1. Les processus de combustion et de captage du Hg dans les centrales au charbon ne modifient que minimalement les signatures isotopiques du Hg. Nous considérons ces deux résultats suffisamment prometteur à fin de recommander des études plus élaborées au sujet du traçage des émissions du Hg des centrales au charbon dans l’environnement. Il sera important d’étudier les signatures isotopiques des formes gazeuses et particulaires du Hg dans les panaches des centrales au charbon, afin de vérifier leur variation et évolution. La difficulté de tracer les sources du Hg réside dans la modification de ses signatures isotopiques par les transformations biogéochimiques omniprésentes dans l’atmosphère. Abstract Mercury (Hg) is a toxic, persistent and globally distributed pollutant. Since the industrial revolution, human activities have augmented the global Hg cycle at the Earth’s surface by a factor of three. Hg emissions from coal-fired power plants represent at present the largest single anthropogenic source. However, quantitative tracing of the fate of coal Hg emissions from different countries or regions is a challenging issue. The objective of this PhD dissertation was to use Hg stable isotope signatures to address this problem. Firstly, we developed a combustion-trapping protocol to extract, purify and pre-concentrate Hg from solid samples with low Hg levels such as coal and coal combustion products. Purified coal Hg was then measured for its isotope compositions by high-precision (~0.1‰, 2σ) multi-collector inductively coupled plasma mass spectrometry. In summary we find that coals from different global coal basins are often isotopically distinguishable at the p=0.05 or 0.10 level, and that combustion and capture processes in coal-fired power plants do not substantially change feed coal Hg isotope signatures. We consider these combined results to be sufficiently promising to recommend detailed atmospheric Hg isotope tracer studies of coal plant Hg emissions. However, we anticipate that the different gaseous and particulate forms of Hg in coal flue gas emissions may carry more contrasting Hg isotope signatures than we estimated for bulk emissions. Therefore, caution should be taken in near-field and far-field coal Hg emission tracing, and additional studies on the Hg isotope signatures of coal plant Hg emissions are necessary.