Embed Size (px)
Citation preview
Research Collection
Report
Thermal expansion, compressibility and volumetric changes ofquartz obtained by single crystal dilatometry to 700°C and 3.5kilobars (0.35 GPa)
Author(s): Raz, Urs; Girsperger, Sven; Thompson, Alan Bruce
Publication Date: 2002
Permanent Link: https://doi.org/10.3929/ethz-a-004392716
Rights / License: In Copyright - Non-Commercial Use Permitted
This page was generated automatically upon download from the ETH Zurich Research Collection. For moreinformation please consult the Terms of use.
ETH Library

U.RAZ, S. GIRSPERGER AND A.B. THOMPSON EXPANSION AND COMPRESSIBILTY CHANGES OF QUARTZ
1
Thermal expansion, compressibility and volumetric changes of quartz obtained by single crystal dilatometry to 700°C and 3.5 kilobars (0.35
GPa).
by Urs Raz1,2, Sven Girsperger 1& Alan Bruce Thompson 1
Abstract
A dilatometer has been developed to measure volumetric changes of oriented single crystals simultaneously as a function of pressure and temperature to 0.6 GPa and 900oC. Argon gas is used as the pressure medium inside an externally heated hydrothermal cold-seal rod-bomb. The present apparatus has been used to measure thermal expansion of quartz in the two principal crystallographic axes as a function of pressure to 0.35 GPa, 700oC. Thermal expansion for directions parallel to a(x) and c(z) both increase with increasing temperature, both increase very sharply close to the low-high quartz transition. High quartz shows negative thermal expansion, it decreases with further increase in temperature. Linear compressibility of low quartz is greater for the direction parallel to c(z) than to a(x), at least to 0.35 GPa.
The measured data has been fitted to an Equation Of State (EOS) and can be used to determine the volume and directional length changes of single crystals of quartz in piezothermometric devices, in other industrial applications, as well as in measurement sensors in natural volcanic and hydrothermal systems.
Keywords: quartz, thermal expansion, compresibility, dilatometer, equation of state 1Department of Earth Sciences, ETH-Zentrum, CH-8092 Zürich, SWITZERLAND <[email protected]> , <[email protected]> 2Solexperts AG, Schulstr. 5, CH-8603 Schwerzenbach/ZH, SWITZERLAND <[email protected]> This paper may be retrieved from:
http://e-collection.ethbib.ethz.ch/cgi-bin/show.pl?type=bericht&nr=184
U.RAZ, S. GIRSPERGER AND A.B. THOMPSON EXPANSION AND COMPRESSIBILTY CHANGES OF QUARTZ
2
1. Introduction
For the calculation of phase equilibria involving extrapolation over large ranges in
pressure and temperature relevant to conditions inside the Earth and other planets, thermodynamic data needs to be measured as accurately as possible. Unfortunately their measurement is a tedious and technically demanding task especially at elevated pressures and temperatures. Consequently the data bases for thermal properties of minerals (heat of formation, specific heat, latent heat), as well as thermo elastic properties (density, reactive volume), have grown quite slowly.
In recent years micro-scale specimens in diamond anvils and solid media cells mounted in synchrotron beams for x-ray diffraction work, have been used to determine crystal structures and sometimes volumetric properties of minerals at elevated temperatures and pressure. While techniques for crystal structure determinations have certainly improved in recent years (see D’AMOUR et al., 1979; LEVIEN et al., 1980; GLINNEMAN et al., 1992; ANGEL, et al., 1997; OGATA et al., 1987) pressure and temperature control in such devices is not very precise (see MILETICH, 2000). Furthermore in such microscopic devices, directional thermal expansion and compression data must be obtained from unit cell measurements and only small scale samples (<10µ) can be used. Measurement techniques on meso-scale samples (mm to cm) has advanced very little since the pioneering work of P. W. BRIDGMAN (1948 a,b, 1949). Our study presents a new dilatometer for direct measurement of length change of single crystals at elevated pressure and temperature, with corresponding data for meso-scale crystals of quartz.
While our method imposes limitations in terms of specimen type (need for large and disorder-free single crystals) and P-T-range (correspondingly spacious experimental chamber required), our type of experiment may be run with straightforward basic hydrothermal pressure-temperature equipment (cold seal rod bomb). In addition it provides superior accuracy and resolution for volumetric measurements, because it permits direct determination of directional length change (α − directional expansion, β − directional compressibility) as a function of simultaneous changes in pressure and temperature on crystals of industrial size.
2. Previous volumetric data for quartz as functions of pressure and temperature
The structure of low quartz can be viewed as a distortion of that of high quartz
(HEANEY et al., 1994, p.6). The low-quartz structure (with a space group of P3121 for left-handed and P3221 for right-handed twins) consists of two sets of chains of SiO4 tetrahedra forming spirals parallel to the c-axis (HEANEY et al., 1994, p.9; HEMLEY et al., 1994, p.43).
U.RAZ, S. GIRSPERGER AND A.B. THOMPSON EXPANSION AND COMPRESSIBILTY CHANGES OF QUARTZ
3
A recent comparison of the P-V equations of state for various silica polymorphs at room temperature (near 300 K, see HEMLEY et al., 1994, p.49, Fig.4) summarises for low-quartz the measured continuous decrease in molar volume with increasing pressure1. The thermal expansion (α) for most silica polymorphs has only been measured at ambient pressure (1 bar).
Three simultaneous mechanisms permit the quartz structure to decrease in volume with increasing pressure, (1) distortion of tetrahedra in response to changes in bond angle, (2) decrease in bond length, but mainly (3) rotation of linked tetrahedra (JORGENSEN, 1978). Changes in the Si-O-Si angle and the tetrahedral tilt angle control the thermal expansion, whereas smaller changes in the Si-O-Si angle and the tetrahedral distortion control isothermal compression (D'AMOUR et al., 1979; LEVIEN et al., 1980).
2.1 Volumetric data measured in situ at P & T
Traditionally hydrothermal experimentation techniques rely on quenching before samples can be examined. In quenching methods, starting materials (solids & liquids) are hermetically enclosed in a chemically inert container and taken to pressure P and temperature T. The selected P-T-conditions are maintained for a duration deemed long enough for the expected reaction to fully take place, typically hours to months. Subsequently the sample is returned to ambient conditions as rapidly as possible in order to 'freeze' the phases that were stable at P & T, thus allowing the experimenter to remove and examine the products of the reaction. Obviously this procedure is unsuitable for the measurement of thermodynamic data at P and T. The properties in question are not quenchable and must be studied in situ at P and T. We therefore needed to develop procedures to perform relative and absolute metric measurements inside an experimental chamber at P and T.
Apparatus constraints, such as diminishing material strength at increasing temperatures, finite overall hardness and tensile strength, limit our type of measurement to a maximum of about 15 kbar (1.5 GPa) and 1000°C in internally heated pressure vessels. Higher gas pressures are extremely difficult to seal routinely and gas is required as the pressurizing medium to ensure isostatic shear-free conditions. Externally heated vessels (cold seal rod-bombs) as used in this study are limited to about 7 kbar and 900°C. However, in the cold seal type apparatus the metal rapidly loses strength with rising temperatures. It is thus unsuitable to follow normal geothermal gradients where temperature and pressure increase simultaneously (tensile strength of alloys used for cold seal bombs drops off sharply at approx. 500°C).
1 because the symbol α is often used to denote the thermal expansion coefficient, as well as the low temperature form of quartz (α –quartz) we generally refer to this form as low-quartz here.
U.RAZ, S. GIRSPERGER AND A.B. THOMPSON EXPANSION AND COMPRESSIBILTY CHANGES OF QUARTZ
4
Our apparatus allows both, pressure and temperature scans; i.e. compressibility with increasing temperature and thermal expansion with increasing pressure may be measured directly. In terms of pressure and temperature the scan range and direction (up or down P and T) be may be chosen without restrictions. This feature proved to be extremely helpful for the volumetric and kinetic study of phase transitions (experiments of this type will be discussed in another paper).
In comparison, micro volume diamond anvil cells do offer a vast pressure range up to 300 GPa, but usually at room temperature. Thus such experimentation still lacks a reliable and accurate pressure scale covering this P-T range, especially when the diamond cells are laser-heated to attain elevated temperatures. Data obtained by anvil cells still need to be considered to have limited metric accuracy and resolution, especially when extended to higher temperatures either by internal or external heating.
3. Design of apparatus and control of temperature and pressure
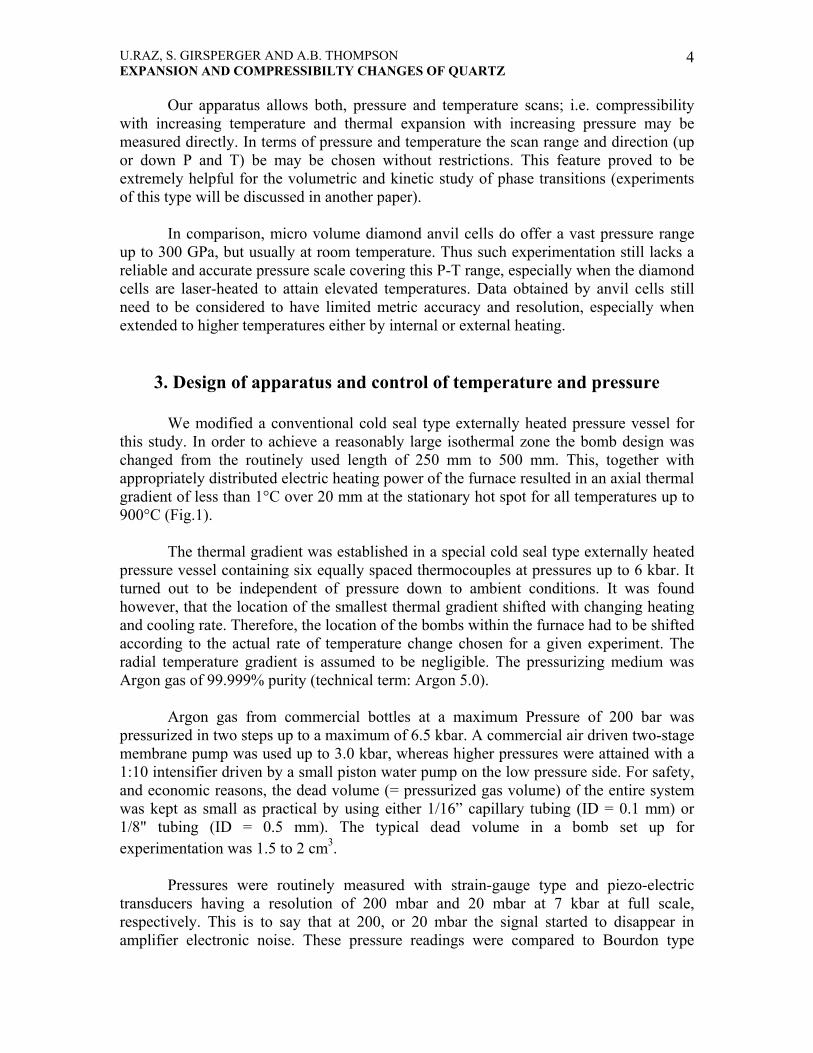
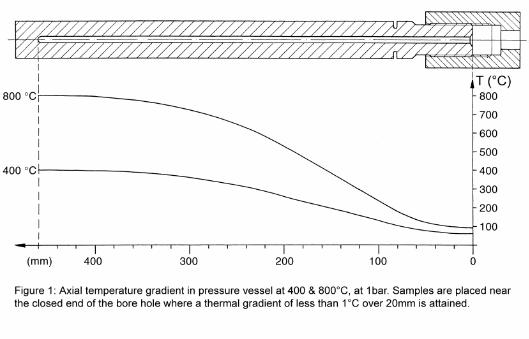
We modified a conventional cold seal type externally heated pressure vessel for this study. In order to achieve a reasonably large isothermal zone the bomb design was changed from the routinely used length of 250 mm to 500 mm. This, together with appropriately distributed electric heating power of the furnace resulted in an axial thermal gradient of less than 1°C over 20 mm at the stationary hot spot for all temperatures up to 900°C (Fig.1).
The thermal gradient was established in a special cold seal type externally heated pressure vessel containing six equally spaced thermocouples at pressures up to 6 kbar. It turned out to be independent of pressure down to ambient conditions. It was found however, that the location of the smallest thermal gradient shifted with changing heating and cooling rate. Therefore, the location of the bombs within the furnace had to be shifted according to the actual rate of temperature change chosen for a given experiment. The radial temperature gradient is assumed to be negligible. The pressurizing medium was Argon gas of 99.999% purity (technical term: Argon 5.0).
Argon gas from commercial bottles at a maximum Pressure of 200 bar was pressurized in two steps up to a maximum of 6.5 kbar. A commercial air driven two-stage membrane pump was used up to 3.0 kbar, whereas higher pressures were attained with a 1:10 intensifier driven by a small piston water pump on the low pressure side. For safety, and economic reasons, the dead volume (= pressurized gas volume) of the entire system was kept as small as practical by using either 1/16” capillary tubing (ID = 0.1 mm) or 1/8" tubing (ID = 0.5 mm). The typical dead volume in a bomb set up for experimentation was 1.5 to 2 cm3.
Pressures were routinely measured with strain-gauge type and piezo-electric transducers having a resolution of 200 mbar and 20 mbar at 7 kbar at full scale, respectively. This is to say that at 200, or 20 mbar the signal started to disappear in amplifier electronic noise. These pressure readings were compared to Bourdon type
U.RAZ, S. GIRSPERGER AND A.B. THOMPSON EXPANSION AND COMPRESSIBILTY CHANGES OF QUARTZ
5
gauges (manufactured by Heise) with a resolution of 5 bar (= 1 division on the dial). Hysteresis of the beryllium alloy Bourdon tubes was remarkably low (5 to 10 bars maximum even after long duration, days to weeks, near full-scale excursions above 6 kbar). The gauges were calibrated against secondary standards (I-II phase transition of ammonium fluoride, low-high quartz transition); a primary dead weight tester calibration was not available. Scale linearity between the calibration points is assumed.
Temperatures were measured with type-K Inconel sheathed thermocouples inside the bomb by means of brazed pressure feed-throughs. Hot junctions were kept fully isolated from the ground to avoid inductive noise stemming mainly from the 50 Hz AC power line feeding the heating coils. A conventional water-ice bath in a Dewar flask served as the cold junction. Thermocouples were calibrated against a type-S Pt-Rh laboratory standard which itself was verified at the Swiss Federal Institute of Standards in Bern. Comparison of the working type-K thermocouples with the standard type-S thermocouple was performed in a special calibration furnace under computer control. Temperatures are considered accurate to +/-2°C.
Furnace temperatures were kept to the set value by means of PID (Proportional Integral Differential) controllers driving two AC-line half-wave thyristors. This technique was preferred to phase-angle control in order to prevent injection of spurious noise into the AC line, which interferes unfavorably with the measuring computers. Set values were changed under computer control by adding a time dependent offset voltage to the controller's sensing thermocouple (also called generation of temperature 'ramps').
Pressures were set by manually-operated shut-off valves. Thermally induced pressure changes followed the coefficient (δp/δT)V for Argon (isochoric temperature induced pressure change). In a later addition to the apparatus a computer controlled bleed valve allowed us to decrease pressure in steps of approx. 2 to 5 bar starting at 6.5 kbar.
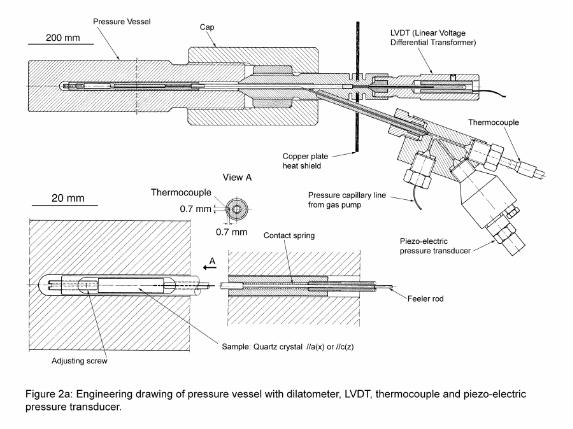
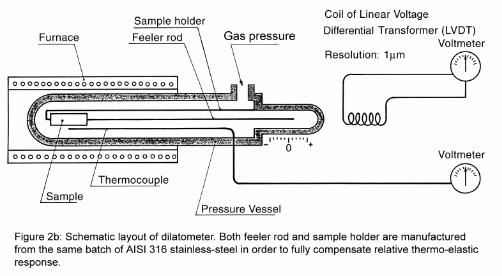
The dilatometer option (Fig.2) in the pressure vessels was made up in a conventional way by a sample holder and a spring loaded feeler-rod, both manufactured from the same material (AISI 316 stainless-steel) in order to cancel out their relative thermo-elastic response.
4. Measurement procedures
Movement of the feeler rod was sensed electromagnetically through the walls of a piece of pressure tubing located inside the coil of a conventional LVDT (Linear Voltage Differential Transformer). Stainless steel tubing of AISI 304 or 316 grades turned out to dampen the LVTD signal the least. With this arrangement, resolution was below 1µ and limited only by electronic amplifier noise. The LVDT's amplified signal was calibrated with a micrometer allowing readings down to 1µ. This technique of taking metric length measurements inside a pressurized container without the need for electrical or mechanical feed-throughs turned out to be a key factor for the overall success of this study.
U.RAZ, S. GIRSPERGER AND A.B. THOMPSON EXPANSION AND COMPRESSIBILTY CHANGES OF QUARTZ
6
Control of the experiments (temperature ramps and cycles, stepwise pressure bleed off) and all data acquisition was accomplished with DEC PDP-11 computers running the RT-11 operating system (Foreground-Background monitor). Voltages from thermocouples, LVDT amplifiers and pressure transducers were scanned with a low thermal-offset reed-relay scanner (HP 3495A) and routed to a digital voltmeter (HP 3456A). For instrument control, the HP-IB / IEEE-488 bus was used. Bias voltages driving temperature ramps were generated by a programmable digital to analog power supply (HP 59501A) and suitably arranged voltage-dividing resistors.
5. Results of PVT measurements
Three samples of quartz were used for the investigation of its volumetric properties and the low/high transition at pressures up to 3.5 kbar: (1) clear, colorless vein quartz (used for the development of the method) (2) synthetic quartz cut parallel to the c(z)-axis (3) smoky vein quartz cut parallel to the a(x)-axis
The samples were cut into cylindrical pieces of about 25 mm length and 5 mm OD, resulting in an overall weight of 1.5 – 2 g. A 0.8 mm hole was drilled half way along the cylinder axis to accommodate a 0.5 mm OD sheathed thermocouple. In accordance with earlier studies the phase boundary between low and high quartz proved to follow a straight line up to 3.5 kbar (Figs.3, 4, 5 and Tabs.1, 2, 3).
6. Equations of State and fitting of PVT data
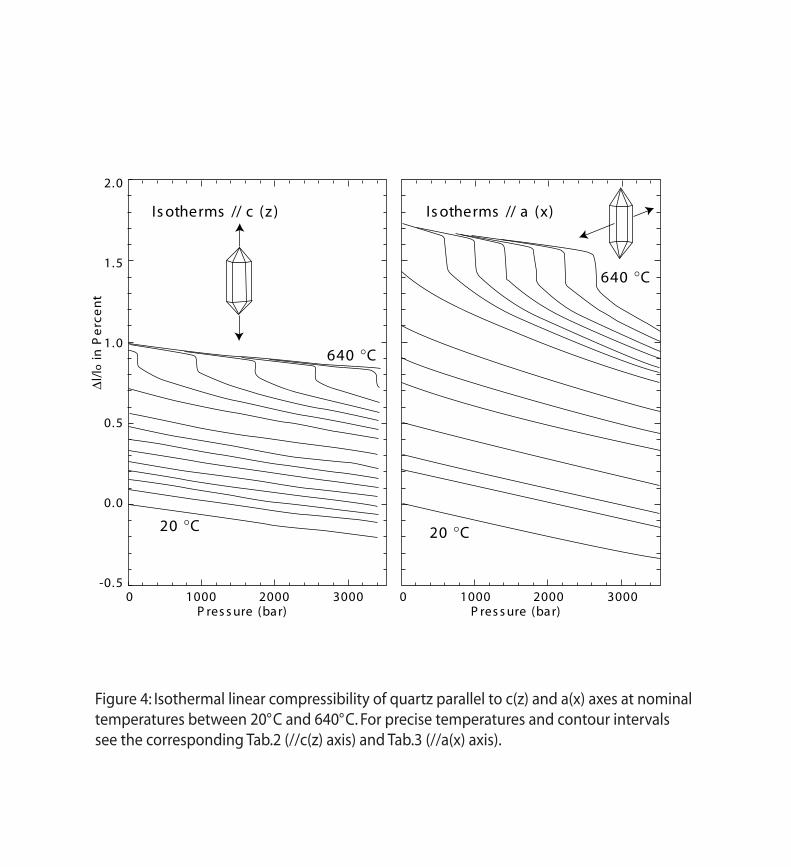
The α-quartz structure (with a space group of P3121) consists of two sets of chains of SiO4 tetrahedra forming spirals parallel to the c(z)-axis (HEMLEY et al., 1994, p.43). The deformation of these tetrahedral chains is reflected by the dilatometric measurements. The linear thermal expansion and compressibility of quartz parallel to the crystallographic a(x)- and c(z)-axis were measured in the range up to 3.5 kbar and to 640°C. Thermal expansion agrees well with the data of SKINNER (1966), JAY (1933) and MAYER (1960) in showing also negative thermal expansion for high quartz. Compressibility measurements at room temperature are consistent with the results of BRIDGMAN (1948 a, b; 1949) but show increased compressibility parallel to c(z) above about 2 kbar and for parallel to a(x) above about 3 kbar. Relative changes in length as a function of pressure and temperature are shown in Fig.4. These data were used to calculate an interpolated set of volumetric properties (Tab.3) for agiven P and T.
U.RAZ, S. GIRSPERGER AND A.B. THOMPSON EXPANSION AND COMPRESSIBILTY CHANGES OF QUARTZ
7
6.1 Equations of state for low (α-) quartz
Most Equations of State (EOS) for volumetric changes as functions of P and T are modified from the van der Waals modification of the ideal gas law
(P + a/V2)(V-b) = RT (1), for example to a virial equation of the form
V = Vo + a/P + b/P2 + c/P3 (2). In the present case, isothermal changes of pressure with volume were formulated as
V = Vo + AP + BP2 (3), and isobaric changes with temperature as
V = Vo + AT + BT2 (4). The best type of fitting for low quartz data was obtained with
V(P,T) = A/(P + B) + CP2 + DP + E (5) with A = a1T + a2
B = a3T2 + a4T + a5
C = a6
D = a7T2 + a8T + a9
E = a10T2 + a11T + a12.
The molar volume of 22.688 cm3 at 1 bar and 298.15 K was taken from ROBIE et
al. (1979). The molar volume data at T and P were fit to a function V=V(P,T) for low and high quartz separately, the type and degree being the same for both (the number of adjustable parameters was minimized).
280 data points in the range from 1 to 3 kbar and 300 K up to Tc were taken as input for regression analysis. 3 additional points were calculated outside this limit by linear extrapolation to 200 K to improve the derivatives (dV/dT)P at the low temperature limit. The best fit constants (simplest equation with the lowest residuals) for low (α) quartz are:
a1= 0.225007E+01 a5= -0.208346E+04 a9= -0.860444E-04 a2= -0.997038E+03 a6= 0.139958E-08 a10= 0.631069E-06 a3= -0.438645E-01 a7= -0.792110E-10 a11= 0.192899E-03 a4= 0.430831E+02 a8= 0.794849E-07 a12= 0.226296E+02
with a sum of squares of 99.98107 and a standard deviation of 0.004 cm3, where the maiximum deviation is 0.015 cm3.
6.2 Crystallographic EOS for low (α) quartz
The EOS presented here is purely empirical, based on isobaric and isothermal, as well as polythermobaric, analysis of the experimental data. The mathematical relations
U.RAZ, S. GIRSPERGER AND A.B. THOMPSON EXPANSION AND COMPRESSIBILTY CHANGES OF QUARTZ
8
were chosen in a purely pragmatic manner. The aim was to keep the fit function as simple as possible and represent the measured data with acceptable precision. Low and high quartz were fitted independently to the same equation. Consequently it is not recommended that our function be extrapolated to obtain PVT values far outside the P-T-area covered by our experiments.
Recent developments of Equations of State for volumetric changes as functions of P and T are to be found in the fitting of high pressure lattice parameter data (e.g., ANGEL, 2000). These equations developed for solids have followed the Birch-Murgnaghan equations in terms of expressing volume changes as functions of pressure and bulk moduli (reciprocal compressibility). We have used the data fitting program of ANGEL (website: http://www.crystal.vt.edu/crystal/rja/) to fit our data in Tab.3 to obtain a series of isothermal Birch-Murgnaghan equations. The raw data may thus be used by any reader to obtain their own preferred fit equations. The Birch-Murnaghan equation
P=3K0fE(1+2fE)5/2{1+3/2(K’-4)fE+3/2[K0K”+(K’-4)(K’-3)+35/9]fE2}
with fE=[(V0/V)2/3-1)]/2
was used to it’s second order truncation (K’=4). Initial values for V0=22.6929cm3 and K0=45GPa were chosen. The resulting fitted values for V0, K0 and K” are listed in Tab.4 (note: K’ is fixed to 4). The quality of the isothermal fit decreases rapidly with increasing temperature and thus reflects the softening of low quartz approaching the α−β phase transition.
6.3 Equations of state for high (β) quartz
For high (β) quartz the same function (equation 5) was used for fitting and the following constants were obtained:
b1= -0.440968E+00 b5= -0.319299E+00 b9= -0.247462E-02 b2= 0.195727E+00 b6= -0.383799E-09 b10= -0.400260E-05 b3= 0.678930E-01 b7= -0.271121E-08 b11= 0.742196E-02 b4= 0.171344E+00 b8= 0.513888E-05 b12= 0.202996E+02
with a sum of squares of 97.38915 and a standard deviation of 0.005 cm3, where the maximum deviation is 0.024 cm3.
6.4 Negative thermal expansion of high (β) quartz
Our thermal expansion data show that high quartz exhibits negative thermal expansion (i.e. high (β)-quartz shrinks when it is heated, see the recent discussion by WELCHE et al., 1998) . Also our data show that the axial ratio c/a decreases from about
U.RAZ, S. GIRSPERGER AND A.B. THOMPSON EXPANSION AND COMPRESSIBILTY CHANGES OF QUARTZ
9
1.1001 at room temperature to a nearly constant value of about 1.092 above the transition temperature (RAZ, 1983, Fig. 46 p. 73). Similar observations were implied in earlier high temperature x-ray studies (ACKERMANN and SORRELL, 1974; JAY, 1933; BERGER et al., 1966) but are not visible in all fits of volumetric data (e.g., DOROGOKUPETS, 1995, Fig. 8, p.8496). TUCKER et al., 2000) have recently noted that the volume of high quartz is lower than would be calculated from the actual Si-O bond lengths. This and other examples of lattice shrinking are interpreted by DOVE et al. (2000, p. 26) in terms of Rigid Unit Modes of linked polyhedra in framework structures.
More recent data, reviewed by CARPENTER (2000, p. 46, Fig. 8), indicate that it is the c(z)-direction which shows the principal negative thermal expansion, whereas the a(x)- direction shows little change or is slightly positive from their data. Our data show that the a(x)- direction shows also weak negative thermal expansion.
6.5 Relative merits of the dilatometer vs diamond anvil cells
In comparison to x-ray diamond anvil cell (DAC) studies our dilatometric approach to PVT measurement suffers from a number of limitations but also offers features not known with DAC’s. The major drawback certainly lies in the technical upper pressure limit of approx. 15kbars to our technique. Proceeding beyond crustal conditions remains therefore outside the realm of cold-seal bomb and internally heated pressure vessel dilatometry. On the other hand, resolution and accuracy of the dilatometry method are better. Thanks to the commercially available piezo-electric transducers, and charge amplifiers, pressures in experimental apparatus may be resolved close to 1ppm. The dilatometric technique fitted together with piezo-pressure sensors provides an extremely powerful method for the detailed study of phase transitions and their kinetics. A new future application, proposed here, will permit combination of our PVT data to DAC’s driven by piezo-electric force actuators rather than by fine pitched mechanical screws.
7. Other physical properties reflecting these volumetric changes
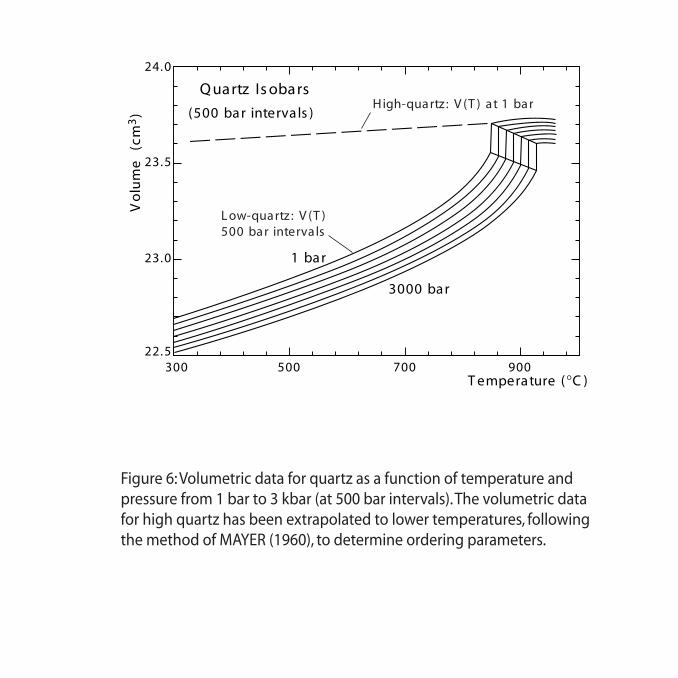
MAYER (1960) measured the isobaric thermal expansion of quartz in both a(x) and c(z) directions at room pressure. He defined a parameter, like the ordering parameter in Landau theory, based upon the difference between the actual low quartz volume at temperature and the down temperature extrapolated high quartz volume, which has zero value above the transition temperature and tends towards infinity towards low temperature (RAZ, 1983, Fig.45 p.72). We have incorporated this method into the construction of Fig.6. These data are consistent with results from Raman spectroscopic data of soft modes (HOECHLI and SCOTT, 1971; BACHHEIMER and DOLINO,1977; BARRON et al., 1982) and from elastic constant measurements for compliance C14 (HOECHLI, 1970; AXE and SHIRANE, 1970 and the recent summaries in the volume edited by REDFERN and CARPENTER, 2000).
U.RAZ, S. GIRSPERGER AND A.B. THOMPSON EXPANSION AND COMPRESSIBILTY CHANGES OF QUARTZ
10
8. Open Questions about Equations of State
The ease of fitting a mathematical function to a given data set depends upon the
extent of its change. In our case this is reflected by the values of the partial first and higher derivatives (divergences in Fig. 3) of the volume function (compressibility (δV/δP)T and thermal expansion (δV/δT)P). Various requirements may be of importance when choosing a mathematical relation to represent this function:
(a) best possible approximation to the measured data set, (b) reflectance of a known or assumed physical relation among the variables, (c) and/or as a consequence of (b) the possibility of sound extrapolation beyond the measurement range of the data set.
Our polynomial functions where selected principally with requirement (a) in
mind. We found that the fit parameters to a series of isothermal Birch-Murgnaghan equations (Tab.4) were quite imprecise, even though they relate to requirements (b) and (c). Likewise classical Equations of State are not adequate close to phase transitions (see Dorogokupets, 1995). Within the P-T-range covered by our measurements, noticeable divergence from linearity occurs in the vicinity of the low to high quartz phase transition. This feature anticipates the advent of the phase transition (Fig.6). Unfortunately, a quantitative determination of onset points on the low side of the transition is not feasible with our technique.
While there is an attraction to the elegance of a known or assumed physical relation among the variables (requirement b above) we can rarely fulfill the expected simplicity. Today with the development of computer based mathematical tools we can present measured raw data in tables and interpolate them as needed. This can also be done for simple determination of derivatives and inversion of the function with respect to all variables, etc. Development of Equations of State (EOS) for extrapolation of data beyond the range of measurements will continue as remarked for requirement (c) above. Our PVT data may be used for testing EOS derived from ab initio calculations.
9.Applications & Outlook
The techniques described here can be used to determine the linear and volumetric properties of solids simultaneously as functions of pressure and temperature (to about 0.7 GPa and 900oC), with an accuracy better than that for most crystallographic methods. Such data are important both for interpolation and extrapolation of Equations of State for particular crystal structures, and for evaluating the P-T equilibrium conditions for solid-solid reactions. Reactive volumes determine the slope of univariant curves for solid-solid reactions to a considerable extent, because of the small density differences of the reactants.
U.RAZ, S. GIRSPERGER AND A.B. THOMPSON EXPANSION AND COMPRESSIBILTY CHANGES OF QUARTZ
11
Our data have several applications involving the physical behavior of quartz and other common minerals. Most studies of fluid inclusions in minerals assume rigid cavities which means that the volume and shape of the inclusions should not change during cooling and decompression. This simplification may now be corrected with our data for quartz.
A future application of our data concerns the method for calibrating and measurement in Diamond Anvil Cells. Our PVT data for quartz would permit piezo-electric force actuators to be used rather than the crude method of fine pitched mechanical screws as applied at present.
Present day industrial use of quartz, as pressure and force sensors, as translational and force actuators, and as electronic oscillators for time and frequency standards relies mainly on its piezo effect. Use of low quartz as electronic oscillators has led to its synthesis at 250 to 450 oC under fluid pressures of 3.4 x 10⁷ to 1.4 x 10⁹Pa in a temperature gradient (BEALL, 1994, p. 469-473). Our data will be useful for new piezoelectric applications for plates from single crystal as quartz oscillators in elevated P-T environments in natural hydrothermal systems and for new industrial optical and electronic applications
Acknowledgements
The authors wish to thank Brigitte Bühlmann and Urs Graber for their engineering and technical support. We thank Ross Angel for supply of his EOS program and for dis-cussions about its application. This work was supported by ETH research credits.
L inear compres s ibility at 25 °C
// a (x)
// c (z )
B R IDG MAN (1948)
P res s ure (bar)
(lo
- l
)l
x1
00
0
00
1
2
3
4
1000 2000 3000 4000 5000
(b)
(a ) T hermal expans ion at 1 bar
S K INNE R (1966)MAY E R (1959)J AY (1933)
this s tudy
0 200 400 600 800 10000.0
0.5
1.0
1.5
2.0
T emperature (°C )
Ch
an
ge
of
Le
ng
th (
%)
// a (x)
// c (z )
this s tudy
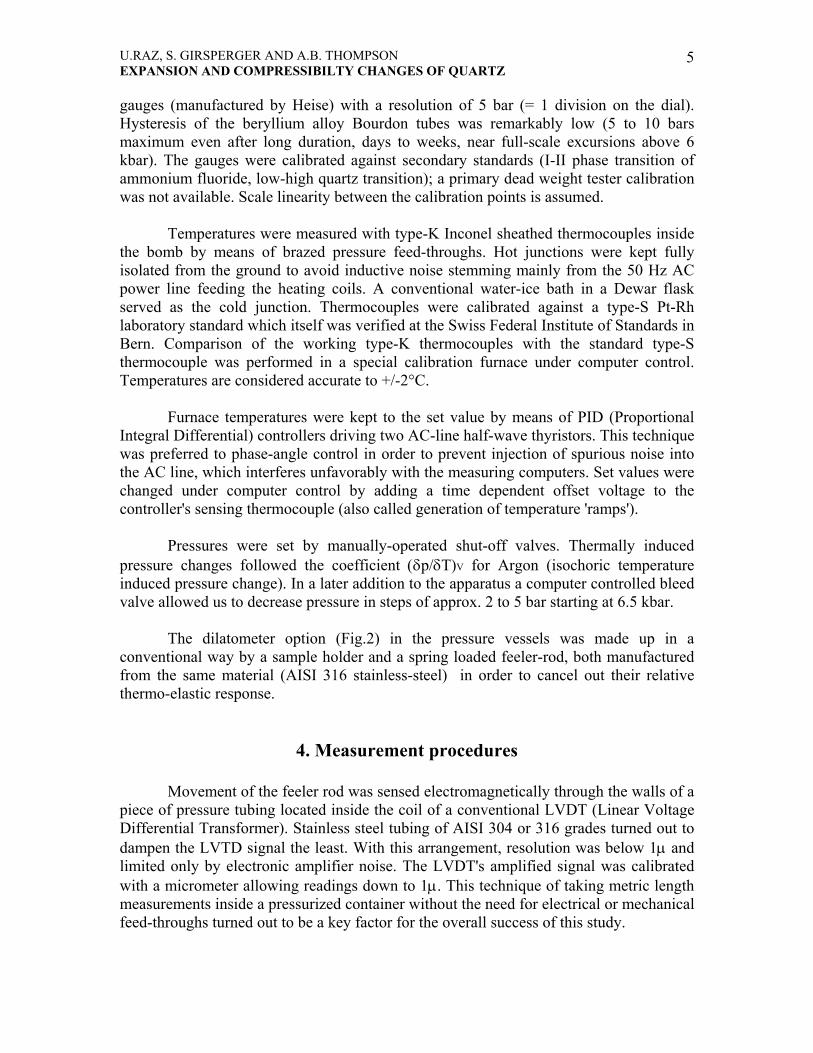
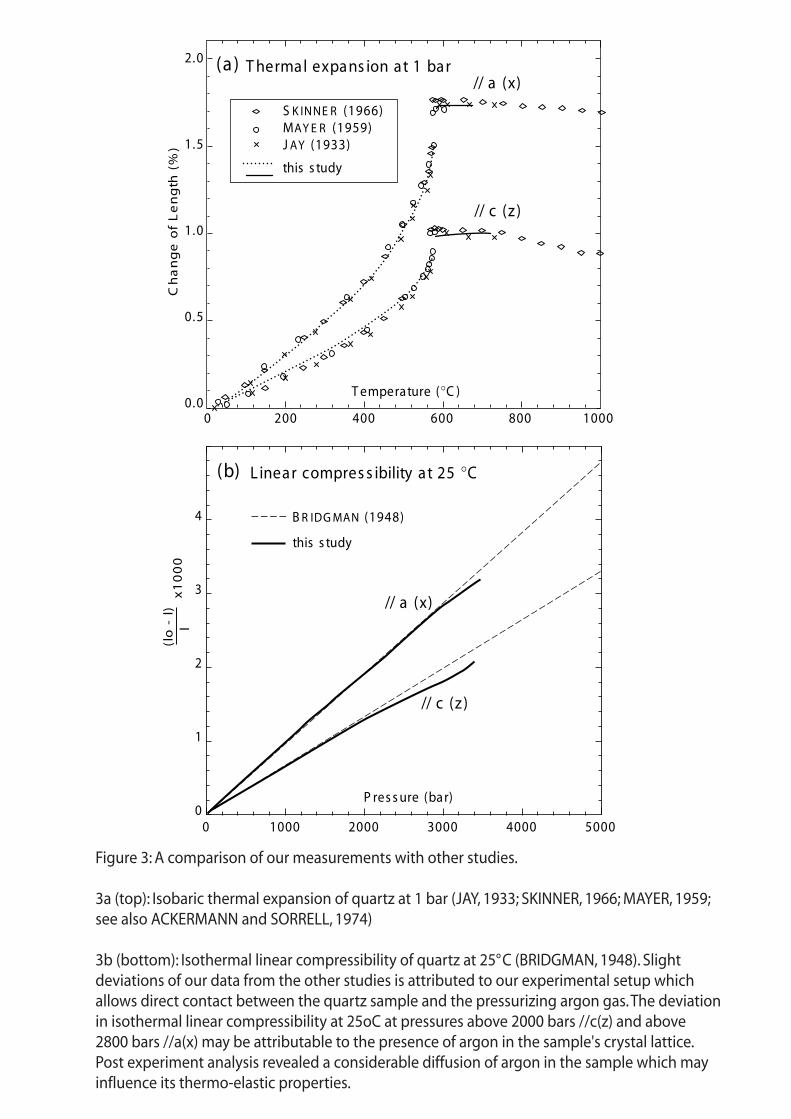
Figure 3: A comparison of our measurements with other studies.
3a (top): Isobaric thermal expansion of quartz at 1 bar (JAY, 1933; SKINNER, 1966; MAYER, 1959;see also ACKERMANN and SORRELL, 1974)
3b (bottom): Isothermal linear compressibility of quartz at 25°C (BRIDGMAN, 1948). Slightdeviations of our data from the other studies is attributed to our experimental setup whichallows direct contact between the quartz sample and the pressurizing argon gas. The deviationin isothermal linear compressibility at 25oC at pressures above 2000 bars //c(z) and above2800 bars //a(x) may be attributable to the presence of argon in the sample's crystal lattice.Post experiment analysis revealed a considerable diffusion of argon in the sample which mayinfluence its thermo-elastic properties.
640 °C
640 °C
Is otherms // a (x)Is otherms // c (z )
20 °C20 °C
P res s ure (bar) P res s ure (bar)
∆l/l
o i
n P
erc
en
t
0 1000 2000 3000 0 1000 2000 3000-0.5
0.0
0.5
1.0
1.5
2.0
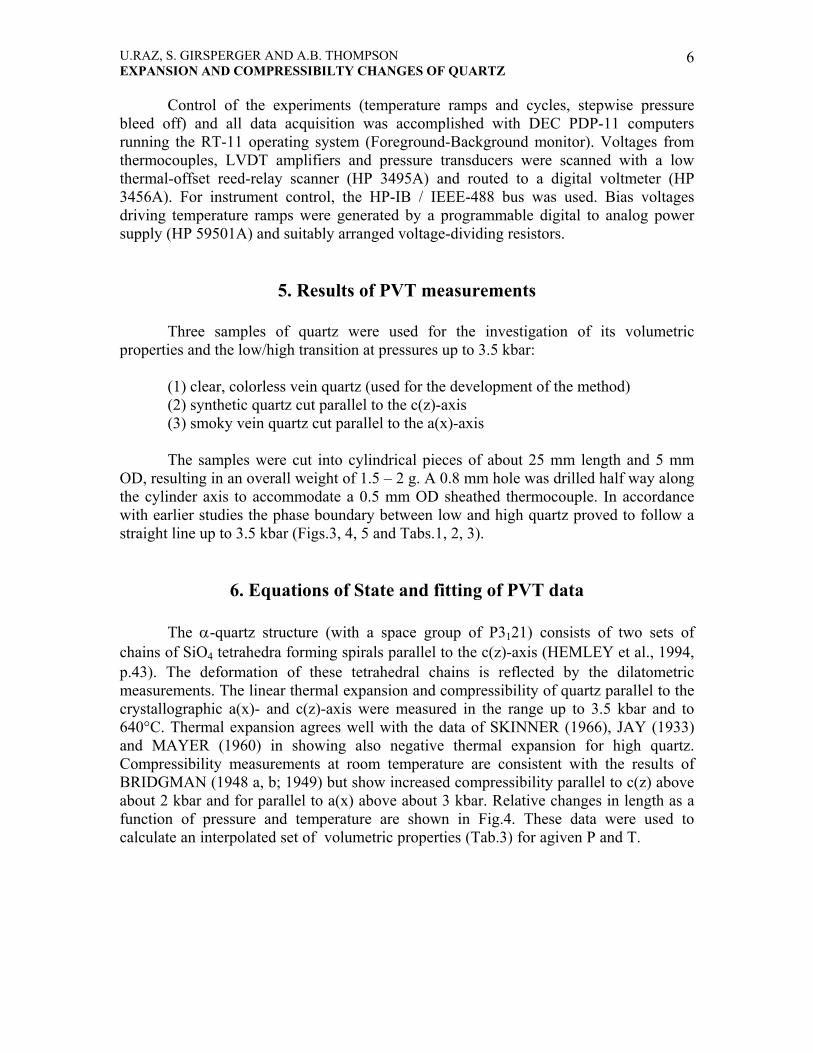
Figure 4: Isothermal linear compressibility of quartz parallel to c(z) and a(x) axes at nominaltemperatures between 20°C and 640°C. For precise temperatures and contour intervalssee the corresponding Tab.2 (//c(z) axis) and Tab.3 (//a(x) axis).
24.0
23.5
23.0
22.5
22.00 500 1000 1500 2000 2500 3000 3500
P res s ure (bar)
Mo
lar
Vo
lum
e (
cm3
)
L ow-quartz
High-quartz
20 °C
640 °C
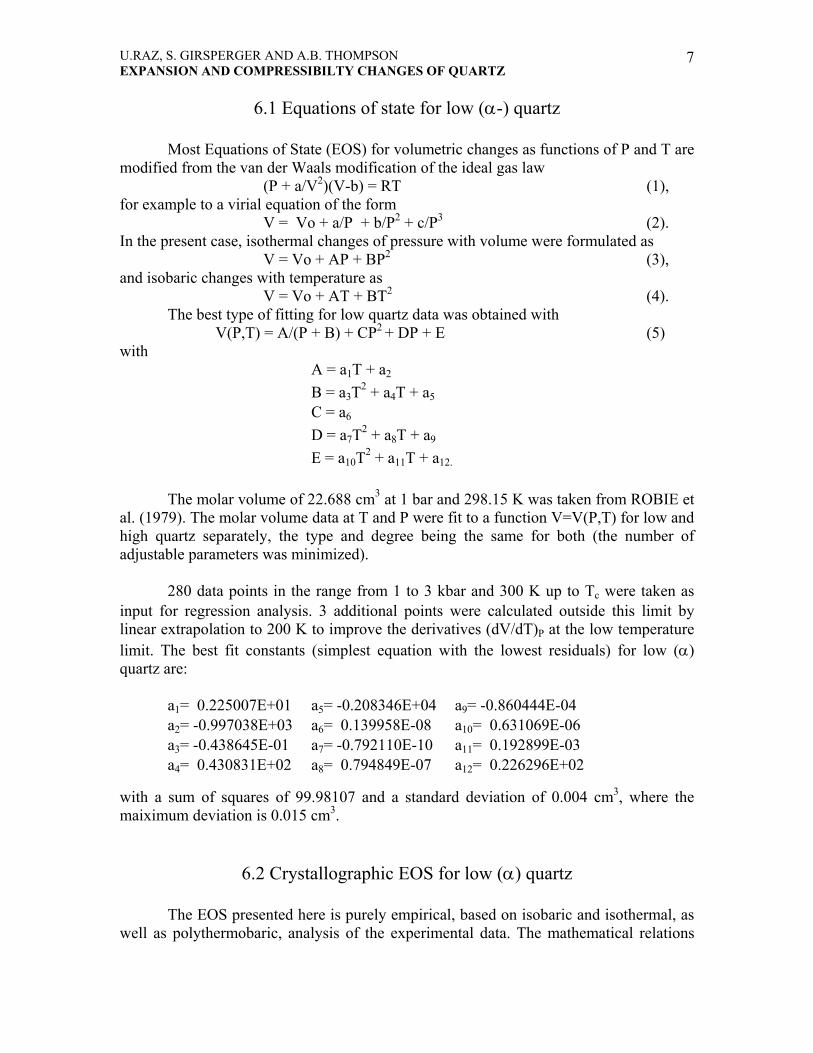
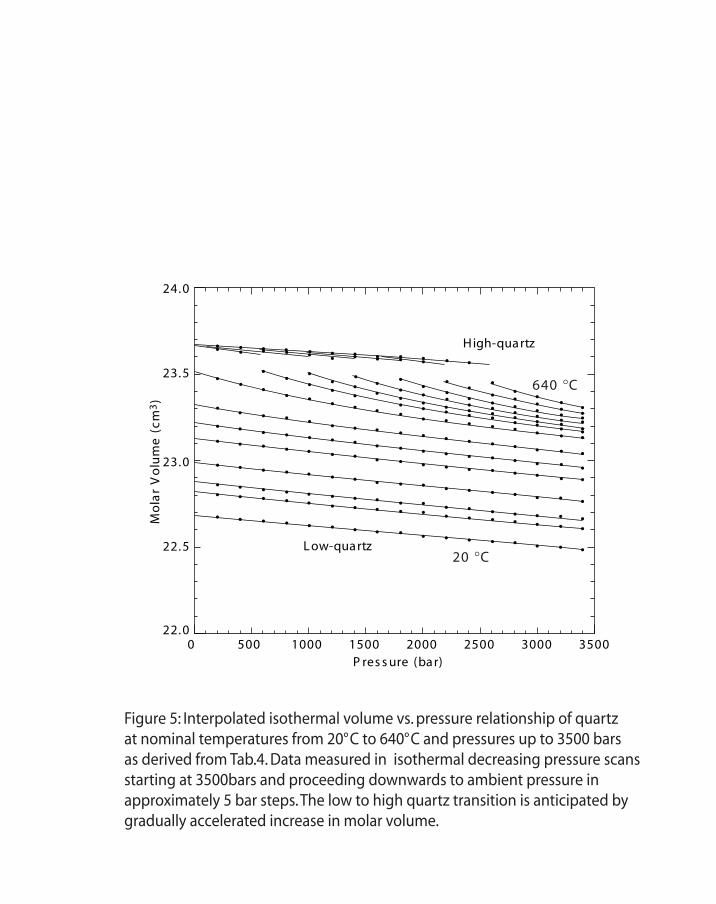
Figure 5: Interpolated isothermal volume vs. pressure relationship of quartzat nominal temperatures from 20°C to 640°C and pressures up to 3500 barsas derived from Tab.4. Data measured in isothermal decreasing pressure scansstarting at 3500bars and proceeding downwards to ambient pressure inapproximately 5 bar steps. The low to high quartz transition is anticipated bygradually accelerated increase in molar volume.
30022.5
23.0
23.5
24.0
500 700 900T emperature (°C )
Vo
lum
e
(cm
3)
Q uartz Is obars
(500 bar interva ls )
1 bar
3000 bar
High-quartz : V (T ) at 1 bar
L ow-quartz : V (T ) 500 bar interva ls
Figure 6: Volumetric data for quartz as a function of temperature andpressure from 1 bar to 3 kbar (at 500 bar intervals). The volumetric datafor high quartz has been extrapolated to lower temperatures, followingthe method of MAYER (1960), to determine ordering parameters.
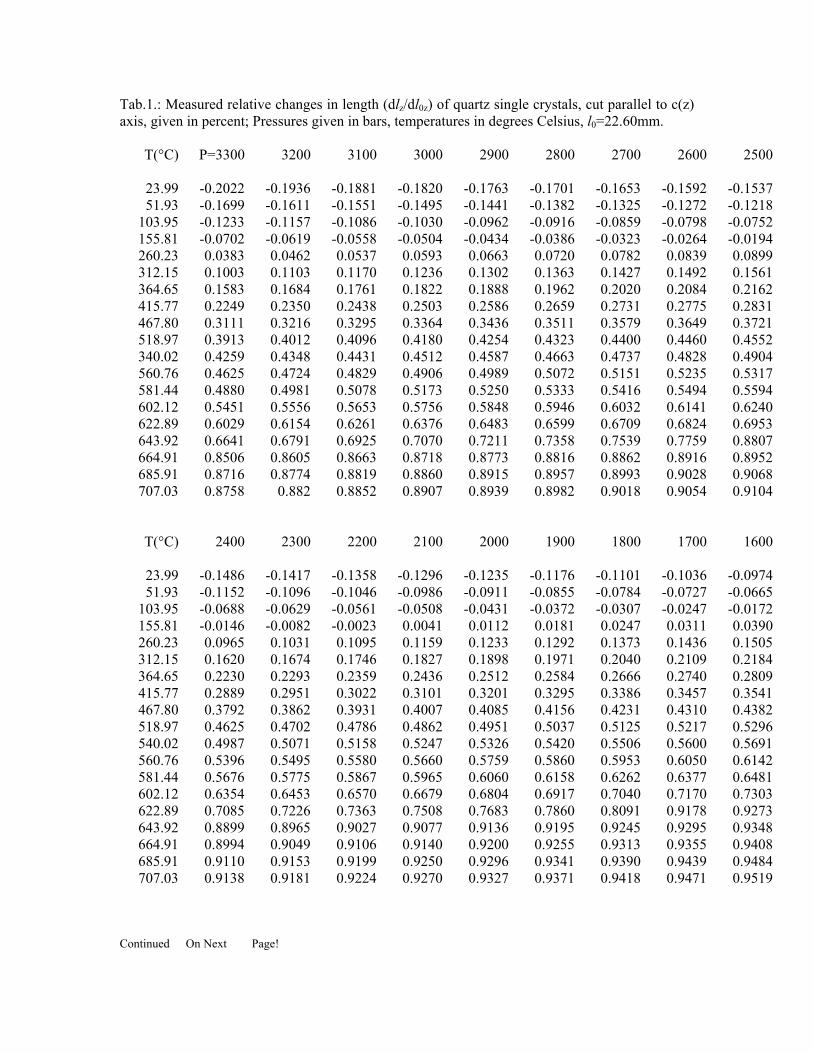
Tab.1.: Measured relative changes in length (dlz/dl0z) of quartz single crystals, cut parallel to c(z) axis, given in percent; Pressures given in bars, temperatures in degrees Celsius, l0=22.60mm.
T(°C) P=3300 3200 3100 3000 2900 2800 2700 2600 2500
23.99 -0.2022 -0.1936 -0.1881 -0.1820 -0.1763 -0.1701 -0.1653 -0.1592 -0.153751.93 -0.1699 -0.1611 -0.1551 -0.1495 -0.1441 -0.1382 -0.1325 -0.1272 -0.1218
103.95 -0.1233 -0.1157 -0.1086 -0.1030 -0.0962 -0.0916 -0.0859 -0.0798 -0.0752155.81 -0.0702 -0.0619 -0.0558 -0.0504 -0.0434 -0.0386 -0.0323 -0.0264 -0.0194260.23 0.0383 0.0462 0.0537 0.0593 0.0663 0.0720 0.0782 0.0839 0.0899312.15 0.1003 0.1103 0.1170 0.1236 0.1302 0.1363 0.1427 0.1492 0.1561364.65 0.1583 0.1684 0.1761 0.1822 0.1888 0.1962 0.2020 0.2084 0.2162415.77 0.2249 0.2350 0.2438 0.2503 0.2586 0.2659 0.2731 0.2775 0.2831467.80 0.3111 0.3216 0.3295 0.3364 0.3436 0.3511 0.3579 0.3649 0.3721518.97 0.3913 0.4012 0.4096 0.4180 0.4254 0.4323 0.4400 0.4460 0.4552340.02 0.4259 0.4348 0.4431 0.4512 0.4587 0.4663 0.4737 0.4828 0.4904560.76 0.4625 0.4724 0.4829 0.4906 0.4989 0.5072 0.5151 0.5235 0.5317581.44 0.4880 0.4981 0.5078 0.5173 0.5250 0.5333 0.5416 0.5494 0.5594602.12 0.5451 0.5556 0.5653 0.5756 0.5848 0.5946 0.6032 0.6141 0.6240622.89 0.6029 0.6154 0.6261 0.6376 0.6483 0.6599 0.6709 0.6824 0.6953643.92 0.6641 0.6791 0.6925 0.7070 0.7211 0.7358 0.7539 0.7759 0.8807664.91 0.8506 0.8605 0.8663 0.8718 0.8773 0.8816 0.8862 0.8916 0.8952685.91 0.8716 0.8774 0.8819 0.8860 0.8915 0.8957 0.8993 0.9028 0.9068707.03 0.8758 0.882 0.8852 0.8907 0.8939 0.8982 0.9018 0.9054 0.9104
T(°C) 2400 2300 2200 2100 2000 1900 1800 1700 1600
23.99 -0.1486 -0.1417 -0.1358 -0.1296 -0.1235 -0.1176 -0.1101 -0.1036 -0.097451.93 -0.1152 -0.1096 -0.1046 -0.0986 -0.0911 -0.0855 -0.0784 -0.0727 -0.0665
103.95 -0.0688 -0.0629 -0.0561 -0.0508 -0.0431 -0.0372 -0.0307 -0.0247 -0.0172155.81 -0.0146 -0.0082 -0.0023 0.0041 0.0112 0.0181 0.0247 0.0311 0.0390260.23 0.0965 0.1031 0.1095 0.1159 0.1233 0.1292 0.1373 0.1436 0.1505312.15 0.1620 0.1674 0.1746 0.1827 0.1898 0.1971 0.2040 0.2109 0.2184364.65 0.2230 0.2293 0.2359 0.2436 0.2512 0.2584 0.2666 0.2740 0.2809415.77 0.2889 0.2951 0.3022 0.3101 0.3201 0.3295 0.3386 0.3457 0.3541467.80 0.3792 0.3862 0.3931 0.4007 0.4085 0.4156 0.4231 0.4310 0.4382518.97 0.4625 0.4702 0.4786 0.4862 0.4951 0.5037 0.5125 0.5217 0.5296540.02 0.4987 0.5071 0.5158 0.5247 0.5326 0.5420 0.5506 0.5600 0.5691560.76 0.5396 0.5495 0.5580 0.5660 0.5759 0.5860 0.5953 0.6050 0.6142581.44 0.5676 0.5775 0.5867 0.5965 0.6060 0.6158 0.6262 0.6377 0.6481602.12 0.6354 0.6453 0.6570 0.6679 0.6804 0.6917 0.7040 0.7170 0.7303622.89 0.7085 0.7226 0.7363 0.7508 0.7683 0.7860 0.8091 0.9178 0.9273643.92 0.8899 0.8965 0.9027 0.9077 0.9136 0.9195 0.9245 0.9295 0.9348664.91 0.8994 0.9049 0.9106 0.9140 0.9200 0.9255 0.9313 0.9355 0.9408685.91 0.9110 0.9153 0.9199 0.9250 0.9296 0.9341 0.9390 0.9439 0.9484707.03 0.9138 0.9181 0.9224 0.9270 0.9327 0.9371 0.9418 0.9471 0.9519
Continued On Next Page!
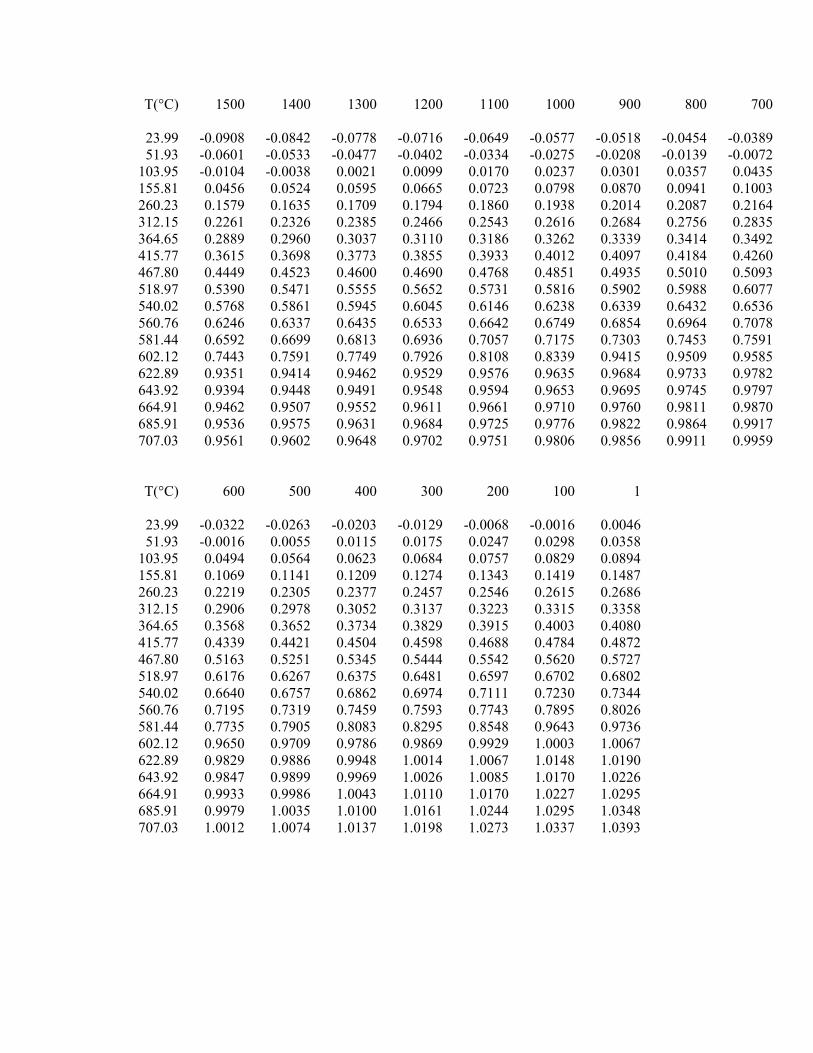
T(°C) 1500 1400 1300 1200 1100 1000 900 800 700
23.99 -0.0908 -0.0842 -0.0778 -0.0716 -0.0649 -0.0577 -0.0518 -0.0454 -0.038951.93 -0.0601 -0.0533 -0.0477 -0.0402 -0.0334 -0.0275 -0.0208 -0.0139 -0.0072
103.95 -0.0104 -0.0038 0.0021 0.0099 0.0170 0.0237 0.0301 0.0357 0.0435155.81 0.0456 0.0524 0.0595 0.0665 0.0723 0.0798 0.0870 0.0941 0.1003260.23 0.1579 0.1635 0.1709 0.1794 0.1860 0.1938 0.2014 0.2087 0.2164312.15 0.2261 0.2326 0.2385 0.2466 0.2543 0.2616 0.2684 0.2756 0.2835364.65 0.2889 0.2960 0.3037 0.3110 0.3186 0.3262 0.3339 0.3414 0.3492415.77 0.3615 0.3698 0.3773 0.3855 0.3933 0.4012 0.4097 0.4184 0.4260467.80 0.4449 0.4523 0.4600 0.4690 0.4768 0.4851 0.4935 0.5010 0.5093518.97 0.5390 0.5471 0.5555 0.5652 0.5731 0.5816 0.5902 0.5988 0.6077540.02 0.5768 0.5861 0.5945 0.6045 0.6146 0.6238 0.6339 0.6432 0.6536560.76 0.6246 0.6337 0.6435 0.6533 0.6642 0.6749 0.6854 0.6964 0.7078581.44 0.6592 0.6699 0.6813 0.6936 0.7057 0.7175 0.7303 0.7453 0.7591602.12 0.7443 0.7591 0.7749 0.7926 0.8108 0.8339 0.9415 0.9509 0.9585622.89 0.9351 0.9414 0.9462 0.9529 0.9576 0.9635 0.9684 0.9733 0.9782643.92 0.9394 0.9448 0.9491 0.9548 0.9594 0.9653 0.9695 0.9745 0.9797664.91 0.9462 0.9507 0.9552 0.9611 0.9661 0.9710 0.9760 0.9811 0.9870685.91 0.9536 0.9575 0.9631 0.9684 0.9725 0.9776 0.9822 0.9864 0.9917707.03 0.9561 0.9602 0.9648 0.9702 0.9751 0.9806 0.9856 0.9911 0.9959
T(°C) 600 500 400 300 200 100 1
23.99 -0.0322 -0.0263 -0.0203 -0.0129 -0.0068 -0.0016 0.0046 51.93 -0.0016 0.0055 0.0115 0.0175 0.0247 0.0298 0.0358
103.95 0.0494 0.0564 0.0623 0.0684 0.0757 0.0829 0.0894 155.81 0.1069 0.1141 0.1209 0.1274 0.1343 0.1419 0.1487 260.23 0.2219 0.2305 0.2377 0.2457 0.2546 0.2615 0.2686 312.15 0.2906 0.2978 0.3052 0.3137 0.3223 0.3315 0.3358 364.65 0.3568 0.3652 0.3734 0.3829 0.3915 0.4003 0.4080 415.77 0.4339 0.4421 0.4504 0.4598 0.4688 0.4784 0.4872 467.80 0.5163 0.5251 0.5345 0.5444 0.5542 0.5620 0.5727 518.97 0.6176 0.6267 0.6375 0.6481 0.6597 0.6702 0.6802 540.02 0.6640 0.6757 0.6862 0.6974 0.7111 0.7230 0.7344 560.76 0.7195 0.7319 0.7459 0.7593 0.7743 0.7895 0.8026 581.44 0.7735 0.7905 0.8083 0.8295 0.8548 0.9643 0.9736 602.12 0.9650 0.9709 0.9786 0.9869 0.9929 1.0003 1.0067 622.89 0.9829 0.9886 0.9948 1.0014 1.0067 1.0148 1.0190 643.92 0.9847 0.9899 0.9969 1.0026 1.0085 1.0170 1.0226 664.91 0.9933 0.9986 1.0043 1.0110 1.0170 1.0227 1.0295 685.91 0.9979 1.0035 1.0100 1.0161 1.0244 1.0295 1.0348 707.03 1.0012 1.0074 1.0137 1.0198 1.0273 1.0337 1.0393
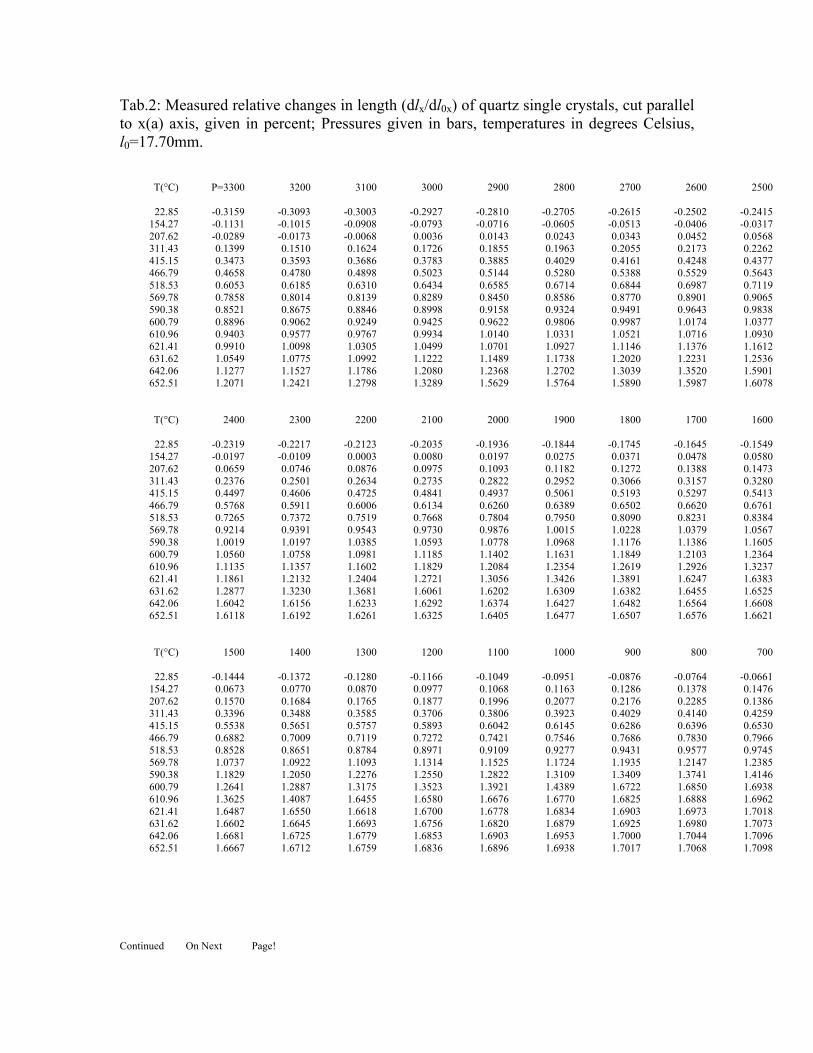
Tab.2: Measured relative changes in length (dlx/dl0x) of quartz single crystals, cut parallel to x(a) axis, given in percent; Pressures given in bars, temperatures in degrees Celsius, l0=17.70mm.
T(°C) P=3300 3200 3100 3000 2900 2800 2700 2600 2500
22.85 -0.3159 -0.3093 -0.3003 -0.2927 -0.2810 -0.2705 -0.2615 -0.2502 -0.2415154.27 -0.1131 -0.1015 -0.0908 -0.0793 -0.0716 -0.0605 -0.0513 -0.0406 -0.0317207.62 -0.0289 -0.0173 -0.0068 0.0036 0.0143 0.0243 0.0343 0.0452 0.0568311.43 0.1399 0.1510 0.1624 0.1726 0.1855 0.1963 0.2055 0.2173 0.2262415.15 0.3473 0.3593 0.3686 0.3783 0.3885 0.4029 0.4161 0.4248 0.4377466.79 0.4658 0.4780 0.4898 0.5023 0.5144 0.5280 0.5388 0.5529 0.5643518.53 0.6053 0.6185 0.6310 0.6434 0.6585 0.6714 0.6844 0.6987 0.7119569.78 0.7858 0.8014 0.8139 0.8289 0.8450 0.8586 0.8770 0.8901 0.9065590.38 0.8521 0.8675 0.8846 0.8998 0.9158 0.9324 0.9491 0.9643 0.9838600.79 0.8896 0.9062 0.9249 0.9425 0.9622 0.9806 0.9987 1.0174 1.0377610.96 0.9403 0.9577 0.9767 0.9934 1.0140 1.0331 1.0521 1.0716 1.0930621.41 0.9910 1.0098 1.0305 1.0499 1.0701 1.0927 1.1146 1.1376 1.1612631.62 1.0549 1.0775 1.0992 1.1222 1.1489 1.1738 1.2020 1.2231 1.2536642.06 1.1277 1.1527 1.1786 1.2080 1.2368 1.2702 1.3039 1.3520 1.5901652.51 1.2071 1.2421 1.2798 1.3289 1.5629 1.5764 1.5890 1.5987 1.6078
T(°C) 2400 2300 2200 2100 2000 1900 1800 1700 1600
22.85 -0.2319 -0.2217 -0.2123 -0.2035 -0.1936 -0.1844 -0.1745 -0.1645 -0.1549154.27 -0.0197 -0.0109 0.0003 0.0080 0.0197 0.0275 0.0371 0.0478 0.0580207.62 0.0659 0.0746 0.0876 0.0975 0.1093 0.1182 0.1272 0.1388 0.1473311.43 0.2376 0.2501 0.2634 0.2735 0.2822 0.2952 0.3066 0.3157 0.3280415.15 0.4497 0.4606 0.4725 0.4841 0.4937 0.5061 0.5193 0.5297 0.5413466.79 0.5768 0.5911 0.6006 0.6134 0.6260 0.6389 0.6502 0.6620 0.6761518.53 0.7265 0.7372 0.7519 0.7668 0.7804 0.7950 0.8090 0.8231 0.8384569.78 0.9214 0.9391 0.9543 0.9730 0.9876 1.0015 1.0228 1.0379 1.0567590.38 1.0019 1.0197 1.0385 1.0593 1.0778 1.0968 1.1176 1.1386 1.1605600.79 1.0560 1.0758 1.0981 1.1185 1.1402 1.1631 1.1849 1.2103 1.2364610.96 1.1135 1.1357 1.1602 1.1829 1.2084 1.2354 1.2619 1.2926 1.3237621.41 1.1861 1.2132 1.2404 1.2721 1.3056 1.3426 1.3891 1.6247 1.6383631.62 1.2877 1.3230 1.3681 1.6061 1.6202 1.6309 1.6382 1.6455 1.6525642.06 1.6042 1.6156 1.6233 1.6292 1.6374 1.6427 1.6482 1.6564 1.6608652.51 1.6118 1.6192 1.6261 1.6325 1.6405 1.6477 1.6507 1.6576 1.6621
T(°C) 1500 1400 1300 1200 1100 1000 900 800 700
22.85 -0.1444 -0.1372 -0.1280 -0.1166 -0.1049 -0.0951 -0.0876 -0.0764 -0.0661154.27 0.0673 0.0770 0.0870 0.0977 0.1068 0.1163 0.1286 0.1378 0.1476207.62 0.1570 0.1684 0.1765 0.1877 0.1996 0.2077 0.2176 0.2285 0.1386311.43 0.3396 0.3488 0.3585 0.3706 0.3806 0.3923 0.4029 0.4140 0.4259415.15 0.5538 0.5651 0.5757 0.5893 0.6042 0.6145 0.6286 0.6396 0.6530466.79 0.6882 0.7009 0.7119 0.7272 0.7421 0.7546 0.7686 0.7830 0.7966518.53 0.8528 0.8651 0.8784 0.8971 0.9109 0.9277 0.9431 0.9577 0.9745569.78 1.0737 1.0922 1.1093 1.1314 1.1525 1.1724 1.1935 1.2147 1.2385590.38 1.1829 1.2050 1.2276 1.2550 1.2822 1.3109 1.3409 1.3741 1.4146600.79 1.2641 1.2887 1.3175 1.3523 1.3921 1.4389 1.6722 1.6850 1.6938610.96 1.3625 1.4087 1.6455 1.6580 1.6676 1.6770 1.6825 1.6888 1.6962621.41 1.6487 1.6550 1.6618 1.6700 1.6778 1.6834 1.6903 1.6973 1.7018631.62 1.6602 1.6645 1.6693 1.6756 1.6820 1.6879 1.6925 1.6980 1.7073642.06 1.6681 1.6725 1.6779 1.6853 1.6903 1.6953 1.7000 1.7044 1.7096652.51 1.6667 1.6712 1.6759 1.6836 1.6896 1.6938 1.7017 1.7068 1.7098
Continued On Next Page!
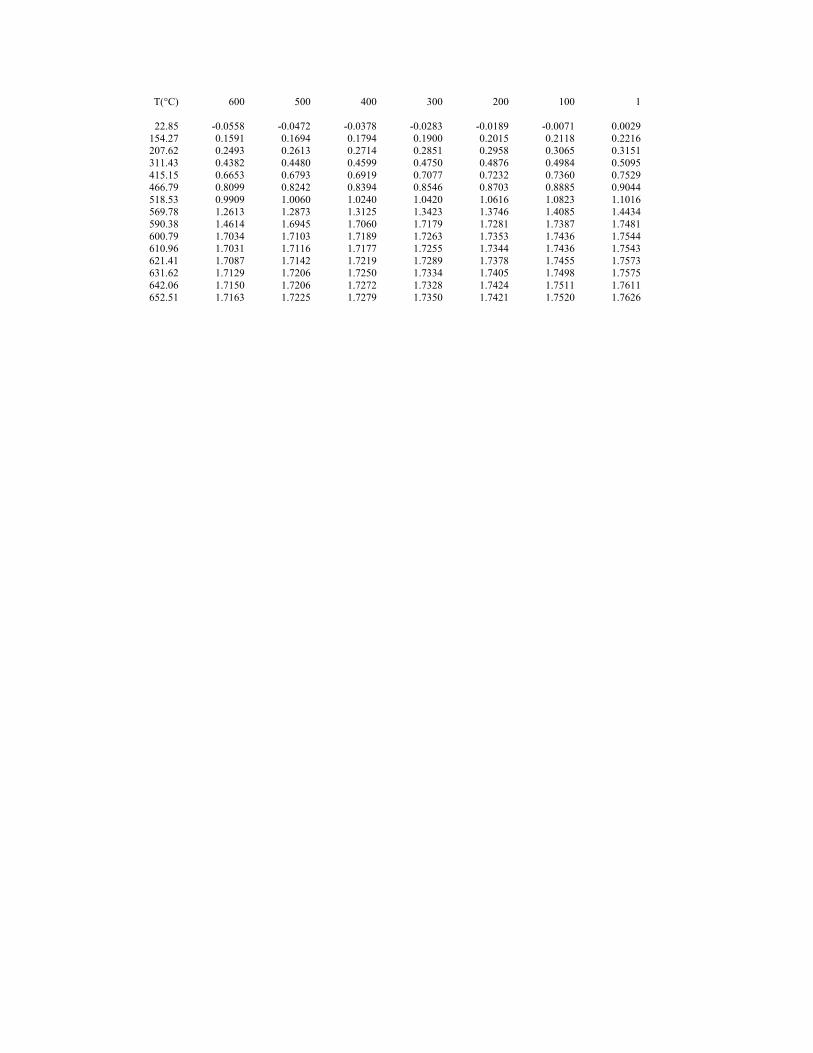
T(°C) 600 500 400 300 200 100 1
22.85 -0.0558 -0.0472 -0.0378 -0.0283 -0.0189 -0.0071 0.0029 154.27 0.1591 0.1694 0.1794 0.1900 0.2015 0.2118 0.2216 207.62 0.2493 0.2613 0.2714 0.2851 0.2958 0.3065 0.3151 311.43 0.4382 0.4480 0.4599 0.4750 0.4876 0.4984 0.5095 415.15 0.6653 0.6793 0.6919 0.7077 0.7232 0.7360 0.7529 466.79 0.8099 0.8242 0.8394 0.8546 0.8703 0.8885 0.9044 518.53 0.9909 1.0060 1.0240 1.0420 1.0616 1.0823 1.1016 569.78 1.2613 1.2873 1.3125 1.3423 1.3746 1.4085 1.4434 590.38 1.4614 1.6945 1.7060 1.7179 1.7281 1.7387 1.7481 600.79 1.7034 1.7103 1.7189 1.7263 1.7353 1.7436 1.7544 610.96 1.7031 1.7116 1.7177 1.7255 1.7344 1.7436 1.7543 621.41 1.7087 1.7142 1.7219 1.7289 1.7378 1.7455 1.7573 631.62 1.7129 1.7206 1.7250 1.7334 1.7405 1.7498 1.7575 642.06 1.7150 1.7206 1.7272 1.7328 1.7424 1.7511 1.7611 652.51 1.7163 1.7225 1.7279 1.7350 1.7421 1.7520 1.7626
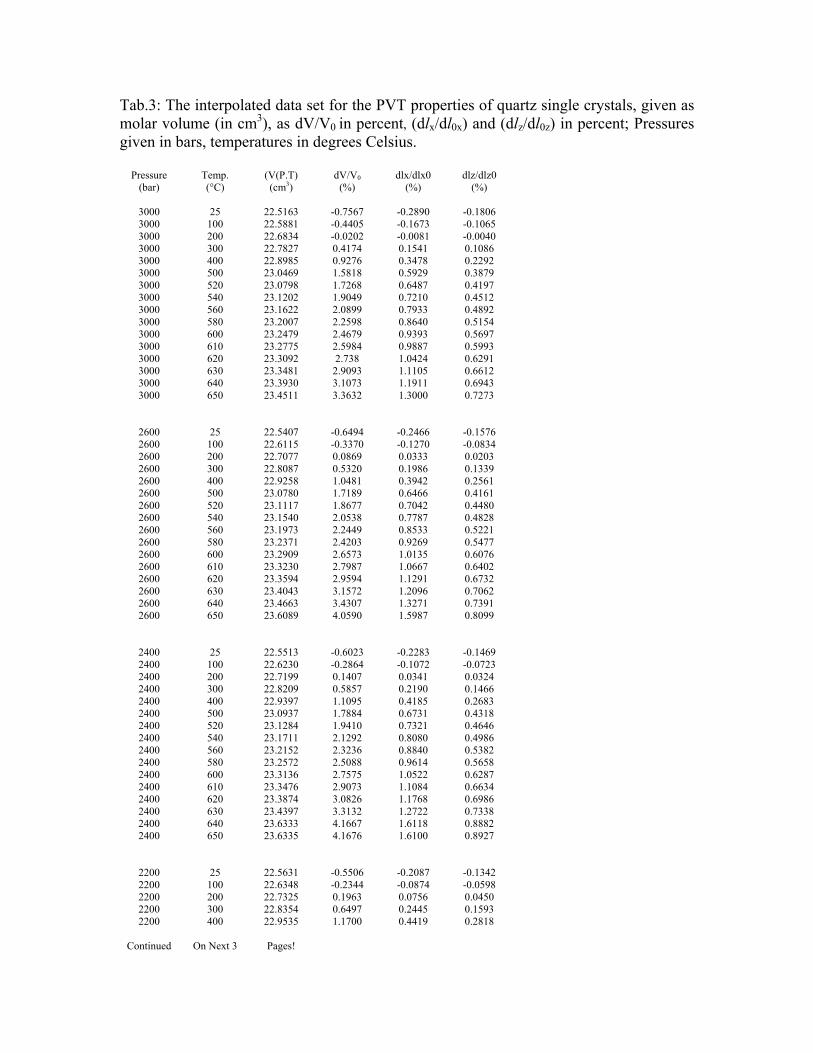
Tab.3: The interpolated data set for the PVT properties of quartz single crystals, given as molar volume (in cm3), as dV/V0 in percent, (dlx/dl0x) and (dlz/dl0z) in percent; Pressures given in bars, temperatures in degrees Celsius.
Pressure Temp. (V(P.T) dV/V0 dlx/dlx0 dlz/dlz0 (bar) (°C) (cm3) (%) (%) (%)
3000 25 22.5163 -0.7567 -0.2890 -0.1806 3000 100 22.5881 -0.4405 -0.1673 -0.1065 3000 200 22.6834 -0.0202 -0.0081 -0.0040 3000 300 22.7827 0.4174 0.1541 0.1086 3000 400 22.8985 0.9276 0.3478 0.2292 3000 500 23.0469 1.5818 0.5929 0.3879 3000 520 23.0798 1.7268 0.6487 0.4197 3000 540 23.1202 1.9049 0.7210 0.4512 3000 560 23.1622 2.0899 0.7933 0.4892 3000 580 23.2007 2.2598 0.8640 0.5154 3000 600 23.2479 2.4679 0.9393 0.5697 3000 610 23.2775 2.5984 0.9887 0.5993 3000 620 23.3092 2.738 1.0424 0.6291 3000 630 23.3481 2.9093 1.1105 0.6612 3000 640 23.3930 3.1073 1.1911 0.6943 3000 650 23.4511 3.3632 1.3000 0.7273
2600 25 22.5407 -0.6494 -0.2466 -0.1576 2600 100 22.6115 -0.3370 -0.1270 -0.0834 2600 200 22.7077 0.0869 0.0333 0.0203 2600 300 22.8087 0.5320 0.1986 0.1339 2600 400 22.9258 1.0481 0.3942 0.2561 2600 500 23.0780 1.7189 0.6466 0.4161 2600 520 23.1117 1.8677 0.7042 0.4480 2600 540 23.1540 2.0538 0.7787 0.4828 2600 560 23.1973 2.2449 0.8533 0.5221 2600 580 23.2371 2.4203 0.9269 0.5477 2600 600 23.2909 2.6573 1.0135 0.6076 2600 610 23.3230 2.7987 1.0667 0.6402 2600 620 23.3594 2.9594 1.1291 0.6732 2600 630 23.4043 3.1572 1.2096 0.7062 2600 640 23.4663 3.4307 1.3271 0.7391 2600 650 23.6089 4.0590 1.5987 0.8099
2400 25 22.5513 -0.6023 -0.2283 -0.1469 2400 100 22.6230 -0.2864 -0.1072 -0.0723 2400 200 22.7199 0.1407 0.0341 0.0324 2400 300 22.8209 0.5857 0.2190 0.1466 2400 400 22.9397 1.1095 0.4185 0.2683 2400 500 23.0937 1.7884 0.6731 0.4318 2400 520 23.1284 1.9410 0.7321 0.4646 2400 540 23.1711 2.1292 0.8080 0.4986 2400 560 23.2152 2.3236 0.8840 0.5382 2400 580 23.2572 2.5088 0.9614 0.5658 2400 600 23.3136 2.7575 1.0522 0.6287 2400 610 23.3476 2.9073 1.1084 0.6634 2400 620 23.3874 3.0826 1.1768 0.6986 2400 630 23.4397 3.3132 1.2722 0.7338 2400 640 23.6333 4.1667 1.6118 0.8882 2400 650 23.6335 4.1676 1.6100 0.8927
2200 25 22.5631 -0.5506 -0.2087 -0.1342 2200 100 22.6348 -0.2344 -0.0874 -0.0598 2200 200 22.7325 0.1963 0.0756 0.0450 2200 300 22.8354 0.6497 0.2445 0.1593 2200 400 22.9535 1.1700 0.4419 0.2818
Continued On Next 3 Pages!
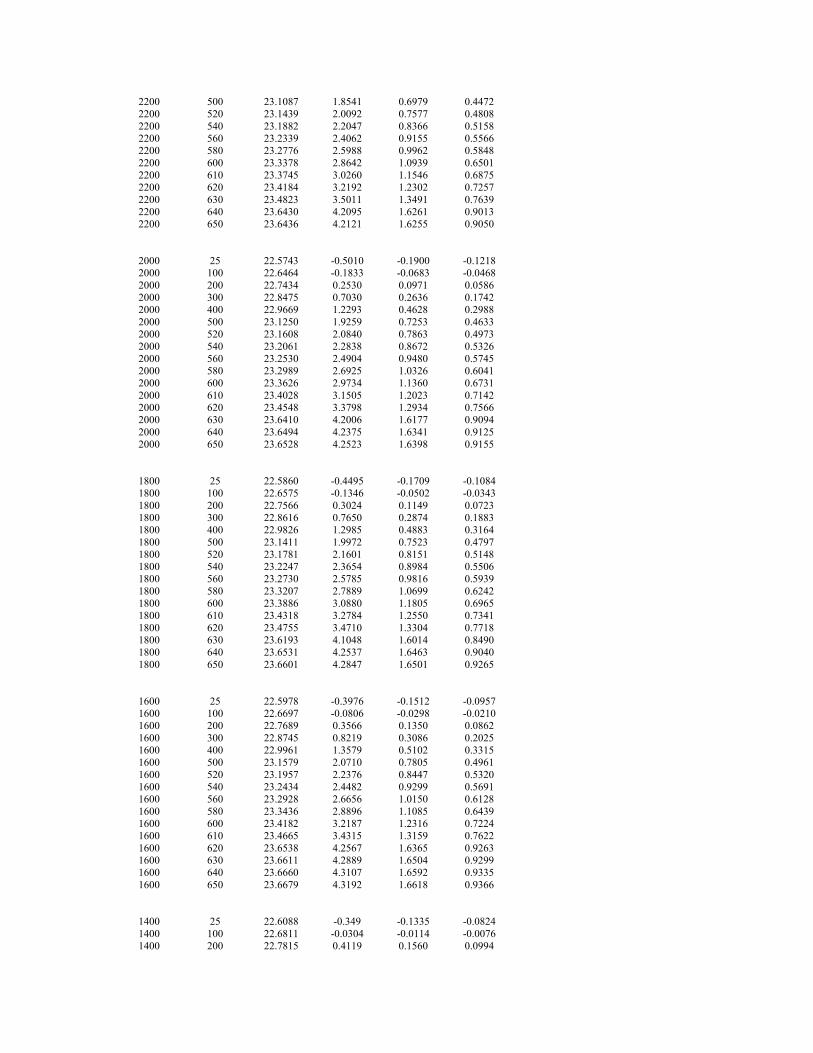
2200 500 23.1087 1.8541 0.6979 0.4472 2200 520 23.1439 2.0092 0.7577 0.4808 2200 540 23.1882 2.2047 0.8366 0.5158 2200 560 23.2339 2.4062 0.9155 0.5566 2200 580 23.2776 2.5988 0.9962 0.5848 2200 600 23.3378 2.8642 1.0939 0.6501 2200 610 23.3745 3.0260 1.1546 0.6875 2200 620 23.4184 3.2192 1.2302 0.7257 2200 630 23.4823 3.5011 1.3491 0.7639 2200 640 23.6430 4.2095 1.6261 0.9013 2200 650 23.6436 4.2121 1.6255 0.9050
2000 25 22.5743 -0.5010 -0.1900 -0.1218 2000 100 22.6464 -0.1833 -0.0683 -0.0468 2000 200 22.7434 0.2530 0.0971 0.0586 2000 300 22.8475 0.7030 0.2636 0.1742 2000 400 22.9669 1.2293 0.4628 0.2988 2000 500 23.1250 1.9259 0.7253 0.4633 2000 520 23.1608 2.0840 0.7863 0.4973 2000 540 23.2061 2.2838 0.8672 0.5326 2000 560 23.2530 2.4904 0.9480 0.5745 2000 580 23.2989 2.6925 1.0326 0.6041 2000 600 23.3626 2.9734 1.1360 0.6731 2000 610 23.4028 3.1505 1.2023 0.7142 2000 620 23.4548 3.3798 1.2934 0.7566 2000 630 23.6410 4.2006 1.6177 0.9094 2000 640 23.6494 4.2375 1.6341 0.9125 2000 650 23.6528 4.2523 1.6398 0.9155
1800 25 22.5860 -0.4495 -0.1709 -0.1084 1800 100 22.6575 -0.1346 -0.0502 -0.0343 1800 200 22.7566 0.3024 0.1149 0.0723 1800 300 22.8616 0.7650 0.2874 0.1883 1800 400 22.9826 1.2985 0.4883 0.3164 1800 500 23.1411 1.9972 0.7523 0.4797 1800 520 23.1781 2.1601 0.8151 0.5148 1800 540 23.2247 2.3654 0.8984 0.5506 1800 560 23.2730 2.5785 0.9816 0.5939 1800 580 23.3207 2.7889 1.0699 0.6242 1800 600 23.3886 3.0880 1.1805 0.6965 1800 610 23.4318 3.2784 1.2550 0.7341 1800 620 23.4755 3.4710 1.3304 0.7718 1800 630 23.6193 4.1048 1.6014 0.8490 1800 640 23.6531 4.2537 1.6463 0.9040 1800 650 23.6601 4.2847 1.6501 0.9265
1600 25 22.5978 -0.3976 -0.1512 -0.0957 1600 100 22.6697 -0.0806 -0.0298 -0.0210 1600 200 22.7689 0.3566 0.1350 0.0862 1600 300 22.8745 0.8219 0.3086 0.2025 1600 400 22.9961 1.3579 0.5102 0.3315 1600 500 23.1579 2.0710 0.7805 0.4961 1600 520 23.1957 2.2376 0.8447 0.5320 1600 540 23.2434 2.4482 0.9299 0.5691 1600 560 23.2928 2.6656 1.0150 0.6128 1600 580 23.3436 2.8896 1.1085 0.6439 1600 600 23.4182 3.2187 1.2316 0.7224 1600 610 23.4665 3.4315 1.3159 0.7622 1600 620 23.6538 4.2567 1.6365 0.9263 1600 630 23.6611 4.2889 1.6504 0.9299 1600 640 23.6660 4.3107 1.6592 0.9335 1600 650 23.6679 4.3192 1.6618 0.9366
1400 25 22.6088 -0.349 -0.1335 -0.0824 1400 100 22.6811 -0.0304 -0.0114 -0.0076 1400 200 22.7815 0.4119 0.1560 0.0994
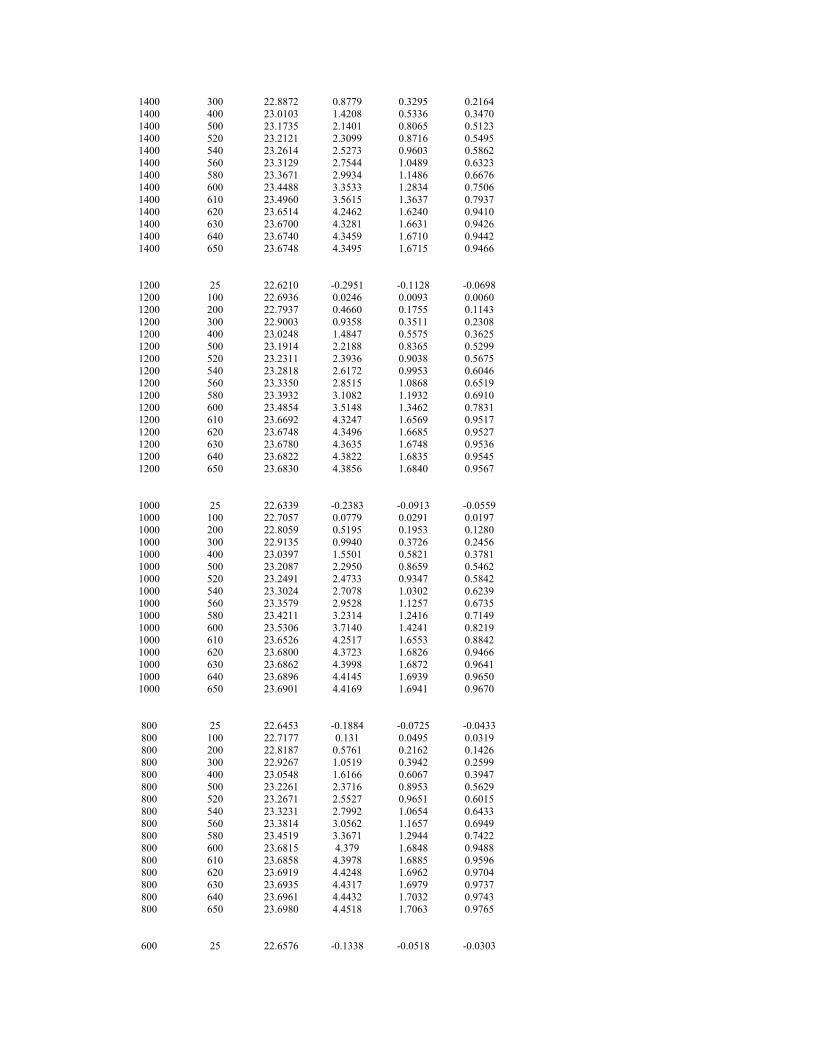
1400 300 22.8872 0.8779 0.3295 0.2164 1400 400 23.0103 1.4208 0.5336 0.3470 1400 500 23.1735 2.1401 0.8065 0.5123 1400 520 23.2121 2.3099 0.8716 0.5495 1400 540 23.2614 2.5273 0.9603 0.5862 1400 560 23.3129 2.7544 1.0489 0.6323 1400 580 23.3671 2.9934 1.1486 0.6676 1400 600 23.4488 3.3533 1.2834 0.7506 1400 610 23.4960 3.5615 1.3637 0.7937 1400 620 23.6514 4.2462 1.6240 0.9410 1400 630 23.6700 4.3281 1.6631 0.9426 1400 640 23.6740 4.3459 1.6710 0.9442 1400 650 23.6748 4.3495 1.6715 0.9466
1200 25 22.6210 -0.2951 -0.1128 -0.0698 1200 100 22.6936 0.0246 0.0093 0.0060 1200 200 22.7937 0.4660 0.1755 0.1143 1200 300 22.9003 0.9358 0.3511 0.2308 1200 400 23.0248 1.4847 0.5575 0.3625 1200 500 23.1914 2.2188 0.8365 0.5299 1200 520 23.2311 2.3936 0.9038 0.5675 1200 540 23.2818 2.6172 0.9953 0.6046 1200 560 23.3350 2.8515 1.0868 0.6519 1200 580 23.3932 3.1082 1.1932 0.6910 1200 600 23.4854 3.5148 1.3462 0.7831 1200 610 23.6692 4.3247 1.6569 0.9517 1200 620 23.6748 4.3496 1.6685 0.9527 1200 630 23.6780 4.3635 1.6748 0.9536 1200 640 23.6822 4.3822 1.6835 0.9545 1200 650 23.6830 4.3856 1.6840 0.9567
1000 25 22.6339 -0.2383 -0.0913 -0.0559 1000 100 22.7057 0.0779 0.0291 0.0197 1000 200 22.8059 0.5195 0.1953 0.1280 1000 300 22.9135 0.9940 0.3726 0.2456 1000 400 23.0397 1.5501 0.5821 0.3781 1000 500 23.2087 2.2950 0.8659 0.5462 1000 520 23.2491 2.4733 0.9347 0.5842 1000 540 23.3024 2.7078 1.0302 0.6239 1000 560 23.3579 2.9528 1.1257 0.6735 1000 580 23.4211 3.2314 1.2416 0.7149 1000 600 23.5306 3.7140 1.4241 0.8219 1000 610 23.6526 4.2517 1.6553 0.8842 1000 620 23.6800 4.3723 1.6826 0.9466 1000 630 23.6862 4.3998 1.6872 0.9641 1000 640 23.6896 4.4145 1.6939 0.9650 1000 650 23.6901 4.4169 1.6941 0.9670
800 25 22.6453 -0.1884 -0.0725 -0.0433 800 100 22.7177 0.131 0.0495 0.0319 800 200 22.8187 0.5761 0.2162 0.1426 800 300 22.9267 1.0519 0.3942 0.2599 800 400 23.0548 1.6166 0.6067 0.3947 800 500 23.2261 2.3716 0.8953 0.5629 800 520 23.2671 2.5527 0.9651 0.6015 800 540 23.3231 2.7992 1.0654 0.6433 800 560 23.3814 3.0562 1.1657 0.6949 800 580 23.4519 3.3671 1.2944 0.7422 800 600 23.6815 4.379 1.6848 0.9488 800 610 23.6858 4.3978 1.6885 0.9596 800 620 23.6919 4.4248 1.6962 0.9704 800 630 23.6935 4.4317 1.6979 0.9737 800 640 23.6961 4.4432 1.7032 0.9743 800 650 23.6980 4.4518 1.7063 0.9765
600 25 22.6576 -0.1338 -0.0518 -0.0303
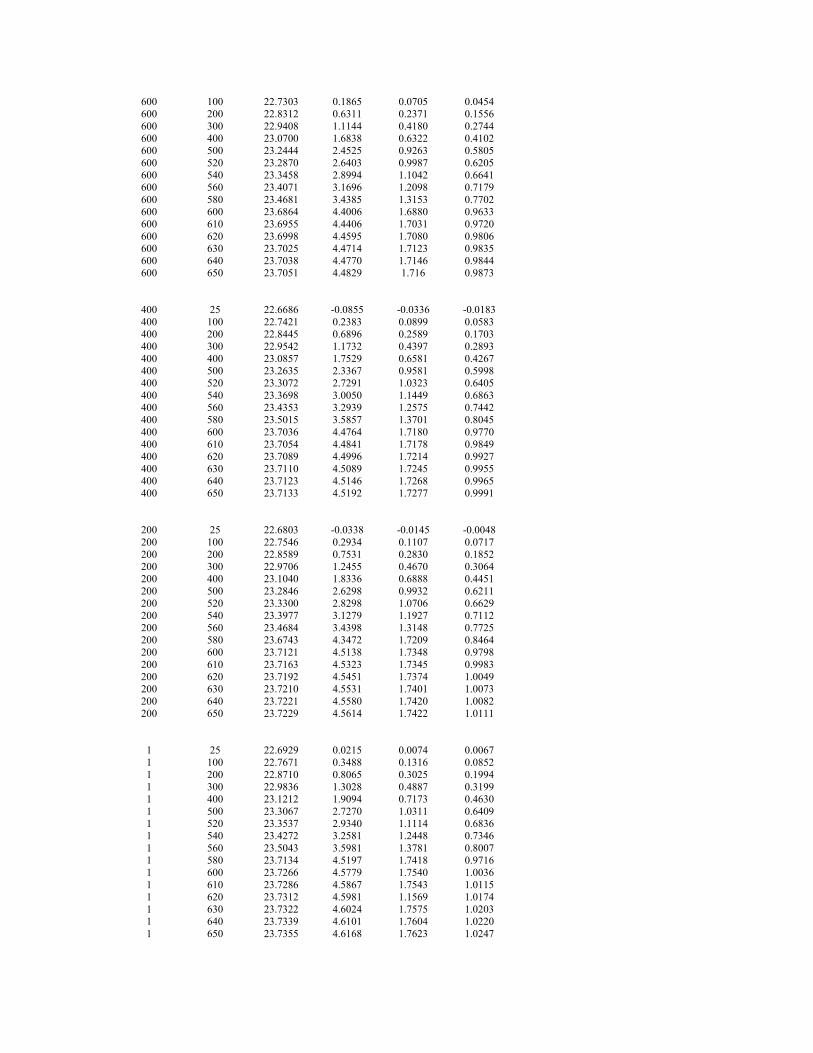
600 100 22.7303 0.1865 0.0705 0.0454 600 200 22.8312 0.6311 0.2371 0.1556 600 300 22.9408 1.1144 0.4180 0.2744 600 400 23.0700 1.6838 0.6322 0.4102 600 500 23.2444 2.4525 0.9263 0.5805 600 520 23.2870 2.6403 0.9987 0.6205 600 540 23.3458 2.8994 1.1042 0.6641 600 560 23.4071 3.1696 1.2098 0.7179 600 580 23.4681 3.4385 1.3153 0.7702 600 600 23.6864 4.4006 1.6880 0.9633 600 610 23.6955 4.4406 1.7031 0.9720 600 620 23.6998 4.4595 1.7080 0.9806 600 630 23.7025 4.4714 1.7123 0.9835 600 640 23.7038 4.4770 1.7146 0.9844 600 650 23.7051 4.4829 1.716 0.9873
400 25 22.6686 -0.0855 -0.0336 -0.0183 400 100 22.7421 0.2383 0.0899 0.0583 400 200 22.8445 0.6896 0.2589 0.1703 400 300 22.9542 1.1732 0.4397 0.2893 400 400 23.0857 1.7529 0.6581 0.4267 400 500 23.2635 2.3367 0.9581 0.5998 400 520 23.3072 2.7291 1.0323 0.6405 400 540 23.3698 3.0050 1.1449 0.6863 400 560 23.4353 3.2939 1.2575 0.7442 400 580 23.5015 3.5857 1.3701 0.8045 400 600 23.7036 4.4764 1.7180 0.9770 400 610 23.7054 4.4841 1.7178 0.9849 400 620 23.7089 4.4996 1.7214 0.9927 400 630 23.7110 4.5089 1.7245 0.9955 400 640 23.7123 4.5146 1.7268 0.9965 400 650 23.7133 4.5192 1.7277 0.9991
200 25 22.6803 -0.0338 -0.0145 -0.0048 200 100 22.7546 0.2934 0.1107 0.0717 200 200 22.8589 0.7531 0.2830 0.1852 200 300 22.9706 1.2455 0.4670 0.3064 200 400 23.1040 1.8336 0.6888 0.4451 200 500 23.2846 2.6298 0.9932 0.6211 200 520 23.3300 2.8298 1.0706 0.6629 200 540 23.3977 3.1279 1.1927 0.7112 200 560 23.4684 3.4398 1.3148 0.7725 200 580 23.6743 4.3472 1.7209 0.8464 200 600 23.7121 4.5138 1.7348 0.9798 200 610 23.7163 4.5323 1.7345 0.9983 200 620 23.7192 4.5451 1.7374 1.0049 200 630 23.7210 4.5531 1.7401 1.0073 200 640 23.7221 4.5580 1.7420 1.0082 200 650 23.7229 4.5614 1.7422 1.0111
1 25 22.6929 0.0215 0.0074 0.0067 1 100 22.7671 0.3488 0.1316 0.0852 1 200 22.8710 0.8065 0.3025 0.1994 1 300 22.9836 1.3028 0.4887 0.3199 1 400 23.1212 1.9094 0.7173 0.4630 1 500 23.3067 2.7270 1.0311 0.6409 1 520 23.3537 2.9340 1.1114 0.6836 1 540 23.4272 3.2581 1.2448 0.7346 1 560 23.5043 3.5981 1.3781 0.8007 1 580 23.7134 4.5197 1.7418 0.9716 1 600 23.7266 4.5779 1.7540 1.0036 1 610 23.7286 4.5867 1.7543 1.0115 1 620 23.7312 4.5981 1.1569 1.0174 1 630 23.7322 4.6024 1.7575 1.0203 1 640 23.7339 4.6101 1.7604 1.0220 1 650 23.7355 4.6168 1.7623 1.0247
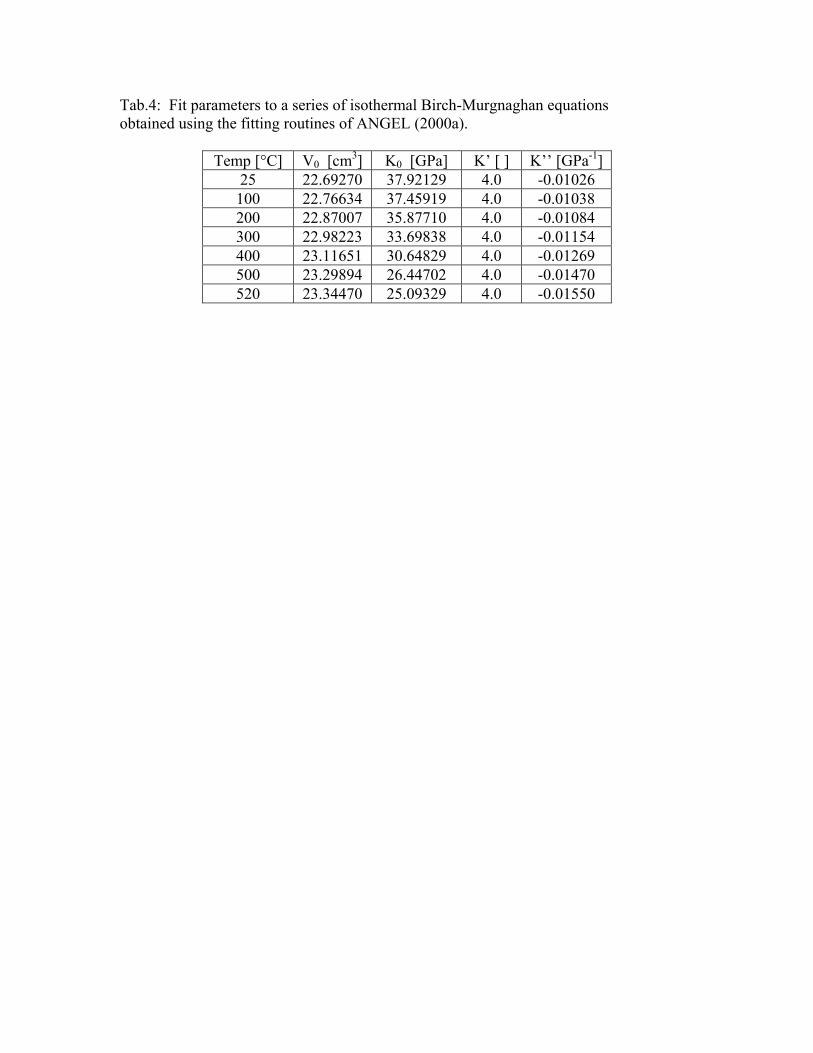
Tab.4: Fit parameters to a series of isothermal Birch-Murgnaghan equations obtained using the fitting routines of ANGEL (2000a).
Temp [°C] V0 [cm3] K0 [GPa] K’ [ ] K’’ [GPa-1] 25 22.69270 37.92129 4.0 -0.01026 100 22.76634 37.45919 4.0 -0.01038 200 22.87007 35.87710 4.0 -0.01084 300 22.98223 33.69838 4.0 -0.01154 400 23.11651 30.64829 4.0 -0.01269 500 23.29894 26.44702 4.0 -0.01470 520 23.34470 25.09329 4.0 -0.01550
28
References ACKERMANN, R.J. and SORRELL, C.A. (1974): Thermal expansion and the high-low
transformation in quartz. J. Appl. Cryst. C 7, 461-467. ANGEL, R.J. (2000): Equations of state. In: Hazen, R.M. and Downs, R.T. (eds): High-
Temperature and High-Pressure Crystal Chemistry 41. Rev. Mineral. Geochem. 35-59. ANGEL, R.J., ALLAN, D.R., MILETICH, R. and FINGER, L.W. (1997): The Use of Quartz as an
Internal Pressure Standard in High-Pressure Crystallography. J. Appl. Cryst. 30, 461-466. ASLANIAN, T.A. and LEVANYUK, A.P. (1979): On the possibility of the incomensurate phase near
α−β transition point in quartz. Solid State Communications 31, 547-550. ASLANIAN, T.A. and LEVANYUK, A.P. (1984): Fluctuation effects as a cause for the
incommensurate phase formation. Ferroelectrics 53, 231-234. ASLANIAN, T.A., LEVANYUK, A.P., VALLADE, M. and LAJZEROWICZ, J. (1983): Various
possibilities for formation of incommensurate superstructure near the α−β transition in quartz. J. Physics C 16, 6705-6712.
AXE, J.C. and SHIRANE, G. (1970): Study of the α−β quartz phase transformation by inelastic neutron scattering. Phys. Rev. B1, 342-348.
BACHHEIMER, J.P. (1980): An anomaly in the β phase near the α−β transition of quartz. J. Phys. Lett. 41, L559-L561.
BARRON, T.H.K., COLLINS, J.F., SMITH, T.W. and WHITE, G.K. (1982): Thermal expansion, Grueneisen functions and static lattice properties of quartz. J. Physics C 15, 4311-4326.
BASTIE, P., MOGEON, F. and ZEYEN, C.M.E. (1988): Direct neutron observation of a single-q incommensurate phase of quartz at zero stress. Physical Review B 38, 786-788.
BEALL, G.H. (1994): Industrial applications of silica. Rev. Mineral. 29, 468-505. BERGER, C., EYRAUD, L., RICHARD, M. and RIVIERE, R. (1966): Etude radiocristallographique de
variation de volume pour quelques matériaux subissant des transformations de phase solide - solide. Société Chimique de France Bulletin 1966, 628-633.
BRIDGMANN, P.W. (1948a): The compression of 39 substances to 100,000 kg/cm2. Proc. Am. Acad. of Arts and Sciences 76, 55-70.
BRIDGMANN, P.W. (1948b): The compression of 39 substances to 40,000 kg/cm2. Proc. Am. Acad. of Arts and Sciences 76, 71-87.
BYSTRICHOV, A.S. (1966): The nature of the low - high transformation in quartz. Geochem. International 1966, 223-229.
CARPENTER, M.A., SALJE, E.K.H., GRAEME-BARBER, A., WRUCK, B., DOVE, M.T. and KNIGHT, K.S. (1998): Calibration of excess thermodynamic properties and elastic constant variations due to the α× β phase transition in quartz. Am. Mineral. 83, 2-22.
COHEN, R.E. (1994): First-principles theory of crystalline SiO2. In: Heaney, P.J., Prewitt, C.T. and Gibbs, G.V. (eds): Silica - Physical Behavior, Geochemistry and Materials Applications 29. Rev. Mineral. 369-402.
D'AMOUR, H., DENNER, W. and SCHULZ, H. (1979): Structure determination of α-quartz up to 68 x 108 Pa. Acta Cryst. B35, 550-555.
DOLINO, G. (1990): The α-inc-β transitions of quartz: A century of research on displacive phase transitions. Phase Transitions 21, 59-72.
DOLINO, G. and VALLADE, M. (1994): Lattice dynamical behavior of anhydrous silica. In: Heaney, P.J., Prewitt, C.T. and Gibbs, G.V. (eds): Silica: Physical behavior, geochemistry and materials applications 29. Rev. Mineral. 403-431.
DOROGOKUPETS, P.I. (1995): Equation of state for lambda transition in quartz. J. Geophys. Res.
29
100/B5, 8489-8499. DREBUSHCHAK, V.A. and DEMENT'EV, S.H. (1993): Thermodynamic study of quartz in the
vicinity of the α−β quartz transition. Geokhimia 9, 1341-1353. GHIORSO, M.S., CARMICHAEL, I.S.E. and MORET, L.K. (1979): Inverted high temperature quartz.
Contrib. Mineral. Petrol. 68, 307-323. GLINNEMANN, J.J., SCHULZ, H.E.K., HAHN, T., PLACA, S.J.L. and DACOL, F. (1992): Crystal
structures of the low-temperature quartz-type phases of SiO2 and GeO2 at elevated pressure. Z. Kristallogr. 198, 177-212.
HATTA, I., MATSUURA, M., YAO, H., GOUHARA, K. and KATO, N. (1985): True behaviour of heat capacity in α, incommensurate, and β phases of quartz. Thermochimica Acta 88, 143-148.
HAZEN, R.M., FINGER, L.W., HEMLEY, R.J. and MAO, H.K. (1989): High-pressure crystal chemistry and amorphization of α-quartz. Solid State Communications 72, 507-511.
HEANEY, P.J. (1994): Structure and chemistry of the low-pressure silica polymorphs. In: Heaney, P.J., Prewitt, C.T. and Gibbs, G.V. (eds): Silica: Physical Behaviour, Geochemistry, and Materials Applications 29. Rev. Mineral. 1-4.
HEANEY, P.J. (2000): Phase transformations induced by solid solution. In: Redfern, S.A.T. and Carpenter, M.A. (eds): Transformation processes in minerals 39. Rev. Mineral. Geochem., Washington D.C., 135-174.
HEANEY, P.J., PREWITT, C.T. and GIBBS, G.V. (1994): Silica: Physical behaviour, geochemistry and material applications Rev. Mineral. 29. Mineralocial Society of America, Washington, D.C., 606 pp.
HEANEY, P.J. and VEBLEN, D.R. (1991): Observations of the α−β transition in quartz: A review of imaging and diffraction studies and some new results. Am. Mineral. 76, 1018-1032.
HEMLEY, R.J., PREWITT, C.T. and KINGMA, K.J. (1994): High-pressure behavior of silica. In: Heaney, P.J., Prewitt, C.T. and Gibbs, G.V. (eds): Silica: Phsical Behaviour, Geochemistry, and Materials Applications 29. Rev. Mineral., 41-81.
HOECHLI, U.T. (1970): Ultrasonic Investigations of the first-Order α−β Phase Transition of Quartz. Solid State Communications 8, 1487-1490.
HOECHLI, U.T. and SCOTT, J.F. (1971): Displacement parameter, soft-mode frequency, and fluctuations in quartz below its α−β phase transistion. Phys. Rev. Lett. 26, 1627-1629.
JAY, A.H. (1933): The thermal expansion of quartz by x-ray measurements. Proc. Roy. Soc. A 142, 237-247.
KEITH, M.L. and TUTTLE, O.F. (1952): Significance of variation in the high-low inversion of quartz. Am. J. Sci. Bowen Volume, 203-280.
KELLEY, K.K. (1960): Contributions to the data on theoretical metallurgy XIII. High temperature heat-content, heat-capacity, and entropy data for the elements and inorganic compounds. U.S. Bureau of Mines Bulletin 584, 232.
KINGMA, K.J., HEMLEY, R.J., MAO, H.K. and VEBLEN, D.R. (1993): New high-pressure transformation in α-quartz. Phys. Rev. Lett. 70, 3927-3930.
LEVIEN, L., PREWITT, C.T. and WEIDNER, D.J. (1980): Structure and elastic properties of quartz at pressure. Am. Mineral. 65, 920-930.
MAJUMDAR, A.J., MCKINSTRY, H.A. and ROY, R. (1964): Thermodynamic parameters for the alpha-beta quartz and alpha-beta cristobalite transitions. J. Phys. Chem. Solids 25, 1487-1489.
MALOV, Y.V. and SONYUSHKIN, V.E. (1976): Direct electron-microscopic investigation of the α−β transition process in quartz. Soviet Phys. Crystall., USSR 20-644-645
MAYER, G. (1960): Recherches expérimentales sur une transformation du quartz. Commissariat à
30
l'Energie Atomique , C.E.A. 1330, 101. MILETICH, R., ALLAN, D.R. and KUHS, W.F. (2000): High-pressure single-crystal techniques. In:
Hazen, R.M. (ed.): High-Temperature-High Pressure Crystal Chemistry 41. Rev. Mineral. OGATA, K., TAKÉUCHI, Y. and KUDOH, Y. (1987): Structure of α-quartz as a function of
temperature and pressure. Z. Kristallogr. 179, 403-413. PRYDE, A.K.A. and DOVE, M.T. (1998): On the sequence of phase transitions in tridymite. Phys.
Chem. Minerals 26, 267-283. RAMAN, C.V. and NEDUNGADI, T.M.R. (1940): The α−β transformation of quartz. Nature 145,
145-147. RAZ, U. (1983): Thermal and volumetric measurements on quartz and other substances at
pressures up to 6 kbars and temperatures up to 700ºC. Unpubl. Swiss Federal Inst. Tech. REDFERN, S.A.T. and CARPENTER, M.A. (2000): Transformation Processes in Minerals Reviews
in Mineralogy and Geochemistry 39. Mineral. Soc. Am., Washington, D.C., 361 pp. ROBIE, R.A., HEMINGWAY, B.S. and FISHER, J.R. (1979): Thermodynamic Properties of Minerals
and Related Substances at 298.15 K and 1 Bar (105 Pascals) Pressure and at Higher Temperatures. Geol. Surv. Bull. 1452, 1-456.
SHAPIRO, S.M. and CUMMINS, H.Z. (1968): Critical opalescence in quartz. Phys. Rev. Lett. 21, 1578-1582.
SHEN, A.H., BASSETT, W.A. and CHOU, I.M. (1993): The α−β quartz transition at high temperatures and pressures in a diamond-anvil cell by laser interferometry. Am. Mineral. 78, 694-698.
SKINNER, B.J. (1966): Thermal expansions. In: Clark, S.P. (ed.): Handbook of physical constants 97. Geol. Soc. Am. Mem., 75-96.
SOSMAN, R.B. (1927): The properties of silica 37. The Chemical Catalog Company, New York, 856 pp.
STEINWEHR, H.E. (1932): Umwandlung α−β Quartz. Z. Kristallogr. 99, 292-313. STULL, D.R. and PROPHET, H. (1971): JANAF thermochemical tables. 2nd ed. National Bureau of
Standards NBS37. National Standards Ref. Data Series, 1141 pp. TUCKER, M.G., DOVE, M.T. and KEEN, D.A. (2000): Direct measurement of the thermal
expansion of the Si-O bond by neutron total scattering. J. Physics Condensed Matter 12, L425-L430.
VALLADE, M., BERGE, B. and DOLINO, G. (1992): Origin of the incommensurate phase of quartz: II. Interpretation of inelastic neutron scattering data. J. Physics 2, 1481-1495.
VAN TENDELOO, G., VAN LANDUYT, J. and AMELINCKX, S. (1976): The α−β phase transition in quartz and AIPO4 as studied by electron microscopy and diffraction. Phys. Status Solidi 33, 723-735.
WELCHE, P.R.L., HEINE, V. and DOVE, M.T. (1998): Negative thermal expansion in β-quartz. Phys. Chem. Minerals 26, 63-77.
YAKOVLEV, I.A., MIKHEEVA, L.F. and VELICHKINA, T.S. (1956): The molecular scattering of light and the α−β transformation in quartz. Soviet Phys. Crystall., USSR 1, 91-98.
YOUNG, R.A. (1962): Mechanism of the phase transition in quartz. US Air Force, Office of Scientific Research Contract No AF49(638)-624
ZEYEN, C.M.E., DOLINO, G. and BACHHEIMER, J.P. (1983): Neutron and calorimetric observation of a modulated structure in quartz just above the α−β phase transition. Physica 120 B, 280-282.