Embed Size (px)
Citation preview
THE AFRICAINVESTMENTREPORT2017
INVESTMENT INVESTMENT INVESTMENT INVESTMENT INVESTMENT INVESTMENT INVESTMENT INVESTMENT INVESTMENT INVESTMENT INVESTMENT REPORTREPORTREPORTREPORTREPORTREPORTREPORTREPORTREPORTREPORTREPORTREPORTREPORTREPORTREPORTREPORTREPORTREPORTREPORTREPORTREPORTREPORTREPORTREPORTREPORTREPORTREPORTREPORTREPORT201720172017201720172017
THE THE THE THE THE THE THE THE INVESTMENT INVESTMENT INVESTMENT INVESTMENT INVESTMENT INVESTMENT INVESTMENT INVESTMENT INVESTMENT INVESTMENT INVESTMENT INVESTMENT INVESTMENT INVESTMENT INVESTMENT INVESTMENT INVESTMENT INVESTMENT INVESTMENT INVESTMENT INVESTMENT INVESTMENT INVESTMENT INVESTMENT INVESTMENT INVESTMENT REPORTREPORTREPORTREPORTREPORTREPORTREPORTREPORTREPORTREPORTREPORTREPORTREPORTREPORTREPORTREPORTREPORTREPORTREPORTREPORTREPORTREPORTREPORTREPORTREPORTREPORT20172017201720172017201720172017
AFRICAAFRICAAFRICAAFRICAAFRICAINVESTMENT INVESTMENT INVESTMENT INVESTMENT INVESTMENT INVESTMENT INVESTMENT INVESTMENT INVESTMENT INVESTMENT INVESTMENT INVESTMENT INVESTMENT INVESTMENT INVESTMENT INVESTMENT INVESTMENT INVESTMENT INVESTMENT INVESTMENT INVESTMENT INVESTMENT INVESTMENT INVESTMENT INVESTMENT INVESTMENT INVESTMENT INVESTMENT INVESTMENT INVESTMENT INVESTMENT INVESTMENT INVESTMENT INVESTMENT INVESTMENT INVESTMENT INVESTMENT REPORTREPORTREPORTREPORTREPORTREPORTREPORTREPORTREPORTREPORTREPORTREPORT
INVESTING FORINCLUSIVE GROWTH
AnalyseAfrica.com
Sound information is imperative in order to identify opportunity, minimise risk and tap into Africa’s growth potential.
Analyse Africa is a valuable digital data platform which aggregates macroeconomic data on Africa’s 54 countries from world renowned sources.
• Access validated macroeconomic data and trends at speed• Compare data across African regions and countries• Download data in table and chart format in seconds
Intelligent data leads to smart decisions
Position yourself at the forefront of Africa’s business opportunities, contact us today for a demonstration at [email protected] or +44 (0)20 7775 6900.
THE AFRICA INVESTMENT REPORT 2017 LETTER FROM THE EDITOR1
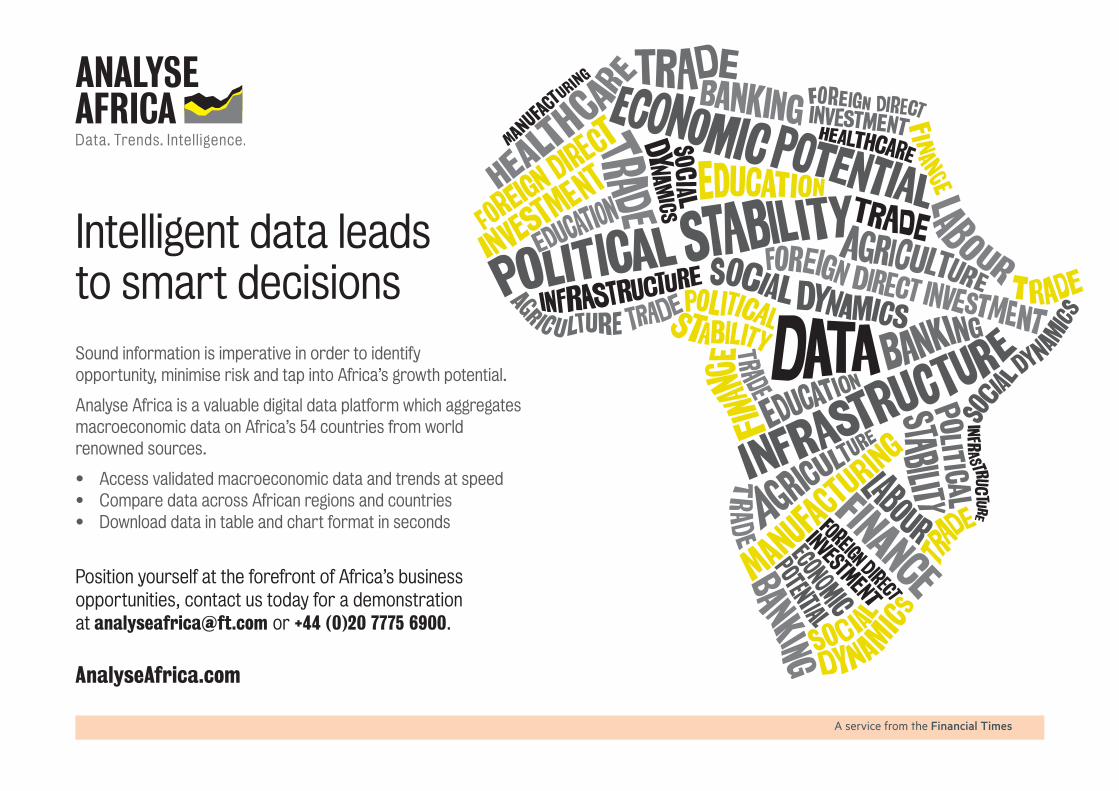
Letter fromthe editor
This year’s Africa Investment Reportcomes at a time of flux, both in Africaand globally. Our findings reflectsome of this uncertainty while alsodemonstrating that investors are findingnew, innovative and productive ways toengage with the region.
The year 2017 brought us into the eraof the Trump presidency. This shift willcontinue to have resounding significancefor investors around the globe as theworld’s number one economy looks
inwards and its policy, both foreign and domestic, continues tobe erratic.
While the US remains the most prolific investor into Africaaccording to our findings, for the first time since our FDIrecords began in 2003, China has surpassed it in terms ofthe amount of capital it is pouring into the region. This is animportant but unsurprising development. China has spent thepast decade actively forging closer economic and political tieswith Africa.
China’s rise to the top spot in terms of greenfield FDI intoAfrica comes because its investors have excelled in the areasthat took the lion’s share of overall investment into the regionin 2016: notably, construction and real estate.
Similarly, while we saw the number of new FDI projectslaunched in Africa fall, total capital invested rose by 40%. Thismay in part reflect some recovery in energy and mining pricesglobally, after being battered in 2015, but we are also seeing anacceleration of capital flowing into other types of investments,
with construction and realestate leading the way.
This builds on trends weremarked on in last year’sversion of this report: foreigninvestors are graduallydiversifying their interests awayfrom traditional energy andextractives sectors. Doubtlessthey see an opportunity tohouse and serve Africa’s rapidlygrowing and fast urbanisingpopulations.
Some investors might bewary of Africa’s overall GDP
growth of 2.2% for 2016 – which falls below the world average.Growth is clearly slowing from the heights of the commoditysupercycle that wound down in 2014-2015. However thestory told by the regional GDP average is disproportionatelyimpacted by poor performance in two of the region’s largesteconomies, Nigeria and South Africa.
Both have flirted with if not fallen into recession over thepast two years, partly due to the rout in prices of their biggestexports but also to poor policy decisions and political discord.This is not the full story.
Others including Ethiopia, Côte D’Ivoire, Tanzania andSenegal have all grown well above 6% through the same period.It bears reiterating that the region is large and diverse andheadline figures all too often disguise the nuances that presentvalue opportunities.
In this time of global flux, there is all too often a kneejerk reaction among investors to withdraw into so-called safehavens. While 2017 has been a tumultuous year – and notalways in positive ways – one effect that I hope it will haveis to begin to undo our misconception of major developedeconomies as the only safe bets.
With the rise in risk in the US and Europe, otherdestinations – Africa included – deserve more focusedattention.
Investing in Africa is not, to be sure, always straightforward.Delays and a lack of regulatory clarity continue to be problemsfor many investors, as are rash policy decisions. Africangovernments need to prove themselves dependable partners toforeign investors.
Foreign investors, for their part, would do well to thinkcreatively about destinations for their capital as we enteruncharted territory. Africa’s manifold opportunities shouldfigure more widely in that calculus.
Adrienne Klasa is editor of This is Africa
It bears reiteratingthat Africa is largeand diverse andheadline figures alltoo often disguise thenuances that presentvalue opportunities
thisisafricaonline.com
TOTAL CAPEX:
$92.3bn*
THE AFRICA INVESTMENT REPORT 2017 AFRICA IN FOCUS2
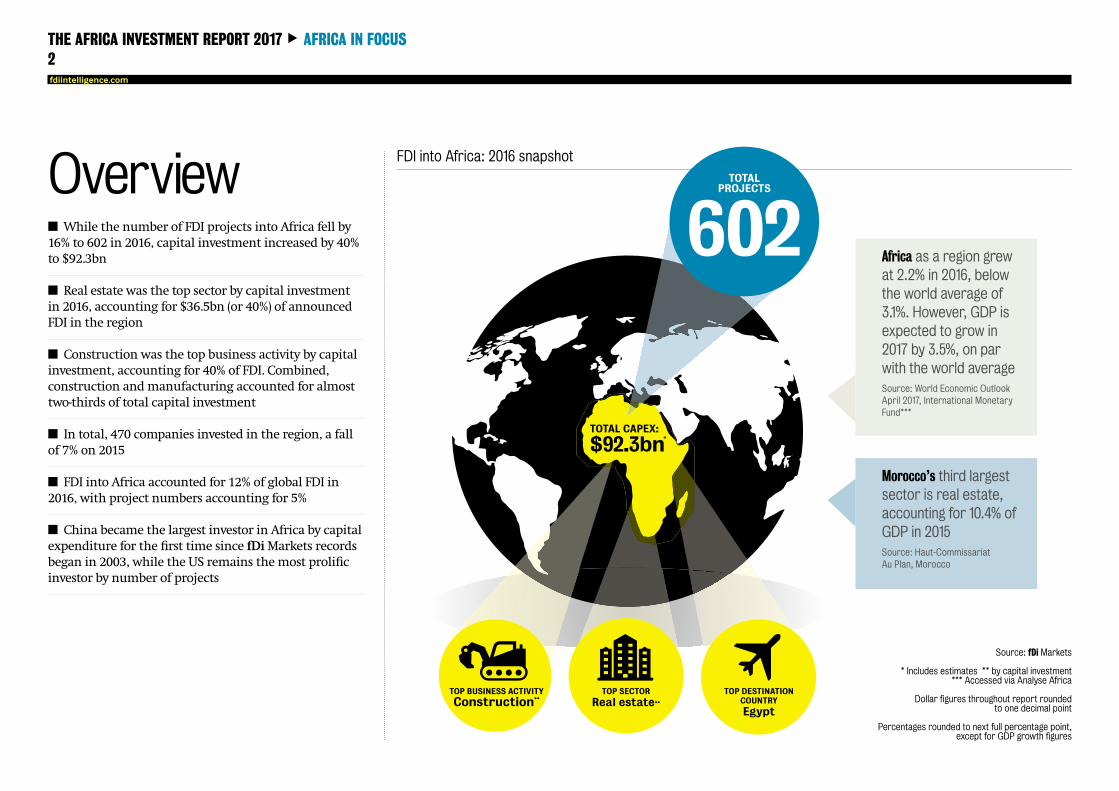
■ While the number of FDI projects into Africa fell by16% to 602 in 2016, capital investment increased by 40%to $92.3bn
■ Real estate was the top sector by capital investmentin 2016, accounting for $36.5bn (or 40%) of announcedFDI in the region
■ Construction was the top business activity by capitalinvestment, accounting for 40% of FDI. Combined,construction andmanufacturing accounted for almosttwo-thirds of total capital investment
■ In total, 470 companies invested in the region, a fallof 7% on 2015
■ FDI into Africa accounted for 12% of global FDI in2016, with project numbers accounting for 5%
■ China became the largest investor in Africa by capitalexpenditure for the first time since fDiMarkets recordsbegan in 2003, while the US remains themost prolificinvestor by number of projects
OverviewFDI into Africa: 2016 snapshot
fdiintelligence.com
Source: fDi Markets
* Includes estimates ** by capital investment*** Accessed via Analyse Africa
Dollar figures throughout report roundedto one decimal point
Percentages rounded to next full percentage point,except for GDP growth figures
TOTALPROJECTS
602 Africa as a region grewat 2.2% in 2016, belowthe world average of3.1%. However, GDP isexpected to grow in2017 by 3.5%, on parwith the world averageSource: World Economic OutlookApril 2017, International MonetaryFund***
Morocco’s third largestsector is real estate,accounting for 10.4% ofGDP in 2015Source: Haut-CommissariatAu Plan, Morocco
TOP BUSINESS ACTIVITY
Construction**
n**
TOP DESTINATIONCOUNTRY
Egypt
TOP SECTOR
Real estate**
This year’s Africa Investment Reportbrings to mind the new edition ofMarcelo Giugale’s excellent book, Eco-nomic Development: What EveryoneNeeds To Know.
If you sometimes wished you had boughtproperty in Mumbai, Shanghai or Rio 10 yearsago, the World Bank senior adviser writes, adecade from now you will no less regret nothaving bought in Abidjan, Dakar or Nairobi today.
Fully 40% of announced greenfield FDI intoAfrica last year went into real estate, the reporttells us, with the same proportion being investedin construction. This represents a shift: in previ-ous years, extractive sectors have tended to topthe African FDI charts.
Now we are starting to see a different dynam-ic. Do the latest numbers merely reflect a cyclicaldownturn in energy and other commodity pricesor do they signal a lasting trend towards a morediversified basis for African growth? My hope andbelief is the latter.
If you had to identify the single most import-ant reason to be bullish on Africa’s prospects inthe 21st century, it would have to be rapid urban-isation, of which the new data is a telling indi-cator.
Africa’s urban population is expanding by 15million a year, according to the UN. That is howmany people live in greater New York, Los Ange-les and Chicago combined. No region’s cities aregrowing faster.
As Sir Paul Collier, a professor of economics atthe University of Oxford, has written, “a success-ful city massively raises the productivity of ordi-nary people. It is the miracle of productivity thathas lifted countries now in the OECD from thepoverty that characterised the entire world untiltwo centuries ago.”
Investors in Africa look beyond extractives by Rosa Whitaker
THE AFRICA INVESTMENT REPORT 2017 VIEWPOINT3
US commerce secretary Wilbur Ross says in-vestors are encouraged by the sight of “cranesdotting the skylines” of Africa’s cities, and he isright. Global private equity and sovereign wealthfunds – along with home-grown investors – arepouring billions of dollars into business and in-dustrial parks, retail complexes, logistics facili-ties and housing across the continent.
An encouraging example is BlackIvy, a USpermanent capital company, which is develop-ing much needed residential communities andan industrial park in Ghana as well as a coldchain logistics platform in Tanzania.
It is true that sub-Saharan Africa’s GDPgrowth is well off the pace from what it averagedduring what Mr Collier has called the “benevo-lent decade”. During the early 2000s, debt relief,buoyant oil prices and surging Chinese demandfor raw materials combined to push the re-gion-wide average to not far shy of 6%, the GreatRecession of 2008-2009 notwithstanding.
A modest recovery to 2.2% is projected by theIMF for this year – from 1.4% in 2016. These com-paratively low headline figures are hardly nour-ishing the “Africa Rising” narrative.
However we should bear in mind that highlyaggregated numbers often hide more than theyreveal. Africa, we need to keep reminding our-selves, is not one country. Economies like Nigeriaand Angola that have come to rely excessively onoil exports may be hurting.
Others like Kenya, Tanzania, Uganda andRwanda in the east and Senegal and Côted’Ivoire in the west, are growing at morethan respectable rates. Indeed, those sameIMF projections have Ghana – fresh off itsseventh consecutive peaceful election sinceindependence – projected as the third-fastestgrowingmarket in theworld in 2018 at 9.2%. The
oil exporters are getting the message as neverbefore: they have no choice but to diversify.
We also need to be clear that Africa’s rise willbe anything but seamless, uniform, swift or pain-less. While urbanisation can revolutionise econ-omies, managed badly it can create cauldrons ofpoverty, violence and revolution.
Managing it well, while critically important,is not a sufficient condition for the region’s take-off. The single largest constraint is the historicalcurse of economic Balkanisation.
De-fragmenting the continent’s economiesinto a single market for goods, services, skillsand innovation remains a distant dream for now,but at least it is a shared one and firmly on theagenda.
On a sub-regional basis it is starting to be real-ised, its benefits demonstrated vividly by the EastAfrican Community.
What is most encouraging, though, is that Af-rica now has a partner with the resources, motiva-tion and will to finance the infrastructure neededto connect and power the continent and its cities.
That partner is China, whose government,state-owned and private businesses and entrepre-neurs now see Africa not just as a source of rawmaterials, but, much more importantly, as a vastnew market and low-cost manufacturing base forChinese products.
For this to be Africa’s century, African econ-omies must be connected and diversified. Invest-ment patterns give hope we are headed in theright direction. As Marcelo Giugale suggests, timeto buy in Nairobi.
Rosa Whitaker is president and CEO of The Whita-ker Group and a leading expert on African trade,investment and business. She was Assistant US TradeRepresentative for Africa in the administrations ofpresidents William J. Clinton and George W. Bush.
thisisafricaonline.com
Investors areencouraged by thesight of “cranesdotting the skylines”of Africa’s cities
THE AFRICA INVESTMENT REPORT 2017 AFRICA REGIONAL TRENDS4
Africa regionaltrends and data ALGERIAMOROCCO
+13% +42%
EGYPT
+15%
ETHIOPIA
GHANA
CÔTE D’IVOIRE
NIGERIA
+27%
SOUTH AFRICA
KENYA
+60%TUNISIA
TANZANIA
-41%
-55%
-5%
-4%
-35%
-19%
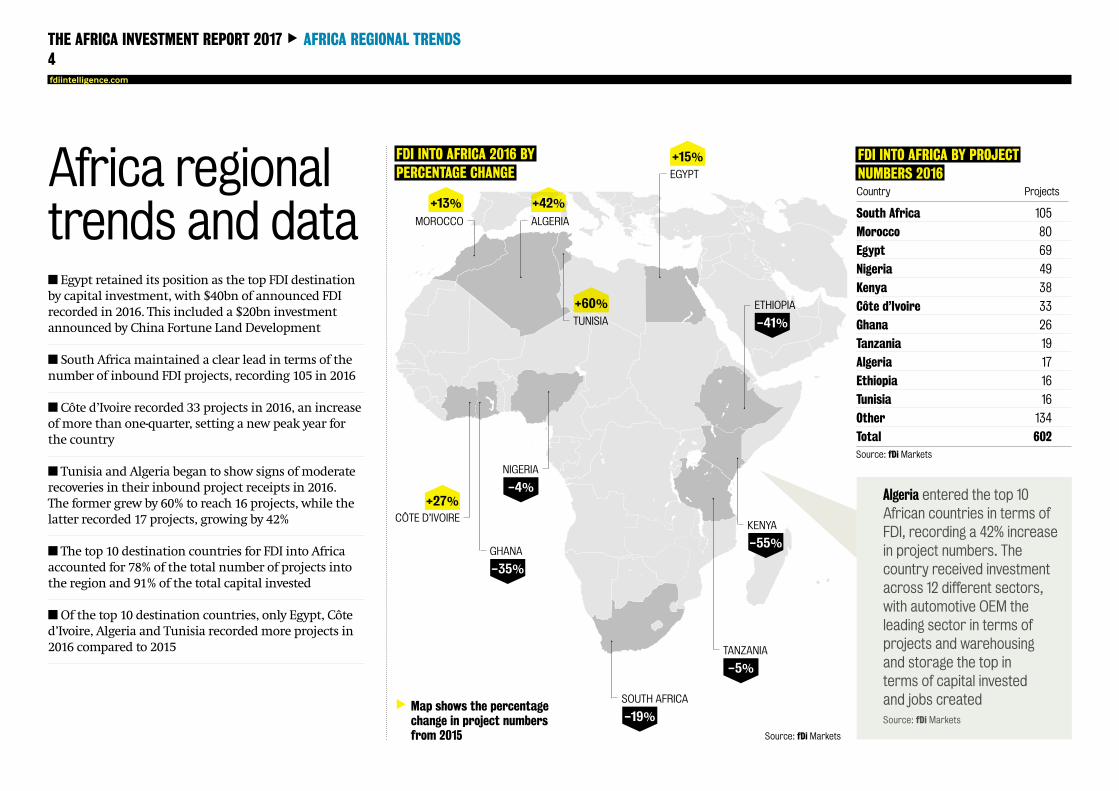
FDI INTO AFRICA 2016 BYPERCENTAGE CHANGE
Map shows the percentagechange in project numbersfrom 2015 Source: fDi Markets
FDI INTO AFRICA BY PROJECTNUMBERS 2016
South Africa 105
Morocco 80
Egypt 69
Nigeria 49
Kenya 38
Côte d’Ivoire 33
Ghana 26
Tanzania 19
Algeria 17
Ethiopia 16
Tunisia 16
Other 134
Total 602
Country Projects
Source: fDi Markets
n Egypt retained its position as the top FDI destinationby capital investment, with $40bn of announced FDIrecorded in 2016. This included a $20bn investmentannounced by China Fortune Land Development
n South Africamaintained a clear lead in terms of thenumber of inbound FDI projects, recording 105 in 2016
n Côte d’Ivoire recorded 33 projects in 2016, an increaseof more than one-quarter, setting a new peak year forthe country
n Tunisia and Algeria began to show signs ofmoderaterecoveries in their inbound project receipts in 2016.The former grew by 60% to reach 16 projects, while thelatter recorded 17 projects, growing by 42%
n The top 10 destination countries for FDI into Africaaccounted for 78% of the total number of projects intothe region and 91% of the total capital invested
nOf the top 10 destination countries, only Egypt, Côted’Ivoire, Algeria and Tunisia recordedmore projects in2016 compared to 2015
Algeria entered the top 10African countries in terms ofFDI, recording a 42% increasein project numbers. Thecountry received investmentacross 12 different sectors,with automotive OEM theleading sector in terms ofprojects and warehousingand storage the top interms of capital investedand jobs createdSource: fDi Markets
fdiintelligence.com
THE AFRICA INVESTMENT REPORT 2017 AFRICA REGIONAL TRENDS5
FDI INTO AFRICA BY PROJECTNUMBERS 2016
FDI INTO AFRICA BY CAPITALINVESTMENT 2016
INVESTMENT BY REGION 2016**
Egypt 40.0 173% 43%
Algeria 7.4 876% 8%
South Africa 7.0 51% 8%
Ethiopia 6.8 296% 7%
Morocco 6.6 52% 7%
Mozambique 6.3 23% 7%
Nigeria 6.2 -25% 7%
Tanzania 1.8 38% 2%
Kenya 1.1 -55% 1%
Rwanda 0.9 -20% 1%
Other 8.1 -63% 9%
North Africa 184 54.3
East Africa 143 19.4
West Africa 135 9.0
Southern Africa 112 7.9
Central Africa 28 1.5
Country Capex Change Market($bn) from 2015 share
Region Projects Capex($bn)*
Source: fDi Markets*Includes estimates
Source: fDi Markets*Includes estimates**Regions are based on United Nations classification
Spotlight on EgyptIn 2017, Egypt’s oil minister, Tarek El-Molla,
announced that Egypt plans to boost itsoil output by 50% by the end of 2018. Thisfollowed $4.2bn of investment in the coal, oiland natural gas sector in 2016.Source: Egypt Oil & Gas
EniSpA announced plans to invest $10bnin Egypt in the next five years. This followsa $1.5bn investment in 2016 to explore thepotential oil and gas field at Zohr, which isdue to start production by the end of 2017Sources: Egypt Independent; fDiMarkets
In 2016, Egypt announced a series ofeconomic and financial reforms in orderto attract further foreign investment andrestore investor confidence after the 2011Arab Spring revolution. This included thefloatation of the Egyptian pound to ease ashortage of dollars in the economySource: BBC News
The real estate sector in Egypt has grownsignificantly in recent years – by 18% in 2015-2016, and on average by 16% per annumbetween 2011-2012 and 2015-2016Source: Ministry of Planning, Egypt
Egypt’s construction and building GDPhas increased significantly in recent years,by 22% in 2015-2016, and on average by20% per annum between 2011-2012 and2015-2016Source: Ministry of Planning, Egypt
thisisafricaonline.com
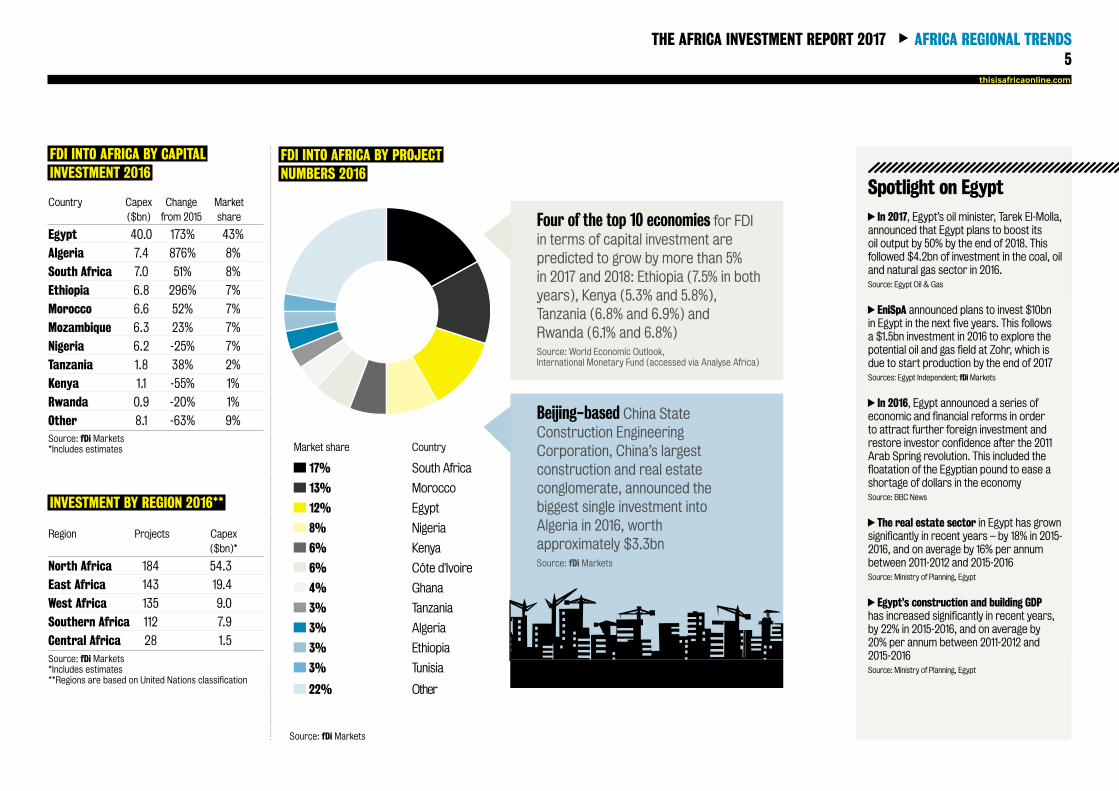
Four of the top 10 economies for FDIin terms of capital investment arepredicted to grow by more than 5%in 2017 and 2018: Ethiopia (7.5% in bothyears), Kenya (5.3% and 5.8%),Tanzania (6.8% and 6.9%) andRwanda (6.1% and 6.8%)Source: World Economic Outlook,International Monetary Fund (accessed via Analyse Africa)
Beijing-based China StateConstruction EngineeringCorporation, China’s largestconstruction and real estateconglomerate, announced thebiggest single investment intoAlgeria in 2016, worthapproximately $3.3bnSource: fDi Markets
Market share Country
17% South Africa
13% Morocco
12% Egypt
8% Nigeria
6% Kenya
6% Côte d'Ivoire
4% Ghana
3% Tanzania
3% Algeria
3% Ethiopia
3% Tunisia
22% Other
Source: fDi Markets
6
Sourcecountries
THE AFRICA INVESTMENT REPORT 2017 SOURCE COUNTRIES
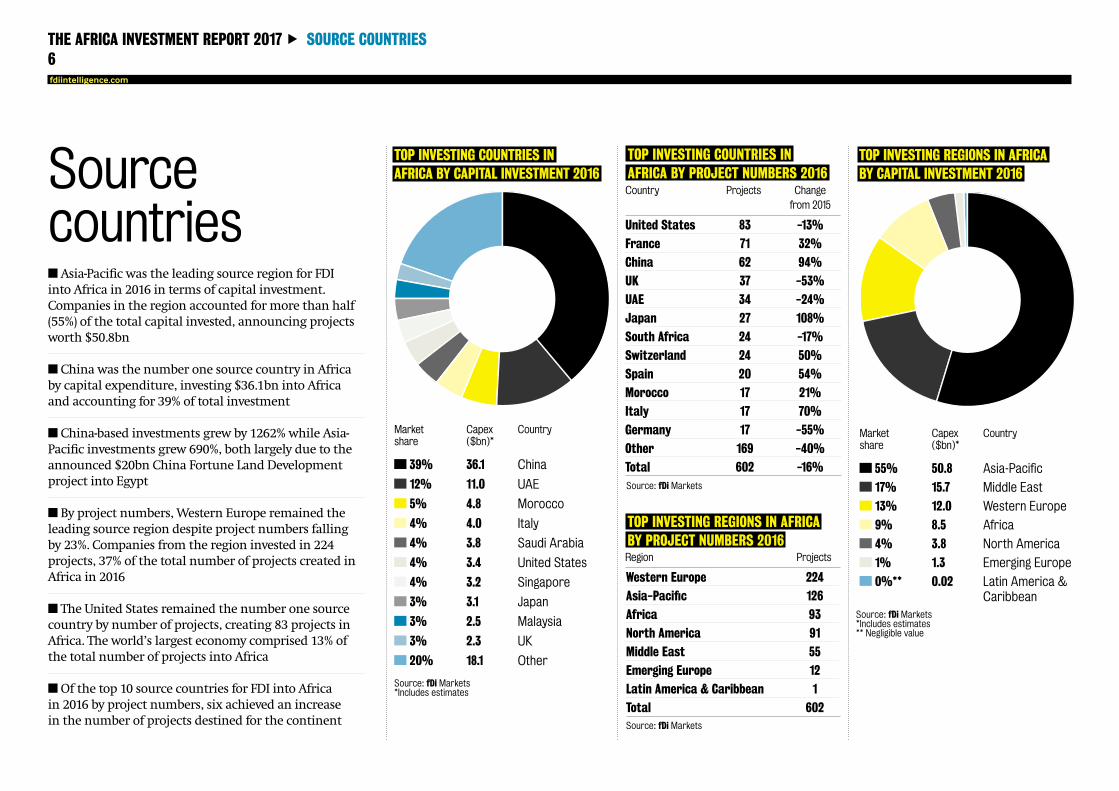
TOP INVESTING COUNTRIES INAFRICA BY PROJECT NUMBERS 2016
United States 83 -13%
France 71 32%
China 62 94%
UK 37 -53%
UAE 34 -24%
Japan 27 108%
South Africa 24 -17%
Switzerland 24 50%
Spain 20 54%
Morocco 17 21%
Italy 17 70%
Germany 17 -55%
Other 169 -40%
Total 602 -16%
Country Projects Changefrom 2015
Source: fDi Markets
TOP INVESTING REGIONS IN AFRICABY PROJECT NUMBERS 2016
Western Europe 224
Asia-Pacific 126
Africa 93
North America 91
Middle East 55
Emerging Europe 12
Latin America & Caribbean 1
Total 602
Region Projects
Source: fDi Markets
TOP INVESTING REGIONS IN AFRICABY CAPITAL INVESTMENT 2016
n Asia-Pacific was the leading source region for FDIinto Africa in 2016 in terms of capital investment.Companies in the region accounted for more than half(55%) of the total capital invested, announcing projectsworth $50.8bn
n China was the number one source country in Africaby capital expenditure, investing $36.1bn into Africaand accounting for 39% of total investment
n China-based investments grew by 1262% while Asia-Pacific investments grew 690%, both largely due to theannounced $20bn China Fortune Land Developmentproject into Egypt
n By project numbers, Western Europe remained theleading source region despite project numbers fallingby 23%. Companies from the region invested in 224projects, 37% of the total number of projects created inAfrica in 2016
n The United States remained the number one sourcecountry by number of projects, creating 83 projects inAfrica. The world’s largest economy comprised 13% ofthe total number of projects into Africa
nOf the top 10 source countries for FDI into Africain 2016 by project numbers, six achieved an increasein the number of projects destined for the continent
TOP INVESTING COUNTRIES INAFRICA BY CAPITAL INVESTMENT 2016
Source: fDi Markets*Includes estimates
Source: fDi Markets*Includes estimates** Negligible value
fdiintelligence.com
Marketshare
Capex($bn)*
Country
39% 36.1 China
12% 11.0 UAE
5% 4.8 Morocco
4% 4.0 Italy
4% 3.8 Saudi Arabia
4% 3.4 United States
4% 3.2 Singapore
3% 3.1 Japan
3% 2.5 Malaysia
3% 2.3 UK
20% 18.1 Other
Marketshare
Capex($bn)*
Country
55% 50.8 Asia-Pacific
17% 15.7 Middle East
13% 12.0 Western Europe
9% 8.5 Africa
4% 3.8 North America
1% 1.3 Emerging Europe
0%** 0.02 Latin America &Caribbean
7THE AFRICA INVESTMENT REPORT 2017 IN FOCUS: CHINA IN AFRICA
thisisafricaonline.com
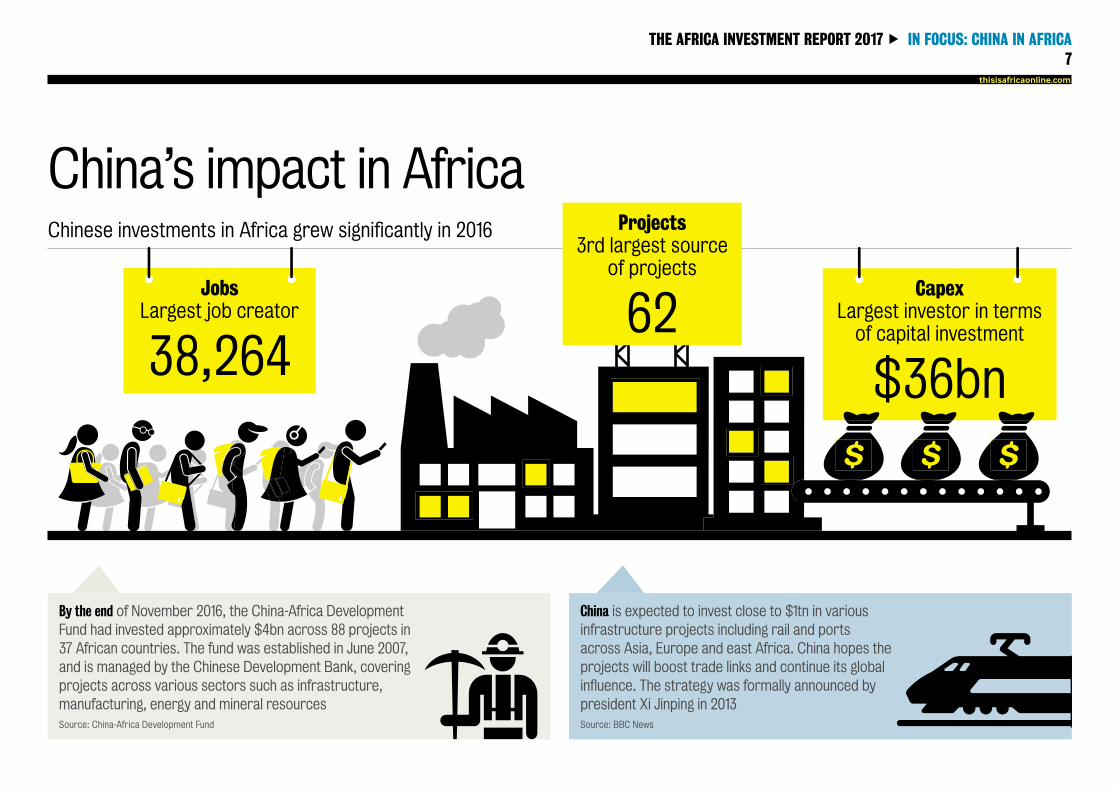
JobsLargest job creator
38,264
By the end of November 2016, the China-Africa DevelopmentFund had invested approximately $4bn across 88 projects in37 African countries. The fund was established in June 2007,and is managed by the Chinese Development Bank, coveringprojects across various sectors such as infrastructure,manufacturing, energy and mineral resourcesSource: China-Africa Development Fund
China is expected to invest close to $1tn in variousinfrastructure projects including rail and portsacross Asia, Europe and east Africa. China hopes theprojects will boost trade links and continue its globalinfluence. The strategy was formally announced bypresident Xi Jinping in 2013Source: BBC News
China’s impact in AfricaChinese investments in Africa grew significantly in 2016
CapexLargest investor in terms
of capital investment
$36bn
Projects3rd largest source
of projects
62
THE AFRICA INVESTMENT REPORT 2017 BUSINESS ACTIVITIES8fdiintelligence.com
Businessactivities
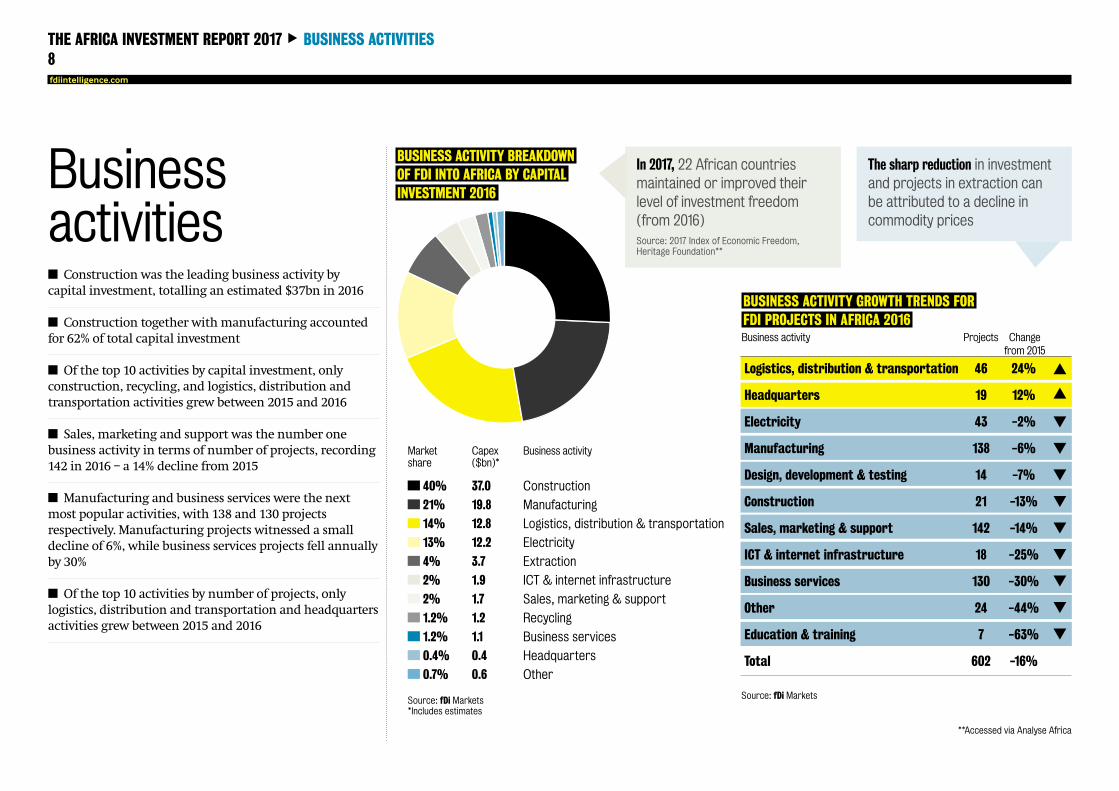
BUSINESS ACTIVITY BREAKDOWNOF FDI INTO AFRICA BY CAPITALINVESTMENT 2016
Source: fDi Markets*Includes estimates
BUSINESS ACTIVITY GROWTH TRENDS FORFDI PROJECTS IN AFRICA 2016
Logistics, distribution & transportation 46 24%
Headquarters 19 12%
Electricity 43 -2%
Manufacturing 138 -6%
Design, development & testing 14 -7%
Construction 21 -13%
Sales, marketing & support 142 -14%
ICT & internet infrastructure 18 -25%
Business services 130 -30%
Other 24 -44%
Education & training 7 -63%
Total 602 -16%
Business activity Projects Changefrom 2015
Source: fDi Markets
n Construction was the leading business activity bycapital investment, totalling an estimated $37bn in 2016
n Construction together withmanufacturing accountedfor 62% of total capital investment
n Of the top 10 activities by capital investment, onlyconstruction, recycling, and logistics, distribution andtransportation activities grew between 2015 and 2016
n Sales, marketing and support was the number onebusiness activity in terms of number of projects, recording142 in 2016 – a 14% decline from 2015
n Manufacturing and business services were the nextmost popular activities, with 138 and 130 projectsrespectively. Manufacturing projects witnessed a smalldecline of 6%, while business services projects fell annuallyby 30%
n Of the top 10 activities by number of projects, onlylogistics, distribution and transportation and headquartersactivities grew between 2015 and 2016
The sharp reduction in investmentand projects in extraction canbe attributed to a decline incommodity prices
In 2017, 22 African countriesmaintained or improved theirlevel of investment freedom(from 2016)Source: 2017 Index of Economic Freedom,Heritage Foundation**
**Accessed via Analyse Africa
Marketshare
Capex($bn)*
Business activity
40% 37.0 Construction
21% 19.8 Manufacturing
14% 12.8 Logistics, distribution & transportation
13% 12.2 Electricity
4% 3.7 Extraction
2% 1.9 ICT & internet infrastructure
2% 1.7 Sales, marketing & support
1.2% 1.2 Recycling
1.2% 1.1 Business services
0.4% 0.4 Headquarters
0.7% 0.6 Other
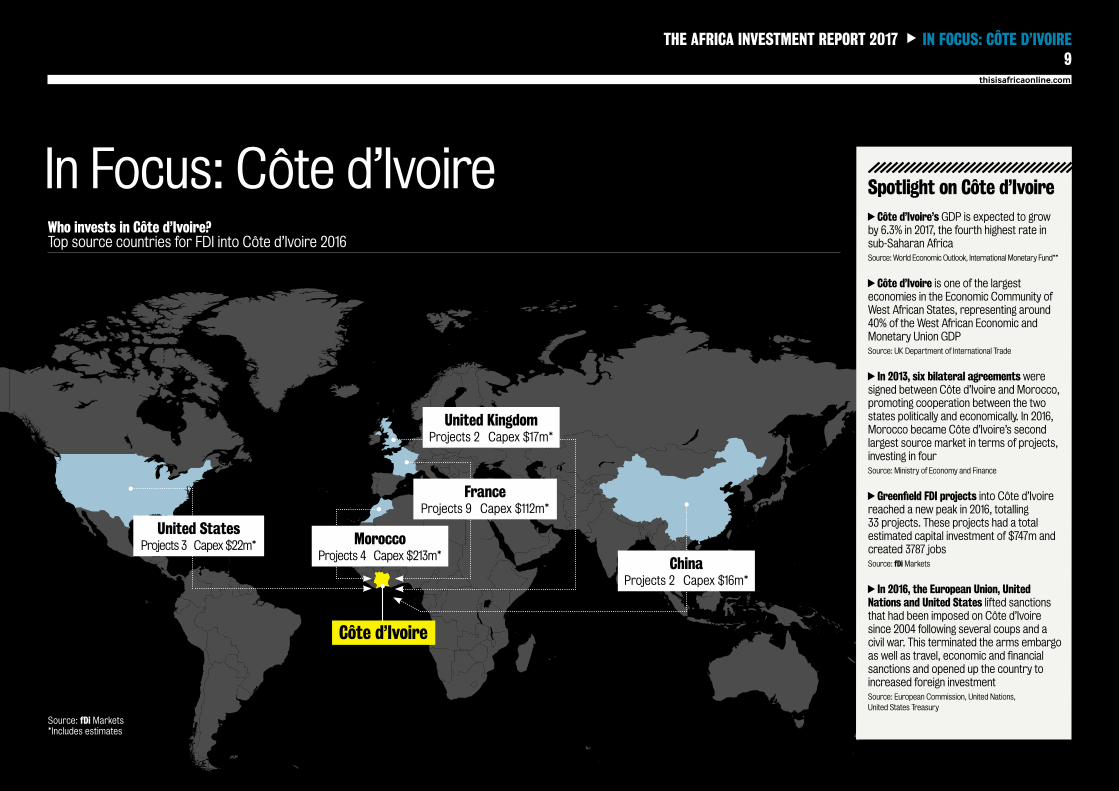
MoroccoProjects 4 Capex $213m*
United StatesProjects 3 Capex$22m*
Côte d’Ivoire
United KingdomProjects 2 Capex $17m*
FranceProjects 9 Capex $112m*
ChinaProjects 2 Capex $16m*
9thisisafricaonline.com
In Focus: Côte d’Ivoire
THE AFRICA INVESTMENT REPORT 2017 IN FOCUS: CÔTE D’IVOIRE
Who invests in Côte d’Ivoire?Top source countries for FDI into Côte d’Ivoire 2016
Source: fDi Markets*Includes estimates
Spotlight on Côte d’IvoireCôte d’Ivoire’s GDP is expected to grow
by 6.3% in 2017, the fourth highest rate insub-Saharan AfricaSource:World EconomicOutlook, InternationalMonetary Fund**
Côte d’Ivoire is one of the largesteconomies in the Economic Community ofWest African States, representing around40% of the West African Economic andMonetary Union GDPSource: UK Department of International Trade
In 2013, six bilateral agreementsweresigned between Côte d’Ivoire and Morocco,promoting cooperation between the twostates politically and economically. In 2016,Morocco became Côte d’Ivoire’s secondlargest source market in terms of projects,investing in fourSource: Ministry of Economy and Finance
Greenfield FDI projects into Côte d’Ivoirereached a new peak in 2016, totalling33 projects. These projects had a totalestimated capital investment of $747m andcreated 3787 jobsSource: fDiMarkets
In 2016, the European Union, UnitedNations and United States lifted sanctionsthat had been imposed on Côte d’Ivoiresince 2004 following several coups and acivil war. This terminated the arms embargoas well as travel, economic and financialsanctions and opened up the country toincreased foreign investmentSource: European Commission, United Nations,United States Treasury
THE AFRICA INVESTMENT REPORT 2017 SECTORS10fdiintelligence.com
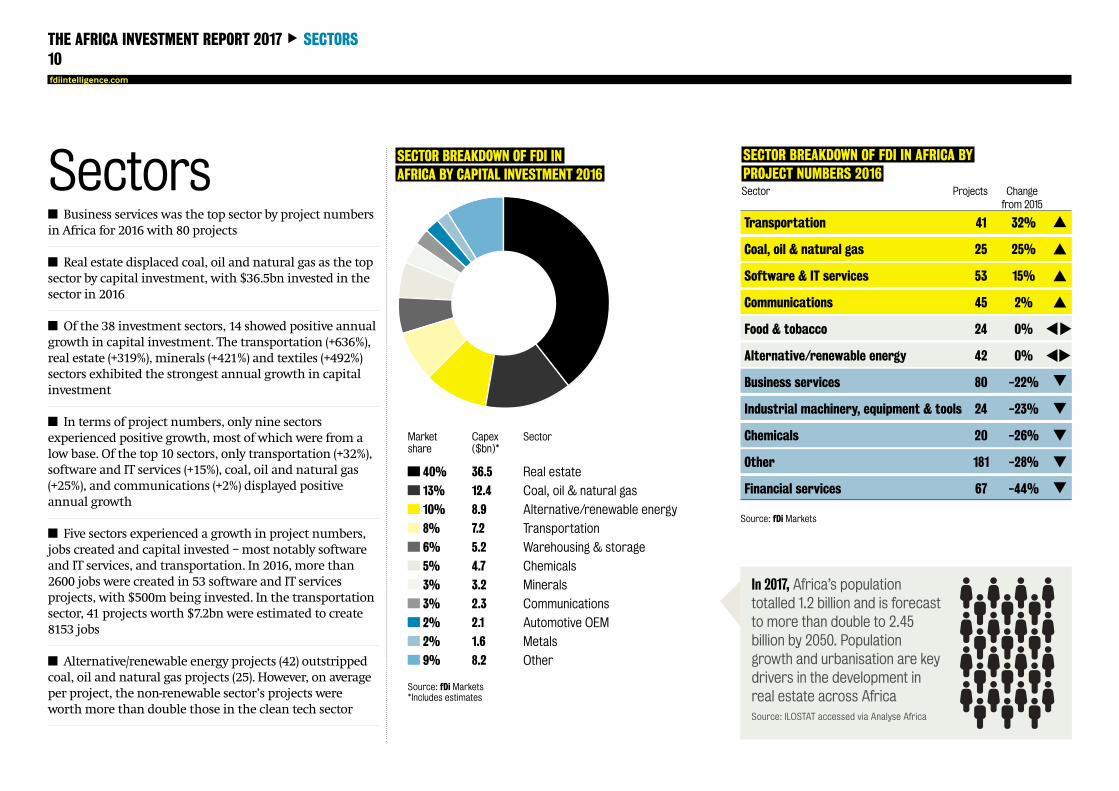
Sectorsn Business services was the top sector by project numbersin Africa for 2016 with 80 projects
n Real estate displaced coal, oil and natural gas as the topsector by capital investment, with $36.5bn invested in thesector in 2016
n Of the 38 investment sectors, 14 showed positive annualgrowth in capital investment. The transportation (+636%),real estate (+319%), minerals (+421%) and textiles (+492%)sectors exhibited the strongest annual growth in capitalinvestment
n In terms of project numbers, only nine sectorsexperienced positive growth, most of which were from alow base. Of the top 10 sectors, only transportation (+32%),software and IT services (+15%), coal, oil and natural gas(+25%), and communications (+2%) displayed positiveannual growth
n Five sectors experienced a growth in project numbers,jobs created and capital invested –most notably softwareand IT services, and transportation. In 2016, more than2600 jobs were created in 53 software and IT servicesprojects, with $500m being invested. In the transportationsector, 41 projects worth $7.2bn were estimated to create8153 jobs
n Alternative/renewable energy projects (42) outstrippedcoal, oil and natural gas projects (25). However, on averageper project, the non-renewable sector’s projects wereworthmore than double those in the clean tech sector
SECTOR BREAKDOWN OF FDI INAFRICA BY CAPITAL INVESTMENT 2016
Source: fDi Markets*Includes estimates
Marketshare
Capex($bn)*
Sector
40% 36.5 Real estate
13% 12.4 Coal, oil & natural gas
10% 8.9 Alternative/renewable energy
8% 7.2 Transportation
6% 5.2 Warehousing & storage
5% 4.7 Chemicals
3% 3.2 Minerals
3% 2.3 Communications
2% 2.1 Automotive OEM
2% 1.6 Metals
9% 8.2 Other
SECTOR BREAKDOWN OF FDI IN AFRICA BYPROJECT NUMBERS 2016Sector Projects Change
from 2015
Transportation 41 32%
Coal, oil & natural gas 25 25%
Software & IT services 53 15%
Communications 45 2%
Food & tobacco 24 0%
Alternative/renewable energy 42 0%
Business services 80 -22%
Industrial machinery, equipment & tools 24 -23%
Chemicals 20 -26%
Other 181 -28%
Financial services 67 -44%
Source: fDi Markets
In 2017, Africa’s populationtotalled 1.2 billion and is forecastto more than double to 2.45billion by 2050. Populationgrowth and urbanisation are keydrivers in the development inreal estate across AfricaSource: ILOSTAT accessed via Analyse Africa
$426m
$316m
THE AFRICA INVESTMENT REPORT 2017 SECTORS11
thisisafricaonline.com
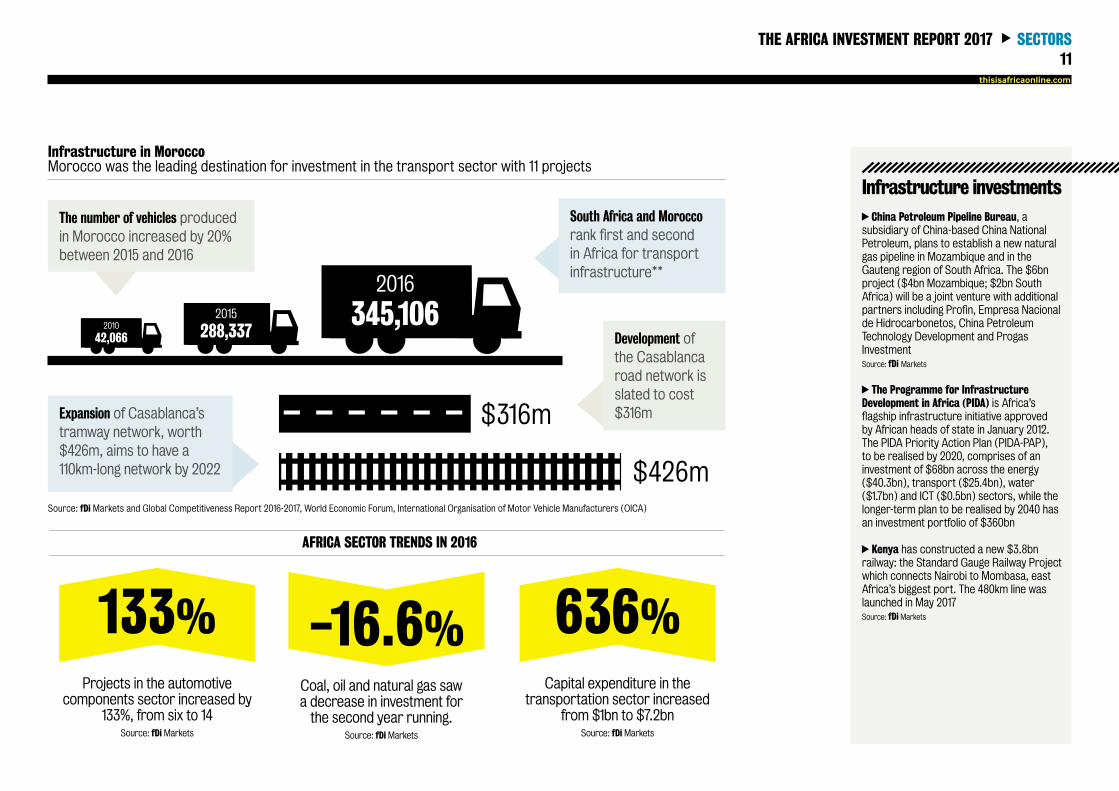
AFRICA SECTOR TRENDS IN 2016
Capital expenditure in thetransportation sector increased
from $1bn to $7.2bnSource: fDiMarkets
636%Coal, oil and natural gas sawa decrease in investment forthe second year running.
Source: fDiMarkets
-16.6%
Source: fDi Markets and Global Competitiveness Report 2016-2017, World Economic Forum, International Organisation of Motor Vehicle Manufacturers (OICA)
Development ofthe Casablancaroad network isslated to cost$316m
Infrastructure investmentsChina Petroleum Pipeline Bureau, a
subsidiary of China-based China NationalPetroleum, plans to establish a new naturalgas pipeline in Mozambique and in theGauteng region of South Africa. The $6bnproject ($4bn Mozambique; $2bn SouthAfrica) will be a joint venture with additionalpartners including Profin, Empresa Nacionalde Hidrocarbonetos, China PetroleumTechnology Development and ProgasInvestmentSource: fDi Markets
The Programme for InfrastructureDevelopment in Africa (PIDA) is Africa’sflagship infrastructure initiative approvedby African heads of state in January 2012.The PIDA Priority Action Plan (PIDA-PAP),to be realised by 2020, comprises of aninvestment of $68bn across the energy($40.3bn), transport ($25.4bn), water($1.7bn) and ICT ($0.5bn) sectors, while thelonger-term plan to be realised by 2040 hasan investment portfolio of $360bn
Kenya has constructed a new $3.8bnrailway: the Standard Gauge Railway Projectwhich connects Nairobi to Mombasa, eastAfrica’s biggest port. The 480km line waslaunched in May 2017Source: fDiMarkets
Infrastructure in MoroccoMorocco was the leading destination for investment in the transport sector with 11 projects
Expansion of Casablanca’stramway network, worth$426m, aims to have a110km-long network by 2022
The number of vehicles producedin Morocco increased by 20%between 2015 and 2016
2010
42,066
2015
288,337
2016
345,106
South Africa and Moroccorank first and secondin Africa for transportinfrastructure**
Projects in the automotivecomponents sector increased by
133%, from six to 14Source: fDiMarkets
133%
THE AFRICA INVESTMENT REPORT 2017 COMPANIES12fdiintelligence.com
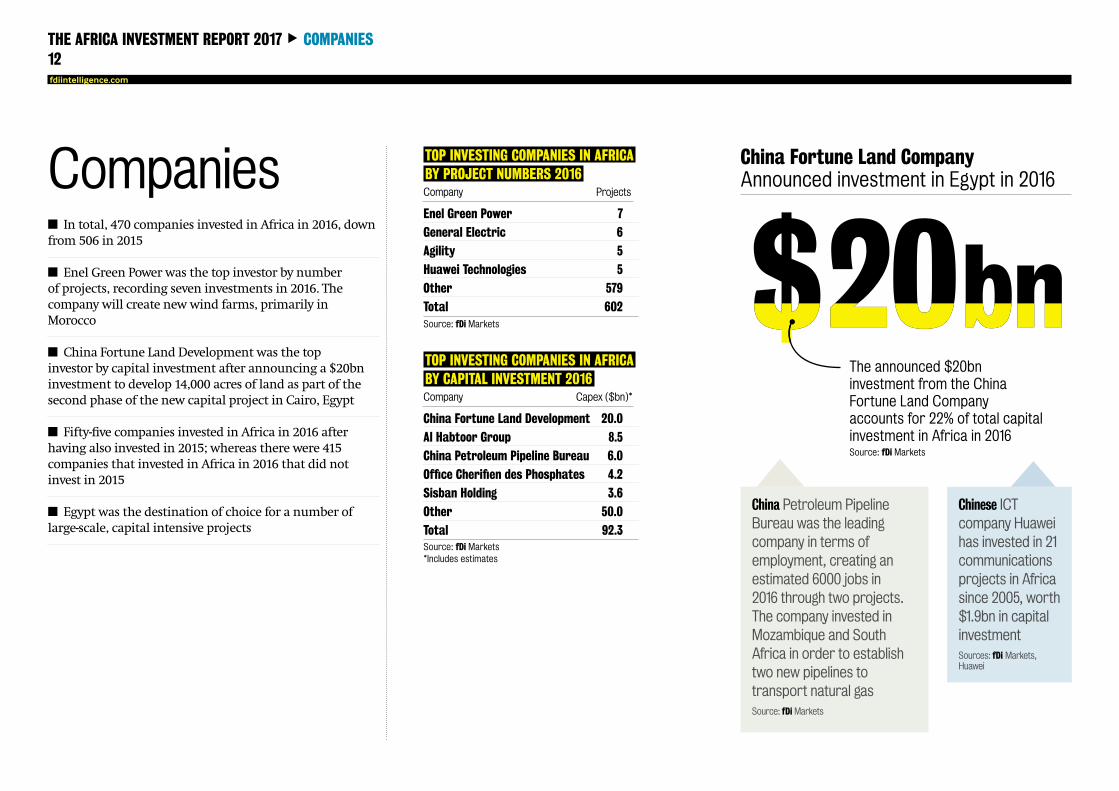
Companiesn In total, 470 companies invested in Africa in 2016, downfrom 506 in 2015
n Enel Green Power was the top investor by numberof projects, recording seven investments in 2016. Thecompany will create newwind farms, primarily inMorocco
n China Fortune Land Development was the topinvestor by capital investment after announcing a $20bninvestment to develop 14,000 acres of land as part of thesecond phase of the new capital project in Cairo, Egypt
n Fifty-five companies invested in Africa in 2016 afterhaving also invested in 2015; whereas there were 415companies that invested in Africa in 2016 that did notinvest in 2015
n Egypt was the destination of choice for a number oflarge-scale, capital intensive projects
TOP INVESTING COMPANIES IN AFRICABY PROJECT NUMBERS 2016
Enel Green Power 7
General Electric 6
Agility 5
Huawei Technologies 5
Other 579
Total 602
Company Projects
Source: fDi Markets
TOP INVESTING COMPANIES IN AFRICABY CAPITAL INVESTMENT 2016
China Fortune Land Development 20.0
Al Habtoor Group 8.5
China Petroleum Pipeline Bureau 6.0
Office Cherifien des Phosphates 4.2
Sisban Holding 3.6
Other 50.0
Total 92.3
Company Capex ($bn)*
Source: fDi Markets*Includes estimates
Chinese ICTcompany Huaweihas invested in 21communicationsprojects in Africasince 2005, worth$1.9bn in capitalinvestmentSources: fDi Markets,Huawei
China Petroleum PipelineBureau was the leadingcompany in terms ofemployment, creating anestimated 6000 jobs in2016 through two projects.The company invested inMozambique and SouthAfrica in order to establishtwo new pipelines totransport natural gasSource: fDiMarkets
China Fortune Land CompanyAnnounced investment in Egypt in 2016
The announced $20bninvestment from the ChinaFortune Land Companyaccounts for 22% of total capitalinvestment in Africa in 2016Source: fDi Markets
The battle for increased infrastructureinvestment in Africa has only begun,and it is one to which public authori-ties, development finance institutions(DFI) and the project finance commu-
nity alike should devote sufficient time and re-sources.
While the population and the cities are grow-ing, electricity generation capacity per capita hasstagnated on the continent. Road density has alsodeclined recently.
Without increased infrastructure spendingover the coming years, it is clear diversificationstrategies will suffer, progress in human develop-ment will come to a halt, and regional integrationwill decline.
Beyond the recent drop in public and privateinvestment growth though, there is some cause foroptimism.
Consider one of the main shifts at work in theinfrastructure investment industry thinking:
One of the greatest needs in African countriesis in the power sector, with only 35% of the popula-tion currently enjoying access to electricity. It hasnot helped that this industry has long thrived onlarge-scale transactions.
But now investors are accommodating smallerprojects in the renewable space because new mod-els are emerging. Governments are building realis-tic procurement strategies.
Tapping into this potential requires a morehands-on approach than many are used to. In-vestment solutions need to be crafted in a ho-listic manner and provide shared benefit for allstakeholders.
Meridiam launched its pan-African fund in2015 based on this new approach. In Senegal, wehave partnered with the national sovereign fundFonsis to tackle energy shortages and take advan-
Financing sustainable infrastructure in Africa byThierry Déau
THE AFRICA INVESTMENT REPORT 2017 VIEWPOINT13
The new ways development institutions aresupporting investors and governments are alsohelping to channel savings into greenfield sustain-able infrastructure. The COP21 agreement in Parison climate change has proved a turning point foremerging economies, with governments eager toimplement their Nationally Determined Contribu-tions (NDCs).
Because there is awill, collectivelywe are away.Inmany countries across Africa, the administrativecapacity to build and deliver on investment pro-grammes is low.
Now most development institutions are awareof this gap in human capital. To address this, theyare directly supporting project preparation andcapacity building by training public sector profes-sionals while developing risk mitigation productsto attract private investors.
Such products leverage existing instruments
tage of the government’s support for low carbonenergy.
Over the past two years, we have developed andfinanced two 30MW photovoltaic plants locatedroughly 100 miles from Dakar. Each plant will pro-vide power for 200,000 inhabitants at a more com-petitive price than that of the country’s thermalpower plant.
These projects are the first of their kind in westAfrica. Senegal has become a leading destinationfor clean energy investment in record time, withmore than 120MWof signed renewable energy pro-duction in the pipeline.
Here the ability to build a union of stakehold-ers mattered just as much as having capital tospend. Input from the local communities andmorein-depth engagement on the part of the contractor,DFIs, private investors and government were key tosuccess.
developed by World Bank Group agency MIGA andOPIC, the US development finance institution.These organisations offer long-term political riskinsurance products that mitigate the risk of loss ofcapital if a government does not honor an obliga-tion.
Other initiatives to go one step further. Theselook to mobilise ‘blended finance’ – using publicand philanthropic capital to crowd in commercialcapital.
In Madagascar, Meridiam was able to workwith a mix of public and private players – includ-ing the International Finance Corporation, theDevelopment Bank of Southern Africa, and theOPEC Fund for International Development – tofinalise a 28-year concession contract with thegovernment of the Republic of Madagascar fortwo airports.
These airports are indispensable for the eco-nomic development of the island country. Financ-ing them required endurance from all the partiesinvolved to invest in one single transaction, whichwas equivalent of 2% of the country’s GDP.
Ultimately, Africa, more than any other con-tinent, requires that we further refine the off-the-shelf approach topublicprivatepartnerships. Theseprojects need local knowledge, good relationshipsand engagement with local stakeholders, backedby strong support of development institutions.
Luckily we are finding that these coalitionsare replicable in a wide range of countries. Thereis a brighter future ahead in Africa as long asall stakeholders learn and remember to worktogether.
Thierry Déau is founding partner and CEO ofMeridiam, a global investor and asset manager specialis-ing in long-term public infrastructure.Follow him on Twitter @ThierryDeau.
thisisafricaonline.com
Africa, more thanany other continent,requires that wefurther refine theoff-the-shelfapproach to publicprivate partnerships
Côted’Ivoire
Mauritius
Tunisia
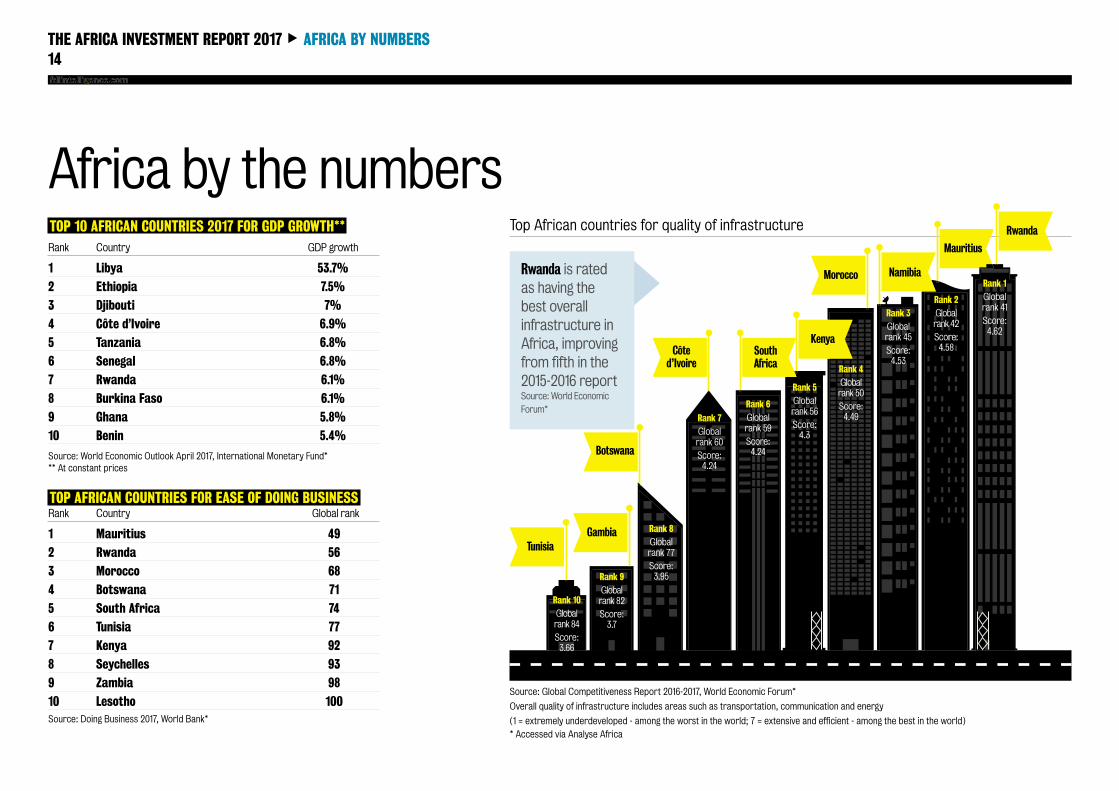
Top African countries for quality of infrastructure Rwanda
NamibiaMorocco
Africa by the numbers
THE AFRICA INVESTMENT REPORT 2017 AFRICA BY NUMBERS14
g
TOP 10 AFRICAN COUNTRIES 2017 FOR GDP GROWTH**
1 Libya 53.7%
2 Ethiopia 7.5%
3 Djibouti 7%
4 Côte d’Ivoire 6.9%
5 Tanzania 6.8%
6 Senegal 6.8%
7 Rwanda 6.1%
8 Burkina Faso 6.1%
9 Ghana 5.8%
10 Benin 5.4%
Rank Country GDP growth
Source: World Economic Outlook April 2017, International Monetary Fund*** At constant prices
TOP AFRICAN COUNTRIES FOR EASE OF DOING BUSINESS
1 Mauritius 49
2 Rwanda 56
3 Morocco 68
4 Botswana 71
5 South Africa 74
6 Tunisia 77
7 Kenya 92
8 Seychelles 93
9 Zambia 98
10 Lesotho 100
Rank Country Global rank
Source: Doing Business 2017, World Bank*
Rwanda is ratedas having thebest overallinfrastructure inAfrica, improvingfrom fifth in the2015-2016 reportSource: World Economic
Forum*
Source: Global Competitiveness Report 2016-2017, World Economic Forum*
Overall quality of infrastructure includes areas such as transportation, communication and energy
(1 = extremely underdeveloped - among the worst in the world; 7 = extensive and efficient - among the best in the world)
* Accessed via Analyse Africa
Rank 1Globalrank 41
Score:4.62
Rank 10Globalrank84
Score:3.66
Kenya
Gambia
Rank 9Globalrank 82
Score:3.7
Rank 5Globalrank 56
Score:4.3
Rank 4Globalrank 50
Score:4.49
Rank 3Globalrank 45
Score:4.53
Rank 2Globalrank42
Score:4.58
Rank 7Globalrank 60
Score:4.24
Botswana
SouthAfrica
Rank 6Globalrank 59
Score:4.24
Rank 8Globalrank 77
Score:3.95
THE AFRICA INVESTMENT REPORT 2017 AFRICA BY NUMBERS15
thisisafricaonline.com
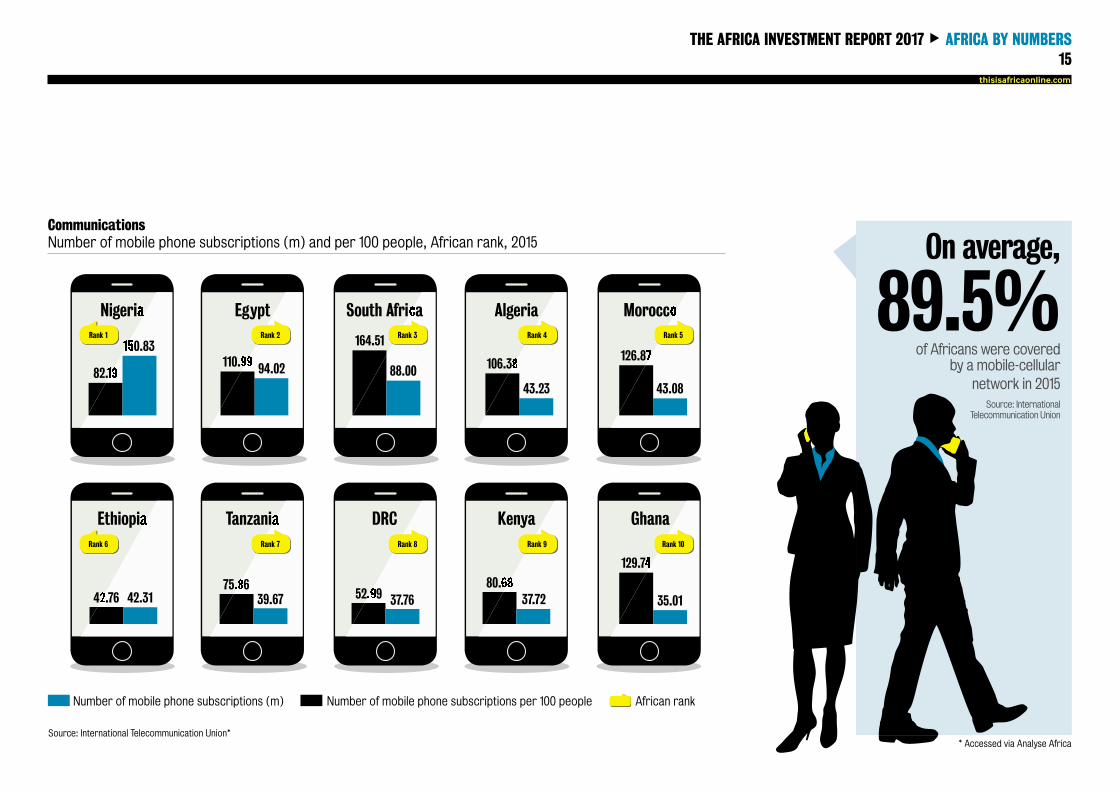
CommunicationsNumber of mobile phone subscriptions (m) and per 100 people, African rank, 2015
Number of mobile phone subscriptions (m) Number of mobile phone subscriptions per 100 people African rank
Source: International Telecommunication Union*
Algeria
Kenya
Morocco
Ghana
South Africa
DRC
Egypt
Tanzania
Nigeria
Ethiopia
82.19
42.76
150.83
42.31
110.99
75.86
94.02
39.67
164.51
52.99
88.00
37.76
106.38
80.68
43.23
37.72
126.87
129.74
43.08
35.01
Rank 1
Rank 6
Rank 2
Rank 7
Rank 3
Rank 8
Rank 4
Rank 9
Rank 5
Rank 10
Number of mobile phone subscriptions (m) Number of mobile phone subscriptions per 100 people African rank
On average,
89.5%of Africans were covered
by a mobile-cellularnetwork in 2015
Source: InternationalTelecommunication Union
* Accessed via Analyse Africa
THE AFRICA INVESTMENT REPORT 2017 INFORMATION16
Published by The Financial Times LtdNumber One Southwark BridgeLondon SE1 9HL© The Financial Times Ltd 2017
For further information, please contact:[email protected]
EditorsAdrienne Klasa – This Is [email protected]+44 (0) 20 7775 6843
Courtney Fingar – fDi [email protected]+44 (0) 20 7775 6365
ContributorsGlenn BarklieJames PattersonRachel Woods
Production editorElliot Smither
DesignParamjit Virdee
This is Africa, a publication from the Financial Times, examines Africanbusiness and politics in a global context, making sense of the relationshipsthat Africa is building with the rest of the world. It challenges internationalpreconceptions about the continent and identifies the opportunities andrisks in this dynamic business environment. For complimentary access toarticles register at: www.thisisAfricaonline.com/register
www.ThisisAfricaonline.com
Analyse Africa, a service from the Financial Times, is a digital data platformwhich aggregates macroeconomic data on Africa’s 54 countries fromleading global sources. Featuring over 2 million+ data records and 5000+indicators it allows fast access to quality checked data. Trend changesare highlighted and explained. Data categories include banking & finance,economic potential, education, environment, foreign direct investment,infrastructure, labour, political stability, social dynamics and trade.
www.AnalyseAfrica.com
fDi Intelligence, a division of the Financial Times, is the largest FDI centreof excellence globally. Specialising in all areas relating to foreigndirect investment and investment promotion, the full suite of servicesincludes: location advertising to generate brand awareness; industry-leading intelligence tools to develop FDI strategies and identify potentialinvestors; and tailored FDI events and investor roundtables to meet targetcompanies and generate business leads.
www.fDiIntelligence.com
About the dataThe report is based on the fDi Markets and Analyse Africa databases from theFinancial Times. fDi Markets tracks greenfield investment projects. It doesnot include mergers and acquisitions or other equity-based or non-equityinvestments. Only new investment projects and significant expansionsof existing projects are included. fDi Markets is the most authoritativesource of intelligence on real investment in the global economy, andthe only source of greenfield investment data that covers all countriesand industries worldwide. Retail projects have been excluded from thisanalysis but are tracked by fDi Markets. The data presented includes FDIprojects that have either been announced or opened by a company. Thedata on capital investment and job creation is based on the investment thecompany is making at the time of the project announcement or opening. Ascompanies can raise capital locally, phase their investment over a periodof time, and can channel their investment through different countries fortax efficiency, the data used in this report is different to the official dataon FDI flows. The data from fDi Markets is more accurate and a real-timeindicator of the real investment companies are making in their overseassubsidiaries. The data shown includes estimates for capital investment andjob creation derived from algorithms (patent pending) when a company
Contributors does not release the information. Note that the investment projectstracked by fDi Markets are being constantly updated and revised basedon new intelligence being received and the underlying algorithms areconstantly improving their accuracy over time. The data presented in thisreport may therefore differ slightly from the real-time data available atwww.fDiMarkets.com
Analyse Africa aggregates macroeconomic data from world renownedsources into one digital data platform. It features over 2 million+ datarecords for 5000+ indicators from 2000 to the most recent yearavailable. The data sources in this report, listed below, were accessed viawww.AnalyseAfrica.com:
Heritage FoundationInternational Labour OrganizationInternational Organisation of Motor Vehicle Manufacturers (OICA)International Monetary FundInternational Telecommunication UnionThe World BankTransparency InternationalWorld Economic Forum
Disclaimer: This report was created using data from the fDi Markets andAnalyse Africa databases. While care has been taken in programming theanalysis and presentation of data, anomalies may occur. The FinancialTimes Ltd accepts no responsibility for the completeness, accuracy orotherwise of the content of the report. The report does not constitute anyform of advice, recommendation, representation or endorsement andis not intended to be relied on in making (or refraining from making) anyspecific investment or other decisions. Appropriate independentadvice should be obtained before making any such decision.
To download a digital copy of the report, please visit:www.ThisisAfricaonline.com/AfricaInvestmentReportwww.fDiIntelligence.com/AfricaInvestmentReport
fdiintelligence.com
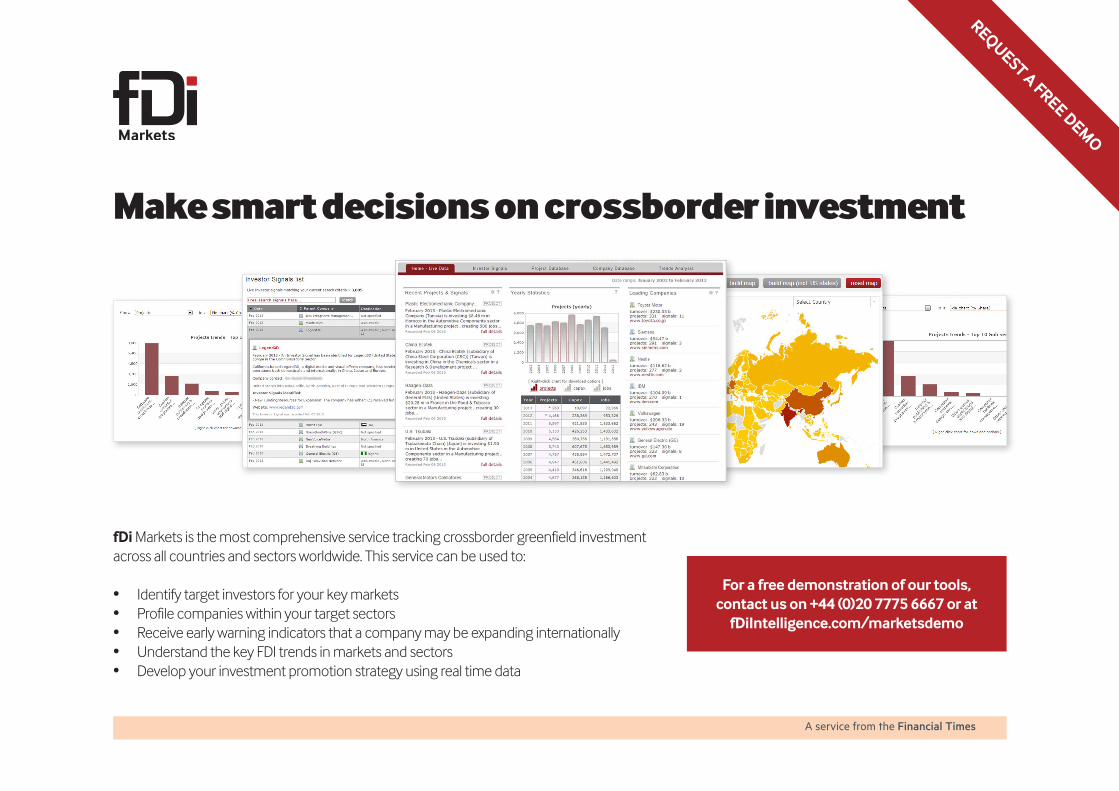
fDi Markets is the most comprehensive service tracking crossborder greenfield investment across all countries and sectors worldwide. This service can be used to:
• Identify target investors for your key markets• Profile companies within your target sectors• Receive early warning indicators that a company may be expanding internationally • Understand the key FDI trends in markets and sectors • Develop your investment promotion strategy using real time data
Make smart decisions on crossborder investment
For a free demonstration of our tools, contact us on +44 (0)20 7775 6667 or at
fDiIntelligence.com/marketsdemo
REQUEST A FREE DEMO