Embed Size (px)
Citation preview
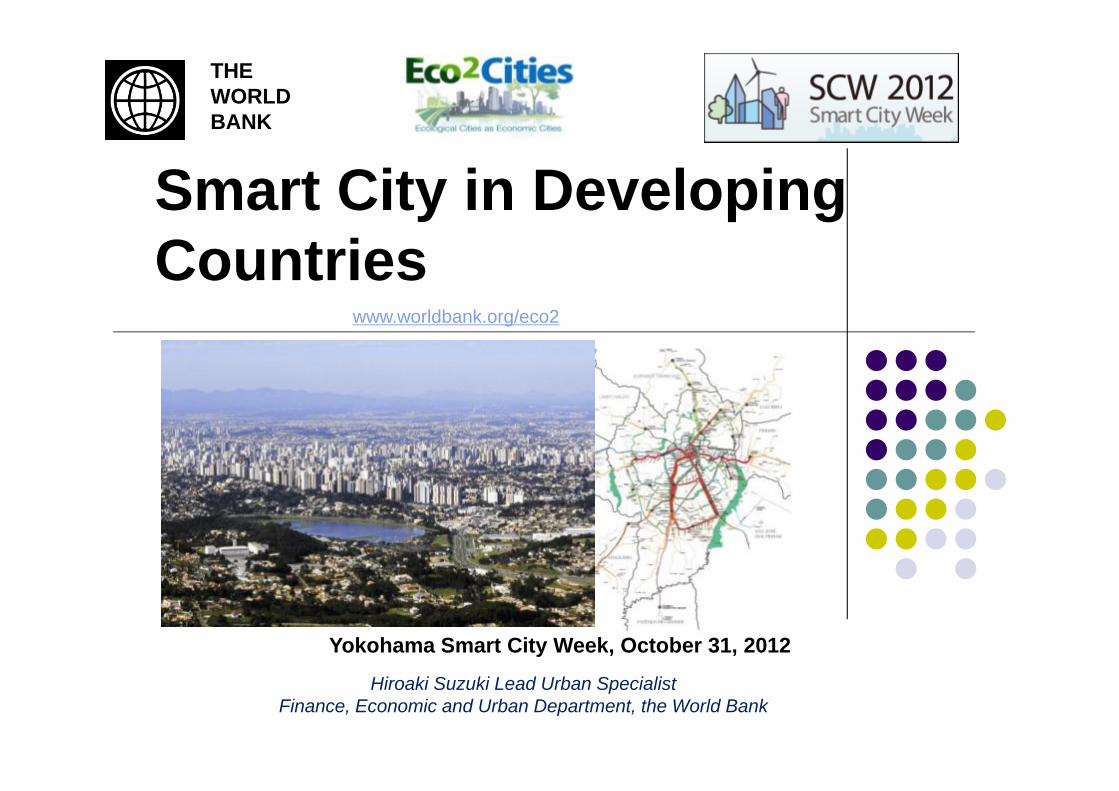
Hiroaki Suzuki Lead Urban SpecialistFinance, Economic and Urban Department, the World Bank
THE WORLD BANK
Yokohama Smart City Week, October 31, 2012
www.worldbank.org/eco2
Smart City in Developing Countries
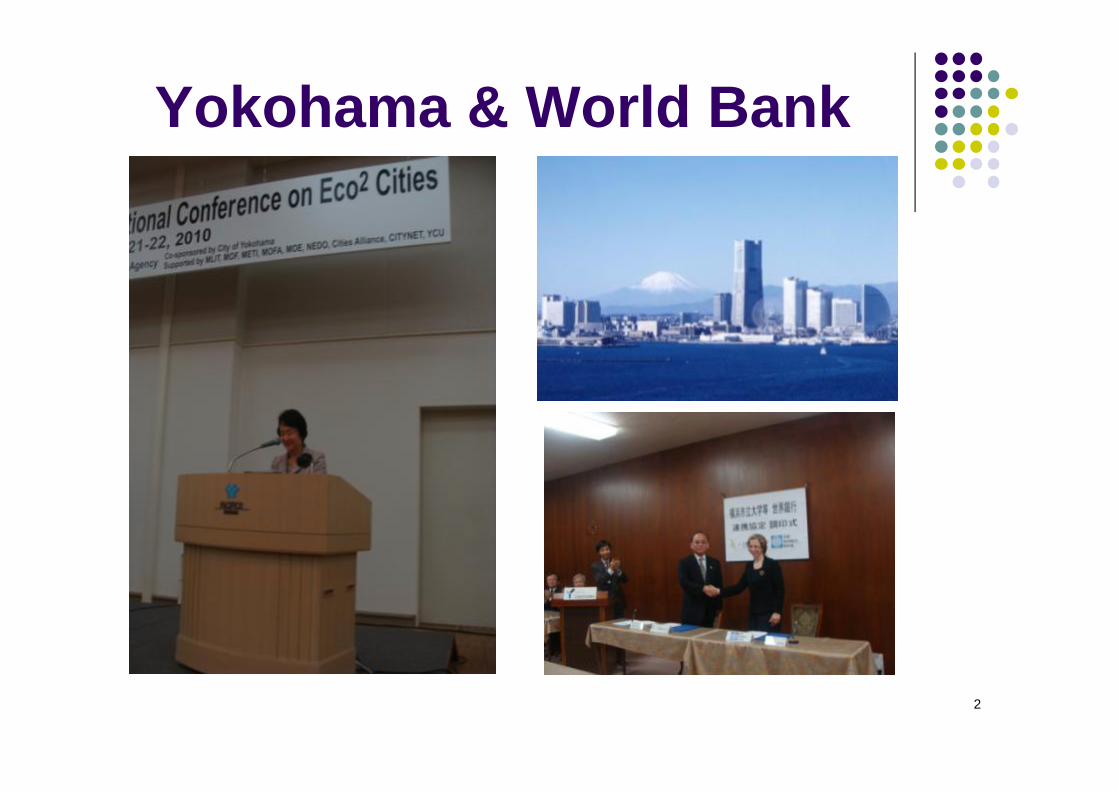
Yokohama & World Bank
2
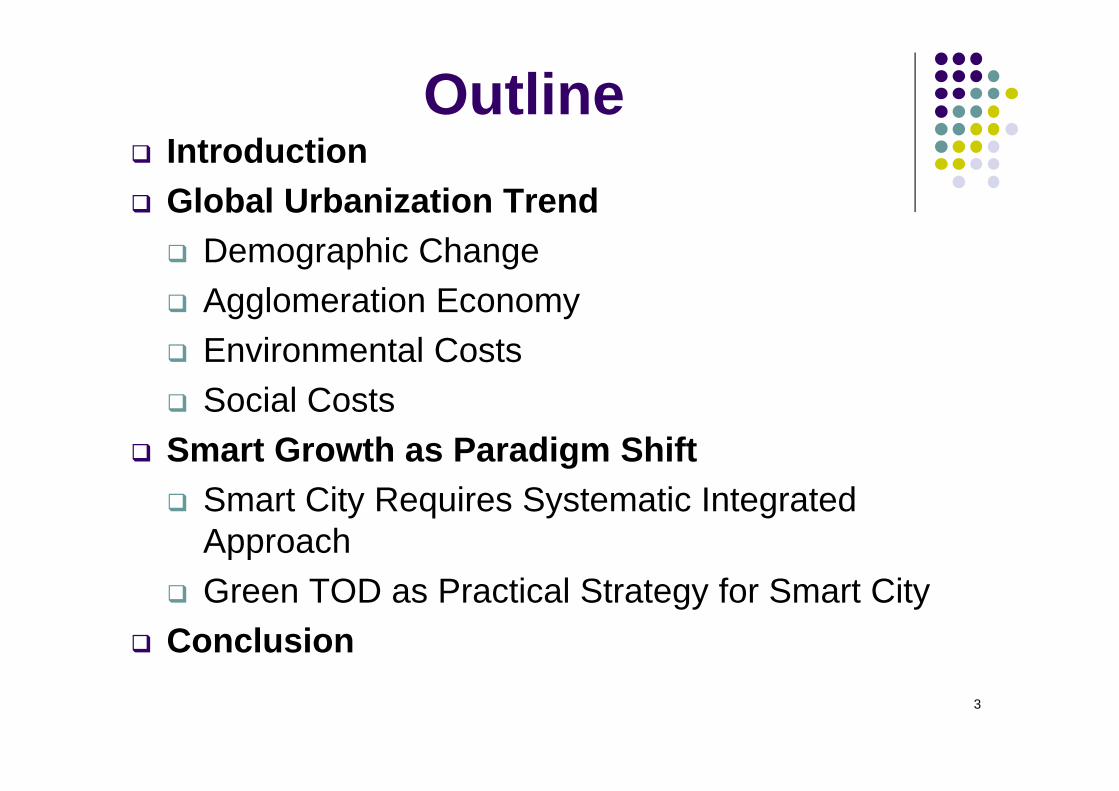
OutlineIntroductionGlobal Urbanization Trend
Demographic ChangeAgglomeration EconomyEnvironmental CostsSocial Costs
Smart Growth as Paradigm ShiftSmart City Requires Systematic Integrated ApproachGreen TOD as Practical Strategy for Smart City
Conclusion 3

Demographic Change: World is urbanizing
4
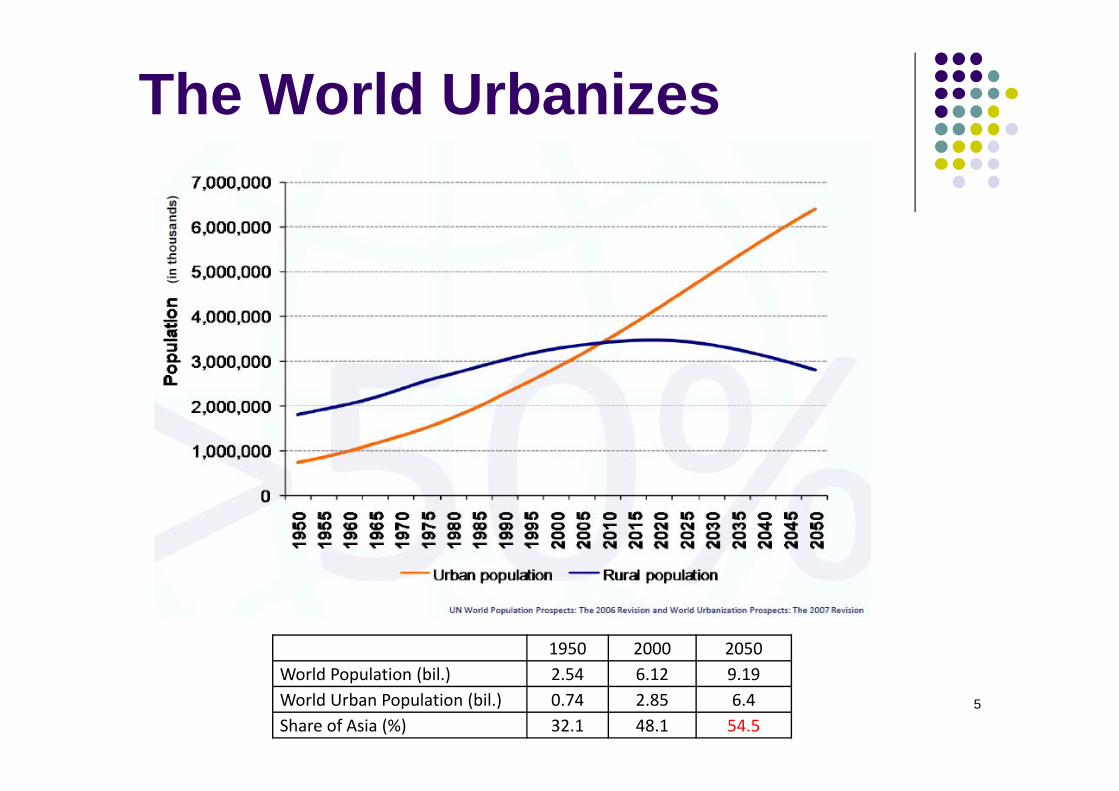
The World Urbanizes
5
1950 2000 2050World Population (bil.) 2.54 6.12 9.19World Urban Population (bil.) 0.74 2.85 6.4Share of Asia (%) 32.1 48.1 54.5
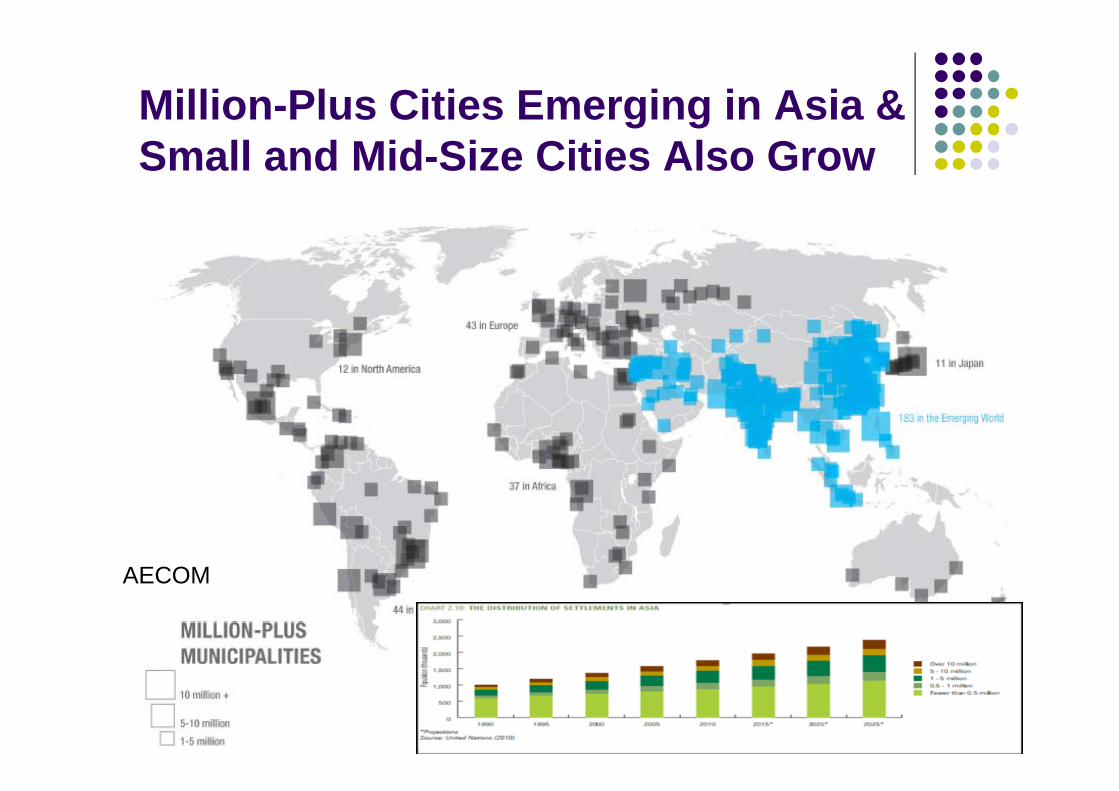
Million-Plus Cities Emerging in Asia & Small and Mid-Size Cities Also Grow
AECOM
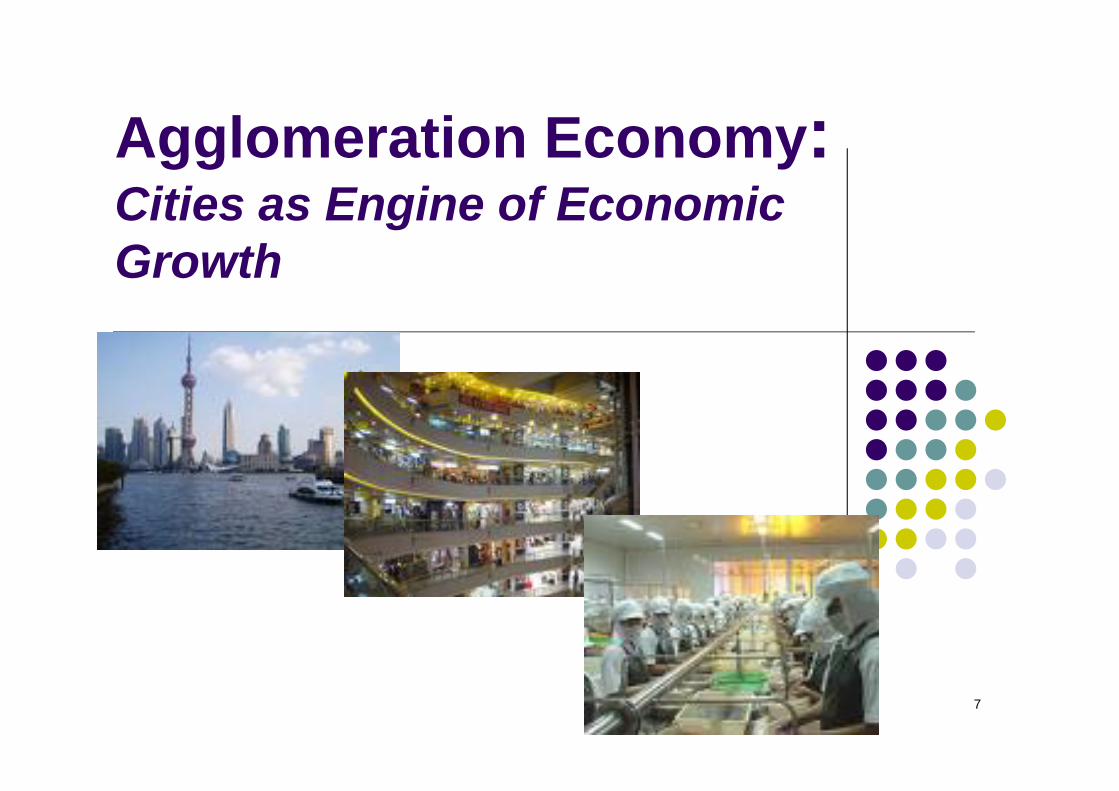
Agglomeration Economy: Cities as Engine of Economic Growth
7

Economic Growth & Urbanization
World Bank World Development Report 2009 8
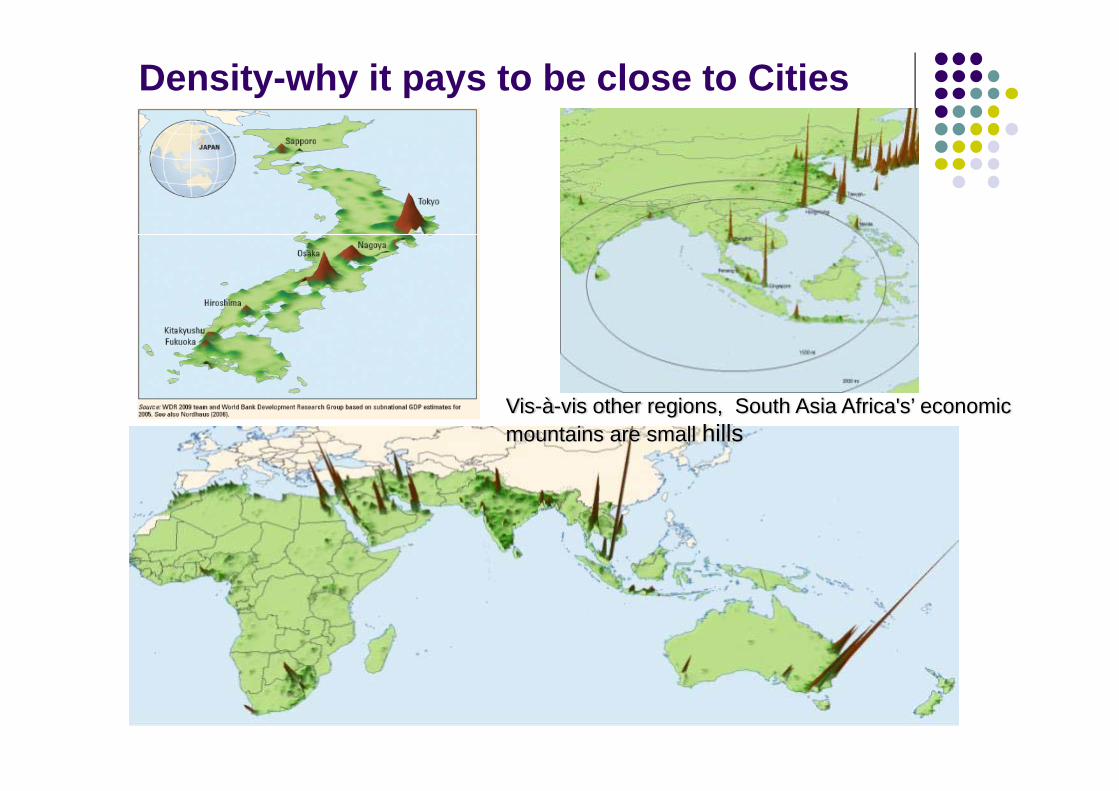
Density-why it pays to be close to Cities
Vis-à-vis other regions, South Asia Africa's’ economic mountains are small hills
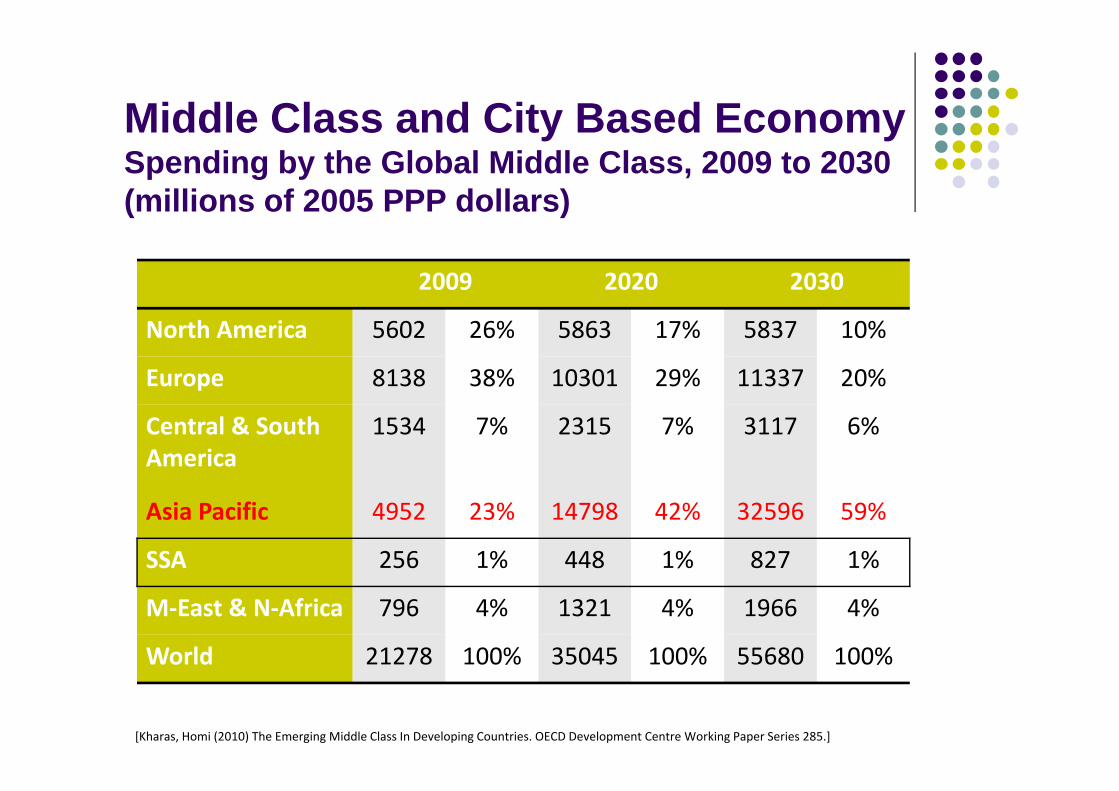
Middle Class and City Based EconomySpending by the Global Middle Class, 2009 to 2030 (millions of 2005 PPP dollars)
2009 2020 2030
North America 5602 26% 5863 17% 5837 10%
Europe 8138 38% 10301 29% 11337 20%
Central & South America
1534 7% 2315 7% 3117 6%
Asia Pacific 4952 23% 14798 42% 32596 59%
SSA 256 1% 448 1% 827 1%
M‐East & N‐Africa 796 4% 1321 4% 1966 4%
World 21278 100% 35045 100% 55680 100%
[Kharas, Homi (2010) The Emerging Middle Class In Developing Countries. OECD Development Centre Working Paper Series 285.]
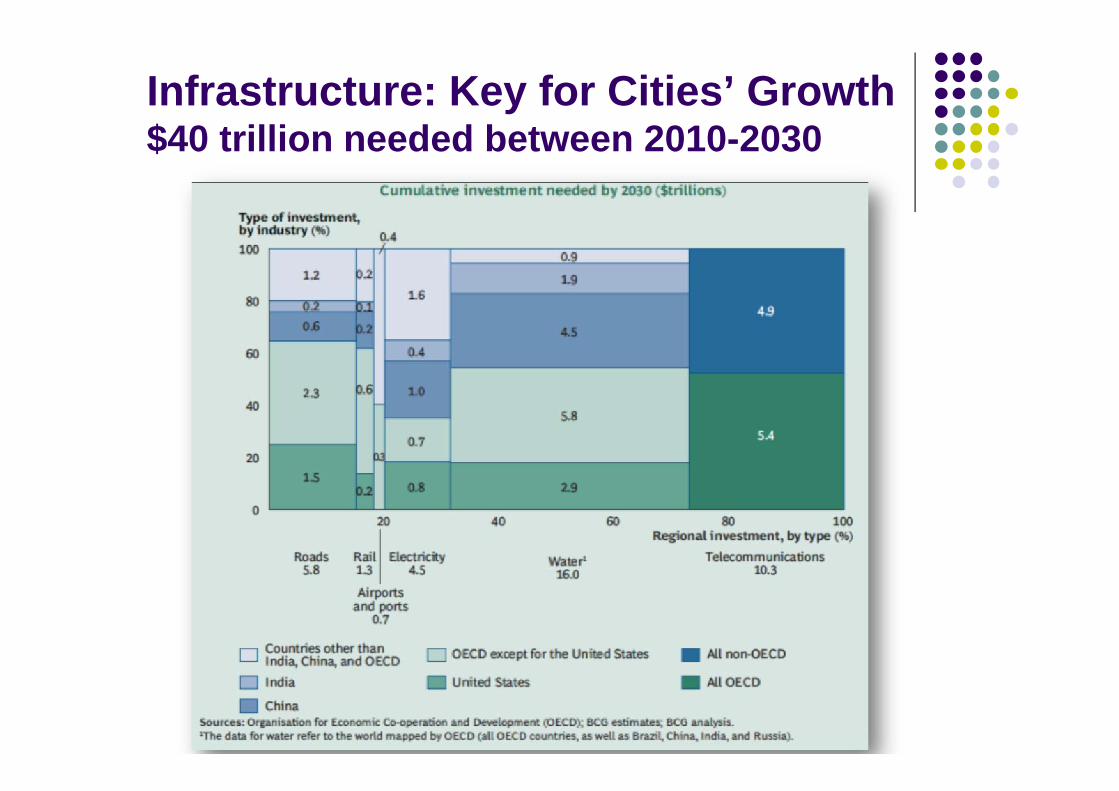
Infrastructure: Key for Cities’ Growth $40 trillion needed between 2010-2030
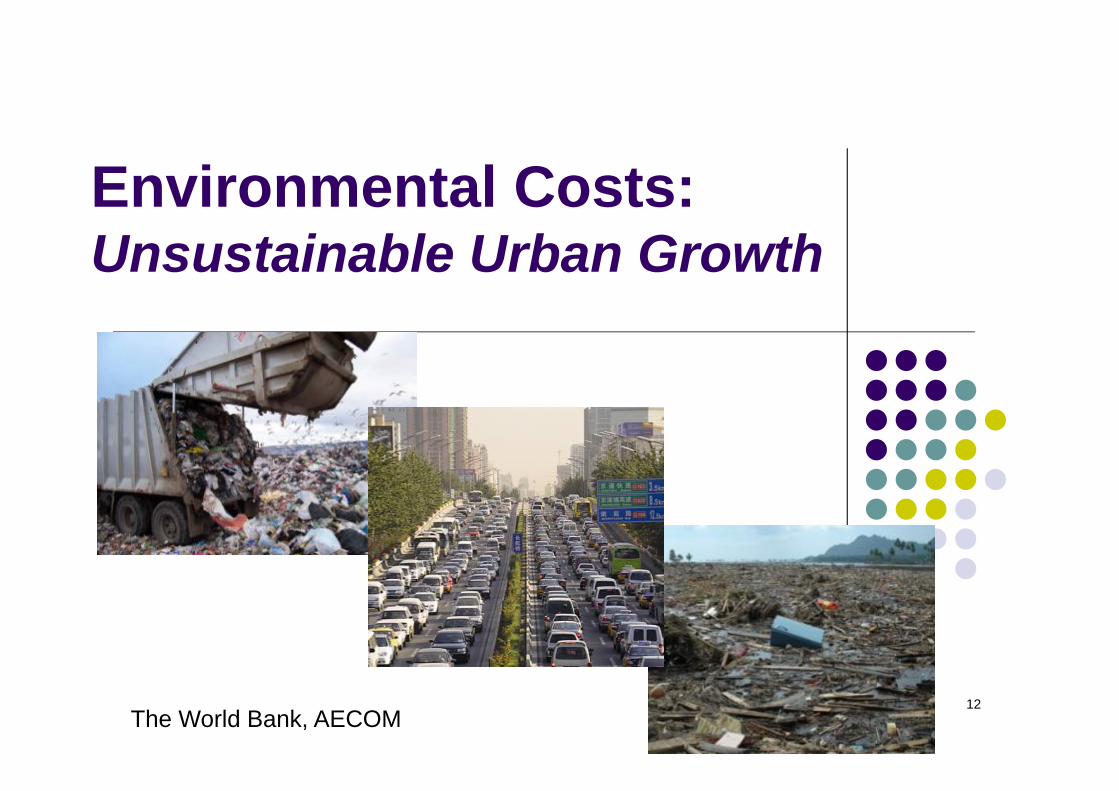
Environmental Costs:Unsustainable Urban Growth
12The World Bank, AECOM

13
Unsustainable GrowthProjected new urban built up area in developing countries alone is 400,000 km² (2000 – 2030)This equals the total urban built up area of the ‘entire world’ as of the year 2001 – we are building a ‘whole new world!’4 Earths (Ecological Footprint) required if developing country cities urbanize following the models of developed country cities
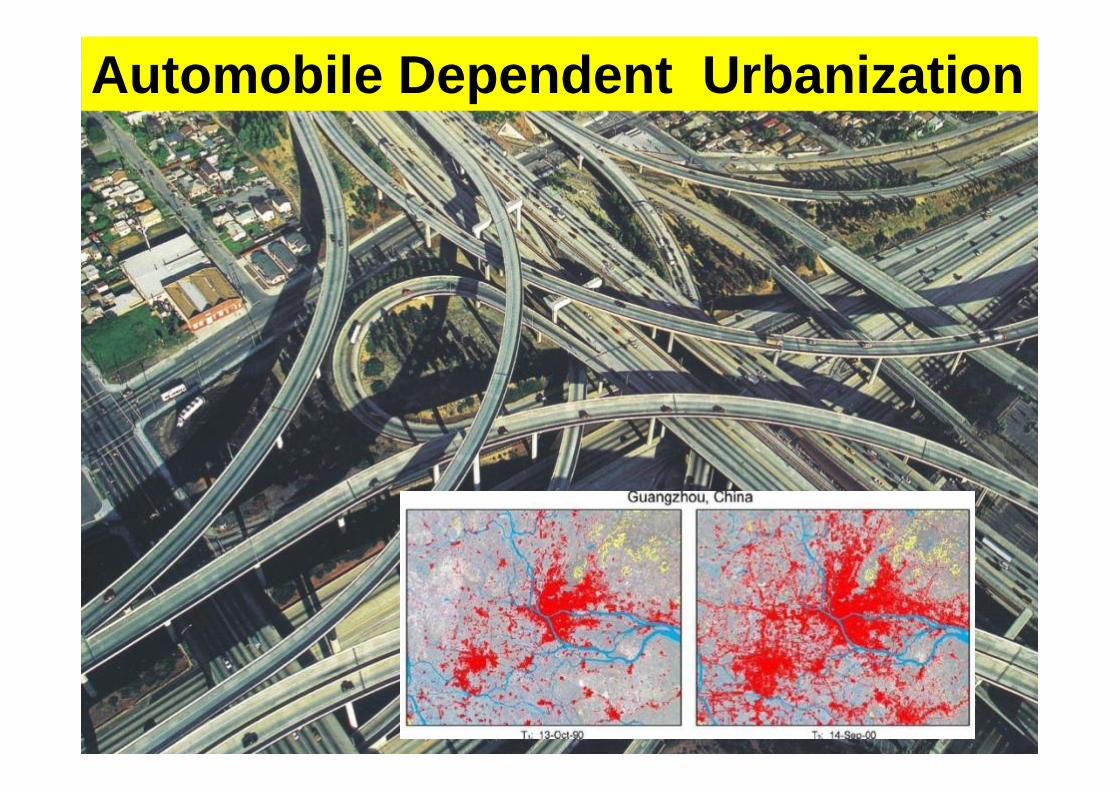
Automobile Dependent Urbanization
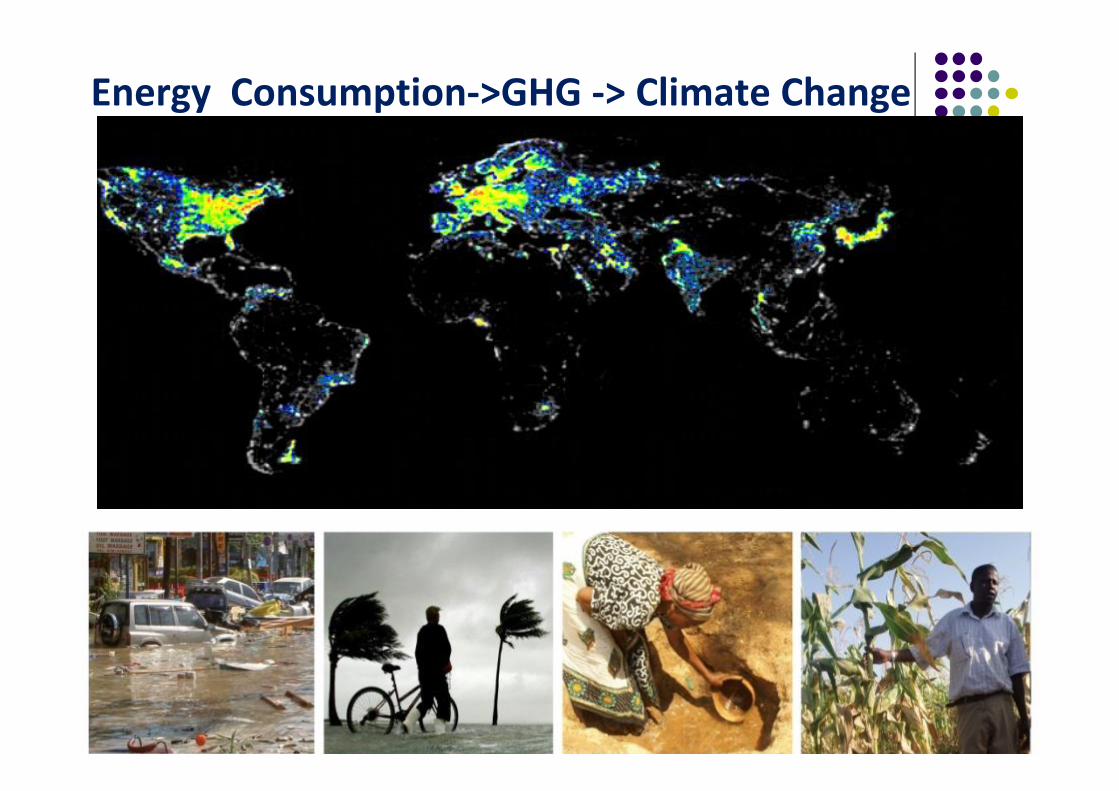
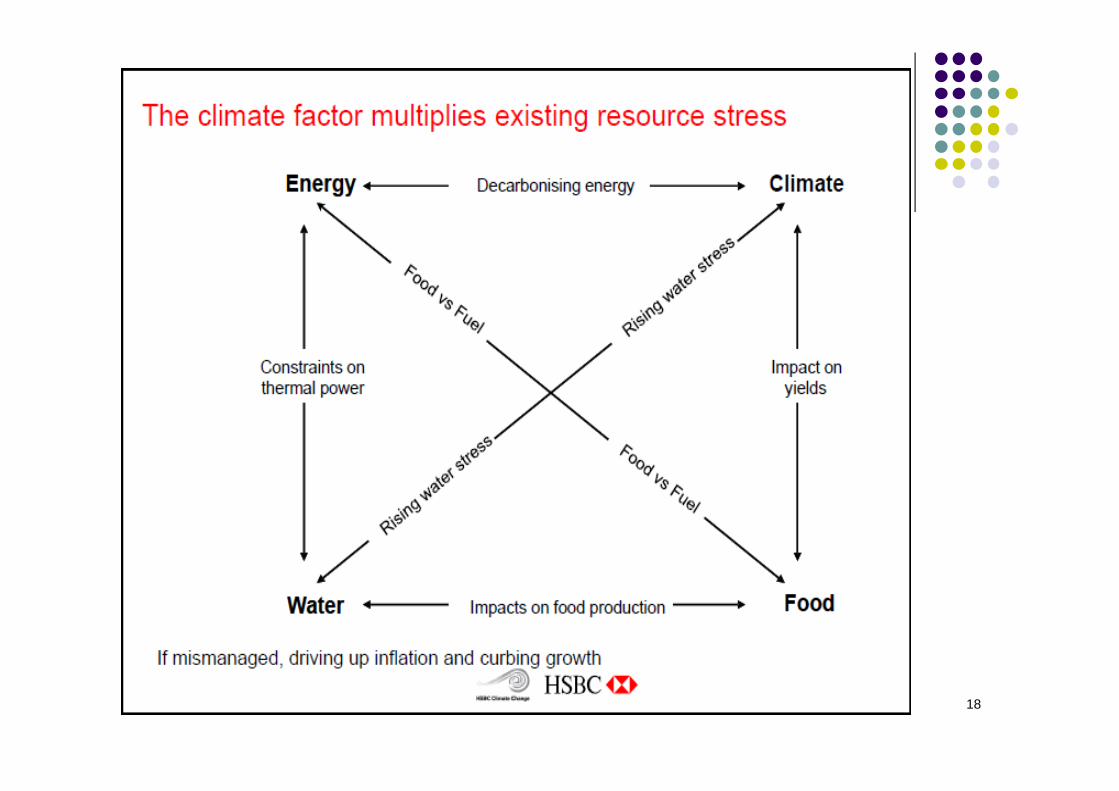
Energy Consumption‐>GHG ‐> Climate Change
15
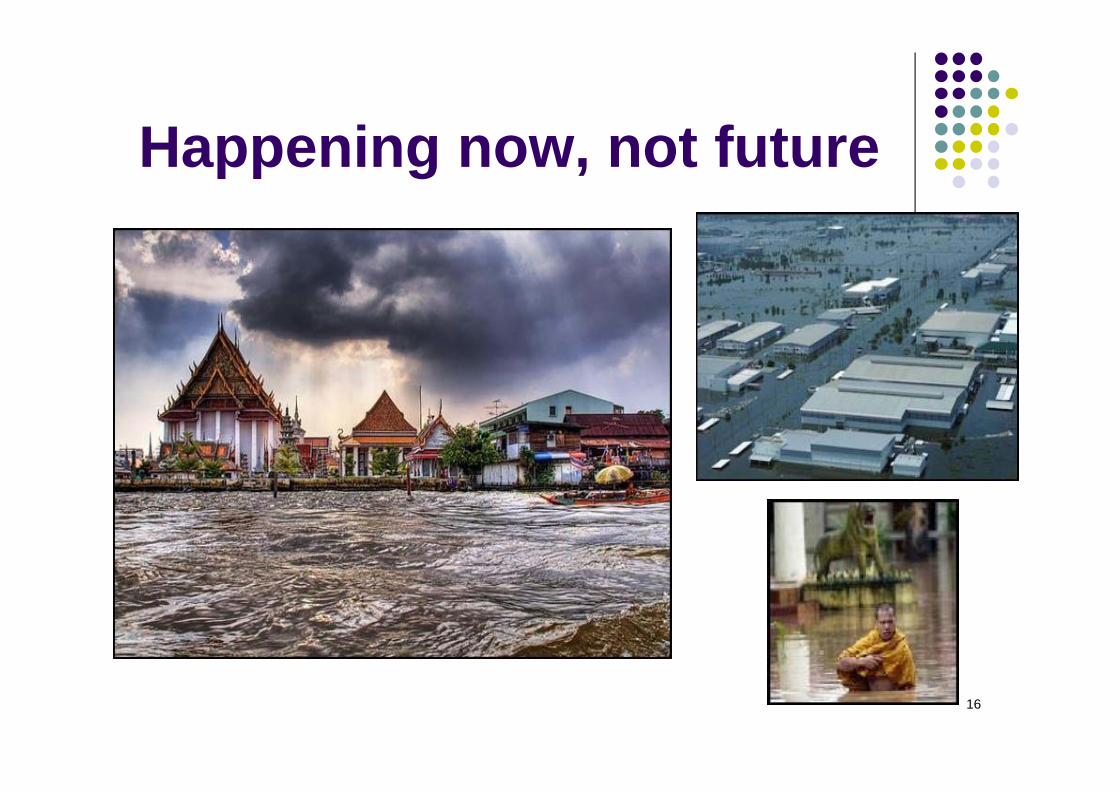
Happening now, not future
16

GHG Emissions are Unequally Distributed Within and Across Countries
WDR2010
18
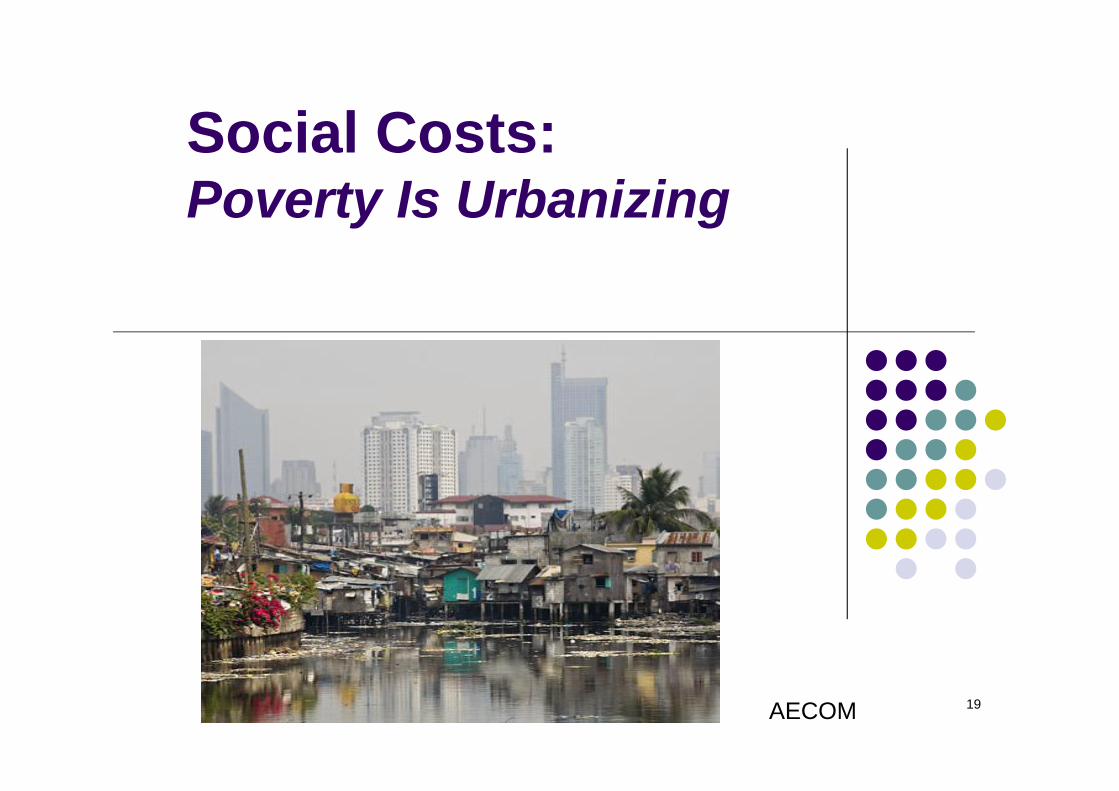
Social Costs:Poverty Is Urbanizing
19AECOM
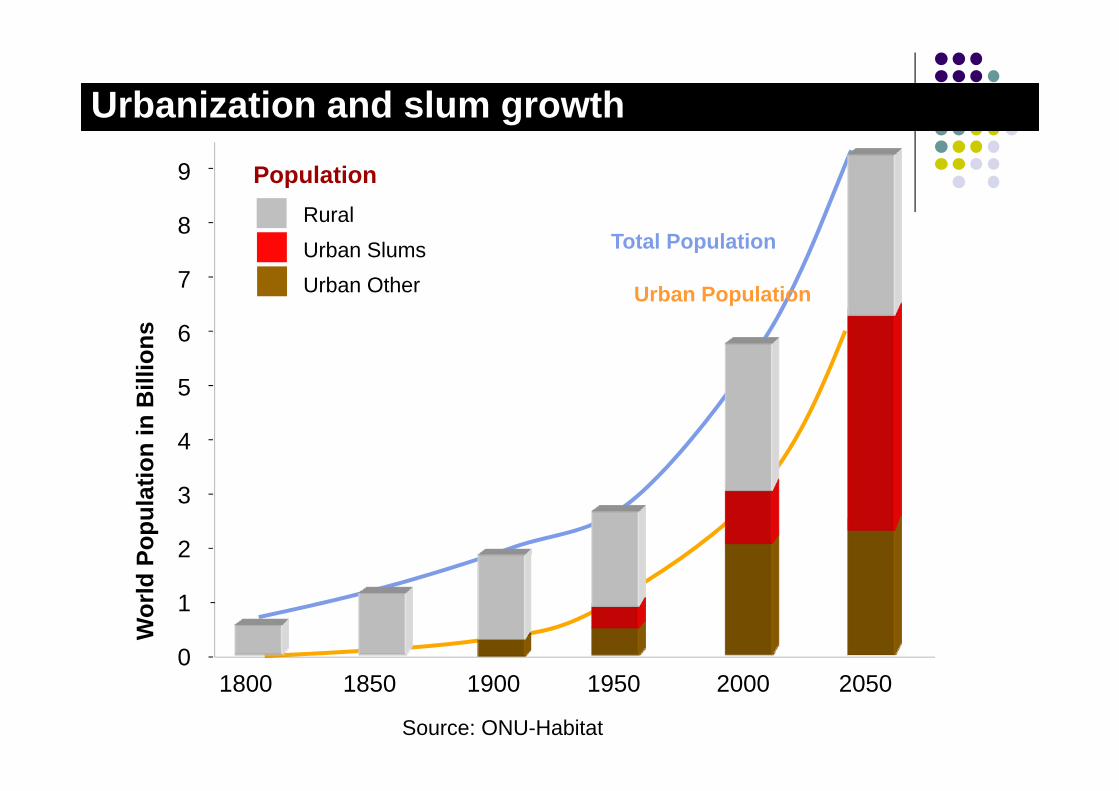
PopulationW
orld
Pop
ulat
ion
in B
illio
ns9
5
7
4
3
2
1
0
6
8
1800 1850 1900 1950 2000 2050
RuralUrban SlumsUrban Other
Total Population
Urban Population
Source: ONU-Habitat
Urbanization and slum growth
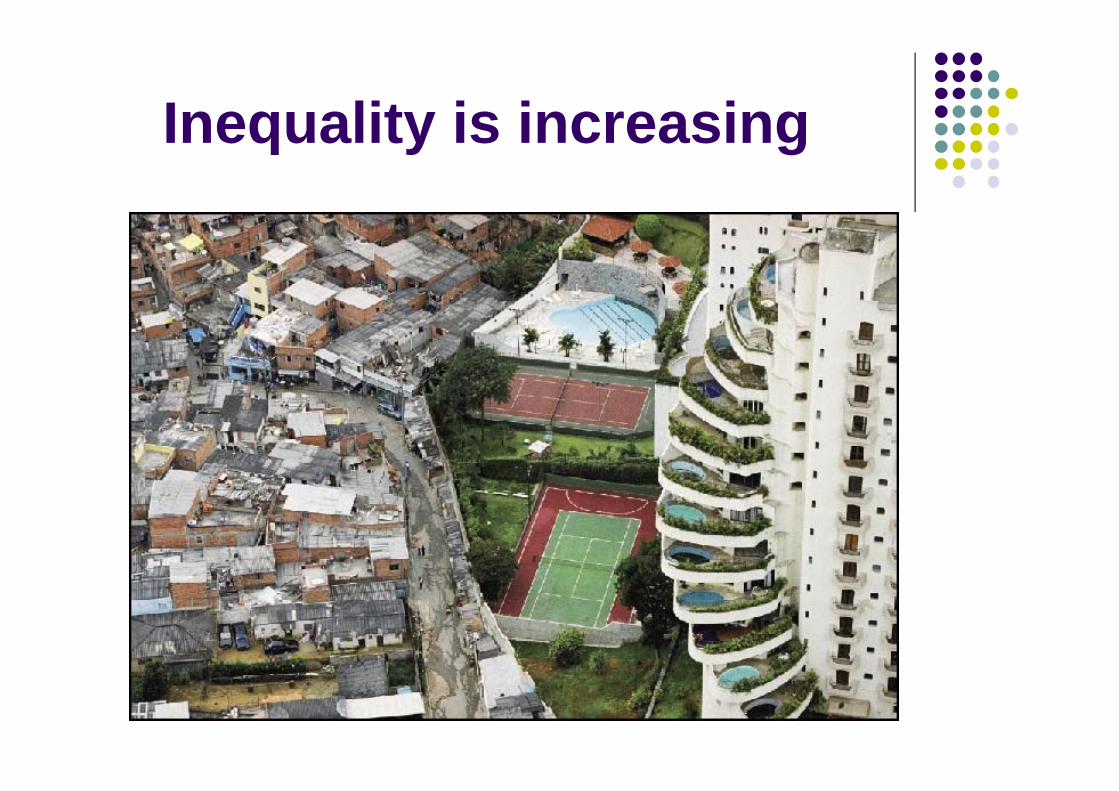
Inequality is increasing
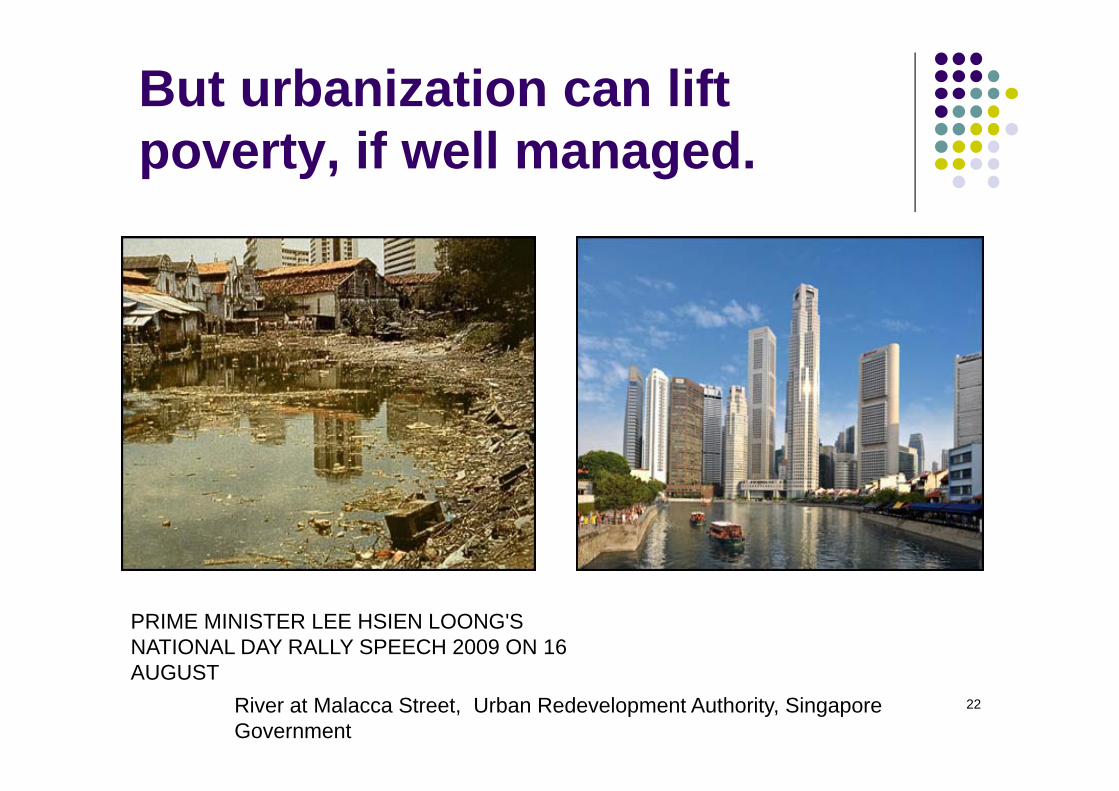
But urbanization can lift poverty, if well managed.
22River at Malacca Street, Urban Redevelopment Authority, Singapore Government
PRIME MINISTER LEE HSIEN LOONG'S NATIONAL DAY RALLY SPEECH 2009 ON 16 AUGUST
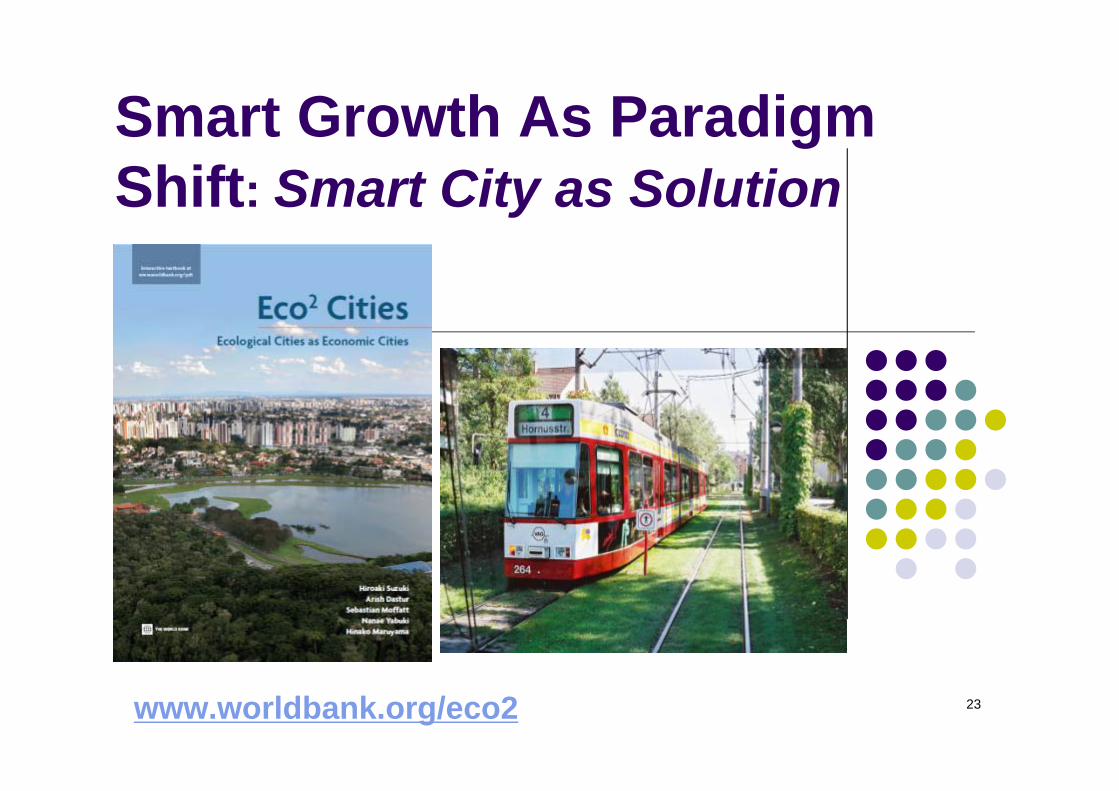
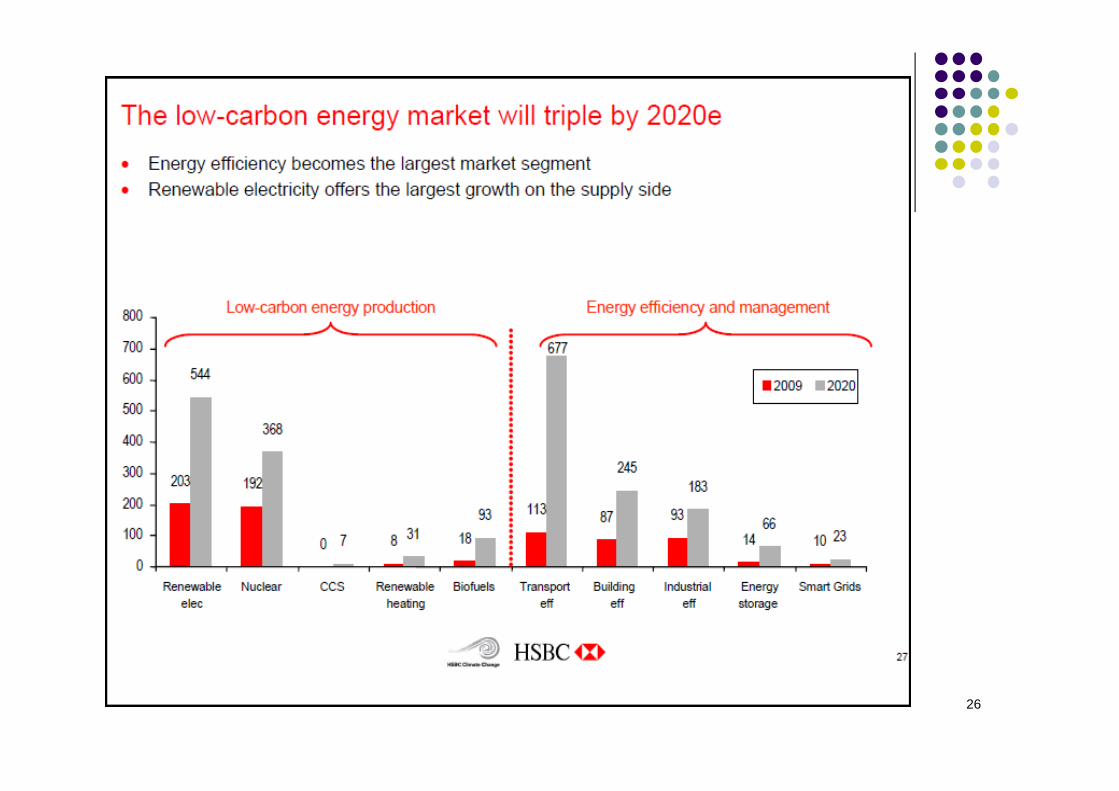
Smart Growth As Paradigm Shift: Smart City as Solution
www.worldbank.org/eco2 23
24
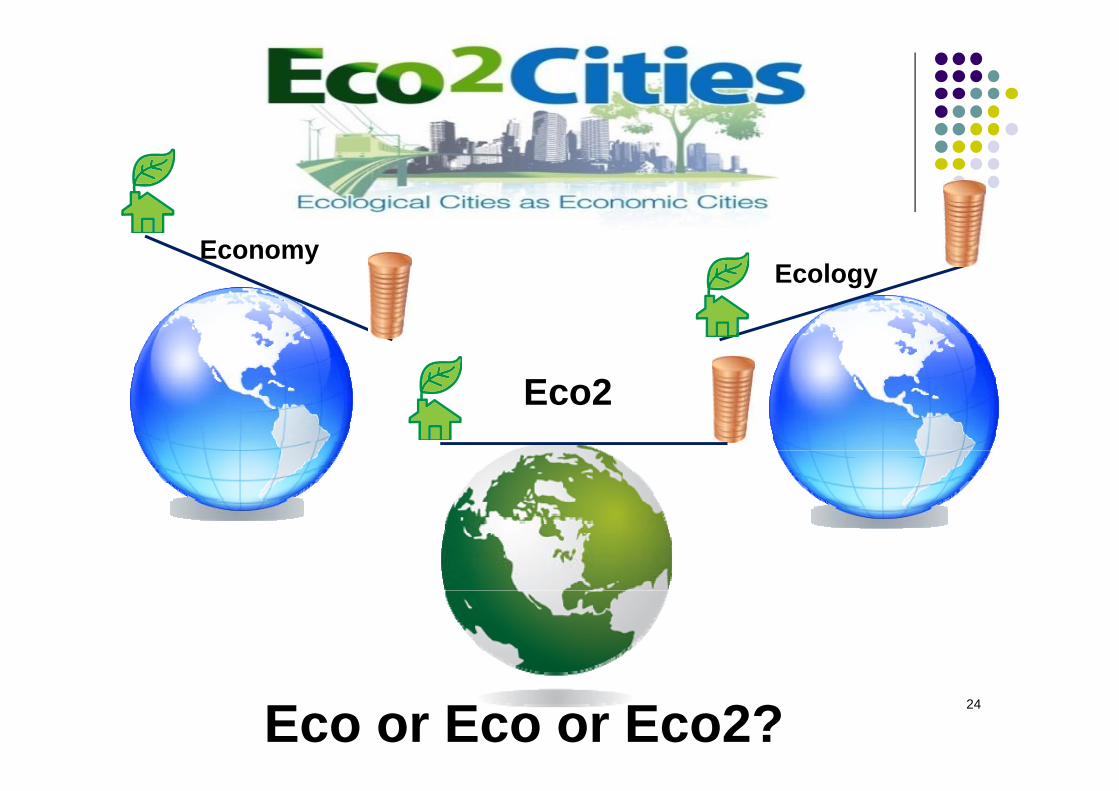
EcologyEconomy
Eco2
Eco or Eco or Eco2?
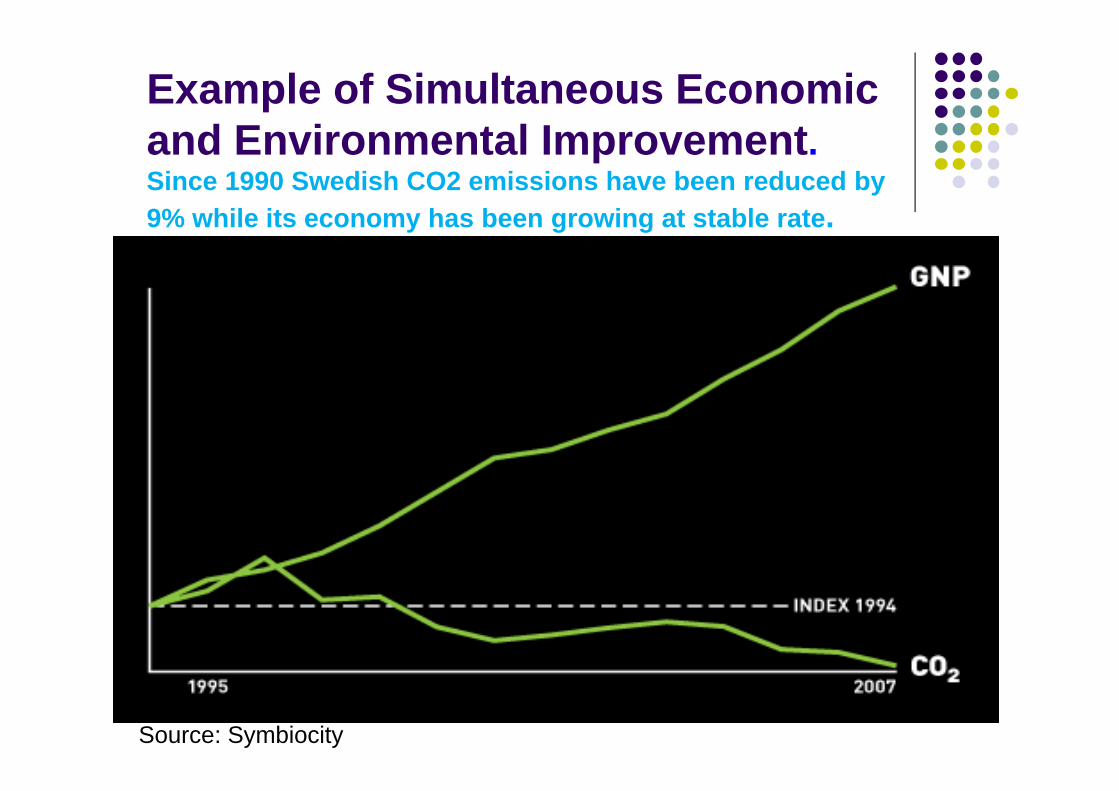
Example of Simultaneous Economic and Environmental Improvement. Since 1990 Swedish CO2 emissions have been reduced by 9% while its economy has been growing at stable rate.
25
Source: Symbiocity
26
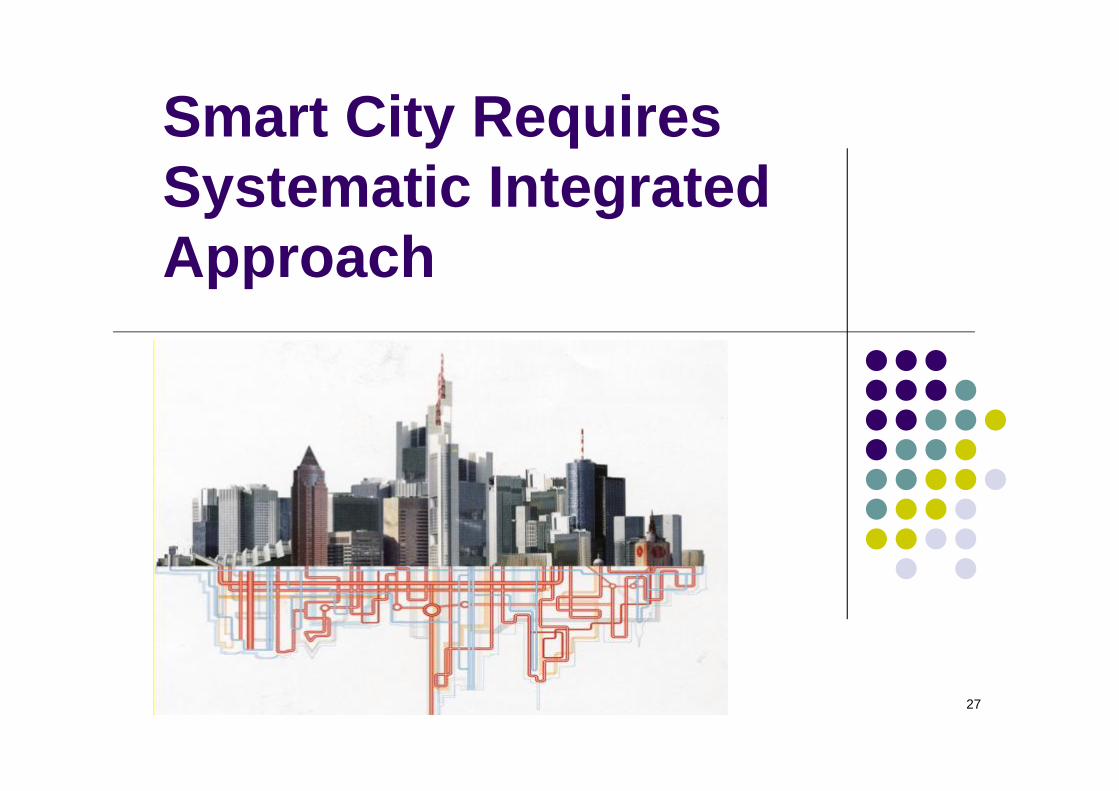
Smart City Requires Systematic Integrated Approach
27
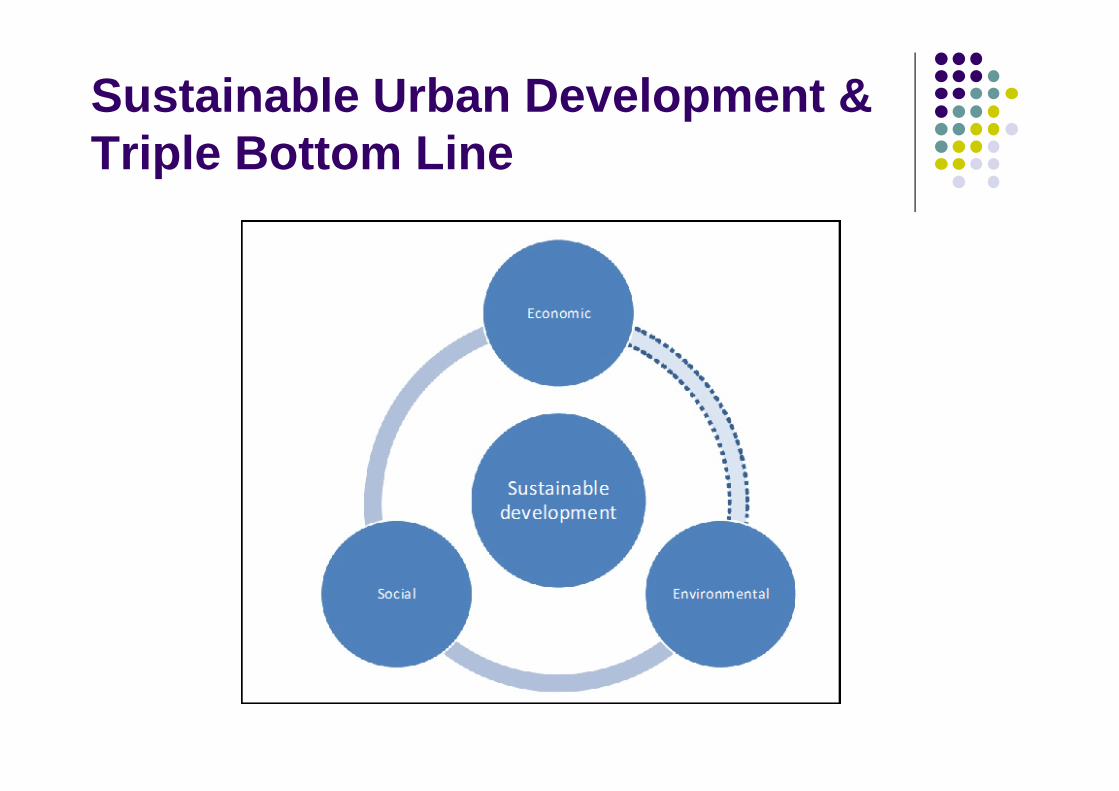
Sustainable Urban Development & Triple Bottom Line
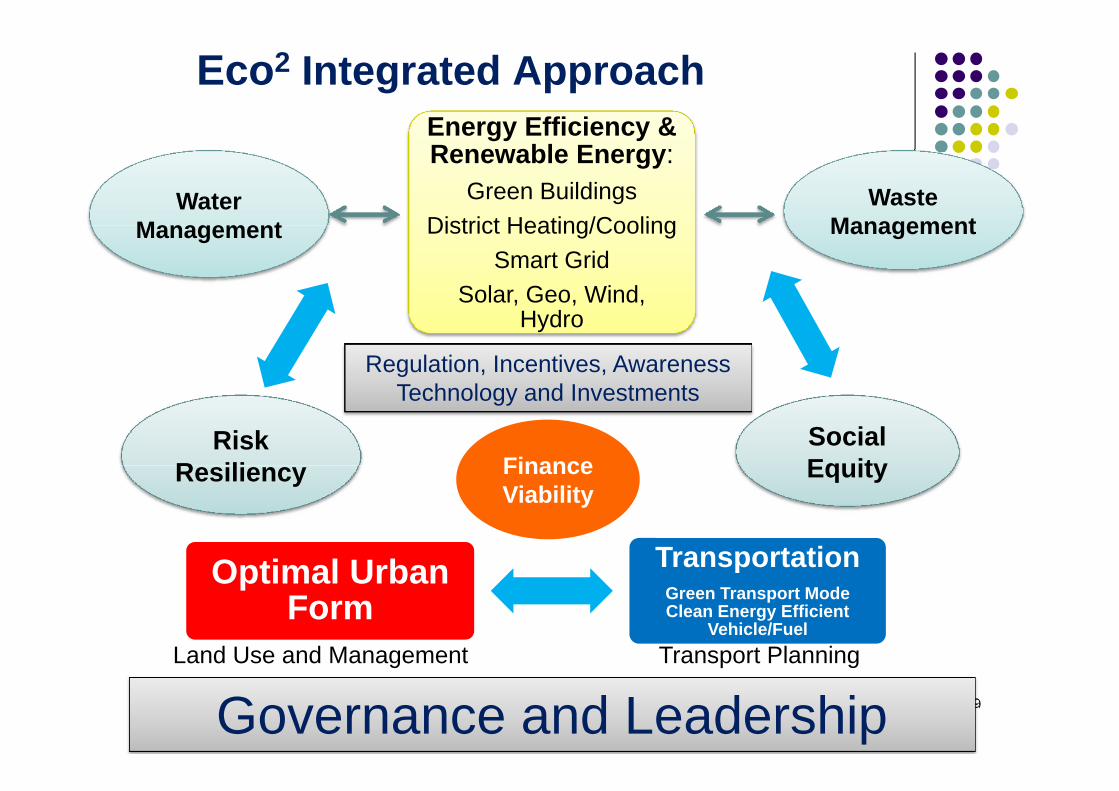
Eco2 Integrated Approach
29
Energy Efficiency & Renewable Energy:
Green BuildingsDistrict Heating/Cooling
Smart GridSolar, Geo, Wind,
Hydro
TransportationGreen Transport ModeClean Energy Efficient
Vehicle/Fuel
Optimal Urban Form
Land Use and Management Transport Planning
Regulation, Incentives, AwarenessTechnology and Investments
Waste Management
Water Management
Risk Resiliency Finance
Viability
Social Equity
Governance and Leadership
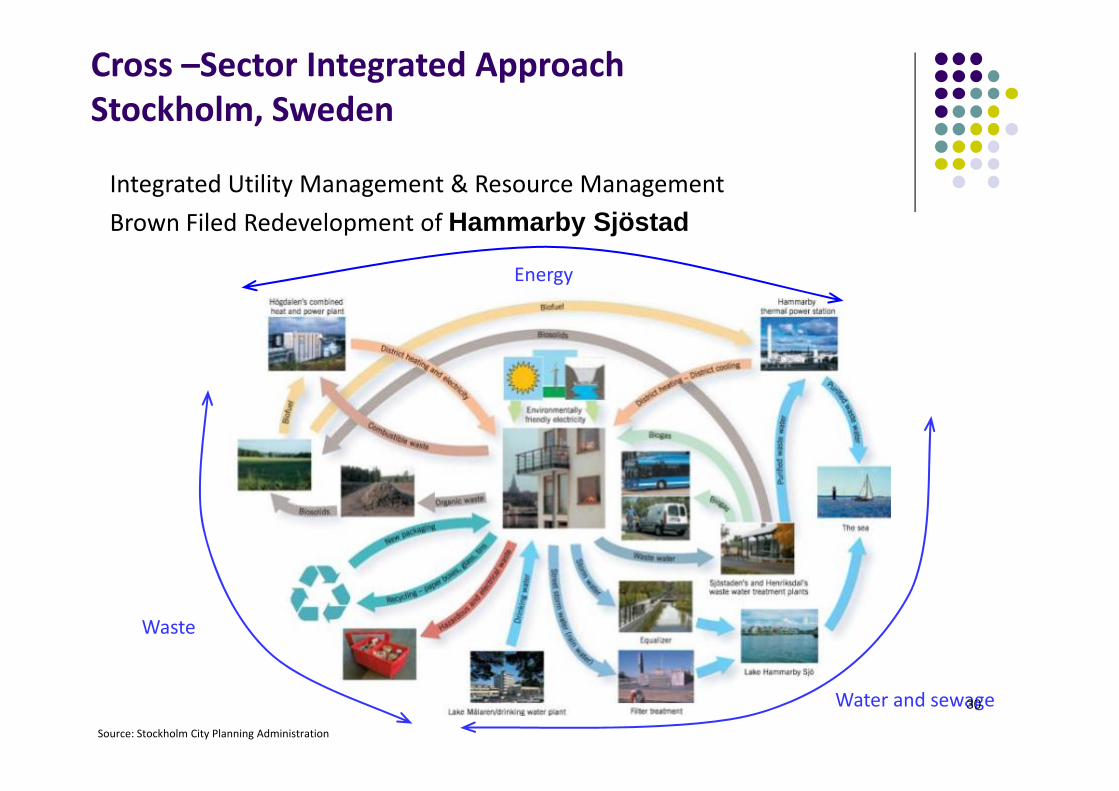
Cross –Sector Integrated ApproachStockholm, Sweden
Integrated Utility Management & Resource ManagementBrown Filed Redevelopment of Hammarby Sjöstad
Energy
Water and sewage
Waste
Source: Stockholm City Planning Administration
30
31
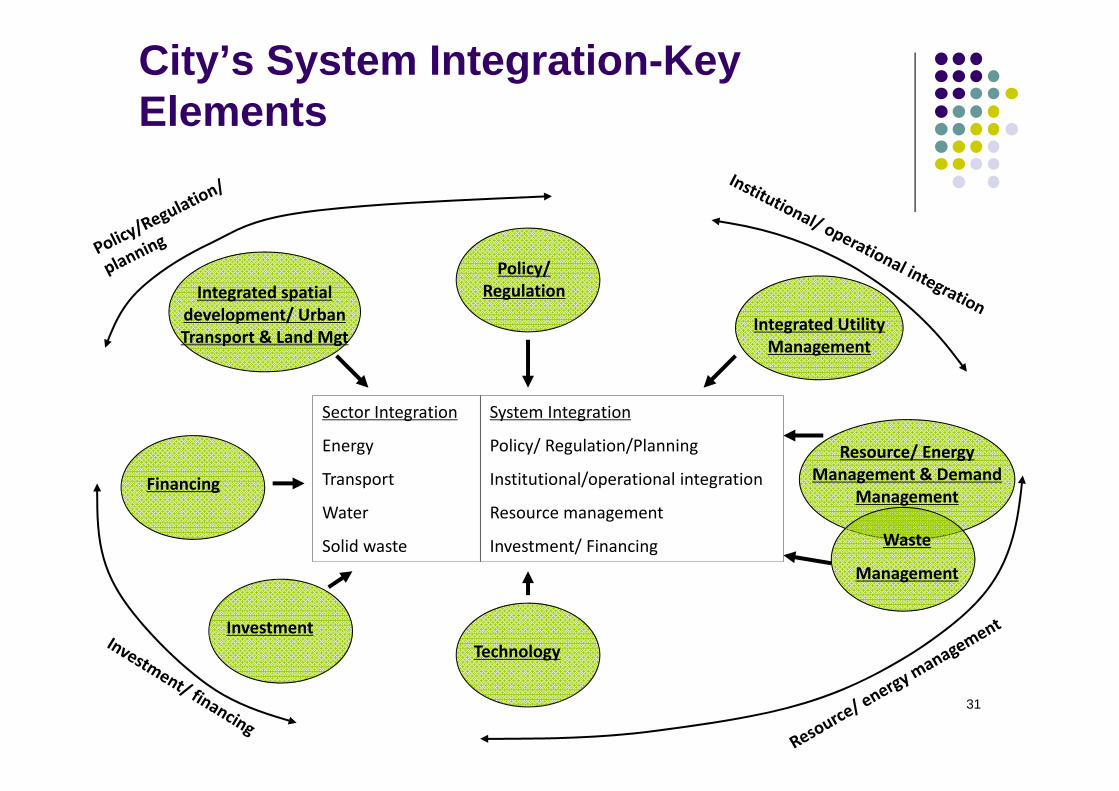
Policy/ Regulation
Integrated Utility Management
Resource/ Energy Management & Demand
Management
Technology
Waste
Management
Financing
Investment
Integrated spatial development/ Urban Transport & Land Mgt
Sector Integration
Energy
Transport
Water
Solid waste
System Integration
Policy/ Regulation/Planning
Institutional/operational integration
Resource management
Investment/ Financing
City’s System Integration-Key Elements
Regional Systems
Municipal Services
Land Use
RoadsSewerage
Waste
Housing
Office Buildings
Environmental Mgt.
Fleet Mgt.
Procurement
ParksLighting
TransitWater
City HallOperations
high ‐ Level of control ‐ low low high‐ Level of control
Building Stocks
Electricity
Ecosystems
Transportation
NaturalGas
SocialServices
InformationCommunications Industry
AgricultureRural
Communities
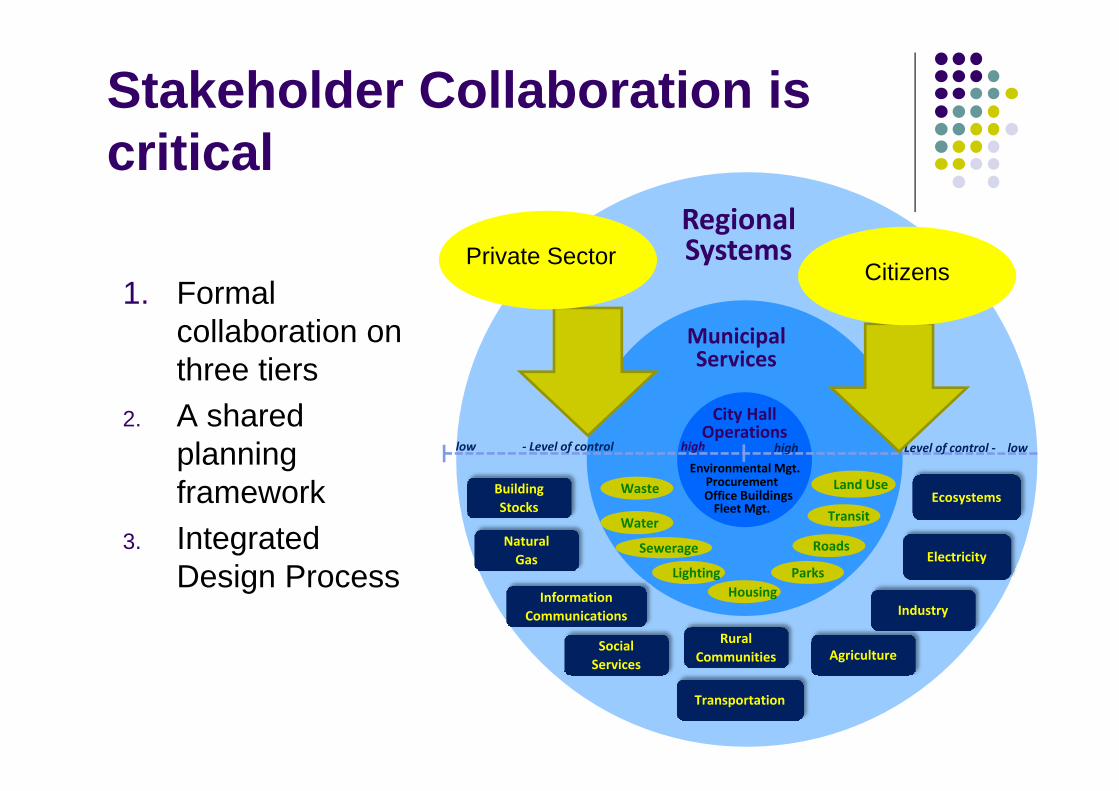
Stakeholder Collaboration is critical
1. Formal collaboration on three tiers
2. A shared planning framework
3. Integrated Design Process
Private SectorCitizens
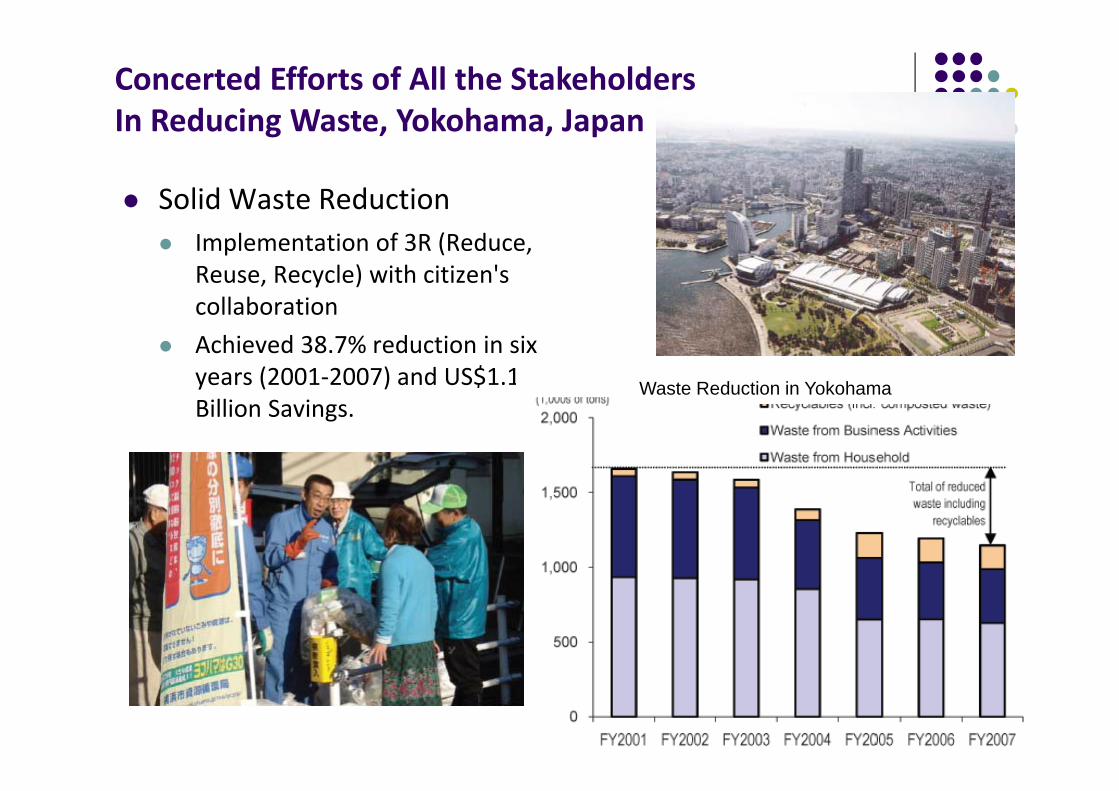
Solid Waste ReductionImplementation of 3R (Reduce, Reuse, Recycle) with citizen's collaborationAchieved 38.7% reduction in six years (2001‐2007) and US$1.1Billion Savings.
Source: City of Yokohama
Concerted Efforts of All the StakeholdersIn Reducing Waste, Yokohama, Japan
Waste Reduction in Yokohama
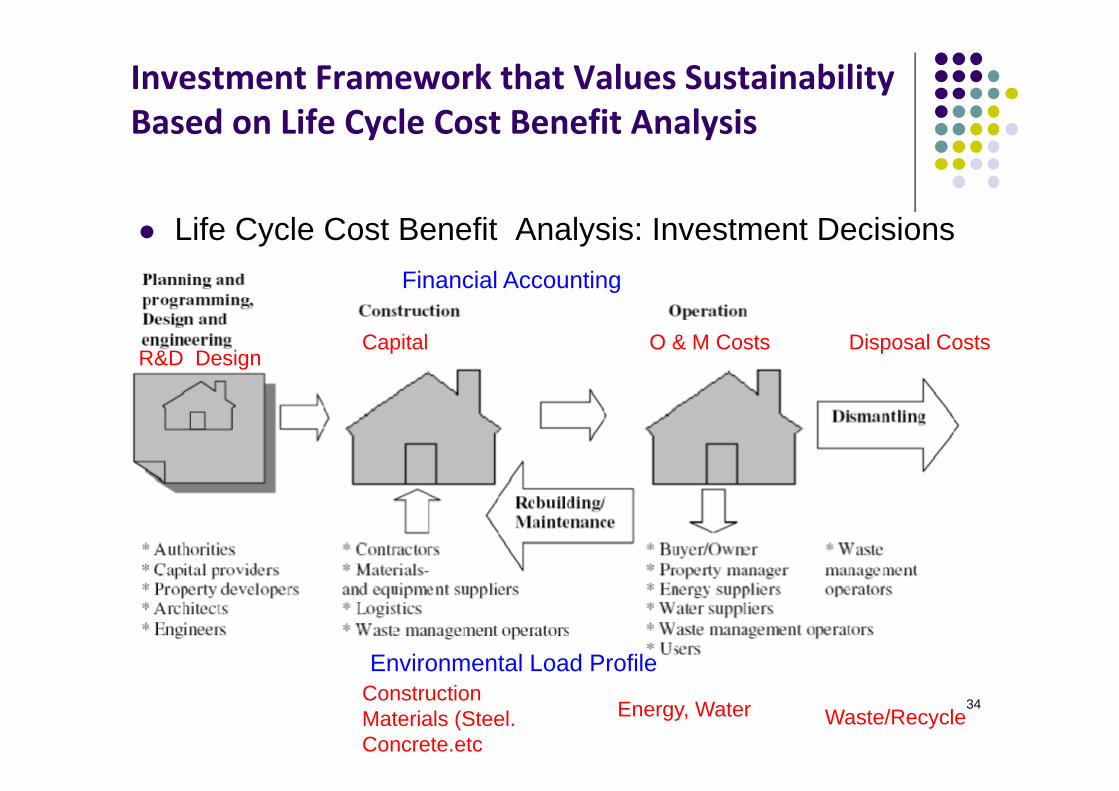
Investment Framework that Values Sustainability Based on Life Cycle Cost Benefit Analysis
34
Life Cycle Cost Benefit Analysis: Investment Decisions
Capital O & M Costs Disposal Costs
Financial Accounting
Environmental Load ProfileConstruction Materials (Steel. Concrete.etc
Energy, Water Waste/Recycle
R&D Design

Spatial Dimension of Smart City: Transit & Land-Use Integration
35
Karl Fjellstrom, ITDP

Urban Spatial Form Determines City Energy EfficiencyDecisions today are limited by past decisions
CITY GHG EMISSIONS
Source: Bertaud, A., and T. Pode, Jr., Density in Atlanta: Implications for Traffic and Transit(Los Angeles: Reason Foundation, 2007); Kick the Habit: A UN Guide to Climate Neutrality
37
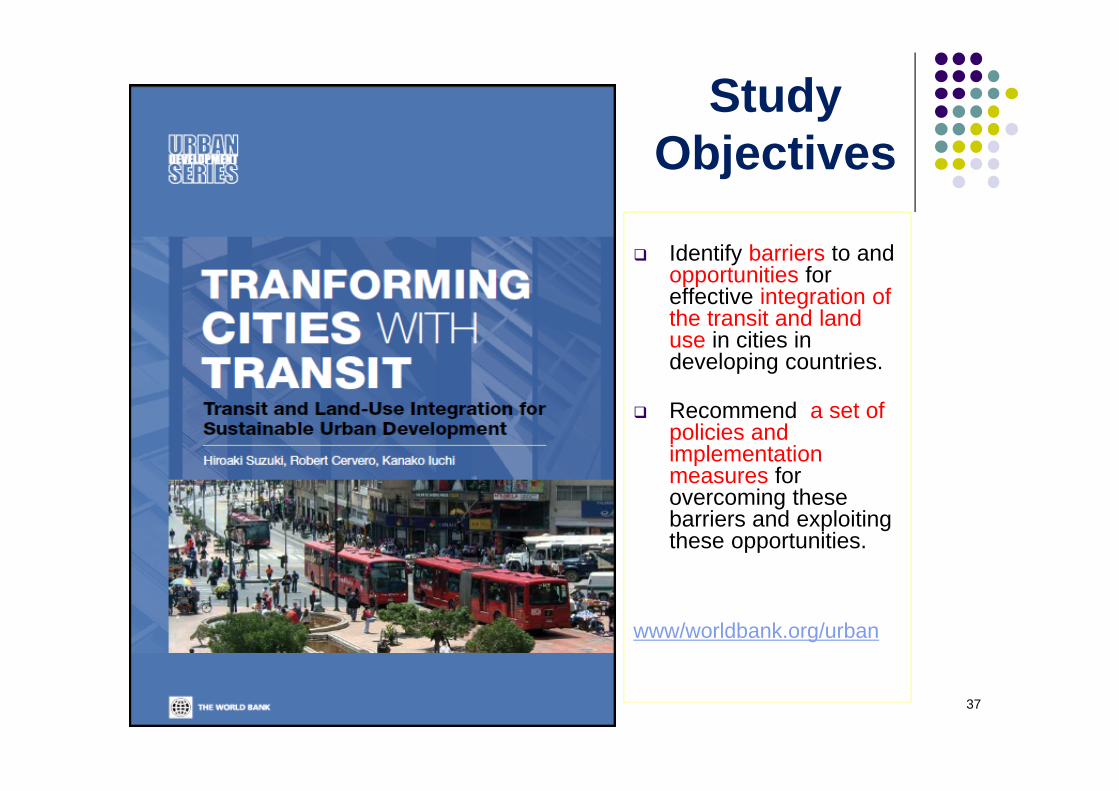
Identify barriers to and opportunities for effective integration of the transit and land use in cities in developing countries.
Recommend a set of policies and implementation measures for overcoming these barriers and exploiting these opportunities.
www/worldbank.org/urban
Study Objectives
38
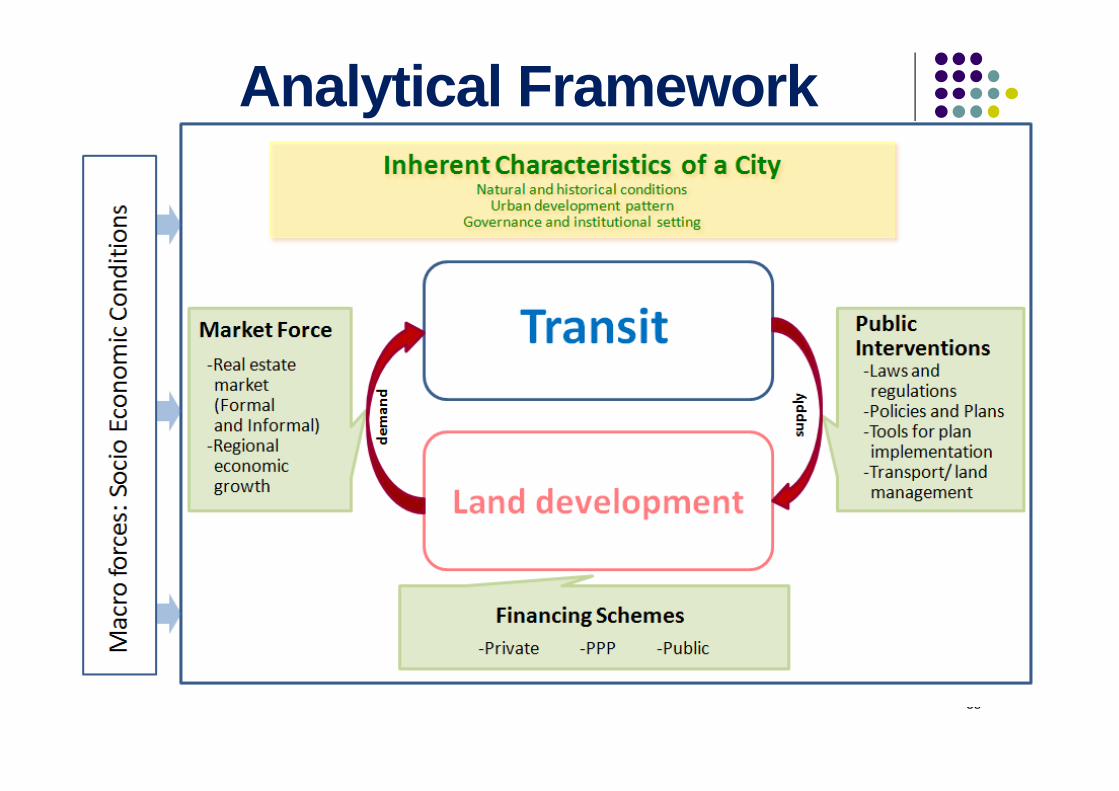
Analytical Framework
Land Use as an endTransport as a means
Land Use Transport
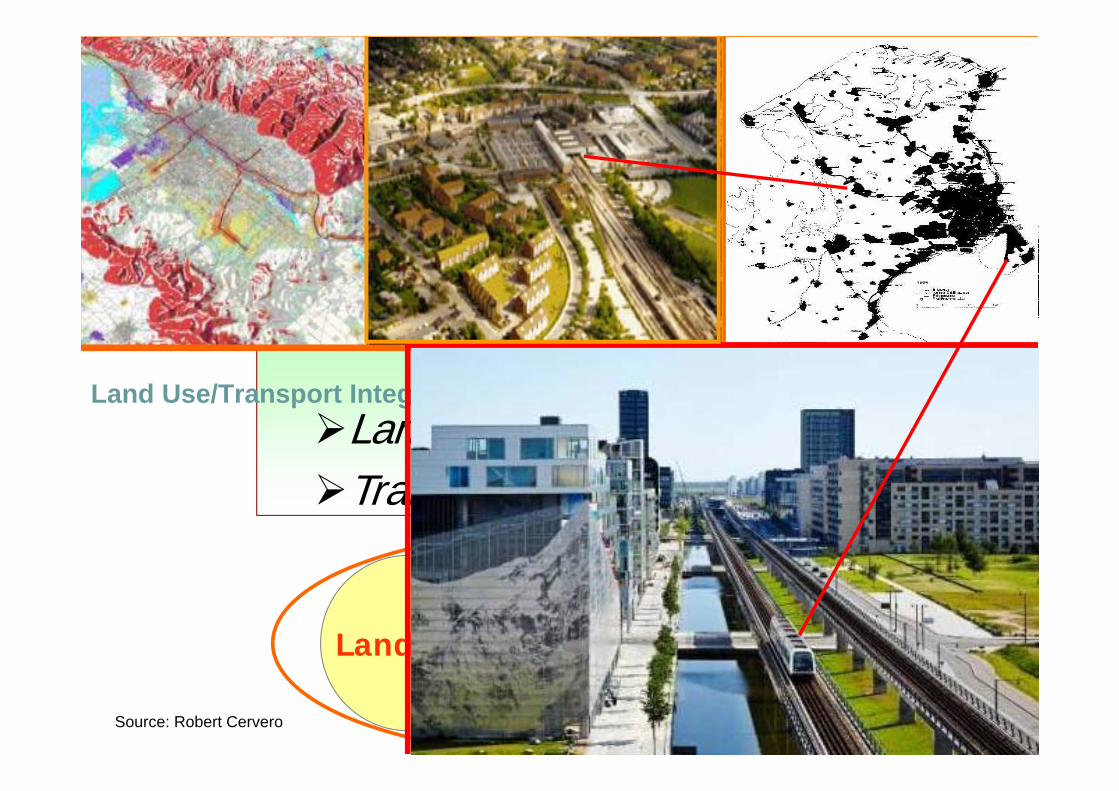
Land Use/Transport Integration
Copenhagen’s Finger Plan
Smart Growth
Source: Robert Cervero
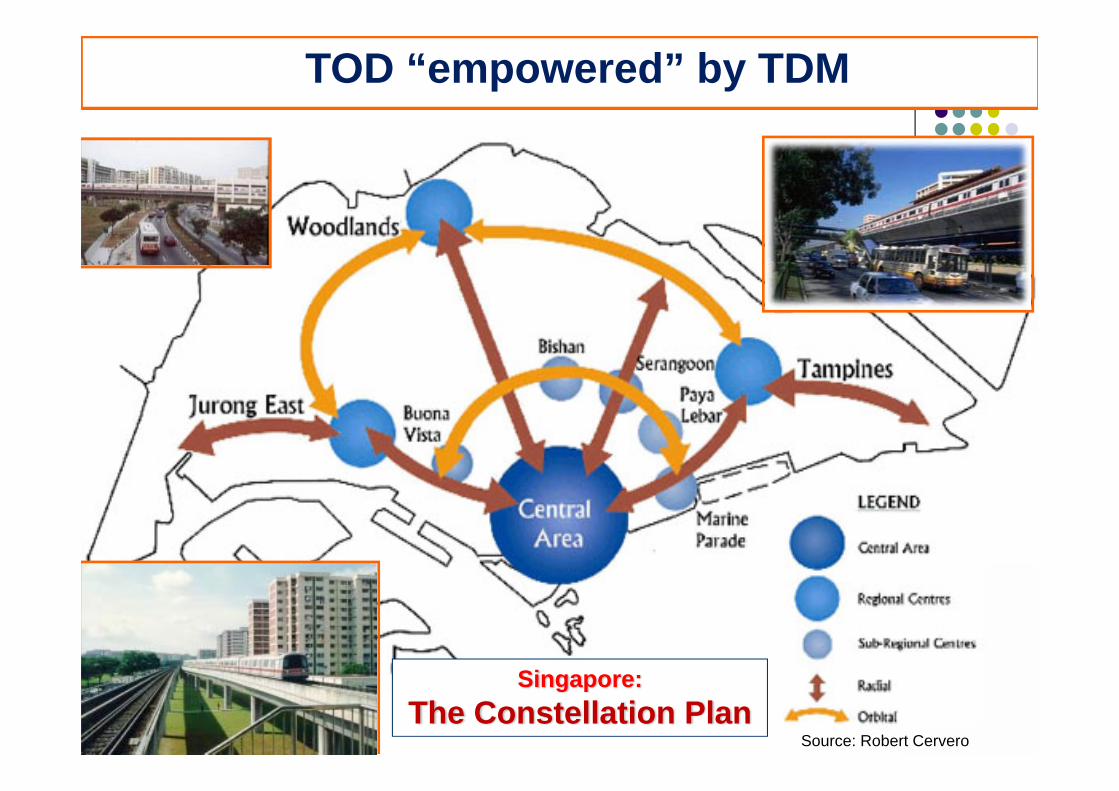
TOD “empowered” by TDM
Singapore:The Constellation Plan
Source: Robert Cervero
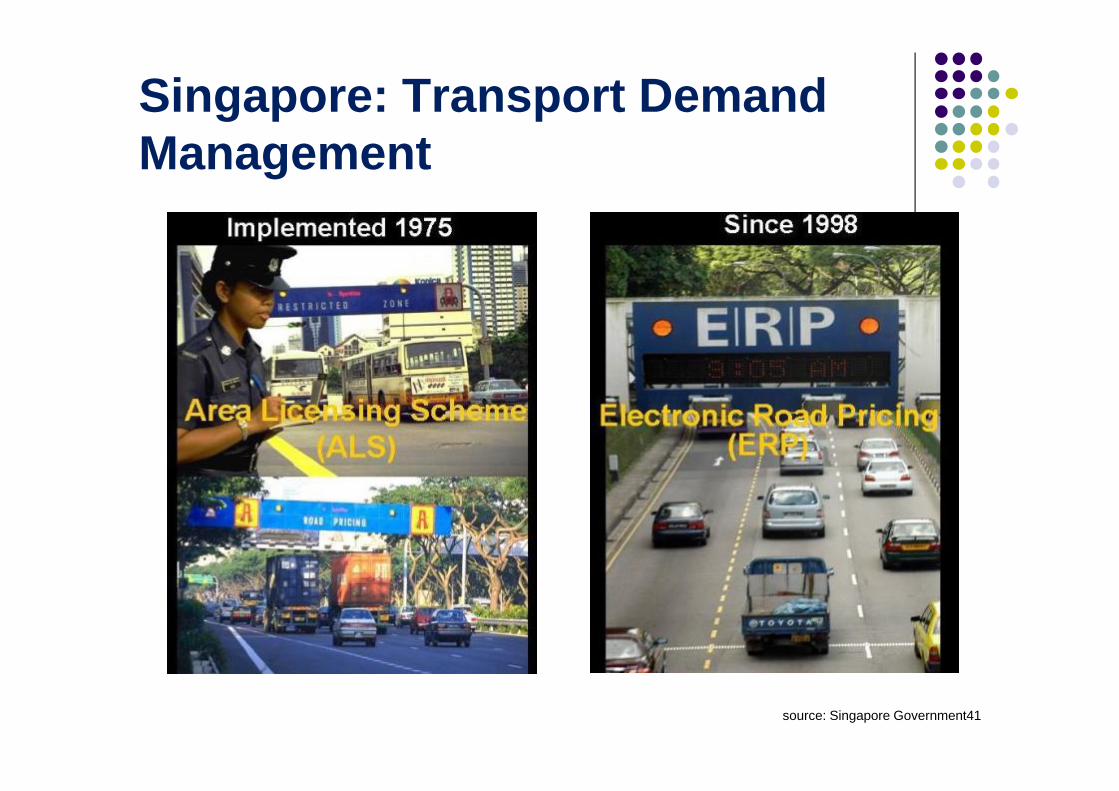
Singapore: Transport Demand Management
source: Singapore Government41
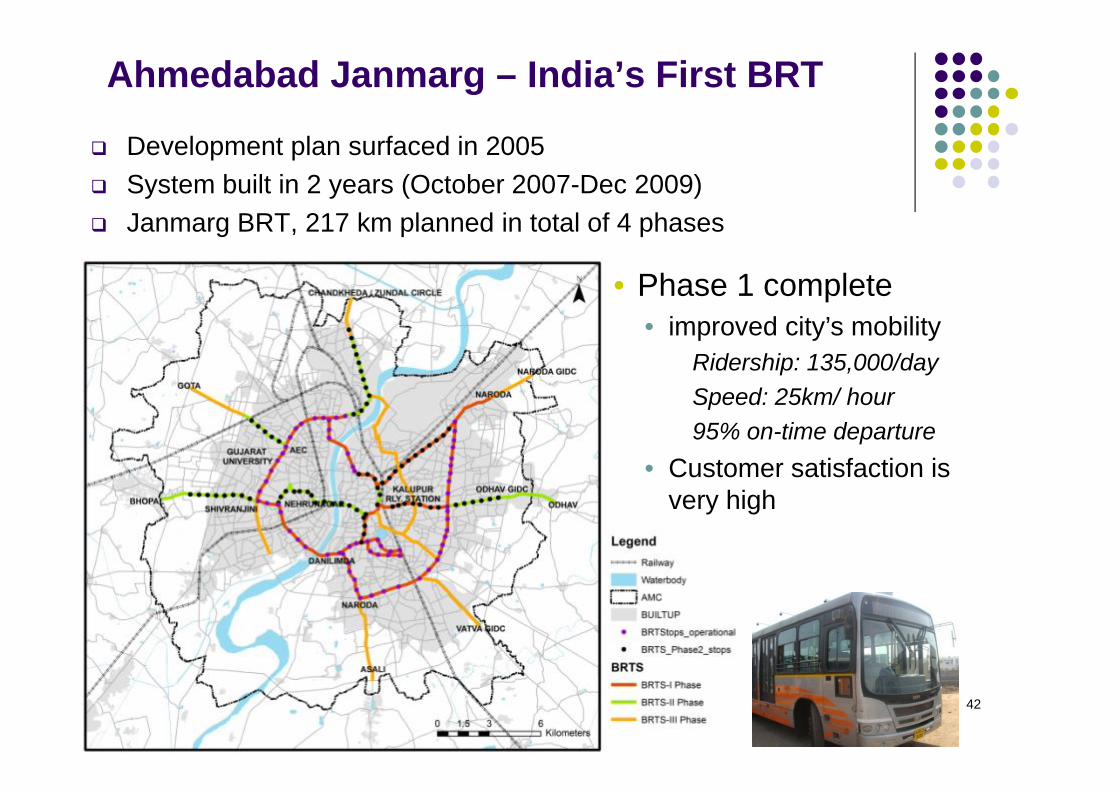
Ahmedabad Janmarg – India’s First BRT
Development plan surfaced in 2005System built in 2 years (October 2007-Dec 2009)Janmarg BRT, 217 km planned in total of 4 phases
42
• Phase 1 complete• improved city’s mobility
Ridership: 135,000/daySpeed: 25km/ hour95% on-time departure
• Customer satisfaction is very high

Development Pattern (2006-2011)New development is apparent in city’s peripheryMore development concentration along the road
current and future BRT corridors
43
Brownfield development: redevelopment of closed textile mill parcels
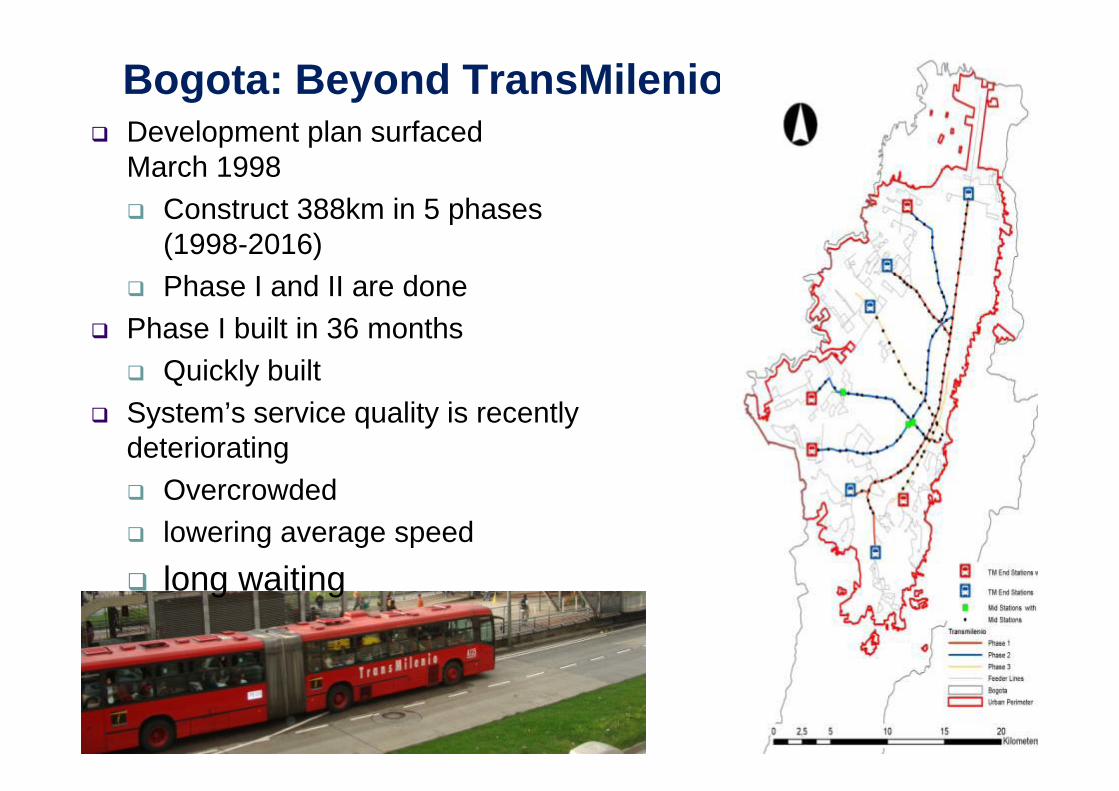
Bogota: Beyond TransMilenio
44
Development plan surfacedMarch 1998
Construct 388km in 5 phases (1998-2016) Phase I and II are done
Phase I built in 36 monthsQuickly built
System’s service quality is recently deteriorating
Overcrowdedlowering average speedlong waiting
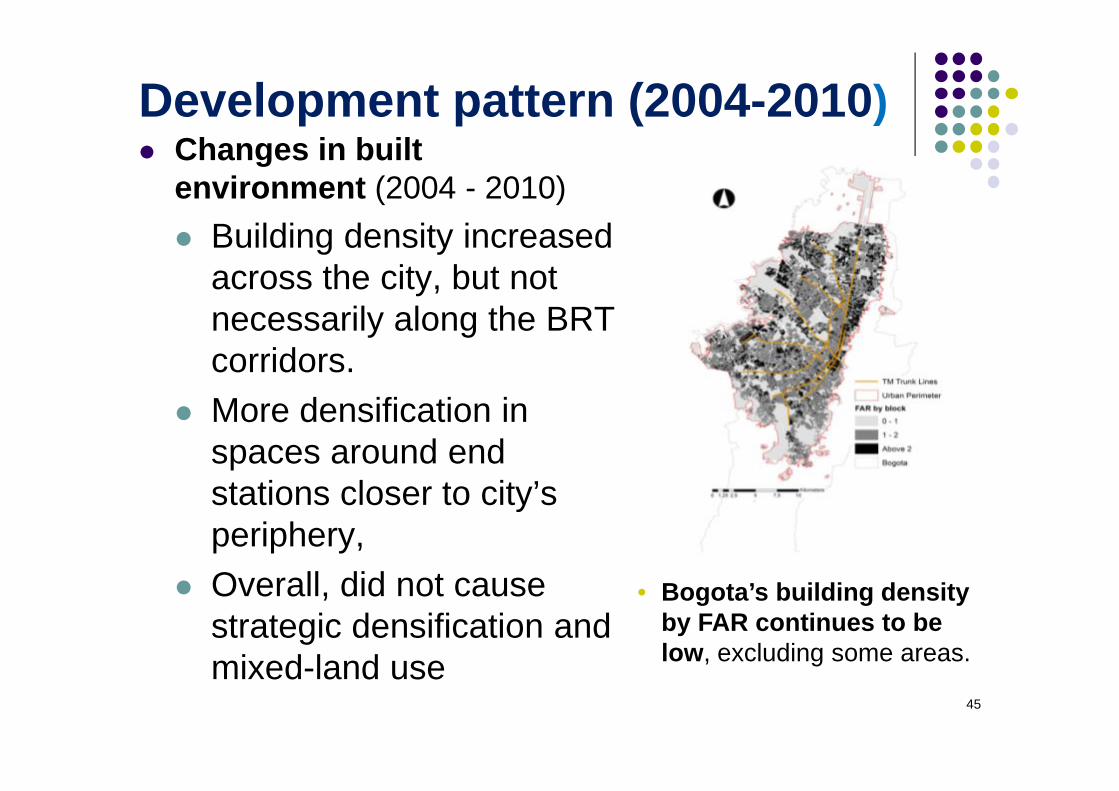
Development pattern (2004-2010)Changes in built environment (2004 - 2010)
Building density increased across the city, but not necessarily along the BRT corridors.More densification in spaces around end stations closer to city’s periphery, Overall, did not cause strategic densification and mixed-land use
45
• Bogota’s building density by FAR continues to be low, excluding some areas.
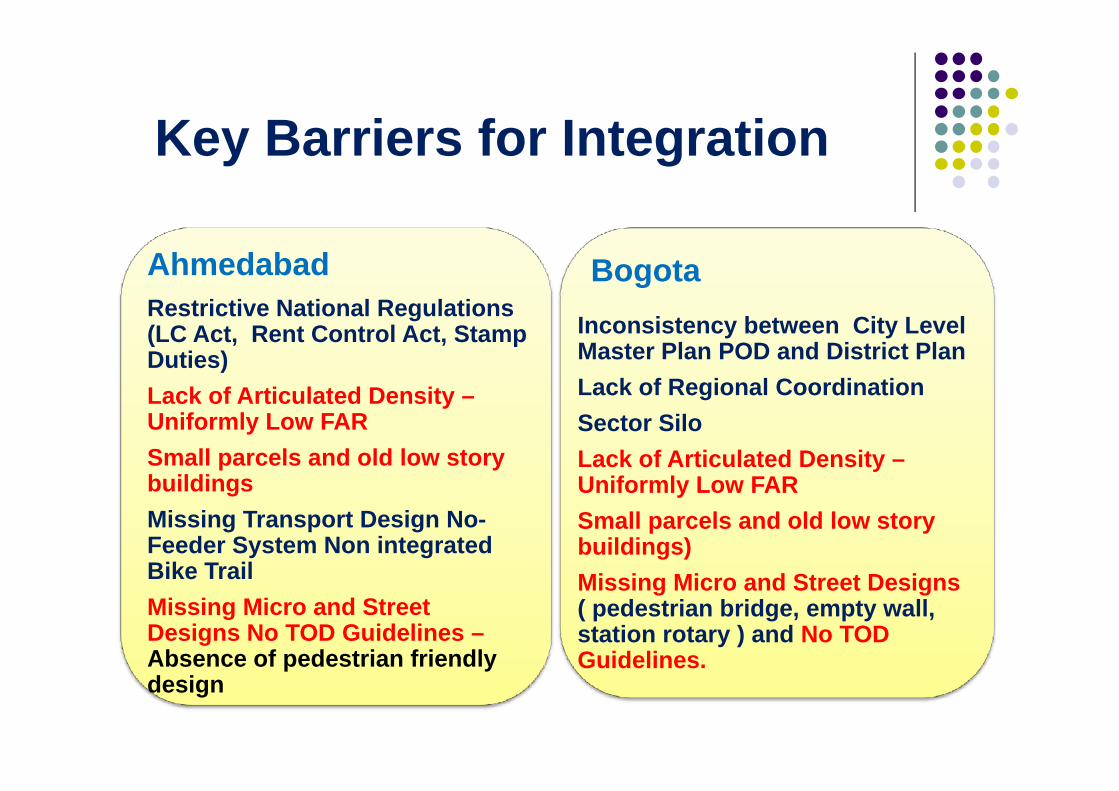
Key Barriers for Integration
AhmedabadRestrictive National Regulations(LC Act, Rent Control Act, Stamp Duties)Lack of Articulated Density –Uniformly Low FAR Small parcels and old low story buildingsMissing Transport Design No-Feeder System Non integrated Bike TrailMissing Micro and Street Designs No TOD Guidelines –Absence of pedestrian friendly design
BogotaInconsistency between City Level Master Plan POD and District Plan Lack of Regional CoordinationSector SiloLack of Articulated Density –Uniformly Low FAR Small parcels and old low story buildings)Missing Micro and Street Designs ( pedestrian bridge, empty wall, station rotary ) and No TOD Guidelines.
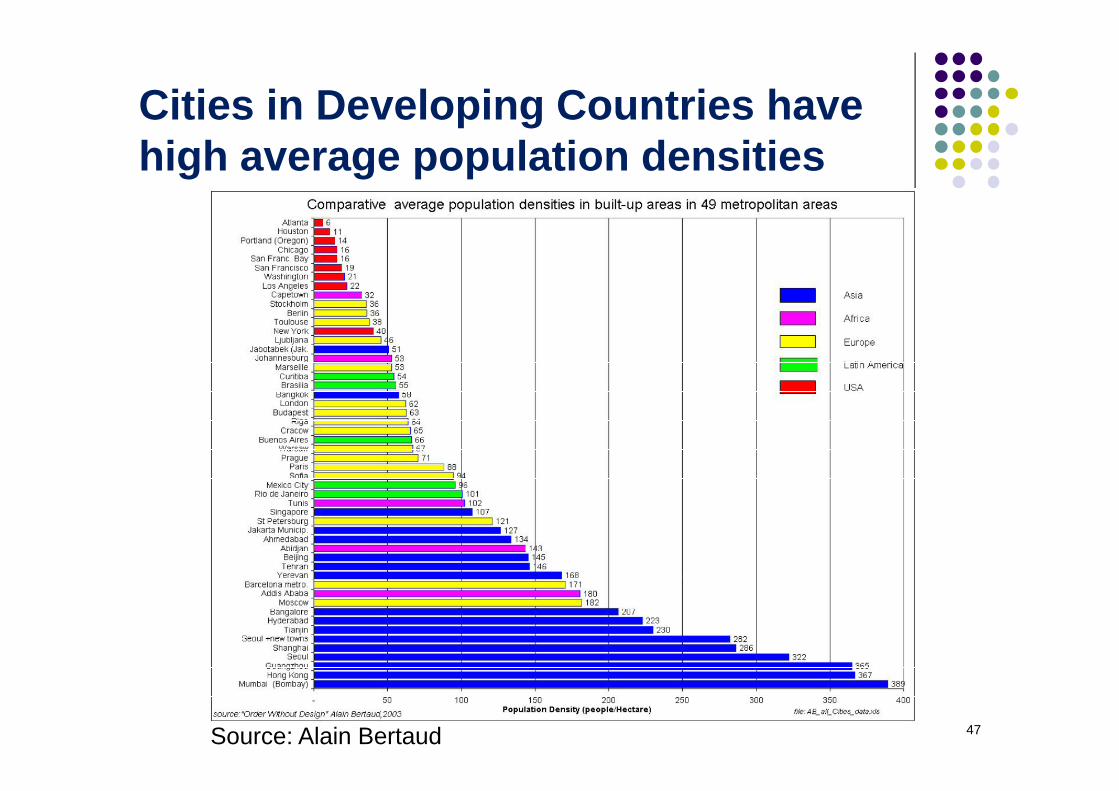
Cities in Developing Countries have high average population densities
47Source: Alain Bertaud

Articulated Density Matters;Not Average Density
48
Source: OECD Compact City Policies / Laruelle, N
Uniform Average Population Density can havetotally different height and spatial form. Whatmatters most for transit and land-useintegration is not average population density,but articulated density.
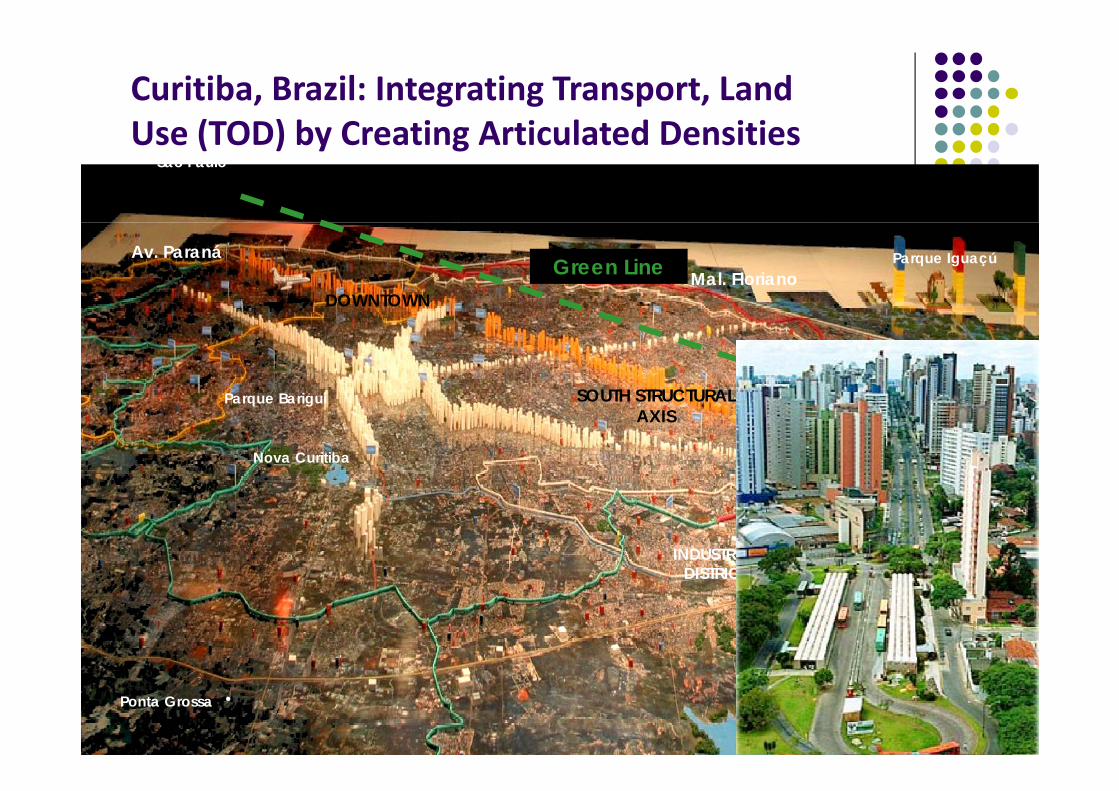
SOUTH STRUCTURAL AXIS
Nova Curitiba
Av. Paraná
Represa Do Passaúna
DOWNTOWNMal. Floriano
Parque IguaçúGreen Line
Porto Alegre・
Ponta Grossa・
INDUSTRIAL DISTRICT
Parque Barigui
São Paulo ・
Curitiba, Brazil: Integrating Transport, Land Use (TOD) by Creating Articulated Densities
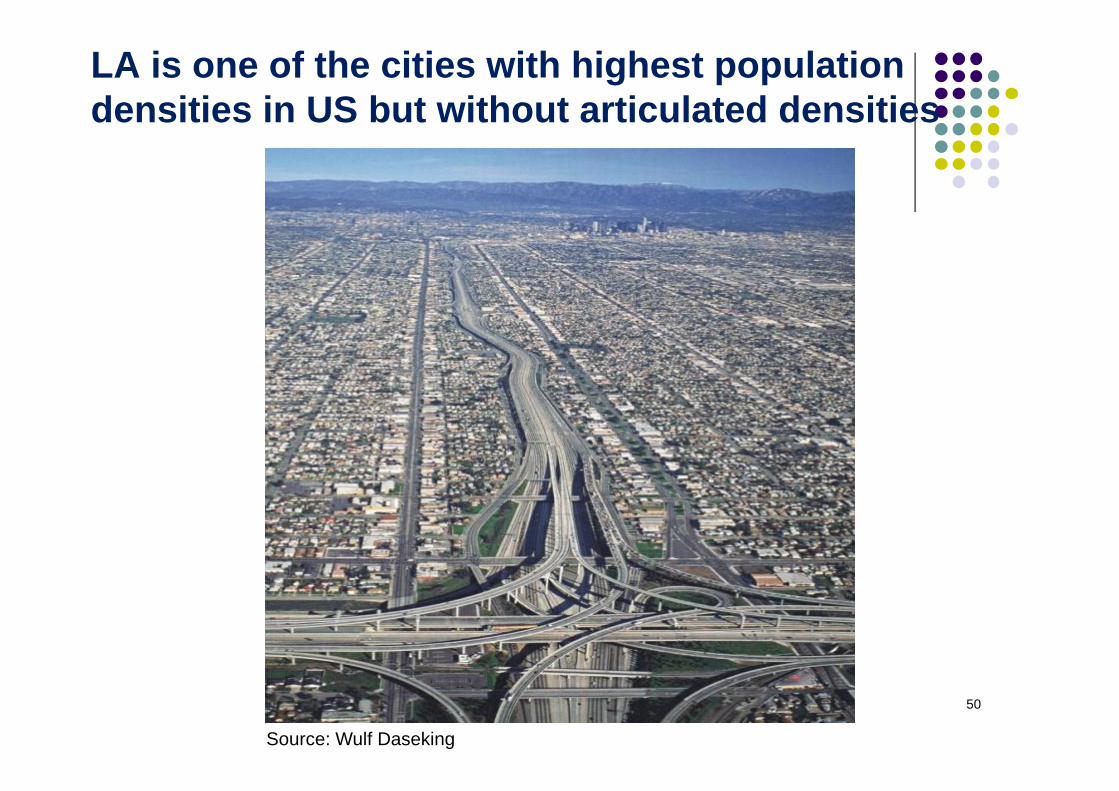
LA is one of the cities with highest population densities in US but without articulated densities
50
Source: Wulf Daseking
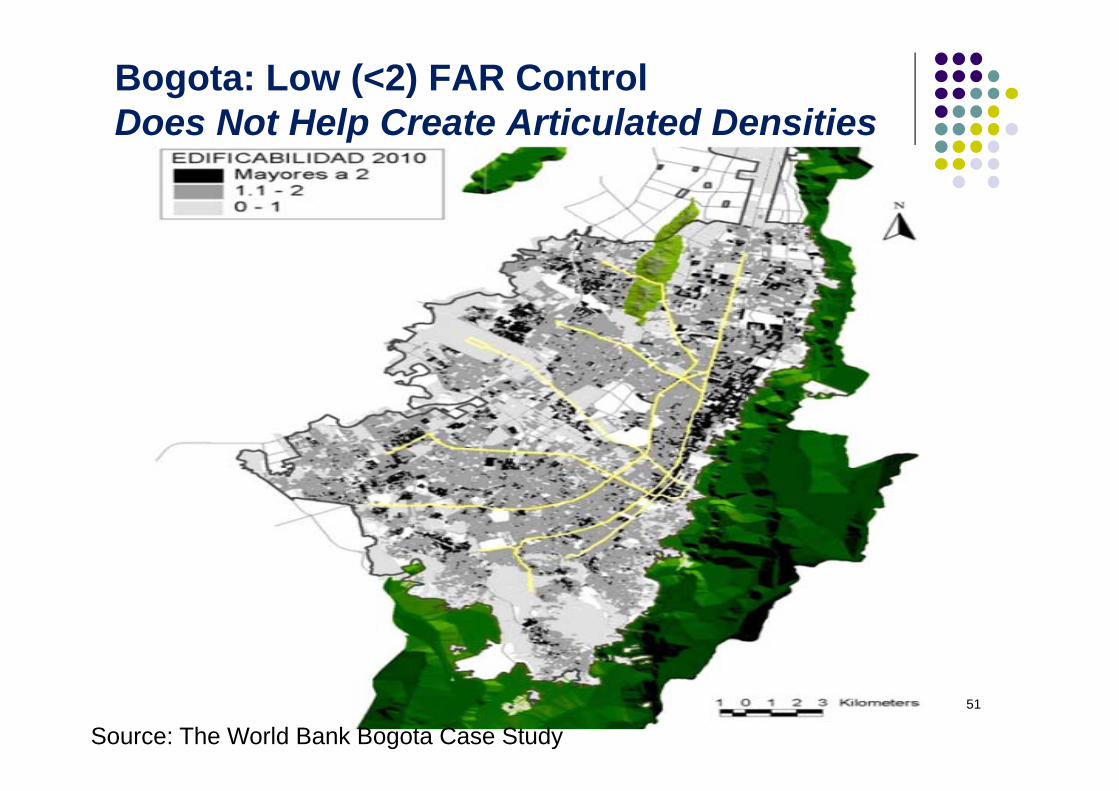
Bogota: Low (<2) FAR ControlDoes Not Help Create Articulated Densities
51
Source: The World Bank Bogota Case Study
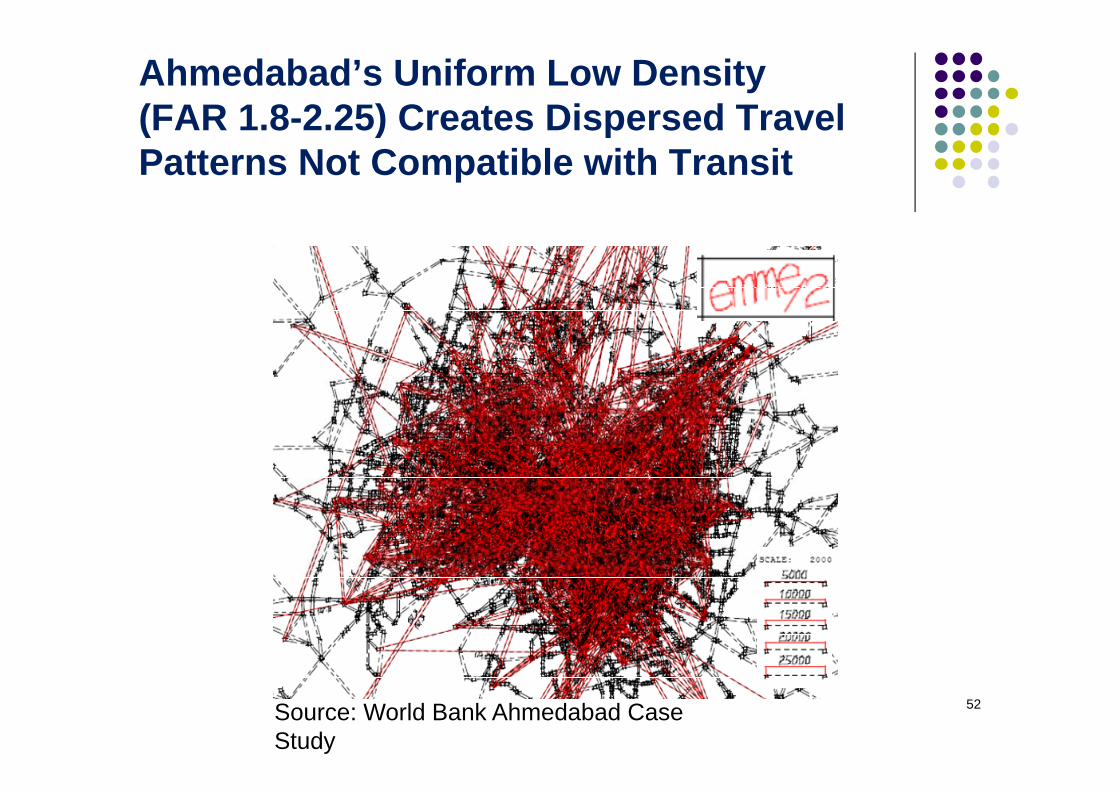
Ahmedabad’s Uniform Low Density (FAR 1.8-2.25) Creates Dispersed Travel Patterns Not Compatible with Transit
52Source: World Bank Ahmedabad Case Study

Source: Alejandro Rodriguez
Missing Micro-Designs Urban & Street Design Matters
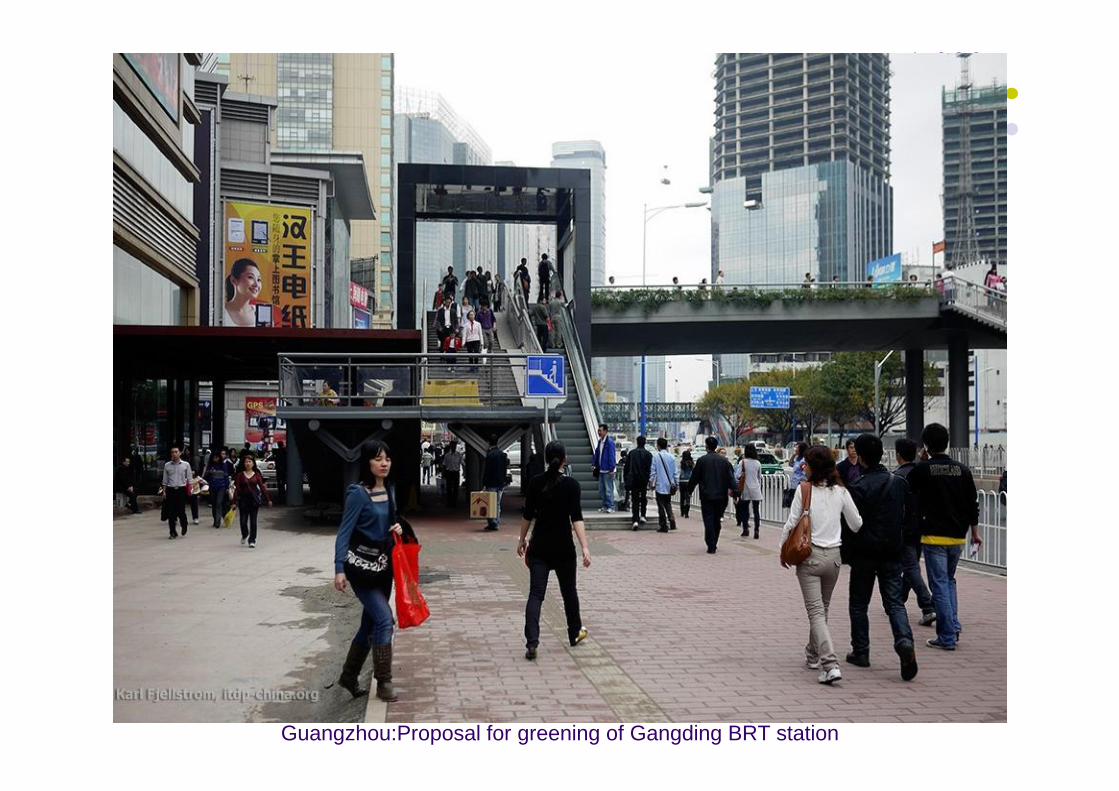
Guangzhou:Proposal for greening of Gangding BRT station

Street without Footpath in Ahmedabad
Source: ITDP India
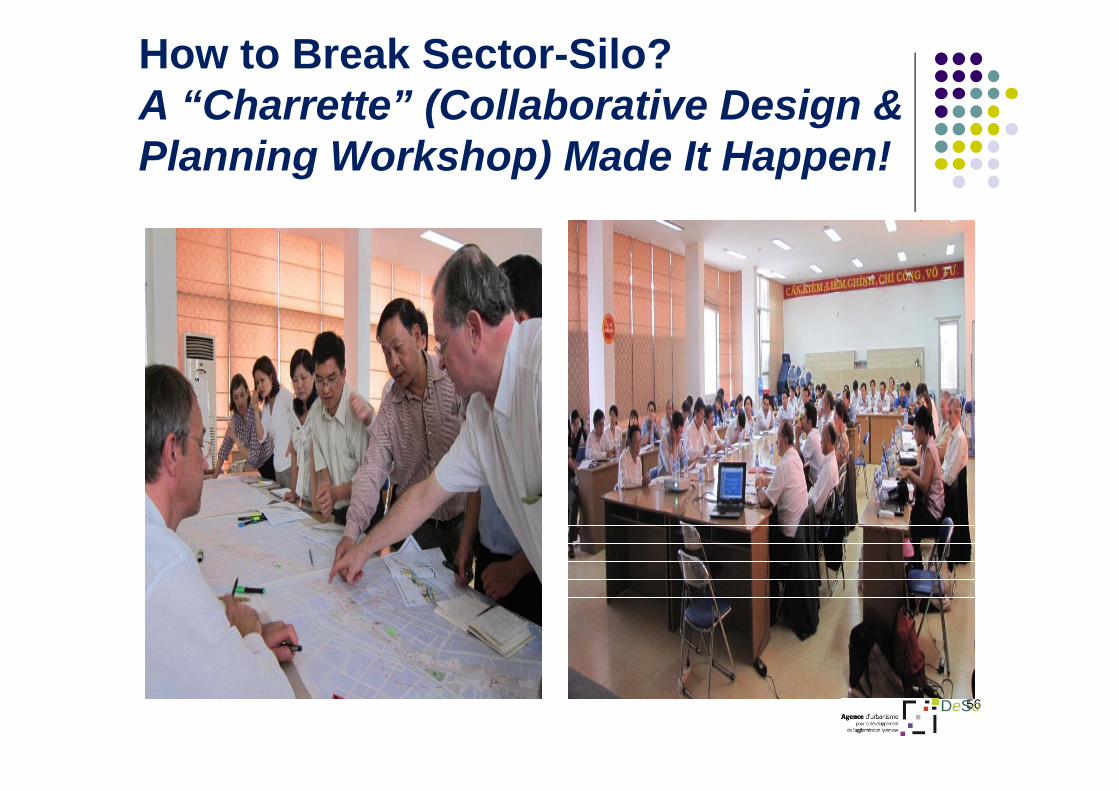
How to Break Sector-Silo? A “Charrette” (Collaborative Design & Planning Workshop) Made It Happen!
56DeSo
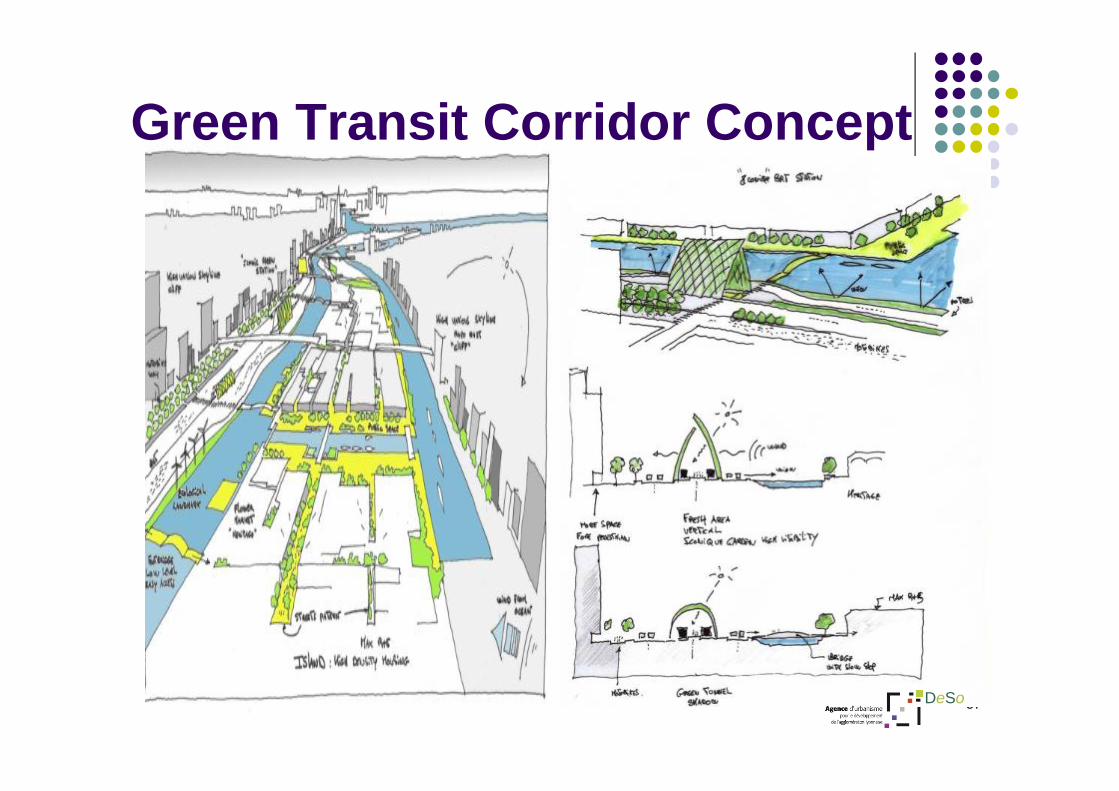
Green Transit Corridor Concept
57DeSo
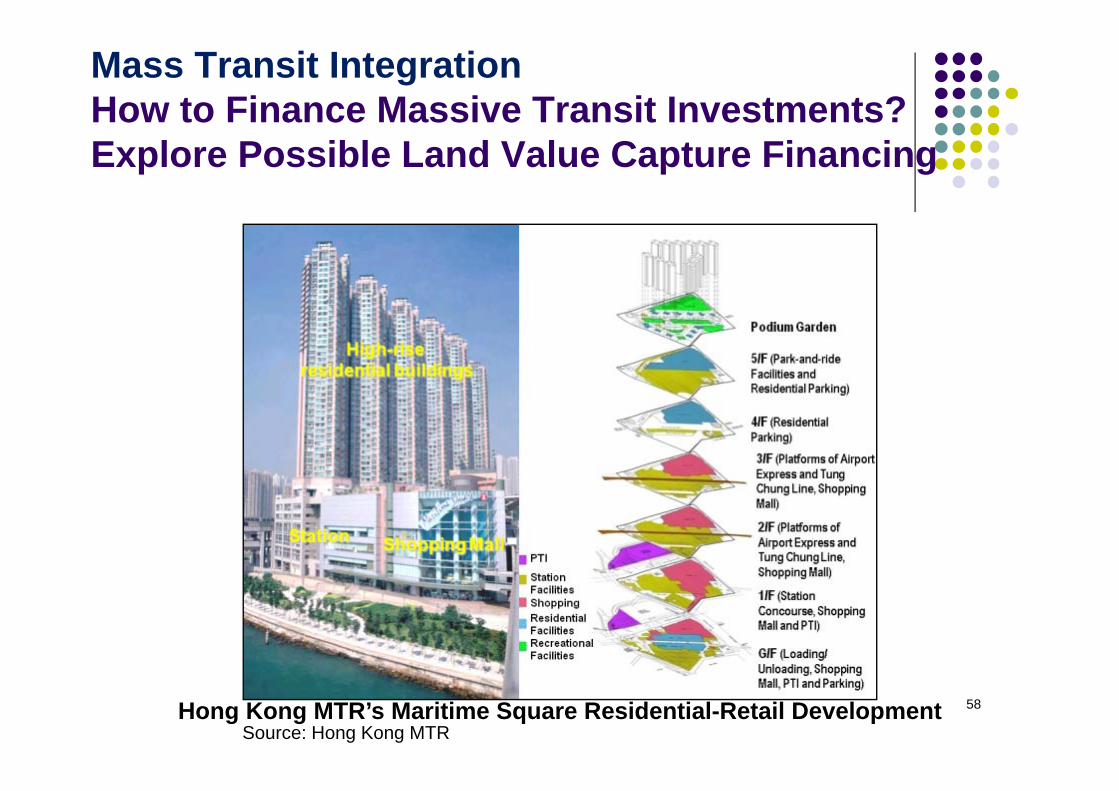
Mass Transit IntegrationHow to Finance Massive Transit Investments?Explore Possible Land Value Capture Financing
58Hong Kong MTR’s Maritime Square Residential-Retail DevelopmentSource: Hong Kong MTR
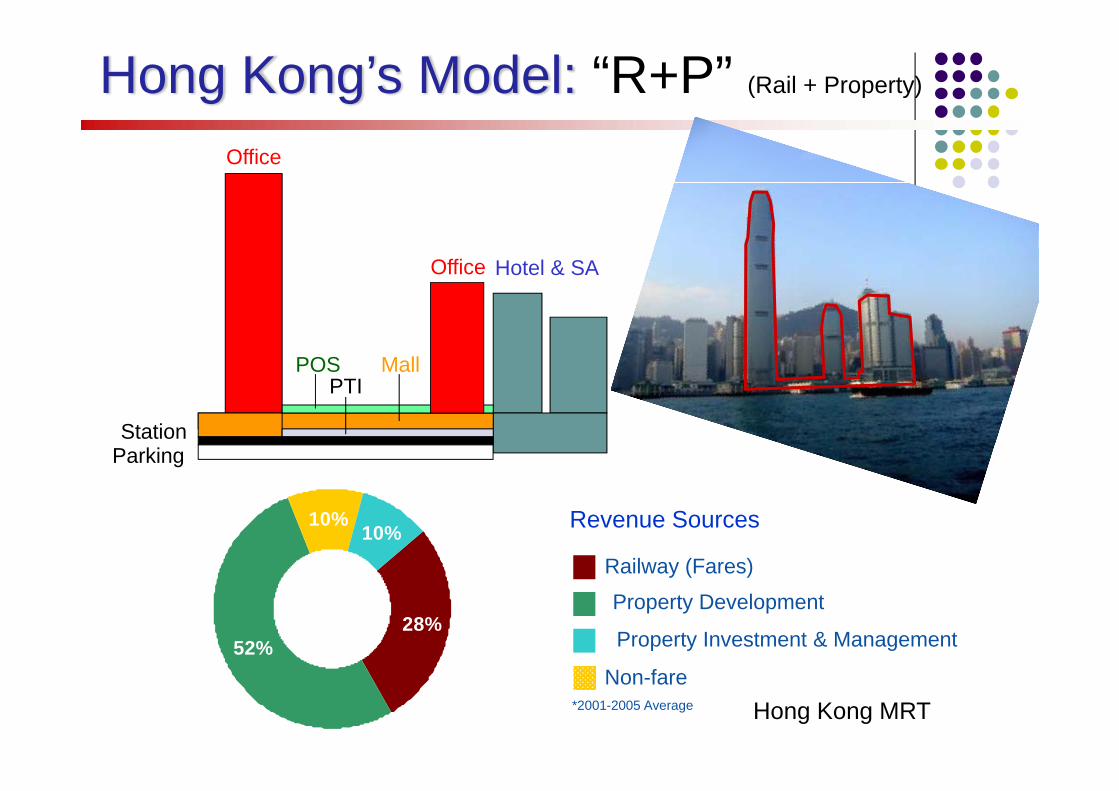
Hong Kong’s Model: “R+P” (Rail + Property)
Office
Mall
Station
PTI
Hotel & SA
POS
Parking
Office
28%52%
10%10%
Railway (Fares)
Property Development
Property Investment & Management
*2001-2005 Average
Non-fare
Revenue Sources
Hong Kong MRT

Tokyo Station City
60

Land Adjustment for TODHakusan City: Japan
61
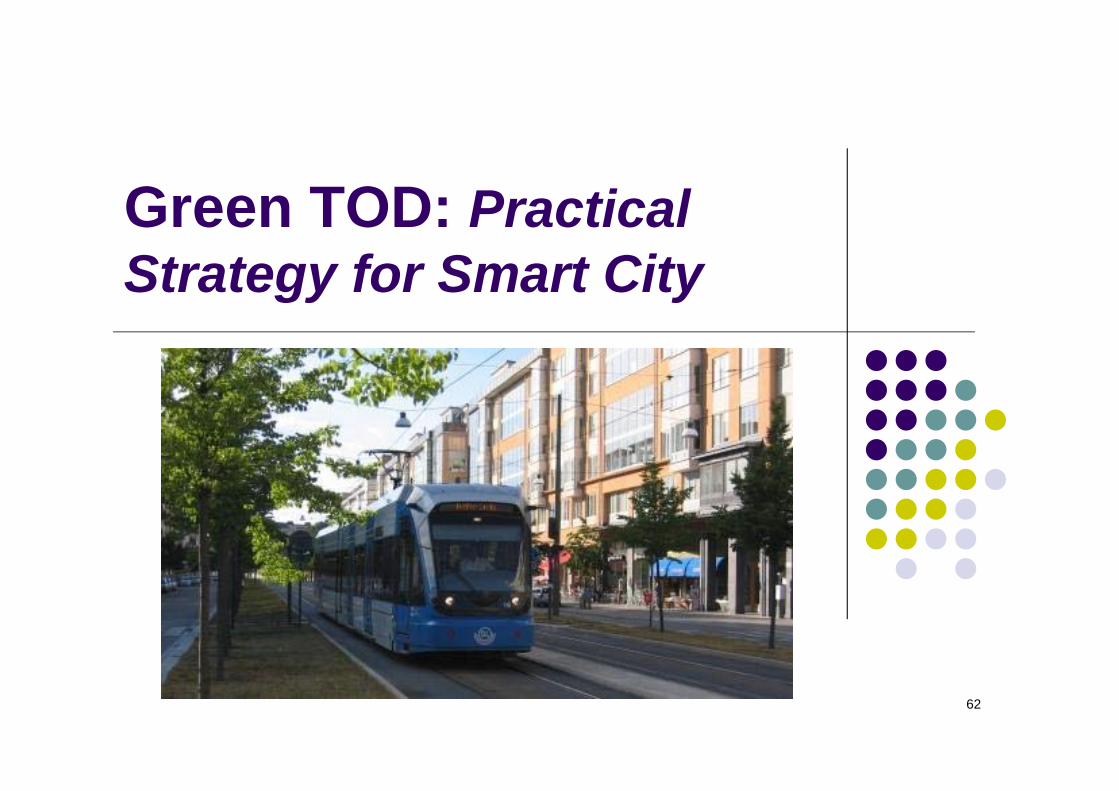
Green TOD: Practical Strategy for Smart City
62
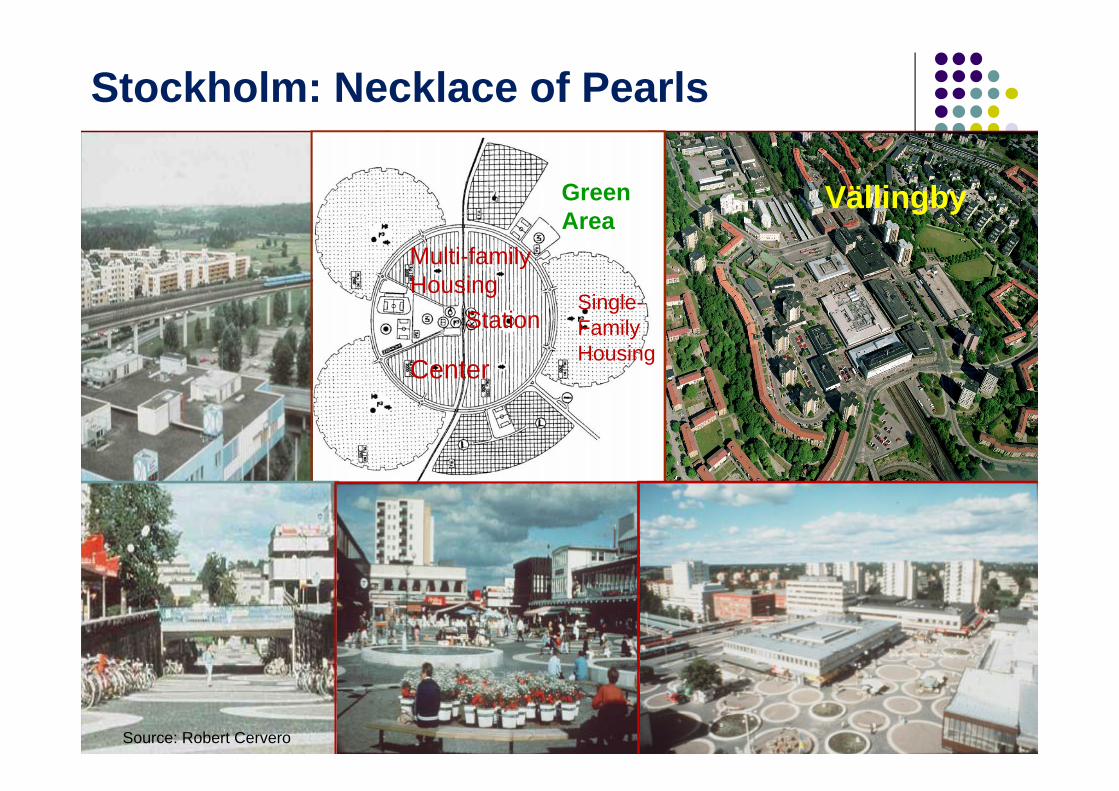
Stockholm: Necklace of Pearls
1930 1950 1970 1990
Jobs-Housing-Retail balance along corridors
PM Peak: 55%-45%directional splits
Center
Station
Multi-familyHousing
Single-FamilyHousing
GreenArea
Vällingby
Source: Robert Cervero
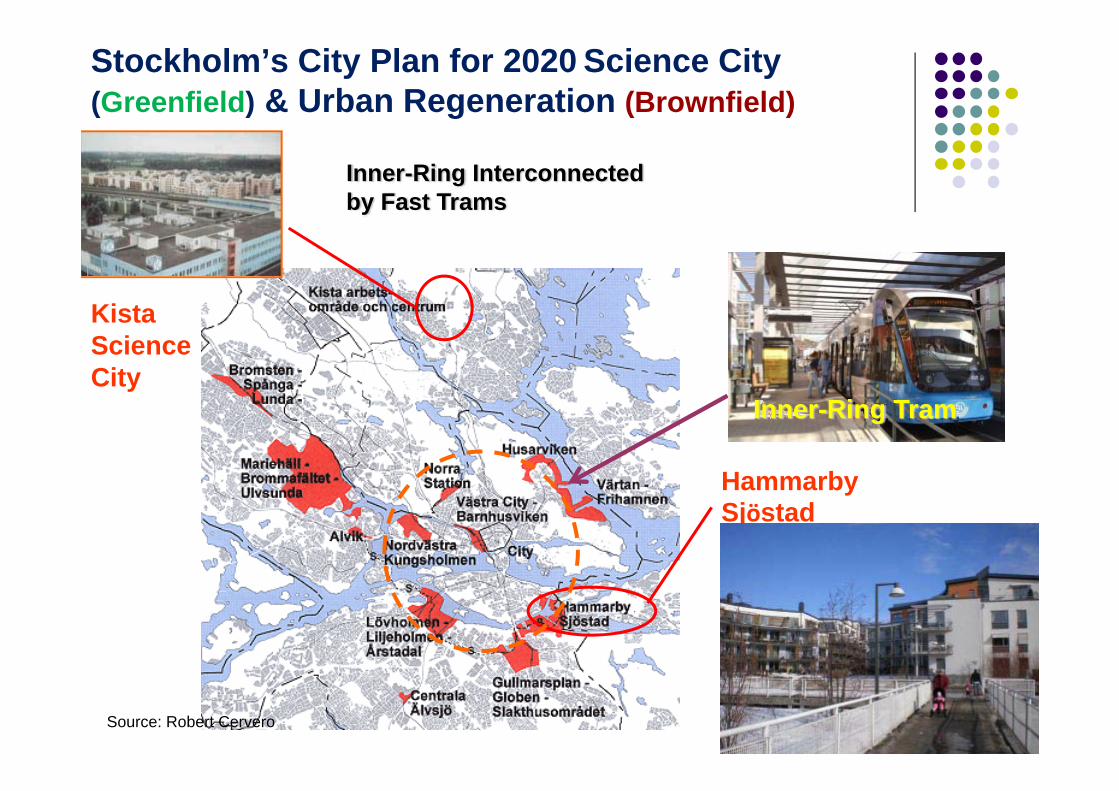
Stockholm’s City Plan for 2020 Science City (Greenfield) & Urban Regeneration (Brownfield)
Kista Science City
Hammarby Sjöstad
Inner-Ring Interconnected by Fast Trams
Inner-Ring Tram
Source: Robert Cervero
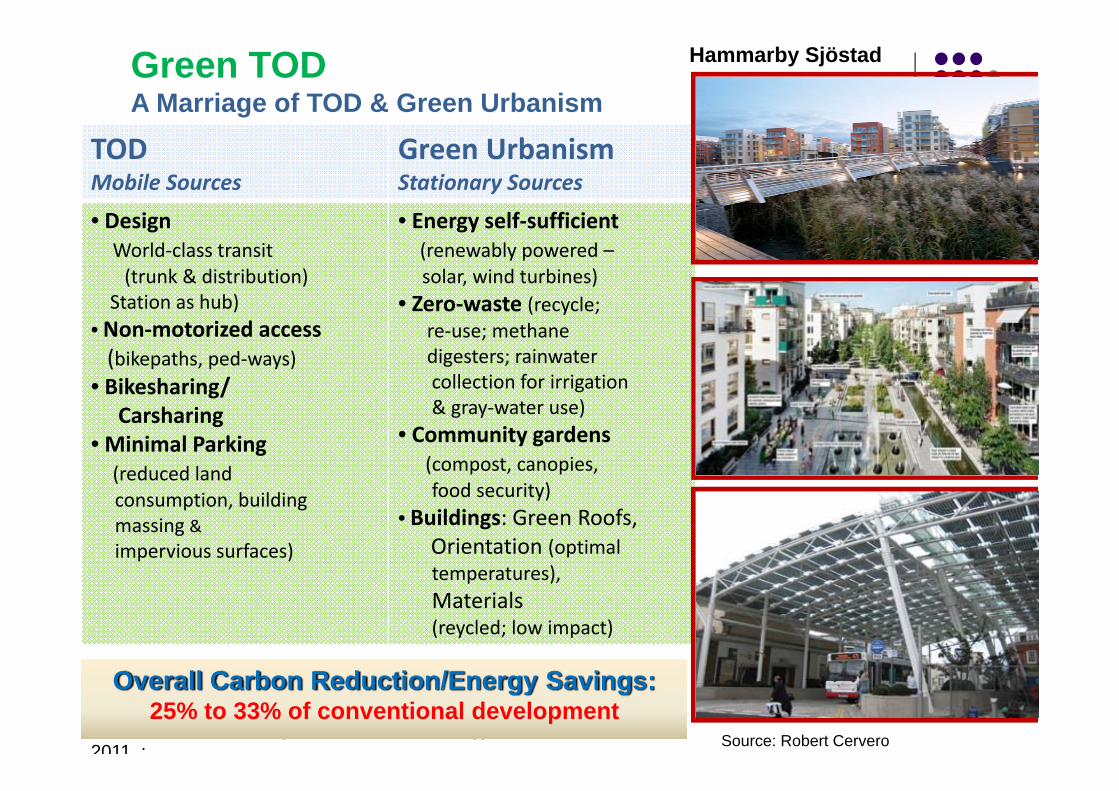
TODMobile Sources
Green UrbanismStationary Sources
• DesignWorld‐class transit(trunk & distribution)
Station as hub)• Non‐motorized access(bikepaths, ped‐ways)
• Bikesharing/Carsharing
• Minimal Parking (reduced land consumption, buildingmassing &impervious surfaces)
• Energy self‐sufficient (renewably powered –solar, wind turbines)
• Zero‐waste (recycle;re‐use; methane digesters; rainwater collection for irrigation& gray‐water use)
• Community gardens(compost, canopies, food security)
• Buildings: Green Roofs, Orientation (optimal temperatures), Materials (reycled; low impact)
Green TODA Marriage of TOD & Green Urbanism
R. Cervero and K. Sullivan, 2011, Green TODs: Marrying Transit-Oriented Development and Green Urbanism. International Journal of Sustainable Development & World Ecology, Vol. 18, No. 3, 2011 ;
Overall Carbon Reduction/Energy Savings: 25% to 33% of conventional development
Hammarby Sjöstad
Source: Robert Cervero

Transport Program
Skinny Streets/Traffic Calming
Congestion Pricing
Bike-ped Bridge
Tramway
Hammarby Sjöstad: Just outside Congestion Pricing Cordon
Source: Robert Cervero
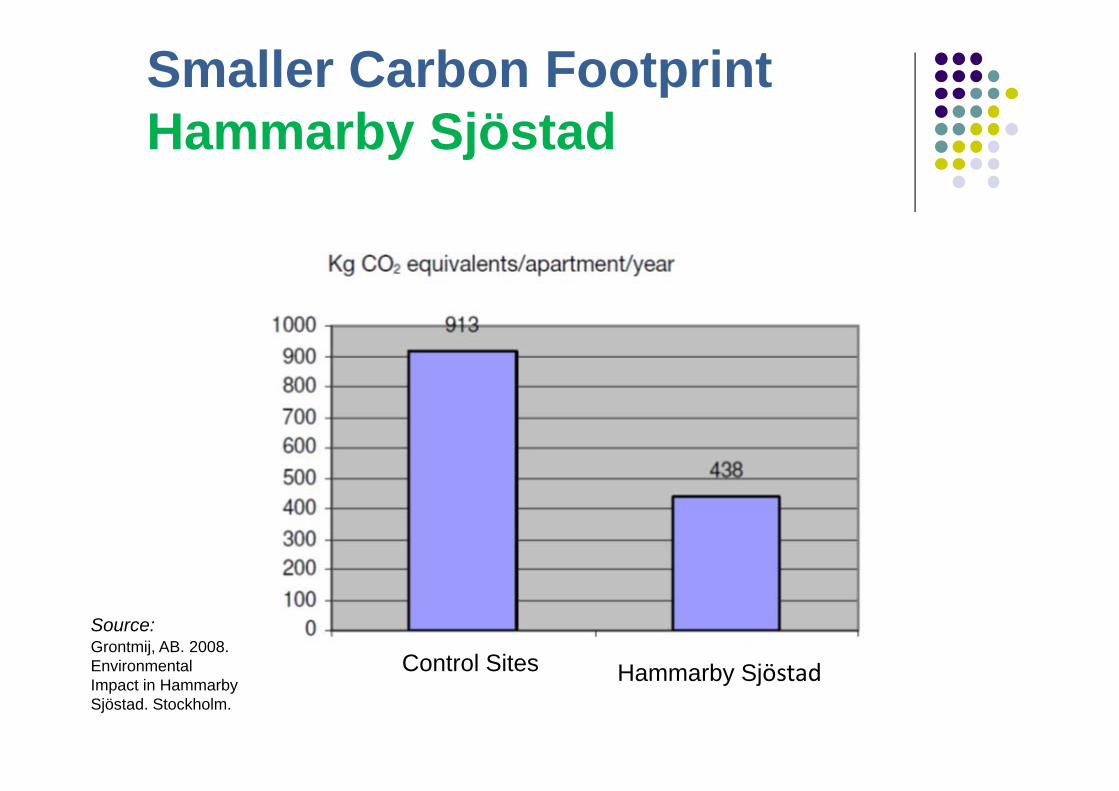
Smaller Carbon FootprintHammarby Sjöstad
Control Sites Hammarby Sjöstad
Source:Grontmij, AB. 2008. EnvironmentalImpact in Hammarby Sjöstad. Stockholm.

Conclusion
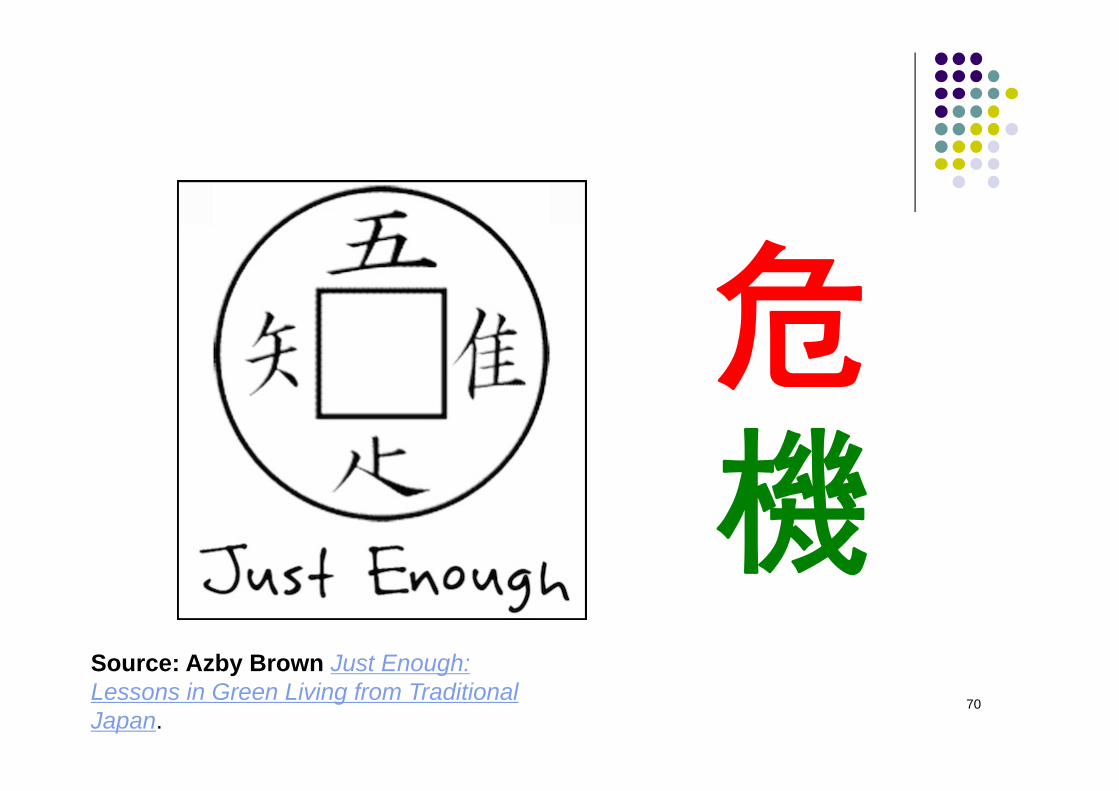
危機
68Source: Azby Brown Just Enough: Lessons in Green Living from Traditional Japan.
EDO (Tokyo) 1 Million City in 18th
Century
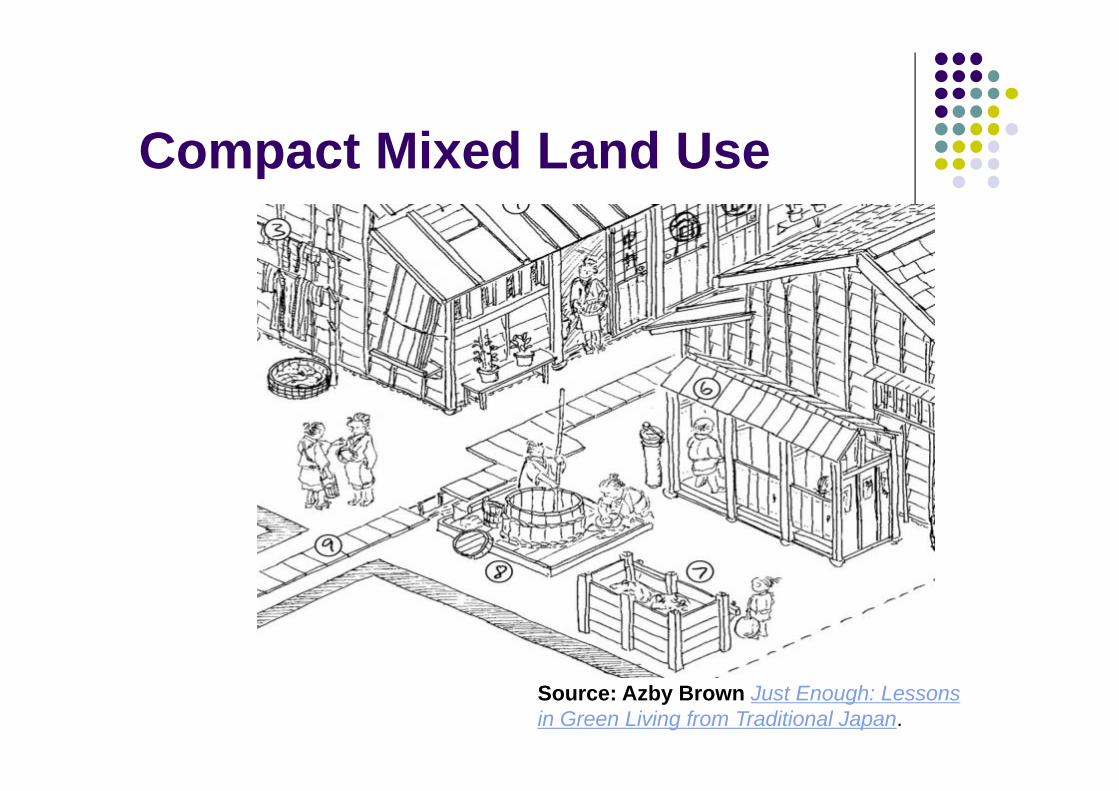
Compact Mixed Land Use
Source: Azby Brown Just Enough: Lessons in Green Living from Traditional Japan.
70
危機
Source: Azby Brown Just Enough: Lessons in Green Living from Traditional Japan.