Embed Size (px)
Citation preview

ISSN: 0128-7702Pertanika J. Soc. Sci. & Hum. 19 (2): 273 - 289 (2011) © Universiti Putra Malaysia Press
Received: 25 May 2009Accepted: 3 January 2011
INTRODUCTIONWord-of-Mouth Marketing, or WOMM, is a term used in the marketing and advertising industry to describe activities that companies undertake to generate personal recommendations as well as referrals for brand names, products and services. This form of communication has valuable source credibility, as people are generally be inclined to trust someone’s opinion if they feel that it is offered freely and without prompting, compulsion, or personal interest in communicating the information. In addition, people are more inclined to believe the word-of-mouth promotion than more formal forms of promotion (i.e. advertising) because it is assumed that the communicator is satisfied by
the goods or services provided and is unlikely to have an ulterior motive (i.e. they are not out to sell you something). Moreover, people tend to believe people whom they know. In brief, WOMM is a marketing phenomenon that facilitates and encourages people to pass along a marketing message voluntarily (Grewal et al., 2003).
Word-of-mouth (WOM) is considered one of the oldest forms of marketing communication, whether from the vendor, experts, or social acquaintances including friends and family. It may also be one of the most powerful channels, particularly if the provider of WOM is someone known and trusted. WOM is considered as a key ingredient in the success or failure of a
The Willingness to Generate Positive Word of Mouth Marketing: The Case of Students in Private Universities in Jordan
Hamza Salim KhraimChair of Marketing Department,
Faculty of Business, Middle East University,
P.O.Box 383, Amman 11610E-mail: [email protected]
ABSTRACTWord-of-mouth marketing is highly recognized as one of the most prominent and powerful tools affecting consumer decision making. This study attempts to examine the willingness of students in private universities to generate positive WOM marketing where inadequate research and literature in Arab countries about such issue is a major concern. The model for this study contends that satisfaction, incentives, experience, and the source has a significant influence on students’ willingness to use WOM. These propositions are investigated using data collected from three private universities in Amman-Jordan. Empirical support was found for three of our hypotheses. A key finding is that satisfaction, experience, and the source have significant influence on students’ willingness to use positive WOM. Thus, it is concluded that with a discussion of how to use those variables in fostering interpersonal relationships between the university and the students in order to increase the likelihood of students’ positive WOM behaviour.
Keywords: Word of mouth, marketing, private universities, decision making, Jordan

Hamza Salim Khraim
274 Pertanika J. Soc. Sci. & Hum. Vol. 19 (2) 2011
new business, because it is very powerful in making decision easier and in accelerating decision process. Furthermore, WOM is the least expensive, yet at the same time, the most credible form of advertising (Clow & Baak, 2007). It is becoming clearer that marketing success is determined more by the time it takes for customers to decide on a product than by any other single factor.
According to Silverman (2001b, p.15) WOM accelerates the process of customer decision-making, from deciding to decide, asking for information, weighing options, evaluating a free trial, and then finally, becoming a customer and advocate. He maintains that:
• The best way to increase profit is to accelerate favourable product decisions.
• The best way to accelerate product decisions is to make them easier.
• The best way to make the decision easier is to deliver word of mouth, instead of confusing, low-credibility information in the form of advertising, or other traditional marketing.
In addition to this, most external search studies include WOM communication as one source of information on which consumers rely on, in addition to other forms of search to create an index of total external search (e.g., Blech & Blech, 2007). More importantly, WOM differs from other information sources in several important ways. WOM communications differ from non-personal sources of external information in that the WOM channel is immediately bi-directional and interactive. The importance of WOM has been confirmed by Donaton (2003) who concludes that one American in 10 tells the other nine how to vote, where to eat, and what to buy. He highlights research showing how influential WOM has become and focuses on the people most responsible for spreading it. His findings show the majority of people rely more than ever on friends and family, rather than advertising or editorial, to decide which restaurants to try,
places to visit, prescription drugs to purchase, hotels to stay in and videos to rent. “It really a critical shift point and marketers need to think about it fundamentally, not just think of throwing on a word of mouth element’’ to marketing plans.
Opinion leader group can play very important role as human information processors and it can help in generating WOM. It has been suggested that opinion leaders exert a “disproportionate amount of influence on the decisions of other consumers” (Flynn et al., 1994). Thus, the opinion leader group has the potential to be very important to marketers in disseminating product and company messages and therefore, it is considered as an essential part of the overall communication strategy.
This study focuses on a very important sector in Jordan, which is higher education and in particular, private universities. In the years between 2000/2001 and 2006/2007, Jordan saw an increased demand for higher education with enrolments growing at an annual rate of 14 percent from 77,841 to 218,900 students. In specific, private universities have seen a rapid increase in their enrolments. From 2000 to 2006, the enrolments in 12 private universities grew by about 18 percent annually from 36,642 to 55,744. With an increasing number of students going for the attainment of higher education, the government needs to allocate greater resources in improving the current higher education system and to improve access of good universities for the rising population. In particular, private universities have to change some of their admission policies. The enrolment cap in the private universities restricts the ability of university to absorb increasing number of higher education students. Projection for the number of students entering university is 92,000 per year by 2013, up from 50,469 in 2005.
The paper begins with listing research objectives, followed by a detailed literature review that highlights key issues of WOM. Accordingly, the next section focuses on research methodology, while the final section provides conclusions and discussion.

The Willingness to Generate Positive Word of Mouth Marketing
275Pertanika J. Soc. Sci. & Hum. Vol. 19 (2) 2011
RESEARCH OBJECTIVESThere has been a lot of marketing research on WOM, but not many has focused on covering the willingness of students in private universities to generate positive WOM. This paper fills this gap with the main objectives of this research as follows:
1. To examine the willingness of the students to generate positive WOM in private universities.
2. To identify the most important sources of positive WOM which have more influence on students; and,
3. To explore the way in which WOM operates in the cultures other than the Western.
LITERATURE REVIEWTo clarify the distinctive features of WOM, this section will shed light on different issues which include definition of WOM, power of WOM, the levels of WOM and empirical research related to WOM.
Definition of WOMThe most common definition used for WOM communication is that of Arndt (1967) who states that it is an oral person-to-person communication between a receiver and a communicator from whom the person perceives as non-commercial, regarding brand, product or a service. Meanwhile, Silverman (1997) defines WOM as informal communications about products, services, or ideas between people who are independent of the company providing the product or service, in a medium independent of the company. Patton (2000) defines it as a message about the products or services offered by an organization or about the organization itself, which involves comments about product performance, service quality and trustworthiness passed on from one person to another. Finally, Stokes & Lomax (2002) define WOM communications as all interpersonal communication regarding products or services where the receiver regards the communicator as impartial.
Power of WOMWOM is more credible than any most sincere salesperson. It is able to reach more people, is faster than advertising, direct mail, and even the Internet, because it can spread like wildfire. It breaks through the clutter and the noise better than anything (Silverman & Eve, 2000). Even more important than its credibility, reach, speed and ability to break through the clutter, is its ability to get people to act. People think that WOM is so powerful because of its objective, and independent nature. Why is that so important? This is because a decision maker is more likely to get the whole, undistorted truth from an independent third party who has interest in promoting your point of view. This unique credibility gives word of mouth much of its power. There are some other reasons why word of mouth is so powerful, and these include:
It is more relevant and complete. WOM is “live,” and not be canned like most company communications. That means it is custom-tailored to the people who are participating in it. People are not giving a pitch; they are responding to questions, though most important questions, the ones the decision-makers themselves are asking. Therefore, customers pay more attention because it is perceived as more relevant and more complete than any other form of communication.
It is the most honest medium. Because it is custom-tailored, and because people are independent of the company, it is the most honest medium, and customers know it. Advertising and salespeople are notoriously biased and not fully truthful. The inherent honesty of word of mouth further adds to its credibility.
It is customer driven. Closely related to the above, word of mouth is the most customers driven of all communication channels. The customer determines who he/she will talk to, what he/she will ask, whether he/she will continue to listen or politely change the subject, etc.
I t is a mysterious, invisible force . Despite all of its overwhelming power, it is invisible. It is sometimes called “underground” communication, or the grapevine.

Hamza Salim Khraim
276 Pertanika J. Soc. Sci. & Hum. Vol. 19 (2) 2011
It feeds on itself. Word of mouth is like a breeder reactor. It is self generating, it feeds on itself. It does not use up anything. If 10 people have 10 experiences, there are 100 direct experiences. If each tells 10 people about their own experiences, that is an additional 1000 (indirect) experiences, which can be just as powerful as the direct experiences. If they each tell ten people, that is an additional 1,000 people who now have 10,000 experiences in their heads, and so on.
Levels of WOMAccording to Silverman (2001) there are several levels of word of mouth that are quite different from each other and these vary both in nature and intensity. Nine levels of WOM, ranging from the “minus 4” level, where the talk about product is only negative, to the “plus 4” level, where every one is raving about the product.
-4 (Negative) WOM +4 (Positive)
Level 1 (Minus 4): People are taking about a product and complaining about it. It has reached to the level of public scandal. People are asking each other about it and actively dissuading other people from using it. If this is a short-term emergency, such as product recall that is reacted too quickly and responsibly, the product can survive.
Level 2 (Minus 3): Customers and ex-customers go out of their way to convince the other people not to use the product, but it has not reached the scandal proportions. Similar to level Minus 4, almost nothing can survive this level.
Level 3 (Minus 2): When asked, customers rant, although they do not go out of their way to badmouth the product. They go on and on about how terrible the product is. The product sales will slowly erode in this situation. The process will be slower because the people are not actively seeking each other out to spread negative WOM.
Level 4 (Minus 1): In this stage, people are not actively complaining about product, but when they are asked, they have relatively
negative things to say. Here, advertisement and other conventional marketing can sometimes provide a holding action, but very little progress will be made.
Level 5 (Zero): At this level, people use product, but are rarely asked about it. They do not volunteer their opinion. If they are asked, they will have little (good or bad) to say about it. This product is getting little or no WOM. It is probably going to cost a fortune to get such a product widely accepted. It is the level where most products are.
Level 6 (Plus 1): When asked, people have nice things to say about the product. For example, people may not necessarily go out of their way to tell anybody about a product or a service from local merchants, such as dry cleaners or restaurants; however, if asked, they will say it is good, reliable, or any of the other nice things that are true about the product.
Level 7 (Plus 2): When asked, customers rave. They go on and on about how wonderful the product is. Here, conventional marketing is almost completely wasted because it is much less powerful that what is sitting there for the talking. What is needed is for you to provide the channels and materials for your customers to rave.
Level 8 (Plus 3): At this level, customers go out of their way to convince other people to use the product. This is what people talk about at parties; the new movie, the latest restaurant, the latest book. Again, provide the encouragement and the channels, facilitate the process, and build a bigger plant.
Level 9 (Plus 4): Product is being talked about continually; people are asking each other about it. Experts, local influences, typical customers, and prospects are all talking with each other about the product or the service and raving about its virtues. It is getting a considerable amount of publicity. At this level, it is especially necessary to manage people’s expectations. Otherwise, people will expect much more than will be delivered, which is a sure recipe for disappointment. In this kind of a situation, sales are often growing at such a rapid rate that the company cannot maintain quality.
The Willingness to Generate Positive Word of Mouth Marketing
277Pertanika J. Soc. Sci. & Hum. Vol. 19 (2) 2011
Once again, expectations must be managed. Some examples of the companies representing level Plus 4 are such as Lexus Automobiles, Harley-Davidson and Apple computer.
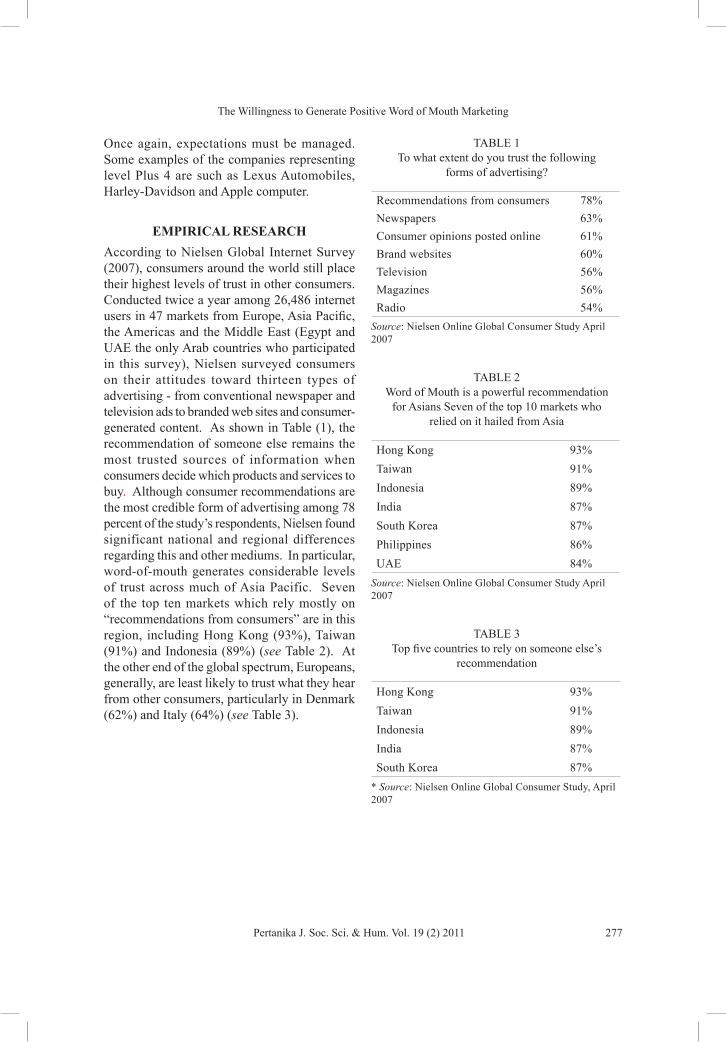
EMPIRICAL RESEARCHAccording to Nielsen Global Internet Survey (2007), consumers around the world still place their highest levels of trust in other consumers. Conducted twice a year among 26,486 internet users in 47 markets from Europe, Asia Pacific, the Americas and the Middle East (Egypt and UAE the only Arab countries who participated in this survey), Nielsen surveyed consumers on their attitudes toward thirteen types of advertising - from conventional newspaper and television ads to branded web sites and consumer-generated content. As shown in Table (1), the recommendation of someone else remains the most trusted sources of information when consumers decide which products and services to buy. Although consumer recommendations are the most credible form of advertising among 78 percent of the study’s respondents, Nielsen found significant national and regional differences regarding this and other mediums. In particular, word-of-mouth generates considerable levels of trust across much of Asia Pacific. Seven of the top ten markets which rely mostly on “recommendations from consumers” are in this region, including Hong Kong (93%), Taiwan (91%) and Indonesia (89%) (see Table 2). At the other end of the global spectrum, Europeans, generally, are least likely to trust what they hear from other consumers, particularly in Denmark (62%) and Italy (64%) (see Table 3).
TABLE 1 To what extent do you trust the following
forms of advertising?
Recommendations from consumers 78%Newspapers 63%Consumer opinions posted online 61%Brand websites 60%Television 56%Magazines 56%Radio 54%
Source: Nielsen Online Global Consumer Study April 2007
TABLE 2 Word of Mouth is a powerful recommendation
for Asians Seven of the top 10 markets who relied on it hailed from Asia
Hong Kong 93%Taiwan 91%Indonesia 89%India 87%South Korea 87%Philippines 86%UAE 84%
Source: Nielsen Online Global Consumer Study April 2007
TABLE 3 Top five countries to rely on someone else’s
recommendation
Hong Kong 93%Taiwan 91%Indonesia 89%India 87%South Korea 87%
* Source: Nielsen Online Global Consumer Study, April 2007

Hamza Salim Khraim
278 Pertanika J. Soc. Sci. & Hum. Vol. 19 (2) 2011
Sweidan (2009) carried the only study on word-of-mouth in Jordan. This study attempted to examine the effect of the word-of-mouth communication on consumers’ purchasing decisions concerning his/her selections and loyalty toward certain brand names. In addition, the study also tried to identify the effects of demographic variables on the consumers’ selection. The major finding of this study indicates that there is a strong effect of the WOM on consumers’ purchasing decision regarding the selection and loyalty to certain brand names. The study also reveals that friends and relatives are the most influential power prior to purchasing decision. Finally, the WOM communication influences male consumers more than the females.
Ying & Chung (2008) investigate how attitude towards purchase intention of a product is affected by involvement level and presentation order of positive and negative WOM information when presented in a single-message single-source context. Two studies were conducted with undergraduates of a top Asian university using experimental setups. It was found that the subjects tended to base their evaluations more on later information than earlier information regardless of the involvement level. Meanwhile, this recency effect was consistently found across the product categories of tourist destination and restaurant in both studies. Despite obtaining differences between high and low involvement levels in the pre-test for both products, the difference was found again in only the restaurant category in the manipulation check of both studies. Thus, the findings of this paper could be used to help companies to position messages in their favour when both positive and negative information needs to be presented.
The purposes of Ferguson’s (2008) paper were to study word-of-mouth and viral marketing, and to determine their measurability in terms of return on investment (ROI). The study examined real-life campaigns from well-known companies and attempted to measure consumers’ response beyond merely viewing or participating in the campaign. In more specific, the study looked into much of an actionable
response can be evoked and measured from viral and word-of-mouth campaigns. The paper explored some recognizable viral marketing campaigns and studied their effects on product sales, consumer advocacy and brand awareness. It also highlighted important factors to consider when developing word-of-mouth marketing, such as, who is doing it well, who is not, what lasting effects can a campaign deliver, and are there any effective ways to measure return on investment. The paper found that word-of-mouth or viral marketing efforts are not always a sure bet. However, a well-placed, calculated and provocative campaign can spark a firestorm of business that sometimes can be effective for years in non-terminal new mediums like the internet.
Meanwhile, in his study, Needham (2008) made an attempt to describe the ways word-of-mouth (WOM) could operate in social network platforms such as Facebook. Using Headbox, a research and seeding community for 30,000 16-25 year olds who share their thoughts, their opinions and their ideas and are rewarded for it, consumer insights on brands and how positive and negative WOM are described. The study revealed that the importance of co-creation is vital in diffusion. Co-creation implies that marketing happens with young people rather than it being directed at them. In addition to that, a new approach to marketing using social networking and a very large sample suggests that we are near to a clearer understanding of the complexities of diffusion by WOM.
According to Soutar et al. (2007), WOM represents an opportunity to organizations who continually seek new ways to achieve competitive advantage because it has a powerful influence on consumers’ attitudes and behaviours. This study aimed to investigate the complexities of the WOM concept and simultaneously examine the triggers that motivate people to offer WOM and the conditions that enhance the chance of WOM occurring. The findings revealed two key WOM themes, termed as “richness of message” and “strength of implied or explicit advocacy”, as well as various triggers and conditions which affect WOM occurrence. The study suggested
The Willingness to Generate Positive Word of Mouth Marketing
279Pertanika J. Soc. Sci. & Hum. Vol. 19 (2) 2011
that the WOM activity is more complex than previous research has argued. Managers should consider various WOM facets and, in particular, recognize WOM will be most favourable when it is positive, richly described and conveyed in a strong manner.
The study of Fong & Burton (2006) was the first to examine WOM in online discussion boards and thus provided valuable insight for marketers into this growing source of WOM. It aimed to examine and compare the frequency and content of postings on digital camera electronic discussion boards within US and China based websites. The analysis showed quantitative and qualitative differences in the content across the two sites. There were differences in the pattern of brand mentions across the two websites, and the requests for information seeking behaviour also varied across the two sites; users of EachNet were more likely to request information, thus possibly increasing the likelihood of, and the influence of, OWOM on this website. There were also significant differences in term of content, with higher country of origin (CoO) effects on EachNet. CoO effects were largely and strongly negative, and in particular, they showed high levels of negative references to brands originating from Japan.
While the objective of Podoshen’s (2006) article was to explore if there is a difference between American Jewish consumers and American non-Jewish consumers in the use of word-of-mouth and brand loyalty in response to the purchase of durable goods (automobiles). Additionally, this article also aimed to explore if there is a difference in the use of WOM and brand loyalty among American Jews with differing levels of acculturation. Nonetheless, the study showed no significant difference in brand loyalty and word-of-mouth between all American Jews and American non-Jews. However, a significant difference between highly acculturated American Jews and low-acculturated American Jews was found. The article helps firms plan their marketing strategy in terms of how they can utilize word of mouth where American Jewish consumers comprise a significant part of the target market.
The study by Wirtz & Chew (2002) examined how incentives would work to actively encourage WOM, and how incentives would potentially interact with other variables that have been shown to drive WOM. The results of the study show that satisfaction does not necessarily increase the likelihood of WOM being generated. It also shows that incentives are effective catalysts to increase the likelihood of WOM being generated by satisfied consumers and tie strength to be an important variable in explaining WOM behaviour. The findings suggest that satisfied customers are a necessary but not sufficient condition for getting positive WOM and those incentives may be an effective way to get satisfied customers to recommend a firm.
THE PROPOSED MODEL AND HYPOTHESIS
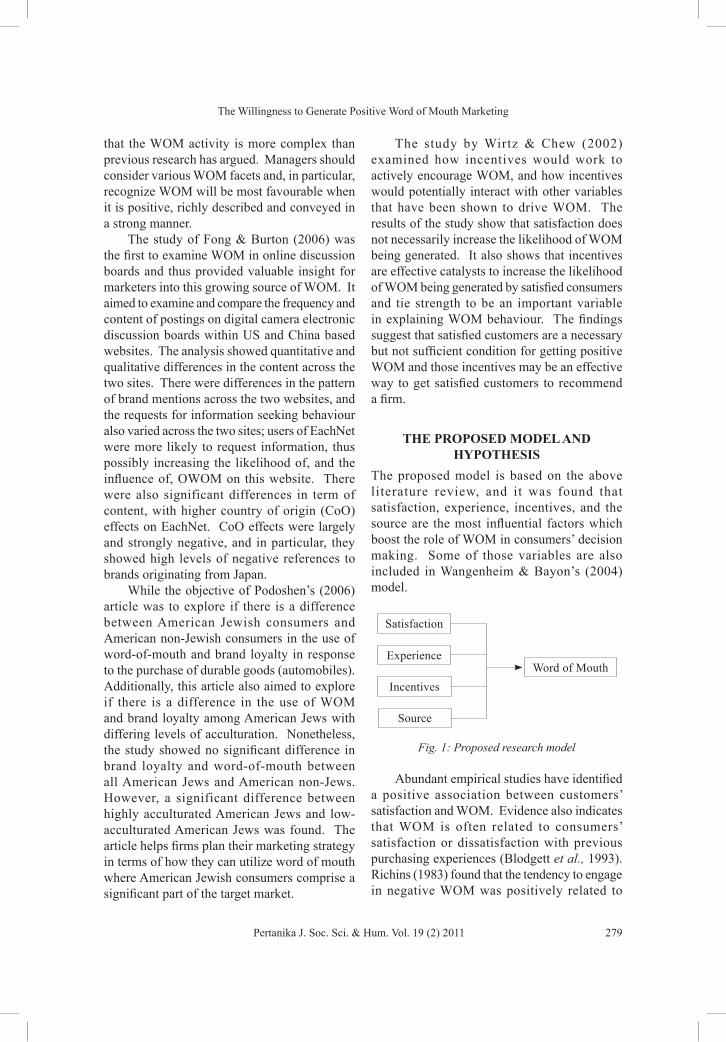
The proposed model is based on the above literature review, and it was found that satisfaction, experience, incentives, and the source are the most influential factors which boost the role of WOM in consumers’ decision making. Some of those variables are also included in Wangenheim & Bayon’s (2004) model.
Abundant empirical studies have identified a positive association between customers’ satisfaction and WOM. Evidence also indicates that WOM is often related to consumers’ satisfaction or dissatisfaction with previous purchasing experiences (Blodgett et al., 1993). Richins (1983) found that the tendency to engage in negative WOM was positively related to
Fig. 1: Proposed research model
Satisfaction
ExperienceWord of Mouth
Incentives
Source

Hamza Salim Khraim
280 Pertanika J. Soc. Sci. & Hum. Vol. 19 (2) 2011
the level of dissatisfaction. Therefore, it was expected that:
H1: Satisfaction has a significant influence on students’ willingness to use WOM.H1a: Dissatisfied students are willing to use WOM more than satisfied students.
According to Gilly et al. (1998), someone who is an expert in a particular product category should dispose of more product or purchase related information in this field and therefore, his/her opinion will be sought more often than the opinion of others. Moreover, the greater knowledge base of experts should enable them to convince others more effectively of their opinion on products and brands. To Jacoby & Hoyer (1981), experts are more often opinion leaders in a product category than other is. Therefore, it was expected that:
H2: WOM from expert and opinion leaders has a direct significant influence on students.
Satisfied customers need to feel motivated to provide WOM. People who are rewarded for a particular behaviour are more likely to engage in that behaviour again (Buhler, 1992). A monetary incentive (reward) can be used as a reinforcer to shape behaviour (Gupta & Shaw, 1998). In other words, incentives can function as an extrinsic motivator, and this motivation may increase as the incentive increases. Therefore, it was expected that:
H3: Incentives provided by universities have a direct significant influence on students’ willingness to spread positive WOM.
Consumers interact with people from a spectrum of various degrees of tie strength, ranging from strong primary (e.g. brother) to weak secondary (e.g. a seldom-contacted acquaintance). Strong ties have been shown to be more likely to be activated for information flow and are more likely to provide information (Brown & Reingen, 1987). In addition, the amount of WOM generated was higher within
groups with many strong tie relations than within the groups with many weak tie relations (Bone, 1992). This indicates that consumers engage in more WOM with strong than with weak ties. Based on that was expected:
H4: The source of WOM has a direct significant influence on students’ willingness to spread Positive WOM
RESEARCH METHODOLOGYThe questionnaire used comprised a five-point Likert-type format related to WOM. The first section contained questions about respondents’ demographics, while the second section contained questions related to WOM. The statement “I am willing to inform other students my opinion about the university according to my experience” was used to measure WOM. The questionnaire was also pre-tested by asking 22 students to complete the questionnaire to discover any difficulty or ambiguous questions. A total of 600 questionnaires were distributed through convenience sampling, out of which, 483 were returned. After checking the returned questionnaires, 33 were discarded due to incomplete responses. Thus, a total of 450 were used for the analysis. The questionnaire was distributed in Arabic language to undergraduate students enrolled in three private universities located in Amman-Jordan. To assure face validity of the translated version, the questionnaire was checked by experts in the relevant area to confirm the accuracy of the translation. A different statistical method such as Cronbach alpha, Factor Analysis, Multiple Regression, and descriptive statistics was also used to analyze the data and to test the hypothesis. In addition, the Cronbach alpha and Factor Analysis were used for testing reliability and validity, and Multiple Regression and descriptive statistics were utilized to test the hypothesis.
RESPONDENTS’ PROFILEAs shown in Table 4, the survey respondents came from a relatively broad cross-section of the students’ population. Of the respondents,

The Willingness to Generate Positive Word of Mouth Marketing
281Pertanika J. Soc. Sci. & Hum. Vol. 19 (2) 2011
32.9 percent were less than 20 years of age, 60.4 percent were between 21 and 25 years of age, and only 6.7 percent were 26 years of age or over. 70 percent of the respondents were males and 29.6 percent were females. About 12.1 percent
of the respondents were the first year students, 17.4 others in the second year, 27.5 percent in their third year, and the highest percentage (36.2) were in the fourth year, and the remaining 6.9 percent were the final year students. In term of
TABLE 4 Cross tabulation of the respondents’ profile by university
Philadelphia University
Applied Science University
Amman Private University
Total
CollegeBusiness 49(10.9%) 46 (10.2 %) 49 (20.9 %) 189 (42.0 %)Law 12 (2.7%) 6 (1.3 %) 2(0.4 %) 20 (4.4 %)Arts 16 (3.6%) 30 (6.7%) 8 (1.8 %) 54 (12.0 %)IT 15 (3.3 %) 26 (5.8 %) 6 (1.3 %) 47 (10.7 %)Science 4 (.9 %) ------ ------ 4 (.9 %)Engineering 19 (4.2 %) 26 (5.8 %) 8 (1.8 %) 53 (11.8 %)Pharmacy 35(7.8%) 12 (2.7 %) 22 (4.9 %) 69 (15.3 %)Others* ----- 4 (0.9%) 10 (2.2 %) 14 (3.1 %)Total 150 (33.3%) 150 (33.3%) 150 (33.3%) 447 (100%)AgeLess than 20 37 (8.3%) 54 (12.1%) 56(12.5%) 147(32.9%)21- 25 100 (22.4%) 82 (18.3 %) 88 (19.7%) 270 (60.4%)26-30 9 (2.0%) 8 (1.8%) 4 (.9 %) 21 (4.7 %)More than 31 1 (.2%) 6 (1.3%) 2 (.4%) 9 (2.0%)Total 147 (32.9%) 150(33.6%) 150 (33.6%) 447 (100%)Academic YearFirst year 6 (1.3 %) 18 (4.0 %) 30 (6.7 %) 54 (12.1 %)Second Year 36 (8.0%) 24 (5.4 %) 18 (4.0 %) 78 (17.4 %)Third Year 41 (9.2%) 48 (10.7%) 34 (7.6 %) 123 (27.5 %)Fourth Year 52 (11.6%) 46 (10.3%) 64 (14.3 %) 162 (36.2 %)Final year 13 (2.9 %) 14 (3.1 %) 4 (.9 %) 31 (6.9 %)Total 148 (33.01%) 150 (33.5 %) 150 (33.5%) 448 (100%)GenderMale 113 (25.1%) 88(19.6%) 116 (25.8%) 317 (70.4%)Female 37 (8.2%) 62 (13.8 %) 34 (7.6%) 133 (29.6%)Total 150(33.3%) 150(33.3%) 150(33.3%) 450 (100%)NationalityJordanian 83(18.4%) 120 (26.7%) 78(17.3%) 281(62.4%)Non Jordanian 67 (14.9%) 30 (6.7%) 72 (16.0%) 169 (37.6%)Total 150(33.3%) 150(33.3%) 150(33.3%) 450 (100%)

Hamza Salim Khraim
282 Pertanika J. Soc. Sci. & Hum. Vol. 19 (2) 2011
nationality, 62.4 percent of the respondents were Jordanian and 37.6 percent others were non-Jordanian. Colleges represented by the survey respondents were Business (42.0 percent), Law (4.4 percent), Arts (12.0 percent), IT (10.7 percent), Science (0.9 percent), Engineering (11.8 percent), Pharmacy (15.3 percent), and others (3.1 percent).
Table 5 shows the descriptive statistics used to measure the WOM items. As shown in the table, all the statements are above the 3 levels, indicating a positive indication towards generating positive WOM. The first statement received the highest mean (4.36) which indicated that if students were satisfied, they would be willing to say positive things
TABLE 5 Descriptive statistics
WOM item Mean Std. deviation
1. If I am satisfied, I will say positive things about my university 4.36 .9122. If I am not satisfied, I will say negative things about my university 3.35 1.3473. Information about financial incentives offered by the university is the
most important thing for me3.21 1.154
4. I consider senior level students as the best source for information about any university
3.41 1.967
5. When I get incentives such as scholarship, I will talk in positive way about the university
3.75 1.165
6. When I need information about a university, usually I ask my close friend
3.20 1.173
7.When I hear positive things about my university from expert people such as the Ministry of Higher Education, I will consider it
3.27 1.237
8. When I hear in the media positive things about my university, such as library, computer labs, I will consider it
3.14 1.178
9. If advertisement contains little information, usually I seek information from friends and relatives
3.87 .859
10. Information coming from the university employee’s (registration dept.) highly influences my attitude towards the university
3.25 1.123
11. Information about the academic faculty highly influences my attitude towards the university
3.44 1.164
12. Even when I am not satisfied from the university, still I will say positive things about it
3.31 1.252
13. Information from experts and opinion leaders create positive attitude about my university
3.82 1.073
14. I am willing to inform other students my opinion about the university according to my experience
3.57 1.021
15. The information that I get from my friends is more valuable than different types of advertisement
3.95 1.035
16. I prefer to depend on various sources rather than relying solely on friend
3.77 1.228
The Willingness to Generate Positive Word of Mouth Marketing
283Pertanika J. Soc. Sci. & Hum. Vol. 19 (2) 2011
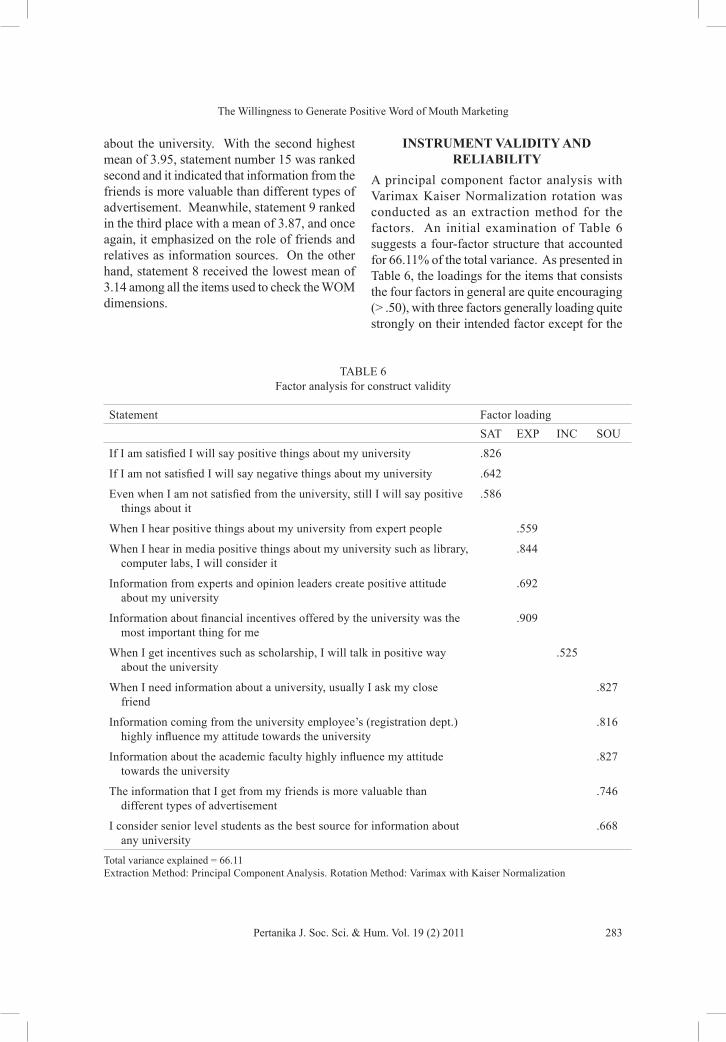
about the university. With the second highest mean of 3.95, statement number 15 was ranked second and it indicated that information from the friends is more valuable than different types of advertisement. Meanwhile, statement 9 ranked in the third place with a mean of 3.87, and once again, it emphasized on the role of friends and relatives as information sources. On the other hand, statement 8 received the lowest mean of 3.14 among all the items used to check the WOM dimensions.
INSTRUMENT VALIDITY AND RELIABILITY
A principal component factor analysis with Varimax Kaiser Normalization rotation was conducted as an extraction method for the factors. An initial examination of Table 6 suggests a four-factor structure that accounted for 66.11% of the total variance. As presented in Table 6, the loadings for the items that consists the four factors in general are quite encouraging (> .50), with three factors generally loading quite strongly on their intended factor except for the
TABLE 6 Factor analysis for construct validity
Statement Factor loadingSAT EXP INC SOU
If I am satisfied I will say positive things about my university .826
If I am not satisfied I will say negative things about my university .642
Even when I am not satisfied from the university, still I will say positive things about it
.586
When I hear positive things about my university from expert people .559
When I hear in media positive things about my university such as library, computer labs, I will consider it
.844
Information from experts and opinion leaders create positive attitude about my university
.692
Information about financial incentives offered by the university was the most important thing for me
.909
When I get incentives such as scholarship, I will talk in positive way about the university
.525
When I need information about a university, usually I ask my close friend
.827
Information coming from the university employee’s (registration dept.) highly influence my attitude towards the university
.816
Information about the academic faculty highly influence my attitude towards the university
.827
The information that I get from my friends is more valuable than different types of advertisement
.746
I consider senior level students as the best source for information about any university
.668
Total variance explained = 66.11Extraction Method: Principal Component Analysis. Rotation Method: Varimax with Kaiser Normalization

Hamza Salim Khraim
284 Pertanika J. Soc. Sci. & Hum. Vol. 19 (2) 2011
third factor, incentives with only two items. All the items (except two) have loaded on their hypothesized factors; therefore, convergent and discriminant validity for all constructs is supported.
INSTRUMENT RELIABILITYAll the scales (except one) performed well on the tests conducted to assess the quality of the measures used in the present study. The instrument for measuring satisfaction, experience, and source showed satisfactory internal consistency (all Cronbach alphas > 0.70) as suggested by Nunnally (1978). However, the instrument for measuring incentives performed poorly (alpha =0.62), although the scale had shown a good reliability in the pre-test (alpha =0.71).
TABLE 7 Cronbach’s alpha for the scales
Variable No. of cases
No. of items
Alpha
Satisfaction 450 3 0.88Experience 450 3 0.75Source 450 5 0.83Incentives 450 2 0.62
DATA ANALYSIS AND HYPOTHESIS TESTING
To test the proposed model for this study, the Multiple Regression Analysis was used, as it allows the researchers to investigate a set of independent and dependent variables. As shown in Table 9, the Variance Inflation factor (VIF) indicates that Multicollinearity does not cause any problem since all independent variables
TABLE 8Model testing
Unstandardized coefficients Unstandardized coefficients
t Sig Collinearity statistics
B Std. error Beta Tolerance VIF(Constant) 1.412 .384 3.678 .000SAT .245 .070 .164 3.506 .001 .938 1.067EXP .236 .063 .175 3.750 .000 .947 1.056INC 3.369E .058 .003 .058 .954 .945 1.058SOU .252 .086 .140 2.949 .003 .905 1.105
TABLE 9 Model summary
Model R R square Adjusted R square
Std. error of the estimate
Durbin-Waston
1 .532a .310 .309 .8776 1.945(Constant), SOU, INC, EXP, SAT

The Willingness to Generate Positive Word of Mouth Marketing
285Pertanika J. Soc. Sci. & Hum. Vol. 19 (2) 2011
are below the threshold of 10 (Neter & Kunter, 1990). Furthermore, when the tolerance value is above .60, it is also considered as an evidence of the absence of multicollinearity among the independent variables as indicated by Hair et al. (1995). Accordingly, the Durbin-Watson test statistic shown in Table 8 is very close to 2, indicating that the adjacent residuals are uncorrelated (Anderson et al., 1990). In addition to that, Table 8 also indicates that three out of four casual of relationships between the variables proposed in our model are highly supported.
Y= ß0 + ß1 Sat + ß2 Exp + ß3 Sour + ß4 Inco + e
HYPOTHESIS TESTINGThe results for H1 show that satisfaction has a significant influence on students’ willingness to use WOM (t = 3.50: sig = 0.001). As for H1a, the results have indicated that satisfied students received higher mean (4.13) which is definitely higher than dissatisfied students who got only 3.20. This result goes against H1a, suggesting that satisfied students are willing to use WOM more than dissatisfied students. Therefore, H1a is not supported. This also means that satisfied students are willing to spread positive WOM more than the dissatisfied ones.
As for H2, it was found that WOM from the expert and opinion leaders has a direct significant influence on students (t = 3.75: sig = 0.000). For H3, it was found that incentives provided by the universities did not have a direct
significant influence on the students’ willingness to spread positive WOM (t = .058: sig = 0.954). Finally, H4 has proven that the source of WOM has a direct significant influence on students (t = 2.949: sig = 0.003). Table 9 summarizes the results of hypothesis testing. To achieve the second objective, it was found that statement 6 (friends) received the highest mean 3.87, while expert and opinion leaders came in the second position with 3.57. Meanwhile, the formal sources about academic faculty ranked third with 3.45.
CONCLUSIONS AND DISCUSSIONFirst, this research has contributed to marketing theory by extending the concept of WOM in two areas; from traditional durable products into new service market (education) and from Western cultures to relatively conservative eastern culture (Jordan).
In this study, the researchers hypothesized and empirically tested the proposition that satisfaction, experience, incentives, and the source could significantly influence WOM communication. The results of the present study enhanced our understanding of how WOM influences students’ willingness to spread WOM. In addition, the study has shown (as indicated in Table 8) that satisfaction, experience, and the source have a direct influence on the students. As for incentives, the result has shown no support for such a factor on the students.
TABLE 10 Results of hypothesis testing
Hypothesis ResultH1 : Satisfaction has a significant influence on students’ willingness to use WOM SupportedH1a: Dissatisfied students are willing to use WOM more than satisfied students Not supportedH2 : WOM from expert and opinion leaders has a direct significant influence on
studentsSupported
H3 : Incentives provided by universities has a direct significant influence on students willingness to spread positive WOM
Not supported
H4 : The source of WOM has a direct significant influence on students Supported
Hamza Salim Khraim
286 Pertanika J. Soc. Sci. & Hum. Vol. 19 (2) 2011
When students were satisfied, they generated positive WOM and more likely to make a recommendation, and this finding is consistent with that of Swan & Oliver (1989). The findings also show that source relationship affects WOM behaviour. Furthermore, it was found that when satisfied, consumers are willing make a recommendation to relatives and friends, which is consistent with Richins’ (1987) findings. Therefore, ongoing market research in relation to the current student satisfaction should be undertaken to ensure that the needs of students are being continually met.
Due to the fact that most students search for information before making such a high-involvement decision as to which university to attend, simple strategies for universities interested in targeting new students would be to arrange to have opinion leaders within their reference groups talk with students. While having a weekend for friends or siblings might work quite well in targeting students, such a procedure would be prohibitively expensive as a strategy for enrolling students. Selecting “successful” graduates to speak to prospective students in their hometown has worked well in one strategy. Meanwhile, providing special activities at an Open Day just before graduation when younger siblings with parents of current graduates are present will also work. As many of the students indicated that they sought advice from their parents, it is important to schedule a special orientation mainly for them. In addition to these efforts, it is vital for the universities to position themselves in away that potential students who are seeking information can obtain such information from different sources. This effort may involve sponsoring or participating in seminars, workshops, and/or community events related to the university’s offering of knowledge-based services.
One of the main contributions of this study is testing the effectiveness of incentive in increasing WOM. In practice, firms use gifts, discounts, credits, loyalty points, and outright cash to encourage their customers to recommend or sign up family members or friends for a service. The results of this study have shown
that such incentives can be less effective in the case of universities, and the success of the university is insignificantly dependent on financial incentives but is more dependent on the teaching quality and the reputation of the institutions involved.
Furthermore, as employers and academic staff are considered significant players in advising prospective students, targeting this group would also be a worthwhile endeavour. Fostering of interpersonal relationships between faculty and staff with students is important and may help encourage positive WOM behaviour. Enrolment administrators need to furnish the information that students needs. Deanship of students’ affair can also contributes in providing assistance for students with all information and encouraging them to communicate and interact both formally and informally with university community. Thus, encouraging interpersonal bonds may be a strategy worth considering to increase the likelihood of students’ WOM behaviour.
Universities can also use direct potential students to contact expert people such as those from the Ministry of Higher Education to ensure the superiority of the university image, services and facilities. Knowledge of this information will enable the universities to avoid significantly reducing its tuition fees while experiencing significant enrolments at higher fees.
It is especially important that universities routinely gather information from new students about the sources of information they used when selecting the university. This information, in turn, allows the university to target the specific WOM behaviour of potential students. Based on that, the Internet and World Wide Web offer unique opportunities to reach selected students searching for courses and university related information. For future research, it is also important to test how the Internet as a medium of communication boosts the effect of WOM on students.
Finally, this study further recommends that WOM marketing must form an integral part of a marketing strategy, rather than regarding it as an uncontrollable form of marketing. In

The Willingness to Generate Positive Word of Mouth Marketing
287Pertanika J. Soc. Sci. & Hum. Vol. 19 (2) 2011
doing so, the existing strengths of progressive marketing can be further built rather than adopting more traditional marketing strategies to turn the uncontrollable into a more proactive, controllable form.
REFERENCESArndt, J. (1967). Word-of-mouth advertising and
informal communication. In D. Cox (Ed.), Risk taking and information handling in consumer behaviour. Boston, MA: Harvard University.
Anderson, D. R., Sweeney, D.J., & Williams, T.W. (1990). Statistics for business and economics (4th ed.). n.p.: West Publishing Company.
Blodgett, J.G., Granbois, D.H., & Walters, R.G. (1993). The effects of perceived justice on complainants’ negative word-of-mouth behavior and repatronage intentions. Journal of Retailing, 69(4), 399-428.
Belch George, E., & Belch, M.A. (2007). Advertising and promotion: An integrated marketing communications perspective (7th ed.). Irwin, USA: McGraw-Hill.
Bob Troia. (2007). The Word is Out! Affinitive Launches 100th Innovative Word-of-Mouth Marketing Program. Retrieved from www.beaffinitive.com
Bone, P.F. (1992). Determinants of word-of-mouth communications during product consumption. Advances in Consumer Research, 19, pp. 579-83.
Buhler, P.M. (1992).The keys to shaping behavior. Supervision, 53(1), 18-21.
Clow, Kenneth E., & Baak, D. (2007). Integrated advertising, promotion, and marketing communications (3rd ed.). New Jersey, USA: Person Prentice Hall.
Donaton, S. (2003). Marketing’s new fascination: Figuring out word-of-mouth. Advertising Age, 74(46).
Ferguson, R. (2008). Word of mouth and viral marketing: Taking the temperature of the hottest trends in marketing. Journal of Consumer Marketing, 25(3), 179 – 182.
Foly, M. (2005). Essentials of Word Of Mouth Marketing. Retrieved from www.ProfitInfo.com
Flynn, L.R., Goldsmith, R.E., & Eastman, J.K. (1994). The king and summers opinion leadership scale: Revision and refinement. Journal of Business Research, 31, 55.
Gilly, M.C., Graham, J.L., Wolfinbarger, M.F., & Yale, L.J. (1998). A dyadic study of interpersonal information search. Journal of the Academy of Marketing Science, 26(Spring), 83-100.
Grewal, R., Cline, T.W., & Davies, A. (2003). Early-entrant advantage, word-of-mouth communication, brand similarity, and the consumer decision-making process. Journal of Consumer Psychology, 13(3).
Gupta, N., & Shaw, J.D. (1998). Let the evidence speak: Financial incentives are effective. Compensation and Benefits Review, 30(2), 26-31.
Hair, J.F., Anderson, R.E., Tatham, R.L., & Black, W.C. (1995). Multivariate data analysis. New York: Simon and Schuster.
Halliday, J. (2003). Study claims TV advertising doesn’t work on car buyers. Advertising Age, 74(41), 8.
Ying, H. L., & Chung, M. Y. (2008). The effects of single-message single-source mixed word-of-mouth on product attitude and purchase intention. Asia Pacific Journal of Marketing and Logistics, 19(1), 75 – 86.
Fong, J., & Burton, S. (2006). Online word-of-mouth: A comparison of American and Chinese discussion boards. Asia Pacific Journal of Marketing and Logistics, 18(2), 146 – 156.
Needham, A. (2008). Word of mouth, youth and their brands. Young consumers. Insight and Ideas for Responsible Marketers, 9(1), 60 – 62.
Neter, J., & Kunter, L. (1990). Applied Linear Statistical Models. Irwin, Homewood, IL.
Nunnally, J. (1978). Psychometric Theory (2nd ed.). New York: McGraw-Hill.
Patton H. Lous., (2000). How administrators can influence student university selection criteria. Higher Education in Europe, Vol. XXV, No. 3.
Podoshen, J. S. (2006). Word of mouth, brand loyalty, acculturation and the American Jewish consumer. Journal of Consumer Marketing, 23(5), 266 – 282.

Hamza Salim Khraim
288 Pertanika J. Soc. Sci. & Hum. Vol. 19 (2) 2011
Richins, M.L. (1987) A multivariate analysis of responses to dissatisfaction. Journal of the Academy of Marketing Science, 15, 24-31.
Richins, M. (1983). Negative word-of-mouth by dissatisfied consumers: A pilot study. Journal of Marketing, 47(winter), 68-78.
Stokes, D., & Lomax, W. (2002). Taking control of word of mouth marketing: The case of an entrepreneurial hotelier. Journal of Small Business and Enterprise Development, 9(4), 349-357.
Silverman, G. (1997). How to harness the awesome power of word-of-mouth. Direct Marketing, 60, 32-7.
Silverman, G. (2001). The power of word of mouth. AMACOM Books. Division of American Management Association.
Silverman, G. (2001b). The secrets of Word-of-Mouth marketing “How to trigger exponential sales through runaway word of mouth.” Amacom ISBN 0-8144-7072-6.
Silverman, G., & Eve, Z. (2000). How to harness word of mouth in the pharmaceutical industry. Market.
Scott, D. (2003). Marketing’s new fascination: Figuring out word-of-mouth. Advertising Age, 74(46).
Swan, J.E., & Oliver, R.L. (1989). Post-purchase communications by consumers. Journal of Retailing, 65(4), 516-33.
Soutar, G.N., Tim, M., & Jillian, C. S. (2007). Conceptualizing word-of-mouth activity, triggers and conditions: An exploratory study. European Journal of Marketing, 41(11/12), 1475 – 1494.
Sweidan, N.M. (2009). The effect of the Word of Mouth on the consumer purchasing decision concerning his/her choice & loyalty towards the brand name. Faculty of Business 9th Conference. Zarka Private University, Jordan.
Wangenheim, F.V., & Bayoun, T. (2004). The effect of word of mouth on services switching: Measurement and moderating variables. European Journal of Marketing, 38(9/10).
Wirtz. J., & Chew P., (2002). The effects of incentives, deal proneness, satisfaction and tie strength on word-of-mouth behaviour. International Journal of Service Industry Management, 13(2), 141-162.

The Willingness to Generate Positive Word of Mouth Marketing
289Pertanika J. Soc. Sci. & Hum. Vol. 19 (2) 2011
QUESTIONNAIREPart One: Tick √ in the box that reflects your answer
1. University Name□ Philadelphia □ Applied Science □ Amman Private University
2. College □ Business □ Arts □ Science □ Law □ Pharmacy □ It □ Others □ Engineering
3. Age□ Less Than 20 □ 21-25 □ 26- 30 □ More than 31
4. Academic Year□ First Year □ Second Year □ Third Year □ Fourth Year □ Final year
5. Gender□ Male □ Female
6. Nationality□ Jordanian □ Non-Jordanian
Part Two :Choose the number that reflects your answer (1=Strongly Disagree, 5 = Strongly Agree)
1. If I am satisfied I will say positive things about my University
2. If I am not satisfied I will say negative things about my University
3. Information about financial incentives offered by the university was the most important thing for me
4. I consider senior level students as the best source for information about any university
5. When I get incentives such as scholarship, I will talk in positive way about the University
6. When I need information about a university, usually I ask my close friend
7. When I hear positive things about my university from expert people such as Ministry of Higher Education, I will consider it
8. When I hear in media positive things about my university such as library, computer labs, I will consider it
9. If advertisement contains little information, usually I seek information from friends and relatives
10. Information coming from the university employee’s (registration dept.) highly influence my attitude towards the university
11. Information about the academic Faculty highly influence my attitude towards the university
12. Even when I am not satisfied from the university, still I will say positive things about it
13. Information from experts and opinion leaders create positive attitude about my university
14. I am willing to inform other students my opinion about the university according to my experience
15. The information that I get from my friends is more valuable than different types of advertisement
16. I prefer to depend on various sources rather than relying on single friend

Hamza Salim Khraim
290 Pertanika J. Soc. Sci. & Hum. Vol. 19 (2) 2011