Embed Size (px)
Citation preview

The Virginia Kindergarten Readiness ProjectExecutive Summary & Legislative Report
Fall 2014, Phase II
Acknowledgements:This study was supported by Elevate Early Education (E3) through public and private investments. The state appropri-ated $250,000 through the Virginia Department of Social Services from former Governor Bob McDonnell’s K-12 Reform Agenda which was matched $2:$1 with $500,000 in private donations from the Batten Educational Achievement Fund of the Hampton Roads Community Foundation. The opinions expressed in this report are those of the authors and do not necessarily represent views of the funding agencies. The authors wish to thank the generous school systems, school administrators, teachers, and kindergarten students who participated in this project. In addition we are grateful to Dr. Elizabeth Cottone, Dr. Jamie DeCoster, Elise Rubinstein, Kate Miller-Bains, and Genna Matthew for their significant contri-butions to this work.
Correspondence concerning this report should be addressed to Amanda Williford at [email protected].
Authors: Amanda P. Williford, Jason T. Downer, Bridget K. Hamre, and Robert C. Pianta

EXECUTIVE SUMMARY.......................................................................ES1-ES5LEGISLATIVE REPORT.........................................................................LR1-LR15
Background & Introduction........................................................LR1Methodology................................................................................LR3Results...........................................................................................LR8Limitations & Considerations......................................................LR12Conclusions...................................................................................LR13Recommendations........................................................................LR14
APPENDIX............................................................................................A1-A3
TABLE OF CONTENTS
Executive Summary
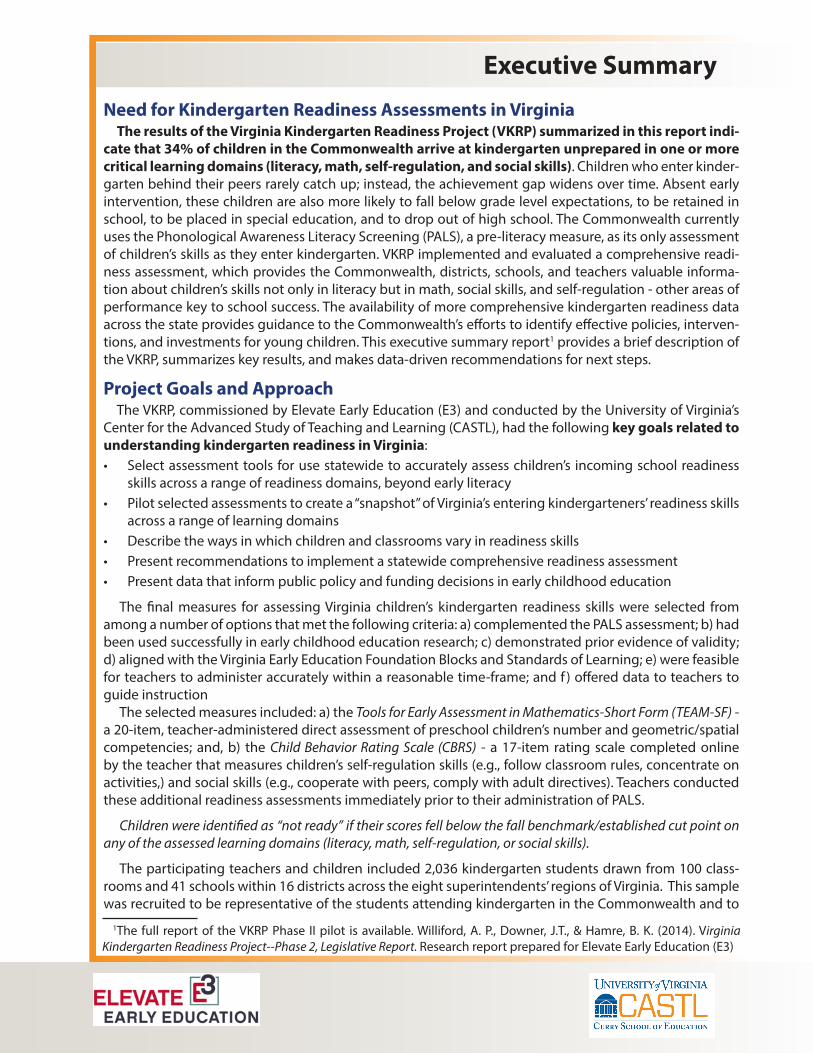
Need for Kindergarten Readiness Assessments in VirginiaThe results of the Virginia Kindergarten Readiness Project (VKRP) summarized in this report indi-
cate that 34% of children in the Commonwealth arrive at kindergarten unprepared in one or more critical learning domains (literacy, math, self-regulation, and social skills). Children who enter kinder-garten behind their peers rarely catch up; instead, the achievement gap widens over time. Absent early intervention, these children are also more likely to fall below grade level expectations, to be retained in school, to be placed in special education, and to drop out of high school. The Commonwealth currently uses the Phonological Awareness Literacy Screening (PALS), a pre-literacy measure, as its only assessment of children’s skills as they enter kindergarten. VKRP implemented and evaluated a comprehensive readi-ness assessment, which provides the Commonwealth, districts, schools, and teachers valuable informa-tion about children’s skills not only in literacy but in math, social skills, and self-regulation - other areas of performance key to school success. The availability of more comprehensive kindergarten readiness data across the state provides guidance to the Commonwealth’s efforts to identify effective policies, interven-tions, and investments for young children. This executive summary report1 provides a brief description of the VKRP, summarizes key results, and makes data-driven recommendations for next steps.
Project Goals and ApproachThe VKRP, commissioned by Elevate Early Education (E3) and conducted by the University of Virginia’s
Center for the Advanced Study of Teaching and Learning (CASTL), had the following key goals related to understanding kindergarten readiness in Virginia:• Select assessment tools for use statewide to accurately assess children’s incoming school readiness
skills across a range of readiness domains, beyond early literacy• Pilot selected assessments to create a “snapshot” of Virginia’s entering kindergarteners’ readiness skills
across a range of learning domains• Describe the ways in which children and classrooms vary in readiness skills• Present recommendations to implement a statewide comprehensive readiness assessment • Present data that inform public policy and funding decisions in early childhood education
The final measures for assessing Virginia children’s kindergarten readiness skills were selected from among a number of options that met the following criteria: a) complemented the PALS assessment; b) had been used successfully in early childhood education research; c) demonstrated prior evidence of validity; d) aligned with the Virginia Early Education Foundation Blocks and Standards of Learning; e) were feasible for teachers to administer accurately within a reasonable time-frame; and f ) offered data to teachers to guide instruction
The selected measures included: a) the Tools for Early Assessment in Mathematics-Short Form (TEAM-SF) - a 20-item, teacher-administered direct assessment of preschool children’s number and geometric/spatial competencies; and, b) the Child Behavior Rating Scale (CBRS) - a 17-item rating scale completed online by the teacher that measures children’s self-regulation skills (e.g., follow classroom rules, concentrate on activities,) and social skills (e.g., cooperate with peers, comply with adult directives). Teachers conducted these additional readiness assessments immediately prior to their administration of PALS.
Children were identified as “not ready” if their scores fell below the fall benchmark/established cut point on any of the assessed learning domains (literacy, math, self-regulation, or social skills).
The participating teachers and children included 2,036 kindergarten students drawn from 100 class-rooms and 41 schools within 16 districts across the eight superintendents’ regions of Virginia. This sample was recruited to be representative of the students attending kindergarten in the Commonwealth and to
1The full report of the VKRP Phase II pilot is available. Williford, A. P., Downer, J.T., & Hamre, B. K. (2014). Virginia Kindergarten Readiness Project--Phase 2, Legislative Report. Research report prepared for Elevate Early Education (E3)

be diverse with regard to geographic regions and child demographic characteristics (see Legislative Report for comparisons to statewide averages). On average, children in the pilot were 5.4 years old, 47.5% were female, 11.4% were identified as English language learners, and 7.2% had an Individual Education Plan. In terms of ethnicity, children were mostly White, Not Hispanic (51%), whereas 28% were Black, 9% were Hispanic, 6% were Asian and 6% were other.
Results and Conclusions One third of children in Virginia enter kindergarten unprepared in at least one essential early learning domain.
Thirty-four percent of children entering kindergarten in Virginia are lacking key skills in at least one early learning domain (see Table 1). This multi-skill estimate falls in stark contrast to rates of readiness based solely on literacy, i.e. PALS, which estimates that approximately 12% of students statewide enter kindergarten unprepared. This higher estimate of children entering kindergarten “not ready” reflects the reality that kindergarten teachers are responsible for supporting children whose perfor-mance varies across learning domains. The additional information about math readiness is particu-larly relevant given an increasing focus on the importance of developing these skills in the early years of schooling. Although Virginia’s Standards of Learning do not directly cover social skills and self-regulation, decades of research demonstrate that these skills are foundational to later school and life success.
Table 1: Readiness Counts by Number of Domains
Readiness Frequency Percent
“Not ready” in at least 1 domain 642 34.0 “Not Ready” in 1 domain 372 19.7 “Not Ready” in 2 domains 179 9.5 “Not Ready” in 3 domains 61 3.2 “Not Ready” in 4 domains 30 1.6
“Ready” in all domains 1249 66.0
Sub Total 1891 100.0
Missing 145
Total 2036
A substantial number of children perform poorly in several domains of early learning.Fourteen percent of children entering kindergarten in Virginia demonstrate a lack of readiness in
two or more domains of learning (see Table 1). These children provide unique challenges to kinder-garten teachers. For example, a child who enters kindergarten without basic skills in literacy, but who can pay attention in the classroom and persist through challenges, is much more likely to respond positively to instruction than a child without these important self-regulation skills.
Children enter school less “ready” in self-regulation and social skills than in literacy and math.
Twenty percent of children entering kindergarten in Virginia face challenges with social skills and 16% do not possess the self-regulation skills needed in the classroom environment (see Figure 1). This is almost twice the rate of children who are “not ready” in the areas of either literacy or math.
ES2
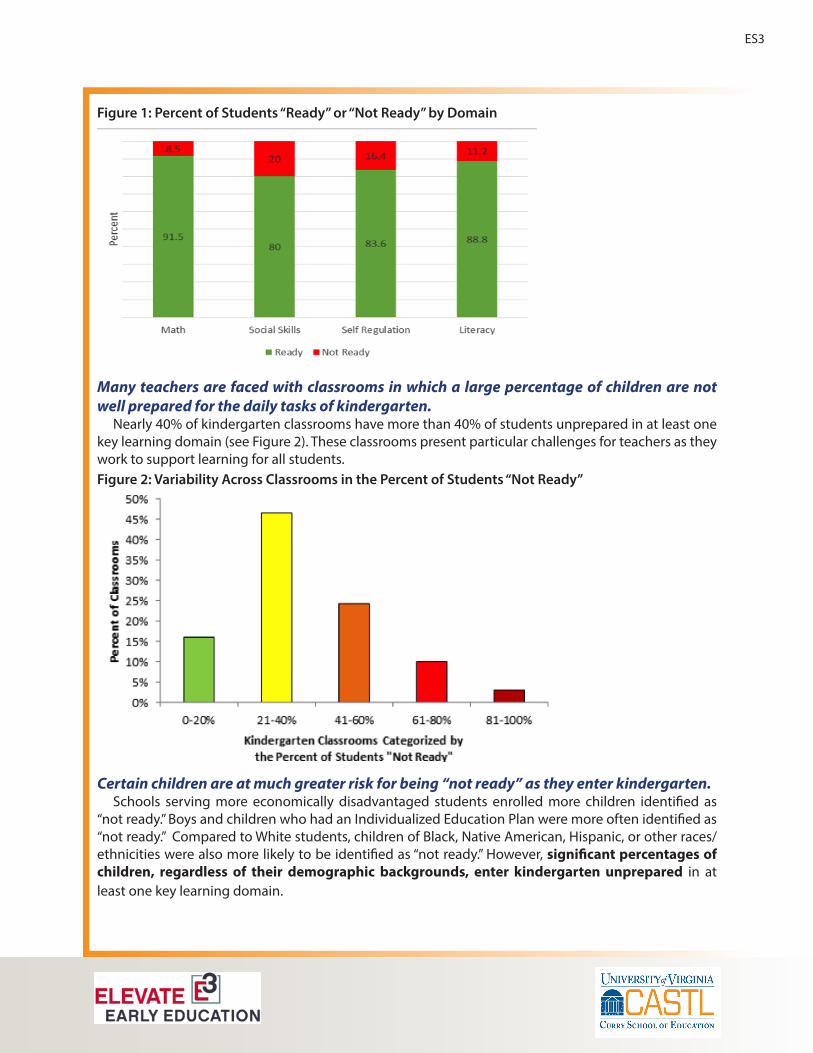
Figure 1: Percent of Students “Ready” or “Not Ready” by Domain
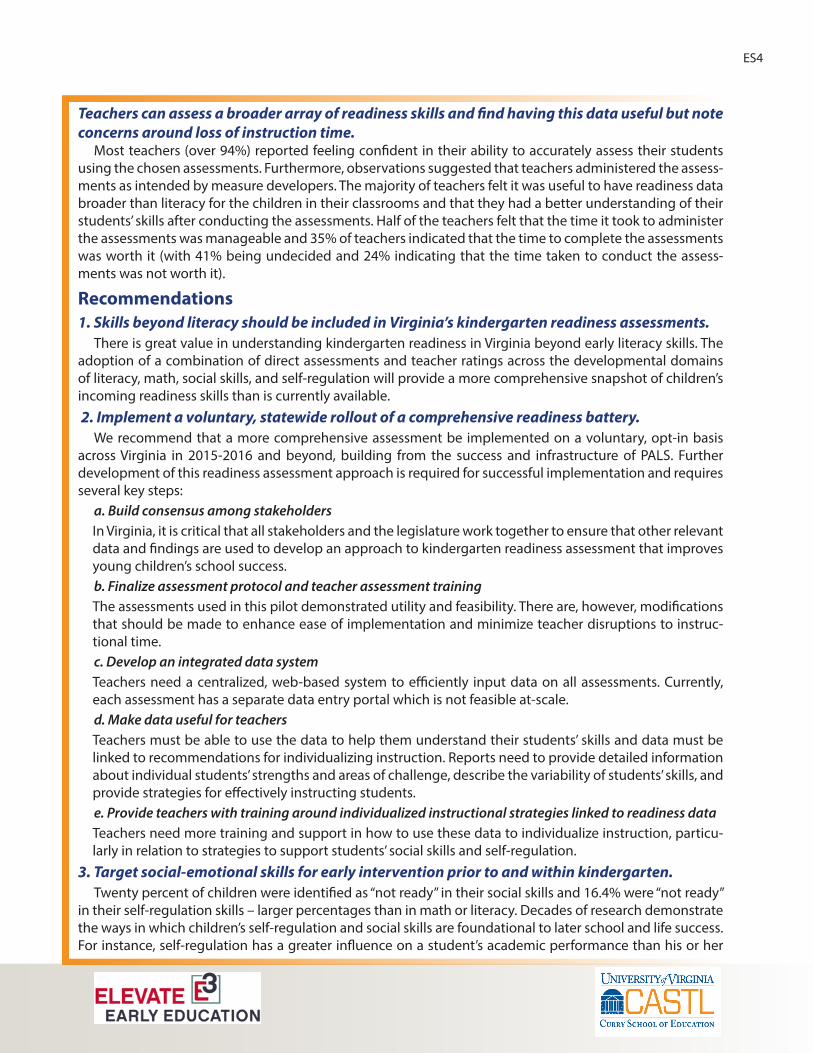
Many teachers are faced with classrooms in which a large percentage of children are not well prepared for the daily tasks of kindergarten.
Nearly 40% of kindergarten classrooms have more than 40% of students unprepared in at least one key learning domain (see Figure 2). These classrooms present particular challenges for teachers as they work to support learning for all students.Figure 2: Variability Across Classrooms in the Percent of Students “Not Ready”
Certain children are at much greater risk for being “not ready” as they enter kindergarten.Schools serving more economically disadvantaged students enrolled more children identified as
“not ready.” Boys and children who had an Individualized Education Plan were more often identified as “not ready.” Compared to White students, children of Black, Native American, Hispanic, or other races/ethnicities were also more likely to be identified as “not ready.” However, significant percentages of children, regardless of their demographic backgrounds, enter kindergarten unprepared in at least one key learning domain.
ES3
Teachers can assess a broader array of readiness skills and find having this data useful but note concerns around loss of instruction time.
Most teachers (over 94%) reported feeling confident in their ability to accurately assess their students using the chosen assessments. Furthermore, observations suggested that teachers administered the assess-ments as intended by measure developers. The majority of teachers felt it was useful to have readiness data broader than literacy for the children in their classrooms and that they had a better understanding of their students’ skills after conducting the assessments. Half of the teachers felt that the time it took to administer the assessments was manageable and 35% of teachers indicated that the time to complete the assessments was worth it (with 41% being undecided and 24% indicating that the time taken to conduct the assess-ments was not worth it).
Recommendations1. Skills beyond literacy should be included in Virginia’s kindergarten readiness assessments.
There is great value in understanding kindergarten readiness in Virginia beyond early literacy skills. The adoption of a combination of direct assessments and teacher ratings across the developmental domains of literacy, math, social skills, and self-regulation will provide a more comprehensive snapshot of children’s incoming readiness skills than is currently available. 2. Implement a voluntary, statewide rollout of a comprehensive readiness battery.
We recommend that a more comprehensive assessment be implemented on a voluntary, opt-in basis across Virginia in 2015-2016 and beyond, building from the success and infrastructure of PALS. Further development of this readiness assessment approach is required for successful implementation and requires several key steps:
a. Build consensus among stakeholdersIn Virginia, it is critical that all stakeholders and the legislature work together to ensure that other relevant data and findings are used to develop an approach to kindergarten readiness assessment that improves young children’s school success.b. Finalize assessment protocol and teacher assessment trainingThe assessments used in this pilot demonstrated utility and feasibility. There are, however, modifications that should be made to enhance ease of implementation and minimize teacher disruptions to instruc-tional time. c. Develop an integrated data systemTeachers need a centralized, web-based system to efficiently input data on all assessments. Currently, each assessment has a separate data entry portal which is not feasible at-scale. d. Make data useful for teachersTeachers must be able to use the data to help them understand their students’ skills and data must be linked to recommendations for individualizing instruction. Reports need to provide detailed information about individual students’ strengths and areas of challenge, describe the variability of students’ skills, and provide strategies for effectively instructing students. e. Provide teachers with training around individualized instructional strategies linked to readiness dataTeachers need more training and support in how to use these data to individualize instruction, particu-larly in relation to strategies to support students’ social skills and self-regulation.
3. Target social-emotional skills for early intervention prior to and within kindergarten. Twenty percent of children were identified as “not ready” in their social skills and 16.4% were “not ready”
in their self-regulation skills – larger percentages than in math or literacy. Decades of research demonstrate the ways in which children’s self-regulation and social skills are foundational to later school and life success. For instance, self-regulation has a greater influence on a student’s academic performance than his or her
ES4

intelligence. This indicates the importance of considering social-emotional learning skills as a learning target on the same level as academic skills. Thus, the Commonwealth should consider:
a. Developing social-emotional learning standards for K-12 studentsLearning standards are an important driver of educational practice. Some states have developed free-standing and comprehensive standards for social-emotional skills while others have worked to more adequately integrate these standards within other subject areas (http://www.casel.org/state-scan-scorecard-project). Although Virginia identifies these skills explicitly in its Foundation Blocks, they are not described as subject areas within the K-12 Standards of Learning. b. Providing teacher training on evidence-based strategies for supporting social-emotional learningTeachers need training and support in the use of strategies to promote students’ self-regulation and social skills. Strategies that help students pay attention, remain on task, and engage in productive group work with peers can be employed during academic instructional times, and thus are feasible for teachers to implement in their classrooms. In addition, there are effective, social-emotional curricula available at both the preschool and elementary levels that can be integrated into kindergarten instruc-tion.
4. Use kindergarten readiness assessments to make data-driven policy decisions.A more comprehensive kindergarten assessment is well positioned within the birth-to-3rd grade
continuum to serve as both an evaluation of the effectiveness of Virginia’s birth-through-preschool programs and an early predictor of later performance in school. As such, the results and recommenda-tions in this report are likely relevant to the efforts of the newly established Commonwealth Council on Childhood, which is tasked to assess the health and educational needs of Virginia’s youngest children (0-8 years). In order to use the data in these ways, Virginia needs a longitudinal data system that links data on young children across agencies (e.g., Office of Head Start, Department of Social Services, and Department of Education) and across time (e.g., early intervention, preschool, K-12). Such a system will increase our capacity to understand the outcomes of state and local investments including:
• Consideration of early childhood quality improvement models that are evidence-based, effective, and cost-sustainable
• Understanding what initiatives, policies, and interventions are currently being funded in Virginia and determine which are effective in promoting school readiness
ES5

Legislative ReportBackground and IntroductionNeed for Kindergarten Readiness Assessments in Virginia
Children who enter kindergarten behind their peers rarely catch up; instead, the achievement gap widens over time.1 Absent early intervention, these children are also more likely to fall below grade level expectations, to be retained in school, to be placed in special education, and to drop out of high school. 2 These negative outcomes have significant financial costs, such as the costs of special education services and social welfare programs.3
Disparities in skills develop for many children prior to entry into the K-12 school system, with between 33 to 50% of children nationwide arriving at kindergarten significantly behind their peers in at least one early learning domain that is critical for school success.2 The proportion of children from low-income backgrounds who enter kindergarten possessing the needed readiness skills (48%) is disproportionally lower than their economically-advantaged peers (75%).2 This is known as the school readiness gap.4 In Virginia, 36% of children under the age of six are from low-income backgrounds and so are at high risk for entering school unprepared and struggling to catch up.5
What is School Readiness?School readiness is the set of skills that children possess when they enter school that prepares
them for later school success. The key domains of school readiness include language, literacy, cognition and general knowledge, approaches to learning, physical health (including well-being and motor development), and social and emotional development (including self-regulation and social skills).6 These key domains of school readiness are represented in Virginia’s Foundation Blocks for Early Learning, which provides a set of comprehensive standards for early education.7 School readiness assessments in Virginia, however, have focused only on children’s pre-literacy skills. Through the Early Intervention Reading Initiative (EIRI) enacted in 1997, Virginia schools have resources to assess children’s entry literacy skills and provide early intervention when indicated, with the vast majority of school districts using the Phonological Awareness Literacy Screening (PALS).8 1 Duncan, G. J., Dowsett, C. J., Claessens, A., Magnuson, K., Huston, A. C., Klebanov, P., ... & Japel, C. (2007). School readiness and later achievement. Developmental Psychology, 43(6), 1428. http://dx.doi.org/10.1037/0012-1649.43.6.1428.supp. 2 Isaacs, J. B. (2012). Starting school at a disadvantage: The school readiness of poor children. The Social Genome Project, 34. Retrieved from http://www.brookings.edu/research/papers/2012/03/19-school-disadvantage-isaacs3 Belfield, C. R., Nores, M., Barnett, S., & Schweinhart, L. (2006). The High/Scope Perry Preschool Program cost–benefit analysis using data from the age-40 followup. Journal of Human Resources, 41(1), 162-190. http://dx.doi.org/10.3368/jhr.XLI.1.162; Reynolds, A. J., Temple, J. A., White, B. A., Ou, S. R., & Robertson, D. L. (2011). Age 26 cost–benefit analysis of the Child‐Parent Center Early Education Program. Child development, 82(1), 379-404. . http://dx.doi.org/10.1111/j.1467-8624.2010.01563.x 4 Sadowski, M. (2006). The school readiness gap. Harvard Education Letter, (22)4. Retrieved from http://www.plan4preschool.org/documents/school-readiness-gap.pdf5 National Center for Children in Poverty; Virginia Early Childhood Profile for 2012: http://www.nccp.org/profiles/VA_profile_6.html. Low income is defined as 200% or below the Federal Poverty Line. 6 Zill, N., Collins, M., West, J. & Hausken, E. J. (1995). Approaching Kindergarten: A look at preschoolers in the United States. Young Children 51, 35-38.7 Virginia Department of Education. (2013). Virginia’s Foundation Blocks for Early Learning: Comprehensive Standard for Four-Year-Olds. Richmond, VA: Author. Retrieved from http://www.doe.virginia.gov/instruction/early_childhood/preschool_initiative/foundationblocks.pdf8 See PALS site: https://pals.virginia.edu/rd-background.html

Readiness Data Collected in VirginiaData from the PALS has provided insight into Virginia kindergartners’ readiness in
literacy indicating that about 12% of children enter kindergarten lacking fundamental literacy skills.9 However, we know little about their skills in the other school readiness areas. Children’s skills in other early learning domains, particularly math and self-regulation, are key indicators of their later success in school. We do not know the extent to which children in Virginia arrive at kindergarten demonstrating these skills. This lack of data provides little guidance for the Commonwealth on creating policies and making targeted investments for young children.
Recently, many other states have developed, or are in the process of developing, kindergarten entry assessments that measure children’s skills across a variety of early learning domains. As of the 2013 school year, the majority of states have plans for Kindergarten Entry Assessments (KEA), which aim to provide practitioners and policymakers with key information about students’ baseline knowledge across multiple learning domains.10 These KEAs are generally administered within the first few weeks of instruction, with many state education departments developing state-specific plans to make use of the information generated. States have used their kindergarten readiness data: a) to link kindergarten data longitudinally to K-12 data, b) to inform instructional practices aimed at closing the school readiness gap at kindergarten entry and during the school year, c) to inform parents of their child’s readiness status, include them in decisions and provide guidance in working at home with their children, and d) to develop support resources for parents and professionals.
Virginia Kindergarten Readiness ProjectThe VKRP, commissioned by Elevate Early Education (E3) and conducted by the
University of Virginia’s Center for Advanced Study of Teaching and Learning (CASTL), had the following key goals related to understanding kindergarten readiness in Virginia: • Select assessment tools for use statewide to accurately assess children’s incoming
school readiness skills across a range of readiness domains, beyond early literacy• Pilot selected assessments to create a “snapshot” of Virginia’s entering kindergarteners’
readiness skills across a range of learning domains• Describe the ways in which children and classrooms vary in readiness skills• Present recommendations to implement a statewide comprehensive readiness
assessment• Present data that inform public policy and funding decisions in early childhood
educationDesign:VKRP was conducted in two phases.
Phase 1 examined the concurrent validity of Teaching Strategies GOLD (an observation-based assessment) when used by teachers to assess children’s school readiness skills in the 9 Smart Beginnings (2013). Virginia’s Biennial School Readiness Report Card: http://www.vareportcard.com/Virginia-School-Readiness-Report-2013.pdf10 Connors‐Tadros, L. (2014). Information and resources on developing state policy on kindergarten entry assessment(KEA) (CEELO FASTFacts). New Brunswick, NJ: Center on Enhancing Early Learning Outcomes.http://ceelo.org/wp-content/uploads/2014/02/KEA_Fast_Fact_Feb_2014.pdf
LR2
fall of the 2013 kindergarten year. Based upon the results from Phase 1, UVa recommended piloting an alternative assessment battery in Phase 2. The executive summary and full report from the validity study can be found at www.e3va.org.
Phase 2 piloted an expanded assessment that would create a “snapshot” of readiness skills across a range of learning domains for children entering kindergarten in Virginia and more clearly define the readiness gap in the Commonwealth. The results of the pilot will inform public policy and funding decisions in early childhood education as well the implementation of a full-scale, statewide comprehensive readiness assessment.
This report focuses on Phase 2.
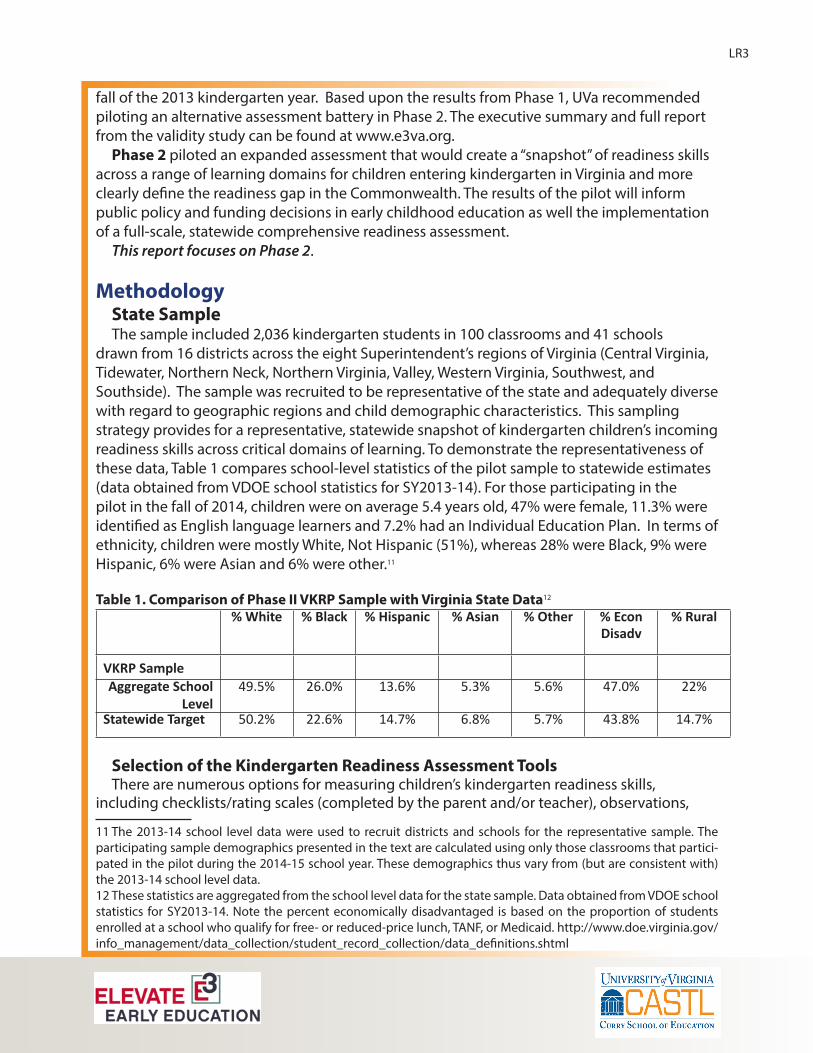
MethodologyState SampleThe sample included 2,036 kindergarten students in 100 classrooms and 41 schools
drawn from 16 districts across the eight Superintendent’s regions of Virginia (Central Virginia, Tidewater, Northern Neck, Northern Virginia, Valley, Western Virginia, Southwest, and Southside). The sample was recruited to be representative of the state and adequately diverse with regard to geographic regions and child demographic characteristics. This sampling strategy provides for a representative, statewide snapshot of kindergarten children’s incoming readiness skills across critical domains of learning. To demonstrate the representativeness of these data, Table 1 compares school-level statistics of the pilot sample to statewide estimates (data obtained from VDOE school statistics for SY2013-14). For those participating in the pilot in the fall of 2014, children were on average 5.4 years old, 47% were female, 11.3% were identified as English language learners and 7.2% had an Individual Education Plan. In terms of ethnicity, children were mostly White, Not Hispanic (51%), whereas 28% were Black, 9% were Hispanic, 6% were Asian and 6% were other.11
Table 1. Comparison of Phase II VKRP Sample with Virginia State Data12 % White % Black % Hispanic % Asian % Other % Econ
Disadv% Rural
VKRP SampleAggregate School
Level 49.5% 26.0% 13.6% 5.3% 5.6% 47.0% 22%
Statewide Target 50.2% 22.6% 14.7% 6.8% 5.7% 43.8% 14.7%
Selection of the Kindergarten Readiness Assessment ToolsThere are numerous options for measuring children’s kindergarten readiness skills,
including checklists/rating scales (completed by the parent and/or teacher), observations,
11 The 2013-14 school level data were used to recruit districts and schools for the representative sample. The participating sample demographics presented in the text are calculated using only those classrooms that partici-pated in the pilot during the 2014-15 school year. These demographics thus vary from (but are consistent with) the 2013-14 school level data. 12 These statistics are aggregated from the school level data for the state sample. Data obtained from VDOE school statistics for SY2013-14. Note the percent economically disadvantaged is based on the proportion of students enrolled at a school who qualify for free- or reduced-price lunch, TANF, or Medicaid. http://www.doe.virginia.gov/info_management/data_collection/student_record_collection/data_definitions.shtml
LR3

and direct assessments (conducted either by the child’s teacher or by an independent assessor). Each method has its own strengths and weaknesses, so the most appropriate choice for the type of assessment, as well as the method of administration, should be based upon the intended use of the data. The primary goal for this project was to assess children’s skills at the beginning of kindergarten across multiple domains of learning using assessments that would allow for comparisons of readiness skills across child characteristics such as age, gender, race, socio-economic status, as well as across schools, districts, and regions throughout the state.
The final measures for assessing Virginia’s children’s kindergarten readiness skills were selected from among a number of options that met the following criteria: • complemented the PALS assessment• had been used successfully in early childhood education research• demonstrated prior evidence of validity• aligned with the Virginia Early Education Foundation Blocks and Standards of Learning• were feasible for teachers to administer accurately within a reasonable time-frame• offered data to teachers to guide instruction.
The measures chosen for the fall 2014 pilot were:TEAM-SF. The Tools for Early Assessment in Mathematics-Short Form (TEAM-SF)13 is a 20-item
measure of preschool children’s number and geometric/spatial competencies. The TEAM-SF was created from the Research Based Early Mathematics Assessment (REMA)14, which measures mathematics skills of students from age 3 to 8 years. The REMA evidences good reliability and validity from preschool through first grade and has been shown to be sensitive to early mathematics interventions. 15 Children are assessed individually by teachers using a standardized protocol. Items assessing number sense include asking children to count to five, count a certain number of objects, subitize objects, and match amounts to numbers. Items assessing geometry include asking children to identify certain shapes, make shapes with straws, and identify certain aspects of shapes. In prior research, the TEAM-SF has demonstrated good construct validity (concurrent and discriminant). In the present study, the TEAM-SF demonstrated strong inter-item reliability (α = .94).
CBRS. The Child Behavior Rating Scale (CBRS) is a 17-item teacher rating scale used to assess children’s social skills and self-regulation.16 Teachers rate each child’s behaviors with other students and adults as displayed in the classroom setting using a scale of 1 (never) to 5 (usually/always). The social skills subscale has 7 items (e.g., “Willing to share toys or other things with other children when playing; does not fight or argue with playmates in disputes over property,” and “Takes turns in a game situation with toys, materials, and other things without being told to do so”) and the self-regulation subscale has 10 items [e.g., , “Concentrates when working on a task; is not easily distracted by surrounding activities,” and “Completes learning tasks involving two or more steps (e.g., cutting and pasting) in an organized way”]. The measure has been used
13 Weiland, C., Wolfe, C.B., Hurwitz, M.D., Clements, D.H., Sarama, J.H. & Yoshikawa, H. (2012). Early mathematics assessment: validation of the short form of a prekindergarten and kindergarten mathematics measure. Educational Psychology, 32(3), 311-333.14 Clements, D. H., Sarama, J., & Liu, X. (2008). Development of a measure of early mathematics achievement using the Rasch model: The Research-based Early Maths Assessment. Educational Psychology, 28(4), 457-48215 Clements, D. H., Sarama, J., Spitler, M. E., Lange, A. A., & Wolfe, C. B. (2011). Mathematics learned by young chil-dren in an intervention based on learning trajectories: A large-scale cluster randomized trial. Journal for Research in Mathematics Education, 42 (2), 127-166.16 Bronson, M. B., Goodson, B. D., Layzer, J. I., & Love, J. M. (1990). Child Behavior Rating Scale. Cambridge,MA: Abt Associates.
LR4
frequently in early education research, particularly the self-regulation subscale, and has been found to evidence sound reliability across different US samples17 and across other countries.18 The CBRS predicts children’s academic outcomes both concurrently and longitudinally.19 In the present study, CBRS demonstrated strong inter-item reliability (Social Skills: α = .94; Self-Regulation subscale: α = .94).
SELweb. The Social Emotional Learning, web-based (SELweb) is an online direct assessment of students’ social problem-solving skills and self-regulation.20SELweb is web-based, self- administered, and suitable for mass administration, taking approximately 20 minutes to complete. Children completed several modules assessing their social problem-solving skills and self-control abilities. All aspects of the assessment are audio-narrated and illustrated, requiring only limited reading ability. The social problem-solving module contains eight vignettes, that describe ambiguous peer interaction scenarios. After each vignette, children were asked to select: (a) a social goal, (b) the best solution, and (c) how mean they believed the provocateur’s actions to be. The self-control composite consists of two modules, one aimed at assessing a student’s delay of gratification (e.g., students were instructed to send rocket ships into space, and told to get as many points as possible, with the slowest rocket ship being worth the most amount of points) and the other designed to assess a student’s ability to refrain from impulsivity when frustrated (e.g., students were instructed to press a button when they saw matching shapes on the screen, and the task was pre-programmed to become “stuck” on certain items, and the number of button presses, and length of each press were recorded). Compared to other measures of social-emotional comprehension, the SELweb demonstrates both convergent and discriminant validity. The SELweb is also concurrently and positively associated with teacher report of social-emotional competencies. 22
PALS-K. The Phonological Awareness Literacy Screening-Kindergarten (PALS-K) is a widely-used diagnostic assessment administered one-on-one to students by teachers after the first six weeks from the start of the school year in Virginia.21 It is intended to identify students who 17 Matthews, J.S., Pointz, C.C., & Morrison, F.J. (2009). Early gender differences in self-regulation and academic achievement. Journal of Educational Psychology, 101(3), 689-704. ; Matthews, J.S., & Morrison, F.J. (2009). A structured observation of behavioral self-regulation and its contribution to kindergarten outcomes. Developmental Psychology, 45(3), 605-619.18 Wanless, S. B., McClelland, M. M., Acock, A. C., Ponitz, C. C., Son, S.-H., Lan, X., … Li, S. (2011). Measuring behavioral regulation in four societies. Psychological Assessment, 23(2), 364–378. 19 Lim, S.M., Rodger, S., & Brown, T. (2010). Assessments of learning-related skills and interpersonal skills constructs within early childhood environments in Singapore. Infant and Child Development, 19(4), 366-384; Matthews, J. M., Cameron Ponitz, C., & Morrison, F. J. (2009). Early gender differences in self-regulation and academic achievement. Journal of Educational Psychology, 101, 689–704.; Meisels, S.J., Liaw, F R., Dorfman, A., & Nelson, R. (1995). The Work Sampling System: Reliability and validity of a performance assessment for young children.” Early Childhood Research Quarterly, 10(3), 277-296; von Suchodoletz, A., Gestsdottir, S., Wanless, S.B., McClelland, M.M., Birgisdottir, F., Gunsenhauser, C., & Ragnarsdottir, H. (2013). Behavioral self-regulation and relations to emergent academic skills among children in Germany and Iceland. Early Childhood Research Quarterly, 28(1); Wanless, S. B., McClelland, M. M., Tominey, S. L., & Acock, A. C. (2011). The influence of demographic risk factors on children’s behavioral regulation in prekindergarten and kindergarten. Early Education and Development, 22, 461–488.20 McKown, C., Russo-Ponsaran, N., Johnson, J., Russo, J. & Allen, A. (2014). Web-Based Assessment of Children’s Social-Emotional Comprehension. Manuscript submitted for publication.21 Invernizzi, M., Juel, C., Swank, L., & Meier, J. (2014). PALS Kindergarten Technical Reference. https://pals.virginia.edu/pdfs/rd/tech/K_Tech_Ref_2014_B.pdf
LR5

may need additional support in order to improve their literacy skills and reach grade-level expectations. The PALS-K measures children’s print knowledge and phonological awareness. More specifically, the PALS-K examines students’ rhyme awareness, alphabet knowledge, beginning sound awareness, knowledge of letter sounds, spelling, concept of word, and word recognition. The PALS-K has been field-tested statewide and has demonstrated strong reliability and validity.23 Ninety-nine percent of school divisions in the Commonwealth choose to administer the PALS in their classrooms, and the assessment is available in both English and Spanish.22 One of the participating VKRP districts does not use the PALS-K as its literacy screener but their chosen assessment is very similar in timing, content, and administration.
Teacher Training & AdministrationTeacher Training ProceduresA total of 100 teachers were recruited to represent the statewide target.23 On average,
participating teachers had 14.6 years of teaching experience (SD=9.52). About one-fifth of the teachers had been teaching for 5 years or less (20.4%). All teachers had earned at least a Bachelor’s degree or higher with over half of teachers (52%) possessing a Master’s degree. Teachers were an average of 41 years of age (SD=11.09), and the majority were White (85.7%) and female (99%).
Teachers were trained to conduct the assessments through a collaborative effort of UVA’s research team and an experienced trainer from the publisher of the TEAM-SF. This training team held 10, in-person, single-day trainings (3 - 4.5 hours) between the end of July and the end of September with between 5 and 40 teachers in attendance at each session. Most teachers completed the training prior to the first instructional day for students.24
Teachers were asked to conduct the readiness assessments during a 2-week window immediately before they began their administration of PALS. Thus, for most teachers, the assessments were conducted during the 4-5 weeks after the start of student instruction. Teachers administered the direct assessments (TEAM-SF and SELweb) during instructional time and completed the CBRS outside of instructional time (e.g., before students arrived in the morning, after school, during a break). All data were entered online by either the teacher (TEAM-SF and CBRS) or the child (SELWeb).
The classroom teacher administered the TEAM-SF individually by enlisting the help of teaching aides and assistants who instructed the larger group of students while she or he assessed students one at a time. Teachers generally administered the TEAM-SF in the back of the classroom, in another quiet space, or in a quiet section of the hallway. Teachers could choose whether to administer all items to a child in one sitting versus dividing the TEAM-SF into 2 or 3 smaller assessments. Teachers were instructed that if fatigue or inattention became an issue for the child that they should allow the child to take a break and resume the assessment at a later time during the two-week assessment period. On average, it took teachers about 20 minutes per child to complete the TEAM-SF.
For the SELweb, teachers were given three options for administration. First, small groups of 3-5 students were able to complete the assessment in a computer lab while monitored by
22 Background of PALS. Retrieved from https://pals.virginia.edu/rd-background.html23 Due to additional interest within participating districts an extra 23 teachers were involved in the study, but only data from the 100 classrooms selected for the state representative sample are reflected here24 Teachers from three districts completed trainings two weeks after the start of school
LR6

either the teacher or another trained adult. This was the preferred format as it improved efficiency while maintaining a manageable testing setting. Alternatively, teachers could assess their entire classroom of students at once in a computer lab, provided that they had an adult-to-child ratio of at least 1:5 so that adults could monitor students’ engagement. Lastly, teachers could provide the assessment individually to their students at a computer in their classroom. Some teachers chose to use a combination of these three formats. The majority of teachers (50%) reported that they administered SELweb in small groups, while 38% reported that they administered the SELweb in larger groups. Thirty-three percent of teachers reported that they administered SELweb individually to at least one student in their classroom. The SELweb took an average of 20 minutes per child to complete. It should be noted that the total time taken per classroom was dependent upon how many students were assessed at the same time.
Teachers completed the CBRS online outside of instructional time. Each teacher rated their students individually on all 17 items of the CBRS and reported that it took about 10 minutes per child to complete the scale. Teachers were encouraged to take breaks when completing the rating scale and not to assess all of their students in one sitting to reduce teacher burden and improve the quality of assessments.
Fidelity of Test Administration - Observational data To assess fidelity of test administration, UVA research staff observed the administration of the
TEAM-SF and SELweb in 18 randomly selected classrooms (15% of the sample). The UVa research team created a set of items that the observer used to rate the fidelity of the assessments as they were implemented in classrooms. Items were created based on the areas of theoretical importance in general test administration (e.g., providing unbiased feedback, having all required materials), as well as the most important assessment-specific concepts highlighted in the training (e.g., exposing children to a stimulus for a specific amount of time). Additionally, these observational measures assessed the use of space and materials, delivery of questions, compliance with timing rules, and appropriate reactions to child responses. The TEAM-SF Observational Measure comprised 6 items, while the SELweb Observational Measure comprised 5 items.
For the TEAM-SF, items were rated on a 4 point scale (0-3) with 0 indicating the absence of the indicated behavior and 3 indicating optimal execution of the behavior. For the SELweb, items were rated as either “yes” or “no” with “yes” indicating competent delivery of the assessment and “no” indicating noncompliance with the guideline for delivery. The differences in the scales used to assess implementation of the TEAM-SF and the SELweb reflect the varying levels of administration complexity. The SELweb required a simpler adherence indicator (e.g., did the behavior happen or not?) because it was computer administered and self-paced, whereas the TEAM-SF required a quality rating of fidelity (e.g., to what degree of quality did the behavior happen?) due to the nature of the interaction between student and teacher and the more complex item delivery.
Results of the observation for the TEAM-SF indicated consistently high fidelity of test administration across all items (mean: 2.91; range: 2.43-3.00). The SELweb observations indicated moderate fidelity of test administration, with variability across items. These results are encouraging because the TEAM-SF fidelity ratings were higher despite the higher level of complexity involved in administration, indicating that it is possible to train a large number of teachers successfully with high rates of compliance on a relatively complex, individually administered math assessment. On the SELweb, most observed teachers responded to students’ questions appropriately, not providing information on how the student should answer (82%) and using stop points to offset test fatigue
LR7
(83%). However, the majority of teachers (67%) did not read the introductory script that describes the assessment to students before they began the assessment, although it should be noted that SELweb provides an automated introduction that each student hears when the SELweb assessment is started. Additionally, only half of teachers were observed to closely monitor students during the assessment to ensure students were engaged and did not have questions.
Following the administration, teachers received a classroom report that showed their students’ scores and provided them with an online link to a set of strategies that they could use to promote relevant social skills, self-regulation, and math skills.
ResultsDescriptive Statistics for the Readiness Variables
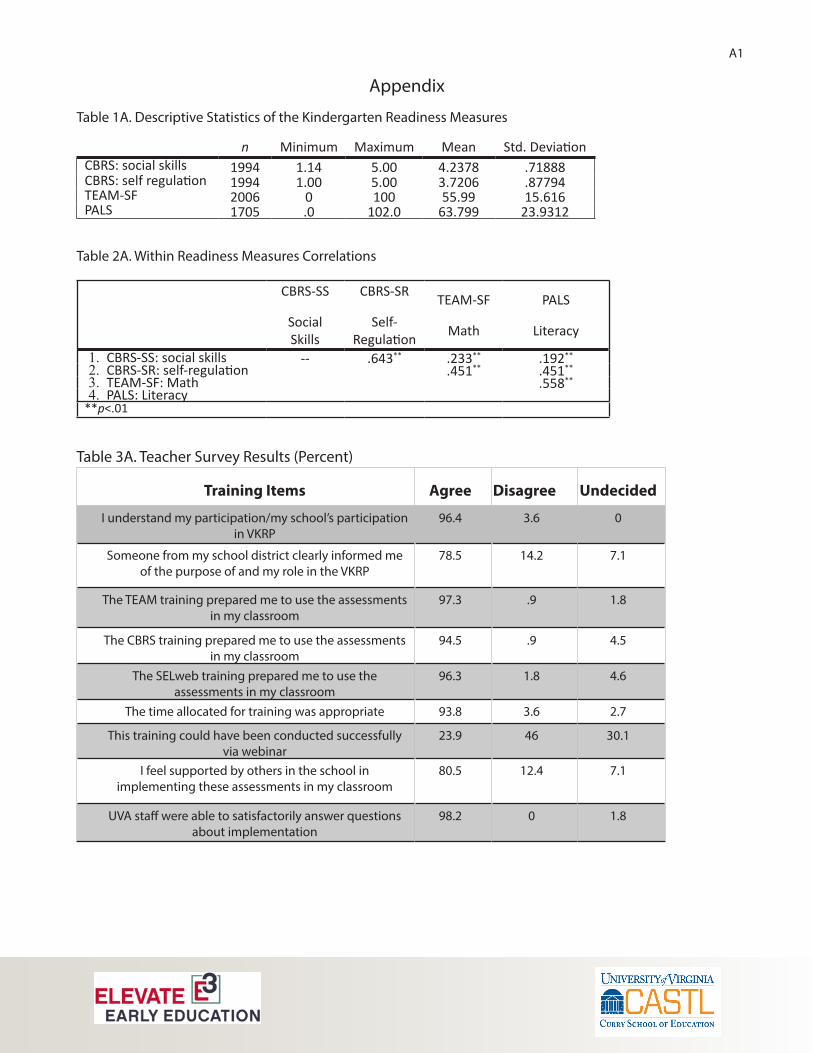
Table 1A in the Appendix provides descriptive statistics for readiness variables used in this report. All of the variables demonstrated adequate variability.
Defining ReadinessThe TEAM-SF and CBRS were combined with PALS25 to determine the percentage of children
who entered kindergarten not displaying key early learning skills (i.e., “not ready”) for this report. We chose the TEAM-SF and CBRS because these measures have been used repeatedly in early education and development research. In addition, we were able to establish theoretically derived cut points to identify children performing above or below expectations at kindergarten entry, which is consistent with how children are identified using the PALS kindergarten fall benchmark.
SELweb was selected to be part of the pilot battery because it is a newly developed direct assessment of children’s social-emotional skills that included both self-regulation and social problem solving, it was specifically designed for use with kindergarten children, and it could be efficiently administered by computer. However, there are less data examining the psychometric properties of the assessment given it is relatively new, and it does not yet have theoretically-derived or data-driven benchmarks. In addition, the subtests selected for this pilot measure particular aspects of self-regulation (i.e., delay of gratification and frustration tolerance) and social skills (peer social problem solving) that are different from those found in the CBRS, which measures children’s self-regulation skills and social skills more comprehensively as displayed in the classroom. Therefore, the CBRS was chosen as the indicator of social skills and self-regulation readiness.
Children were first identified as “ready” or “not ready” within each learning domain (math, self-regulation, social skills, literacy) if they scored below the fall benchmark for literacy (PALS) or below the established cut points for math (TEAM-SF), social skills (CBRS-SS), and self-regulation (CBRS-SR)26. Consistent with prior research , children were identified as “not ready” if they fell below fall benchmarks/established cut points on any of the assessment measures.
25 PALS was used in all but one district which used another literacy assessment26 Students were categorized as “not ready” if: their average score was less than or equal to 3.7 on the CBRS social skills subscale or less than or equal to 2.8 on the self-regulation subscale; they received a score less than or equal to35% correct on the TEAM-SF; their summed score was lower than 28 on the PALS
LR8

How many children are “not ready” in Virginia?27
Thirty-four percent of children sampled were identified as “not ready” in at least one of the assessed early learning domains (literacy, math, social skills, self-regulation).
Do children perform similarly across early learning domains?Children’s scores varied across the early learning domains. For example, children who scored
below the benchmark in literacy may or may not have scored below the threshold in math, self-regulation, or social skills. This is illustrated in Table 2 which shows that the majority of children identified as “not ready” fell below the threshold in only one domain of learning. However, 14% of children fell below the threshold in two or more learning domains.
Table 2: Readiness Counts by Number of DomainsReadiness Frequency Percent“Not ready” in at least 1 domain 642 33.9
“Not Ready” in 1 domain 374 19.6“Not Ready” in 2 domains 182 9.5“Not ready” in 3 domains 61 3.2“Not ready” in 4 domains 30 1.6
“Ready” in all domains 1264 66.1Sub Total 1911 100.0
Missing 125Total 2036
When examining children’s continuous scores across the readiness assessments (See Table 2A in the Appendix for a correlation matrix), we see that the associations tend to be positive and modest to moderate in strength but not redundant, which is consistent with prior research indicating that young children’s skills across readiness domains tend to be somewhat consistent within a child.28
What does readiness look like across the early learning domains?The number of children identified as “not ready” varies across domains. Twenty percent of
children entering kindergarten in Virginia face challenges with social skills and 16% do not possess needed self-regulation skills in the classroom environment (see Figure 1). This is almost twice the rate of children who are “not ready” in the areas of either literacy or math.
27 Six percent of the students in the state sample (n=125) were missing data from at least one learning domain and thus were not assigned to a readiness category. The majority of these students were missing PALS data (66%), with 34% missing CBRS data and 24% missing TEAM data. Most of the students were missing data for just one (59%) or two (31%) of the measures with a smaller proportion missing three (3%) and all four measures (7%). Students missing readiness data were spread across 47 classrooms in 33 schools across all 16 districts that were sampled. On average the students were 5.5 years old, 39.5% were female, 23.3% were identified as English language learners, and 7.4% had an Individual Education Plan. The majority of the students were White, Not Hispanic (48%), with 26% Black, 15% Hispanic, 10% Asian, and 1% other.28 Welsh, J. A., Nix, R., L., Blair, C., Bierman, K. L., & Nelson, K. E. (2010). The development of cognitive skills and gains in academic school readiness for children from low income families. Journal of Educational Psychology, 102, 45-53. http://dx.doi.org/10.1037/a0016738; Williford, A. P., Maier, M., Downer, J. T., Pianta, R. C., & Howes, C. (2013). Understanding how children’s engagement and teachers’ interactions combine to predict school readiness. Journal of Applied Developmental Psychology, 34, 299-309. http://dx.doi.org/10.1016/j.appdev.2013.05.002
LR9

Figure 1: Percent of Students “Ready” or “Not Ready” by Domain
How does readiness vary across classrooms?Not all classrooms have the same number of children who are “not ready” . Nearly forty percent of
kindergarten classrooms have over 40% of students unprepared in at least one key learning domain (see Figure 2).
Figure 2: Variability Across Classrooms in the Percent of Students “Not Ready”
How does readiness vary depending upon school and child demographics?Table 3 illustrates how the percent of students identified as “not ready” varies by child and school
characteristics. Schools serving more economically disadvantaged students had more children identified as “not ready.” Boys and children who had an Individualized Education Plan (IEP) were more often identified as “not ready.” Children who were Black, Native American, Hispanic, or of other races/ethnicities were also more likely to be identified as “not ready” compared to their White peers. However, as can be seen in Table 3, significant percentages of children, regardless of their
LR10

demographic backgrounds, enter kindergarten unprepared in at least on key learning domain. Table 3. Percent of Children Identified as “Not Ready” by Child and School CharacteristicsDemographic Characteristic % “Not Ready” Gender**
Female 27% Male 41%Ethnicity*
Black 37% Native American 27% White not Hispanic 28% Hispanic 49% Asian 29% Multiple 36% Other 55%Child agea
Lower 50% (younger) 37% Upper 50% (older) 31%ELL status Not ELL 33% ELL 42%IEP status**
No IEP 32% IEP 58%School economic disadvantage***
Lower 50% (not disadvantaged) 29% Upper 50% (disadvantaged) 39%School rurality Rural 34% Not rural 35%Overall 34%
Note. a = tested continuously; *= p < .05, ** = p <.01, *** = p < .001.
How did teachers perceive the assessments?Following completion of the assessments and receipt of their classroom report, teachers
completed a survey online where they reported their thoughts about the training, usefulness, and feasibility of the assessments used in the pilot. The survey results are provided in the Appendix (Table 3A).
In terms of training, teachers overwhelmingly indicated that the trainings were appropriate and prepared them to conduct the assessments in their classrooms.
With regard to usability, most teachers felt they could accurately administer the assessments and that the online systems were easy to navigate. Most teachers also reported that using the assessment gave them a better understanding of their students’ skills. Finally, the majority of teachers reported that having data beyond literacy was useful.
Teachers reported that the assessments took substantial time away from instruction. Half of teachers indicated that the time needed to conduct the assessment was manageable but only 35% of teachers indicated that the information they gained from the assessments was worth the time investment. Teachers reported greatest concerns about the TEAM-SF, which had to be given individually to each child.
LR11
Limitations and ConsiderationsIt is important to acknowledge the limitations of this study. First, the sample for this study is relatively small in terms of the number of classrooms. This small sample does not allow us to answer specific questions about how particular schools or localities are performing compared to the state as a whole. In addition, it limits our ability to make comparisons using any data collected at the school level.
Second, being about to randomly select from the full population of classes in each of the Superintendent’s regions would have been the ideal sampling approach and would have allowed for the assumptions that participating classrooms are equivalent to those classes not selected on both observed and unobserved characteristics. However, this sampling approach was not (and rarely is) feasible in practice. The VKRP utilized a purposive sampling strategy described in previous sections in order to ensure that the students and classrooms included in the study were diverse and closely represented the Commonwealth in terms of their socio-demographic make-up, which permits us, with caution, to make some generalizations to Virginia. There are some groups and regions that are over- or under-represented in the present sample relative to the state as whole. In particular, a higher proportion of students from the Tidewater and Southwest Regions were sampled relative to these regions’ overall percentage of Virginia kindergarten enrollment. Despite this, we are confident the sample provides a good snapshot of the state of readiness in the Commonwealth.
It is important to consider that determining the percentage of students identified as “not ready” may be contingent upon the methods used to create the thresholds/cutoffs. There are multiple ways to define readiness. Consistent with how early education research has defined readiness, we decided to define readiness as falling above the threshold or cutoff on all the assessed learning domains. Thus, a student was identified as “not ready” if they fell below the threshold on any of the assessed measures. In addition, we used theoretically derived cut points for the math, social-skills and self-regulation assessments which are consistent with the PALS benchmarks. Other methods for determining readiness would be to identify children who fall below a certain score based upon normed data (either national or local). The assessments chosen do not have national norms at this time, but we did examine the rates of readiness when using a cutpoint of one standard deviation below the sample mean for each assessment. When we defined readiness in this way, we arrived at almost the same estimate of kindergarten students in Virginia being identified “not ready” . Determining the most valid method for defining the readiness cut points will require longitudinal data to examine how performance at kindergarten entry relates to later school success.
Finally, careful thought should be placed on the usefulness of this data to help teachers differentiate and individualize their instruction so that their students learn the skills they need to be successful in kindergarten and beyond. As part of this pilot we created a simple classroom-level report and provided a small set of strategies online for teachers to access and use in their classrooms. However, delivery and use of the teacher report and strategies was not a focus of this project. This most likely resulted in lower teacher satisfaction ratings of usefulness and worth. We are confident that the data from these assessments can be linked with effective and feasible strategies to promote children’s readiness skills and teachers can be supported in their implementation of these strategies.
LR12

ConclusionsOne third of children in Virginia enter kindergarten unprepared in at least one essential early learning domain.
Thirty-four percent of children entering kindergarten in Virginia are lacking key skills in at least one early learning domain. (see Table 2). This multi-skill estimate falls in stark contrast to rates of readiness based solely on literacy, i.e. PALS, which estimates that approximately 12% of students statewide enter kindergarten unprepared. This higher estimate of children entering kindergarten “not ready” reflects the reality that kindergarten teachers are responsible for supporting children whose performance varies across learning domains. The additional information about math readiness is particularly relevant given an increasing focus on the importance of developing these skills in the early years of schooling. Although Virginia’s Standards of Learning do not directly cover social skills and self-regulation, decades of research demonstrate that these skills are foundational to later school and life success.
A substantial number of children perform poorly in several domains of early learning.
Fourteen percent of children entering kindergarten in Virginia demonstrate a lack of readiness in two or more domains of learning. These children provide unique challenges to kindergarten teachers. For example, a child who enters kindergarten without basic skills in literacy, but who can pay attention in the classroom and persist through challenges, is much more likely to respond positively to instruction than a child without these important self-regulation skills.
Children enter school less ready in self-regulation and social skills than in literacy and math.
Twenty percent of children entering kindergarten in Virginia face challenges with social skills and 16% do not possess the self-regulation skills needed to thrive in the classroom environment (see Figure 1). This is almost twice the rate of children who are “not ready” in the areas of either literacy or math.
Many teachers are faced with classrooms in which a large percentage of children are not well prepared for the daily tasks of kindergarten.
Nearly 40% of kindergarten classrooms have more than 40% of students unprepared in at least one key learning domain. These classrooms present particular challenges for teachers as they work to support learning for all students.
Certain children are at much greater risk for being “not ready” as they enter kindergarten.
Schools serving more economically disadvantaged students enrolled more children identified as “not ready”. Boys and children who had an Individualized Education Plan were more often identified as “not ready”. Children of Black, Native American, Hispanic, or other ethnicity (compared to children of White ethnicity) were also more likely to be identified as “not ready” . However, significant percentages of children, regardless of their demographic backgrounds, enter kindergarten unprepared in at least one key learning domain.
LR13

Teachers can assess a broader array of readiness skills and find having this data useful but note concerns around loss of instruction time.
Most teachers (over 94%) reported feeling confident in their ability to accurately assess their students using the chosen assessments. Furthermore, observations suggested that teachers administered the assessments as intended by measure developers. The majority of teachers felt it was useful to have readiness data broader than literacy for the children in their classrooms and that they had a better understanding of their students’ skills after conducting the assessments. Half of the teachers felt that the time it took to administer the assessments was manageable and 35% of teachers indicated that the time to complete the assessments was worth it (with 41% being undecided and 24% indicating that the time taken to conduct the assessments was not worth it).
Recommendations1. Skills beyond literacy should be included in Virginia’s kindergarten readiness assessments.There is great value in understanding kindergarten readiness in Virginia beyond early literacy skills. The adoption of a combination of direct assessments and teacher ratings across the developmental domains of literacy, math, social skills, and self-regulation will provide a more comprehensive snapshot of children’s incoming readiness skills than is currently available.2. Implement a voluntary, statewide rollout of a comprehensive readiness battery. We recommend that a more comprehensive assessment be implemented on a voluntary, opt-in basis across Virginia in 2015-2016 and beyond, building from the success and infrastructure of PALS. Further development of this readiness assessment approach is required for successful implementation and requires several key steps:
a. Build consensus among stakeholdersIn Virginia, it is critical that all stakeholders and the legislature work together to ensure that other relevant data and findings are used to develop an approach to kindergarten readiness assessment that improves young children’s school success.
b. Finalize assessment protocol and teacher assessment trainingThe assessments used in this pilot demonstrated utility and feasibility. There are, however, modifications that should be made to enhance ease of implementation and minimize teacher disruptions to instructional time.
c. Develop an integrated data systemTeachers need a centralized, web-based system to efficiently input data on all assessments. Currently, each assessment has a separate data entry portal, which is not feasible at-scale.
d. Make data useful for teachersTeachers must be able to use the data to help them understand their students’ skills and data must be linked to recommendations for individualizing instruction. Reports need to provide detailed information about individual student’s strengths and areas of challenge, describe the variability of students’ skills, and provide strategies for effectively instructing students.
e. Provide teachers with training around individualized instructional strategies linked to readiness
LR14
dataTeachers need more training and support in how to use these data to individualize instruction, particularly in relation to strategies to support students’ social skills and self-regulation.
3. Target social-emotional skills for early intervention prior to and within kindergarten.
Twenty percent of children were identified as “not ready” in their social skills and 16.4 percent were “not ready” in their self-regulation skills – larger percentages than in math or literacy. Decades of research demonstrate the ways in which children’s self-regulation and social skills are foundational to later school and life success. For instance, self-regulation has a greater influence on a student’s academic performance than his or her intelligence. This indicates the importance of considering social-emotional learning skills as a learning target on the same level as academic skills. Thus, the Commonwealth should consider:
a. Developing social-emotional learning standards for K-12 studentsLearning standards are an important driver of educational practice. Some states have developed free-standing and comprehensive standards for social-emotional skills while others have worked to more adequately integrate these standards within other subject areas (http://www.casel.org/state-scan-scorecard-project). Although Virginia identifies these skills explicitly in its Foundation Blocks, they are not described as subject areas within the k-12 Standards of Learning.
b. Providing teacher training on evidence-based strategies for supporting social-emotional learningTeachers need training and support in the use of strategies to promote students’ self-regulation and social skills. Strategies that help students pay attention, remain on task, and engage in productive group work with peers can be employed during academic instructional times, and thus are feasible for teachers to implement in their classrooms. In addition, there are effective, social-emotional curricula available at both the preschool and elementary levels that can be integrated into kindergarten instruction.
4. Use kindergarten readiness assessments to make data-driven policy decisions.
A more comprehensive kindergarten assessment is well positioned within the birth-to-3rd grade continuum to serve as both an evaluation of the effectiveness of Virginia’s birth-through-preschool programs and an early predictor of later performance in school. As such, the results and recommendations in this report are likely relevant to the efforts of the newly established Commonwealth Council on Childhood, which is tasked to assess the health and educational needs of Virginia’s youngest children (0-8 years). In order to use the data in these ways, Virginia needs a longitudinal data system that links data on young children across agencies (e.g., Office of Head Start, Department of Social Services, and Department of Education) and across time (e.g., early intervention, preschool, K-12). Such a system will increase our capacity to understand the outcomes of state and local investments including:• Consideration of early childhood quality improvement models that are evidence-based,
effective, and cost-sustainable• Understanding what initiatives, policies, and interventions are currently being funded in Virginia
and determine which are effective in promoting school readiness
LR15
Appendix
Table 1A. Descriptive Statistics of the Kindergarten Readiness Measures
n Minimum Maximum Mean Std. DeviationCBRS: social skills 1994 1.14 5.00 4.2378 .71888CBRS: self regulation 1994 1.00 5.00 3.7206 .87794TEAM-SF 2006 0 100 55.99 15.616PALS 1705 .0 102.0 63.799 23.9312
Table 2A. Within Readiness Measures Correlations
CBRS-SS
Social Skills
CBRS-SR
Self- Regulation
TEAM-SF
Math
PALS
Literacy
1. CBRS-SS: social skills -- .643** .233** .192**
2. CBRS-SR: self-regulation .451** .451**
3. TEAM-SF: Math .558**
4. PALS: Literacy**p<.01
Table 3A. Teacher Survey Results (Percent)
Training Items Agree Disagree Undecided
I understand my participation/my school’s participation in VKRP
96.4 3.6 0
Someone from my school district clearly informed me of the purpose of and my role in the VKRP
78.5 14.2 7.1
The TEAM training prepared me to use the assessments in my classroom
97.3 .9 1.8
The CBRS training prepared me to use the assessments in my classroom
94.5 .9 4.5
The SELweb training prepared me to use the assessments in my classroom
96.3 1.8 4.6
The time allocated for training was appropriate 93.8 3.6 2.7
This training could have been conducted successfully via webinar
23.9 46 30.1
I feel supported by others in the school in implementing these assessments in my classroom
80.5 12.4 7.1
UVA staff were able to satisfactorily answer questions about implementation
98.2 0 1.8
A1

Usability Items (%) Agree Disagree Undecided
I feel confident in my ability to accurately assess my students using TEAM 94.3 0 5.7
I feel confident in my ability to accurately assess my students using CBRS 94.3 0 5.7
I feel confident in my ability to accurately assess my students using SELweb 82.1 4.7 13.2
TEAM is an accurate measure of my students’ kindergarten entry skills 66.3 18.7 15
CBRS is an accurate measure of my students’ kindergarten entry skills 66 6.6 27.4
SELweb is an accurate measure of my students’ kindergarten entry skills 51.9 16 32.1I used the information I learned through conducting TEAM with my students to guide my instruction
61.9 26.7 11.4
I used the information I learned through conducting CBRS with my students to guide my instruction
44.2 27.9 27.9
I used the information I learned through conducting SELweb with my students to guide my instruction
36.9 33.1 30.1
I used the information I learned through the classroom level report to guide my instruction, TEAM
51.9 26.9 21.2
I used the information I learned through the classroom level report to guide my instruction, CBRS
40.8 27.2 32
I used the information I learned through the classroom level report to guide my instruction, SELweb
36.9 30.1 33
I used the information I gathered to inform parents, TEAM 27.8 48.1 24
I used the information I gathered to inform parents, CBRS 13.6 54.3 32
I used the information I gathered to inform parents, SELweb 11.6 56.3 32
I found it useful to have readiness data broader than literacy for the children in my classroom
68 8.5 23.6
The classroom report generated by CASTL was useful 65.1 11.3 23.6
The strategies that were included in the report were useful, Math 70.5 6.7 22.9
The strategies that were included in the report were useful, Social-Emotional 55.3 8.6 36.2The information that I gained from conducting these assessments was worth the time lost to instruction
31.2 33 35.8
I would recommend TEAM to other kindergarten teachers 47.7 17.7 34.6I would recommend CBRS to other kindergarten teachers 49 16 34.9I would recommend SELweb to other kindergarten teachers 35.8 21.7 42.5I had a better understanding of my students’ skills after conducting TEAM 72.4 17.2 10.5
I had a better understanding of my students’ skills after conducting CBRS 55.2 21.9 22.9
I would like to assess my students again using TEAM to track their growth over the year
53.8 30.2 16
I would like to assess my students again using CBRS to track their growth over the year
44.8 31.5 23.8
I would like to assess my students again using SELweb to track their growth over the year
46.2 31.7 22.1
I would like to use these assessments next year with my new students 36.2 21.9 41.9
A2
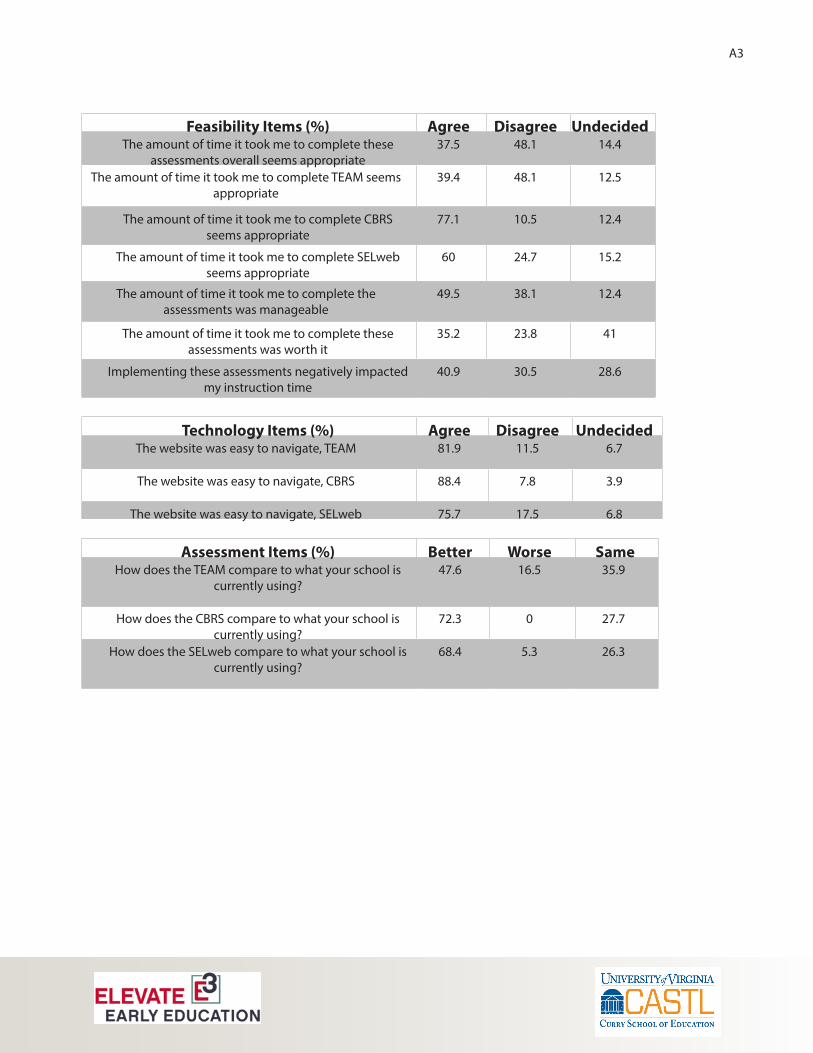
Feasibility Items (%) Agree Disagree UndecidedThe amount of time it took me to complete these
assessments overall seems appropriate37.5 48.1 14.4
The amount of time it took me to complete TEAM seems appropriate
39.4 48.1 12.5
The amount of time it took me to complete CBRS seems appropriate
77.1 10.5 12.4
The amount of time it took me to complete SELweb seems appropriate
60 24.7 15.2
The amount of time it took me to complete the assessments was manageable
49.5 38.1 12.4
The amount of time it took me to complete these assessments was worth it
35.2 23.8 41
Implementing these assessments negatively impacted my instruction time
40.9 30.5 28.6
Technology Items (%) Agree Disagree UndecidedThe website was easy to navigate, TEAM 81.9 11.5 6.7
The website was easy to navigate, CBRS 88.4 7.8 3.9
The website was easy to navigate, SELweb 75.7 17.5 6.8
Assessment Items (%) Better Worse SameHow does the TEAM compare to what your school is
currently using?47.6 16.5 35.9
How does the CBRS compare to what your school is currently using?
72.3 0 27.7
How does the SELweb compare to what your school is currently using?
68.4 5.3 26.3
A3