Embed Size (px)
Citation preview
06.14.2021
2021
KINDERGARTEN READINESS ASSESSMENT (KRA)
Analysis of the Fall 2020 Results

1
Kindergarten Readiness Assessment (KRA) Introduction Section 59-152-33 of the South Carolina Code of Laws requires the adoption and administration of a school readiness assessment by the State Board of Education. The results may not be used to deny a student admission or progress to kindergarten or first grade but instead should demonstrate progress toward improving school readiness. As stated in the Code of Laws:
(A) Before July 1, 2015, the South Carolina Education Oversight Committee shall recommend an assessment to evaluate and measure the school readiness of students prior to their entrance into a prekindergarten or kindergarten program per the goals pursuant to Section 59-152-30 to the State Board of Education. Prior to submitting the recommendation to the State Board, the Education Oversight Committee shall seek input from the South Carolina First Steps to School Readiness Board of Trustees and other early childhood advocates. In making the recommendation, the South Carolina Education Oversight Committee shall consider assessments that are research-based, reliable, and appropriate for measuring readiness. The assessment chosen must evaluate each child’s early language and literacy development, numeracy skills, physical well-being, social and emotional development, and approaches to learning. The assessment of academic readiness must be aligned with first and second grade standards for English language arts and mathematics. The purpose of the assessment is to provide teachers, administrators, and parents or guardians with information to address the readiness needs of each student, especially by identifying language, cognitive, social, emotional, and health needs, and providing appropriate instruction and support for each child. The results of the screenings and the developmental intervention strategies recommended to address the child’s identified needs must be provided, in writing, to the parent or guardian. Reading instructional strategies and developmental activities for students whose oral language and emergent literacy skills are assessed to be below the national standards must be aligned with the district’s reading proficiency plan for addressing the readiness needs of each student. The school readiness assessment adopted by the State Board of Education may not be used to deny a student admission or progress to kindergarten or first grade. Every student entering the public schools for the first time in prekindergarten and kindergarten must be administered a readiness screening by the forty-fifth day of the school year. (B) The results of individual students in a school readiness assessment may not be publicly reported. (C) Following adoption of a school readiness assessment, the State Board of Education shall adopt a system for reporting population-level results that provides baseline data for measuring overall change and improvement in the skills and knowledge of students over time. The Department of Education shall house and monitor the system. (D) The South Carolina First Steps to School Readiness Board of Trustees shall support the implementation of the school readiness assessment and must provide professional development to support the readiness assessment for teachers and parents of programs supported with First Steps funds. The board shall utilize the annual aggregate literacy and other readiness assessment information in establishing standards and practices to support all early childhood providers served by First Steps. (Section 59-152-33)
2
Based on the above recommendations, the Kindergarten Readiness Assessment was selected as the readiness assessment for use by the state of South Carolina. Proviso 1A.58 of the 2019-20 General Appropriation Act directs the South Carolina Department of Education to expend up to $2.0 million in Education Improvement Act (EIA) funds to administer the Kindergarten Readiness Assessment (KRA) to “each child entering kindergarten in the public schools. The assessment of kindergarten students must be administered at a minimum of once during the first forty-five days of the school year with the results collected by the department.” Act 135, signed by the Governor on May 18, 2020, continued normal operations of state government following interruptions related to the COVID-19 pandemic, thus requiring the continued administration of the KRA. About the KRA and the Modified KRA The KRA was created through a partnership between WestEd, Johns Hopkins University, the Ohio Department of Education, and the Maryland State Department of Education. The assessment provides information on a child’s readiness for kindergarten. The assessment is individually administered by a teacher, where a teacher interacts directly with a child for the selected-response and the performance task items. Other items are scored through observation and interactions with students in authentic school settings. The KRA is designed to give reports for an individual student, as well as cohorts of students, such that readiness may be examined at the classroom, school, and district levels, as well as by child demographics. Due to conditions related to the COVID-19 pandemic, the full version of the KRA developed for South Carolina was not administered in 2020. Instead, a shortened KRA was used at the beginning of the 2020-21 school year (herein referred to as the Modified KRA). Before describing the abbreviated assessment, an overview of the full KRA may be useful. The full KRA measures four domains:
• Language and Literacy: skills such as reading, writing, speaking, and listening.
• Mathematics: skills such as counting, comparison, and sorting.
• Physical Well-Being & Motor Development: abilities such as dexterity, muscular coordination, and balance.
• Social Foundations: demonstration of following rules, asking for help, task persistence, and other skills necessary to the functioning within the kindergarten classroom.
KRA items for both the Language and Literacy and Mathematics domains include selected response and performance task types, wherein the child responds to assessment stimuli (e.g., pointing to a picture or naming letters). A third item type, observations, are based upon teacher ratings of the child along a continuum according to a defined rubric. Both the Physical Well-Being & Motor Development and the Social Foundations domains are rated solely with the observational rubric. Information from the four KRA domains contributes to a total score designating a child’s overall performance level (hereafter termed KRA Overall score). KRA scores are classified into one of three categories:
• Demonstrating Readiness: Student demonstrates foundational skills and behaviors that prepare him or her for instruction based on kindergarten standards.
3
• Approaching Readiness: Student demonstrates some foundational skills and behaviors that prepare him or her for instruction based on kindergarten standards.
• Emerging Readiness: Student demonstrates limited foundational skills and behaviors that prepare him or her for instruction based on kindergarten standards.1
The KRA used by South Carolina public schools in fall 2020 was modified for use during COVID-19 pandemic conditions. Only 33 of the 50 items on the full KRA assessment were used. The omitted 17 items required observation of students interacting with others, activities limited by pandemic health measures of social distancing and mask-wearing. This Modified KRA version omitted two items from the Language and Literacy domain and three items from the Physical Well-Being and Motor Development domain; all 12 items from the Social Foundations domain were eliminated. The reduction of items prevented generation of scores for the Physical Well-Being & Motor Development and the Social Foundations domains. All available information obtained contributed to the calculation of the Modified KRA Overall readiness score and readiness classification level. New guidelines were provided for the administration of the 2020 Modified KRA. In addition to maintaining social distance and using face masks, it was suggested that gloves be worn by teachers and/or students as they interacted with test manipulatives. Recommendations also suggested use of a long object for pointing to test stimuli and sanitizing test materials before and after use. While limiting the number of items was done for safety concerns, these test modifications compromised the ability to use Modified KRA scores as a sound measure of kindergarten readiness or to use the results as part of longitudinal comparisons. The KRA publisher, WestEd, recommends that only the KRA Overall score be reported for the 2020 administration of the modified form, due to the changes made to the domains. Additionally, they suggest caution in interpretation of the Modified KRA Overall score. WestEd emphasizes that the reduction of items diminishes the reliability of the assessment. Also, they note that the modified assessment “strayed substantially from the KRA blueprint” (see WestEd letter in Appendix A). Because of these limitations, the publisher advises against using results from the 2020 Modified KRA for comparison with previous years’ results; therefore, no KRA scores from other school years are included in this report. Past reports on South Carolina KRA results have compared student readiness levels to those in Ohio and Maryland, which also use KRA. Prior to the pandemic, however, Ohio adapted a revised version of the KRA, shorter than the full version of the KRA used in South Carolina before 2020. Maryland has not modified the KRA, but the state did not administer the assessment in 2020 due to the pandemic. Because of Ohio’s use of a different version of KRA and Maryland’s cancellation of the 2020 assessment, this report makes no comparison with other states’ KRA results. Results from the Modified KRA provide a “snapshot” of South Carolina kindergartners’ readiness in the fall of 2020. These results are unsuitable for comparisons to states administering other versions of the KRA.
1 KRA Technical Report Addendum, 2015

4
5
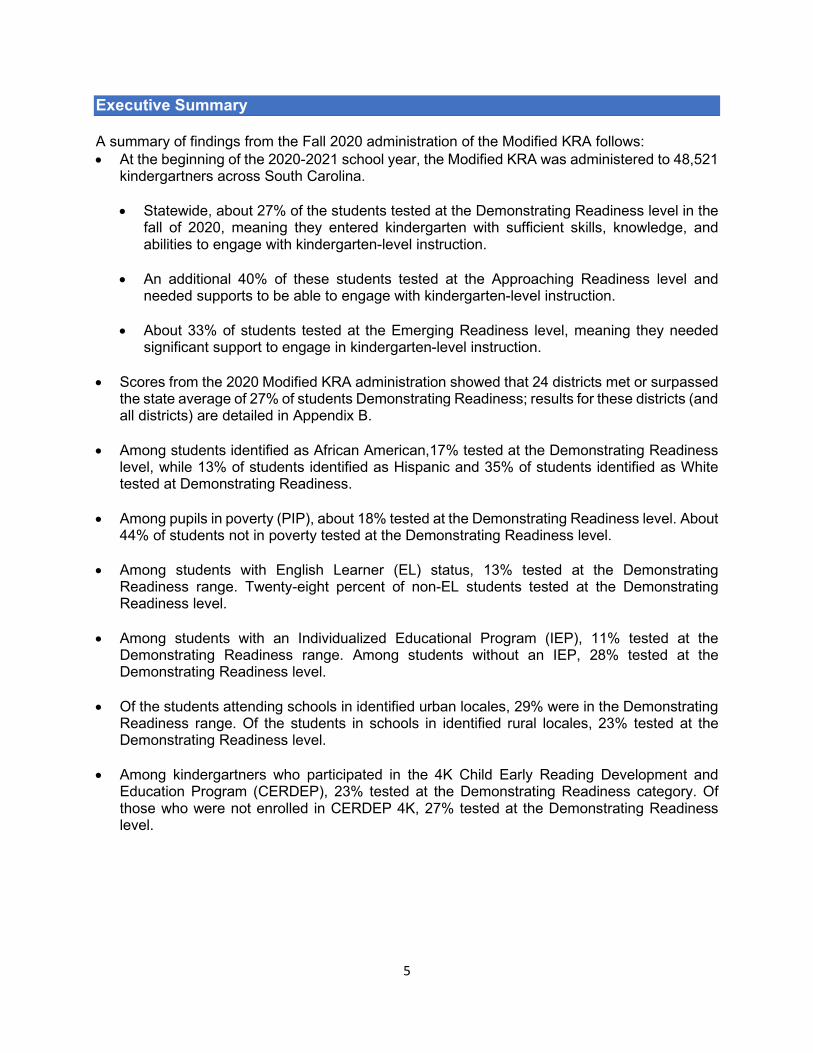
Executive Summary A summary of findings from the Fall 2020 administration of the Modified KRA follows: • At the beginning of the 2020-2021 school year, the Modified KRA was administered to 48,521
kindergartners across South Carolina. • Statewide, about 27% of the students tested at the Demonstrating Readiness level in the
fall of 2020, meaning they entered kindergarten with sufficient skills, knowledge, and abilities to engage with kindergarten-level instruction.
• An additional 40% of these students tested at the Approaching Readiness level and needed supports to be able to engage with kindergarten-level instruction.
• About 33% of students tested at the Emerging Readiness level, meaning they needed significant support to engage in kindergarten-level instruction.
• Scores from the 2020 Modified KRA administration showed that 24 districts met or surpassed the state average of 27% of students Demonstrating Readiness; results for these districts (and all districts) are detailed in Appendix B.
• Among students identified as African American,17% tested at the Demonstrating Readiness level, while 13% of students identified as Hispanic and 35% of students identified as White tested at Demonstrating Readiness.
• Among pupils in poverty (PIP), about 18% tested at the Demonstrating Readiness level. About
44% of students not in poverty tested at the Demonstrating Readiness level.
• Among students with English Learner (EL) status, 13% tested at the Demonstrating Readiness range. Twenty-eight percent of non-EL students tested at the Demonstrating Readiness level.
• Among students with an Individualized Educational Program (IEP), 11% tested at the
Demonstrating Readiness range. Among students without an IEP, 28% tested at the Demonstrating Readiness level.
• Of the students attending schools in identified urban locales, 29% were in the Demonstrating
Readiness range. Of the students in schools in identified rural locales, 23% tested at the Demonstrating Readiness level.
• Among kindergartners who participated in the 4K Child Early Reading Development and
Education Program (CERDEP), 23% tested at the Demonstrating Readiness category. Of those who were not enrolled in CERDEP 4K, 27% tested at the Demonstrating Readiness level.
6
Recommendations Recommendation 1: The test publisher’s note that the KRA assessment may be given within the first 45-days of a school year. However, it is recognized that scores for children may differ substantially if the test is given at the 1st day of school as compared to the 40th day of school. Recording the date when the KRA test is administered would allow for comparison of scores for children taking the assessment in similar timeframes. Recommendation 2: Administering the KRA requires significant time. The Modified KRA was abbreviated as an accommodation to pandemic protective measures, but at a sacrifice to the reliable measure of the domains in the original KRA blueprint. Ohio began using a shortened version of the measure (Kindergarten Readiness Assessment-Revised) in the fall of 2020. The benefits and qualities of the Ohio version should be investigated for possible adoption. Similarly, versions of the KRA administered in other states should be investigated. Adopting the same version of the KRA used in other states would also permit comparison of South Carolina readiness levels with those elsewhere. It is recommended to complete a review of the format, duration, and features of the readiness assessments given in other states. The features of these assessments should be considered, along with the suitability of the communities and student populations in those states for comparison with South Carolina, to inform decisions about future administrations of the KRA in South Carolina. Recommendation 3: The delay between students’ beginning kindergarten and delivery of KRA results limits the assessment’s potential benefits. We recommend finding ways to administer the KRA prior to the start of school, examining the possibility of using the shortened KRA-Revised, and working with the vendor to reduce the time required to deliver results. Recommendation 4: Matching kindergarten students’ records to data from their pre-kindergarten experience may include inaccuracies due to parent self-report of the pre-kindergarten program attended. The student data provided the SCDE and First Steps do not correspond in report of kindergartners’ prior year experience. The Office of Revenue and Fiscal Affairs has helped in matching kindergarten records to students’ enrollment in First Steps. It is recommended that a uniform system for collecting and reporting data be adopted among entities. Recommendation 5: Additional surveys of educators’ views on the KRA may contribute insight into the assessment’s utility. To increase representation and voice, a broader distribution of future surveys to a larger sample of stakeholders is recommended. Recommendation 6: It may be useful to open kindergarten teachers’ access to any available end-of-year 4K assessments. If students were assessed in their 4K year, results from these tests should be made available to kindergarten teachers to allow for informed, individualized instruction. Recommendation 7: Analyses related to school locale were limited by using a classification system that is limited to only rural and urban designations. We recommend exploring other classification systems (such as the National Center for Education Statistics) which classifies school locales as Rural, Small Town, Suburban, and Rural.
7
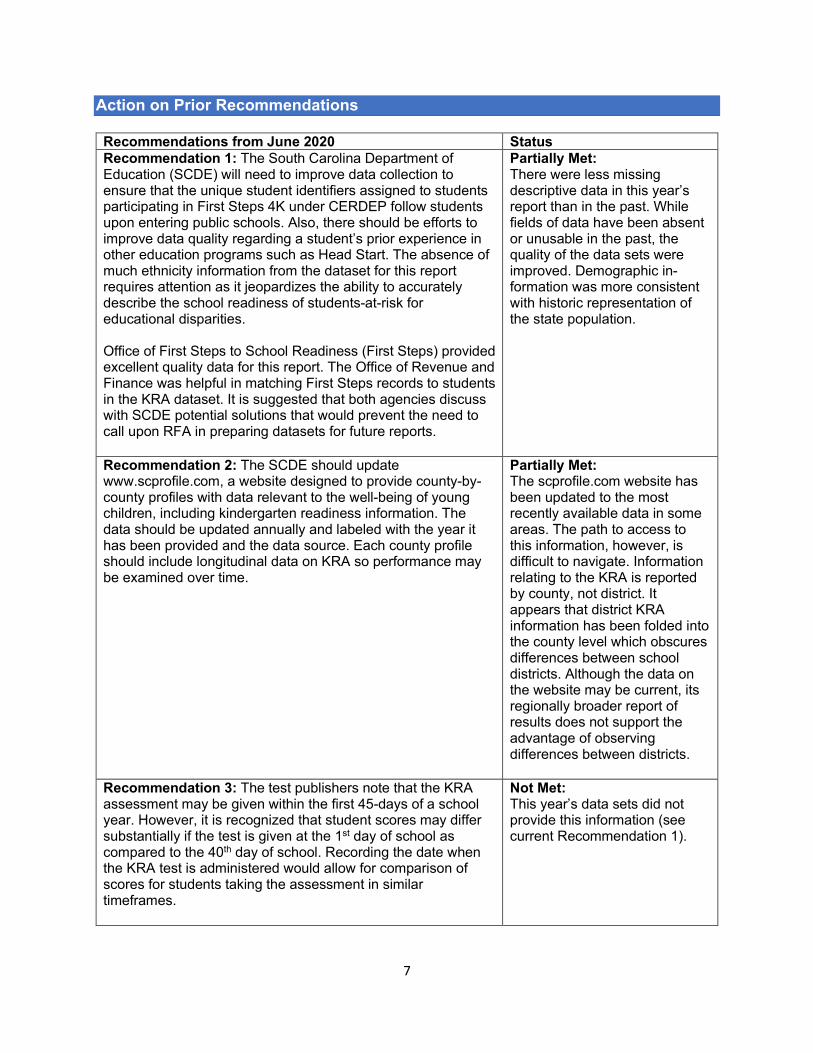
Action on Prior Recommendations Recommendations from June 2020 Status Recommendation 1: The South Carolina Department of Education (SCDE) will need to improve data collection to ensure that the unique student identifiers assigned to students participating in First Steps 4K under CERDEP follow students upon entering public schools. Also, there should be efforts to improve data quality regarding a student’s prior experience in other education programs such as Head Start. The absence of much ethnicity information from the dataset for this report requires attention as it jeopardizes the ability to accurately describe the school readiness of students-at-risk for educational disparities. Office of First Steps to School Readiness (First Steps) provided excellent quality data for this report. The Office of Revenue and Finance was helpful in matching First Steps records to students in the KRA dataset. It is suggested that both agencies discuss with SCDE potential solutions that would prevent the need to call upon RFA in preparing datasets for future reports.
Partially Met: There were less missing descriptive data in this year’s report than in the past. While fields of data have been absent or unusable in the past, the quality of the data sets were improved. Demographic in-formation was more consistent with historic representation of the state population.
Recommendation 2: The SCDE should update www.scprofile.com, a website designed to provide county-by-county profiles with data relevant to the well-being of young children, including kindergarten readiness information. The data should be updated annually and labeled with the year it has been provided and the data source. Each county profile should include longitudinal data on KRA so performance may be examined over time.
Partially Met: The scprofile.com website has been updated to the most recently available data in some areas. The path to access to this information, however, is difficult to navigate. Information relating to the KRA is reported by county, not district. It appears that district KRA information has been folded into the county level which obscures differences between school districts. Although the data on the website may be current, its regionally broader report of results does not support the advantage of observing differences between districts.
Recommendation 3: The test publishers note that the KRA assessment may be given within the first 45-days of a school year. However, it is recognized that student scores may differ substantially if the test is given at the 1st day of school as compared to the 40th day of school. Recording the date when the KRA test is administered would allow for comparison of scores for students taking the assessment in similar timeframes.
Not Met: This year’s data sets did not provide this information (see current Recommendation 1).
8
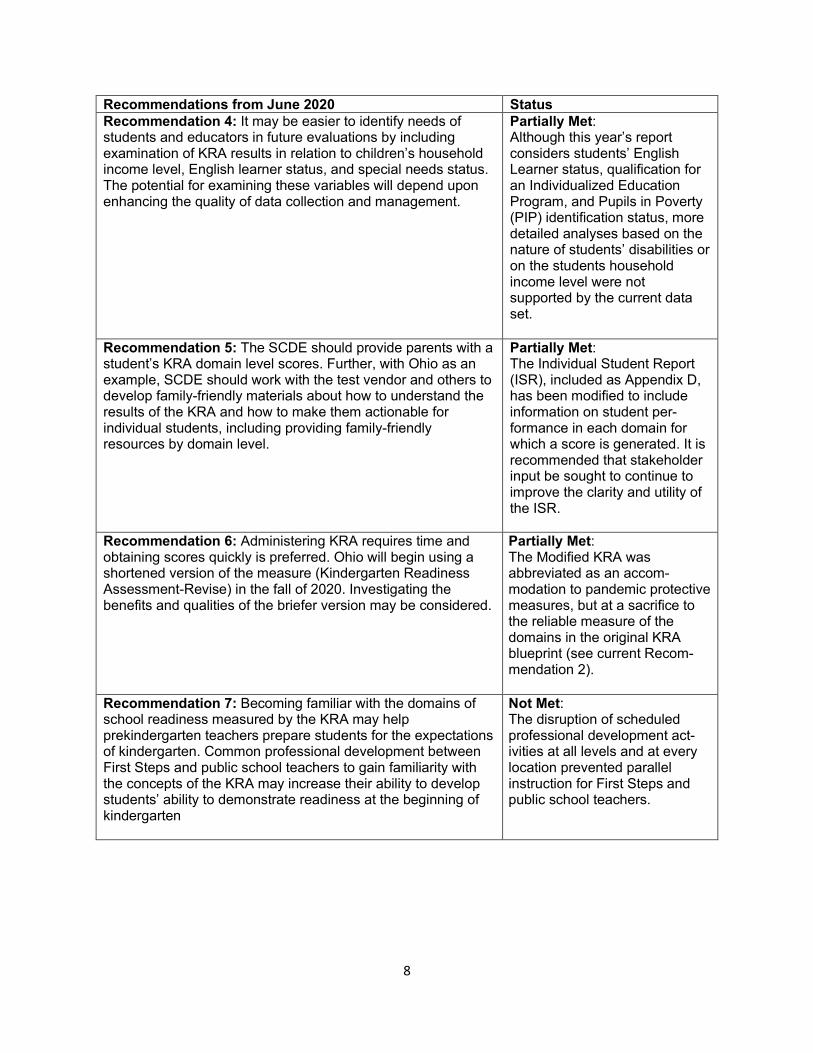
Recommendations from June 2020 Status Recommendation 4: It may be easier to identify needs of students and educators in future evaluations by including examination of KRA results in relation to children’s household income level, English learner status, and special needs status. The potential for examining these variables will depend upon enhancing the quality of data collection and management.
Partially Met: Although this year’s report considers students’ English Learner status, qualification for an Individualized Education Program, and Pupils in Poverty (PIP) identification status, more detailed analyses based on the nature of students’ disabilities or on the students household income level were not supported by the current data set.
Recommendation 5: The SCDE should provide parents with a student’s KRA domain level scores. Further, with Ohio as an example, SCDE should work with the test vendor and others to develop family-friendly materials about how to understand the results of the KRA and how to make them actionable for individual students, including providing family-friendly resources by domain level.
Partially Met: The Individual Student Report (ISR), included as Appendix D, has been modified to include information on student per-formance in each domain for which a score is generated. It is recommended that stakeholder input be sought to continue to improve the clarity and utility of the ISR.
Recommendation 6: Administering KRA requires time and obtaining scores quickly is preferred. Ohio will begin using a shortened version of the measure (Kindergarten Readiness Assessment-Revise) in the fall of 2020. Investigating the benefits and qualities of the briefer version may be considered.
Partially Met: The Modified KRA was abbreviated as an accom-modation to pandemic protective measures, but at a sacrifice to the reliable measure of the domains in the original KRA blueprint (see current Recom-mendation 2).
Recommendation 7: Becoming familiar with the domains of school readiness measured by the KRA may help prekindergarten teachers prepare students for the expectations of kindergarten. Common professional development between First Steps and public school teachers to gain familiarity with the concepts of the KRA may increase their ability to develop students’ ability to demonstrate readiness at the beginning of kindergarten
Not Met: The disruption of scheduled professional development act-ivities at all levels and at every location prevented parallel instruction for First Steps and public school teachers.
9
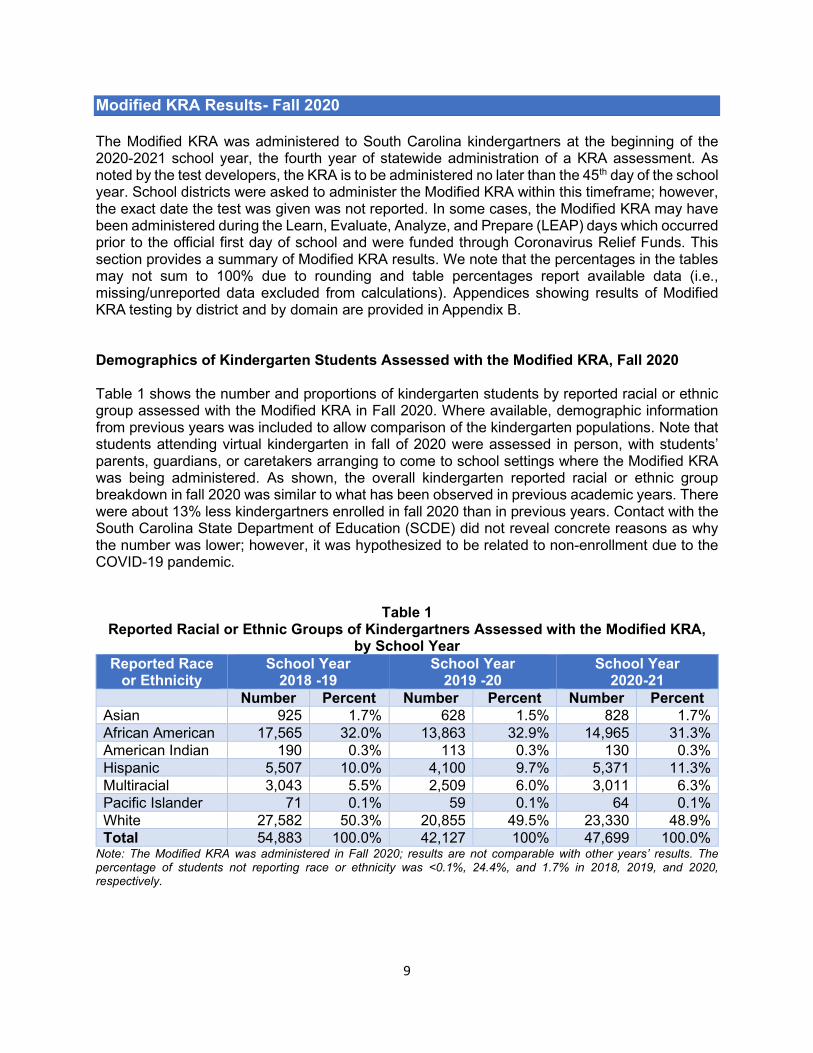
Modified KRA Results- Fall 2020 The Modified KRA was administered to South Carolina kindergartners at the beginning of the 2020-2021 school year, the fourth year of statewide administration of a KRA assessment. As noted by the test developers, the KRA is to be administered no later than the 45th day of the school year. School districts were asked to administer the Modified KRA within this timeframe; however, the exact date the test was given was not reported. In some cases, the Modified KRA may have been administered during the Learn, Evaluate, Analyze, and Prepare (LEAP) days which occurred prior to the official first day of school and were funded through Coronavirus Relief Funds. This section provides a summary of Modified KRA results. We note that the percentages in the tables may not sum to 100% due to rounding and table percentages report available data (i.e., missing/unreported data excluded from calculations). Appendices showing results of Modified KRA testing by district and by domain are provided in Appendix B. Demographics of Kindergarten Students Assessed with the Modified KRA, Fall 2020 Table 1 shows the number and proportions of kindergarten students by reported racial or ethnic group assessed with the Modified KRA in Fall 2020. Where available, demographic information from previous years was included to allow comparison of the kindergarten populations. Note that students attending virtual kindergarten in fall of 2020 were assessed in person, with students’ parents, guardians, or caretakers arranging to come to school settings where the Modified KRA was being administered. As shown, the overall kindergarten reported racial or ethnic group breakdown in fall 2020 was similar to what has been observed in previous academic years. There were about 13% less kindergartners enrolled in fall 2020 than in previous years. Contact with the South Carolina State Department of Education (SCDE) did not reveal concrete reasons as why the number was lower; however, it was hypothesized to be related to non-enrollment due to the COVID-19 pandemic.
Table 1 Reported Racial or Ethnic Groups of Kindergartners Assessed with the Modified KRA,
by School Year Reported Race
or Ethnicity School Year
2018 -19 School Year
2019 -20 School Year
2020-21 Number Percent Number Percent Number Percent
Asian 925 1.7% 628 1.5% 828 1.7% African American 17,565 32.0% 13,863 32.9% 14,965 31.3% American Indian 190 0.3% 113 0.3% 130 0.3% Hispanic 5,507 10.0% 4,100 9.7% 5,371 11.3% Multiracial 3,043 5.5% 2,509 6.0% 3,011 6.3% Pacific Islander 71 0.1% 59 0.1% 64 0.1% White 27,582 50.3% 20,855 49.5% 23,330 48.9% Total 54,883 100.0% 42,127 100% 47,699 100.0%
Note: The Modified KRA was administered in Fall 2020; results are not comparable with other years’ results. The percentage of students not reporting race or ethnicity was <0.1%, 24.4%, and 1.7% in 2018, 2019, and 2020, respectively.
10
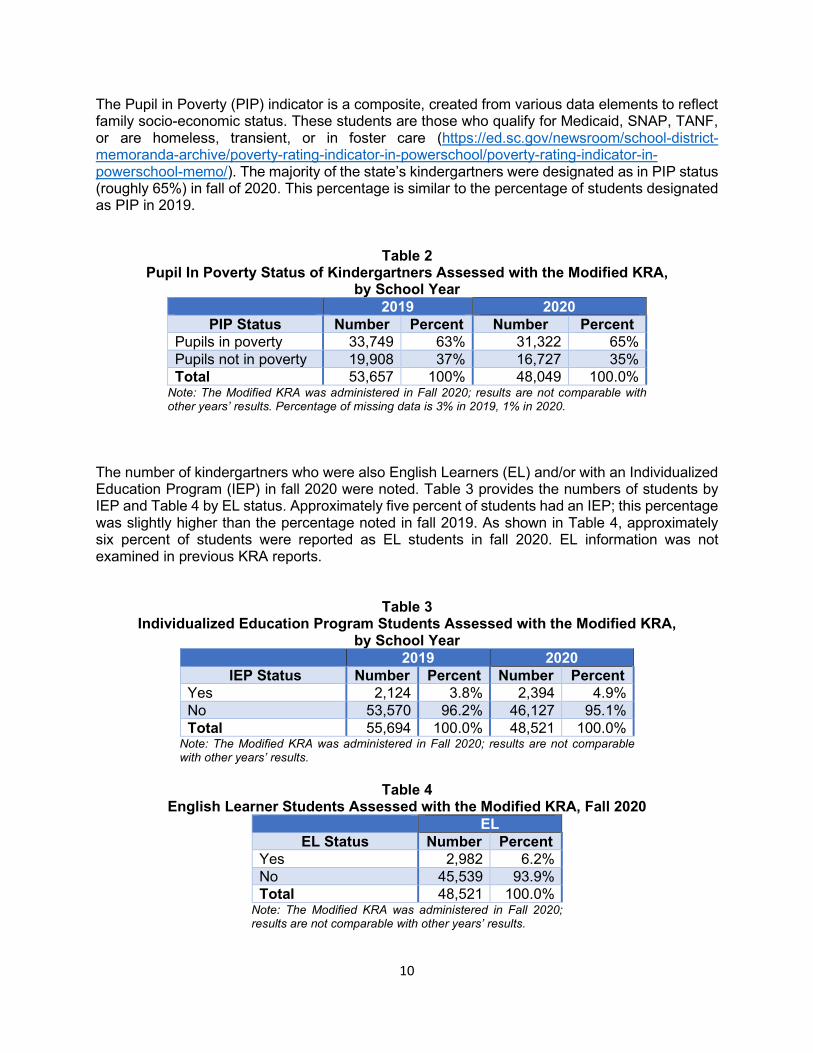
The Pupil in Poverty (PIP) indicator is a composite, created from various data elements to reflect family socio-economic status. These students are those who qualify for Medicaid, SNAP, TANF, or are homeless, transient, or in foster care (https://ed.sc.gov/newsroom/school-district-memoranda-archive/poverty-rating-indicator-in-powerschool/poverty-rating-indicator-in-powerschool-memo/). The majority of the state’s kindergartners were designated as in PIP status (roughly 65%) in fall of 2020. This percentage is similar to the percentage of students designated as PIP in 2019.
Table 2
Pupil In Poverty Status of Kindergartners Assessed with the Modified KRA, by School Year
2019 2020 PIP Status Number Percent Number Percent
Pupils in poverty 33,749 63% 31,322 65% Pupils not in poverty 19,908 37% 16,727 35% Total 53,657 100% 48,049 100.0%
Note: The Modified KRA was administered in Fall 2020; results are not comparable with other years’ results. Percentage of missing data is 3% in 2019, 1% in 2020.
The number of kindergartners who were also English Learners (EL) and/or with an Individualized Education Program (IEP) in fall 2020 were noted. Table 3 provides the numbers of students by IEP and Table 4 by EL status. Approximately five percent of students had an IEP; this percentage was slightly higher than the percentage noted in fall 2019. As shown in Table 4, approximately six percent of students were reported as EL students in fall 2020. EL information was not examined in previous KRA reports.
Table 3 Individualized Education Program Students Assessed with the Modified KRA,
by School Year 2019 2020
IEP Status Number Percent Number Percent Yes 2,124 3.8% 2,394 4.9% No 53,570 96.2% 46,127 95.1% Total 55,694 100.0% 48,521 100.0%
Note: The Modified KRA was administered in Fall 2020; results are not comparable with other years’ results.
Table 4
English Learner Students Assessed with the Modified KRA, Fall 2020 EL
EL Status Number Percent Yes 2,982 6.2% No 45,539 93.9% Total 48,521 100.0%
Note: The Modified KRA was administered in Fall 2020; results are not comparable with other years’ results.
11
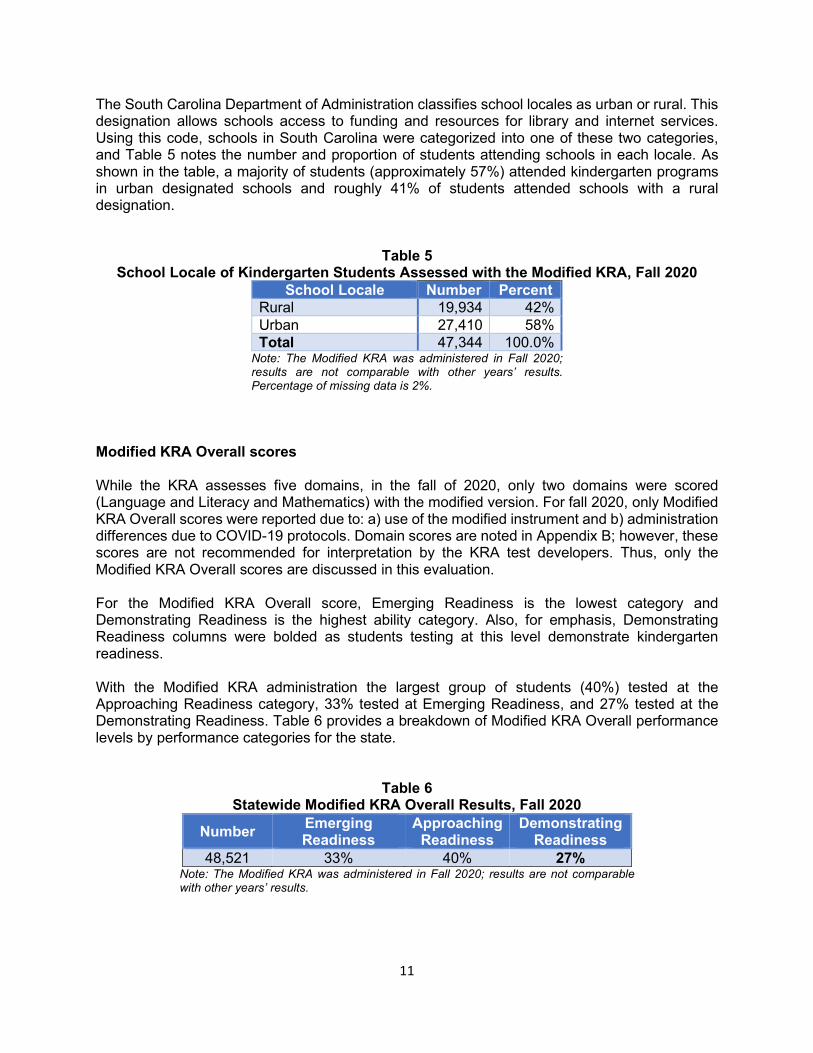
The South Carolina Department of Administration classifies school locales as urban or rural. This designation allows schools access to funding and resources for library and internet services. Using this code, schools in South Carolina were categorized into one of these two categories, and Table 5 notes the number and proportion of students attending schools in each locale. As shown in the table, a majority of students (approximately 57%) attended kindergarten programs in urban designated schools and roughly 41% of students attended schools with a rural designation.
Table 5 School Locale of Kindergarten Students Assessed with the Modified KRA, Fall 2020
School Locale Number Percent Rural 19,934 42% Urban 27,410 58% Total 47,344 100.0%
Note: The Modified KRA was administered in Fall 2020; results are not comparable with other years’ results. Percentage of missing data is 2%.
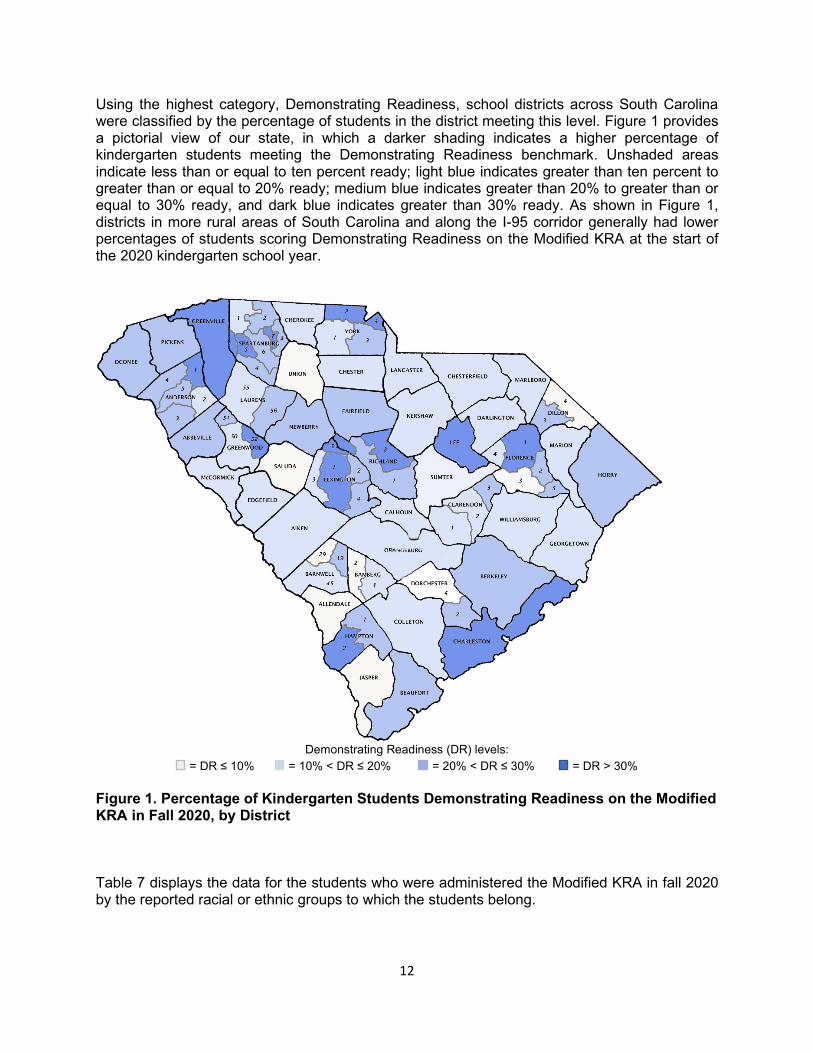
Modified KRA Overall scores While the KRA assesses five domains, in the fall of 2020, only two domains were scored (Language and Literacy and Mathematics) with the modified version. For fall 2020, only Modified KRA Overall scores were reported due to: a) use of the modified instrument and b) administration differences due to COVID-19 protocols. Domain scores are noted in Appendix B; however, these scores are not recommended for interpretation by the KRA test developers. Thus, only the Modified KRA Overall scores are discussed in this evaluation. For the Modified KRA Overall score, Emerging Readiness is the lowest category and Demonstrating Readiness is the highest ability category. Also, for emphasis, Demonstrating Readiness columns were bolded as students testing at this level demonstrate kindergarten readiness. With the Modified KRA administration the largest group of students (40%) tested at the Approaching Readiness category, 33% tested at Emerging Readiness, and 27% tested at the Demonstrating Readiness. Table 6 provides a breakdown of Modified KRA Overall performance levels by performance categories for the state.
Table 6 Statewide Modified KRA Overall Results, Fall 2020
Number Emerging Readiness
Approaching Readiness
Demonstrating Readiness
48,521 33% 40% 27% Note: The Modified KRA was administered in Fall 2020; results are not comparable with other years’ results.
12
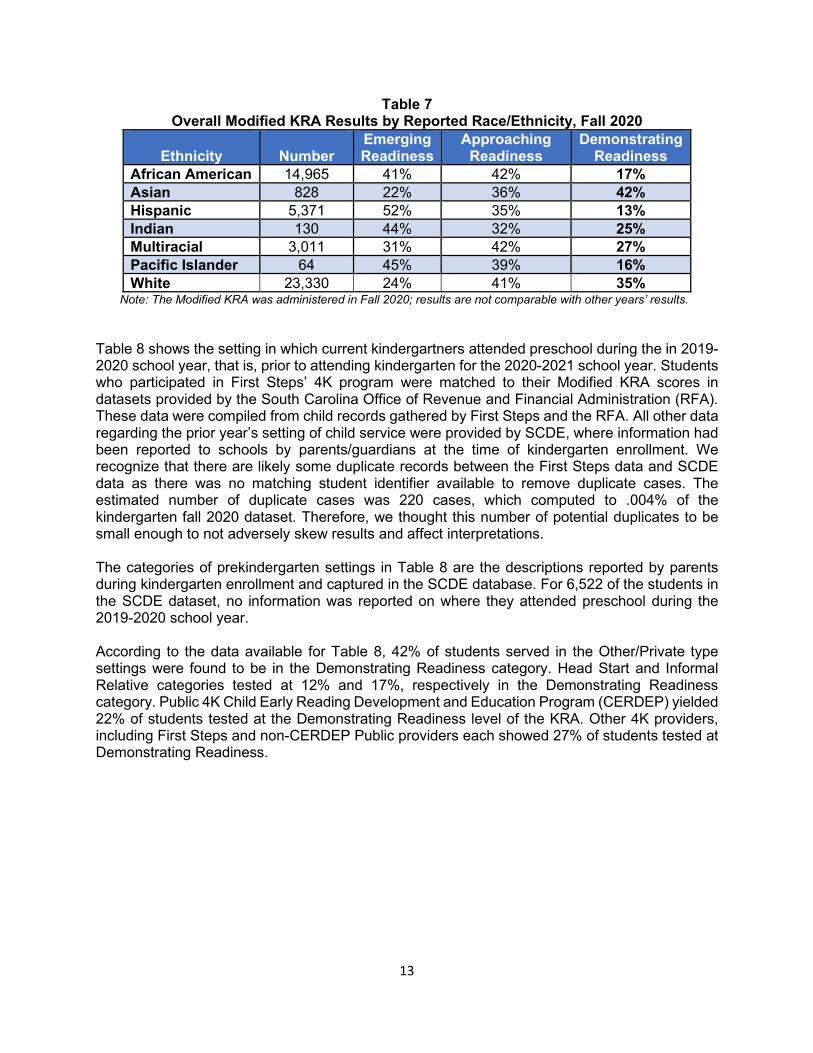
Using the highest category, Demonstrating Readiness, school districts across South Carolina were classified by the percentage of students in the district meeting this level. Figure 1 provides a pictorial view of our state, in which a darker shading indicates a higher percentage of kindergarten students meeting the Demonstrating Readiness benchmark. Unshaded areas indicate less than or equal to ten percent ready; light blue indicates greater than ten percent to greater than or equal to 20% ready; medium blue indicates greater than 20% to greater than or equal to 30% ready, and dark blue indicates greater than 30% ready. As shown in Figure 1, districts in more rural areas of South Carolina and along the I-95 corridor generally had lower percentages of students scoring Demonstrating Readiness on the Modified KRA at the start of the 2020 kindergarten school year.
Demonstrating Readiness (DR) levels:
= DR ≤ 10% = 10% < DR ≤ 20% = 20% < DR ≤ 30% = DR > 30% Figure 1. Percentage of Kindergarten Students Demonstrating Readiness on the Modified KRA in Fall 2020, by District Table 7 displays the data for the students who were administered the Modified KRA in fall 2020 by the reported racial or ethnic groups to which the students belong.
13
Table 7 Overall Modified KRA Results by Reported Race/Ethnicity, Fall 2020
Ethnicity
Number
Emerging Readiness
Approaching Readiness
Demonstrating Readiness
African American 14,965 41% 42% 17% Asian 828 22% 36% 42% Hispanic 5,371 52% 35% 13% Indian 130 44% 32% 25% Multiracial 3,011 31% 42% 27% Pacific Islander 64 45% 39% 16% White 23,330 24% 41% 35%
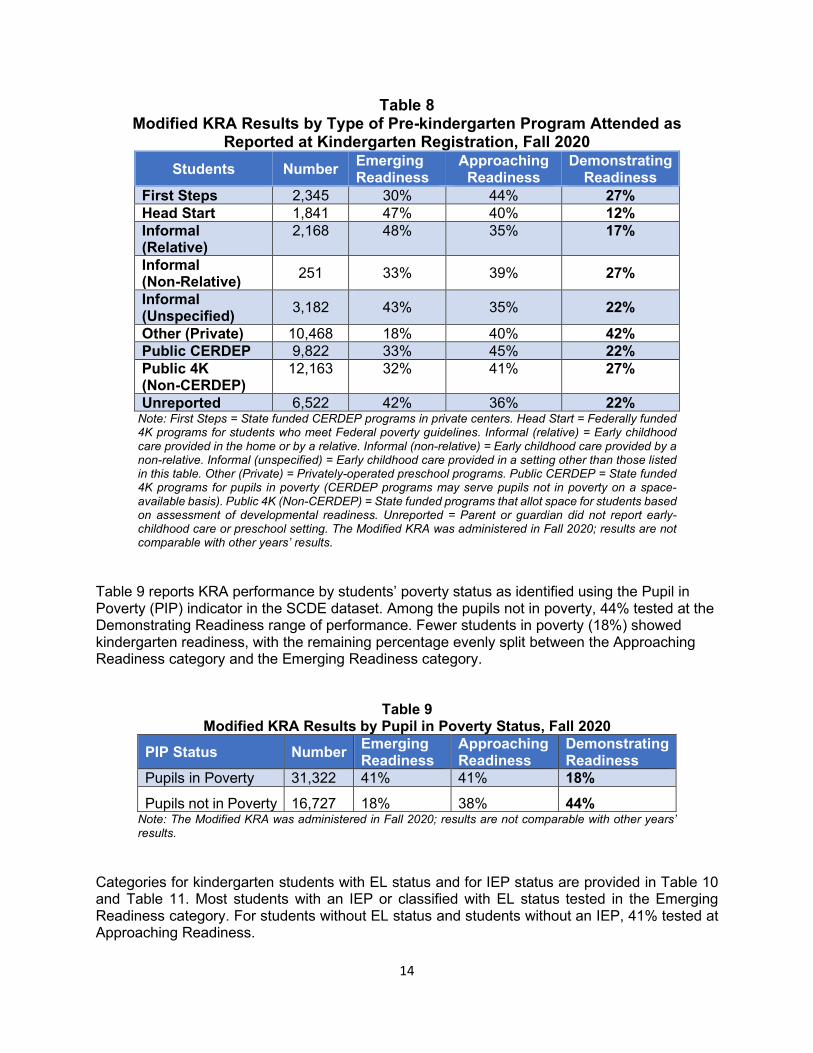
Note: The Modified KRA was administered in Fall 2020; results are not comparable with other years’ results. Table 8 shows the setting in which current kindergartners attended preschool during the in 2019-2020 school year, that is, prior to attending kindergarten for the 2020-2021 school year. Students who participated in First Steps’ 4K program were matched to their Modified KRA scores in datasets provided by the South Carolina Office of Revenue and Financial Administration (RFA). These data were compiled from child records gathered by First Steps and the RFA. All other data regarding the prior year’s setting of child service were provided by SCDE, where information had been reported to schools by parents/guardians at the time of kindergarten enrollment. We recognize that there are likely some duplicate records between the First Steps data and SCDE data as there was no matching student identifier available to remove duplicate cases. The estimated number of duplicate cases was 220 cases, which computed to .004% of the kindergarten fall 2020 dataset. Therefore, we thought this number of potential duplicates to be small enough to not adversely skew results and affect interpretations. The categories of prekindergarten settings in Table 8 are the descriptions reported by parents during kindergarten enrollment and captured in the SCDE database. For 6,522 of the students in the SCDE dataset, no information was reported on where they attended preschool during the 2019-2020 school year. According to the data available for Table 8, 42% of students served in the Other/Private type settings were found to be in the Demonstrating Readiness category. Head Start and Informal Relative categories tested at 12% and 17%, respectively in the Demonstrating Readiness category. Public 4K Child Early Reading Development and Education Program (CERDEP) yielded 22% of students tested at the Demonstrating Readiness level of the KRA. Other 4K providers, including First Steps and non-CERDEP Public providers each showed 27% of students tested at Demonstrating Readiness.
14
Table 8 Modified KRA Results by Type of Pre-kindergarten Program Attended as
Reported at Kindergarten Registration, Fall 2020 Students Number Emerging
Readiness Approaching
Readiness Demonstrating
Readiness First Steps 2,345 30% 44% 27% Head Start 1,841 47% 40% 12% Informal (Relative)
2,168 48% 35% 17%
Informal (Non-Relative) 251 33% 39% 27%
Informal (Unspecified) 3,182 43% 35% 22%
Other (Private) 10,468 18% 40% 42% Public CERDEP 9,822 33% 45% 22% Public 4K (Non-CERDEP)
12,163 32% 41% 27%
Unreported 6,522 42% 36% 22% Note: First Steps = State funded CERDEP programs in private centers. Head Start = Federally funded 4K programs for students who meet Federal poverty guidelines. Informal (relative) = Early childhood care provided in the home or by a relative. Informal (non-relative) = Early childhood care provided by a non-relative. Informal (unspecified) = Early childhood care provided in a setting other than those listed in this table. Other (Private) = Privately-operated preschool programs. Public CERDEP = State funded 4K programs for pupils in poverty (CERDEP programs may serve pupils not in poverty on a space-available basis). Public 4K (Non-CERDEP) = State funded programs that allot space for students based on assessment of developmental readiness. Unreported = Parent or guardian did not report early-childhood care or preschool setting. The Modified KRA was administered in Fall 2020; results are not comparable with other years’ results.
Table 9 reports KRA performance by students’ poverty status as identified using the Pupil in Poverty (PIP) indicator in the SCDE dataset. Among the pupils not in poverty, 44% tested at the Demonstrating Readiness range of performance. Fewer students in poverty (18%) showed kindergarten readiness, with the remaining percentage evenly split between the Approaching Readiness category and the Emerging Readiness category.
Table 9 Modified KRA Results by Pupil in Poverty Status, Fall 2020
PIP Status Number Emerging Readiness
Approaching Readiness
Demonstrating Readiness
Pupils in Poverty 31,322 41% 41% 18% Pupils not in Poverty 16,727 18% 38% 44%
Note: The Modified KRA was administered in Fall 2020; results are not comparable with other years’ results.
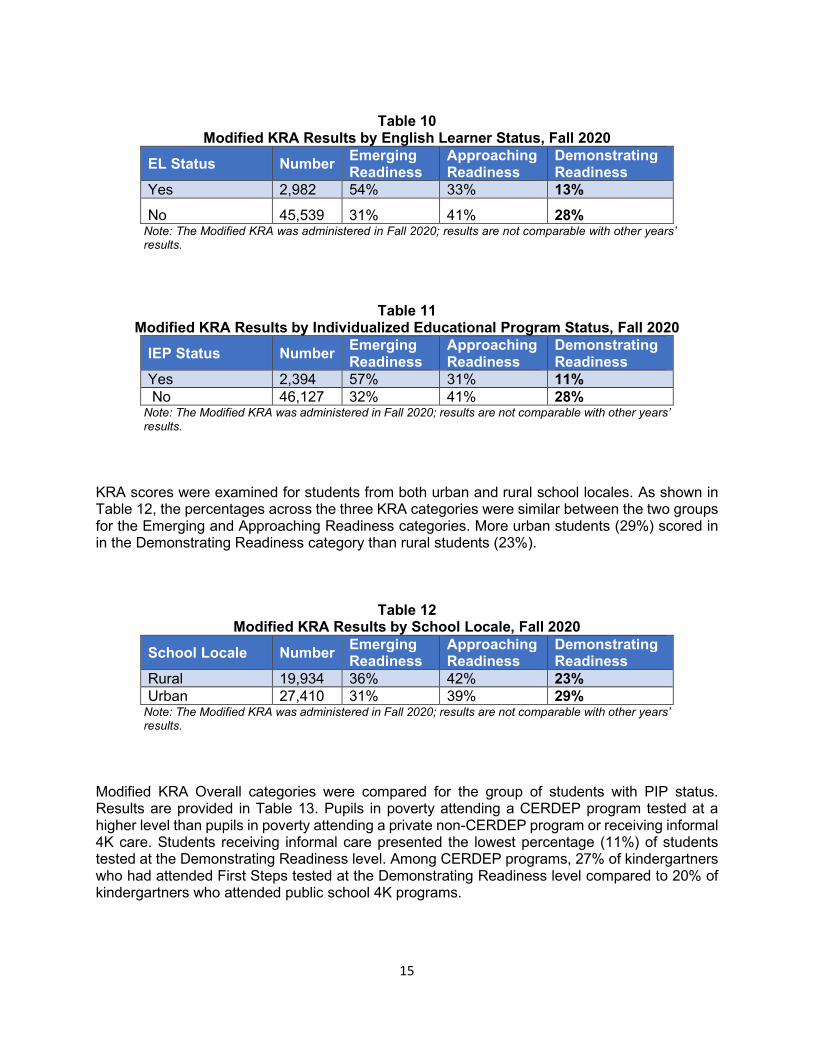
Categories for kindergarten students with EL status and for IEP status are provided in Table 10 and Table 11. Most students with an IEP or classified with EL status tested in the Emerging Readiness category. For students without EL status and students without an IEP, 41% tested at Approaching Readiness.
15
Table 10
Modified KRA Results by English Learner Status, Fall 2020 EL Status Number Emerging
Readiness Approaching Readiness
Demonstrating Readiness
Yes 2,982 54% 33% 13% No 45,539 31% 41% 28%
Note: The Modified KRA was administered in Fall 2020; results are not comparable with other years’ results.
Table 11
Modified KRA Results by Individualized Educational Program Status, Fall 2020 IEP Status Number Emerging
Readiness Approaching Readiness
Demonstrating Readiness
Yes 2,394 57% 31% 11% No 46,127 32% 41% 28%
Note: The Modified KRA was administered in Fall 2020; results are not comparable with other years’ results.
KRA scores were examined for students from both urban and rural school locales. As shown in Table 12, the percentages across the three KRA categories were similar between the two groups for the Emerging and Approaching Readiness categories. More urban students (29%) scored in in the Demonstrating Readiness category than rural students (23%).
Table 12
Modified KRA Results by School Locale, Fall 2020 School Locale Number Emerging
Readiness Approaching Readiness
Demonstrating Readiness
Rural 19,934 36% 42% 23% Urban 27,410 31% 39% 29%
Note: The Modified KRA was administered in Fall 2020; results are not comparable with other years’ results.
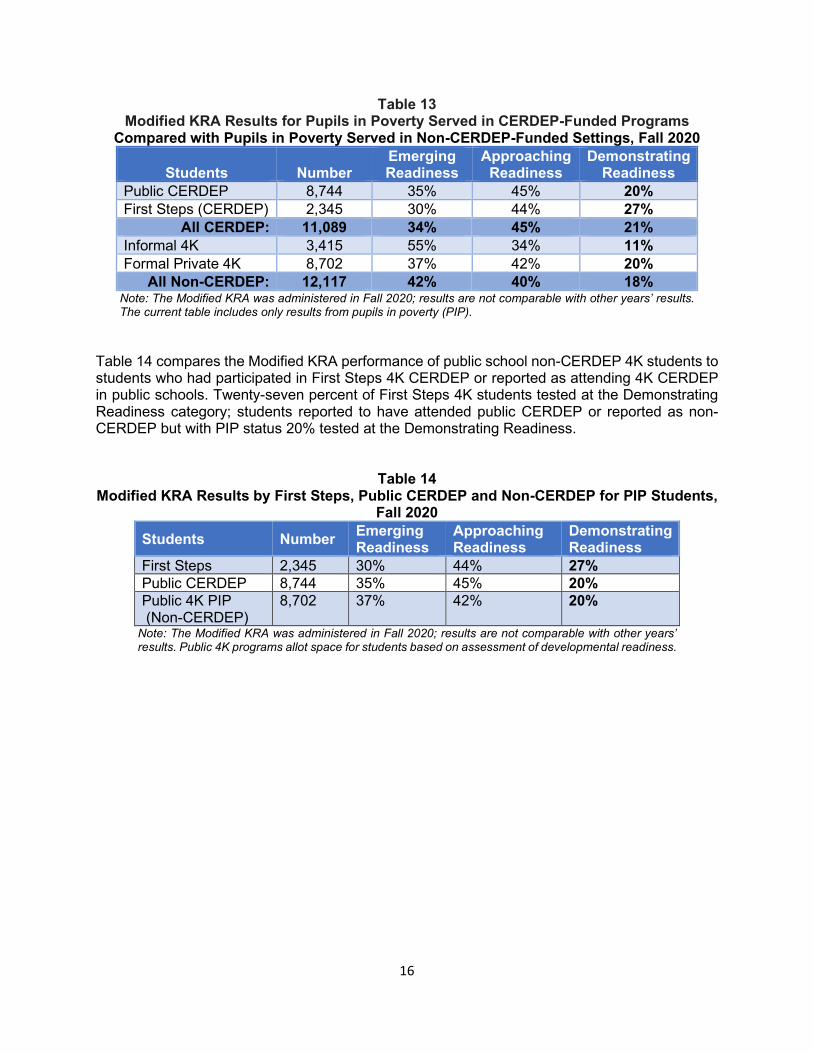
Modified KRA Overall categories were compared for the group of students with PIP status. Results are provided in Table 13. Pupils in poverty attending a CERDEP program tested at a higher level than pupils in poverty attending a private non-CERDEP program or receiving informal 4K care. Students receiving informal care presented the lowest percentage (11%) of students tested at the Demonstrating Readiness level. Among CERDEP programs, 27% of kindergartners who had attended First Steps tested at the Demonstrating Readiness level compared to 20% of kindergartners who attended public school 4K programs.
16
Table 13 Modified KRA Results for Pupils in Poverty Served in CERDEP-Funded Programs
Compared with Pupils in Poverty Served in Non-CERDEP-Funded Settings, Fall 2020
Students Number Emerging Readiness
Approaching Readiness
Demonstrating Readiness
Public CERDEP 8,744 35% 45% 20% First Steps (CERDEP) 2,345 30% 44% 27%
All CERDEP: 11,089 34% 45% 21% Informal 4K 3,415 55% 34% 11% Formal Private 4K 8,702 37% 42% 20%
All Non-CERDEP: 12,117 42% 40% 18% Note: The Modified KRA was administered in Fall 2020; results are not comparable with other years’ results. The current table includes only results from pupils in poverty (PIP).
Table 14 compares the Modified KRA performance of public school non-CERDEP 4K students to students who had participated in First Steps 4K CERDEP or reported as attending 4K CERDEP in public schools. Twenty-seven percent of First Steps 4K students tested at the Demonstrating Readiness category; students reported to have attended public CERDEP or reported as non-CERDEP but with PIP status 20% tested at the Demonstrating Readiness.
Table 14 Modified KRA Results by First Steps, Public CERDEP and Non-CERDEP for PIP Students,
Fall 2020
Students Number Emerging Readiness
Approaching Readiness
Demonstrating Readiness
First Steps 2,345 30% 44% 27% Public CERDEP 8,744 35% 45% 20% Public 4K PIP (Non-CERDEP)
8,702 37% 42% 20%
Note: The Modified KRA was administered in Fall 2020; results are not comparable with other years’ results. Public 4K programs allot space for students based on assessment of developmental readiness.
17
Survey of Stakeholder Perceptions Beginning in the 2014-15 school year, the Kindergarten Readiness Assessment (KRA) has been administered at the start of the kindergarten year to measure young students’ school readiness. The goal is to provide information to help kindergarten teachers understand how to “best meet a child’s needs and to help schools, families, communities, and policy makers know how best to support young students as they enter the K-12 environment” (https://ed.sc.gov/instruction/early-learning-and-literacy/assessments-in-early-learning/kindergarten-readiness-assessments/). While it has been state law to administer the KRA, school personnel had not been asked about the usefulness of the information, how assessment information is used, or teachers’ and administrators’ perceptions of the test and testing process. To gain their perspective on these questions, at the June 2020 meeting, the Education Oversight Committee (EOC) requested that feedback be solicited from teachers and other stakeholders. In response to the request, a survey was created and distributed in April 2021 to school and district personnel. The survey was sent to an email list of 179 school and district level personnel associated with various EOC initiatives. Recipients of the email were asked to forward the web-based survey to teachers, administrators, and other school personnel who were involved with the KRA and could provide information. The goal of the survey was to gauge feedback about the KRA process, use of results, and teachers’ and administrators’ perspectives of the KRA. The survey was brief and included a mix of open- and closed-ended questions. Closed-ended questions asked stakeholders’ experiences with the KRA and using KRA report information; information about how the KRA reports were used; and which school personnel were responsible for administering the assessment. Open-ended questions allowed respondents to provide perspectives about what they liked best and least about KRA testing. Finally, limited demographic information was requested so as not to identify respondents and anonymity was assured to encourage honest feedback. Note that the survey asked respondents to provide feedback related to the KRA during the COVID-19 pandemic. It is possible that respondents’ experiences with and disruptions related to the pandemic could have colored their responses. Responses were summarized for closed-ended questions by computing frequency tables, percentages and descriptive information; open-ended questions were summarized by sorting responses based on themes in the data. A copy of the KRA Survey administered is provided in Appendix C. To gain as many responses as possible, the link was active for a two-week period. One hundred eighty respondents provided feedback to the survey; as the survey was anonymous, we are unable to distinguish the number of respondents from the original email list versus those respondents completing the survey after receiving the forwarded link. The 180 responses were used for the sample; however, we recognize that select items may not have 180 responses due to missing data. Nonresponse is noted where appropriate. Also, responses may not sum to 100% due to rounding. Of the survey respondents, 175 reported their position in the school district. The majority were teachers (144 or 82%) and 25 (14%) of the survey respondents were administrators (e.g., principal or assistant principal). There were six respondents who wrote in positions, including: Literacy Coach (2 respondents), and one each for positions of Reading Coach, Instructional Facilitator, District Instructional Specialist, and Director of Child Development. Five respondents did not state their position in the school district. Table 15 reports the position of the KRA survey respondents.
18
Table 15 Position Reported by KRA Survey Respondents
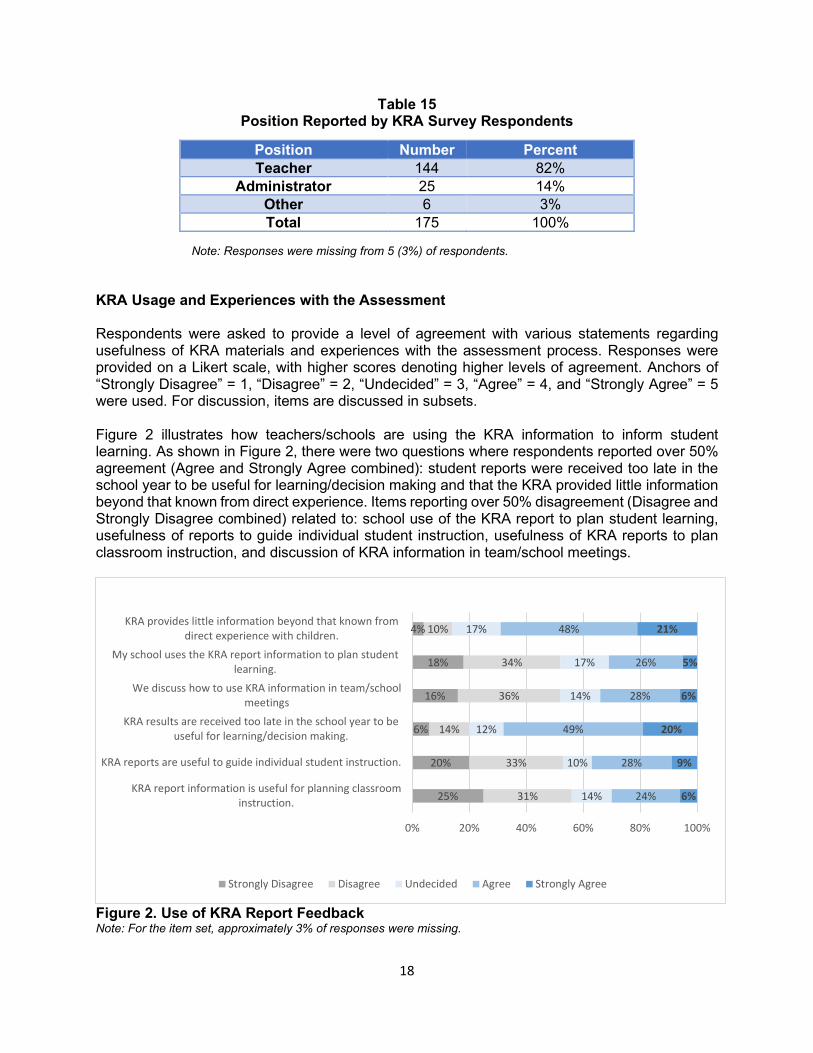
Note: Responses were missing from 5 (3%) of respondents. KRA Usage and Experiences with the Assessment Respondents were asked to provide a level of agreement with various statements regarding usefulness of KRA materials and experiences with the assessment process. Responses were provided on a Likert scale, with higher scores denoting higher levels of agreement. Anchors of “Strongly Disagree” = 1, “Disagree” = 2, “Undecided” = 3, “Agree” = 4, and “Strongly Agree” = 5 were used. For discussion, items are discussed in subsets. Figure 2 illustrates how teachers/schools are using the KRA information to inform student learning. As shown in Figure 2, there were two questions where respondents reported over 50% agreement (Agree and Strongly Agree combined): student reports were received too late in the school year to be useful for learning/decision making and that the KRA provided little information beyond that known from direct experience. Items reporting over 50% disagreement (Disagree and Strongly Disagree combined) related to: school use of the KRA report to plan student learning, usefulness of reports to guide individual student instruction, usefulness of KRA reports to plan classroom instruction, and discussion of KRA information in team/school meetings.
Figure 2. Use of KRA Report Feedback Note: For the item set, approximately 3% of responses were missing.
25%
20%
6%
16%
18%
4%
31%
33%
14%
36%
34%
10%
14%
10%
12%
14%
17%
17%
24%
28%
49%
28%
26%
48%
6%
9%
20%
6%
5%
21%
0% 20% 40% 60% 80% 100%
KRA report information is useful for planning classroominstruction.
KRA reports are useful to guide individual student instruction.
KRA results are received too late in the school year to beuseful for learning/decision making.
We discuss how to use KRA information in team/schoolmeetings
My school uses the KRA report information to plan studentlearning.
KRA provides little information beyond that known fromdirect experience with children.
Strongly Disagree Disagree Undecided Agree Strongly Agree
Position Number Percent Teacher 144 82%
Administrator 25 14% Other 6 3% Total 175 100%
19
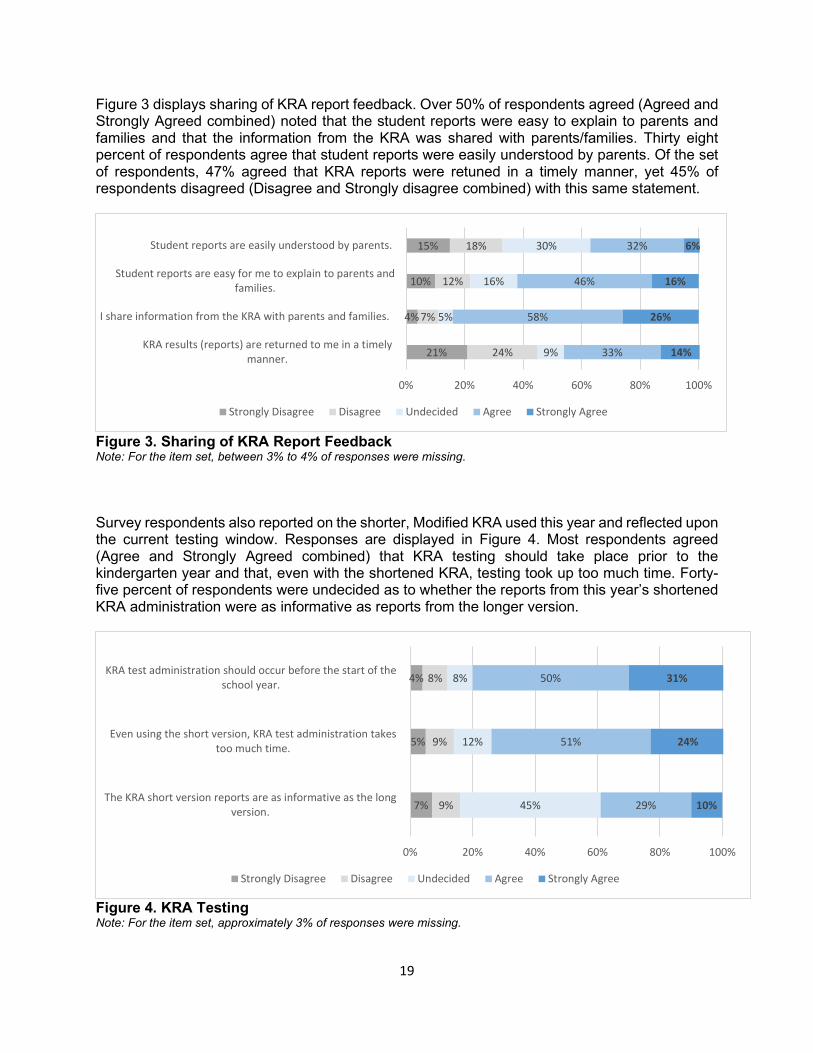
Figure 3 displays sharing of KRA report feedback. Over 50% of respondents agreed (Agreed and Strongly Agreed combined) noted that the student reports were easy to explain to parents and families and that the information from the KRA was shared with parents/families. Thirty eight percent of respondents agree that student reports were easily understood by parents. Of the set of respondents, 47% agreed that KRA reports were retuned in a timely manner, yet 45% of respondents disagreed (Disagree and Strongly disagree combined) with this same statement.
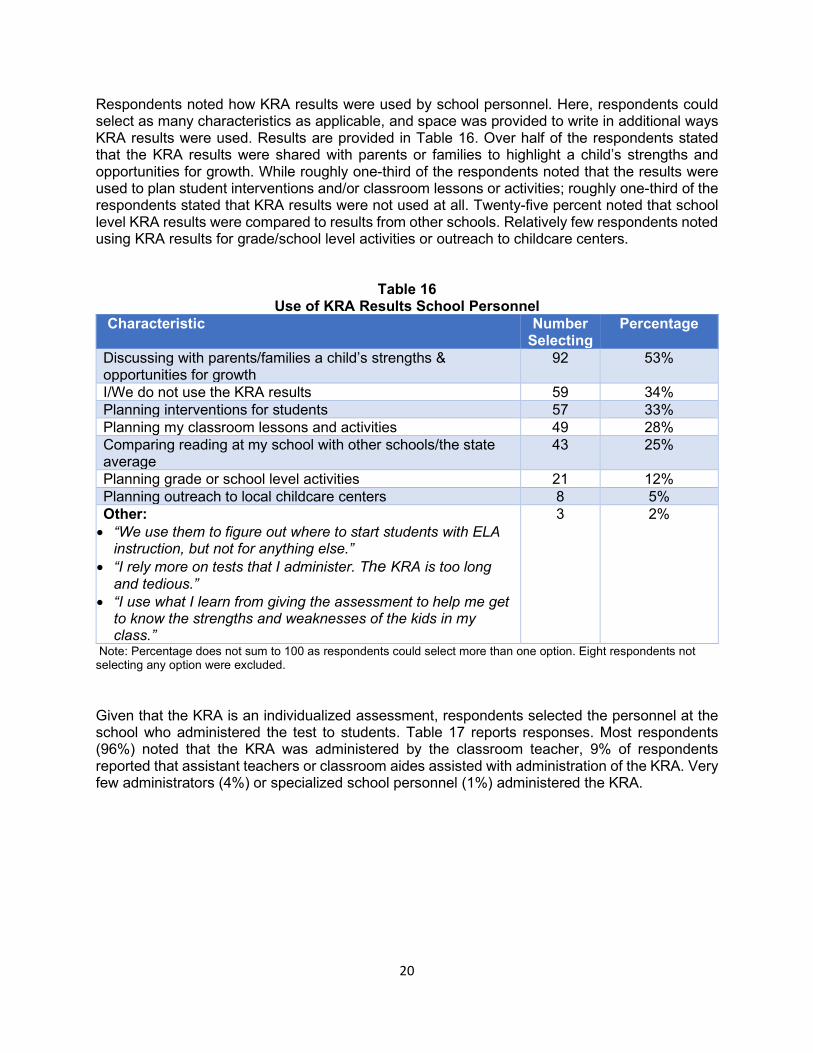
Figure 3. Sharing of KRA Report Feedback Note: For the item set, between 3% to 4% of responses were missing. Survey respondents also reported on the shorter, Modified KRA used this year and reflected upon the current testing window. Responses are displayed in Figure 4. Most respondents agreed (Agree and Strongly Agreed combined) that KRA testing should take place prior to the kindergarten year and that, even with the shortened KRA, testing took up too much time. Forty-five percent of respondents were undecided as to whether the reports from this year’s shortened KRA administration were as informative as reports from the longer version.
Figure 4. KRA Testing Note: For the item set, approximately 3% of responses were missing.
21%
4%
10%
15%
24%
7%
12%
18%
9%
5%
16%
30%
33%
58%
46%
32%
14%
26%
16%
6%
0% 20% 40% 60% 80% 100%
KRA results (reports) are returned to me in a timelymanner.
I share information from the KRA with parents and families.
Student reports are easy for me to explain to parents andfamilies.
Student reports are easily understood by parents.
Strongly Disagree Disagree Undecided Agree Strongly Agree
7%
5%
4%
9%
9%
8%
45%
12%
8%
29%
51%
50%
10%
24%
31%
0% 20% 40% 60% 80% 100%
The KRA short version reports are as informative as the longversion.
Even using the short version, KRA test administration takestoo much time.
KRA test administration should occur before the start of theschool year.
Strongly Disagree Disagree Undecided Agree Strongly Agree
20
Respondents noted how KRA results were used by school personnel. Here, respondents could select as many characteristics as applicable, and space was provided to write in additional ways KRA results were used. Results are provided in Table 16. Over half of the respondents stated that the KRA results were shared with parents or families to highlight a child’s strengths and opportunities for growth. While roughly one-third of the respondents noted that the results were used to plan student interventions and/or classroom lessons or activities; roughly one-third of the respondents stated that KRA results were not used at all. Twenty-five percent noted that school level KRA results were compared to results from other schools. Relatively few respondents noted using KRA results for grade/school level activities or outreach to childcare centers.
Table 16 Use of KRA Results School Personnel
Characteristic Number Selecting
Percentage
Discussing with parents/families a child’s strengths & opportunities for growth
92 53%
I/We do not use the KRA results 59 34% Planning interventions for students 57 33% Planning my classroom lessons and activities 49 28% Comparing reading at my school with other schools/the state average
43 25%
Planning grade or school level activities 21 12% Planning outreach to local childcare centers 8 5% Other: • “We use them to figure out where to start students with ELA
instruction, but not for anything else.” • “I rely more on tests that I administer. The KRA is too long
and tedious.” • “I use what I learn from giving the assessment to help me get
to know the strengths and weaknesses of the kids in my class.”
3 2%
Note: Percentage does not sum to 100 as respondents could select more than one option. Eight respondents not selecting any option were excluded. Given that the KRA is an individualized assessment, respondents selected the personnel at the school who administered the test to students. Table 17 reports responses. Most respondents (96%) noted that the KRA was administered by the classroom teacher, 9% of respondents reported that assistant teachers or classroom aides assisted with administration of the KRA. Very few administrators (4%) or specialized school personnel (1%) administered the KRA.
21
Table 17 School Personnel Administering the KRA
Personnel Number Selecting Percent of Total Respondents
Classroom Teacher 172 96% Assistant Teacher/Classroom Aides
17 9%
Administrator 4 2% Specialized school personnel 1 1%
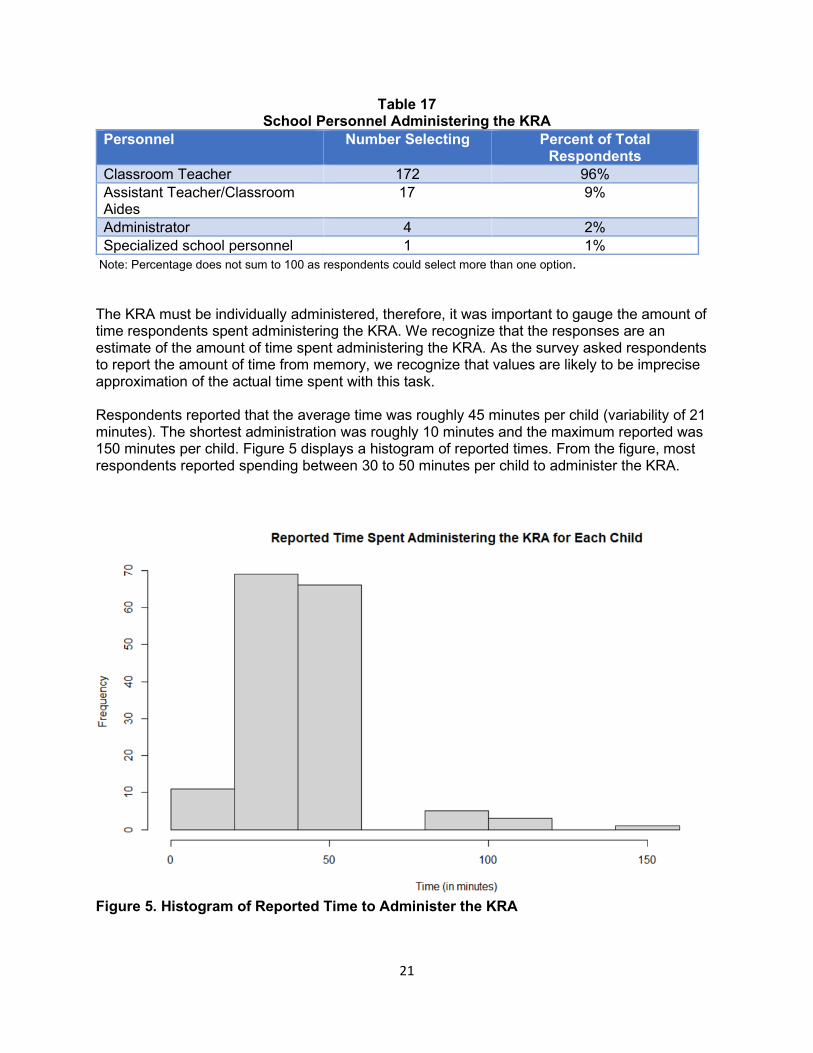
Note: Percentage does not sum to 100 as respondents could select more than one option. The KRA must be individually administered, therefore, it was important to gauge the amount of time respondents spent administering the KRA. We recognize that the responses are an estimate of the amount of time spent administering the KRA. As the survey asked respondents to report the amount of time from memory, we recognize that values are likely to be imprecise approximation of the actual time spent with this task. Respondents reported that the average time was roughly 45 minutes per child (variability of 21 minutes). The shortest administration was roughly 10 minutes and the maximum reported was 150 minutes per child. Figure 5 displays a histogram of reported times. From the figure, most respondents reported spending between 30 to 50 minutes per child to administer the KRA.
Figure 5. Histogram of Reported Time to Administer the KRA
22
To allow respondents space to provide their perspectives on the KRA testing, two open ended questions were included on the survey. These questions asked respondents to reflect on the aspects of the KRA testing that were liked the most and the least. Respondents were asked what they liked best about the KRA testing. Of the 180 survey respondents, 127 (71%) answered this open-ended question. Their responses were grouped by themes and placed into categories. Some replies to this question contained elements that fell into more than one category.
The most frequently mentioned positive aspect of the KRA was learning about students’ skill level in the domains measured by the KRA. Some respondents referred to the benefit of using the assessment information as a basis for planning instruction.
The second most mentioned positive aspect of the KRA was the reports it yields. These comments mentioned the clarity and ease of understanding of individual student reports, as well as the recommendations provided. A few respondents particularly wrote they liked the KRA report for parents.
The third most mentioned positive aspect of the KRA was the utilization of computer technology. Respondents mentioned reduction in paper, availability of results on computers, and the benefits of having students use iPads in administration.
Other positive responses were mentioned with less frequency. These included the benefits of KRA results when communicating with parents, appreciation of the broad scope of the assessment, liking the one-on-one time with students, and enjoying the administration of the KRA. A couple of respondents most liked the shortened version of the KRA that was given in 2020.
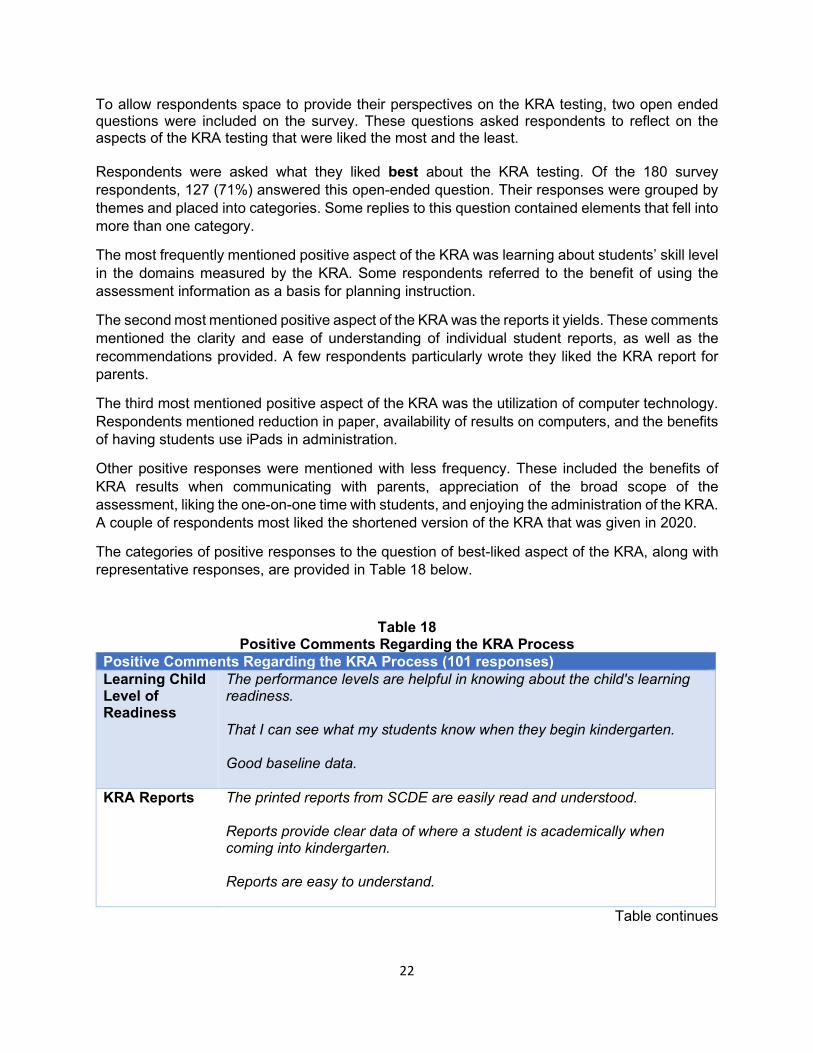
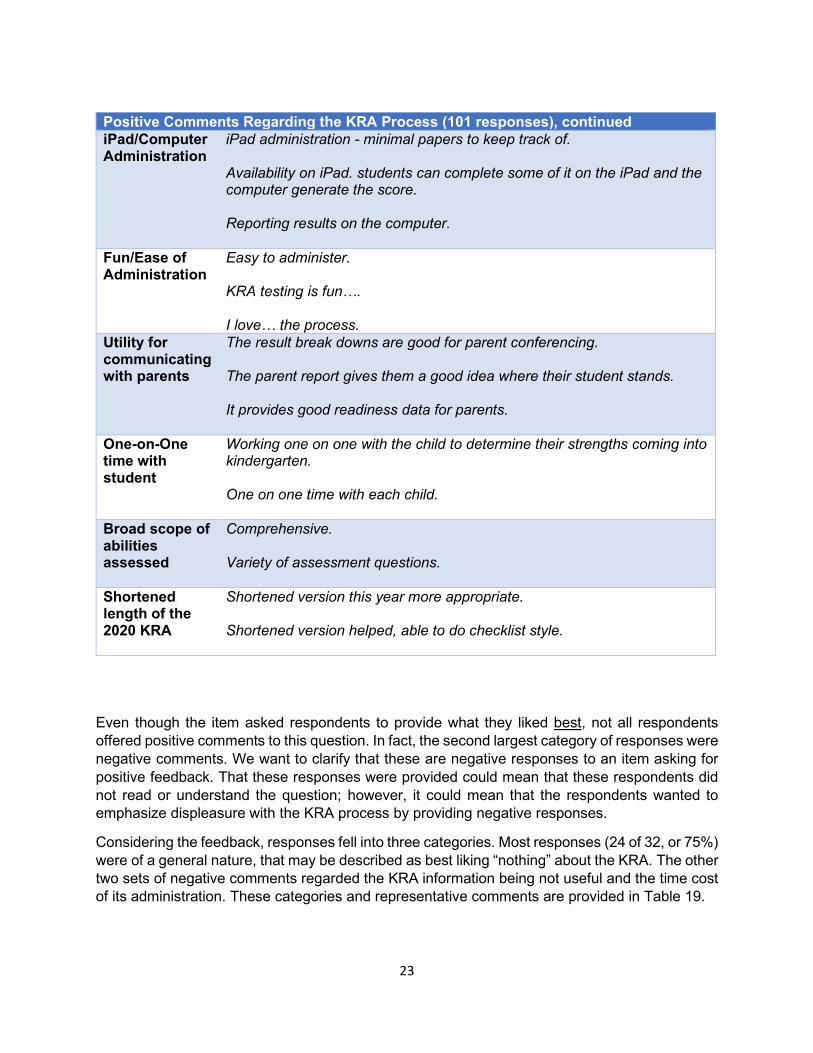
The categories of positive responses to the question of best-liked aspect of the KRA, along with representative responses, are provided in Table 18 below.
Table 18 Positive Comments Regarding the KRA Process
Positive Comments Regarding the KRA Process (101 responses) Learning Child Level of Readiness
The performance levels are helpful in knowing about the child's learning readiness. That I can see what my students know when they begin kindergarten. Good baseline data.
KRA Reports The printed reports from SCDE are easily read and understood. Reports provide clear data of where a student is academically when coming into kindergarten. Reports are easy to understand.
Table continues
23
Positive Comments Regarding the KRA Process (101 responses), continued iPad/Computer Administration
iPad administration - minimal papers to keep track of. Availability on iPad. students can complete some of it on the iPad and the computer generate the score. Reporting results on the computer.
Fun/Ease of Administration
Easy to administer. KRA testing is fun…. I love… the process.
Utility for communicating with parents
The result break downs are good for parent conferencing. The parent report gives them a good idea where their student stands. It provides good readiness data for parents.
One-on-One time with student
Working one on one with the child to determine their strengths coming into kindergarten. One on one time with each child.
Broad scope of abilities assessed
Comprehensive. Variety of assessment questions.
Shortened length of the 2020 KRA
Shortened version this year more appropriate. Shortened version helped, able to do checklist style.
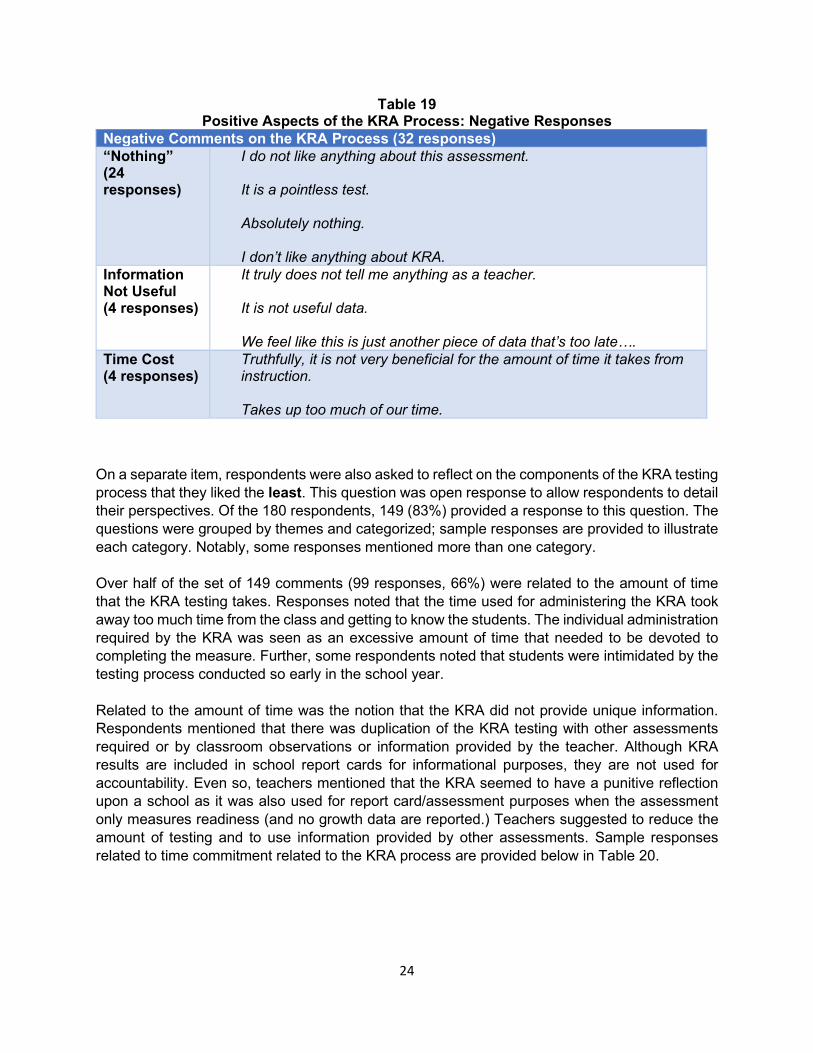
Even though the item asked respondents to provide what they liked best, not all respondents offered positive comments to this question. In fact, the second largest category of responses were negative comments. We want to clarify that these are negative responses to an item asking for positive feedback. That these responses were provided could mean that these respondents did not read or understand the question; however, it could mean that the respondents wanted to emphasize displeasure with the KRA process by providing negative responses.
Considering the feedback, responses fell into three categories. Most responses (24 of 32, or 75%) were of a general nature, that may be described as best liking “nothing” about the KRA. The other two sets of negative comments regarded the KRA information being not useful and the time cost of its administration. These categories and representative comments are provided in Table 19.
24
Table 19 Positive Aspects of the KRA Process: Negative Responses
Negative Comments on the KRA Process (32 responses) “Nothing” (24 responses)
I do not like anything about this assessment. It is a pointless test. Absolutely nothing. I don’t like anything about KRA.
Information Not Useful (4 responses)
It truly does not tell me anything as a teacher. It is not useful data. We feel like this is just another piece of data that’s too late….
Time Cost (4 responses)
Truthfully, it is not very beneficial for the amount of time it takes from instruction. Takes up too much of our time.
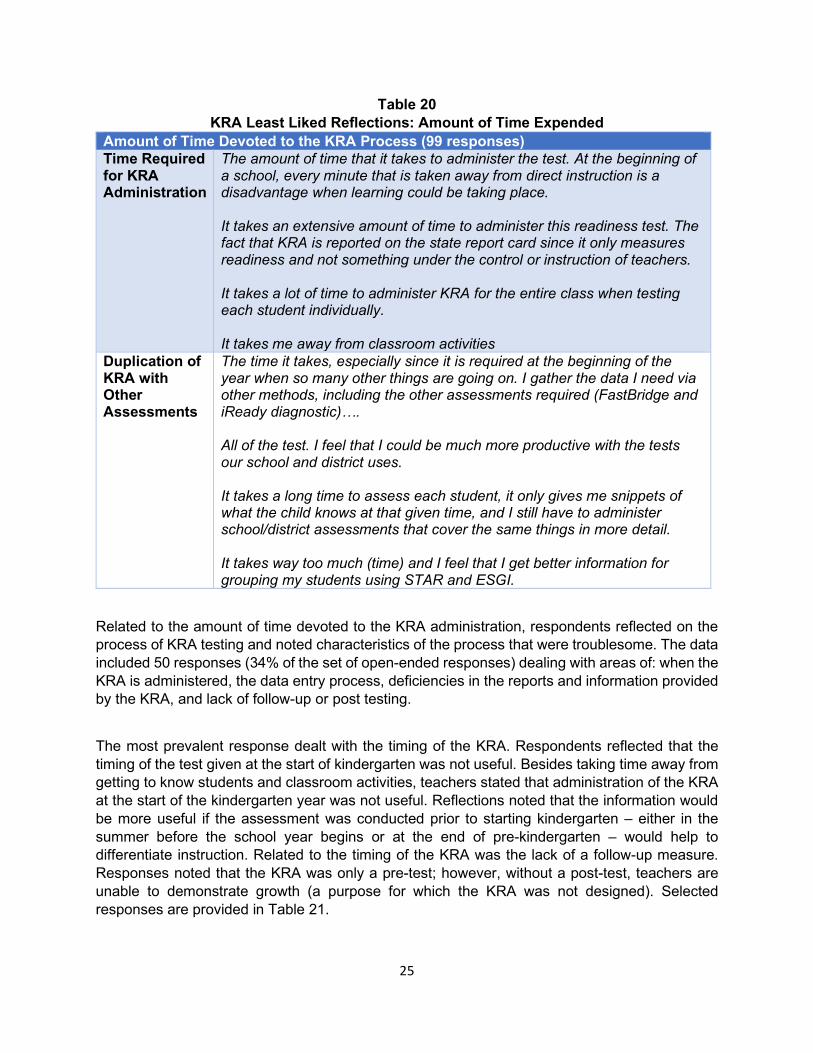
On a separate item, respondents were also asked to reflect on the components of the KRA testing process that they liked the least. This question was open response to allow respondents to detail their perspectives. Of the 180 respondents, 149 (83%) provided a response to this question. The questions were grouped by themes and categorized; sample responses are provided to illustrate each category. Notably, some responses mentioned more than one category. Over half of the set of 149 comments (99 responses, 66%) were related to the amount of time that the KRA testing takes. Responses noted that the time used for administering the KRA took away too much time from the class and getting to know the students. The individual administration required by the KRA was seen as an excessive amount of time that needed to be devoted to completing the measure. Further, some respondents noted that students were intimidated by the testing process conducted so early in the school year. Related to the amount of time was the notion that the KRA did not provide unique information. Respondents mentioned that there was duplication of the KRA testing with other assessments required or by classroom observations or information provided by the teacher. Although KRA results are included in school report cards for informational purposes, they are not used for accountability. Even so, teachers mentioned that the KRA seemed to have a punitive reflection upon a school as it was also used for report card/assessment purposes when the assessment only measures readiness (and no growth data are reported.) Teachers suggested to reduce the amount of testing and to use information provided by other assessments. Sample responses related to time commitment related to the KRA process are provided below in Table 20.
25
Table 20 KRA Least Liked Reflections: Amount of Time Expended
Amount of Time Devoted to the KRA Process (99 responses) Time Required for KRA Administration
The amount of time that it takes to administer the test. At the beginning of a school, every minute that is taken away from direct instruction is a disadvantage when learning could be taking place. It takes an extensive amount of time to administer this readiness test. The fact that KRA is reported on the state report card since it only measures readiness and not something under the control or instruction of teachers. It takes a lot of time to administer KRA for the entire class when testing each student individually. It takes me away from classroom activities
Duplication of KRA with Other Assessments
The time it takes, especially since it is required at the beginning of the year when so many other things are going on. I gather the data I need via other methods, including the other assessments required (FastBridge and iReady diagnostic)…. All of the test. I feel that I could be much more productive with the tests our school and district uses. It takes a long time to assess each student, it only gives me snippets of what the child knows at that given time, and I still have to administer school/district assessments that cover the same things in more detail. It takes way too much (time) and I feel that I get better information for grouping my students using STAR and ESGI.
Related to the amount of time devoted to the KRA administration, respondents reflected on the process of KRA testing and noted characteristics of the process that were troublesome. The data included 50 responses (34% of the set of open-ended responses) dealing with areas of: when the KRA is administered, the data entry process, deficiencies in the reports and information provided by the KRA, and lack of follow-up or post testing.
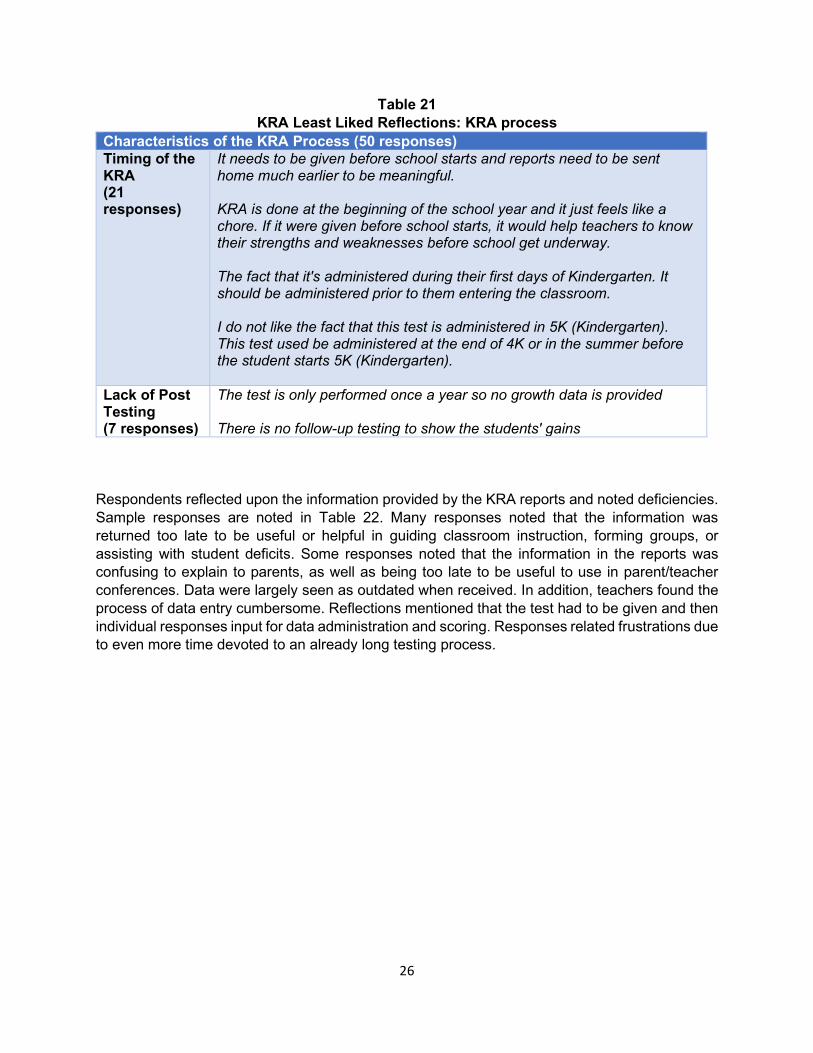
The most prevalent response dealt with the timing of the KRA. Respondents reflected that the timing of the test given at the start of kindergarten was not useful. Besides taking time away from getting to know students and classroom activities, teachers stated that administration of the KRA at the start of the kindergarten year was not useful. Reflections noted that the information would be more useful if the assessment was conducted prior to starting kindergarten – either in the summer before the school year begins or at the end of pre-kindergarten – would help to differentiate instruction. Related to the timing of the KRA was the lack of a follow-up measure. Responses noted that the KRA was only a pre-test; however, without a post-test, teachers are unable to demonstrate growth (a purpose for which the KRA was not designed). Selected responses are provided in Table 21.
26
Table 21 KRA Least Liked Reflections: KRA process
Characteristics of the KRA Process (50 responses) Timing of the KRA (21 responses)
It needs to be given before school starts and reports need to be sent home much earlier to be meaningful.
KRA is done at the beginning of the school year and it just feels like a
chore. If it were given before school starts, it would help teachers to know their strengths and weaknesses before school get underway.
The fact that it's administered during their first days of Kindergarten. It
should be administered prior to them entering the classroom. I do not like the fact that this test is administered in 5K (Kindergarten).
This test used be administered at the end of 4K or in the summer before the student starts 5K (Kindergarten).
Lack of Post Testing (7 responses)
The test is only performed once a year so no growth data is provided
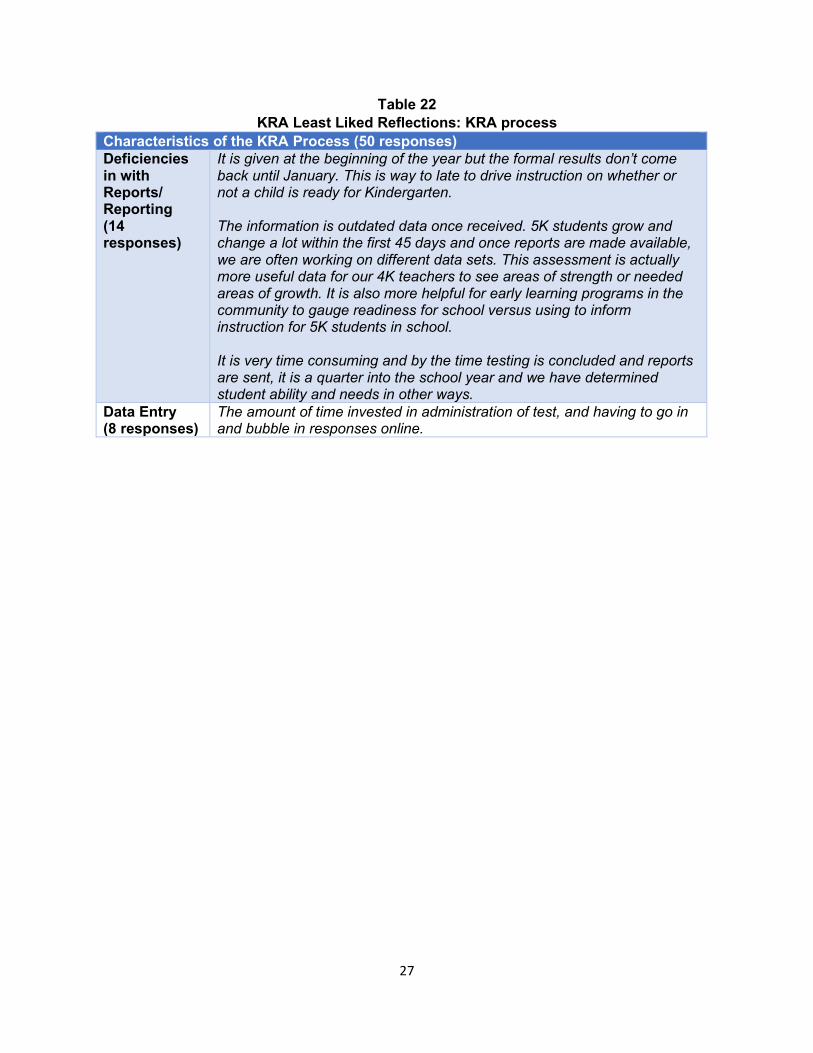
There is no follow-up testing to show the students' gains Respondents reflected upon the information provided by the KRA reports and noted deficiencies. Sample responses are noted in Table 22. Many responses noted that the information was returned too late to be useful or helpful in guiding classroom instruction, forming groups, or assisting with student deficits. Some responses noted that the information in the reports was confusing to explain to parents, as well as being too late to be useful to use in parent/teacher conferences. Data were largely seen as outdated when received. In addition, teachers found the process of data entry cumbersome. Reflections mentioned that the test had to be given and then individual responses input for data administration and scoring. Responses related frustrations due to even more time devoted to an already long testing process.
27
Table 22 KRA Least Liked Reflections: KRA process
Characteristics of the KRA Process (50 responses) Deficiencies in with Reports/ Reporting (14 responses)
It is given at the beginning of the year but the formal results don’t come back until January. This is way to late to drive instruction on whether or not a child is ready for Kindergarten. The information is outdated data once received. 5K students grow and change a lot within the first 45 days and once reports are made available, we are often working on different data sets. This assessment is actually more useful data for our 4K teachers to see areas of strength or needed areas of growth. It is also more helpful for early learning programs in the community to gauge readiness for school versus using to inform instruction for 5K students in school.
It is very time consuming and by the time testing is concluded and reports are sent, it is a quarter into the school year and we have determined student ability and needs in other ways.
Data Entry (8 responses)
The amount of time invested in administration of test, and having to go in and bubble in responses online.

28
29
DEPARTMENT OF EDUCATION MOLLY M. SPEARMAN
STATE SUPERINTENDENT OF EDUCATION
TO: District Superintendents District Test Coordinators
District Instructional Leaders
FROM: Molly M. Spearman
State Superintendent of Education
DATE:
July 14, 2020
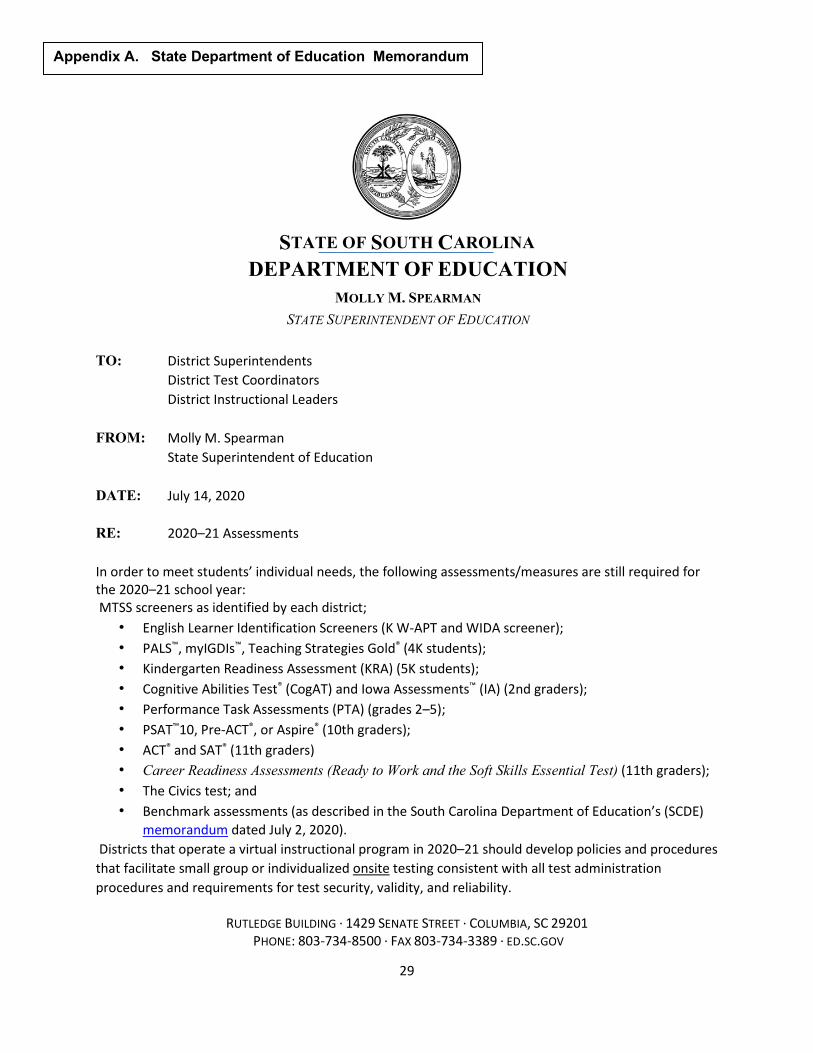
RE: 2020–21 Assessments In order to meet students’ individual needs, the following assessments/measures are still required for the 2020–21 school year: MTSS screeners as identified by each district;
• English Learner Identification Screeners (K W-APT and WIDA screener); • PALS™, myIGDIs™, Teaching Strategies Gold® (4K students); • Kindergarten Readiness Assessment (KRA) (5K students); • Cognitive Abilities Test® (CogAT) and Iowa Assessments™ (IA) (2nd graders); • Performance Task Assessments (PTA) (grades 2–5); • PSAT™10, Pre-ACT®, or Aspire® (10th graders); • ACT® and SAT® (11th graders) • Career Readiness Assessments (Ready to Work and the Soft Skills Essential Test) (11th graders); • The Civics test; and • Benchmark assessments (as described in the South Carolina Department of Education’s (SCDE)
memorandum dated July 2, 2020). Districts that operate a virtual instructional program in 2020–21 should develop policies and procedures that facilitate small group or individualized onsite testing consistent with all test administration procedures and requirements for test security, validity, and reliability.
RUTLEDGE BUILDING · 1429 SENATE STREET · COLUMBIA, SC 29201
PHONE: 803-734-8500 · FAX 803-734-3389 · ED.SC.GOV
S TATE OF S OUTH C AROLINA
Appendix A. State Department of Education Memorandum
30
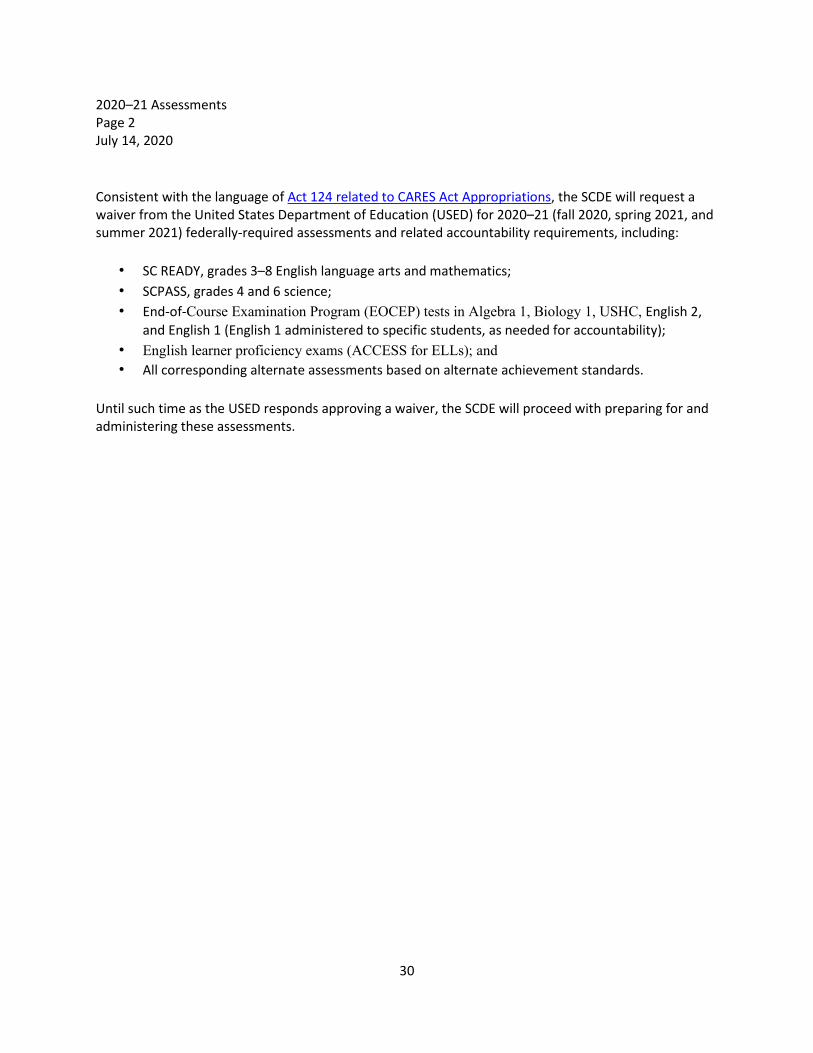
2020–21 Assessments Page 2 July 14, 2020 Consistent with the language of Act 124 related to CARES Act Appropriations, the SCDE will request a waiver from the United States Department of Education (USED) for 2020–21 (fall 2020, spring 2021, and summer 2021) federally-required assessments and related accountability requirements, including:
• SC READY, grades 3–8 English language arts and mathematics; • SCPASS, grades 4 and 6 science; • End-of-Course Examination Program (EOCEP) tests in Algebra 1, Biology 1, USHC, English 2,
and English 1 (English 1 administered to specific students, as needed for accountability); • English learner proficiency exams (ACCESS for ELLs); and • All corresponding alternate assessments based on alternate achievement standards.
Until such time as the USED responds approving a waiver, the SCDE will proceed with preparing for and administering these assessments.
31
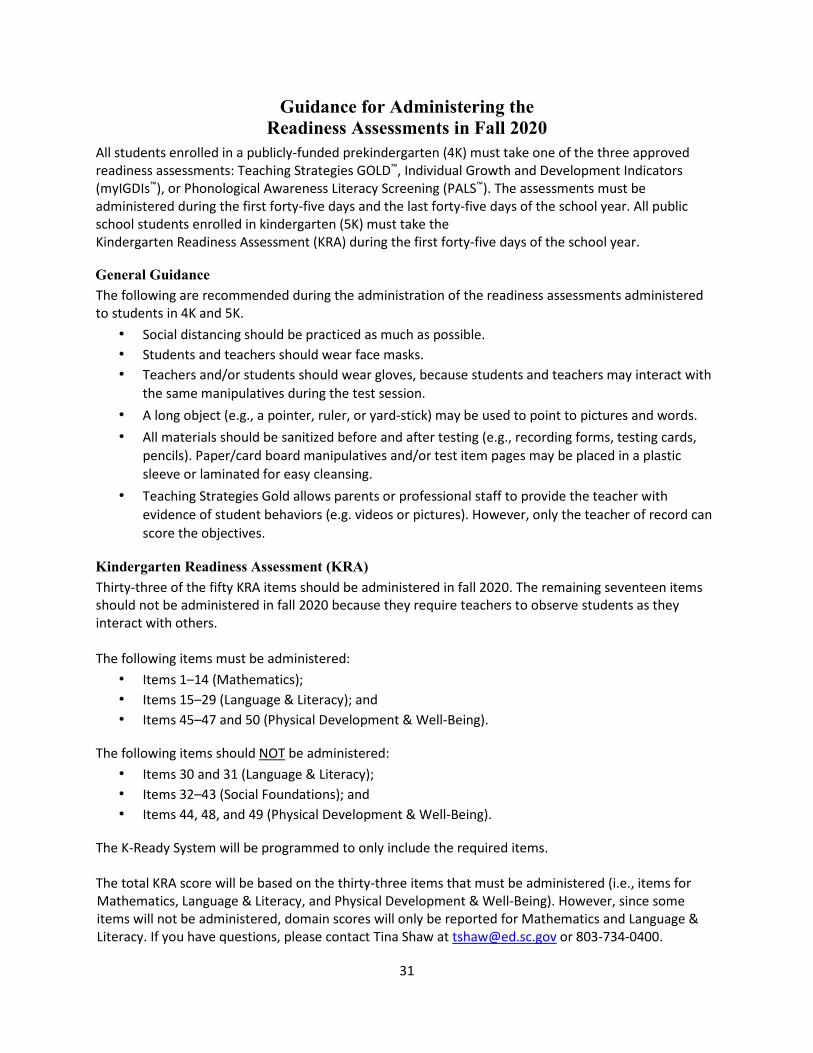
Guidance for Administering the Readiness Assessments in Fall 2020
All students enrolled in a publicly-funded prekindergarten (4K) must take one of the three approved readiness assessments: Teaching Strategies GOLD™, Individual Growth and Development Indicators (myIGDIs™), or Phonological Awareness Literacy Screening (PALS™). The assessments must be administered during the first forty-five days and the last forty-five days of the school year. All public school students enrolled in kindergarten (5K) must take the Kindergarten Readiness Assessment (KRA) during the first forty-five days of the school year.
General Guidance The following are recommended during the administration of the readiness assessments administered to students in 4K and 5K.
• Social distancing should be practiced as much as possible. • Students and teachers should wear face masks. • Teachers and/or students should wear gloves, because students and teachers may interact with
the same manipulatives during the test session. • A long object (e.g., a pointer, ruler, or yard-stick) may be used to point to pictures and words. • All materials should be sanitized before and after testing (e.g., recording forms, testing cards,
pencils). Paper/card board manipulatives and/or test item pages may be placed in a plastic sleeve or laminated for easy cleansing.
• Teaching Strategies Gold allows parents or professional staff to provide the teacher with evidence of student behaviors (e.g. videos or pictures). However, only the teacher of record can score the objectives.
Kindergarten Readiness Assessment (KRA) Thirty-three of the fifty KRA items should be administered in fall 2020. The remaining seventeen items should not be administered in fall 2020 because they require teachers to observe students as they interact with others.
The following items must be administered: • Items 1–14 (Mathematics); • Items 15–29 (Language & Literacy); and • Items 45–47 and 50 (Physical Development & Well-Being).
The following items should NOT be administered: • Items 30 and 31 (Language & Literacy); • Items 32–43 (Social Foundations); and • Items 44, 48, and 49 (Physical Development & Well-Being).
The K-Ready System will be programmed to only include the required items.
The total KRA score will be based on the thirty-three items that must be administered (i.e., items for Mathematics, Language & Literacy, and Physical Development & Well-Being). However, since some items will not be administered, domain scores will only be reported for Mathematics and Language & Literacy. If you have questions, please contact Tina Shaw at [email protected] or 803-734-0400.
32
Per SCDE’s request, this memo describes WestEd’s recommendations for analyzing KRA results based on the modified version of the KRA that was administered throughout South Carolina in fall 2020. The modified version of the KRA differed from the full version in two significant ways:
• The modified version included fewer items. • The modified version strayed substantially from the KRA blueprint.
When reducing the number of items on assessments, the trade-off is reliability. Fewer items generally result in less reliable scores and a corresponding increase in random measurement error. The increase in measurement error can subsequently compromise comparisons to cohorts of students who were assessed with the full version of the KRA, as small changes in scores might be the result of the decreased reliability (and increased measurement error) rather than differences in student performance. While the modified version is statistically equated to the full version and the KRA scale remains the same, the modified version eliminated all 12 items (24 raw points) from the Social Foundations domain and reduced the Language and Literacy domain by 2 items (4 raw points) and the Physical Well-Being and Motor Development domain by 3 items (6 raw points). It is possible that these changes portray an incongruent description of school readiness between the modified version and the full version. Given the circumstances of COVID-19 and the potential impact of the two points described above, WestEd endorses the use of the modified KRA for reporting overall scores and performance levels but recommends that results be interpreted with caution, especially comparisons to previous cohorts who were assessed with the full version. Specifically, any differences in results between the 2020 cohort and previous cohorts might not be due solely to the impact of the COVID-19 pandemic. Lastly, we believe that the choice to report (or not report) domain scores for the modified version should be driven by the purpose of the KRA. If it is important to provide stakeholders with more detailed information about students’s preparedness across the domains, then domain scores could be reported. But again, we recommend caution when interpreting domain-level results and comparing to previous cohorts. Please feel free to contact me with any questions or concerns.
cc: Tina Shaw, Brandon Loudermilk, Kristen Thompson, Matt Gaertner
To: Elizabeth Jones, Assessment Director, South Carolina Department of Education (SCDE) From: Matt Brunetti, Senior Program Associate, WestEd – Assessment Research & Innovation Date: February 22, 2021 Re: KRA 2020 Score Analysis
33
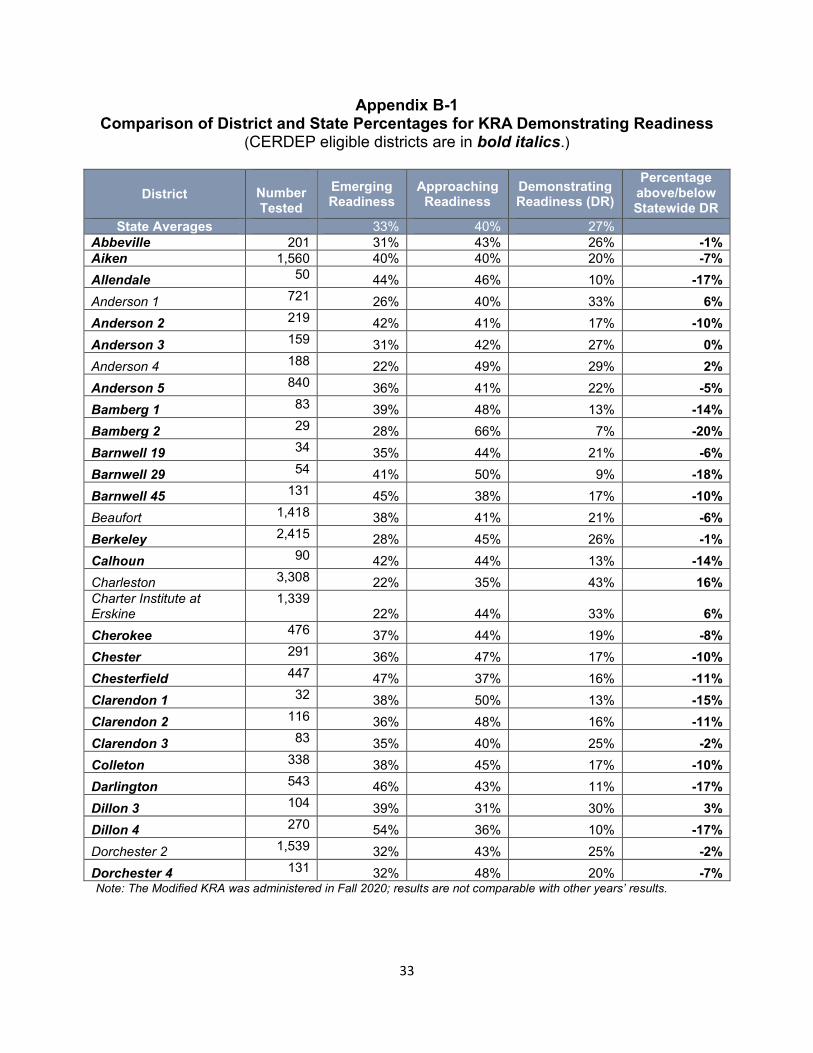
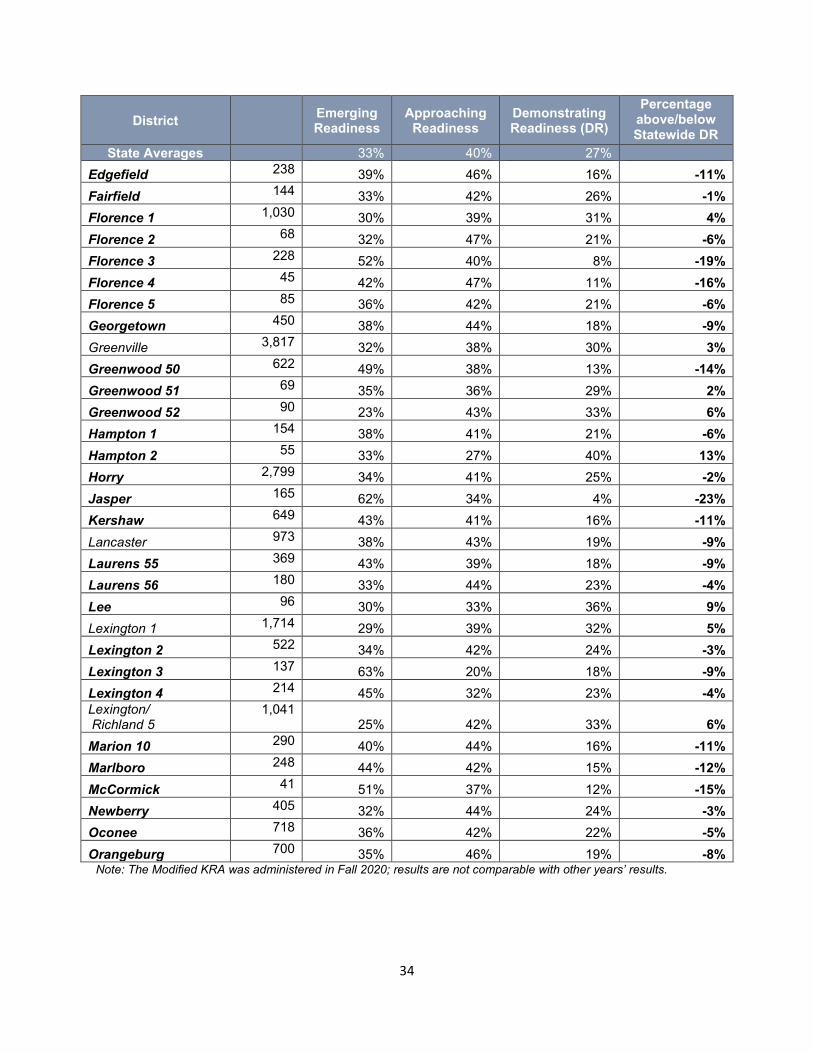
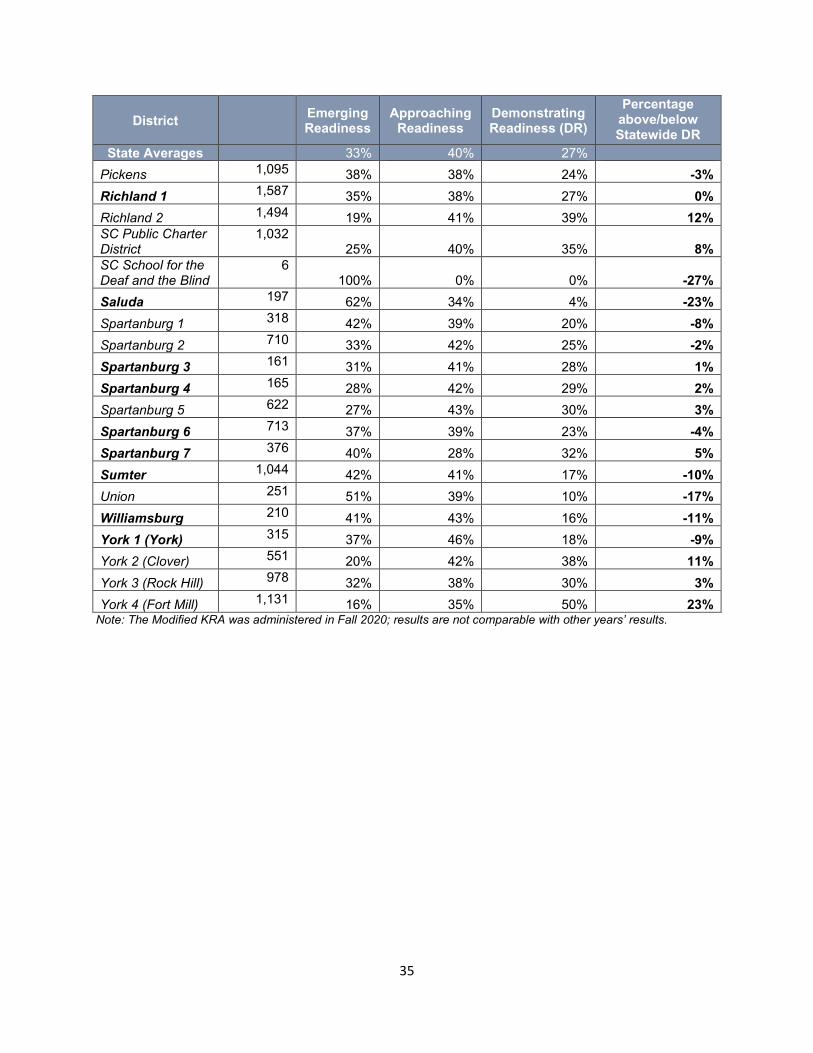
Appendix B-1 Comparison of District and State Percentages for KRA Demonstrating Readiness
(CERDEP eligible districts are in bold italics.)
District
Number Tested
Emerging Readiness
Approaching Readiness
Demonstrating Readiness (DR)
Percentage above/below Statewide DR
State Averages 33% 40% 27% Abbeville 201 31% 43% 26% -1% Aiken 1,560 40% 40% 20% -7% Allendale 50 44% 46% 10% -17% Anderson 1 721 26% 40% 33% 6% Anderson 2 219 42% 41% 17% -10% Anderson 3 159 31% 42% 27% 0% Anderson 4 188 22% 49% 29% 2% Anderson 5 840 36% 41% 22% -5% Bamberg 1 83 39% 48% 13% -14% Bamberg 2 29 28% 66% 7% -20% Barnwell 19 34 35% 44% 21% -6% Barnwell 29 54 41% 50% 9% -18% Barnwell 45 131 45% 38% 17% -10% Beaufort 1,418 38% 41% 21% -6% Berkeley 2,415 28% 45% 26% -1% Calhoun 90 42% 44% 13% -14% Charleston 3,308 22% 35% 43% 16% Charter Institute at Erskine
1,339 22% 44% 33% 6%
Cherokee 476 37% 44% 19% -8% Chester 291 36% 47% 17% -10% Chesterfield 447 47% 37% 16% -11% Clarendon 1 32 38% 50% 13% -15% Clarendon 2 116 36% 48% 16% -11% Clarendon 3 83 35% 40% 25% -2% Colleton 338 38% 45% 17% -10% Darlington 543 46% 43% 11% -17% Dillon 3 104 39% 31% 30% 3% Dillon 4 270 54% 36% 10% -17% Dorchester 2 1,539 32% 43% 25% -2% Dorchester 4 131 32% 48% 20% -7% Note: The Modified KRA was administered in Fall 2020; results are not comparable with other years’ results.
34
District Emerging
Readiness Approaching
Readiness Demonstrating Readiness (DR)
Percentage above/below Statewide DR
State Averages 33% 40% 27% Edgefield 238 39% 46% 16% -11% Fairfield 144 33% 42% 26% -1% Florence 1 1,030 30% 39% 31% 4% Florence 2 68 32% 47% 21% -6% Florence 3 228 52% 40% 8% -19% Florence 4 45 42% 47% 11% -16% Florence 5 85 36% 42% 21% -6% Georgetown 450 38% 44% 18% -9% Greenville 3,817 32% 38% 30% 3% Greenwood 50 622 49% 38% 13% -14% Greenwood 51 69 35% 36% 29% 2% Greenwood 52 90 23% 43% 33% 6% Hampton 1 154 38% 41% 21% -6% Hampton 2 55 33% 27% 40% 13% Horry 2,799 34% 41% 25% -2% Jasper 165 62% 34% 4% -23% Kershaw 649 43% 41% 16% -11% Lancaster 973 38% 43% 19% -9% Laurens 55 369 43% 39% 18% -9% Laurens 56 180 33% 44% 23% -4% Lee 96 30% 33% 36% 9% Lexington 1 1,714 29% 39% 32% 5% Lexington 2 522 34% 42% 24% -3% Lexington 3 137 63% 20% 18% -9% Lexington 4 214 45% 32% 23% -4% Lexington/ Richland 5
1,041 25% 42% 33% 6%
Marion 10 290 40% 44% 16% -11% Marlboro 248 44% 42% 15% -12% McCormick 41 51% 37% 12% -15% Newberry 405 32% 44% 24% -3% Oconee 718 36% 42% 22% -5% Orangeburg 700 35% 46% 19% -8%
Note: The Modified KRA was administered in Fall 2020; results are not comparable with other years’ results.
35
District Emerging
Readiness Approaching
Readiness Demonstrating Readiness (DR)
Percentage above/below Statewide DR
State Averages 33% 40% 27% Pickens 1,095 38% 38% 24% -3% Richland 1 1,587 35% 38% 27% 0% Richland 2 1,494 19% 41% 39% 12% SC Public Charter District
1,032 25% 40% 35% 8%
SC School for the Deaf and the Blind
6 100% 0% 0% -27%
Saluda 197 62% 34% 4% -23% Spartanburg 1 318 42% 39% 20% -8% Spartanburg 2 710 33% 42% 25% -2% Spartanburg 3 161 31% 41% 28% 1% Spartanburg 4 165 28% 42% 29% 2% Spartanburg 5 622 27% 43% 30% 3% Spartanburg 6 713 37% 39% 23% -4% Spartanburg 7 376 40% 28% 32% 5% Sumter 1,044 42% 41% 17% -10% Union 251 51% 39% 10% -17% Williamsburg 210 41% 43% 16% -11% York 1 (York) 315 37% 46% 18% -9% York 2 (Clover) 551 20% 42% 38% 11% York 3 (Rock Hill) 978 32% 38% 30% 3% York 4 (Fort Mill) 1,131 16% 35% 50% 23%
Note: The Modified KRA was administered in Fall 2020; results are not comparable with other years’ results.
36
Appendix B-2 Interpreting KRA Scale Scores
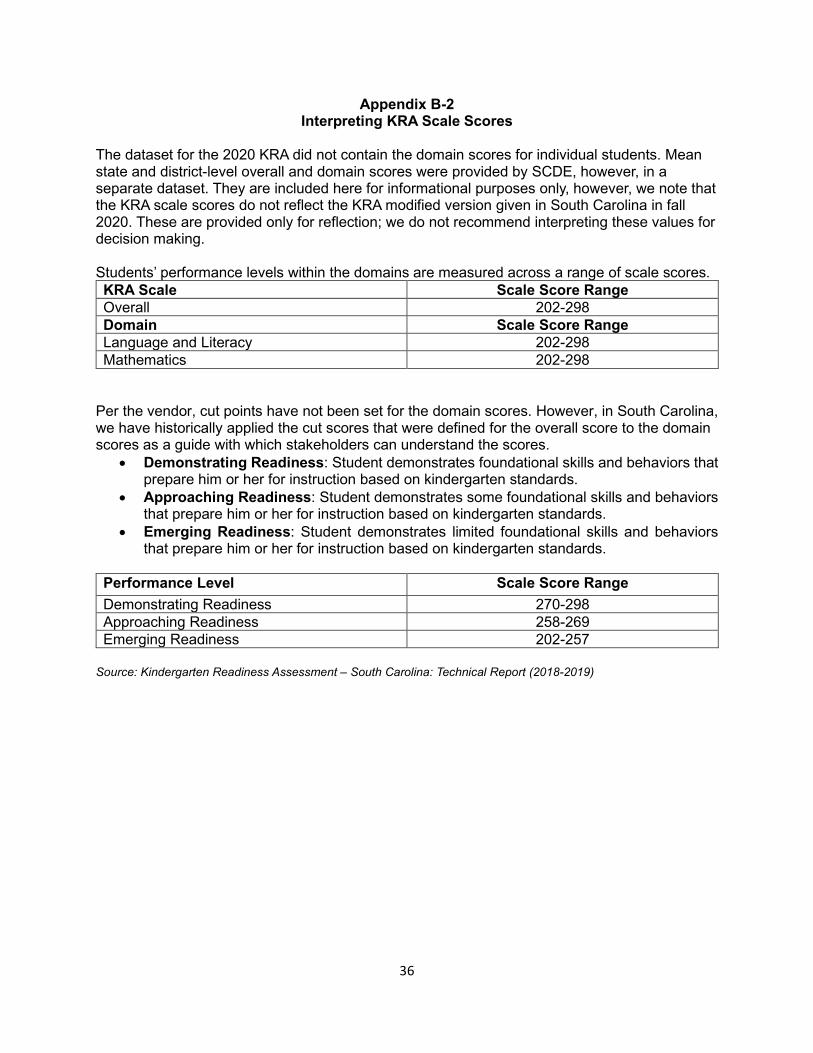
The dataset for the 2020 KRA did not contain the domain scores for individual students. Mean state and district-level overall and domain scores were provided by SCDE, however, in a separate dataset. They are included here for informational purposes only, however, we note that the KRA scale scores do not reflect the KRA modified version given in South Carolina in fall 2020. These are provided only for reflection; we do not recommend interpreting these values for decision making. Students’ performance levels within the domains are measured across a range of scale scores. KRA Scale Scale Score Range Overall 202-298 Domain Scale Score Range Language and Literacy 202-298 Mathematics 202-298
Per the vendor, cut points have not been set for the domain scores. However, in South Carolina, we have historically applied the cut scores that were defined for the overall score to the domain scores as a guide with which stakeholders can understand the scores.
• Demonstrating Readiness: Student demonstrates foundational skills and behaviors that prepare him or her for instruction based on kindergarten standards.
• Approaching Readiness: Student demonstrates some foundational skills and behaviors that prepare him or her for instruction based on kindergarten standards.
• Emerging Readiness: Student demonstrates limited foundational skills and behaviors that prepare him or her for instruction based on kindergarten standards.
Performance Level Scale Score Range Demonstrating Readiness 270-298 Approaching Readiness 258-269 Emerging Readiness 202-257
Source: Kindergarten Readiness Assessment – South Carolina: Technical Report (2018-2019)
37
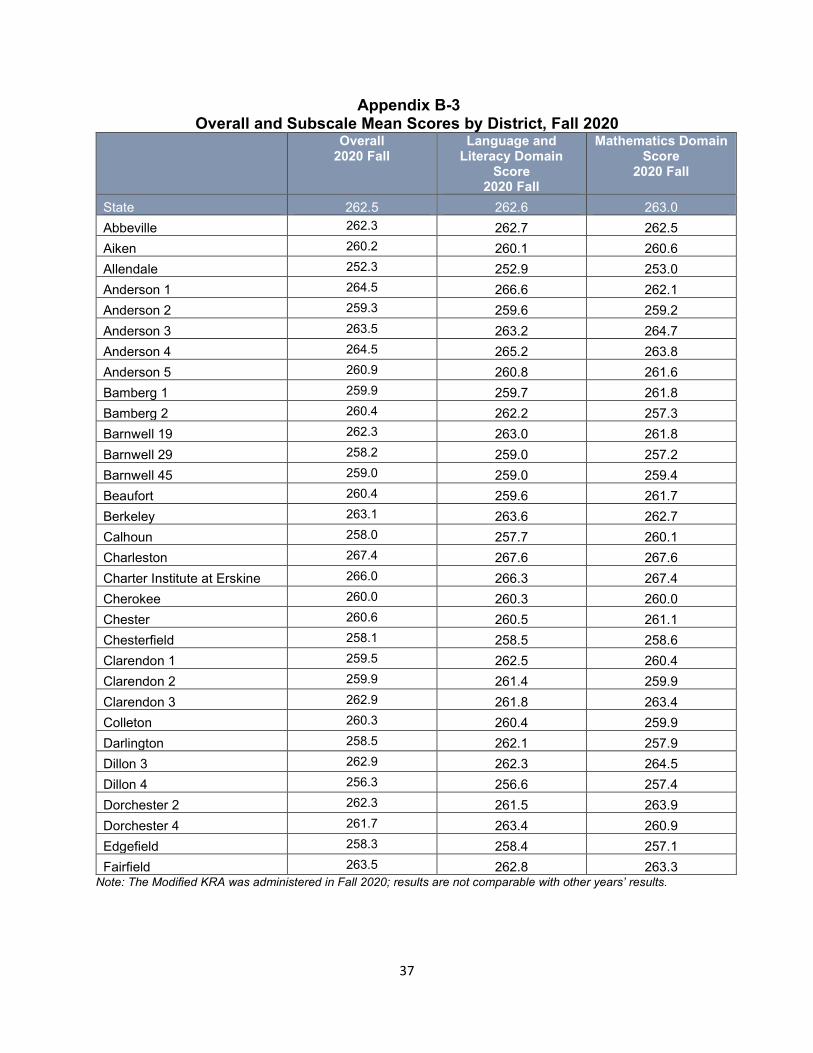
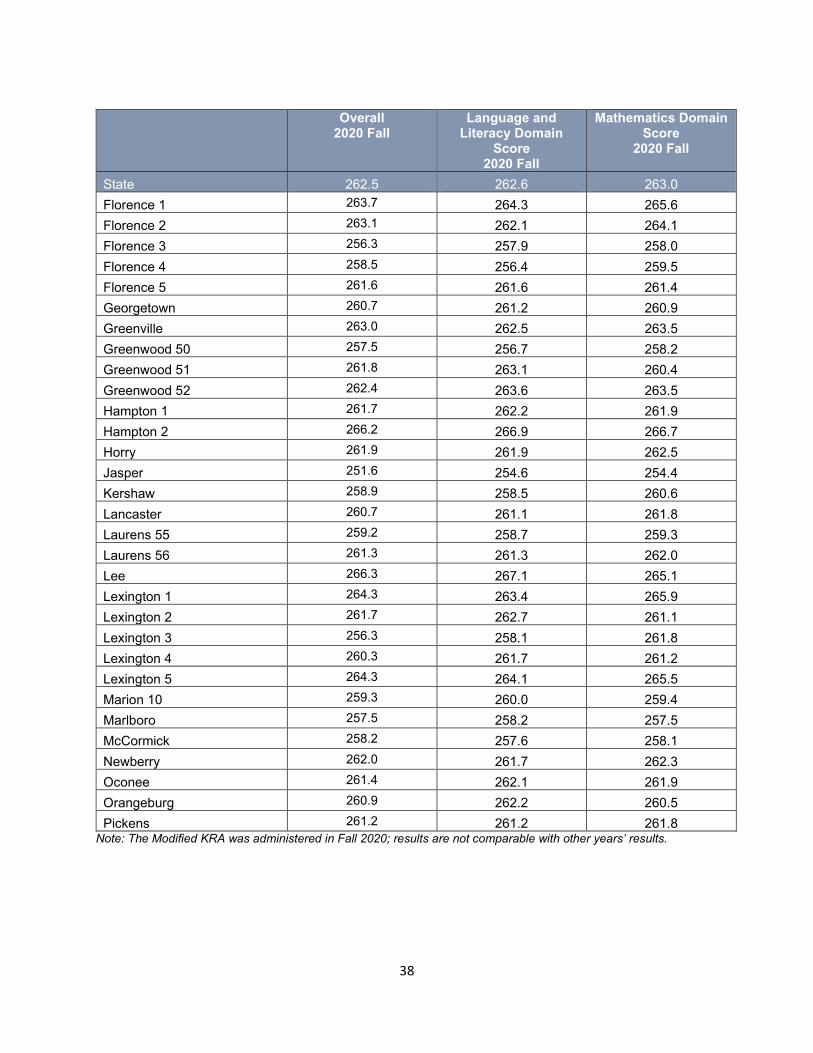
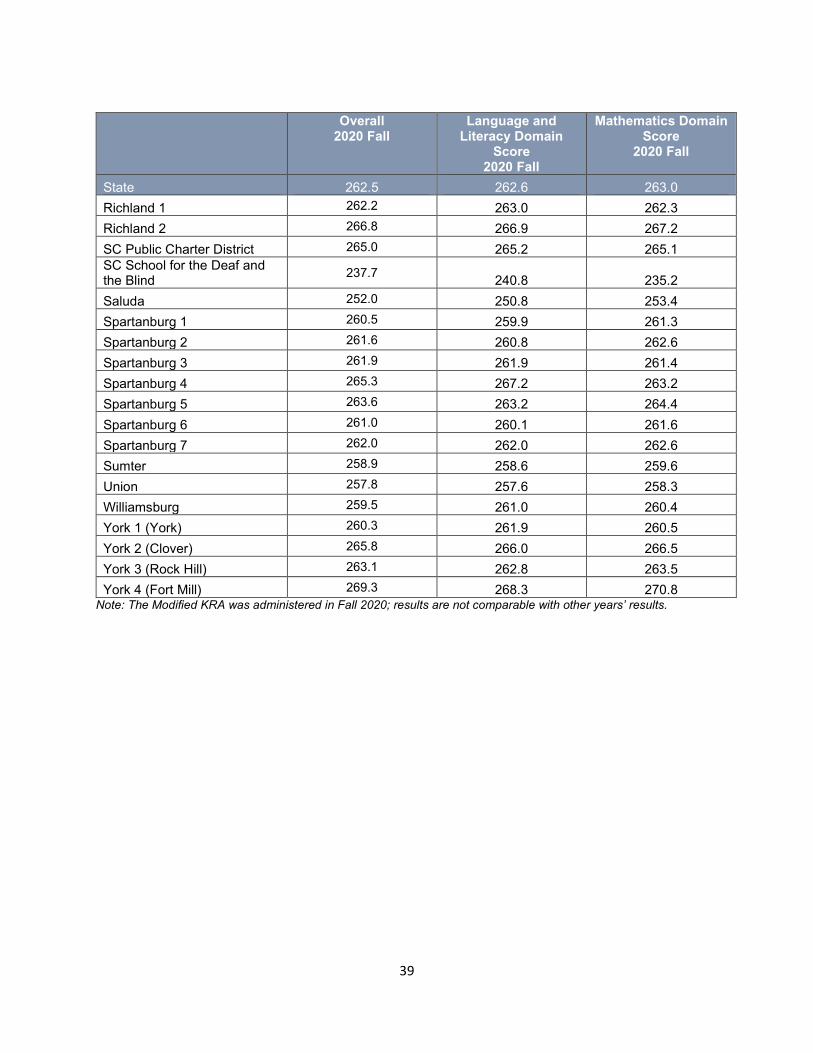
Appendix B-3 Overall and Subscale Mean Scores by District, Fall 2020
Overall 2020 Fall
Language and Literacy Domain
Score 2020 Fall
Mathematics Domain Score
2020 Fall
State 262.5 262.6 263.0 Abbeville 262.3 262.7 262.5 Aiken 260.2 260.1 260.6 Allendale 252.3 252.9 253.0 Anderson 1 264.5 266.6 262.1 Anderson 2 259.3 259.6 259.2 Anderson 3 263.5 263.2 264.7 Anderson 4 264.5 265.2 263.8 Anderson 5 260.9 260.8 261.6 Bamberg 1 259.9 259.7 261.8 Bamberg 2 260.4 262.2 257.3 Barnwell 19 262.3 263.0 261.8 Barnwell 29 258.2 259.0 257.2 Barnwell 45 259.0 259.0 259.4 Beaufort 260.4 259.6 261.7 Berkeley 263.1 263.6 262.7 Calhoun 258.0 257.7 260.1 Charleston 267.4 267.6 267.6 Charter Institute at Erskine 266.0 266.3 267.4 Cherokee 260.0 260.3 260.0 Chester 260.6 260.5 261.1 Chesterfield 258.1 258.5 258.6 Clarendon 1 259.5 262.5 260.4 Clarendon 2 259.9 261.4 259.9 Clarendon 3 262.9 261.8 263.4 Colleton 260.3 260.4 259.9 Darlington 258.5 262.1 257.9 Dillon 3 262.9 262.3 264.5 Dillon 4 256.3 256.6 257.4 Dorchester 2 262.3 261.5 263.9 Dorchester 4 261.7 263.4 260.9 Edgefield 258.3 258.4 257.1 Fairfield 263.5 262.8 263.3
Note: The Modified KRA was administered in Fall 2020; results are not comparable with other years’ results.
38
Overall
2020 Fall Language and
Literacy Domain Score
2020 Fall
Mathematics Domain Score
2020 Fall
State 262.5 262.6 263.0 Florence 1 263.7 264.3 265.6 Florence 2 263.1 262.1 264.1 Florence 3 256.3 257.9 258.0 Florence 4 258.5 256.4 259.5 Florence 5 261.6 261.6 261.4 Georgetown 260.7 261.2 260.9 Greenville 263.0 262.5 263.5 Greenwood 50 257.5 256.7 258.2 Greenwood 51 261.8 263.1 260.4 Greenwood 52 262.4 263.6 263.5 Hampton 1 261.7 262.2 261.9 Hampton 2 266.2 266.9 266.7 Horry 261.9 261.9 262.5 Jasper 251.6 254.6 254.4 Kershaw 258.9 258.5 260.6 Lancaster 260.7 261.1 261.8 Laurens 55 259.2 258.7 259.3 Laurens 56 261.3 261.3 262.0 Lee 266.3 267.1 265.1 Lexington 1 264.3 263.4 265.9 Lexington 2 261.7 262.7 261.1 Lexington 3 256.3 258.1 261.8 Lexington 4 260.3 261.7 261.2 Lexington 5 264.3 264.1 265.5 Marion 10 259.3 260.0 259.4 Marlboro 257.5 258.2 257.5 McCormick 258.2 257.6 258.1 Newberry 262.0 261.7 262.3 Oconee 261.4 262.1 261.9 Orangeburg 260.9 262.2 260.5 Pickens 261.2 261.2 261.8
Note: The Modified KRA was administered in Fall 2020; results are not comparable with other years’ results.
39
Overall
2020 Fall Language and
Literacy Domain Score
2020 Fall
Mathematics Domain Score
2020 Fall
State 262.5 262.6 263.0 Richland 1 262.2 263.0 262.3 Richland 2 266.8 266.9 267.2 SC Public Charter District 265.0 265.2 265.1 SC School for the Deaf and the Blind 237.7 240.8 235.2 Saluda 252.0 250.8 253.4 Spartanburg 1 260.5 259.9 261.3 Spartanburg 2 261.6 260.8 262.6 Spartanburg 3 261.9 261.9 261.4 Spartanburg 4 265.3 267.2 263.2 Spartanburg 5 263.6 263.2 264.4 Spartanburg 6 261.0 260.1 261.6 Spartanburg 7 262.0 262.0 262.6 Sumter 258.9 258.6 259.6 Union 257.8 257.6 258.3 Williamsburg 259.5 261.0 260.4 York 1 (York) 260.3 261.9 260.5 York 2 (Clover) 265.8 266.0 266.5 York 3 (Rock Hill) 263.1 262.8 263.5 York 4 (Fort Mill) 269.3 268.3 270.8
Note: The Modified KRA was administered in Fall 2020; results are not comparable with other years’ results.

40
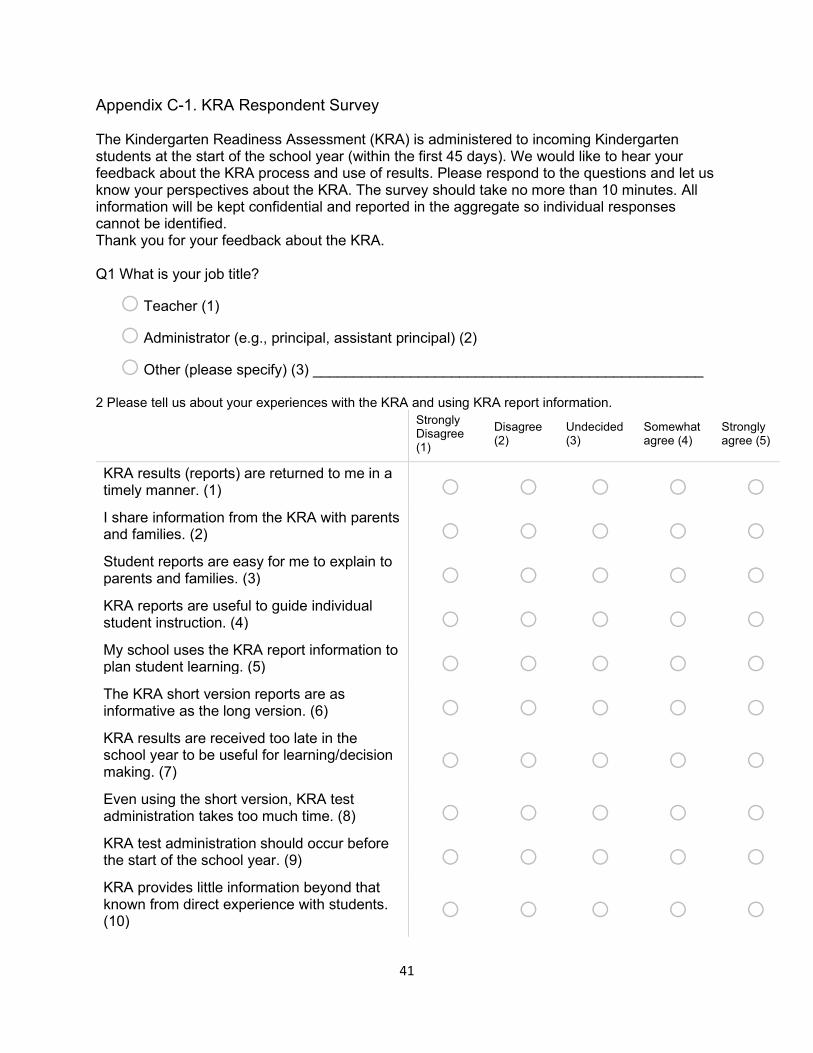
41
Appendix C-1. KRA Respondent Survey The Kindergarten Readiness Assessment (KRA) is administered to incoming Kindergarten students at the start of the school year (within the first 45 days). We would like to hear your feedback about the KRA process and use of results. Please respond to the questions and let us know your perspectives about the KRA. The survey should take no more than 10 minutes. All information will be kept confidential and reported in the aggregate so individual responses cannot be identified. Thank you for your feedback about the KRA. Q1 What is your job title?
o Teacher (1)
o Administrator (e.g., principal, assistant principal) (2)
o Other (please specify) (3) ________________________________________________ 2 Please tell us about your experiences with the KRA and using KRA report information.
Strongly Disagree (1)
Disagree (2)
Undecided (3)
Somewhat agree (4)
Strongly agree (5)
KRA results (reports) are returned to me in a timely manner. (1) o o o o o I share information from the KRA with parents and families. (2) o o o o o Student reports are easy for me to explain to parents and families. (3) o o o o o KRA reports are useful to guide individual student instruction. (4) o o o o o My school uses the KRA report information to plan student learning. (5) o o o o o The KRA short version reports are as informative as the long version. (6) o o o o o KRA results are received too late in the school year to be useful for learning/decision making. (7) o o o o o Even using the short version, KRA test administration takes too much time. (8) o o o o o KRA test administration should occur before the start of the school year. (9) o o o o o KRA provides little information beyond that known from direct experience with students. (10) o o o o o
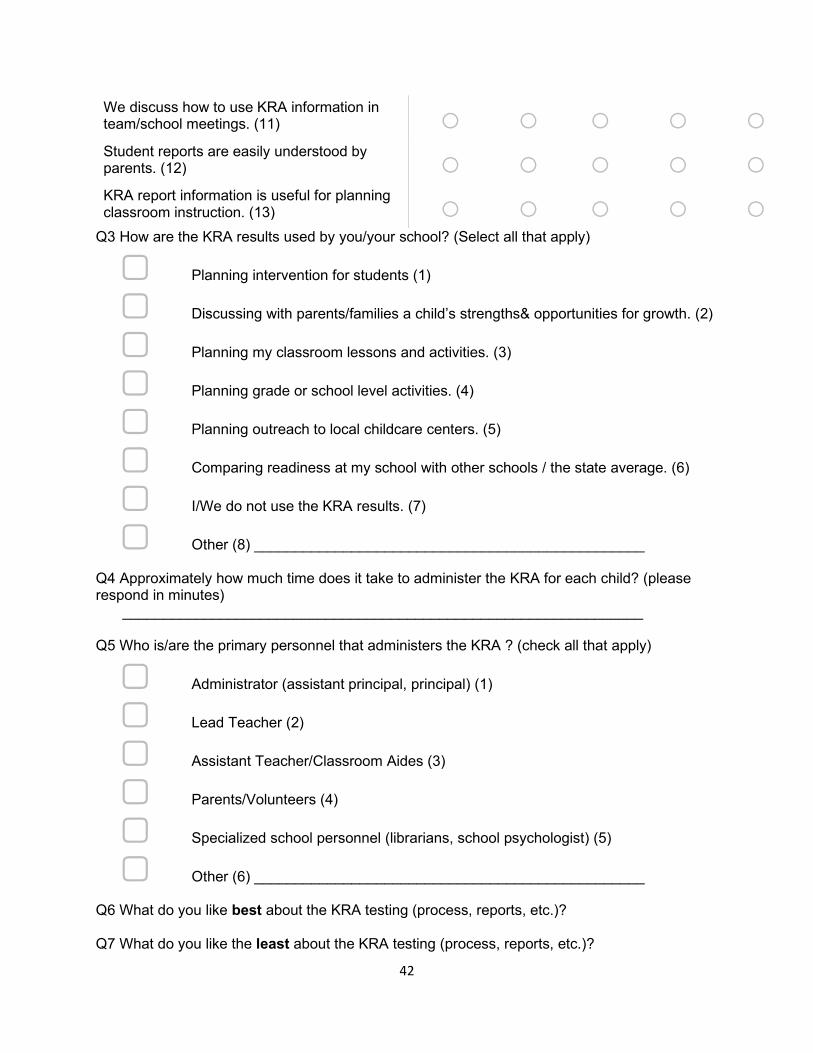
42
We discuss how to use KRA information in team/school meetings. (11) o o o o o Student reports are easily understood by parents. (12) o o o o o KRA report information is useful for planning classroom instruction. (13) o o o o o
Q3 How are the KRA results used by you/your school? (Select all that apply)
▢ Planning intervention for students (1)
▢ Discussing with parents/families a child’s strengths& opportunities for growth. (2)
▢ Planning my classroom lessons and activities. (3)
▢ Planning grade or school level activities. (4)
▢ Planning outreach to local childcare centers. (5)
▢ Comparing readiness at my school with other schools / the state average. (6)
▢ I/We do not use the KRA results. (7)
▢ Other (8) ________________________________________________ Q4 Approximately how much time does it take to administer the KRA for each child? (please respond in minutes)
________________________________________________________________ Q5 Who is/are the primary personnel that administers the KRA ? (check all that apply)
▢ Administrator (assistant principal, principal) (1)
▢ Lead Teacher (2)
▢ Assistant Teacher/Classroom Aides (3)
▢ Parents/Volunteers (4)
▢ Specialized school personnel (librarians, school psychologist) (5)
▢ Other (6) ________________________________________________ Q6 What do you like best about the KRA testing (process, reports, etc.)? Q7 What do you like the least about the KRA testing (process, reports, etc.)?
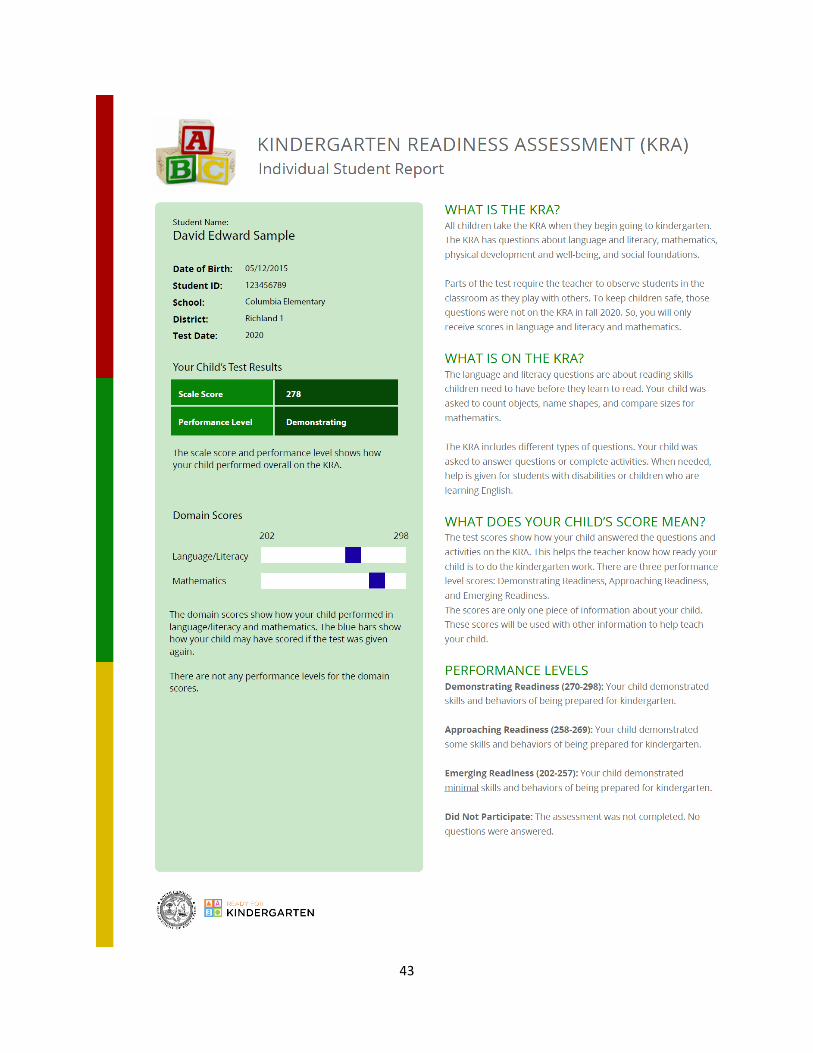
43
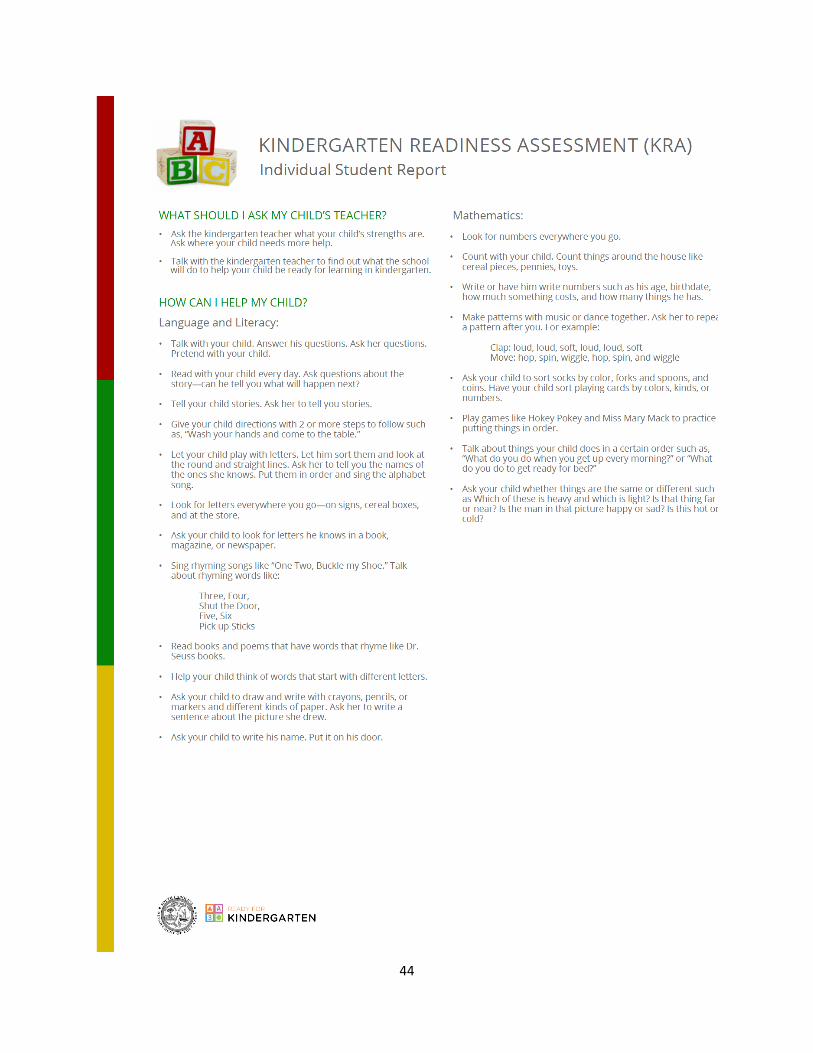
44
45
This report’s principal authors, from University of South Carolina – Department of Educational Studies, include:
Dr. Fred Greer, Research Associate Professor Dr. Christine DiStefano, Professor Dr. Jin Liu, Clinical Assistant Professor Mr. Jiandong Wang, Research Assistant
The following individuals (in alphabetical order) contributed to this report:
Sarah Crawford, South Carolina Revenue and Fiscal Affairs Office Andrew Epting, South Carolina Office of Administration Brandon Loudermilk, South Carolina Department of Education Chelsea Richardson, South Carolina Office of First Steps Tina Shaw, South Carolina Department of Education
46
The SC Education Oversight Committee is an independent, non-partisan group made up of 18 educators, business persons, and elected leaders. Created in 1998, the committee is dedicated to reporting facts, measuring change, and promoting progress within South Carolina’s education system.
ADDITIONAL INFORMATION If you have questions, please contact the Education Oversight Committee (EOC) staff for additional information. The phone number is 803.734.6148. Also, please visit the EOC website at www.eoc.sc.gov for additional resources.
The Education Oversight Committee does not discriminate on the basis of race, color, national origin, religion, sex, or handicap in its practices relating to employment or establishment and administration of its programs and initiatives. Inquiries regarding employment, programs and initiatives of the Committee should be directed to the Executive Director 803.734.6148.