Embed Size (px)
Citation preview
DATA SHEET
I N F O R M | E M P O W E R | A D VA N C E | w w w. p r b . o r g
POPULATION REFERENCE BUREAU
THE URBAN-RURAL DIVIDE IN HEALTH AND DEVELOPMENT
© 2015 Population Reference Bureau THE URBAN-RURAL DIVIDE IN HEALTH AND DEVELOPMENT 2
THE URBAN-RURAL DIVIDE IN HEALTH AND DEVELOPMENT
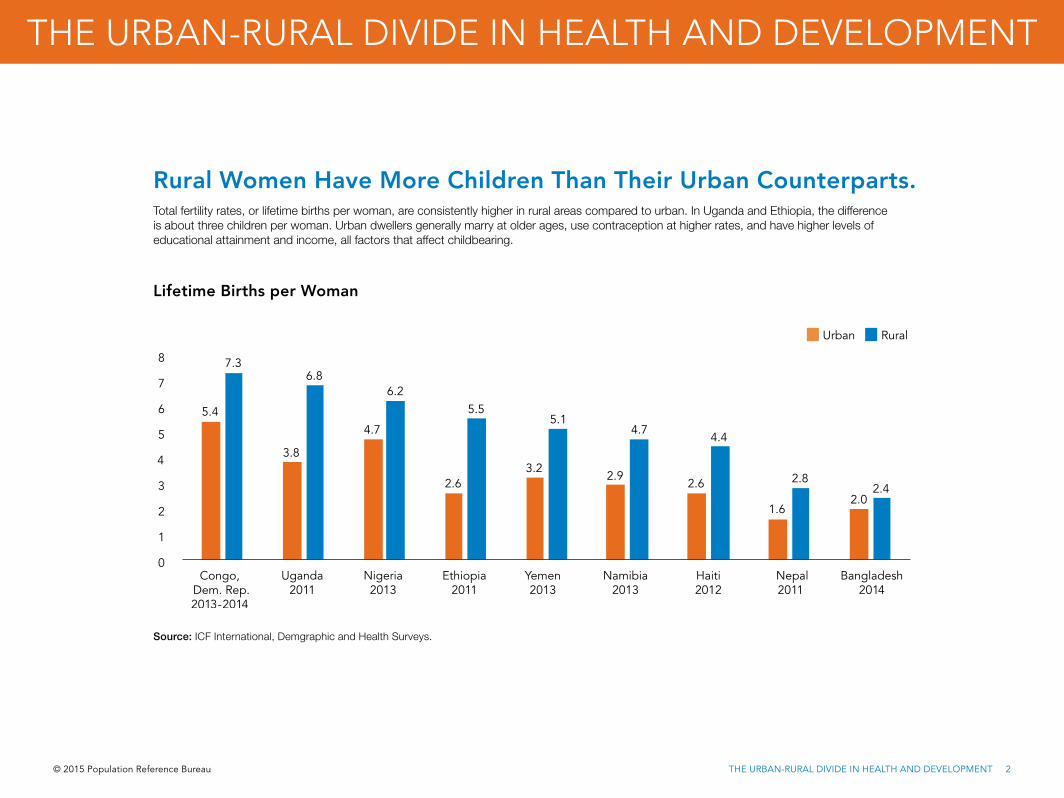
Rural Women Have More Children Than Their Urban Counterparts.Total fertility rates, or lifetime births per woman, are consistently higher in rural areas compared to urban. In Uganda and Ethiopia, the difference is about three children per woman. Urban dwellers generally marry at older ages, use contraception at higher rates, and have higher levels of educational attainment and income, all factors that affect childbearing.
Source: ICF International, Demgraphic and Health Surveys.
5.4
3.8
4.7
2.6 3.2
2.9 2.6
1.6 2.0
7.3 6.8
6.2 5.5
5.1 4.7
4.4
2.8 2.4
0
1
2
3
4
5
6
7
8
Congo, Dem. Rep.2013-2014
Uganda 2011
Nigeria 2013
Ethiopia 2011
Yemen 2013
Namibia 2013
Haiti2012
Nepal2011
Bangladesh 2014
Urban Rural
Lifetime Births per Woman
© 2015 Population Reference Bureau THE URBAN-RURAL DIVIDE IN HEALTH AND DEVELOPMENT 3
THE URBAN-RURAL DIVIDE IN HEALTH AND DEVELOPMENT
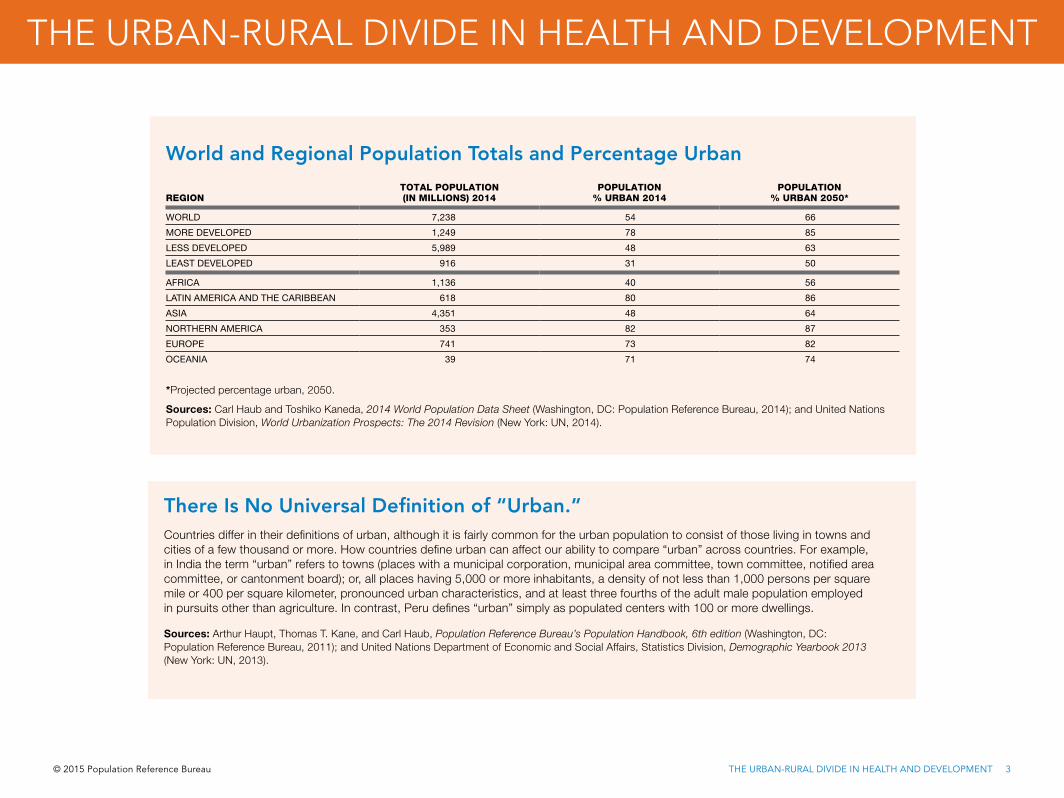
There Is No Universal Definition of “Urban.”Countries differ in their definitions of urban, although it is fairly common for the urban population to consist of those living in towns and cities of a few thousand or more. How countries define urban can affect our ability to compare “urban” across countries. For example, in India the term “urban” refers to towns (places with a municipal corporation, municipal area committee, town committee, notified area committee, or cantonment board); or, all places having 5,000 or more inhabitants, a density of not less than 1,000 persons per square mile or 400 per square kilometer, pronounced urban characteristics, and at least three fourths of the adult male population employed in pursuits other than agriculture. In contrast, Peru defines “urban” simply as populated centers with 100 or more dwellings.
Sources: Arthur Haupt, Thomas T. Kane, and Carl Haub, Population Reference Bureau’s Population Handbook, 6th edition (Washington, DC: Population Reference Bureau, 2011); and United Nations Department of Economic and Social Affairs, Statistics Division, Demographic Yearbook 2013 (New York: UN, 2013).
World and Regional Population Totals and Percentage Urban
REGIONTOTAL POPULATION (IN MILLIONS) 2014
POPULATION % URBAN 2014
POPULATION % URBAN 2050*
WORLD 7,238 54 66
MORE DEVELOPED 1,249 78 85
LESS DEVELOPED 5,989 48 63
LEAST DEVELOPED 916 31 50
AFRICA 1,136 40 56
LATIN AMERICA AND THE CARIBBEAN 618 80 86
ASIA 4,351 48 64
NORTHERN AMERICA 353 82 87
EUROPE 741 73 82
OCEANIA 39 71 74
*Projected percentage urban, 2050.
Sources: Carl Haub and Toshiko Kaneda, 2014 World Population Data Sheet (Washington, DC: Population Reference Bureau, 2014); and United Nations Population Division, World Urbanization Prospects: The 2014 Revision (New York: UN, 2014).
© 2015 Population Reference Bureau THE URBAN-RURAL DIVIDE IN HEALTH AND DEVELOPMENT 4
THE URBAN-RURAL DIVIDE IN HEALTH AND DEVELOPMENT
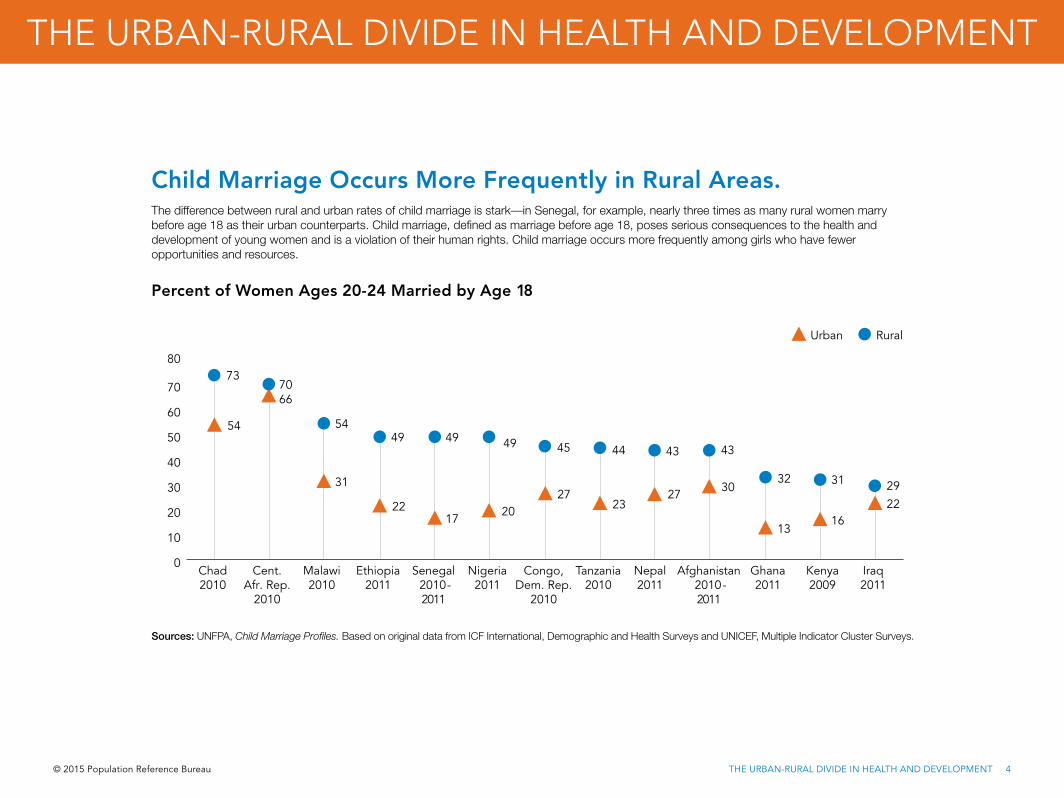
Child Marriage Occurs More Frequently in Rural Areas.The difference between rural and urban rates of child marriage is stark—in Senegal, for example, nearly three times as many rural women marry before age 18 as their urban counterparts. Child marriage, defined as marriage before age 18, poses serious consequences to the health and development of young women and is a violation of their human rights. Child marriage occurs more frequently among girls who have fewer opportunities and resources.
Sources: UNFPA, Child Marriage Profiles. Based on original data from ICF International, Demographic and Health Surveys and UNICEF, Multiple Indicator Cluster Surveys.
54
66
31
22 17
20 27
23 27
30
13 16
22
73 70
54 49 49 49 45 44 43 43
32 31 29
0
10
20
30
40
50
60
70
80
Chad 2010
Cent. Afr. Rep.
2010
Malawi 2010
Ethiopia 2011
Senegal 2010-2011
Nigeria 2011
Congo, Dem. Rep.
2010
Tanzania 2010
Nepal 2011
Afghanistan 2010-2011
Ghana 2011
Kenya 2009
Iraq 2011
Urban Rural
Percent of Women Ages 20-24 Married by Age 18
© 2015 Population Reference Bureau THE URBAN-RURAL DIVIDE IN HEALTH AND DEVELOPMENT 5
THE URBAN-RURAL DIVIDE IN HEALTH AND DEVELOPMENT
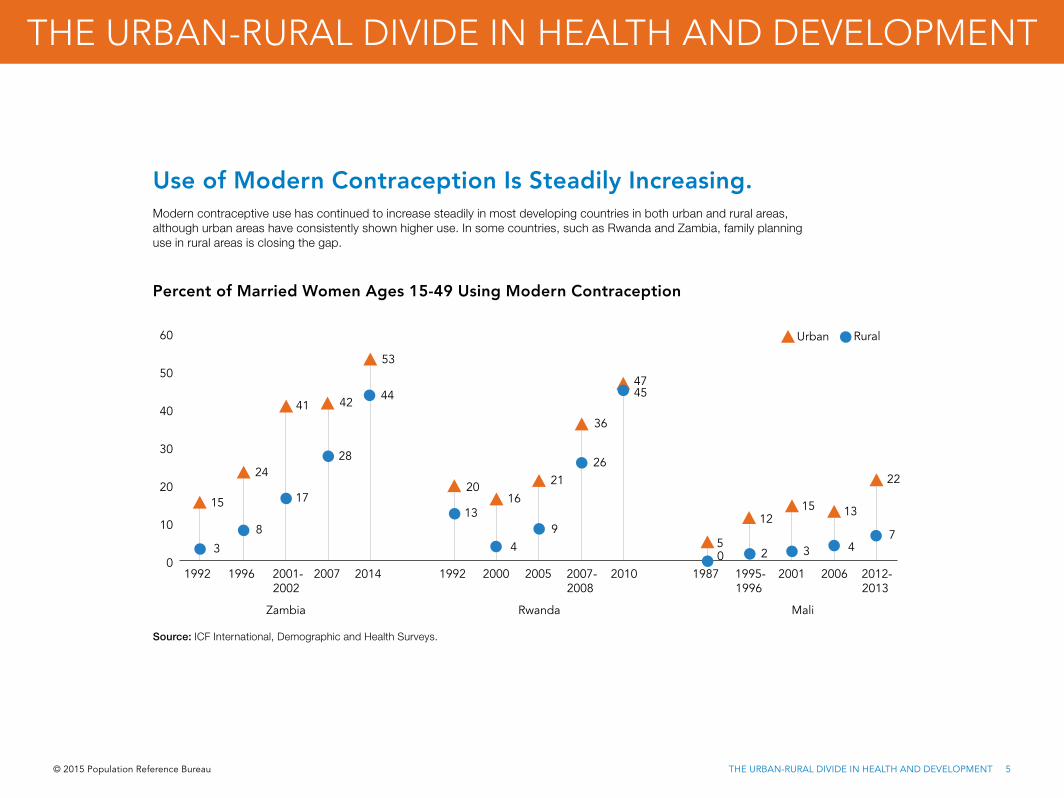
Modern contraceptive use has continued to increase steadily in most developing countries in both urban and rural areas, although urban areas have consistently shown higher use. In some countries, such as Rwanda and Zambia, family planning use in rural areas is closing the gap.
Use of Modern Contraception Is Steadily Increasing.
Source: ICF International, Demographic and Health Surveys.
15
24
41 42
53
3
8
17
28
44
20 16
21
36
47
13
4 9
26
45
5 0
12 15 13
22
2 3 4 7
0
10
20
30
40
50
60
1992 1996 2001-2002
2007 2014 1992 2000 2005 2007-2008
2010 1987 1995-1996
2001 2006 2012-2013
Urban
Zambia Rwanda Mali
Rural
Percent of Married Women Ages 15-49 Using Modern Contraception
THE URBAN-RURAL DIVIDE IN HEALTH AND DEVELOPMENT
© 2015 Population Reference Bureau THE URBAN-RURAL DIVIDE IN HEALTH AND DEVELOPMENT 6
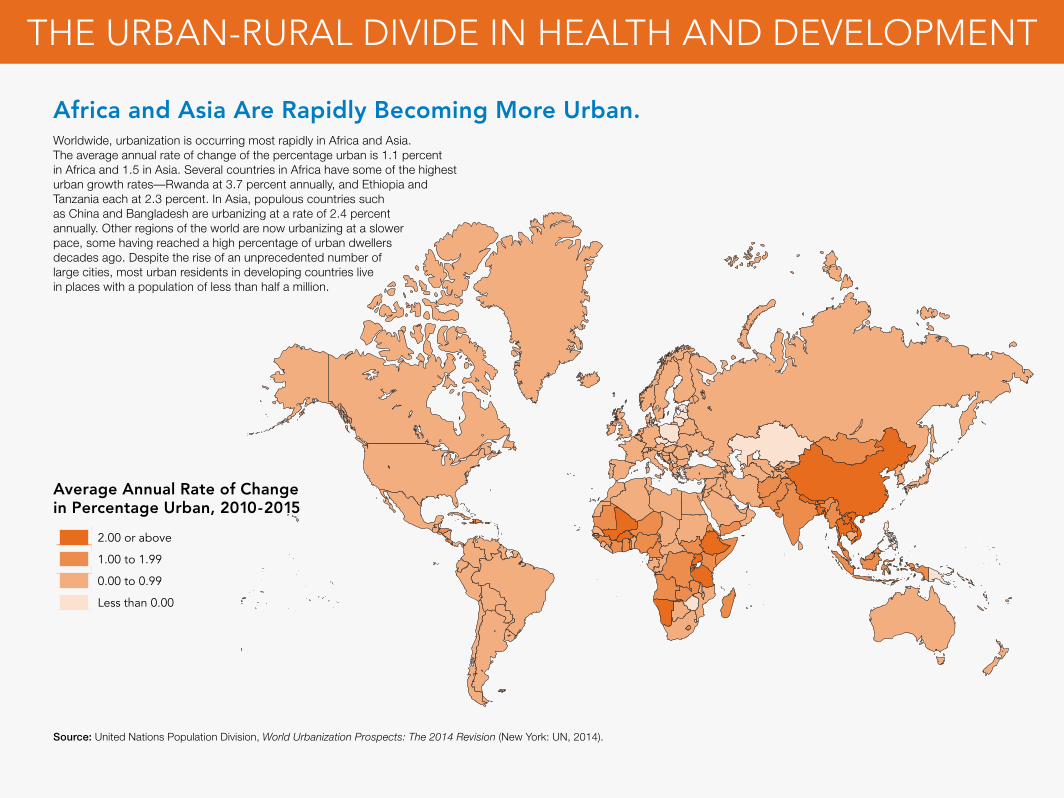
Source: United Nations Population Division, World Urbanization Prospects: The 2014 Revision (New York: UN, 2014).
Average Annual Rate of Change in Percentage Urban, 2010-2015
2.00 or above
1.00 to 1.99
0.00 to 0.99
Less than 0.00
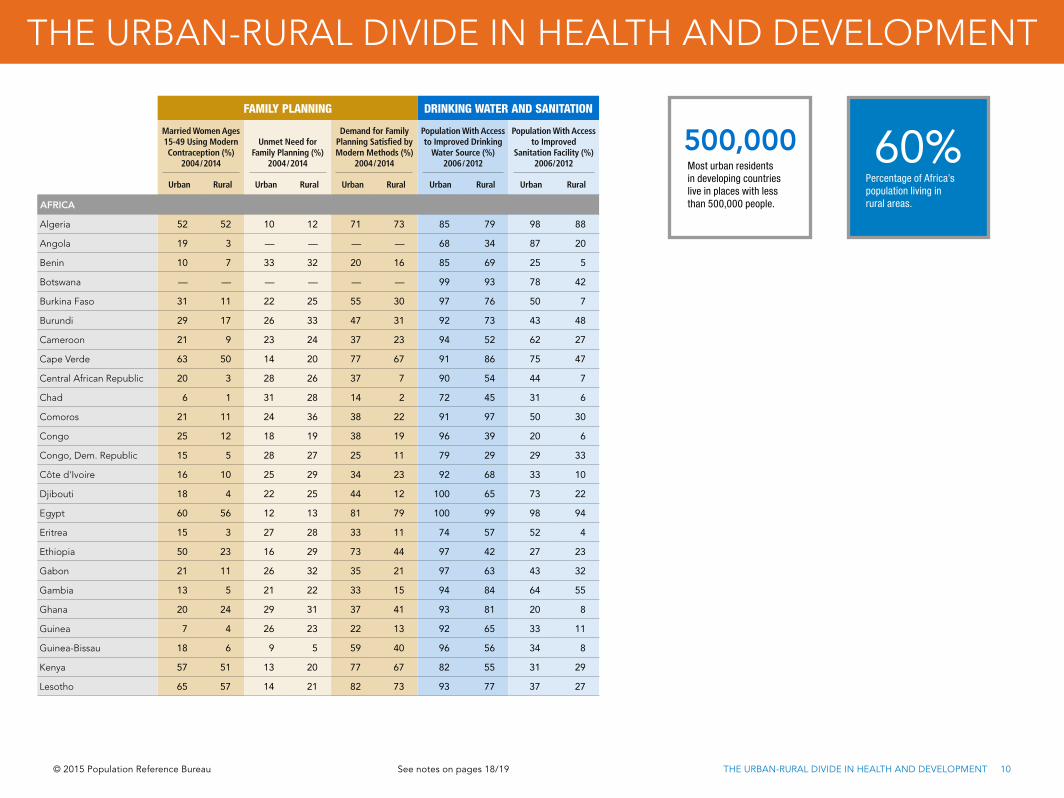
Africa and Asia Are Rapidly Becoming More Urban. Worldwide, urbanization is occurring most rapidly in Africa and Asia. The average annual rate of change of the percentage urban is 1.1 percent in Africa and 1.5 in Asia. Several countries in Africa have some of the highest urban growth rates—Rwanda at 3.7 percent annually, and Ethiopia and Tanzania each at 2.3 percent. In Asia, populous countries such as China and Bangladesh are urbanizing at a rate of 2.4 percent annually. Other regions of the world are now urbanizing at a slower pace, some having reached a high percentage of urban dwellers decades ago. Despite the rise of an unprecedented number of large cities, most urban residents in developing countries live in places with a population of less than half a million.
THE URBAN-RURAL DIVIDE IN HEALTH AND DEVELOPMENT
© 2015 Population Reference Bureau THE URBAN-RURAL DIVIDE IN HEALTH AND DEVELOPMENT 7
THE URBAN-RURAL DIVIDE IN HEALTH AND DEVELOPMENT
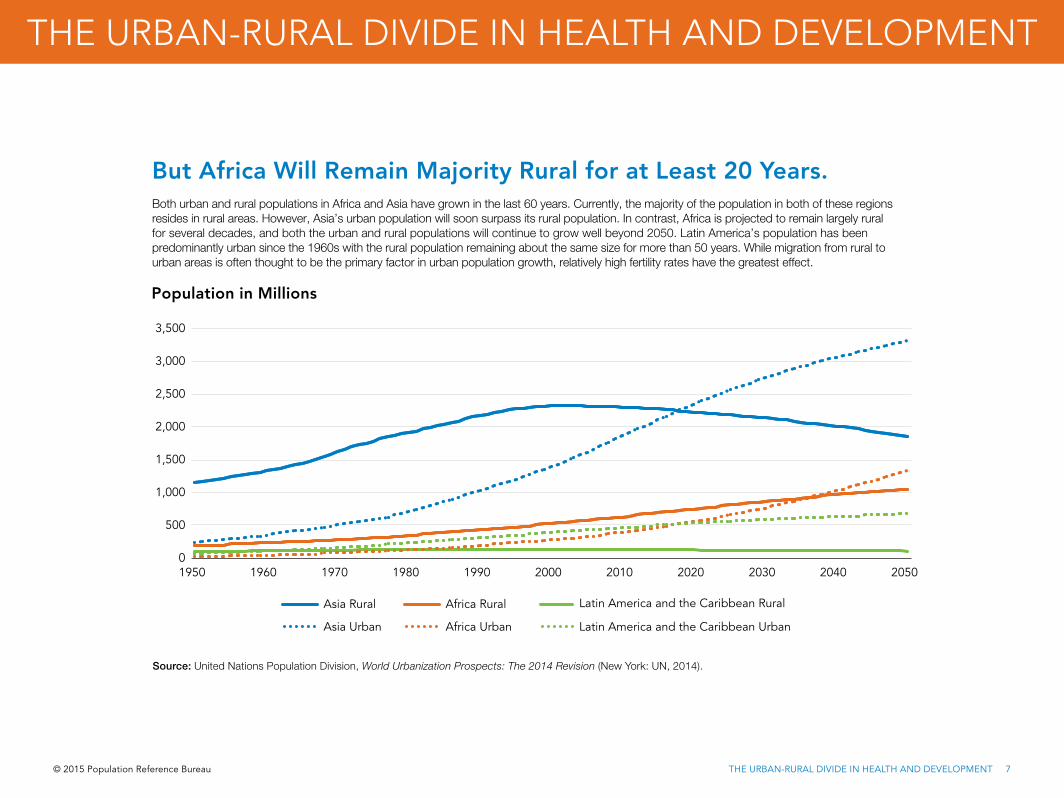
Both urban and rural populations in Africa and Asia have grown in the last 60 years. Currently, the majority of the population in both of these regions resides in rural areas. However, Asia’s urban population will soon surpass its rural population. In contrast, Africa is projected to remain largely rural for several decades, and both the urban and rural populations will continue to grow well beyond 2050. Latin America’s population has been predominantly urban since the 1960s with the rural population remaining about the same size for more than 50 years. While migration from rural to urban areas is often thought to be the primary factor in urban population growth, relatively high fertility rates have the greatest effect.
0
500
1,000
1,500
2,000
2,500
3,000
3,500
1950 1960 1970 1980 1990 2000 2010 2020 2030 2040 2050
Asia Urban Africa Urban
Asia Rural Africa Rural
Latin America and the Caribbean Urban
Latin America and the Caribbean Rural
But Africa Will Remain Majority Rural for at Least 20 Years.
Source: United Nations Population Division, World Urbanization Prospects: The 2014 Revision (New York: UN, 2014).
Population in Millions
© 2015 Population Reference Bureau THE URBAN-RURAL DIVIDE IN HEALTH AND DEVELOPMENT 8
THE URBAN-RURAL DIVIDE IN HEALTH AND DEVELOPMENT
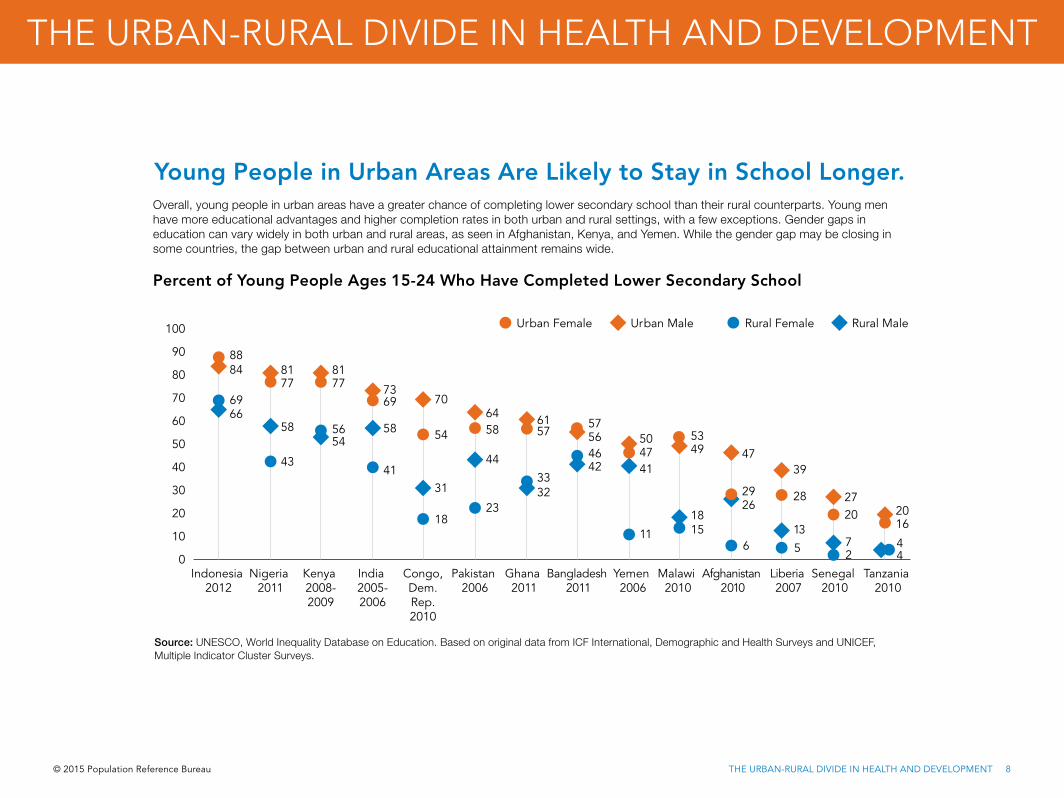
Overall, young people in urban areas have a greater chance of completing lower secondary school than their rural counterparts. Young men have more educational advantages and higher completion rates in both urban and rural settings, with a few exceptions. Gender gaps in education can vary widely in both urban and rural areas, as seen in Afghanistan, Kenya, and Yemen. While the gender gap may be closing in some countries, the gap between urban and rural educational attainment remains wide.
Young People in Urban Areas Are Likely to Stay in School Longer.
Source: UNESCO, World Inequality Database on Education. Based on original data from ICF International, Demographic and Health Surveys and UNICEF, Multiple Indicator Cluster Surveys.
69
43
56
41
18 23
33
46
11 15 6 5 2
4
66 58
54 58
31
44
32
42 41
18 26
13 7
4
88
77 77
69
54 58 57 57
47 53
29 28
20 16
84 81 81
73 70
64 61 56 50
49 47 39
27 20
0
10
20
30
40
50
60
70
80
90
100
Indonesia 2012
Nigeria 2011
Kenya 2008-2009
India 2005-2006
Congo,Dem.Rep.2010
Pakistan 2006
Ghana 2011
Bangladesh 2011
Yemen 2006
Malawi 2010
Afghanistan 2010
Liberia 2007
Senegal 2010
Tanzania 2010
Rural Female Rural MaleUrban Female Urban Male
Percent of Young People Ages 15-24 Who Have Completed Lower Secondary School
© 2015 Population Reference Bureau See notes on pages 18/19 THE URBAN-RURAL DIVIDE IN HEALTH AND DEVELOPMENT 9
THE URBAN-RURAL DIVIDE IN HEALTH AND DEVELOPMENT
DEMOGRAPHY SOCIOECONOMIC MATERNAL AND CHILD HEALTH
Total Population (millions)
2014
Population % Urban
Total Fertility Rate2004/2014
Women Ages 15-19 Who Have Begun Childbearing (%)
2004/2014
Population Below National Poverty Line (%)
2004/2013
Employment in Agriculture
(% of total employment) 2004/2013
Lower Secondary School
Completion Rate (%)2004/2012
Antenatal Care (at least 4 visits) (%)
2004/2014
Skilled Attendance at Delivery (%)
2004/2014Infant Mortality Rate
2004/2014
Children Under Age 5 Who are
Underweight (%)2004/2014
2014 2050 Urban Rural Urban Rural Urban Rural Urban Rural Urban Rural Urban Rural Urban Rural Urban Rural
AFRICA
Algeria 39.1 70 82 2.2 2.4 — — — — 11 — — 73 60 98 95 — — 3 4
Angola 22.4 43 64 4.6 7.7 20 45 19 58 — — — 61 32 73 24 95 138 — —
Benin 10.3 44 61 4.3 5.4 11 21 31 40 43 28 8 66 53 90 75 41 49 15 21
Botswana 2.0 57 70 — — — — 11 24 30 — — 76 70 99 90 — — — —
Burkina Faso 17.9 29 52 3.9 6.7 13 29 25 53 85 20 2 45 31 93 61 61 81 18 27
Burundi 10.5 12 26 4.8 6.6 12 9 34 69 — 23 5 39 33 88 58 49 81 18 30
Cameroon 22.8 54 70 4.0 6.4 18 34 12 55 53 43 11 77 50 87 47 58 77 7 20
Cape Verde 0.5 65 78 2.7 3.1 18 20 13 44 — — — 77 67 91 64 46 37 — —
Central African Republic 4.8 40 57 5.1 7.0 40 55 50 69 — 15 1 54 30 83 38 100 126 23 24
Chad 13.3 22 37 6.3 7.2 38 46 21 53 — 21 2 44 17 60 12 100 108 22 33
Comoros 0.7 28 38 3.5 4.8 12 11 35 49 — — — 50 49 92 79 21 45 12 17
Congo 4.6 65 77 4.5 6.5 28 46 — 75 35 40 11 85 69 98 84 45 51 9 16
Congo, Dem. Republic 71.2 42 60 5.4 7.3 20 32 62 76 — 64 25 61 42 94 74 59 68 14 26
Côte d'Ivoire 20.8 53 71 3.7 6.3 19 46 29 54 — 39 10 61 33 84 45 66 82 12 17
Djibouti 0.9 77 83 — — — — — — — 35 11 26 12 98 55 68 54 26 40
Egypt 87.9 43 57 2.9 3.8 5 14 15 32 29 84 70 81 57 97 89 20 29 6 5
Eritrea 6.5 22 42 3.6 5.6 5 14 — — — — — 80 47 74 17 41 45 27 44
Ethiopia 95.9 19 38 2.6 5.5 4 15 26 30 79 37 6 46 14 51 4 59 76 16 30
Gabon 1.7 87 91 3.9 6.1 26 43 30 45 24 39 18 81 58 93 69 42 47 6 9
Gambia 1.9 59 71 4.7 6.8 14 24 33 74 — 47 19 73 72 77 41 75 85 12 21
Ghana 27.0 53 70 3.4 5.2 12 17 11 39 42 59 32 93 82 91 59 46 56 9 13
Guinea 11.6 37 56 3.8 5.8 23 43 35 65 — 22 3 77 49 84 32 55 83 9 21
Guinea-Bissau 1.7 49 65 3.5 6.4 23 38 51 76 — 31 5 74 65 69 29 61 64 13 21
Kenya 43.2 25 44 3.1 4.5 17 19 34 49 61 79 55 68 51 82 50 63 58 7 13
Lesotho 1.9 27 47 2.3 3.9 12 23 — — — 47 20 80 72 90 73 74 86 8 11
© 2015 Population Reference Bureau See notes on pages 18/19 THE URBAN-RURAL DIVIDE IN HEALTH AND DEVELOPMENT 10
THE URBAN-RURAL DIVIDE IN HEALTH AND DEVELOPMENT
FAMILY PLANNING DRINKING WATER AND SANITATION
Married Women Ages 15-49 Using Modern Contraception (%)
2004/2014
Unmet Need for Family Planning (%)
2004/2014
Demand for Family Planning Satisfied byModern Methods (%)
2004/2014
Population With Access to Improved Drinking
Water Source (%) 2006/2012
Population With Access to Improved
Sanitation Facility (%) 2006/2012
Urban Rural Urban Rural Urban Rural Urban Rural Urban Rural
AFRICA
Algeria 52 52 10 12 71 73 85 79 98 88
Angola 19 3 — — — — 68 34 87 20
Benin 10 7 33 32 20 16 85 69 25 5
Botswana — — — — — — 99 93 78 42
Burkina Faso 31 11 22 25 55 30 97 76 50 7
Burundi 29 17 26 33 47 31 92 73 43 48
Cameroon 21 9 23 24 37 23 94 52 62 27
Cape Verde 63 50 14 20 77 67 91 86 75 47
Central African Republic 20 3 28 26 37 7 90 54 44 7
Chad 6 1 31 28 14 2 72 45 31 6
Comoros 21 11 24 36 38 22 91 97 50 30
Congo 25 12 18 19 38 19 96 39 20 6
Congo, Dem. Republic 15 5 28 27 25 11 79 29 29 33
Côte d'Ivoire 16 10 25 29 34 23 92 68 33 10
Djibouti 18 4 22 25 44 12 100 65 73 22
Egypt 60 56 12 13 81 79 100 99 98 94
Eritrea 15 3 27 28 33 11 74 57 52 4
Ethiopia 50 23 16 29 73 44 97 42 27 23
Gabon 21 11 26 32 35 21 97 63 43 32
Gambia 13 5 21 22 33 15 94 84 64 55
Ghana 20 24 29 31 37 41 93 81 20 8
Guinea 7 4 26 23 22 13 92 65 33 11
Guinea-Bissau 18 6 9 5 59 40 96 56 34 8
Kenya 57 51 13 20 77 67 82 55 31 29
Lesotho 65 57 14 21 82 73 93 77 37 27
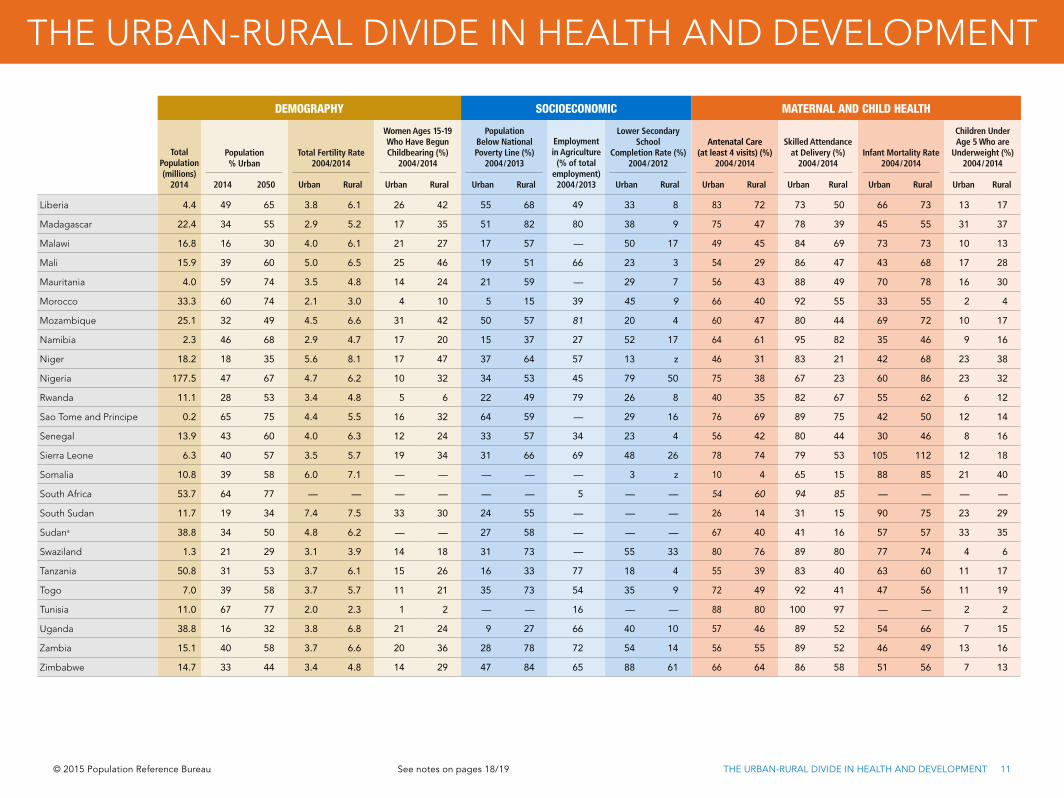
60%Percentage of Africa’s population living in rural areas.
500,000Most urban residents in developing countries live in places with less than 500,000 people.
© 2015 Population Reference Bureau See notes on pages 18/19 THE URBAN-RURAL DIVIDE IN HEALTH AND DEVELOPMENT 11
THE URBAN-RURAL DIVIDE IN HEALTH AND DEVELOPMENT
DEMOGRAPHY SOCIOECONOMIC MATERNAL AND CHILD HEALTH
Total Population (millions)
2014
Population % Urban
Total Fertility Rate2004/2014
Women Ages 15-19 Who Have Begun Childbearing (%)
2004/2014
Population Below National Poverty Line (%)
2004/2013
Employment in Agriculture
(% of total employment) 2004/2013
Lower Secondary School
Completion Rate (%)2004/2012
Antenatal Care (at least 4 visits) (%)
2004/2014
Skilled Attendance at Delivery (%)
2004/2014Infant Mortality Rate
2004/2014
Children Under Age 5 Who are
Underweight (%)2004/2014
2014 2050 Urban Rural Urban Rural Urban Rural Urban Rural Urban Rural Urban Rural Urban Rural Urban Rural
Liberia 4.4 49 65 3.8 6.1 26 42 55 68 49 33 8 83 72 73 50 66 73 13 17
Madagascar 22.4 34 55 2.9 5.2 17 35 51 82 80 38 9 75 47 78 39 45 55 31 37
Malawi 16.8 16 30 4.0 6.1 21 27 17 57 — 50 17 49 45 84 69 73 73 10 13
Mali 15.9 39 60 5.0 6.5 25 46 19 51 66 23 3 54 29 86 47 43 68 17 28
Mauritania 4.0 59 74 3.5 4.8 14 24 21 59 — 29 7 56 43 88 49 70 78 16 30
Morocco 33.3 60 74 2.1 3.0 4 10 5 15 39 45 9 66 40 92 55 33 55 2 4
Mozambique 25.1 32 49 4.5 6.6 31 42 50 57 81 20 4 60 47 80 44 69 72 10 17
Namibia 2.3 46 68 2.9 4.7 17 20 15 37 27 52 17 64 61 95 82 35 46 9 16
Niger 18.2 18 35 5.6 8.1 17 47 37 64 57 13 z 46 31 83 21 42 68 23 38
Nigeria 177.5 47 67 4.7 6.2 10 32 34 53 45 79 50 75 38 67 23 60 86 23 32
Rwanda 11.1 28 53 3.4 4.8 5 6 22 49 79 26 8 40 35 82 67 55 62 6 12
Sao Tome and Principe 0.2 65 75 4.4 5.5 16 32 64 59 — 29 16 76 69 89 75 42 50 12 14
Senegal 13.9 43 60 4.0 6.3 12 24 33 57 34 23 4 56 42 80 44 30 46 8 16
Sierra Leone 6.3 40 57 3.5 5.7 19 34 31 66 69 48 26 78 74 79 53 105 112 12 18
Somalia 10.8 39 58 6.0 7.1 — — — — — 3 z 10 4 65 15 88 85 21 40
South Africa 53.7 64 77 — — — — — — 5 — — 54 60 94 85 — — — —
South Sudan 11.7 19 34 7.4 7.5 33 30 24 55 — — — 26 14 31 15 90 75 23 29
Sudana 38.8 34 50 4.8 6.2 — — 27 58 — — — 67 40 41 16 57 57 33 35
Swaziland 1.3 21 29 3.1 3.9 14 18 31 73 — 55 33 80 76 89 80 77 74 4 6
Tanzania 50.8 31 53 3.7 6.1 15 26 16 33 77 18 4 55 39 83 40 63 60 11 17
Togo 7.0 39 58 3.7 5.7 11 21 35 73 54 35 9 72 49 92 41 47 56 11 19
Tunisia 11.0 67 77 2.0 2.3 1 2 — — 16 — — 88 80 100 97 — — 2 2
Uganda 38.8 16 32 3.8 6.8 21 24 9 27 66 40 10 57 46 89 52 54 66 7 15
Zambia 15.1 40 58 3.7 6.6 20 36 28 78 72 54 14 56 55 89 52 46 49 13 16
Zimbabwe 14.7 33 44 3.4 4.8 14 29 47 84 65 88 61 66 64 86 58 51 56 7 13
© 2015 Population Reference Bureau See notes on pages 18/19 THE URBAN-RURAL DIVIDE IN HEALTH AND DEVELOPMENT 12
THE URBAN-RURAL DIVIDE IN HEALTH AND DEVELOPMENT
FAMILY PLANNING DRINKING WATER AND SANITATION
Married Women Ages 15-49 Using Modern Contraception (%)
2004/2014
Unmet Need for Family Planning (%)
2004/2014
Demand for Family Planning Satisfied byModern Methods (%)
2004/2014
Population With Access to Improved Drinking
Water Source (%) 2006/2012
Population With Access to Improved
Sanitation Facility (%) 2006/2012
Urban Rural Urban Rural Urban Rural Urban Rural Urban Rural
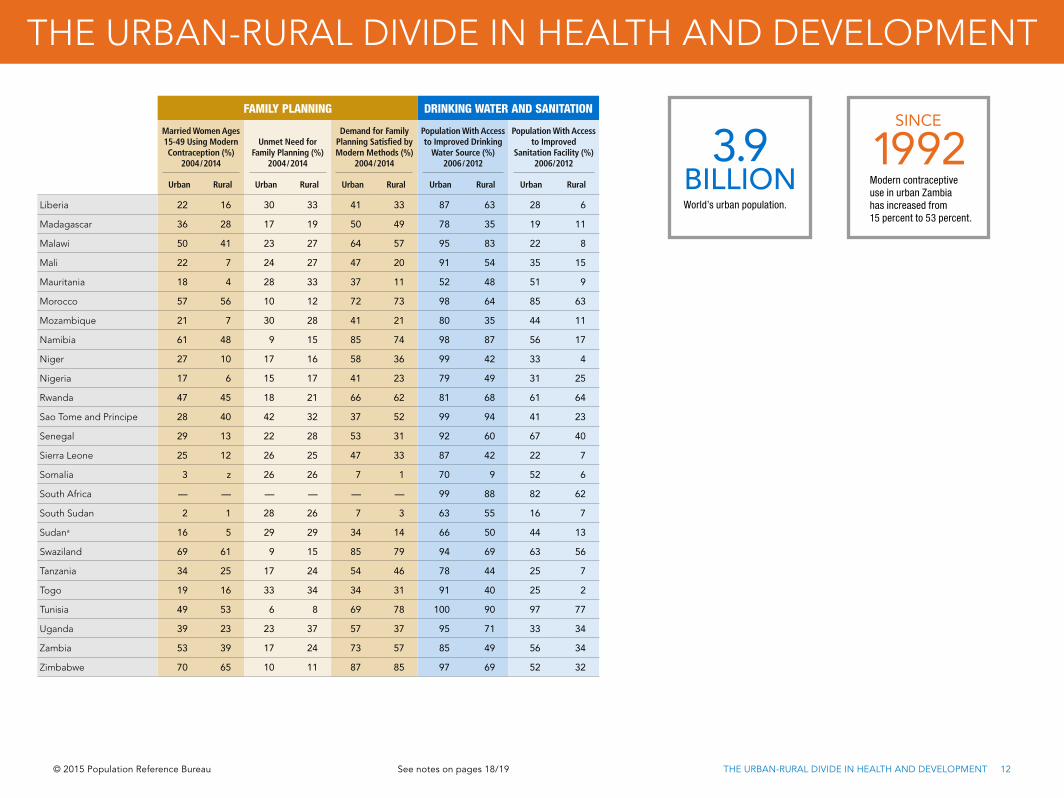
Liberia 22 16 30 33 41 33 87 63 28 6
Madagascar 36 28 17 19 50 49 78 35 19 11
Malawi 50 41 23 27 64 57 95 83 22 8
Mali 22 7 24 27 47 20 91 54 35 15
Mauritania 18 4 28 33 37 11 52 48 51 9
Morocco 57 56 10 12 72 73 98 64 85 63
Mozambique 21 7 30 28 41 21 80 35 44 11
Namibia 61 48 9 15 85 74 98 87 56 17
Niger 27 10 17 16 58 36 99 42 33 4
Nigeria 17 6 15 17 41 23 79 49 31 25
Rwanda 47 45 18 21 66 62 81 68 61 64
Sao Tome and Principe 28 40 42 32 37 52 99 94 41 23
Senegal 29 13 22 28 53 31 92 60 67 40
Sierra Leone 25 12 26 25 47 33 87 42 22 7
Somalia 3 z 26 26 7 1 70 9 52 6
South Africa — — — — — — 99 88 82 62
South Sudan 2 1 28 26 7 3 63 55 16 7
Sudana 16 5 29 29 34 14 66 50 44 13
Swaziland 69 61 9 15 85 79 94 69 63 56
Tanzania 34 25 17 24 54 46 78 44 25 7
Togo 19 16 33 34 34 31 91 40 25 2
Tunisia 49 53 6 8 69 78 100 90 97 77
Uganda 39 23 23 37 57 37 95 71 33 34
Zambia 53 39 17 24 73 57 85 49 56 34
Zimbabwe 70 65 10 11 87 85 97 69 52 32
3.9 BILLIONWorld’s urban population.
SINCE
1992Modern contraceptive use in urban Zambia has increased from 15 percent to 53 percent.
© 2015 Population Reference Bureau See notes on pages 18/19 THE URBAN-RURAL DIVIDE IN HEALTH AND DEVELOPMENT 13
THE URBAN-RURAL DIVIDE IN HEALTH AND DEVELOPMENT
DEMOGRAPHY SOCIOECONOMIC MATERNAL AND CHILD HEALTH
Total Population (millions)
2014
Population % Urban
Total Fertility Rate2004/2014
Women Ages 15-19 Who Have Begun Childbearing (%)
2004/2014
Population Below National Poverty Line (%)
2004/2013
Employment in Agriculture
(% of total employment) 2004/2013
Lower Secondary School
Completion Rate (%)2004/2012
Antenatal Care (at least 4 visits) (%)
2004/2014
Skilled Attendance at Delivery (%)
2004/2014Infant Mortality Rate
2004/2014
Children Under Age 5 Who are
Underweight (%)2004/2014
2014 2050 Urban Rural Urban Rural Urban Rural Urban Rural Urban Rural Urban Rural Urban Rural Urban Rural
EUROPE
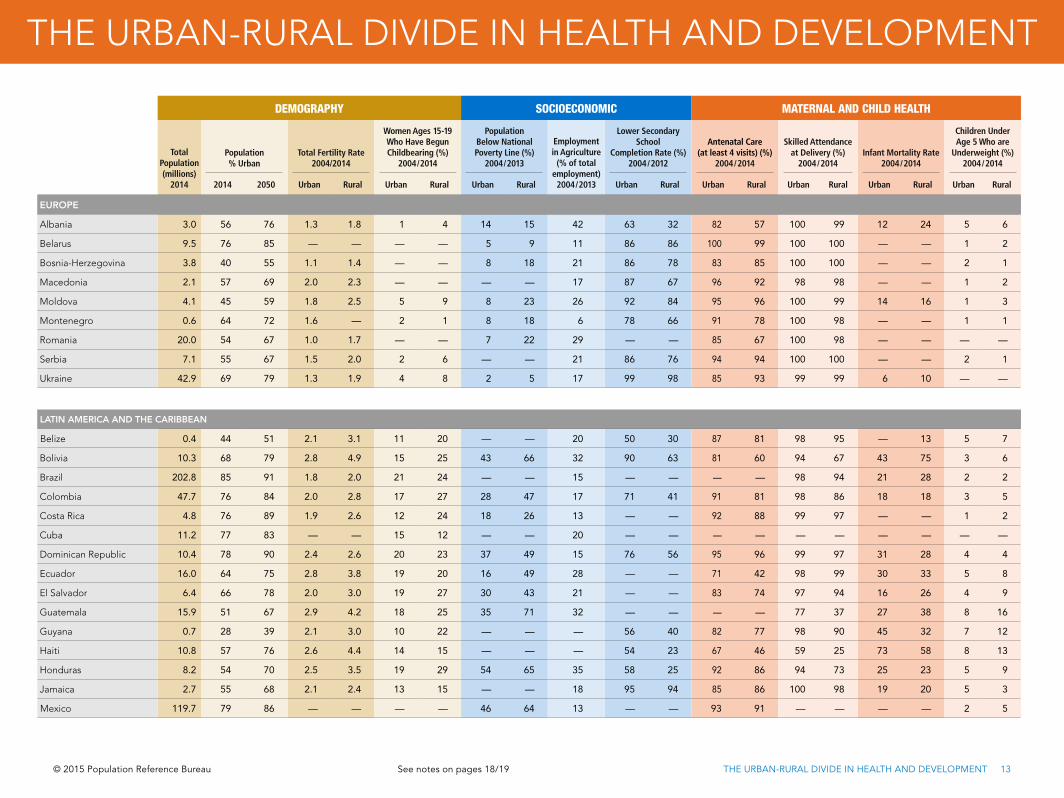
Albania 3.0 56 76 1.3 1.8 1 4 14 15 42 63 32 82 57 100 99 12 24 5 6
Belarus 9.5 76 85 — — — — 5 9 11 86 86 100 99 100 100 — — 1 2
Bosnia-Herzegovina 3.8 40 55 1.1 1.4 — — 8 18 21 86 78 83 85 100 100 — — 2 1
Macedonia 2.1 57 69 2.0 2.3 — — — — 17 87 67 96 92 98 98 — — 1 2
Moldova 4.1 45 59 1.8 2.5 5 9 8 23 26 92 84 95 96 100 99 14 16 1 3
Montenegro 0.6 64 72 1.6 — 2 1 8 18 6 78 66 91 78 100 98 — — 1 1
Romania 20.0 54 67 1.0 1.7 — — 7 22 29 — — 85 67 100 98 — — — —
Serbia 7.1 55 67 1.5 2.0 2 6 — — 21 86 76 94 94 100 100 — — 2 1
Ukraine 42.9 69 79 1.3 1.9 4 8 2 5 17 99 98 85 93 99 99 6 10 — —
LATIN AMERICA AND THE CARIBBEAN
Belize 0.4 44 51 2.1 3.1 11 20 — — 20 50 30 87 81 98 95 — 13 5 7
Bolivia 10.3 68 79 2.8 4.9 15 25 43 66 32 90 63 81 60 94 67 43 75 3 6
Brazil 202.8 85 91 1.8 2.0 21 24 — — 15 — — — — 98 94 21 28 2 2
Colombia 47.7 76 84 2.0 2.8 17 27 28 47 17 71 41 91 81 98 86 18 18 3 5
Costa Rica 4.8 76 89 1.9 2.6 12 24 18 26 13 — — 92 88 99 97 — — 1 2
Cuba 11.2 77 83 — — 15 12 — — 20 — — — — — — — — — —
Dominican Republic 10.4 78 90 2.4 2.6 20 23 37 49 15 76 56 95 96 99 97 31 28 4 4
Ecuador 16.0 64 75 2.8 3.8 19 20 16 49 28 — — 71 42 98 99 30 33 5 8
El Salvador 6.4 66 78 2.0 3.0 19 27 30 43 21 — — 83 74 97 94 16 26 4 9
Guatemala 15.9 51 67 2.9 4.2 18 25 35 71 32 — — — — 77 37 27 38 8 16
Guyana 0.7 28 39 2.1 3.0 10 22 — — — 56 40 82 77 98 90 45 32 7 12
Haiti 10.8 57 76 2.6 4.4 14 15 — — — 54 23 67 46 59 25 73 58 8 13
Honduras 8.2 54 70 2.5 3.5 19 29 54 65 35 58 25 92 86 94 73 25 23 5 9
Jamaica 2.7 55 68 2.1 2.4 13 15 — — 18 95 94 85 86 100 98 19 20 5 3
Mexico 119.7 79 86 — — — — 46 64 13 — — 93 91 — — — — 2 5
© 2015 Population Reference Bureau See notes on pages 18/19 THE URBAN-RURAL DIVIDE IN HEALTH AND DEVELOPMENT 14
THE URBAN-RURAL DIVIDE IN HEALTH AND DEVELOPMENT
FAMILY PLANNING DRINKING WATER AND SANITATION
Married Women Ages 15-49 Using Modern Contraception (%)
2004/2014
Unmet Need for Family Planning (%)
2004/2014
Demand for Family Planning Satisfied byModern Methods (%)
2004/2014
Population With Access to Improved Drinking
Water Source (%) 2006/2012
Population With Access to Improved
Sanitation Facility (%) 2006/2012
Urban Rural Urban Rural Urban Rural Urban Rural Urban Rural
EUROPE
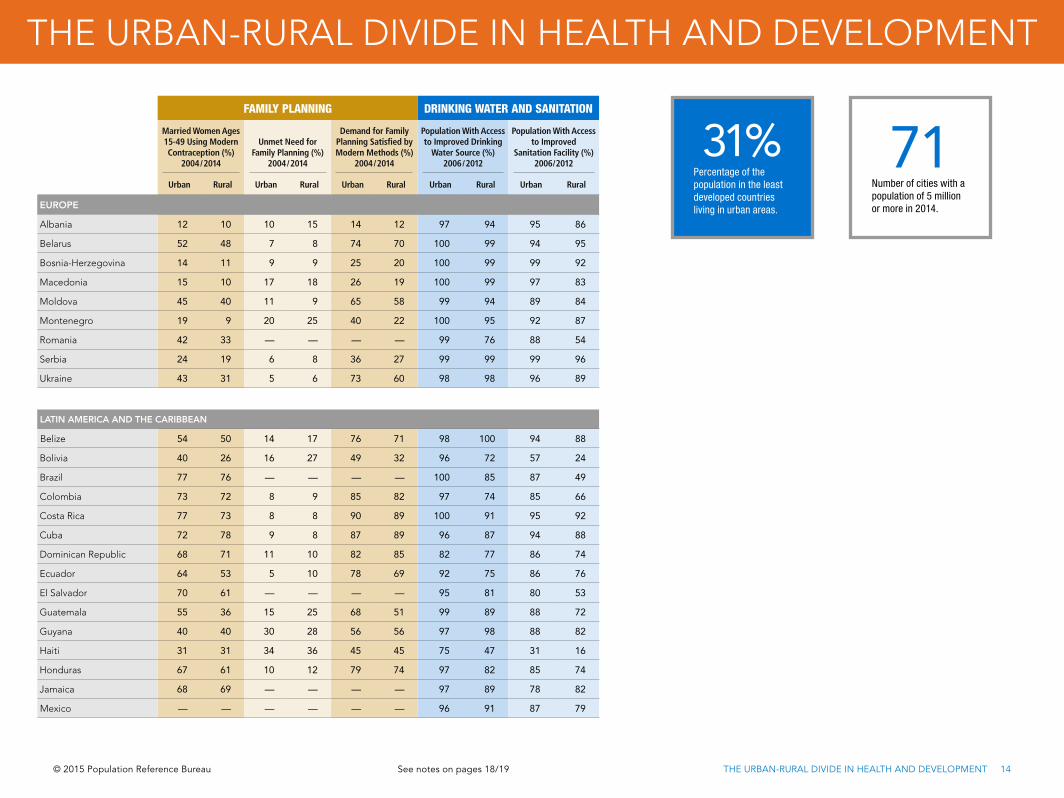
Albania 12 10 10 15 14 12 97 94 95 86
Belarus 52 48 7 8 74 70 100 99 94 95
Bosnia-Herzegovina 14 11 9 9 25 20 100 99 99 92
Macedonia 15 10 17 18 26 19 100 99 97 83
Moldova 45 40 11 9 65 58 99 94 89 84
Montenegro 19 9 20 25 40 22 100 95 92 87
Romania 42 33 — — — — 99 76 88 54
Serbia 24 19 6 8 36 27 99 99 99 96
Ukraine 43 31 5 6 73 60 98 98 96 89
LATIN AMERICA AND THE CARIBBEAN
Belize 54 50 14 17 76 71 98 100 94 88
Bolivia 40 26 16 27 49 32 96 72 57 24
Brazil 77 76 — — — — 100 85 87 49
Colombia 73 72 8 9 85 82 97 74 85 66
Costa Rica 77 73 8 8 90 89 100 91 95 92
Cuba 72 78 9 8 87 89 96 87 94 88
Dominican Republic 68 71 11 10 82 85 82 77 86 74
Ecuador 64 53 5 10 78 69 92 75 86 76
El Salvador 70 61 — — — — 95 81 80 53
Guatemala 55 36 15 25 68 51 99 89 88 72
Guyana 40 40 30 28 56 56 97 98 88 82
Haiti 31 31 34 36 45 45 75 47 31 16
Honduras 67 61 10 12 79 74 97 82 85 74
Jamaica 68 69 — — — — 97 89 78 82
Mexico — — — — — — 96 91 87 79
31%Percentage of the population in the least developed countries living in urban areas.
71Number of cities with a population of 5 million or more in 2014.
© 2015 Population Reference Bureau See notes on pages 18/19 THE URBAN-RURAL DIVIDE IN HEALTH AND DEVELOPMENT 15
THE URBAN-RURAL DIVIDE IN HEALTH AND DEVELOPMENT
DEMOGRAPHY SOCIOECONOMIC MATERNAL AND CHILD HEALTH
Total Population (millions)
2014
Population % Urban
Total Fertility Rate2004/2014
Women Ages 15-19 Who Have Begun Childbearing (%)
2004/2014
Population Below National Poverty Line (%)
2004/2013
Employment in Agriculture
(% of total employment) 2004/2013
Lower Secondary School
Completion Rate (%)2004/2012
Antenatal Care (at least 4 visits) (%)
2004/2014
Skilled Attendance at Delivery (%)
2004/2014Infant Mortality Rate
2004/2014
Children Under Age 5 Who are
Underweight (%)2004/2014
2014 2050 Urban Rural Urban Rural Urban Rural Urban Rural Urban Rural Urban Rural Urban Rural Urban Rural
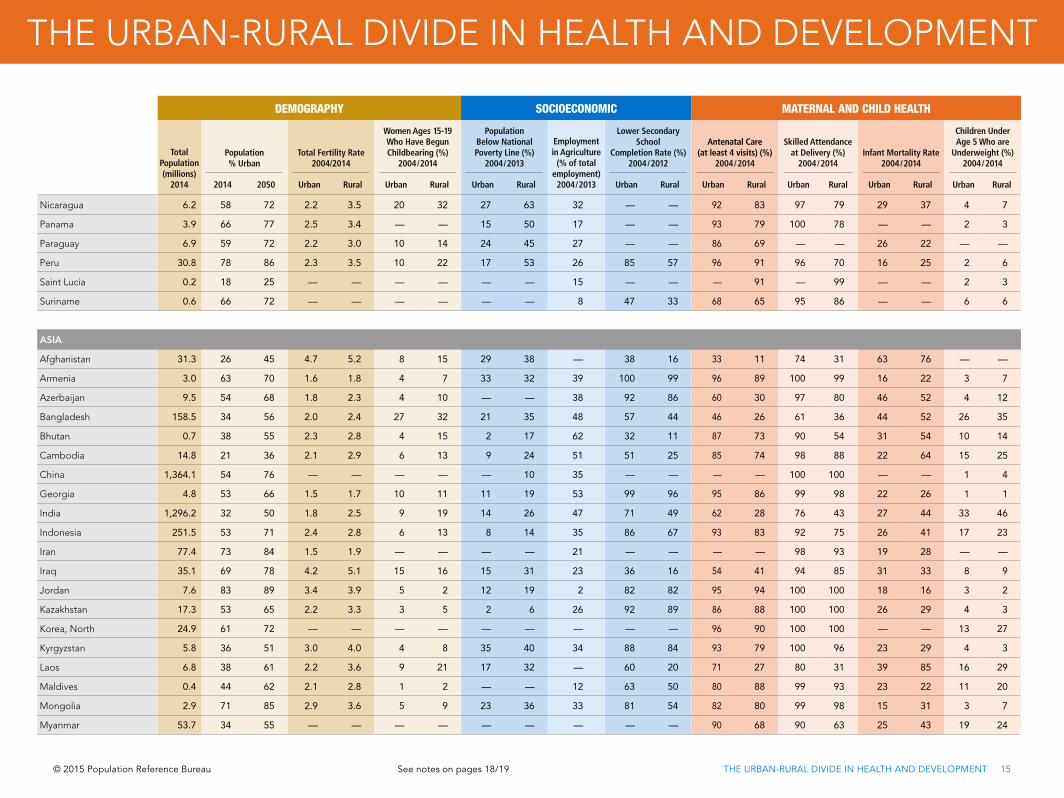
Nicaragua 6.2 58 72 2.2 3.5 20 32 27 63 32 — — 92 83 97 79 29 37 4 7
Panama 3.9 66 77 2.5 3.4 — — 15 50 17 — — 93 79 100 78 — — 2 3
Paraguay 6.9 59 72 2.2 3.0 10 14 24 45 27 — — 86 69 — — 26 22 — —
Peru 30.8 78 86 2.3 3.5 10 22 17 53 26 85 57 96 91 96 70 16 25 2 6
Saint Lucia 0.2 18 25 — — — — — — 15 — — — 91 — 99 — — 2 3
Suriname 0.6 66 72 — — — — — — 8 47 33 68 65 95 86 — — 6 6
ASIA
Afghanistan 31.3 26 45 4.7 5.2 8 15 29 38 — 38 16 33 11 74 31 63 76 — —
Armenia 3.0 63 70 1.6 1.8 4 7 33 32 39 100 99 96 89 100 99 16 22 3 7
Azerbaijan 9.5 54 68 1.8 2.3 4 10 — — 38 92 86 60 30 97 80 46 52 4 12
Bangladesh 158.5 34 56 2.0 2.4 27 32 21 35 48 57 44 46 26 61 36 44 52 26 35
Bhutan 0.7 38 55 2.3 2.8 4 15 2 17 62 32 11 87 73 90 54 31 54 10 14
Cambodia 14.8 21 36 2.1 2.9 6 13 9 24 51 51 25 85 74 98 88 22 64 15 25
China 1,364.1 54 76 — — — — — 10 35 — — — — 100 100 — — 1 4
Georgia 4.8 53 66 1.5 1.7 10 11 11 19 53 99 96 95 86 99 98 22 26 1 1
India 1,296.2 32 50 1.8 2.5 9 19 14 26 47 71 49 62 28 76 43 27 44 33 46
Indonesia 251.5 53 71 2.4 2.8 6 13 8 14 35 86 67 93 83 92 75 26 41 17 23
Iran 77.4 73 84 1.5 1.9 — — — — 21 — — — — 98 93 19 28 — —
Iraq 35.1 69 78 4.2 5.1 15 16 15 31 23 36 16 54 41 94 85 31 33 8 9
Jordan 7.6 83 89 3.4 3.9 5 2 12 19 2 82 82 95 94 100 100 18 16 3 2
Kazakhstan 17.3 53 65 2.2 3.3 3 5 2 6 26 92 89 86 88 100 100 26 29 4 3
Korea, North 24.9 61 72 — — — — — — — — — 96 90 100 100 — — 13 27
Kyrgyzstan 5.8 36 51 3.0 4.0 4 8 35 40 34 88 84 93 79 100 96 23 29 4 3
Laos 6.8 38 61 2.2 3.6 9 21 17 32 — 60 20 71 27 80 31 39 85 16 29
Maldives 0.4 44 62 2.1 2.8 1 2 — — 12 63 50 80 88 99 93 23 22 11 20
Mongolia 2.9 71 85 2.9 3.6 5 9 23 36 33 81 54 82 80 99 98 15 31 3 7
Myanmar 53.7 34 55 — — — — — — — — — 90 68 90 63 25 43 19 24
© 2015 Population Reference Bureau See notes on pages 18/19 THE URBAN-RURAL DIVIDE IN HEALTH AND DEVELOPMENT 16
THE URBAN-RURAL DIVIDE IN HEALTH AND DEVELOPMENT
FAMILY PLANNING DRINKING WATER AND SANITATION
Married Women Ages 15-49 Using Modern Contraception (%)
2004/2014
Unmet Need for Family Planning (%)
2004/2014
Demand for Family Planning Satisfied byModern Methods (%)
2004/2014
Population With Access to Improved Drinking
Water Source (%) 2006/2012
Population With Access to Improved
Sanitation Facility (%) 2006/2012
Urban Rural Urban Rural Urban Rural Urban Rural Urban Rural
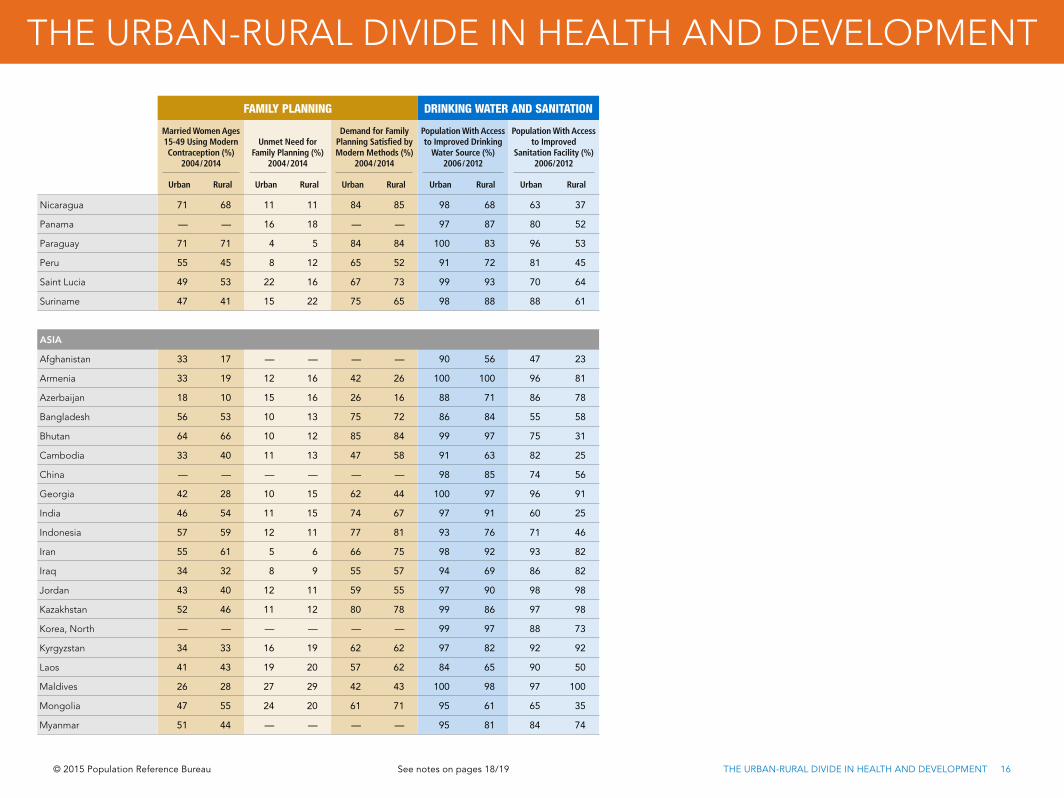
Nicaragua 71 68 11 11 84 85 98 68 63 37
Panama — — 16 18 — — 97 87 80 52
Paraguay 71 71 4 5 84 84 100 83 96 53
Peru 55 45 8 12 65 52 91 72 81 45
Saint Lucia 49 53 22 16 67 73 99 93 70 64
Suriname 47 41 15 22 75 65 98 88 88 61
ASIA
Afghanistan 33 17 — — — — 90 56 47 23
Armenia 33 19 12 16 42 26 100 100 96 81
Azerbaijan 18 10 15 16 26 16 88 71 86 78
Bangladesh 56 53 10 13 75 72 86 84 55 58
Bhutan 64 66 10 12 85 84 99 97 75 31
Cambodia 33 40 11 13 47 58 91 63 82 25
China — — — — — — 98 85 74 56
Georgia 42 28 10 15 62 44 100 97 96 91
India 46 54 11 15 74 67 97 91 60 25
Indonesia 57 59 12 11 77 81 93 76 71 46
Iran 55 61 5 6 66 75 98 92 93 82
Iraq 34 32 8 9 55 57 94 69 86 82
Jordan 43 40 12 11 59 55 97 90 98 98
Kazakhstan 52 46 11 12 80 78 99 86 97 98
Korea, North — — — — — — 99 97 88 73
Kyrgyzstan 34 33 16 19 62 62 97 82 92 92
Laos 41 43 19 20 57 62 84 65 90 50
Maldives 26 28 27 29 42 43 100 98 97 100
Mongolia 47 55 24 20 61 71 95 61 65 35
Myanmar 51 44 — — — — 95 81 84 74
© 2015 Population Reference Bureau See notes on pages 18/19 THE URBAN-RURAL DIVIDE IN HEALTH AND DEVELOPMENT 17
THE URBAN-RURAL DIVIDE IN HEALTH AND DEVELOPMENT
DEMOGRAPHY SOCIOECONOMIC MATERNAL AND CHILD HEALTH
Total Population (millions)
2014
Population % Urban
Total Fertility Rate2004/2014
Women Ages 15-19 Who Have Begun Childbearing (%)
2004/2014
Population Below National Poverty Line (%)
2004/2013
Employment in Agriculture
(% of total employment) 2004/2013
Lower Secondary School
Completion Rate (%)2004/2012
Antenatal Care (at least 4 visits) (%)
2004/2014
Skilled Attendance at Delivery (%)
2004/2014Infant Mortality Rate
2004/2014
Children Under Age 5 Who are
Underweight (%)2004/2014
2014 2050 Urban Rural Urban Rural Urban Rural Urban Rural Urban Rural Urban Rural Urban Rural Urban Rural
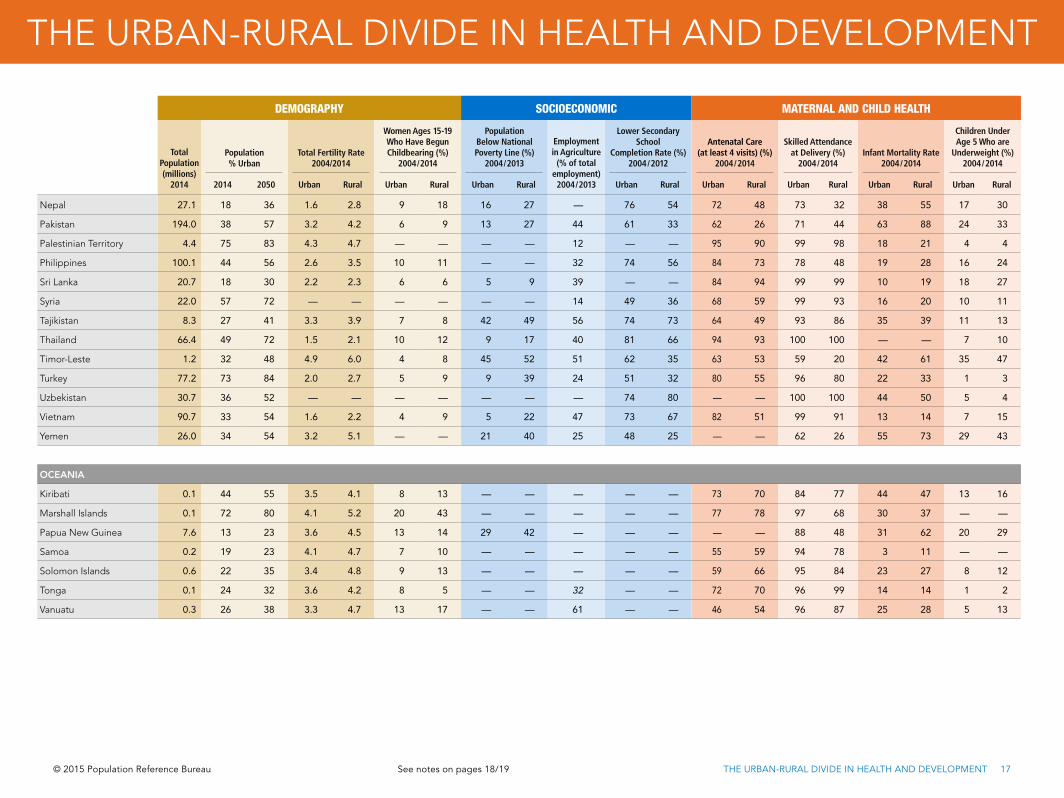
Nepal 27.1 18 36 1.6 2.8 9 18 16 27 — 76 54 72 48 73 32 38 55 17 30
Pakistan 194.0 38 57 3.2 4.2 6 9 13 27 44 61 33 62 26 71 44 63 88 24 33
Palestinian Territory 4.4 75 83 4.3 4.7 — — — — 12 — — 95 90 99 98 18 21 4 4
Philippines 100.1 44 56 2.6 3.5 10 11 — — 32 74 56 84 73 78 48 19 28 16 24
Sri Lanka 20.7 18 30 2.2 2.3 6 6 5 9 39 — — 84 94 99 99 10 19 18 27
Syria 22.0 57 72 — — — — — — 14 49 36 68 59 99 93 16 20 10 11
Tajikistan 8.3 27 41 3.3 3.9 7 8 42 49 56 74 73 64 49 93 86 35 39 11 13
Thailand 66.4 49 72 1.5 2.1 10 12 9 17 40 81 66 94 93 100 100 — — 7 10
Timor-Leste 1.2 32 48 4.9 6.0 4 8 45 52 51 62 35 63 53 59 20 42 61 35 47
Turkey 77.2 73 84 2.0 2.7 5 9 9 39 24 51 32 80 55 96 80 22 33 1 3
Uzbekistan 30.7 36 52 — — — — — — — 74 80 — — 100 100 44 50 5 4
Vietnam 90.7 33 54 1.6 2.2 4 9 5 22 47 73 67 82 51 99 91 13 14 7 15
Yemen 26.0 34 54 3.2 5.1 — — 21 40 25 48 25 — — 62 26 55 73 29 43
OCEANIA
Kiribati 0.1 44 55 3.5 4.1 8 13 — — — — — 73 70 84 77 44 47 13 16
Marshall Islands 0.1 72 80 4.1 5.2 20 43 — — — — — 77 78 97 68 30 37 — —
Papua New Guinea 7.6 13 23 3.6 4.5 13 14 29 42 — — — — — 88 48 31 62 20 29
Samoa 0.2 19 23 4.1 4.7 7 10 — — — — — 55 59 94 78 3 11 — —
Solomon Islands 0.6 22 35 3.4 4.8 9 13 — — — — — 59 66 95 84 23 27 8 12
Tonga 0.1 24 32 3.6 4.2 8 5 — — 32 — — 72 70 96 99 14 14 1 2
Vanuatu 0.3 26 38 3.3 4.7 13 17 — — 61 — — 46 54 96 87 25 28 5 13
THE URBAN-RURAL DIVIDE IN HEALTH AND DEVELOPMENT
© 2015 Population Reference Bureau THE URBAN-RURAL DIVIDE IN HEALTH AND DEVELOPMENT 18
FAMILY PLANNING DRINKING WATER AND SANITATION
Married Women Ages 15-49 Using Modern Contraception (%)
2004/2014
Unmet Need for Family Planning (%)
2004/2014
Demand for Family Planning Satisfied byModern Methods (%)
2004/2014
Population With Access to Improved Drinking
Water Source (%) 2006/2012
Population With Access to Improved
Sanitation Facility (%) 2006/2012
Urban Rural Urban Rural Urban Rural Urban Rural Urban Rural
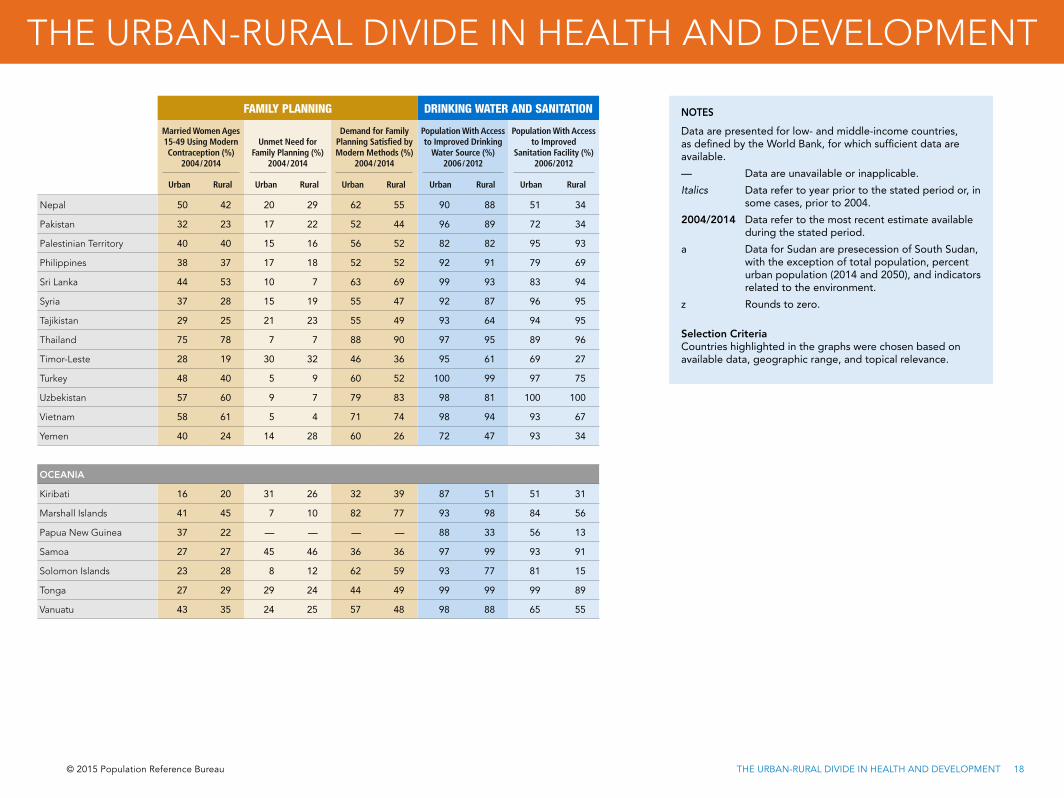
Nepal 50 42 20 29 62 55 90 88 51 34
Pakistan 32 23 17 22 52 44 96 89 72 34
Palestinian Territory 40 40 15 16 56 52 82 82 95 93
Philippines 38 37 17 18 52 52 92 91 79 69
Sri Lanka 44 53 10 7 63 69 99 93 83 94
Syria 37 28 15 19 55 47 92 87 96 95
Tajikistan 29 25 21 23 55 49 93 64 94 95
Thailand 75 78 7 7 88 90 97 95 89 96
Timor-Leste 28 19 30 32 46 36 95 61 69 27
Turkey 48 40 5 9 60 52 100 99 97 75
Uzbekistan 57 60 9 7 79 83 98 81 100 100
Vietnam 58 61 5 4 71 74 98 94 93 67
Yemen 40 24 14 28 60 26 72 47 93 34
OCEANIA
Kiribati 16 20 31 26 32 39 87 51 51 31
Marshall Islands 41 45 7 10 82 77 93 98 84 56
Papua New Guinea 37 22 — — — — 88 33 56 13
Samoa 27 27 45 46 36 36 97 99 93 91
Solomon Islands 23 28 8 12 62 59 93 77 81 15
Tonga 27 29 29 24 44 49 99 99 99 89
Vanuatu 43 35 24 25 57 48 98 88 65 55
NOTES
Data are presented for low- and middle-income countries, as defined by the World Bank, for which sufficient data are available.
— Data are unavailable or inapplicable.
Italics Data refer to year prior to the stated period or, in some cases, prior to 2004.
2004/2014 Data refer to the most recent estimate available during the stated period.
a Data for Sudan are presecession of South Sudan, with the exception of total population, percent urban population (2014 and 2050), and indicators related to the environment.
z Rounds to zero.
Selection CriteriaCountries highlighted in the graphs were chosen based on available data, geographic range, and topical relevance.
© 2015 Population Reference Bureau THE URBAN-RURAL DIVIDE IN HEALTH AND DEVELOPMENT 19
THE URBAN-RURAL DIVIDE IN HEALTH AND DEVELOPMENTDEFINITIONS
Total Population (in millions)Mid-2014 population estimates based on a recent
census, official national data, or Population Reference
Bureau (PRB), United Nations (UN), and U.S. Census
Bureau projections.
Population, % Urban, 2014 and 2050Percentage of the total population living in areas termed
“urban” by that country or by the UN. Countries define
urban in many different ways, from population centers
of 100 or more dwellings to only the population living in
national and provincial capitals.
Total Fertility Rate, Urban/RuralThe average number of children a woman would have
assuming that current age-specific birth rates remain
constant throughout her childbearing years (usually
considered to be ages 15 to 49).
Women Ages 15-19 Who Have Begun Childbearing, % Urban/RuralPercentage of women ages 15 to 19 who have had a
live birth or who are pregnant with their first child.
Population Below National Poverty Line, % Urban/RuralThe national poverty rate is the percentage of the
total population living below the national poverty line.
National poverty rates use a country specific poverty
line, reflecting the country’s economic and social
circumstances. In some cases, the national poverty line
is adjusted for different areas (such as urban and rural)
within the country, to account for differences in prices
or the availability of goods and services. Typically the
urban poverty line is set higher than the rural poverty
line, reflecting the relatively higher costs of living in
urban areas.
Employment in Agriculture, % of Total EmploymentPercentage of population employed in agriculture as
share of total employment. Agriculture also includes
hunting, fishing, and forestry.
Lower Secondary School Completion Rate, % Urban/RuralPercentage of young people ages 15-24, who have completed lower secondary school. Programs at this level are typically designed to build upon the basics of primary education and are usually organized around a more subject-oriented curriculum, introducing theoretical concepts across a broad range of subjects.
Antenatal Care (at least 4 visits), % Urban/RuralThe percentage of women ages 15 to 49 with a live birth in a given time period that received antenatal care by any provider (whether skilled or unskilled) four or more times during pregnancy.
Skilled Attendance at Delivery, % Urban/RuralPercentage of births attended by skilled personnel, including doctors, nurses, and midwives.
Children Under Age 5 Who Are Underweight, % Urban/RuralThe percentage of children ages 0 to 59 months who are below minus two standard deviations (-2 SD) from median weight-for-age of the World Health Organization (WHO) Child Growth Standards.
Infant Mortality Rate, Urban/RuralThe annual number of deaths of infants under age 1 per 1,000 live births.
Married Women Ages 15-49 Using Modern Contraception, % Urban/RuralThe percentage of currently married or “in-union” women ages 15 to 49 who are currently using a form of modern contraception. “Modern” methods include clinic and supply methods such as the pill, IUD, condom, and sterilization.
Unmet Need for Family Planning, % Urban/RuralWomen have an unmet need for family planning if they are married, fecund, of reproductive age (generally ages 15 to 49) and say they prefer to stop having children (limit their births) or want to wait two or more years to have another child (space their births), but are not using any method of contraception.
Demand for Family Planning Satisfied by Modern Methods, % Urban/RuralThe percentage of women (or their partners) who desire either to have no further children or to postpone the next child and who are currently using a modern contraceptive method. This indicator is calculated as modern contraceptive prevalence divided by total demand for family planning (contraceptive prevalence plus unmet need), and expressed as a percentage.
Population With Access to Improved Drinking Water Source, % Urban/RuralThe percentage of the population who use any of the following types of water supply for drinking: piped water into dwelling, plot or yard; public tap/standpipe; borehole/tube well; protected dug well; protected spring; rainwater collection and bottled water (if a secondary available source is also improved). Definitions and a detailed description of these facilities can be found at the WHO/UNICEF Joint Monitoring Programme for Water Supply and Sanitation at www.wssinfo.org.
Population With Access to Improved Sanitation Facility, % Urban/RuralPercentage of the population with access to facilities that hygienically separate human excreta from human contact. Improved facilities include flush/pour flush toilets or latrines connected to a sewer, septic tank, or pit; ventilated improved pit latrines; pit latrines with a slab or platform of any material which covers the pit entirely, except for the drop hole and composting toilets/latrines. Definitions and a detailed description of these facilities can be found at the WHO/UNICEF Joint Monitoring Programme for Water Supply and Sanitation at www.wssinfo.org.
NOTESMore developed regions, following the UN classification, comprise all of Europe and North America, plus Australia, Japan, and New Zealand. All other regions and countries are classified as less developed. The least developed countries consist of 48 countries with especially low indicators; 34 of these countries are in sub-Saharan Africa, 13 in Asia, and one in the Caribbean. The criteria and list of countries, as defined by the UN, can be found at www.unohrlls.org/about-ldcs/.
Some demographic and educational events may have taken place in rural settings where in-migrant urban women previously lived at the time of a given survey. These indicators include: total fertility rate, infant mortality, and lower secondary school completion.
SOURCESCarl Haub and Toshiko Kaneda, 2014 World Population Data Sheet (Washington, DC: Population Reference Bureau, 2014); United Nations Population Division, World Urbanization Prospects: The 2014 Revision (New York: UN, 2014); Demographic and Health Surveys (ICF International and national statistical offices); Reproductive Health Surveys (U.S. Centers for Disease Control and Prevention); Multiple Indicator Cluster Surveys (UNICEF); Pan-Arab Project for Family Health (PAPFAM); UNESCO World Inequality Database on Education (WIDE); United Nations Statistics Division, Millennium Development Goals Indicators Database; World Bank, World Development Indicators Database; and UNICEF Global Databases.
ACKNOWLEDGMENTSAuthor: Donna Clifton. Special thanks to Jason Bremner, Charlotte Feldman-Jacobs, Carl Haub, and Toshiko Kaneda of PRB; Yoonjoung Choi, Jane Ebot, Anthony Kolb, Madeleine Short, and Shelley Snyder from USAID; and Mark Montgomery from Population Council, for their insight and assistance. Design and Production: Prographics, Inc.
Photo credit, cover: © 2006 Vinoth Vijayaraghavan, Courtesy of Photoshare.
This publication is made possible by the generous support of the American people through the United States Agency for International Development (USAID) under the terms of the IDEA Project (No. AID-OAA-A-10-00009). The contents are the responsibility of the Population Reference Bureau and do not necessarily reflect the views of USAID or the United States Government.
© 2015 Population Reference Bureau. All rights reserved.
Definitions, Notes, Sources, and Acknowledgments
The POPULATION REFERENCE BUREAU informs people around the world about
population, health, and the environment, and empowers them to use that information to advance the
well-being of current and future generations.
INFORMPRB informs people around the world about issues related to population, health, and the environment. To do this, we transform technical data and research into accurate, easy-to-understand information.
INNOVATIVE TOOLS. DataFinder is a searchable database of hundreds of indicators for thousands of places.
INFLUENTIAL PUBLICATIONS. The World’s Youth 2013 Data Sheet provides a comprehensive portrait of the well-being of youth ages 10 to 24 across the globe, including such indicators as the current and projected size of youth populations, educational enrollments, labor force participation, marriage and fertility, and health risks and behaviors.
MULTIMEDIA. PRB has over 150 video and audio presentations with leading experts on topics as wide-ranging as climate change, immigration, HIV/AIDS, and female genital mutilation. Many videos include PowerPoint presentations shown during seminars and press briefings. Many ENGAGE presentations feature the Trendalyzer software created by Hans Rosling.
ONLINE RESOURCES. PRB’s website offers full text of all PRB publications, including our respected Population Bulletins, and data and analysis on world issues ranging from gender to aging to family planning.
EMPOWERPRB empowers people—researchers, journalists, policymakers, and educators—to use information about population, health, and the environment to encourage action. Frequently, people have information but lack the tools needed to communicate effectively to decisionmakers. PRB builds coalitions and conducts trainings to share techniques to inform policy.
JOURNALIST NETWORKS. PRB builds the capacity of journalists from developing countries through seminars and study tours. We organized several study tours for journalists in Uganda, Kenya, Tanzania, Indonesia, and Mali to visit projects and the people they affect.
POLICY COMMUNICATION TRAINING. In the past decade, PRB has trained more than 800 professionals in Asia, Africa, and Latin America. Each year, we sponsor two workshops with local partners, including Kenya’s National Council for Population and Development, training local and regional policymakers, program managers, research experts, and advocates.
COMMUNITIES OF PRACTICE. PRB is leading a new American Community Survey (ACS) Data Users Group to increase understanding and use of ACS data. This group shares information about key ACS data issues and applications through an online community forum, webinars, special sessions at professional meetings, and an annual conference.
ADVANCEPRB works to advance the well-being of current and future generations. Toward that end, we analyze data and research, disseminate information, and empower people to use that information to inform policymaking. While the numbers of publications created or workshops conducted are one way to measure PRB’s work, the creation of evidence-based policies, increased demand for health services, and active coalitions are better gauges of progress toward positive social change.
EVIDENCE-BASED POLICIES. PRB provides analysis for the KIDS COUNT Data Book, an annual report card on the well-being of children and families in the United States. The Data Book has helped promote the passage of several U.S. policies, including the State Children’s Health Insurance Program.
DEMAND FOR HEALTH SERVICES. Articles written as part of a media training effort in child marriage in Senegal led to the vice president of the National Assembly’s call for a study to understand and address this common and harmful practice.
ACTIVE COALITIONS. PRB works with the East Africa Population, Health, and Environment Network to increase information sharing across the region. The AFRICAPHE online discussion group improves access to information and capacity-building and funding opportunities.
1875 Connecticut Ave., NW, Washington, DC 20009 USA
tel. 202-483-1100 | fax 202-328-3937 | e-mail: [email protected] | website: www.prb.org
PRB on: @PRBdata