Embed Size (px)
Citation preview

The Transit Authority of the City of Omaha FINANCIAL STATEMENTS AND
INDEPENDENT AUDITOR’S REPORT For the year ended December 31, 2019

C O N T E N T S
Page INDEPENDENT AUDITOR’S REPORT ON THE FINANCIAL STATEMENTS
MANAGEMENT’S DISCUSSION AND ANALYSIS 1-7 GENERAL PURPOSE FINANCIAL STATEMENTS
Statements of Net Position 8 Statements of Revenues, Expenses, and Changes in Net Position 9 Statements of Cash Flows 10 Notes to Financial Statements 11-23
Required Supplementary Information Schedule of Changes in Net Pension Liability and Related Ratios – Salary Plan
24-25
Schedule of Employer Contributions – Salary Plan 26 Schedule of Investment Returns – Salary Plan 27 Schedule of Changes in Net Pension Liability and Related Ratios – Hourly Plan
28-29
Schedule of Employer Contributions – Hourly Plan 30 Schedule of Investment Returns – Hourly Plan 31
Supplementary Information
Schedule of Expenditures of Federal Awards 32 Notes to the Schedule of Expenditures of Federal Awards 33
INDEPENDENT AUDITOR’S REPORT ON INTERNAL CONTROL OVER FINANCIAL REPORTING AND ON COMPLIANCE AND OTHER MATTERS BASED ON AN AUDIT OF FINANCIAL STATEMENTS PERFORMED IN ACCORDANCE WITH GOVERNMENT AUDITING STANDARDS
34-35 INDEPENDENT AUDITOR’S REPORT ON COMPLIANCE FOR EACH MAJOR PROGRAM AND ON INTERNAL CONTROL OVER COMPLIANCE REQUIRED BY THE UNIFORM GUIDANCE
36-37 Schedule of Findings and Questioned Costs 38
Hamilton Associates, P.C. Certified Public Accountants
INDEPENDENT AUDITOR'S REPORT To the Board of Directors The Transit Authority of the City of Omaha Omaha, Nebraska
Report on the Financial Statements
We have audited the accompanying financial statements of The Transit Authority of the City of Omaha (the Transit Authority) as of and for the years ended December 31, 2019 and 2018, and the related notes to the financial statements, which collectively comprise the Transit Authority’s basic financial statements as listed in the table of contents.
Management’s Responsibility for the Financial Statements
Management is responsible for the preparation and fair presentation of these financial statements in accordance with accounting principles generally accepted in the United States of America; this includes the design, implementation, and maintenance of internal control relevant to the preparation and fair presentation of financial statements that are free from material misstatement, whether due to fraud or error.
Auditor’s Responsibility
Our responsibility is to express opinions on these financial statements based on our audits. We conducted our audits in accordance with auditing standards generally accepted in the United States of America and the standards applicable to financial audits contained in Government Auditing Standards, issued by the Comptroller General of the United States. Those standards require that we plan and perform the audit to obtain reasonable assurance about whether the financial statements are free from material misstatement.
An audit involves performing procedures to obtain audit evidence about the amounts and disclosures in the financial statements. The procedures selected depend on the auditor’s judgment, including the assessment of the risks of material misstatement of the financial statements, whether due to fraud or error. In making those risk assessments, the auditor considers internal control relevant to the entity’s preparation and fair presentation of the financial statements in order to design audit procedures that are appropriate in the circumstances, but not for the purpose of expressing an opinion on the effectiveness of the entity’s internal control. Accordingly, we express no such opinion. An audit also includes evaluating the appropriateness of accounting policies used and the reasonableness of significant accounting estimates made by management, as well as evaluating the overall presentation of the financial statements.
We believe that the audit evidence we have obtained is sufficient and appropriate to provide a basis for our audit opinions.
Opinion
In our opinion, the financial statements referred to above present fairly, in all material respects, the respective financial position of the Transit Authority, as of December 31, 2019 and 2018, and the respective changes in financial position and, where applicable, cash flows thereof for the years then ended in accordance with accounting principles generally accepted in the United States of America.
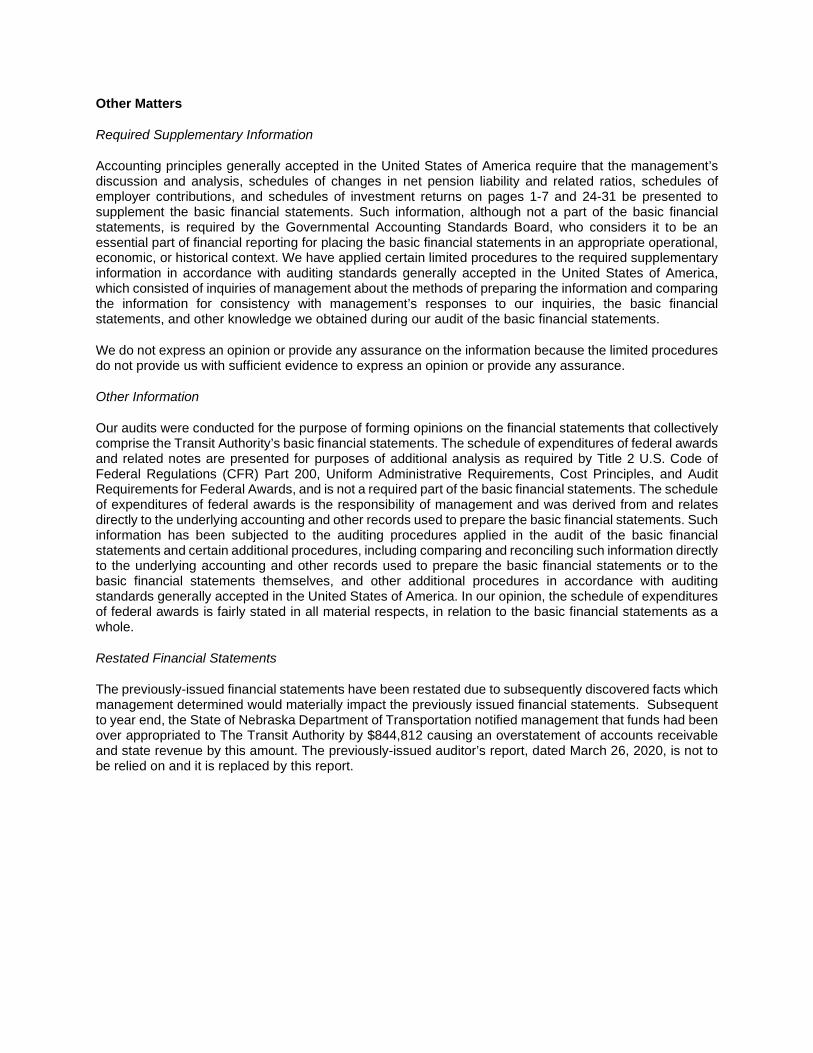
Other Matters
Required Supplementary Information
Accounting principles generally accepted in the United States of America require that the management’s discussion and analysis, schedules of changes in net pension liability and related ratios, schedules of employer contributions, and schedules of investment returns on pages 1-7 and 24-31 be presented to supplement the basic financial statements. Such information, although not a part of the basic financial statements, is required by the Governmental Accounting Standards Board, who considers it to be an essential part of financial reporting for placing the basic financial statements in an appropriate operational, economic, or historical context. We have applied certain limited procedures to the required supplementary information in accordance with auditing standards generally accepted in the United States of America, which consisted of inquiries of management about the methods of preparing the information and comparing the information for consistency with management’s responses to our inquiries, the basic financial statements, and other knowledge we obtained during our audit of the basic financial statements.
We do not express an opinion or provide any assurance on the information because the limited procedures do not provide us with sufficient evidence to express an opinion or provide any assurance.
Other Information
Our audits were conducted for the purpose of forming opinions on the financial statements that collectively comprise the Transit Authority’s basic financial statements. The schedule of expenditures of federal awards and related notes are presented for purposes of additional analysis as required by Title 2 U.S. Code of Federal Regulations (CFR) Part 200, Uniform Administrative Requirements, Cost Principles, and Audit Requirements for Federal Awards, and is not a required part of the basic financial statements. The schedule of expenditures of federal awards is the responsibility of management and was derived from and relates directly to the underlying accounting and other records used to prepare the basic financial statements. Such information has been subjected to the auditing procedures applied in the audit of the basic financial statements and certain additional procedures, including comparing and reconciling such information directly to the underlying accounting and other records used to prepare the basic financial statements or to the basic financial statements themselves, and other additional procedures in accordance with auditing standards generally accepted in the United States of America. In our opinion, the schedule of expenditures of federal awards is fairly stated in all material respects, in relation to the basic financial statements as a whole.
Restated Financial Statements
The previously-issued financial statements have been restated due to subsequently discovered facts which management determined would materially impact the previously issued financial statements. Subsequent to year end, the State of Nebraska Department of Transportation notified management that funds had been over appropriated to The Transit Authority by $844,812 causing an overstatement of accounts receivable and state revenue by this amount. The previously-issued auditor’s report, dated March 26, 2020, is not to be relied on and it is replaced by this report.

Other Reporting Required by Government Auditing Standards
In accordance with Government Auditing Standards, we have also issued our report dated May 27, 2020 on our consideration of the Transit Authority’s internal control over financial reporting and on our tests of its compliance with certain provisions of laws, regulations, contracts, and grant agreements and other matters. The purpose of that report is to describe the scope of our testing of internal control over financial reporting and compliance and the results of that testing, and not to provide an opinion on internal control over financial reporting or on compliance. That report is an integral part of an audit performed in accordance with Government Auditing Standards in considering the Transit Authority’s internal control over financial reporting and compliance.
Council Bluffs, Iowa May 27, 2020

THE TRANSIT AUTHORITY OF THE CITY OF OMAHA MANAGEMENT’S DISCUSSION AND ANALYSIS For the years ended December 31, 2019 and 2018
- 1 -
Introduction This management’s discussion and analysis of the financial performance of The Transit Authority of the City of Omaha (the “The Transit Authority”) provides an overview of the Transit Authority’s financial activities for the year ended December 31, 2019 as compared to December 31, 2018. It should be read in conjunction with the accompanying financial statements of the Transit Authority. Financial Highlights The Transit Authority’s net position increased in 2019 by $7,156,000 or 11.7%, this is a large increase for the Transit Authority and is due largely from the purchase of Revenue Vehicles and end design and construction of the BRT project. The increased net position amount is a favorable outcome since this reflects the financial outlook for the Transit Authority.
• The Transit Authority reported operating losses in 2019 of $32,520,049 as compared to the 2018 amount of $30,389,330 this is a 7% increase or $2,130,719 over the 2018 operating loss. The three main contributors to this increase is the following, revenue vehicle operations, casualty claims and depreciation expense. The revenues stayed relatively consistent between the years 2019 and 2018. The Transit Authority receives nonoperating revenues in the form of property taxes and governmental grants to support operations. Reporting an operating loss is consistent with the Transit Authority’s operating history, since the Transit Authority was formed and is operated primarily to provide public transportation to the residents of Omaha and the surrounding area and is subsidized to that end. The Transit Authority levies property taxes to provide sufficient resources to enable it to serve residents in the metropolitan area.
Total nonoperating revenues net effect increased by $2,018,546 or 7.9% in 2019 over the 2018 figure, a largest portion of this increased amount is the 2019 state operating grant and other local support. Using This Annual Report The Transit Authority’s financial statements consist of three statements - a statement of net position; a statement of revenues, expenses, and changes in net position; and a statement of cash flow. These statements provide information about the activities of the Transit Authority, including resources held by the Transit Authority but restricted for specific purposes by creditors, contributors, grantors or enabling legislation. The Transit Authority is accounted for as a business-type activity and presents its financial statements on the accrual basis of accounting using the economic resources measurement focus.

THE TRANSIT AUTHORITY OF THE CITY OF OMAHA MANAGEMENT’S DISCUSSION AND ANALYSIS For the years ended December 31, 2019 and 2018
- 2 -
The Statement of Net Position and Statement of Revenues, Expenses, and Changes in Net position One of the most important questions asked about any of the Transit Authority’s finances is “Is the Transit Authority as a whole better or worse off as a result of the year’s activities?” The Statement of Net Position and the Statement of Revenues, Expenses and Changes in Net Position report information about the Transit Authority’s resources and its activities in a way that helps answer this question. These statements include all restricted and unrestricted assets and all liabilities and deferred inflows and outflows of resources using the accrual basis of accounting. Using the accrual basis of accounting means that all of the current year’s revenues and expenses are taken into account regardless of when cash is received or paid. These two statements report the Transit Authority’s net position and changes in the amount. The Transit Authority’s total net position, the difference between assets, liabilities, and deferred inflows and outflows of resources, is one measure of the Transit Authority’s financial health or financial position. Over time, increases or decreases in the Transit Authority’s net position is an indicator of whether its financial health is improving or deteriorating. Other nonfinancial factors, such as changes in legislation and regulations, measures of the quantity and quality of services provided to its passengers, and local economic factors should also be considered to assess the overall financial health of the Transit Authority. The Statement of Cash Flows The Statement of Cash Flows reports cash receipts, cash payments and net changes in cash and cash equivalents resulting from four defined types of activities. It provides answers to such questions as where did cash come from, what was cash used for and what was the change in cash and cash equivalents during the reporting period. The Transit Authority’s Net Position The Transit Authority’s net position is the difference between its assets, liabilities, and deferred inflows of resources reported in the Statement of Net Position. The Transit Authority’s net position increased in 2019 by $8,000,812 or 13.1% over 2018, this increase in the Transit Authority’s Net Position is due to the large increase in capital assets or the purchasing of the new Revenue Vehicles. Refer to Table 1.

THE TRANSIT AUTHORITY OF THE CITY OF OMAHA MANAGEMENT’S DISCUSSION AND ANALYSIS For the years ended December 31, 2019 and 2018
- 3 -
Table 1: Assets, Liabilities and Net position
2019 2018
AssetsCash and investments 6,562,261$ 8,698,532$ Other current assets 28,784,637 28,635,154 Capital assets, net 58,773,936 52,174,371 Other noncurrent assets 91,386 97,662
Total assets 94,212,220$ 89,605,719$
Deferred Outflows Of ResourcesPension related deferred outflows 449,016$ 2,089,800$
Liabilities and Net PositionCurrent liabilities
Accounts payable 5,008,710$ 7,073,409$ Accrued wages and vacation payable 995,369 994,382 Other accrued salaries and related 616,075 640,519 Accrued expenses 299,666 357,754 Claims liability 1,642,824 1,189,165
Total current liabilities 8,562,644$ 10,255,229$
Noncurrent liabiltiesNet pension liability 12,387,979 15,998,802 Other post employment benefits 230,333 248,333
Total noncurrent liabilities 12,618,312 16,247,135$
Total liabilities 21,180,956$ 26,502,364$
Deferred Inflows Of ResourcesPension related deferred inflows 5,258,617$ 4,127,492$
Net AssetsNet investment in capital assets 55,060,555$ 46,239,604$ Restricted 2,372,547 2,357,332 Unrestricted 10,788,561 12,468,727
Total net position 68,221,663$ 61,065,663$
Transit Authority continues to capture allowable operating costs and capitalizes these expenditures in the annual appropriation of the 5307 FTA Formula funds. These funds are being invested while giving the Transit Authority a greater means of working capital. The 2019 operating expenses had an increase over what was reported in 2018 the amount increased by $2,055,238 or 5.8% over 2018, a significant amount of the increase is the additional depreciation expense calculated on the new Revenue Vehicles. The Transit Authority is continuing to be more effective in the managing of grant funds and controlling operating expenses in order to keep them at a minimum. Refer to Table 2.

THE TRANSIT AUTHORITY OF THE CITY OF OMAHA MANAGEMENT’S DISCUSSION AND ANALYSIS For the years ended December 31, 2019 and 2018
- 4 -
Table 2: Operating Results and Changes in Net Assets 2019 2018
Operating RevenuesPassenger fares 3,296,824$ 3,417,993$ Service contracts 949,430 886,644 Other 458,702 475,800
Total operating revenues 4,704,956$ 4,780,437$
Operating ExpensesAdministration of transportation operations 616,099$ 831,906$ Revenue vehicle movement control 944,842 893,323 Scheduling of transportation operations 122,531 114,274 Revenue vehicle operations 16,654,009 16,975,784 Maintenance administration 523,819 473,161 Servicing revenue vehicles 833,025 839,010 Maintenance revenue vehicles 3,475,100 3,309,206 Maintenance of other equipment 1,127,393 1,045,325 Ticketing and fare collection 80,252 97,807 Customer services and promotion 698,119 677,737 Personnel, legal and insurance 1,977,809 1,643,663 Finance, accounting and data processing 672,646 639,672 Purchasing and stores 143,763 155,756 General management 442,357 432,126 M.A.P.A activities 124,401 167,680 General and administrative 617,448 593,818 Depreciation 8,171,392 6,279,519
Total operating expenses 37,225,005$ 35,169,767$
Operating (loss) income (32,520,049) (30,389,330)
Nonoperating revenues (expenses)Property taxes 18,578,467$ 17,936,529$ Federal operating grants 5,895,806 5,533,560 State operating grants 2,563,148 2,043,746 Other support and revenue 500,000 - Investment income 66,503 81,093 Gain (loss) on disposal of capital assets 18,250 8,700
Nonoperating revenues, net 27,622,174$ 25,603,628$
Income (loss) before capital contributions (4,897,875)$ (4,785,702)$ Capital contributions 12,053,875 16,724,970 Increase (decrease) in net assets 7,156,000 11,939,268 Net assets, beginning of year 61,065,663 49,126,395 Net assets, end of year 68,221,663$ 61,065,663$
THE TRANSIT AUTHORITY OF THE CITY OF OMAHA MANAGEMENT’S DISCUSSION AND ANALYSIS For the years ended December 31, 2019 and 2018
- 5 -
Operating Losses The first component of the overall change in the Transit Authority’s net position is its operating income or loss - generally, the difference between net passenger service and other operating revenues and the expenses incurred to perform those services. In each of the past two years, the Transit Authority has reported an operating loss. As previously stated, this is consistent with the Transit Authority’s operating history as the Transit Authority was formed and is operated primarily to provide public transportation to the residents of Omaha and the surrounding area and is subsidized to that end. The Transit Authority levies property taxes to provide sufficient resources to enable it to serve residents in the metropolitan area. The operating loss for 2019 increased compared to 2018 by $2,130,719 or 7%. As you can see from the tables, there is a slight decrease in operating revenues of 1.6% or $75,481 between 2019 and 2018. The large increase in operating expenses between 2019 and 2018 is the increase in the following: casualty claims and depreciation expense, which is the net cause of the increased operating loss. The Transit Authority is a labor intensified industry with employee costs in salaries, wages, and fringe benefits amounting to the majority of the total operating expenses in 2019 as well as previous years. Nonoperating Revenues Nonoperating revenues consist primarily of property taxes levied by the Transit Authority, federal and state operating grants, and investment income. Nonoperating revenues increased in 2019 by $2,018,546 or 7.9% over 2018. The majority of the increase is seen in Property Taxes, State Operating Grants, and Other support and revenue. The Transit Authority’s Cash Flows Increased changes in the Transit Authority’s cash flows are due mainly to the utilization of the grant activities and the more efficient collection of receivables. Net cash used in operating activities decreased by $137,272 in 2019 or 0.6% as compared to the 2018 amounts. As discussed earlier, better utilization of federal grants continues to provide an increase in cash and investments giving the Transit Authority better working capital. Emphasis has been placed on how the Transit Authority has managed its cash to increase working capital. Working capital is the value of a company’s current assets minus its current liabilities and deferred inflows/outflows of resources. It is considered a good measure of both a company’s efficiency and its financial health. Working capital has remained fairly consistent for the last several years.

THE TRANSIT AUTHORITY OF THE CITY OF OMAHA MANAGEMENT’S DISCUSSION AND ANALYSIS For the years ended December 31, 2019 and 2018
- 6 -
Table 3: Statement of Cash Flows 2019 2018
Operating Activities
Received from customers and users 4,649,466$ 4,741,175$ Payments to suppliers (11,819,223) (11,989,677) Payments to employees (16,887,393) (16,945,920) Net cash used in operating activities: (24,057,150)$ (24,194,422)$
Noncapital Financial ActivitiesState grants 1,081,116 2,658,338 Federal grants 5,738,185 4,262,285 Property taxes received 18,080,819 16,546,829 Net cash provided by (used in)
noncapital financing activities 24,900,120 23,467,452
Capital and Related Financing ActivitiesPurchase of capital assets (17,746,120)$ (15,483,415)$ Proceeds on sale of capital assets 18,250 8,700 Other support and revenue received 500,000 - Federal capital grants received 14,182,126 13,735,405
Net cash provided by (used in) capital and related financing activities (3,045,744)$ (1,739,310)$
Investing ActivitiesInterest income received 66,503$ 81,093$
Net cash provided by investing activities 66,503$ 81,093$
Net Increase (Decrease) in Cash (2,136,271)$ (2,385,187)$
Cash - Beginning of Year 8,698,532 11,083,719
Cash - End of Year 6,562,261$ 8,698,532$
Provided by Operating Activities:Operating income (loss) (32,520,049)$ (30,389,330)$ Adjustments to reconcile operating income to net cash provided by operating activities:
Depreciation 8,171,392 6,279,519 Loss on disposal of assets 82,632 - Changes in assets and liabilities:
Change in receivables (3,678) (53,072) Change in inventory (97,809) (25,481) Change in prepaid and other assets (32,669) (39,713) Change in deferred outflows of resources 1,640,784 (1,566,372) Change in accounts payable and prepaid expenses 1,181,945 328,284 Change in net pension liability (3,610,823) 3,317,365 Change in deferred inflows of resources 1,131,125 (2,045,622)
Net cash provided by (used in) operating activities (24,057,150)$ (24,194,422)$

THE TRANSIT AUTHORITY OF THE CITY OF OMAHA MANAGEMENT’S DISCUSSION AND ANALYSIS For the years ended December 31, 2019 and 2018
- 7 -
Capital Assets The Transit Authorities procured a total of $17,253,302 in 2019 capital assets as compared to the 2018 amount of $14,660,691. In 2019 the Transit Authority purchased ten new revenue vehicles. There is continued engineering and design on the BRT project, ORBT bus shelters and the installation of AVL and MyRide. Other Economic Factors A large segment of ridership is comprised of individuals subsidized by state and local agencies. Government and Social Service agencies’ purchases of bus tickets continue to increase each year. The Transit Authority is always looking at new ways to attract new riders and increase ridership. Contacting the Transit Authority's Financial Management This financial report is designed to provide a general overview of the Transit Authority's finances and to show the Transit Authority's accountability for the money it receives. Questions about this report and requests for additional financial information should be directed to the Transit Authority's Finance Director or Executive Director by telephoning (402) 341-7560 or emailing [email protected] or [email protected].

THE TRANSIT AUTHORITY OF THE CITY OF OMAHA
STATEMENTS OF NET POSITION December 31, 2019 and 2018
- 8 -
ASSETS 2019 2018
CURRENT ASSETSCash and cash equivalents (Note 2) 6,562,261$ 8,698,532$ Accounts and grants receivable 9,876,589 10,361,509 Property taxes receivable 17,487,261 16,989,612 Materials and supplies inventory 931,040 833,231 Prepaid expenses and other 489,747 450,802
Total current assets 35,346,898$ 37,333,686$
CAPITAL ASSETS, NET (Note 3) 58,773,936 52,174,371
OTHER ASSETS 91,386 97,662
Total assets 94,212,220$ 89,605,719$
DEFERRED OUTFLOWS OF RESOURCES
Pension related deferred outflows (Note 5) 449,016$ 2,089,800$
LIABILITIES
CURRENT LIABILITIES Accounts payable 5,008,710$ 7,073,409$ Accrued wages and vacation payable 995,369 994,382 Other accrued salaries and related 616,075 640,519 Accrued expenses 299,666 357,754 Claim liabilities (Note 7) 1,642,824 1,189,165
Total current liabilities 8,562,644$ 10,255,229$ NONCURRENT LIABILITIES
Net pension liability (Note 5) 12,387,979$ 15,998,802$ Other employee benefits payable (Note 6) 230,333 248,333
Total noncurrent liabilities 12,618,312$ 16,247,135$
Total liabilities 21,180,956$ 26,502,364$
DEFERRED INFLOWS OF RESOURCES
Pension related deferred inflows (Note 5) 5,258,617$ 4,127,492$
NET POSITION
Net investment in capital assets 55,060,555$ 46,239,604$ Restricted (Note 4) 2,372,547 2,357,332 Unrestricted 10,788,561 12,468,727
Total net position 68,221,663$ 61,065,663$
See Notes to Financial Statements

THE TRANSIT AUTHORITY OF THE CITY OF OMAHA
STATEMENTS OF REVENUES, EXPENSES, AND CHANGES IN NET POSITION For the years ended December 31, 2019 and 2018
- 9 -
2019 2018
OPERATING REVENUESPassenger fares 3,296,824$ 3,417,993$ Service contracts 949,430 886,644 Other 458,702 475,800
Total operating revenues 4,704,956$ 4,780,437$
OPERATING EXPENSESAdministration of transportation operations 616,099$ 831,906$ Revenue vehicle movement control 944,842 893,323 Scheduling of transportation operations 122,531 114,274 Revenue vehicle operations 16,654,009 16,975,784 Maintenance administration 523,819 473,161 Servicing revenue vehicles 833,025 839,010 Maintenance of revenue vehicles 3,475,100 3,309,206 Maintenance of other equipment 1,127,393 1,045,325 Ticketing and fare collection 80,252 97,807 Customer services and promotion 698,119 677,737 Personnel, legal and insurance 1,977,809 1,643,663 Finance, accounting and data processing 672,646 639,672 Purchasing and stores 143,763 155,756 General management 442,357 432,126 M.A.P.A activities 124,401 167,680 General and administrative 617,448 593,818 Depreciation 8,171,392 6,279,519
Total operating expenses 37,225,005$ 35,169,767$
Operating (loss) income (32,520,049)$ (30,389,330)$
NONOPERATING REVENUES (EXPENSES)Property taxes 18,578,467$ 17,936,529$ Federal operating grants 5,895,806 5,533,560 State operating grants 2,563,148 2,043,746 Other support and revenue 500,000 - Investment income 66,503 81,093 Gain (loss) on disposal of capital assets 18,250 8,700
Nonoperating revenues, net 27,622,174$ 25,603,628$
LOSS BEFORE CAPITAL CONTRIBUTIONS (4,897,875)$ (4,785,702)$
CAPITAL CONTRIBUTIONS 12,053,875$ 16,724,970$
Change in net position 7,156,000$ 11,939,268$
NET POSITION - BEGINNING 61,065,663$ 49,126,395$
NET POSITION - END OF YEAR 68,221,663$ 61,065,663$
See Notes to Financial Statements

THE TRANSIT AUTHORITY OF THE CITY OF OMAHA
STATEMENTS OF CASH FLOWS For the years ended December 31, 2019 and 2018
- 10 -
2019 2018
CASH FLOWS FROM OPERATING ACTIVITIESCash received from customers 4,649,466$ 4,741,175$ Cash paid to suppliers (11,819,223) (11,989,677) Cash paid to employees (16,887,393) (16,945,920)
Net cash provided by (used in) operating activities: (24,057,150)$ (24,194,422)$
CASH FLOWS FROM NONCAPITAL FINANCING ACTIVITIES State grants received 1,081,116 2,658,338 Federal grants received 5,738,185 4,262,285 Property taxes received 18,080,819 16,546,829
Net cash provided by (used in) noncapital financing activities 24,900,120$ 23,467,452$
CASH FLOWS FROM CAPITAL AND RELATED FINANCING ACTIVITIES Purchase of capital assets (17,746,120)$ (15,483,415)$ Proceeds on sale of capital assets 18,250 8,700 Other support and revenue received 500,000 - Federal capital grants received 14,182,126 13,735,405
Net cash provided by (used in) capital and related financing activities (3,045,744)$ (1,739,310)$
CASH FLOWS FROM INVESTING ACTIVITIESInterest income received 66,503$ 81,093$
Net cash provided by (used in) investing activities 66,503$ 81,093$
NET INCREASE (DECREASE) IN CASH (2,136,271)$ (2,385,187)$
CASH - BEGINNING OF YEAR 8,698,532 11,083,719
CASH - END OF YEAR 6,562,261$ 8,698,532$
RECONCILIATION TO BALANCE SHEETSCash 6,562,261$ 8,698,532$
RECONCILIATION OF OPERATING INCOME TO NET CASH PROVIDED BY OPERATING ACTIVITIES:
Operating income (loss) (32,520,049)$ (30,389,330)$ Adjustments to reconcile operating income to net cash provided by (used in) operating activities:
Depreciation 8,171,392 6,279,519 Loss on disposal of assets 82,632 - Changes in assets and liabilities:
(Increase) Decrease in receivables (3,678) (53,072) (Increase) Decrease in inventory (97,809) (25,481) (Increase) Decrease in prepaid and other assets (32,669) (39,713) (Increase) Decrease in deferred outflows of resources 1,640,784 (1,566,372) Increase (Decrease) in accounts payable and accrued expenses 1,181,945 328,284 Increase (Decrease) in net pension liability (3,610,823) 3,317,365 Increase (Decrease) in deferred inflows of resources 1,131,125 (2,045,622)
Net cash provided by (used in) operating activities (24,057,150)$ (24,194,422)$
SUPPLEMENTAL CASH FLOWS INFORMATIONAccounts payable incurred for purchase of property and equipment 3,042,237$ 5,934,767$
See Notes to Financial Statements

THE TRANSIT AUTHORITY OF THE CITY OF OMAHA
NOTES TO FINANCIAL STATEMENTS Years ended December 31, 2019 and 2018
- 11 -
1. Nature of Operations and Summary of Significant Accounting Policies
The Transit Authority of the City of Omaha (the Transit Authority) operates a timed-transfer system offering fixed, express/commuter and circulator route services. The Transit Authority serves 100 square miles or approximately 85% of the City of Omaha. In addition, the Transit Authority offers MOBY, American with Disabilities Act complementary Para the Transit service. MOBY is an origin-to destination, curb-to-curb service operation within Omaha's city limits.
Reporting Entity:
The Transit Authority, a public benefit corporation, was created by the City of Omaha, Nebraska, by Ordinance No. 26335 on May 10, 1972, under statutes of Nebraska known as the Transit Authority Law. The Transit Authority is an independent political subdivision of the State of Nebraska. As a political subdivision, it is distinct from, and is not an agency of, the State of Nebraska or any other local governmental unit. The Transit Authority has the right to eminent domain and the power to enter into contracts and to purchase equipment. The Transit Authority consists of a five-member board appointed by the mayor and confirmed by Omaha's City Council and the County Board of Douglas County, Nebraska. The Transit Authority is solely responsible for financing deficits or the disposition of surplus funds. The Transit Authority collects revenues, controls disbursements and has title to all assets. The Transit Authority has and retains full and exclusive jurisdiction and control over all public passenger transportation systems in the City of Omaha, excluding taxicabs and railroad systems. The transit service outside of the Omaha city limits is provided by contractual agreement between the Transit Authority and the respective political jurisdictions and agencies. Basis of Accounting:
The financial statements of the Transit Authority have been prepared in conformity with accounting principles generally accepted in the United States of America (GAAP) as applied to governmental units. The Governmental Accounting Standards Board (GASB) is the accepted standard setting body for establishing governmental accounting and financial reporting principles. The Transit Authority's financial statements consist of a single-purpose business type activity which is reported on the accrual basis of accounting using the economic resources measurement focus. Revenues are recognized in the period they are earned and expenses are recognized in the period they are incurred. The Transit Authority is not subject to federal or state income taxes. Use of Estimates:
The preparation of financial statements in conformity with accounting principles generally accepted in the United States of America requires management to make estimates and assumptions that affect the reported amounts of assets and liabilities and disclosure of contingent assets and liabilities at the date of the financial statements and the reported amounts of revenues, expenses and other changes in net position during the reporting period. Significant estimates include the assumptions used in computing the Transit Authority's pension benefit obligation. Actual results could differ from those estimates. Cash Equivalents: The Transit Authority considers all liquid investments with original maturities of three months or less to be cash equivalents. At December 31, 2019 and 2018, cash equivalents consisted primarily of money market accounts with a bank.
THE TRANSIT AUTHORITY OF THE CITY OF OMAHA
NOTES TO FINANCIAL STATEMENTS Years ended December 31, 2019 and 2018
- 12 -
1. Nature of Operations and Summary of Significant Accounting Policies – Continued Certificates of Deposit and Investment Income:
Investments in nonnegotiable certificates of deposit are carried at cost. Investment income consists of interest income. Accounts, Grants and Property Taxes Receivable: Accounts receivable consist of amounts due from customers for the Transit services, accrued interest and various other items. Grants receivable consist of amounts due from the federal and state government under grant contracts as reimbursement for funds expended in accordance with those grant agreements. Tax collections receivable consist of uncollected property taxes. The Transit Authority has evaluated outstanding receivables and determined that no allowance is necessary at December 31, 2019 and 2018. Materials and Supplies Inventory: Materials and supplies are stated at the lower of cost (first-in, first-out method) or market. Inventory generally consists of maintenance parts and supplies for rolling stock and other miscellaneous items. Capital Assets:
Assets which cost $5,000 or more, and with a useful life of more than one year, are capitalized in the year they are placed in service. Capital assets are recorded at cost, or if contributed property, at their fair value at the time of contribution. Costs of maintenance and repairs are charged to operations as incurred; costs of improvements are capitalized and depreciated over the remaining useful lives of the related assets. The Transit Authority computes depreciation using the straight-line method over the estimated useful lives of the assets as follows:
Building and improvements 3 - 40 years Motor coaches 2 - 12 years Service cars and other equipment 3 - 7 years
Accrued Vacation Pay:
The Transit Authority policies permit most employees to accumulate vacation benefits that may be realized as paid time off. Under the terms of the Operating Policy, employees of the Transit Authority are granted vacation varying from one to five weeks based upon length of service. Expense and related liability for accrued vacation pay is earned in the current year to be used in the following year. There is no carryover of unused vacation. Accrued vacation pay is computed using the regular pay rates in effect at the statement of net position date plus an additional amount for compensation-related payments such as pension, social security and Medicare taxes computed using rates in effect at that date.
THE TRANSIT AUTHORITY OF THE CITY OF OMAHA
NOTES TO FINANCIAL STATEMENTS Years ended December 31, 2019 and 2018
- 13 -
1. Nature of Operations and Summary of Significant Accounting Policies – Continued
Net Position: Net position is required to be classified into three components – net investment in capital assets, restricted, and unrestricted. These classifications are defined as follows:
Net investment in capital assets – This component of net position consists of capital assets, net of accumulated depreciation and costs to be recovered from future revenues, reduced by the outstanding balances of any bonds, mortgages, notes, or other borrowings that are attributable to the acquisition, construction, or improvement of those assets. If there are significant unspent related debt proceeds at year-end, the portion of the debt attributable to the unspent proceeds is not included in the calculation of net investment in capital assets. Restricted – This component of net position consists of constraints placed on net position use through external constraints imposed by creditors (such as through debt covenants), contributors, or law or regulations of other governments or constraints imposed by law through constitutional provisions or enabling legislation. Unrestricted – This component of net position consists of net position that do not meet the definition of "restricted" or "net investment in capital assets." When both restricted and unrestricted resources are available for use, it is the Transit Authority's policy to use restricted resources first, then unrestricted resources as they are needed.
Revenue Recognition:
Operating revenues occur from passenger fares, service contracts, rental of property, and sale of advertising space. Operating expenses include the cost of sales and service, administrative expenses and depreciation on capital assets. All revenue and expenses not meeting this definition are reported as non-operating revenues and expenses. Resources received or recognized as receivable before time requirements are met, are reported as deferred revenues.
Passenger fares are recorded as revenue at the time the service is provided. Property taxes are recognized as revenues in the year for which they are levied.
The Transit Authority recognizes federal and state grant income when eligibility requirements are met. The Federal Transit Administration ("FTA") and the State of Nebraska provide financial assistance and distribute grants directly to the Transit Authority for operations and acquisition of property and equipment. Operating grants made on the basis of entitlement periods are recorded as grant receivables and revenues over the entitlement periods, based on qualifying expenditures. Capital grants for the acquisition of property and equipment (reimbursement type grants) are recorded as grant receivables when the related grant expenditures are incurred.
Property Taxes:
The tax levies for all political subdivisions in Douglas County are certified by the county board on or before October 15. Real estate taxes are due and become an enforceable lien on property on December 31. The first half of the real estate taxes becomes delinquent on April 1 and the second half become delinquent on August 1 following the levy date. Personal property taxes are due on December 31 and become delinquent on April 1 and August 1 following the levy date. Delinquent taxes bear 14% interest.

THE TRANSIT AUTHORITY OF THE CITY OF OMAHA
NOTES TO FINANCIAL STATEMENTS Years ended December 31, 2019 and 2018
- 14 -
2. Cash and Cash Equivalents
Custodial credit risk is the risk that in the event of a bank failure, a government's deposits may not be returned to it. The Transit Authority's deposit policy for custodial credit risk requires compliance with the provisions of state law. As of December 31, 2019, and 2018, the Transit Authority’s banks of deposit and money market balances were $5,770,968 and $8,458,090, respectively. As of December 31, 2019, and 2018, the amounts were fully insured or collateralized with collateral in the Transit Authority’s name. State law requires collateralization of all deposits with federal depository insurance; bonds and other obligations of the U.S. Treasury, U.S. agencies or instrumentalities of the state of Nebraska; bonds of any city, county, school district or special road district of the state of Nebraska; bonds or obligations of another state, or political subdivision of another state, which are rated within the two highest classifications of prime by at least one of the standard rating services; or a surety bond having an aggregate value at least equal to the amount of deposits. The carrying values of cash and deposits are included in the balance sheets as follows:
2019 2018 Carrying value:
Deposits $ 5,503,799 $ 7,853,649 Cash at County Treasurer 1,058,462 844,883
$ 6,562,261 $ 8,698,532
Investment income for the year ended December 31, 2019 and 2018, consisted of interest income of $66,503 and $81,093, respectively.
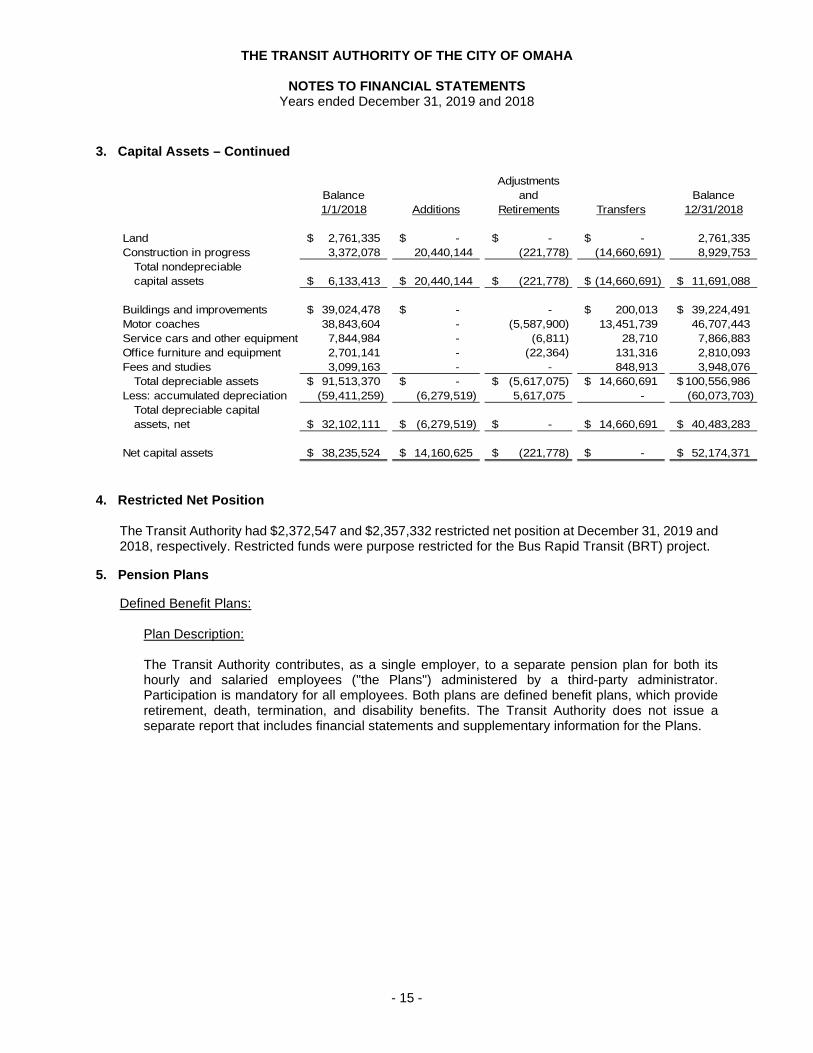
3. Capital Assets
Capital assets activity for the year ended December 31, 2019 and 2018, was:
Balance Balance1/1/2019 Additions 12/31/2019
Land 2,761,335$ -$ -$ 67,000.00$ 2,828,335 Construction in progress 8,929,753 14,961,802 (108,213) (17,253,302) 6,530,040
Total nondepreciable capital assets 11,691,088$ 14,961,802$ (108,213)$ (17,186,302)$ 9,358,375$
Buildings and improvements 39,224,491$ -$ - 1,712,187$ 40,936,678$ Motor coaches 46,707,443 - (7,967,029) 4,119,560 42,859,974 Service cars and other equipment 7,866,883 - (27,228) 2,032,840 9,872,495 Office furniture and equipment 2,810,093 - (31,067) 2,927,197 5,706,223 Fees and studies 3,948,076 - - 6,394,518 10,342,594
Total depreciable assets 100,556,986$ -$ (8,025,324)$ 17,186,302$ 109,717,964$ Less: accumulated depreciation (60,073,703) (8,171,392) 7,942,692 - (60,302,403)
Total depreciable capital assets, net 40,483,283$ (8,171,392)$ (82,632)$ 17,186,302$ 49,415,561$
Net capital assets 52,174,371$ 6,790,410$ (190,845)$ -$ 58,773,936$
Transfers
Adjustments and
Retirements
THE TRANSIT AUTHORITY OF THE CITY OF OMAHA
NOTES TO FINANCIAL STATEMENTS Years ended December 31, 2019 and 2018
- 15 -
3. Capital Assets – Continued
Balance Balance1/1/2018 Additions 12/31/2018
Land 2,761,335$ -$ -$ -$ 2,761,335 Construction in progress 3,372,078 20,440,144 (221,778) (14,660,691) 8,929,753
Total nondepreciable capital assets 6,133,413$ 20,440,144$ (221,778)$ (14,660,691)$ 11,691,088$
Buildings and improvements 39,024,478$ -$ - 200,013$ 39,224,491$ Motor coaches 38,843,604 - (5,587,900) 13,451,739 46,707,443 Service cars and other equipment 7,844,984 - (6,811) 28,710 7,866,883 Office furniture and equipment 2,701,141 - (22,364) 131,316 2,810,093 Fees and studies 3,099,163 - - 848,913 3,948,076
Total depreciable assets 91,513,370$ -$ (5,617,075)$ 14,660,691$ 100,556,986$ Less: accumulated depreciation (59,411,259) (6,279,519) 5,617,075 - (60,073,703)
Total depreciable capital assets, net 32,102,111$ (6,279,519)$ -$ 14,660,691$ 40,483,283$
Net capital assets 38,235,524$ 14,160,625$ (221,778)$ -$ 52,174,371$
Transfers
Adjustments and
Retirements
4. Restricted Net Position
The Transit Authority had $2,372,547 and $2,357,332 restricted net position at December 31, 2019 and 2018, respectively. Restricted funds were purpose restricted for the Bus Rapid Transit (BRT) project.
5. Pension Plans
Defined Benefit Plans: Plan Description:
The Transit Authority contributes, as a single employer, to a separate pension plan for both its hourly and salaried employees ("the Plans") administered by a third-party administrator. Participation is mandatory for all employees. Both plans are defined benefit plans, which provide retirement, death, termination, and disability benefits. The Transit Authority does not issue a separate report that includes financial statements and supplementary information for the Plans.
THE TRANSIT AUTHORITY OF THE CITY OF OMAHA
NOTES TO FINANCIAL STATEMENTS Years ended December 31, 2019 and 2018
- 16 -
5. Pension Plans – Continued
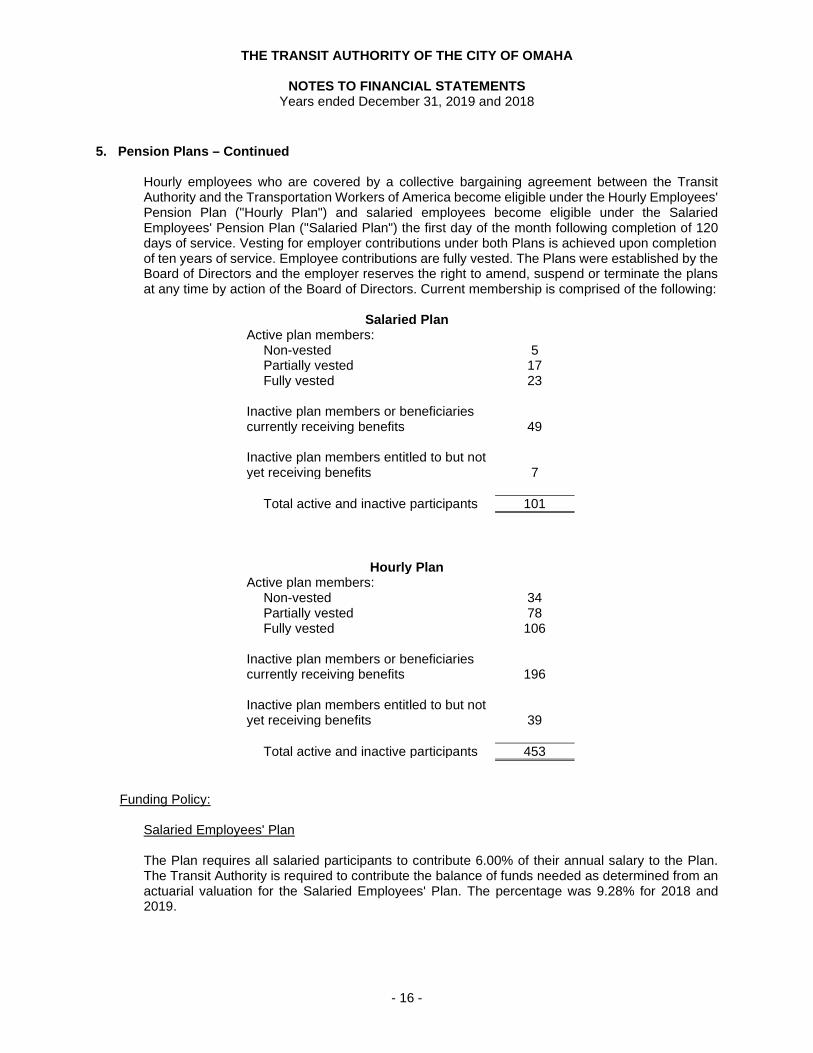
Hourly employees who are covered by a collective bargaining agreement between the Transit Authority and the Transportation Workers of America become eligible under the Hourly Employees' Pension Plan ("Hourly Plan") and salaried employees become eligible under the Salaried Employees' Pension Plan ("Salaried Plan") the first day of the month following completion of 120 days of service. Vesting for employer contributions under both Plans is achieved upon completion of ten years of service. Employee contributions are fully vested. The Plans were established by the Board of Directors and the employer reserves the right to amend, suspend or terminate the plans at any time by action of the Board of Directors. Current membership is comprised of the following:
Salaried Plan Active plan members:
Non-vested 5 Partially vested 17 Fully vested 23
Inactive plan members or beneficiaries currently receiving benefits
49
Inactive plan members entitled to but not yet receiving benefits
7
Total active and inactive participants 101
Hourly Plan Active plan members:
Non-vested 34 Partially vested 78 Fully vested 106
Inactive plan members or beneficiaries currently receiving benefits
196
Inactive plan members entitled to but not yet receiving benefits
39
Total active and inactive participants 453
Funding Policy: Salaried Employees' Plan
The Plan requires all salaried participants to contribute 6.00% of their annual salary to the Plan. The Transit Authority is required to contribute the balance of funds needed as determined from an actuarial valuation for the Salaried Employees' Plan. The percentage was 9.28% for 2018 and 2019.

THE TRANSIT AUTHORITY OF THE CITY OF OMAHA
NOTES TO FINANCIAL STATEMENTS Years ended December 31, 2019 and 2018
- 17 -
5. Pension Plans – Continued Funding Policy-Continued:
Hourly Employees' Plan
The Plan requires all salaried participants to contribute 7.00% of their annual salary to the Plan. The Transit Authority is required to contribute 7.50% of the hourly participant’s annual salary to the Plan.
Funded Status and Funding Progress:
Salaried Employees’ Plan At December 31, 2019, the measurement date, based on a valuation date of January 1, 2019, the Plan was 83.57% funded. The actuarial accrued liability for benefits was $9,635,341 and the actuarial value of assets was $8,051,883 resulting in a net pension liability (NPL) of $1,583,458. The covered payroll (payroll on which contributions to a pension plan are based) was $2,645,012 and the ratio of the NPL to covered payroll was 59.87%. Expected real rates of return are determined by subtracting expected inflation from expected rates of return. Expected real rates of return for each major asset class and asset allocation as of December 31, 2019, are as summarized in the following table:
Asset Class
Target Allocation
Long-Term Expected Real Rate of Return
US Cash 2% 0.15% US Core Fixed Income 38% 1.85% US Equity Market 55% 4.63% Non-US Equity 5% 6.15%
Hourly Employees’ Plan
At December 31, 2019, the measurement date, based on a valuation date of January 1, 2019, the Plan was 70.60% funded. The actuarial accrued liability was $36,755,425 and the actuarial value of assets was $25,950,904 resulting in a net pension liability of $10,804,521. The covered payroll was $11,485,056 and the ratio of the NPL to covered payroll was 94.07%. Expected real rates of return are determined by subtracting expected inflation from expected rates of return. Expected real rates of return for each major asset class and asset allocation as of December 31, 2019, are as summarized in the following table:
Asset Class
Target Allocation
Long-Term Expected Real Rate of Return
US Cash 2% 0.15% US Core Fixed Income 38% 1.85% US Equity Market 55% 4.63% Non-US Equity 5% 6.15%

THE TRANSIT AUTHORITY OF THE CITY OF OMAHA
NOTES TO FINANCIAL STATEMENTS Years ended December 31, 2019 and 2018
- 18 -
5. Pension Plans – Continued
Annual Pension Cost and Net Pension Obligation:
The Transit Authority's changes in net pension liability are as follows:
Salary Plan
Balances at 12/31/17 9,116,088$ 7,486,118$ 1,629,970$ Charges for the year:
Service cost 179,772 - 179,772 Interest on total pension liability 609,316 - 609,316 Effect of economic/demographic
gains or losses 93,312 - 93,312 Benefit payments (546,859) (546,859) - Employer contributions - 241,858 (241,858) Member contributions - 147,545 (147,545) Net investment income - (343,502) 343,502 Administrative expenses - (17,714) 17,714
Net changes 335,541 (518,672) 854,213 Balances at 12/31/18 9,451,629$ 6,967,446$ 2,484,183$ Charges for the year:
Service cost 184,317 - 184,317 Interest on total pension liability 629,507 - 629,507 Benefit payments (630,112) (630,112) - Employer contributions - 210,798 (210,798) Member contributions - 154,482 (154,482) Net investment income - 1,371,501 (1,371,501) Administrative expenses - (22,232) 22,232
Net changes 183,712 1,084,437 (900,725) Balances at 12/31/19 9,635,341$ $ 8,051,883 $ 1,583,458
Total Pension Liability
Plan Fiduciary Net Position
Net Pension Liability
Plan fiduciary net position as a percentage of the total pension liability:
2018 73.72% 2019 83.57%
The following represents the net pension liability for the Transit Authority for 2019 and 2018, calculated using the discount rate of 6.75%, as well as what the net pension liability would be if it were calculated using a discount rate that is 1-percentage-point lower (5.75%) or 1-percentage-point higher (7.75%) than the current rate:
Authority's net pension liability (asset) - 2019 2,562,959$ 1,583,458$ 761,673$
Authority's net pension liability (asset) - 2018 3,454,259$ 2,484,183$ 1,669,146$
1% Decrease (5.75%)
1% Increase (7.75%)
Current Discount Rate
(6.75%)

THE TRANSIT AUTHORITY OF THE CITY OF OMAHA
NOTES TO FINANCIAL STATEMENTS Years ended December 31, 2019 and 2018
- 19 -
5. Pension Plans – Continued Annual Pension Cost and Net Pension Obligation-Continued:
Hourly Plan
Balances at 12/31/17 35,249,385$ 24,197,918$ 11,051,467$ Charges for the year:
Service cost 929,833 - 929,833 Interest on total pension liability 2,365,575 - 2,365,575 Effect of economic/demographic
gains or losses (333,721) - (333,721) Benefit payments (2,304,956) (2,304,956) - Employer contributions - 855,109 (855,109) Member contributions - 797,854 (797,854) Net investment income - (1,103,652) 1,103,652 Administrative expenses - (50,776) 50,776
Net changes 656,731 (1,806,421) 2,463,152 Balances at 12/31/18 35,906,116$ 22,391,497$ 13,514,619$ Charges for the year:
Service cost 845,600 - 845,600 Interest on total pension liability 2,401,149 - 2,401,149 Benefit payments (2,397,440) (2,397,440) - Employer contributions - 836,227 (836,227) Member contributions - 780,898 (780,898) Net investment income - 4,406,294 (4,406,294) Administrative expenses - (66,572) 66,572
Net changes 849,309 3,559,407 (2,710,098) Balances at 12/31/19 36,755,425$ $ 25,950,904 $ 10,804,521
Total Pension Liability
Plan Fiduciary Net Position
Net Pension Liability
Plan fiduciary net position as a percentage of the total pension liability:
2018 62.36% 2019 70.60%
The following represents the net pension liability for the Transit Authority for 2019 and 2018, calculated using the discount rate of 6.75%, as well as what the net pension liability would be if it were calculated using a discount rate that is 1-percentage-point lower (5.75%) or 1-percentage-point higher (7.75%) than the current rate:
Authority's net pension liability (asset) - 2019 14,537,757$ 10,804,521$ 7,604,768$
Authority's net pension liability (asset) - 2018 17,195,222$ 13,514,619$ 10,361,074$
1% Decrease (5.75%)
1% Increase (7.75%)
Current Discount Rate
(6.75%)

THE TRANSIT AUTHORITY OF THE CITY OF OMAHA
NOTES TO FINANCIAL STATEMENTS Years ended December 31, 2019 and 2018
- 20 -
5. Pension Plans – Continued Annual Pension Cost and Net Pension Obligation-Continued: For the current year, the Transit Authority recognized pension expense of $208,111. The Transit Authority reported deferred outflows of resources and deferred inflows of resources related to pensions from the following sources:
Salary Plan
Differences between expected and actual experience 200,249$ (83,189)$ 233,416$ (96,826)$
Net difference between projected and actualearnings on pension plan investments - (442,646) 338,180 -
Total 200,249$ (525,835)$ 571,596$ (96,826)$
Deferred Outflows of Resources
Deferred Inflows of
Resources
2019 2018Deferred Inflows of
Resources
Deferred Outflows of Resources
Amounts reported as deferred outflows of resources and deferred inflows of resources related to pensions will be recognized in pension expense as follows:
Year ended December 31:2020 (110,566)$ 2021 (97,250) 2022 5,946 2023 (162,656) 2024 19,530
Thereafter 19,410
Hourly Plan
Differences between expected and actual experience 248,767$ (253,307)$ 299,462$ (293,514)$
Changes of assumptions - (3,143,953) - (3,737,152) Net difference between projected and actual
earnings on pension plan investments - (1,335,522) 1,218,742 - Total 248,767$ (4,732,782)$ 1,518,204$ (4,030,666)$
Deferred Outflows of Resources
Deferred Inflows of
Resources
Deferred Outflows of Resources
Deferred Inflows of
Resources
2019 2018

THE TRANSIT AUTHORITY OF THE CITY OF OMAHA
NOTES TO FINANCIAL STATEMENTS Years ended December 31, 2019 and 2018
- 21 -
5. Pension Plans – Continued Annual Pension Cost and Net Pension Obligation-Continued: Amounts reported as deferred outflows of resources and deferred inflows of resources related to pensions will be recognized in pension expense as follows:
Year ended December 31:
2020 (952,066)$ 2021 (922,168) 2022 (624,699) 2023 (1,167,433) 2024 (590,678)
Thereafter (226,971)
The annual required contribution for the current year was determined as part of the January 1, 2019 actuarial valuation using the entry age cost method. The actuarial assumptions included a rate of return on the investment of present and future assets of 6.75% for the Hourly Plan and Salaried Plan per year and projected salary increases of 4.00% for each plan. The actuarial value of assets was determined using techniques that smooth the effects of short-term volatility in the market value of investments by setting such value equal to the expected value, based on the assumed rate of return, plus 25% of the difference between market and expected values for the Salaried Plan and Hourly Plan. Increases in the net pension liability are amortized over 23 years with a closed period for the Salaried and Hourly Plan.
Additional Information: The Schedule of Pension Funding Progress, presented as RSI following the Notes to the Financial Statements, presents multiyear trend information about whether the actuarial value of plan assets are increasing or decreasing over time relative to the actuarial accrued liability for benefits. The projection of benefits for the Salary and Hourly Employee Plans for financial reporting purposes does not explicitly incorporate the potential effects of the limitation of funding percentage on the employer's portion.
Deferred Compensation Plan: The Transit Authority offers its employees a deferred compensation plan created in accordance with Internal Revenue Service Code Section 457. The plan permits employees to defer a portion of their salary until termination, retirement, death or unforeseeable emergency. Participation in the plan is optional.
6. Other Employee Benefits
The Transit Authority provides a death benefit to all employees ranging from $4,000 to $5,000 based on the year of retirement. After July 1, 2005 (for bargaining unit employees) and May 2009 for administrative employees, a retiree may opt to take $4,000 cash at retirement in lieu of the $5,000 death benefit. The liability is the amount owed to employees who are eligible at their retirement date to receive the benefit. At December 31, 2019 and 2018, the Transit Authority recorded a liability of $230,333 and $248,333, respectively. No portion of this liability is considered current as of December 31, 2019 or 2018.

THE TRANSIT AUTHORITY OF THE CITY OF OMAHA
NOTES TO FINANCIAL STATEMENTS Years ended December 31, 2019 and 2018
- 22 -
7. Risk Management
The Transit Authority is exposed to various risks of loss related to torts; theft of, damage to and destruction of assets; business interruption, errors and omissions; employee injuries and illnesses; natural disasters and employee health and accident benefits. The Transit Authority is self-insured for workers' compensation risks in Nebraska up to $550,000 per individual, $1,000,000 per occurrence; property risks up to $100,000 per occurrence; public transportation liability risks up to $500,000 per occurrence; and employee health claims up to $125,000 per person with an aggregate maximum of $4,327,758. The self-insurance programs, except for health insurance, are administered through the Human Relations Department. Commercial insurance is purchased for coverage above self-insurance limits. Workers' compensation above self-insured limits is covered by a policy which provides $5,000,000 limits above the Transit Authority's retention of $550,000 per individual and $1,000,000 per occurrence. Public transportation above self-insured limits is covered by a policy which provides $4,500,000 limits above the Transit Authority's retention of $500,000 per occurrence. The Nebraska Political Tort Claims Act limits the Transit Authority's liability for tort claims to $1,000,000 per individual and $5,000,000 for all individuals per occurrence. Public official risks continue to be insured through a commercial policy. Settled claims have not exceeded coverage in any of the past three fiscal years. The Transit Authority funds its self-insurance program on an "incurred loss" basis. Provisions for these liabilities have been made based upon historical experience. The Transit Authority has internally designated approximately $2,000,000 of its cash equivalents as a reserve for the Transit liability and casualty losses. The following is a summary of the changes in the estimated claims liability for the year ended December 31:
2019 2018 Balance, January 1 $ 1,189,165 $ 807,773
Current year claims and change in estimates 4,917,915 4,191,996 Claim payments (4,464,256) (3,810,604)
Balance, December 31 $ 1,642,824 $ 1,189,165 8. Commitments and Contingencies
Government Grants:
The Transit Authority is currently participating in numerous grants from various federally assisted grant programs that are subject to review and audit by the grantor agencies. Entitlement to these resources is generally conditional upon compliance with the terms and conditions of grant agreements and applicable federal regulations, including the expenditure of resources for allowable purposes. At December 31, 2019 and 2018, in the opinion of management of the Transit Authority, any disallowance resulting from a federal audit would not be material. Claims and Litigation:
The Transit Authority is currently involved in various claims and pending legal actions related to matters arising from the ordinary conduct of business. Management believes all outstanding claims are substantially covered by insurance policies and the ultimate disposition of the actions will not have a material effect on the financial statements of the Transit Authority.

THE TRANSIT AUTHORITY OF THE CITY OF OMAHA
NOTES TO FINANCIAL STATEMENTS Years ended December 31, 2019 and 2018
- 23 -
8. Commitments and Contingencies – Continued
Construction and Purchase Commitments As of December 31, 2019, the Transit Authority had construction contracts in progress with remaining future commitments totaling $11,410,103. FTA grant funds have been obtained to cover the bulk of these commitments. Additionally, in January 2020, the Transit Authority finalized purchases on ten new revenue vehicles totaling $8,021,016. 80% of these bus purchases, were funded with federal grants. Current Economic Conditions:
The current economic environment presents governmental agencies with unprecedented circumstances and challenges, which in some cases have resulted in large declines in the fair value of investments and other assets, declines in governmental support, grant revenue, tax revenue, constraints on liquidity and difficulty obtaining financing. The financial statements have been prepared using values and information currently available to the Transit Authority.
A significant decline in governmental support, grant revenue, tax revenue, etc. could have an adverse impact on the Transit Authority's future operating results.
In addition, given the volatility of current economic conditions, the values of assets and liabilities recorded in the financial statements could change rapidly, resulting in material future adjustments in allowances for accounts receivable and pension obligations that could negatively impact the Transit Authority's ability to maintain sufficient liquidity.
9. Subsequent Events
Subsequent events have been evaluated through May 27, 2020 which is the date the financial statements were available to be issued.
On March 11, 2020 the World Health Organization declared the coronavirus outbreak to be a pandemic. Actions taken around the world to help mitigate the spread of the coronavirus include restrictions on travel, and quarantines in certain areas, and forced closures for certain types of public places and businesses. The coronavirus and actions taken to mitigate it have had and are expected to continue to have an adverse impact on the economies and financial markets of many countries, including the geographical areas in which the Transit Authority operates. While it is unknown how long these conditions will last and what the complete financial effect will be to the Transit Authority, to date, the Transit Authority is experiencing disruption in daily activities.

Required Supplementary Information

THE TRANSIT AUTHORITY OF THE CITY OF OMAHA
SCHEDULE OF CHANGES IN NET PENSION LIABILITY AND RELATED RATIOS Salary Plan
Last 10 Calendar Years, ending December 31 (In Thousands)
- 24 -
2019 2018
Total pension liabilityService cost 184$ 180$ Interest on total pension liability 630 609 Effect of economic/demographic gains of
member contributions - 93 Benefit payments, including refunds of
member contributions (630) (547) Net change in total pension liability 184 335 Total pension liability-beginning 9,451 9,116 Total pension liability-ending (a) 9,635$ 9,451$
Fiduciary net positionContributions-employer 211$ 242$ Contributions-member 154 148 Net investment income 1,372 (344) Benefit payments (630) (547) Administrative expense (22) (18) Transfer from hourly plan - - Net change in plan fiduciary net position 1,085 (519) Plan fiduciary net position-beginning 6,967 7,486 Plan fiduciary net position-ending (b) 8,052$ 6,967$
Net pension liability (asset)-ending (a) - (b) 1,583$ 2,484$
Fiduciary net position as a percentage of the total pension liability 83.57% 73.72%
Covered-employee payroll 2,645$ 2,645$
Net pension liability (asset) as a percentageof covered-employee payroll 59.85% 93.92%
This schedule is being built prospectively until it contains ten years of data.Data for fiscal years 2010 to 2014 are unavailable

THE TRANSIT AUTHORITY OF THE CITY OF OMAHA
SCHEDULE OF CHANGES IN NET PENSION LIABILITY AND RELATED RATIOS Salary Plan
Last 10 Calendar Years, ending December 31 (In Thousands)
- 25 -
2017 2016 2015
175$ 154$ 158$ 599 566 550
(124) 219 (25)
(464) (474) (418) 186 465 265
8,930 8,465 8,200 9,116$ $ 8,930 $ 8,465
211$ 211$ 235$ 137 137 127 915 489 (94)
(465) (474) (418) (62) (61) - 47 97 -
783 399 (150) 6,703 6,304 6,454 7,486$ 6,703$ 6,304$
1,630$ 2,227$ 2,161$
82.12% 75.06% 74.47%
2,401$ 2,312$ 2,070$
67.88% 96.32% 104.40%
THE TRANSIT AUTHORITY OF THE CITY OF OMAHA
SCHEDULE OF EMPLOYER CONTRIBUTIONS Salary Plan
Last 10 Calendar Years, ending December 31
- 26 -
2019 2018 2017 2016 2015 2014 2013 2012 2011 2010
Actuarially determined contribution 216,026$ 195,553$ 214,483$ 191,504$ 193,768$ 219,791$ 224,671$ 240,394$ 275,039$ 295,364$
Contributions in relation to the actuarially determined contribution 210,798 241,858 211,386 211,056 234,812 218,892 251,577 246,999 257,653 326,529
Contribution deficiency (excess) 5,228$ (46,305)$ 3,097$ (19,552)$ (41,044)$ 899$ (26,906)$ (6,605)$ 17,386$ (31,165)$
Covered-employee payroll 2,645,012$ 2,645,012$ 2,401,367$ 2,311,907$ 2,069,548$ 2,185,380$ 2,071,861$ 1,905,917$ 1,891,652$ 1,962,025$
Contributions as a percentage of covered-employee payroll 7.97% 9.14% 8.80% 9.13% 11.35% 10.02% 12.14% 12.96% 13.62% 16.64%
Notes to Schedule
Valuation date:Actuarial determined contribution rates are calculated as of December 31 in the fiscal year in which the contributions are reported.
Methods and assumptions used to determine contribution rates:Actuarial cost method Entry age normalAmortization method Level dollar, closed period, 23 yearsAsset valuation method Four year asymptotic smootingInflation 2.50%Salary increases 4.00%Investment rate of return 6.75%Withdrawal rates Rates that vary by age and servicesRetirement rates Rates that vary by age and servicesMortality RP-2000 Combined Health Mortality Table for Males and
Females with generational projection per Scale AA
THE TRANSIT AUTHORITY OF THE CITY OF OMAHA
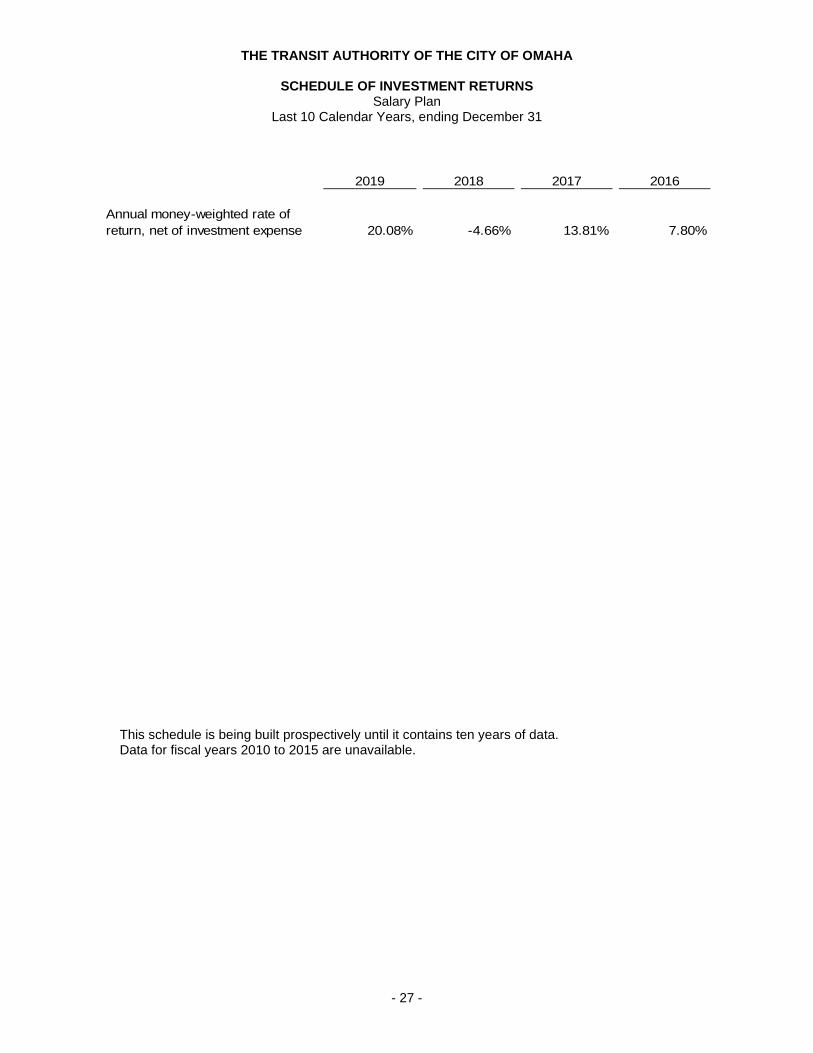
SCHEDULE OF INVESTMENT RETURNS Salary Plan
Last 10 Calendar Years, ending December 31
- 27 -
2019 2018 2017 2016
Annual money-weighted rate of return, net of investment expense 20.08% -4.66% 13.81% 7.80%
This schedule is being built prospectively until it contains ten years of data. Data for fiscal years 2010 to 2015 are unavailable.

THE TRANSIT AUTHORITY OF THE CITY OF OMAHA
SCHEDULE OF CHANGES IN NET PENSION LIABILITY AND RELATED RATIOS Hourly Plan
Last 10 Calendar Years, ending December 31 (In Thousands)
- 28 -
2019 2018
Total pension liabilityService cost 846$ 930$ Interest on total pension liability 2,400 2,366 Effect of economic/demographic gains or
losses - (334) Effect of assumption changes or inputs - - Benefit payments, including refunds of
member contributions (2,397) (2,305) Net change in total pension liability 849 657 Total pension liability-beginning 35,906 35,249 Total pension liability-ending (a) 36,755$ 35,906$
Fiduciary net positionContributions-employer 836$ 855$ Contributions-member 781 798 Net investment income 4,406 (1,104) Benefit payments (2,397) (2,305) Administrative expense (67) (51) Transfer to salary plan - - Net change in plan fiduciary net position 3,559 (1,807) Plan fiduciary net position-beginning 22,391 24,198 Plan fiduciary net position-ending (b) 25,950$ 22,391$
Net pension liability (asset)-ending (a) - (b) 10,805 13,515
Fiduciary net position as a percentage of the total pension liability 70.60% 62.36%
Covered-employee payroll 11,485 11,485
Net pension liability (asset) as a percentageof covered-employee payroll 94.08% 117.67%
This schedule is being built prospectively until it contains ten years of data.Data for fiscal years 2010 to 2014 are unavailable

THE TRANSIT AUTHORITY OF THE CITY OF OMAHA
SCHEDULE OF CHANGES IN NET PENSION LIABILITY AND RELATED RATIOS Hourly Plan
Last 10 Calendar Years, ending December 31 (In Thousands)
- 29 -
2017 2016 2015
1,152$ 1,137$ 1,158$ 2,120 2,032 2,469
90 351 (975) (4,924) - -
(1,857) (1,982) (1,857) (3,419) 1,538 795 38,668 37,130 36,335 35,249$ $ 38,668 $ 37,130
905$ 706$ 748$ 703 651 663
2,934 1,529 (71) (1,857) (1,982) (1,857)
(56) (47) (246) (12) (96) -
2,617 761 (763) 21,581 20,822 21,585 24,198$ 21,583$ 20,822$
11,051$ 17,085$ 16,308$
68.65% 55.82% 56.08%
12,170$ 11,497$ 11,391$
90.81% 148.62% 143.17%
THE TRANSIT AUTHORITY OF THE CITY OF OMAHA
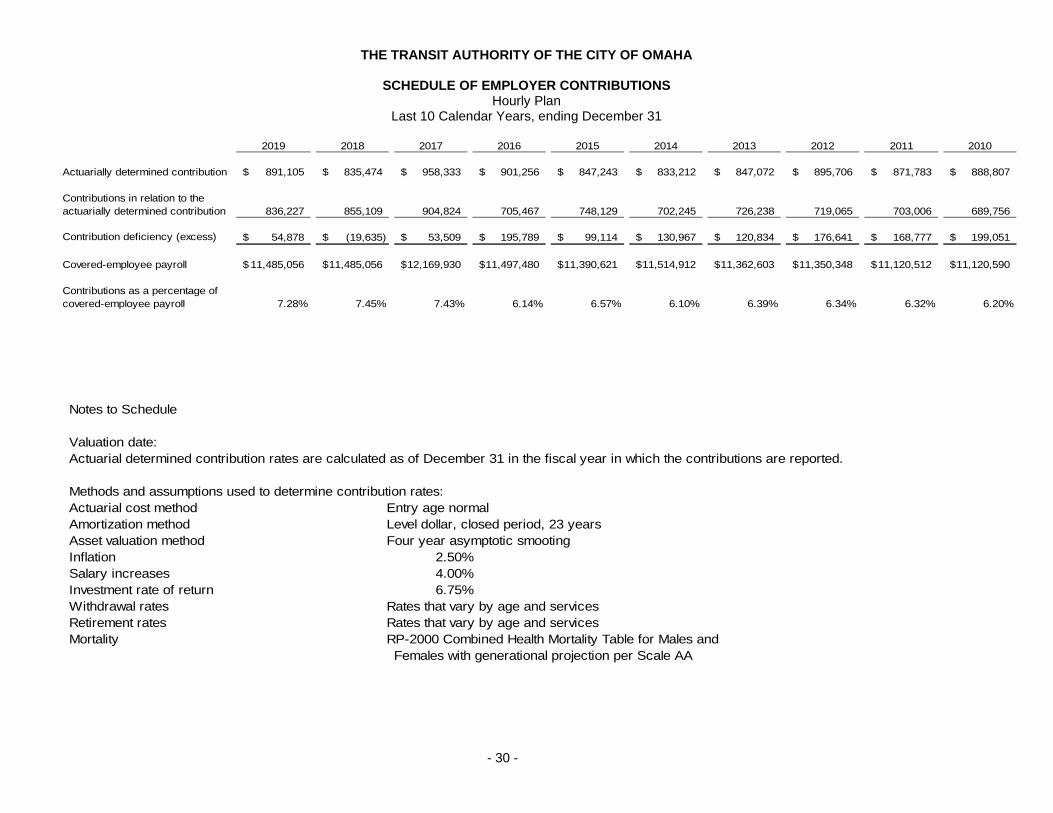
SCHEDULE OF EMPLOYER CONTRIBUTIONS Hourly Plan
Last 10 Calendar Years, ending December 31
- 30 -
2019 2018 2017 2016 2015 2014 2013 2012 2011 2010
Actuarially determined contribution 891,105$ 835,474$ 958,333$ 901,256$ 847,243$ 833,212$ 847,072$ 895,706$ 871,783$ 888,807$
Contributions in relation to the actuarially determined contribution 836,227 855,109 904,824 705,467 748,129 702,245 726,238 719,065 703,006 689,756
Contribution deficiency (excess) 54,878$ (19,635)$ 53,509$ 195,789$ 99,114$ 130,967$ 120,834$ 176,641$ 168,777$ 199,051$
Covered-employee payroll 11,485,056$ 11,485,056$ 12,169,930$ 11,497,480$ 11,390,621$ 11,514,912$ 11,362,603$ 11,350,348$ 11,120,512$ 11,120,590$
Contributions as a percentage of covered-employee payroll 7.28% 7.45% 7.43% 6.14% 6.57% 6.10% 6.39% 6.34% 6.32% 6.20%
Notes to Schedule
Valuation date:Actuarial determined contribution rates are calculated as of December 31 in the fiscal year in which the contributions are reported.
Methods and assumptions used to determine contribution rates:Actuarial cost method Entry age normalAmortization method Level dollar, closed period, 23 yearsAsset valuation method Four year asymptotic smootingInflation 2.50%Salary increases 4.00%Investment rate of return 6.75%Withdrawal rates Rates that vary by age and servicesRetirement rates Rates that vary by age and servicesMortality RP-2000 Combined Health Mortality Table for Males and
Females with generational projection per Scale AA

THE TRANSIT AUTHORITY OF THE CITY OF OMAHA
SCHEDULE OF INVESTMENT RETURNS Hourly Plan
Last 10 Calendar Years, ending December 31
- 31 -
2019 2018 2017 2016
Annual money-weighted rate of return, net of investment expense 20.09% -4.63% 13.68% 7.80%
This schedule is being built prospectively until it contains ten years of data. Data for fiscal years 2010 to 2015 are unavailable.

Supplementary Information

THE TRANSIT AUTHORITY OF THE CITY OF OMAHA
SCHEDULE OF EXPENDITURES OF FEDERAL AWARDS Year Ended December 31, 2019
- 32 -
FederalFederal Grantor/Pass-Through CFDA
Number Expenditures
U.S. Department of Transportation
Federal Transit Cluster
Direct ProgramFederal Transit Capital Investment Grants 20.500 NE-03-X041 176,104$ Federal Transit Capital Investment Grants 20.500 NE-04-X044 591,247 Federal Transit Capital Investment Grants 20.500 NE-04-X045 32,314 Federal Transit Capital Investment Grants 20.500 NE-04-X048 134,837
934,502$ Direct Program
Federal Transit Formula Grants 20.507 NE-90-X104 2,090,883$ Federal Transit Formula Grants 20.507 NE-90-X107 1,480,685 Federal Transit Formula Grants 20.507 NE-90-X111 6,364,405 Federal Transit Formula Grants 20.507 NE-90-X101 483 Federal Transit Formula Grants 20.507 NE-95-BRT1 58,666 Federal Transit Formula Grants 20.507 NE-95-0001 88,530
10,083,652$
Bus and Bus Facilities Formula Program 20.526 NE-34-0002 365,614$ Bus and Bus Facilities Formula Program 20.526 NE-34-0009 90,614 Bus and Bus Facilities Formula Program 20.526 NE-34-0004 86,910
543,138$
Total Federal Transit Cluster 11,561,292$
National Infrastructure Investments 20.933 NE-79-0001 6,171,416$
Passed-ThroughMetropolitan Area Planning Agency
Metropolitan Transportation Planning andState and Non-Metropolitan Planning and Research 20.505 MAPA-METRO NE 93,093$
Total Expenditures of Federal Awards 17,825,801$
Agreement NumberGrantor/Program Title
THE TRANSIT AUTHORITY OF THE CITY OF OMAHA
NOTES TO SCHEDULE OF EXPENDITURES OF FEDERAL AWARDS Year Ended December 31, 2019
- 33 -
1. Basis of Presentation The accompanying schedule of expenditures of federal awards (the "Schedule") includes the federal award activity of The Transit Authority of the City of Omaha under programs of the federal government for the year ended December 31, 2019. The information in this Schedule is presented in accordance with the requirements of Title 2 U.S. Code of Federal Regulations Part 200, Uniform Administrative Requirements, Cost Principles, and Audit Requirements for Federal Awards (Uniform Guidance). Because the Schedule presents only a selected portion of the operations of The Transit Authority of the City of Omaha, it is not intended to and does not present the financial position, changes in net assets, or cash flows of The Transit Authority of the City of Omaha. 2. Summary of Significant Accounting Policies Expenditures reported on the Schedule are reported on the accrual basis of accounting. Such expenditures are recognized following cost principles contained in the Uniform Guidance, wherein certain types of expenditures are not allowable or are limited as to reimbursement 3. Indirect Cost Rate The Authority has elected not to charge the 10 percent de minimis indirect cost rate to its federal award programs.
- 34 -
Hamilton Associates, P.C. Certified Public Accountants
INDEPENDENT AUDITOR’S REPORT ON INTERNAL CONTROL OVER
FINANCIAL REPORTING AND ON COMPLIANCE AND OTHER MATTERS BASED ON AN AUDIT OF FINANCIAL STATEMENTS PERFORMED IN
ACCORDANCE WITH GOVERNMENT AUDITING STANDARDS
To The Board of Directors The Transit Authority of the City of Omaha Omaha, Nebraska We have audited, in accordance with the auditing standards generally accepted in the United States of America and the standards applicable to financial audits contained in Government Auditing Standards issued by the Comptroller General of the United States, the financial statements of The Transit Authority of the City of Omaha, which comprise the statement of financial position as of December 31, 2019, and the related statements of activities and cash flows for the year then ended, and the related notes to the financial statements, and have issued our report thereon dated May 27, 2020. Internal Control over Financial Reporting In planning and performing our audit of the financial statements, we considered The Transit Authority of the City of Omaha’s internal control over financial reporting (internal control) to determine the audit procedures that are appropriate in the circumstances for the purpose of expressing our opinion on the financial statements, but not for the purpose of expressing an opinion on the effectiveness of The Transit Authority of the City of Omaha’s internal control. Accordingly, we do not express an opinion on the effectiveness of The Transit Authority of the City of Omaha’s internal control. A deficiency in internal control exists when the design or operation of a control does not allow management or employees, in the normal course of performing their assigned functions, to prevent, or detect and correct, misstatements on a timely basis. A material weakness is a deficiency, or a combination of deficiencies, in internal control, such that there is a reasonable possibility that a material misstatement of the entity’s financial statements will not be prevented, or detected and corrected on a timely basis. A significant deficiency is a deficiency, or a combination of deficiencies, in internal control that is less severe than a material weakness, yet important enough to merit attention by those charged with governance. Our consideration of internal control was for the limited purpose described in the first paragraph of this section and was not designed to identify all deficiencies in internal control that might be material weaknesses or significant deficiencies. Given these limitations, during our audit we did not identify any deficiencies in internal control that we consider to be material weaknesses. However, material weaknesses may exist that have not been identified. Compliance and Other Matters As part of obtaining reasonable assurance about whether The Transit Authority of the City of Omaha's financial statements are free of material misstatement, we performed tests of its compliance with certain provisions of laws, regulations, contracts and grant agreements, noncompliance with which could have a direct and material effect on the determination of financial statement amounts. However, providing an opinion on compliance with those provisions was not an objective of our audit and, accordingly, we do not express such an opinion. The results of our tests disclosed no instances of noncompliance or other matters that are required to be reported under Government Auditing Standards.
- 35 -
Purpose of this Report The purpose of this report is solely to describe the scope of our testing of internal control and compliance and the results of that testing, and not to provide an opinion on the effectiveness of The Transit Authority of the City of Omaha’s internal control or on compliance. This report is an integral part of an audit performed in accordance with Government Auditing Standards in considering the entity’s internal control and compliance. Accordingly, this communication is not suitable for any other purpose. Council Bluffs, Iowa May 27, 2020
- 36 -
Hamilton Associates, P.C. Certified Public Accountants
INDEPENDENT AUDITORS REPORT ON COMPLIANCE FOR EACH MAJOR FEDERAL PROGRAM AND REPORT ON INTERNAL CONTROL
OVER COMPLIANCE REQUIRED BY THE UNIFORM GUIDANCE To the Board of Directors The Transit Authority of the City of Omaha Omaha, Nebraska Report on Compliance for Each Major Federal Program We have audited The Transit Authority of the City of Omaha’s compliance with the types of compliance requirements described in the OMB Compliance Supplement that could have a direct and material effect on each of The Transit Authority of the City of Omaha’s major federal programs for the year ended December 31, 2019. The Transit Authority of the City of Omaha’s major federal programs are identified in the summary of auditor’s results section of the accompanying schedule of findings and questioned costs. Management’s Responsibility Management is responsible for compliance with the requirements of laws, regulations, contracts, and grants applicable to its federal programs. Auditor’s Responsibility Our responsibility is to express an opinion on compliance for each of The Transit Authority of the City of Omaha’s major federal programs based on our audit of the types of compliance requirements referred to above. We conducted our audit of compliance in accordance with auditing standards generally accepted in the United States of America; the standards applicable to financial audits contained in Government Auditing Standards, issued by the Comptroller General of the United States; and the audit requirements of Title 2 U.S. Code of Federal Regulations Part 200, Uniform Administrative Requirements, Cost Principles, and Audit Requirements for Federal Awards (Uniform Guidance). Those standards and the Uniform Guidance require that we plan and perform the audit to obtain reasonable assurance about whether noncompliance with the types of compliance requirements referred to above that could have a direct and material effect on a major federal program occurred. An audit includes examining, on a test basis, evidence about The Transit Authority of the City of Omaha’s compliance with those requirements and performing such other procedures as we considered necessary in the circumstances. We believe that our audit provides a reasonable basis for our opinion on compliance for each major federal program. However, our audit does not provide a legal determination of The Transit Authority of the City of Omaha’s compliance. Opinion on Each Major Federal Program In our opinion, The Transit Authority of the City of Omaha complied, in all material respects, with the types of compliance requirements referred to above that could have a direct and material effect on each of its major federal programs for the year ended December 31, 2019.

- 37 -
Report on Internal Control Over Compliance Management of The Transit Authority of the City of Omaha is responsible for establishing and maintaining effective internal control over compliance with the types of compliance requirements referred to above. In planning and performing our audit of compliance, we considered The Transit Authority of the City of Omaha’s internal control over compliance with the types of requirements that could have a direct and material effect on each major federal program to determine the auditing procedures that are appropriate in the circumstances for the purpose of expressing an opinion on compliance for each major federal program and to test and report on internal control over compliance in accordance with the Uniform Guidance, but not for the purpose of expressing an opinion on the effectiveness of internal control over compliance. Accordingly, we do not express an opinion on the effectiveness of The Transit Authority of the City of Omaha’s internal control over compliance. A deficiency in internal control over compliance exists when the design or operation of a control over compliance does not allow management or employees, in the normal course of performing their assigned functions, to prevent, or detect and correct, noncompliance with a type of compliance requirement of a federal program on a timely basis. A material weakness in internal control over compliance is a deficiency, or combination of deficiencies, in internal control over compliance, such that there is a reasonable possibility that material noncompliance with a type of compliance requirement of a federal program will not be prevented, or detected and corrected, on a timely basis. A significant deficiency in internal control over compliance is a deficiency, or a combination of deficiencies, in internal control over compliance with a type of compliance requirement of a federal program that is less severe than a material weakness in internal control over compliance, yet important enough to merit attention by those charged with governance. Our consideration of internal control over compliance was for the limited purpose described in the first paragraph of this section and was not designed to identify all deficiencies in internal control over compliance that might be material weaknesses or significant deficiencies. We did not identify any deficiencies in internal control over compliance that we consider to be material weaknesses. However, material weaknesses may exist that have not been identified. The purpose of this report on internal control over compliance is solely to describe the scope of our testing of internal control over compliance and the results of that testing based on the requirements of the Uniform Guidance. Accordingly, this report is not suitable for any other purpose. Council Bluffs, Iowa May 27, 2020

THE TRANSIT AUTHORITY OF THE CITY OF OMAHA
SCHEDULE OF FINDINGS AND QUESTIONED COSTS Year Ended December 31, 2019
- 38 -
I. Summary of Auditor's Results:
Financial Statements:
Type of auditor's report issued: Unmodified
Internal control over financial reporting:
Material weaknesses identified: No
Significant deficiency(ies) identified? None Reported
Noncompliance material to financial statements noted: No
Federal Awards:
Internal control over major programs:
Material weaknesses identified: No
Significant deficiency(ies) identified? No
Type of auditor's report issued on compliance for major programs: Unmodified
Any audit findings disclosed that are required to be reportedin accordance with section 2 CFR 200.516(a)? No
Identification of major programs:
Name of Federal Program or Cluster Expenditures
National Infrastructure Investments 6,171,416$
Dollar threshold used to distinguish betweentype A and type B programs: 750,000$
Auditee qualified as low-risk auditee? Yes
II. Financial Statement Findings
None reported
III. Findings and Questioned Costs for Federal Awards
None reported
CFDA Number
20.933