Embed Size (px)
Citation preview
The Tema Institute Campus Valla, Linköping _____________________________________________________________ THE EFFECTS OF HEAVY METALS ON DENITRIFICATION IN A WETLAND SEDIMENT.
Ernest E. Aigbavbiere Master of Science Thesis, Water Resources and Environmental Studies, 2006
Linköpings Universitet, Campus Valla, 581 83 Linköping.

Rapporttyp Report category Licentiatavhandling Examensarbete AB-uppsats C-uppsats D-uppsats Övrig rapport ________________
Språk Language Svenska/Swedish Engelska/English ________________
Titel THE EFFECTS OF HEAVY METALS ON DENITRIFICATION IN WETLAND SEDIMENT. Title Författare Author: Ernest. E. Aigbavbiere
Sammanfattning Abstract: Wetlands water quality is influenced by the anthopogenic activities in the catchments’ areas. Wastewaters from the urban storm, agricultural runoff and sewage treatment often end up in wetlands before flowing to rivers, lakes and the sea. A lot of pollutants are readily transported in these wastewaters, thus subjecting the wetland ecosystem into a continuous resilience. Importantly, heavy metals like Cu, Zn, and Pb etc. are constituents of such pollutants in the wastewaters. The study has as a specific objective to investigate the effects of heavy metal Cu, Zn and Pb on denitrification, an important ecosystem process and service. In a wetland situation, denitrification is a permanent nitrogen removal process accounting for about 90% of the total nitrogen removal. The research was carried out in the laboratory and sediment samples were taken from a constructed wetland in Linkoping. We employed acetylene inhibition technique in obtaining N2O as a product resulting from nitrate reduction. The treatments (Cu, Zn and Pb) levels were 100 mg/kg, 250 mg/kg, 500 mg/kg and 1000 mg/kg of sediment, in three replicates and a control. Samplings of the assay were taken within 24hours. Gas chromatography was used to analyse and quantify N2O in the various samples. A linear regression analysis was carried out with Windows Excel and SPSS to compare the various treatments with the control at 95% confidence level The results show that there were no inhibitions of denitrification at 100 mg/kg sediment treatment level for any of the element. Inhibition of denitrification was observed at treatment levels 500 mg/kg and 1000 mg/kg of sediment .The rate of nitrate reduction was compared from the slope of the regression curve. The rate for Cu at 500 mg and 1000 mg /kg of sediment was moderately related to that of the control, Zn shows a similar trend but a higher rate in some samples, while Pb shows more inhibition
ISBN _____________________________________________________ ISRN LIU-TEMA/VMPWLS-D--06/005--SE _________________________________________________________________ ISSN _________________________________________________________________ Serietitel och serienummer Title of series, numbering Handledare Tutor
Nyckelord Keywords : wetlands, heavy metals, inhibition, denitrification
Datum Date: 2006/11/05
URL för elektronisk version http://www.ep.liu.se/index.sv.html
Institution, Avdelning Department, Division Insitutionen för tema The Tema Institute Water Resources and Environmental Studies
1
ACKNOWLEDGEMENT I am grateful for the privileged to study a programme like this (MSc Water Resources and
Livelihood security) all parts of the fulfilment of the programme were interesting. To this
ends I wish to commend the resources persons in charge of the programme for their laudable
efforts. I extend my thanks to Julie Wilk, Åsa Danielson and Susanne Eriksson for their
contributions in making this programme a success.
A project work like this demands both mental and material resources. In that regard, I want to
thank the programme administrator for providing the resources. To my supervisor Professor
Bosse Svensson, I own him high esteem for his time, and painstaking in the supervision of the
project. To the team at the Department of Microbiology, Swedish University Agricultural
Sciences, Uppsala, my sincere thanks, for the use of their facilities. Equally, important were
the healthy environment and cooperation we enjoy as international students from the faculty,
department, and individual lecturer. My humble thanks to the international staffs’ at the
faculty of Arts and Science, all lecturers of the Department of Water and Environmental
Studies for their dedication and high sense of duties.
I am grateful to Mrs Lena Nyden and her family for their distinguish show of hospitality, and
high sense of humanity during the time I arrived and started my studies.
My colleagues in the programme were wonderful people. It was great to enjoy enormous
discussions from wide backgrounds. It is hoped that such interchange of experience will be
vital in understanding the complexity of the global environment.

2
ABSTRACT Wetlands water quality is influenced by the anthopogenic activities in the catchments’ areas. Wastewaters from the urban storm, agricultural runoff and sewage treatment often end up in wetlands before flowing to rivers, lakes and the sea. A lot of pollutants are readily transported in these wastewaters, thus subjecting the wetland ecosystem into a continuous resilience. Importantly, heavy metals like Cu, Zn, and Pb etc. are constituents of such pollutants in the wastewaters. The study has as a specific objective to investigate the effects of heavy metal Cu, Zn and Pb on denitrification, an important ecosystem process and service. In a wetland situation, denitrification is a permanent nitrogen removal process accounting for about 90 % of the total nitrogen removal. The research was carried out in the laboratory and sediment samples were taken from a constructed wetland in Linkoping. We employed acetylene inhibition technique in obtaining N2O as a product resulting from nitrate reduction. The treatments (Cu, Zn and Pb) levels were 100 mg/kg, 250 mg/kg, 500 mg/kg and 1000 mg/kg of sediment, in three replicates and a control. Samplings of the assay were taken within 24hours. Gas chromatography was used to analyse and quantify N2O in the various samples. A linear regression analysis was carried out with Windows Excel and SPSS to compare the various treatments with the control at 95 % confidence level The results show that there were no inhibitions of denitrification at 100 mg/kg sediment treatment level for any of the element. Inhibition of denitrification was observed at treatment levels 500 mg/kg and 1000 mg/kg of sediment. The rate of nitrate reduction was compared from the slope of the regression curve. The rate for Cu at 500 mg and 1000 mg /kg of sediment was moderately related to that of the control, Zn shows a similar trend but a higher rate in some samples, while Pb shows more inhibition Key words: wetlands, heavy metals, inhibition, denitrification

3
DEDICATION To Lena and Stellan Nyden
4
TABLE OF CONTENT Page Title ……………………………………………………………………….. 1
Approval…………………………………………………………………………. 2
Acknowledgement ……………………………………………………………… 3
Abstract ……………………………………………………………………. 4
Dedication …………………………………………………………………………… 5
Table of content…………………………………………………………………………. 6
List of tables……………………………………………………………………………… 7
List of Figures……………………………………………………………………………. 7
List of Appendixes……………………………………………………………………….. . 8
Chapter One
Introduction…………………………………………………………… 9-11
Chapter Two: Review of literature………………………………………… 12-18 Chapter Three Methodology………………………………………………………………………… 19-27 Chapter Four Data presentation, analysis, results and discussion…………………………………… 28-40 Chapter Five Summary and suggestions ………………………………………………………… … 40-42 List of references……………………………………………………………………… 43-46 Appendix 1………………………………………………………………………… …47-53 Appendix 2………………………………………………………………………… ….54-55 Appendix 3…………………………………………………………………………… 56-67
5
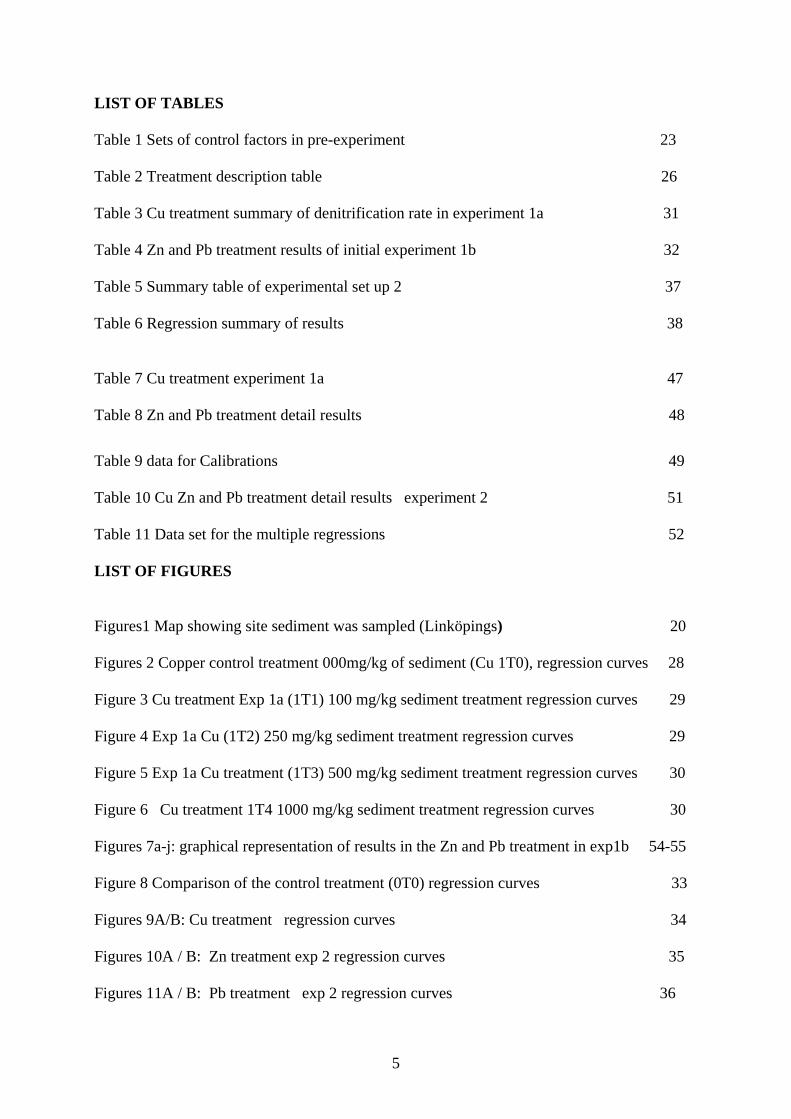
LIST OF TABLES Table 1 Sets of control factors in pre-experiment 23 Table 2 Treatment description table 26 Table 3 Cu treatment summary of denitrification rate in experiment 1a 31 Table 4 Zn and Pb treatment results of initial experiment 1b 32 Table 5 Summary table of experimental set up 2 37 Table 6 Regression summary of results 38 Table 7 Cu treatment experiment 1a 47 Table 8 Zn and Pb treatment detail results 48
Table 9 data for Calibrations 49 Table 10 Cu Zn and Pb treatment detail results experiment 2 51 Table 11 Data set for the multiple regressions 52 LIST OF FIGURES Figures1 Map showing site sediment was sampled (Linköpings) 20 Figures 2 Copper control treatment 000mg/kg of sediment (Cu 1T0), regression curves 28 Figure 3 Cu treatment Exp 1a (1T1) 100 mg/kg sediment treatment regression curves 29 Figure 4 Exp 1a Cu (1T2) 250 mg/kg sediment treatment regression curves 29 Figure 5 Exp 1a Cu treatment (1T3) 500 mg/kg sediment treatment regression curves 30 Figure 6 Cu treatment 1T4 1000 mg/kg sediment treatment regression curves 30 Figures 7a-j: graphical representation of results in the Zn and Pb treatment in exp1b 54-55 Figure 8 Comparison of the control treatment (0T0) regression curves 33 Figures 9A/B: Cu treatment regression curves 34 Figures 10A / B: Zn treatment exp 2 regression curves 35 Figures 11A / B: Pb treatment exp 2 regression curves 36

6
LIST OF APPENDIXES pages Appendix 1 Tables of details of treatment results and some figures 47-53 Appendix 2 Graphical results (linear regression) of Zn and Pb treatment exp 1b. 54-55 Appendix 3 Treatment preparations of the metal salt solution 56-57
7
EFFECTS OF HEAVY METALS ON DENITRIFICATION IN A WETLAND SEDIMENT CHAPTER ONE 1.0 BACKGROUND INFORMATION 1.1 DEFINITIONS Wetland definition lacks specifics, but generally it embraces three components which Gosselink
and Mitsch (1993) indicated as: presence of water in the shallow surface of the soil or within
the root level at most time of the year; a unique soil condition which differs from the upland
and the presence of supportive water adaptive plants(Hydrophytes).Most definitions may
encounter some problem of specifics with regard to the time and the duration of flooding, depth
of the water, the size, endemic species, location and human impact implication.
Some definitions may try to address some of these problem areas. In terms of flooding
wetlands could be seasonal or permanent. The depth is often described as shallow and the
ecology is often seen as an edge of terrestrial and aquatic habitats, thus, being able to support
facultative species (species that adapt to both wet and dry environments) and obligate species
(i.e. adapted to aquatic conditions). Concerning the location and size, there is no definite size.
The sizes range is often determine by the topography and the hydrology of the area. Wetlands
could be located inland, close to coastal lakes, forests and savannahs. They could be fresh
water or marine, and occur in rural or urban areas. Broadly, we have natural wetlands and
artificial or constructed wetlands. The water quality of the wetland is a factor of the
anthopogenic activities in the catchment area (Gosselink and Mitsch 1993).
To be effective, the scientific definition rendered by The US Fish and Wildlife Service defines
wetlands as lands transitional between terrestrial and aquatic systems, where the water table is
usually at or near the surface or the land is covered by shallow water, with any one of the
characteristics such as the presence of undrained hydric soil substrate, predominant
hydrophytes (at least periodically) and the non-soil substrate is water logged. (Cowardin et al
1979).
8
1.2 THE IMPORTANCE OF WETLAND TO THE ENVIRONMENT
The wetland by its unique position acts as a bridge between the land and the river or lake or
coastal sea. It acts as the receiver of most pollutants generated from the anthopogenic
activities taking place in the catchment basin.
The wetland helps to purify water either as wastewater from urban sewage treatment; storm
water or run off from agricultural land, before the water gets into the water systems. It is
the recognition of this vital natural process, that the application of constructed wetland for
treatment of domestic and municipal wastewater, storm water and agricultural run off had
gained much interest. Wetland removes suspended solids, carbonaceous biological oxygen
demand; faecal coli form bacteria, certain heavy metals and phosphorus and nitrogen from
wastewater (Gelt, 1997, Kadlec and Knight, 1996, and Hammer, 1989).
Wetland is an environment that supports numerous species of organisms, thus can be said to
encourage biodiversity. It can also provide livelihood or economic support to communities in
the area of fisheries and the supply of materials for local craft and tools. Some wetlands
constitute a niche for many animal species such as fish: tilapia, catfish and shell fishes but
also an excellent breeding ground especially in the coastal or river based wetlands. Wetland
in some communities is useful in rice cultivation (swampy rice paddy). In the forest area it
encourages the growth of palm trees and bamboo, which are used locally for construction and
other economic uses (Mulugeta, 1994)
Wetland provides a suitable source of data in the area of environmental impact studies,
because the water quality and the nature of the sediment are partly determined by the
influence of the human activities and the nature of the basin catchments. The species fauna
and flora responses in the wetland could be a good indicator of pollution impact, once base
data are known. Wetland risk factors may include excessive load of pollutants, which could
reduce the wetland’s resilience or the capacity of the wetland to adjust itself. Examples are
massive oil spillage either from bust pipes or broken down vessel tanks of which the oil
could drift to the adjacent wetland. There are also the debalasting activities of the ships
during occasional cleaning and oil spill could result from the used water from the oil wells

9
during oil drilling in many natural wetlands. (http://oils.gpa.unep.org/facts/prevent-
land.htm).
Wetland sediment contaminants may include polycyclic aromatic hydrocarbon (PAHs),
monocyclic hydrocarbon, pesticides, chlorinated hydrocarbons phathalates esters, metals,
nutrients, suspended clay and others including cyanides and organo- metals (US EPA,
1993).Wetland hydrological morphology makes them most vulnerable as sinks for most
pollutants
Development also imposed a lot of risk on wetland. The demand for more residential space,
farmland, recreation and aesthetics of the environment had caused the drainage of most coastal
wetlands reconstructed with human habitation. The consequence of this may include urban
flooding, loss of biodiversity, coastal eutrophication etc. (FAO/ UNDP/UNEP, 1994)
Nutrient load in river, lake and coastal waters is of immerse concern. The problem of coastal
water eutrophication is high on the agenda for environmental policy of most global
institutions like the European Union and the United Nation environmental programmes. The
EU water directive specifies nitrate limit of 50 mg/L in drinking water. This applies to
groundwater and surface water (Monteny 2001).
The task of reducing nitrate load flux to the surface and underground water makes wetland
application become very relevant due to its efficiency in the removal of nitrogen from the
wastewaters. Essentially, the process of nitrogen removal from the wastewater is a natural
process called denitrification, which is a component of nitrogen cycle. It is a permanent
removal of nitrogen from the nitrate form to gaseous N2 or N2O in the absence of oxygen
(anaerobic condition). The denitrification process is facilitated naturally by bacterial
activities, which are often moderated by the physiochemical conditions of the environment
(Kadlec and Knight, 1996).
10
CHAPTER TWO 2.0 REVIEW OF LITERATURE 2.1 MATERIAL SINKS IN WETLAND
Wastewater effluents carry a range of materials in dissolved form and suspended solids, which are
organic and inorganic. These materials are carried by urban storm water, sewage water from urban
sewage treatment plant, run-off from agricultural field and waste from livestock yard, into
wetlands, rivers, lakes and the sea (Chandler, 1994). Heavy metals ions constitute the material
sinks in wetland. Heavy metals, which include mercury, cadmium, zinc, lead, chromium and
copper, are used in most household facilities, pharmaceuticals, paint, battery, transportation etc.
Investigation of waste generated from incinerators shows a number of materials in the ash enriched
with heavy metals, in the fly ash or slag. About 80% of mercury (Hg) is from batteries, lead from
waste oil used in some boilers. (Beasley and Kneale, 2001; United Nations- System wide Earth
Watch, 2006).
The development of urban incinerator and central boiler systems in the emerging waste recycling
strategy in environmental management may seem to open new areas of research interest. Wastes
from such systems may no doubt get into the water system and to the wetland, where it become a
sink. There is a global policy development with regards to heavy metals and hazardous substance
emission, for instance, the EU water directive 2000 gave some specifics for drinking water quality
with respect to heavy metal limits, lead 25 ug/L by 2003 and 10 ug/L by 2013(Water Framework
Directive 2000/60/EC)
Wetlands also act as sinks to nutrients and sites where loads of nutrients are reduced from
wastewater before such water enter the rivers or lakes. The microorganisms in a wetland situation
are important in nutrient flux. Wastewater received in the wetland contains nutrients from urban
sewage, agricultural waste and fertilizers, these nutrient loads are reduced by the activities of the:
micro- organisms in the processes of nitrification and denitrification, wetlands plants uptake and
assimilation, and sedimentation in the organic matters. The implication is that the wetland reduces
the nutrient load of the wastewater, thus serving as a natural nutrient sink (Gosselink and Mitsch,
1993).
11
Nutrients abundant in water (especially nitrogen and phosphorous) cause eutrophication or a process
of nutrient enrichment leading to the growth of algae or algal blooms. The algae decay following a
bloom increase the BOD, causing fish stress and kill, and the death of benthic organisms
(Nixon1995; Kremser and Schung, 2002) Also nutrients are not desired in water due to drinking
water status requirement for low nitrate levels. The concentration of unionized ammonia is also lethal
to the fish. Thus, the process of nutrient removal in the aquatic system is very important for both
human health and the sustainability of the aquatic ecosystem
Wetlands as a natural ecological design are important in water quality improvement as it
receive water from the basin and enhance the quality status before discharge to the river ways.
It is the understanding of this process that prompted the man made design of wetlands used in
modern wastewater treatment. Hammer (1989) defines such innovation as constructed
wetlands.
2.2 HEAVY METALS AND ENVIRONMENTAL RISK ISSUES
Heavy metals flux is a significant environmental health issues. Generally, metals in the right
proportion are vital elements in the cells of organism and are important for healthy living.
However excessive supply of these metals might become very fatal to health. Also,
persistence exposure to low concentration of heavy metals constitutes a health risk (United
Nations- System wide Earth Watch 2006).
Day (1998), reported on health problems associated with lead poisoning which include:
neurological damages leading to secondary condition characterized by low intelligence, loss
of short memory, poor coordination and learning disabilities. In a prenatal exposure, the
condition may include low birth weight, poor immune responses or otherwise.
In adult, lead is suggested to have a linked to behavioural inhibition and even tooth decay
(Masters, 1998; Gil et., al 1996). Mercury is also a significant health issue. High
concentrations may cause nervous system damage, leading to deformities in early child
exposure, partial blindness, muscles wasting, and loss of reflex. It is also associated with low:
learning abilities, coordination, and fertilities in males (Dickman et al 1998).

12
Heavy metal like arsenic is said to cause cardiovascular disorder, skin-cancer and skin related
diseases, kidney damage and peripheral neuropathy (WHO, 1997). Copper, which is a trace
element needed in the body normal physiological performance, could cause anaemia, liver
and kidney damages, stomach and intestinal problems when in excess concentration in the
body.
Cadmium, which is another heavy metal, is closely associated with renal dysfunction, lungs
cancer, bone abnormalities such as osteonmalacia and osteoporosis on long -term exposure in
humans and animals. It bio- accumulates in the liver and kidney and it could lead to kidney
and liver failure (BFR, 2005).
Heavy metals could be a field pollutant in an agricultural land with a history of mining or
related industrial activity. For example, cadmium is absorbed by crop plants roots along
with plants nutrients; vegetables and fruits could be a link in the food chain. Also cadmium
flux is reported to associate with cigarette smoke. In seafood e.g. fin and shellfishes from
heavy metal polluted waters; the metals accumulate in the kidney and other organs and
tissues of the fish, and when consumed, its bio- accumulates (BFR, 2005).
Heavy metal toxicity to microbial community often leads to microbial tolerance. Such
tolerance is evidenced by an increase in the species dominance in the microbial community.
Such environmental resistance or tolerance could reinforce into an environmental health risk.
Bacterial tolerance to Cu, Zn, Ni and Pb was investigated by Frostegard et al. (1996). The
results shown a marked tolerance of bacterial to copper, tolerance was also reported in Zn, Ni
and Pb. It is suggested that microbial tolerance to heavy metals could be related to antibiotic
resistance, as new strains of genes will build up in bacteria resistant in a polluted
environment. Such genes resistant to chemicals may seem also to pose resistance to chemical
drugs (Spain, 2003). There is therefore a justification for the research, which in a way want to
examine the possible effects of heavy metal concentration on a wetland microbial process
such as denitrification.

13
2.3 NITROGEN REMOVAL IN WETLANDS
Nitrogen cycling is a complex natural process where nitrogen transformation between
organic, soluble inorganic and gaseous forms. In a wetland situation these three phases of
nitrogen existence is moderated by several factors within the wetland: air, water and substrate
interface. These factors include dissolved oxygen (DO), temperature, concentration of
nitrogen, pH, microbial population, types of vegetation and water flow (Bastviken, 2002)
Nitrogen transformation processes include:
Nitrogen fixation – this is a process whereby bacterial convert dinitrogen gas into ammonium
(NH4+)
Nitrogen mineralization-this is the conversion of organic nitrogen during the decaying process
of organic matter to form ammonium (ammonification) by microbial action. This process
could take place in both aerobic and anaerobic conditions. Urea is often formed and is
hydrolysed to form ammonia which transforms to ammonium within the water phase
NH2.CO.NH2 + H2O -- 2NH3 + CO2
NH3 + H2O------ NH4+ + -OH-
The NH4
+ can enter different pathway such as assimilation by plants, by microbes to form organic matter or can be immobilized by soil particles.
Nitrification:-NH4+ available in aerobic zone in the wetland is oxidized to nitrate by nitrifying
bacteria. The first stage is the formation of nitrite, followed by nitrate formation.
NH4+ +3O2---- --------------------------------------- 2NO2- + H2O + 4H+ + energy
Nitosomonans sp 2NO2- + O2----------------------------------------------- 2NO3- + energy Nitrobacteria sp NO3
- is mobile in the soil solution, thus could be absorbed by plants, leach into ground water
and pass via other pathways. The most important pathways for nitrogen reduction and
permanent removal are through denitrification (Gosselink and Mitsch, 1993).
Nitrogen assimilation. - This is the transformation of inorganic nitrogen into organic form in
the tissue of plants or micro organisms. In the wetlands emergent plants uptake of nutrients
14
have influence on the seasonal nitrogen dynamics, but the decay of the plants is a potential for
nitrogen to return in the form of organic matter and giving rise to ammonium release
(Howard, 1995).Organic materials in the sediments, traps nitrogen in organic form, which can
be released when there is disturbance of the sediment. During deposition NH4+ can also
combine with negatively charged soil particles and become immobile depending on the
chemical condition of the water.
Votalization of ammonium. - This is the physiochemical process whereby ammonium is
transformed into the gaseous form, ammonia, which may be released to the atmosphere due to
the differences in the relative concentration of ammonia between air and water. The wind
velocity, solar radiation and vegetation are also said to influence this process (Bastviken,
2002).
Denitrification- This is the microbial reduction of nitrate to N2 (dinitrogen gas). It can also be
referred to as dissimilatory nitrate removal, due to the fact that it occurs in along side with
decomposition or oxidation of organic matter. In the presence of oxygen organic materials in
the wetlands are readily mineralized by micro organisms
(CHO) n + nH2O----------- nCO2 + 4e- + 2nH+ In anoxic situations, micro-organisms utilizes nitrate, Fe3+ ,sulphate and the least carbon
dioxide for respiration depending on the redox potentials (Gosselink and Mitsch, 1993)
In oxygen limiting situations, i.e. absence of free oxygen gas nitrate is the first compound to
accept electrons from an electron donor. The process requires denitrifying bacteria, which are
active in an anoxic condition, nitrate rich environment, organic matter presence, pH of 6 – 8.5
and appropriate enzymes (Knowles, 1982).
In wetlands there is usually a vertical stratification with depth showing differences in DO
(dissolved oxygen) level, organic matter or suspended solids, and other physiochemical
parameters, such as pH and temperature and the redox potentials.
When nitrate becomes limiting the anaerobic bacterial will utilize Mn 4+ or F3+ followed by
sulphate and lastly carbon dioxide as an electron acceptor in the most anaerobic zone (Kadlec
and Knight, 1996).

15
2.4 STEPS IN DENITRIFICATION
Nitrate is first reduced to nitrite and finally to nitrous oxide or dinitrogen where nitrate, nitrite,
and nitrous oxide are electron acceptors and sub sequentially utilized (Hallin, 1998):
NO3
- -- NO2----- NO--- N2O- N2 2NO3
- + 10e- + 12H+- --------------------- - N2+ 6H2O C6H12O6 + 4NO3-
------------------------------ 6CO2 + 6 H2O +2N2 Denitrifying bacteria This process is responsible for the permanent removal of nitrogen from the wetland. Under
natural flooded soil conditions, nitrogen becomes limiting due to denitrification (Simpson et
al., 1978).The process of nitrogen flux in wetlands involves different microbial interventions,
thus the role of micro organisms is so critical in wetlands application either for urban water
treatment, industrial effluent and agricultural waste treatment facilities. Denitrification has
been identified as the primary reason wetland serves as nitrogen sink (Crumpton et al., 1993).
Other nitrogen removal routes such as plants assimilation, microbial assimilation,
dissimilatory reduction to ammonium nitrogen may account for 1- 34% of the net nitrogen
loss (Stengel et al 1987; Barlett et al 1979).
Wetlands plants are important because they aid aeration in the water column during
photosynthesis, the roots also provide surface for the attachments of microbes. The decayed
plant materials constitute the organic materials, which build up and in turn affect the
characteristics of the wetland sediment. The presence of algae is also a notable characteristic
in a wetland. Algae are important for primary productivity and aeration. The type of
vegetation in the wetland area could be the basis for characterization of a wetland. Some are
described as forest wetland, others mangrove wetland and savannah wetland. On a general
note, however, wetlands are recognized by emergent plants, submerged plants and shallow
water level with a muddy bottom. The dead plant materials are vital sources of organic matter
as energy sources for micro organisms in the sediments (Gosselink and Mitsch 1993).
16
2.5 SOME RELATED STUDIES There are past investigations relating to nitrogen flux and denitrification in wetlands situation
and these include: Bastviken (2002): Nitrogen removal in treatment wetland model and
microcosm studies; Gamble et al, (1977): Denitrifying population in natural soil samples.
Other investigations focus on the control conditions for denitrification such as the addition of
external energy sources and various impacts on denitrification (Isaac and Hanze 1995;
Andersson et al., 1995; Hallin, 1998). Sakadevan et al (1998) reported studies on the impact
of cadmium, copper and zinc on denitrification in surface wetland sediments.
2.6 RESEARCH QUESTION
The research question is whether there is any impact of heavy metals on the activities of
denitrifying bacteria in the wetland sediments.
2.7 RESEARCH OBJECTIVES The objectives of the research include:
1. To ascertain if there was denitrification in the studied sediments
2 .To find out the possible impact of some concentrations of heavy metals on the rate of
denitrification.
3. To compare the rate of denitrification in the different metal treatments and the zero
treatment (the control.
2.8 STATEMENT OF HYPOTHESIS
Null hypothesis (Ho): Heavy metal such as Pb, Zn, or Cu does not have any significant effects on
the rate of denitrification independent on the concentration
Alternative hypothesis (Hi): Heavy metal such as Pb, Zn, or Cu has significant effects on
the rate of denitrification in a certain concentration range.
17
CHAPTER THREE 3.0 METHODOLOGY
3.1 SITE FOR SEDIMENT SAMPLING AND JUSTIFICATION
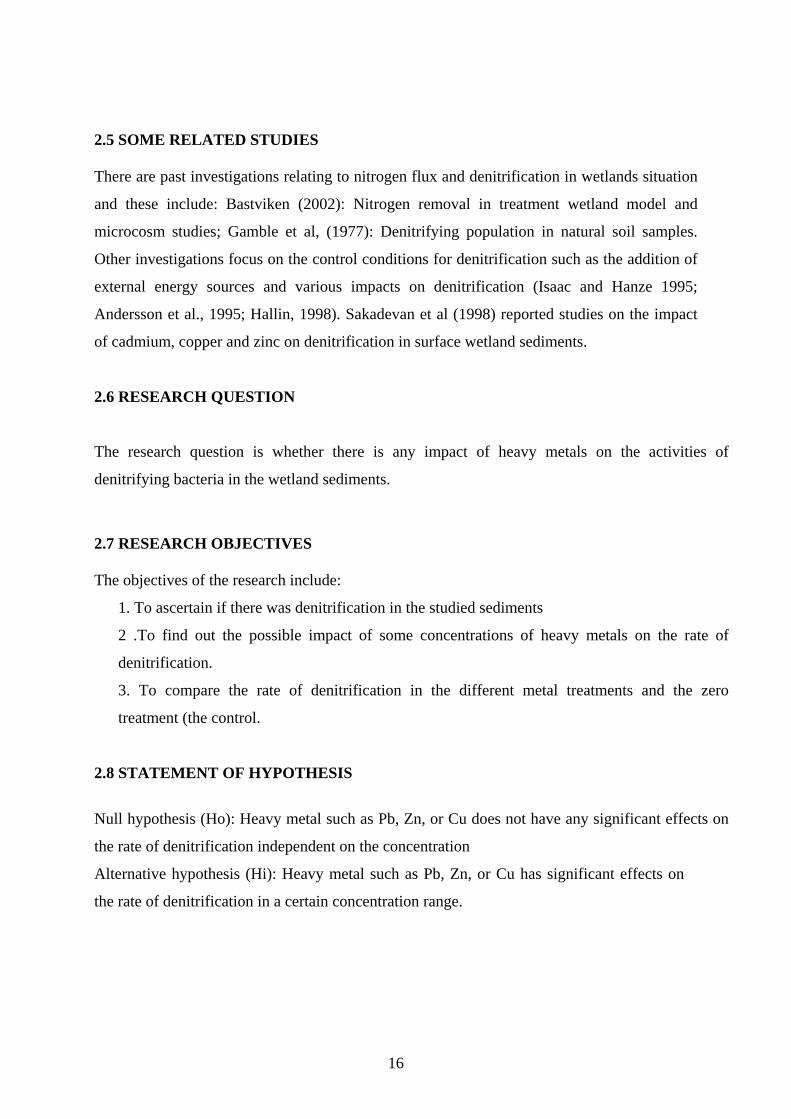
Sediment was taken from the wastewater treatment plant wetland at Nykvarn, Linköpings
Sweden (58`26N and 15` 36´E). The wetland was established in 1993 to serve as a secondary
treatment plant for the municipal wastewater nutrients removal. It consists of six ponds A1B1,
A2B2, A3B3, A3B3 arranged in series with an average area of 1000m2 and depth of 10-30cm.
The wastewater at stage A3B3 is expected to have attained high level of purification before
the water is channelled to the city river Stångån.
The common flora in the ponds includes: Typha latifolia, Lemna minor, Phalaris
arundinacea, Elodea canadensis, Glyceria maxima and Spirogyra sp. By design this
constructed wetland is expected to remove nutrients from the flux from the wastewater from
the sewage from the city. As the water moves from one pond to the other the aquatic plants,
along with biochemical processes taking place in the system help to reduce the level of
nutrients in the water. Prominent among the nitrogen removal pathway is denitrification. A
wastewater like this has the potential for accumulating loads of heavy metals, such as lead,
copper, zinc and others, thus it is justified to examine the possible impact of these heavy
metals on the efficiency of biochemical process such as denitrification.
The field studies were carried out between august 2005 and march 2006, using samples of
sediment from this site in a laboratory experimental setup.

18
Figure 1 Map showing site sediment was sampled (Linköpings)

19
MATERIALS AND METHODS
The investigation of the possible impact of heavy metals in wetland sediments on the
denitrification activities of micro organisms in a wetland receiving waste water from an urban
waste water treatment plant was carried out by laboratory analysis, drawing upon the
acetylene inhibition method in sediments slurries.
The laboratory procedure was chosen in order to have control over different environmental
factors such as sunlight, varying temperature, pH and plants which will have a combine
influence on denitrification. Sediments were taken along with the bacteria typical of wetland
sediments. An inherent content of organic matter serving as energy source for the denitrifiers
was relied upon. The organic carbon can in the alternative be ensured by external source such
as the addition of ethanol, methanol, lipids, and acetate as electron donor. These are important
conditions for denitrification process. The substrate from the wetland had been chosen in
order for the findings to have relevance to the wetland situation defined by the objective of
the study. The sediment was subjected to incubation. Nitrate was added at a specific
concentration, 1.4mg/l.
To ascertain the production of N2O compound from denitrification, gas chromatography was
used in estimating the amount of gas evolution. The production of N2O and N2 is the end
products which qualify the process of denitrification; N2O could be intermediate or final
product in some denitrification depending on the method employed for the investigation.
Glass bottles were used in the experimental setup.
3.2 MEASURING THE RATE OF DENITRIFICATION There are some methods useful in the estimation of the rate of denitrification. The approach
may be to measure nitrate consumption or nitrite production. This approach, however, does
not account for the total breakdown of nitrate (Hallin, 1998). Another approach is to measure
the amount of N2O concentration produced as a result of acetylene inhibition technique. This
has been used to investigate denitrification in soil (Pell et al., 1998; Parsons et al., 1991);
activated sludge (Hallin, 1998) and sediments (Bonin and Raymond, 1990).
The acetylene inhibition technique essentially results in reversible inhibition of N2O reductase
enzymes by acetylene, preventing the N2O from further reduction to N2. This is important due

20
to the difficulties in estimating N2 gas. In this study the standard concentration of 10%
acetylene (Yoshinari and Knowles, 1976) was used in the head space of the slurries in the
glass bottles. N2O was determined with a gas chomatograph connected to an xx detector.
Acetylene inhibition technique is said to have some weakness such as the possibility of also
inhibiting nitrification and the production of N2 despite the inhibition of N2O reductase
(Seitzinger et al., 1993).
However, most investigations in related studies have relied on this acetylene inhibition
technique (Hallin, 1998).The addition of nitrate into the aquatic sample help to avoid these
two weaknesses. The system will not rely on nitrifers to supply nitrate necessary for
denitrification efficiency.
An alternative techniques, include a15N tracer technique (Nishio et al., 1983), where, 15NO3-
is added to the denitrifying samples and the dilution of the isotope to form 14N Nitrate is
measured according to Davidsson et al., (1997). The nitrate conversion to N2 in this case is
analysed by mass spectrometry.
Another technique is the N2 flux procedure which is the direct measurement of the N2
produced during denitrification (Seitzinger, 1993). The limitation associated to this includes
the risk of contamination from the atmospheric N2. Thus, an air tight background will be
needed for the measurement (Bastviken, 2002).
The experiment to determine the effects of heavy metals, Cu, Zn and Pb on denitrification
process in wetland sediments were carried out in the laboratory under an anaerobic condition,
which is an environmental requirement for the denitrification process. A pre-experiment was
carried out with various controls, to determine the impact of the absence of nitrate and or
acetylene on the results of the denitrification assay.
3.3 PREPARATIONS A buffer solution was made: phosphate buffer 15ml of KH2PO4 (0.2M), W1 and 15ml of
NaHPO4 (0.2M), W2 made into 800cc of distilled water filled up to 900cc and shaken

21
thoroughly. 45ml of the buffer solution was administered to 10, 123ml bottles (5 treatments
and 2 parallel) needed for the experiment and then sealed with butyl rubber septa.The bottles
with the buffer solution were subjected to gas exchange operation with the nitrogen gas by
depressuring and pressuring the bottles at least five times. Afterwards and the bottles were
autoclaved for 20minutes at 120oC
Nitrate salt solution was prepared and gas exchange was performed as above. Acetate solution
was also prepared (Sodium acetate). 1.4g of KNO3 was dissolved in 100ml of distilled water
and 0.57g of acetate in 100ml of distilled water.
Sediment samples were taken from the wetland described above. The sediment materials were
filtered, homogenized and left to settle overnight .Thereafter the water above the sediment
was sucked out using a tube and syringe. 5ml of this sediment were given to each of the
parallel bottles set A/B for the various treatments 1,2,3,4 and 5 (See Table1). The dry weight
of the sediment was determined by measuring about 15ml of the slurry placed in a foil plate of
known weight and dried at 105Co overnight. It was allowed to cool and was kept dried in a
desiccator to ascertain the new weight and determine the proportionate dried weight of the
sediment that was used in the experiment.
Table: 1 Pre experiment to determine the implication of the various control treatments on
denitrification.
T Setups
A B CHCOONa NO3- C2H2 Sediment
1 x x
2 x x
3 x x
4 x x x x
5
x
(NB: x means application)
22
Treatment Levels (for concentrations see appendix 4b) 45ml of buffer to stabilize the pH necessary for the anaerobic environment. 2.5ml of nutrient 1ml of nitrate, 1ml of acetate, 5ml of sediment, 10% volume of gas phase, C2H2 making up to 7ml. These sets of control experiment were then placed in the climate room maintained at 20o C
and on a shaker platform and subsequently gas samples were taken at different time intervals;
which were 1hr , 2hrs, 4hrs, 8hrs, 24hrs and 48hrs which corresponds to T0, T1, T2, T3, T4
and T5 respectively. 1ml gas sample was taken from each assay bottle and diluted in a closed
15ml bottle from which 0.3ml of it was introduced into the GC for analysis. The obtained area
marked by the GC reader corresponds directly to the concentration of N2O. There were
responses to the various parameters under consideration (Sets of control)
Setup 1. The system had good source of nitrate, nutrient sediment and acetylene. The result
shows a progressive rise in the level of N2O that was produced during denitrification and that
the organic matter in the sediment can sustain a steady denitrification for the incubation time
used.
Setup 2. There was no nitrate and acetate but acetylene. There was lower N2O production at
the initial time, but it became more towards the last hours of the experimental sampling .The
conclusion is that some nitrate and electron donors were present in the sediment.
Setup 3. This was a control for acetylene inhibition. It was observed that the system could
only estimate a small proportion of N2O as the N2O may have likely undergo further
transformation, which means that the method worked under the conditions planned for the
assay.
Setup 4. Had all the materials, nutrient, nitrate, acetate, acetylene and sediment. There was a
steady increase in the gas concentration with time
Experimental setup 5 without nitrate, acetate, and acetylene, shows a negative value or no
response at the beginning and as the time progresses towards the end there was some release
of N2O, which can be linked to the nutrient in the sediment
23
Conclusively, acetylene inhibition method worked within the framework setup for the
experiment.
3.4 MAIN EXPERIMENTAL SETUP The materials include: wetland sediment, nitrate, nutrient, buffer and acetylene as noted
above, with chlorides of Cu, Zn and Pb.
Method: Wetland sediment was taken from the wetland site in Linköpings Nykvarn
wastewater treatment wetland. The sediment was filtered (1mm sieve), homogenized and
allowed to settle. The water level was reduced there after.
15ml of the sediment was taken and placed in the dryer maintained at 105oC for 24hrs and the
dried weight of the sediment was obtained. 45ml of the buffer were introduced to the 123ml
bottles sets of each of the experimental setup. 5ml of the wet sediment samples (inoculums)
were introduced. Nitrate (1ml), nutrient solution (trace of mineral salts 2.5ml) and acetylene
(7ml) 10% of the gas phase were also added.
Calculated amount of the metals: Cu, Zn and Pb (see appendix 4) were made in 25ml of
distilled water so that 0.1, 0.25, 0.5 and 1ml represented 100, 250, 500 and 1000 mg/kg
respectively, and as used in treatments 1, 2, 3 and 4 respectively. A control without any metal
treatment was included as the zero treatment 0T, for each of the set ups, there was three
parallels A, B and C. The experimental sets up in each case were placed on a rotary shaker for
the duration of the experiment. First installed in the climate room during the experiment 1a
(Initial Cu trial) and 1b (Initial Zn and Pb trials), and in the room temperature maintained in
the laboratory (20oC) for experiment 2(back up trials for Cu, Zn and Pb).
24
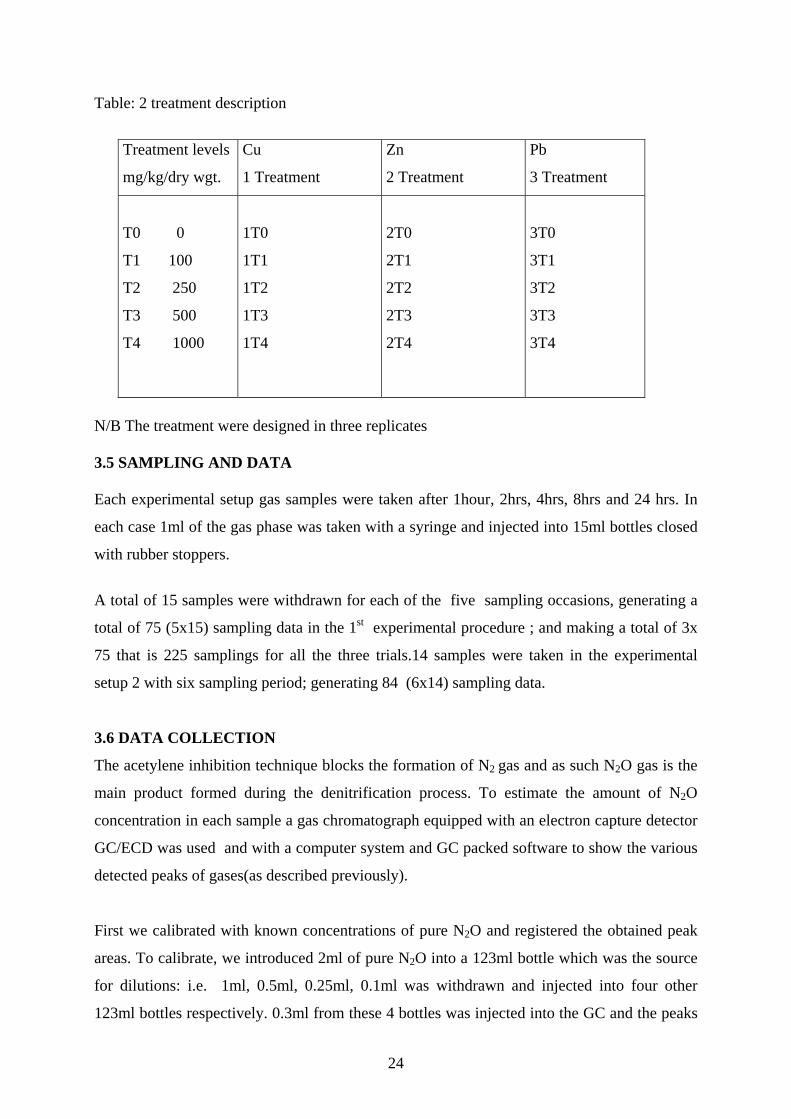
Table: 2 treatment description
Treatment levels
mg/kg/dry wgt.
Cu
1 Treatment
Zn
2 Treatment
Pb
3 Treatment
T0 0
T1 100
T2 250
T3 500
T4 1000
1T0
1T1
1T2
1T3
1T4
2T0
2T1
2T2
2T3
2T4
3T0
3T1
3T2
3T3
3T4
N/B The treatment were designed in three replicates 3.5 SAMPLING AND DATA Each experimental setup gas samples were taken after 1hour, 2hrs, 4hrs, 8hrs and 24 hrs. In
each case 1ml of the gas phase was taken with a syringe and injected into 15ml bottles closed
with rubber stoppers.
A total of 15 samples were withdrawn for each of the five sampling occasions, generating a
total of 75 (5x15) sampling data in the 1st experimental procedure ; and making a total of 3x
75 that is 225 samplings for all the three trials.14 samples were taken in the experimental
setup 2 with six sampling period; generating 84 (6x14) sampling data.
3.6 DATA COLLECTION
The acetylene inhibition technique blocks the formation of N2 gas and as such N2O gas is the
main product formed during the denitrification process. To estimate the amount of N2O
concentration in each sample a gas chromatograph equipped with an electron capture detector
GC/ECD was used and with a computer system and GC packed software to show the various
detected peaks of gases(as described previously).
First we calibrated with known concentrations of pure N2O and registered the obtained peak
areas. To calibrate, we introduced 2ml of pure N2O into a 123ml bottle which was the source
for dilutions: i.e. 1ml, 0.5ml, 0.25ml, 0.1ml was withdrawn and injected into four other
123ml bottles respectively. 0.3ml from these 4 bottles was injected into the GC and the peaks
25
areas were observed. Higher concentration in the samples, which cannot be processed by the
GC/ECD, will require further dilution before re injection. The analysis were performed for the
various samples using 0.3ml of the diluted gas, injecting it into the GC and noting and
registering the peak for N2O.
There were occasions for dilution for the last two sampling occasions for the experimental set
up2. 0.5ml of the samples was withdrawn from 15ml bottles, injected into 12.3ml bottles and
mixed, and then from these, 0.3ml was injected in the GC. Peaks were observed and
registered. These values form the basic data, which were primary research data. The
registered peaks were then subjected to further deductions to convert the area to
concentration.
3.7 DATA ANALYSIS AND STATISTICS
The research aim was to find out if there was any impact of the treatment (heavy metal) on the
rate of denitrification. One can estimate the rate of amount of N2O evolved from the gas phase
of the experimental setup at the various time intervals. We can ascertain this amount of N2O
produced to be a dependent (y) variable, while time an independent (x) variable. The amounts
of N2O produced by the parallel were taken as data(y). A standard curve was obtained from
the area results of the calibration data and y (N2O concentration) was estimated from the
standard curve formula and the concentration was then used for a linear regression.
The coefficient of correlation (R) was estimated from the R Square (fitness of the curve) and
comparison was made between the control, and the various metal treatments and their
concentration levels. The slope of the graph represents the rate of denitrification, thus for each
of the treatment these rates were compared with that of the control. The slope of the graph is
the change in Y/change in X. The statistical tools used were Excel for the linear regression
and the graphs and SPSS for multiple regression analysis and a confidence interval of 95%.
Concerning the R2 value, high values indicate a positive trends or fitness of data while low
values indicate poor fitness of data.
26
CHAPTER FOUR
DATA PRESENTATION, ANALYSIS, RESULTS AND DISCUSSION The first trials on Cu were made a day after the sediment samples were collected from
Nykvarn. There was a substantial denitrification occurring (appendix 1 table 1). The trials for
Zn and Pb could not follow as scheduled, but were carried out after two weeks. The results
showed poor microbial activities compare to those for copper and the activity had ceased after
eight hour of incubation. The possible explanation to these observations will be given in the
discussion. This situation necessitated the back up trials, which was the experimental setup 2
for treatment levels T3 (500 mg/kg) and T4 (1000 mg/kg). See Table 2. Data are presented in
Appendix 1(tables 6, 7, and 9).
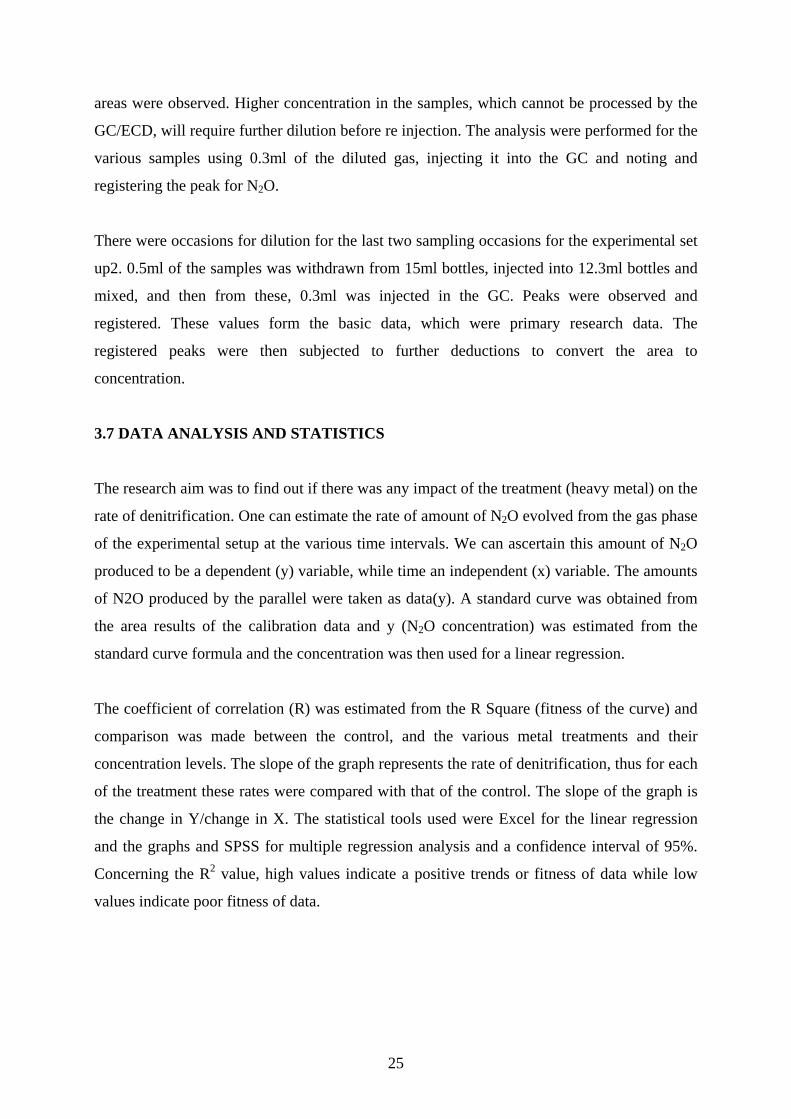
The results of experimental set up 1a, where Cu was used in treatment at 4 levels, are
described in the following graphs and the details of data appendix (1).
Figures 2 Copper control treatment 000mg/kg of sediment (Cu 1T0) with y1, (y2, and y3 same regression line) representing A, B, C parallels respectively.
Zero treatment (0.00mg)/kg sediment
y1 = 6,3954x + 18, 04R2 = 0, 9917
y2 = 7,807x + 18,481R2 = 0, 9783
y3 = 7,807x + 18,481R2 = 0, 9783
01020304050607080
0 2 4 6 8Time (hours)
N2O (ppm)
27
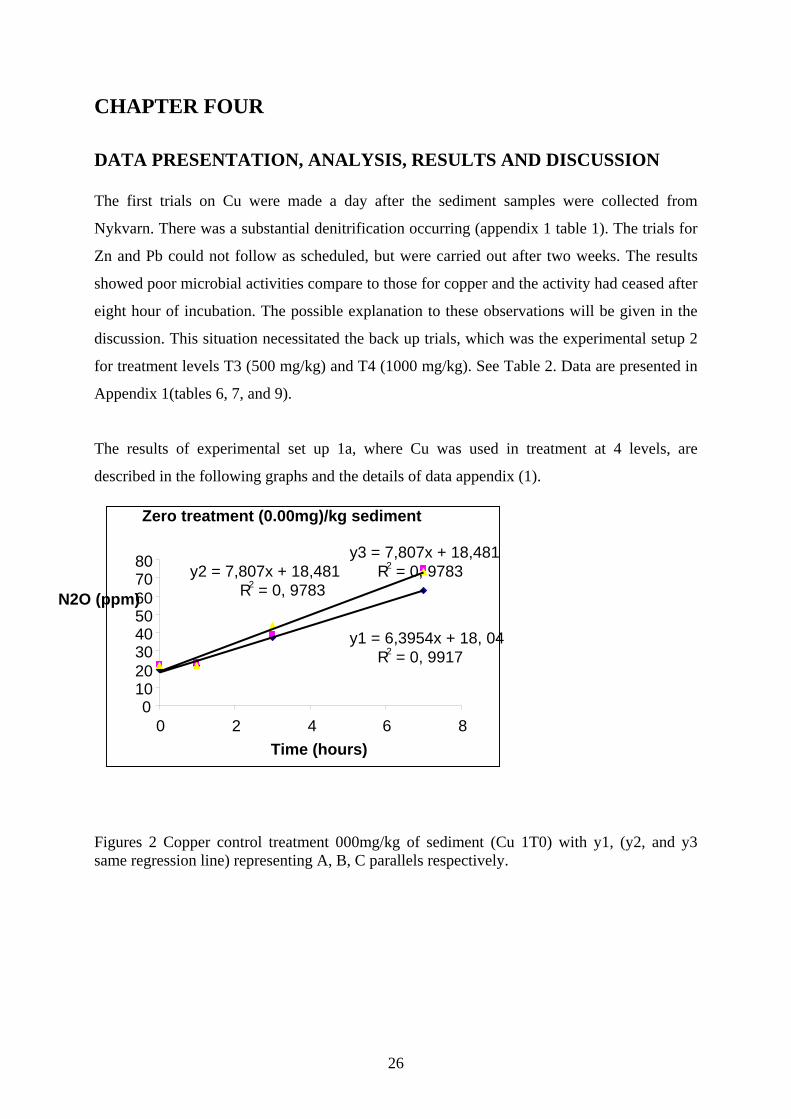
Figure 3 Cu treatment Experiment 1a (1T1) 100 mg/kg sediment treatment, with y1, y2, y3 representing parallels A, B, C respectively.
Figure 4 Exp 1a Cu (1T2) 250 mg/kg sediment treatment, with y1, y2, y3 representing parallels A, B, C respectively.
Cu 100mg/kg of sediment
y1 = 7,2251x + 12,293R2 = 0, 9913
y2 = 6,6893x + 17,962R2 = 0, 9972
y3 = 9,1269x + 9, 6886R2 = 0, 9991
01020304050607080
0 1 2 3 4 5 6 7 8Time (hours)
Cu 250mg/kg of sediment
y1 = 7,5148x + 7, 5843R2 = 0, 9901
y2= 6,9002x + 9, 7845R2 = 0, 9769
y3 = 8,0026x + 9, 7078R2 = 0, 9891
010203040506070
0 1 2 3 4 5 6 7 8Time (hours)
N2O (ppm)
N2O (ppm)

28
Figure 5 Exp 1a Cu treatment (1T3) 500 mg/kg sediment treatment, with y1, y2, y3 representing parallels A, B, C respectively.
Figure 6 Cu trials 1T4 1000 mg/kg sediment treatment, with y1, y2.y3 representing A, B, C parallels respectively.
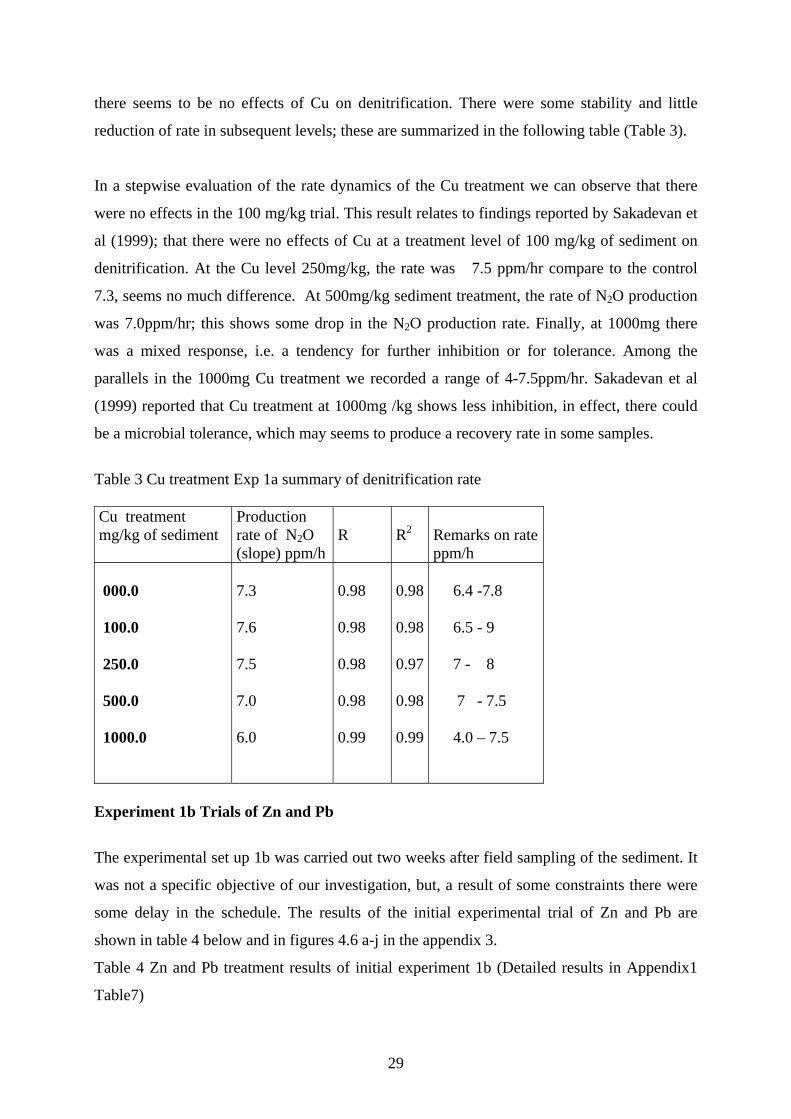
The summary of results from the first trial with Cu is shown in table 3. The rate of N2O
production as an evidence of denitrification by the denitrifying microbial community in Cu
treatment is given. This, however, cannot be asserted conclusively until we are able to
compare these values with other treatments. It is shown here, however, that the rate for the
control experiment (that does not have any copper salt) to be between 6.4 ppm/hr and 7.8
ppm/hr, which the treatment 1T1 also seems to give. It means at 100 mg/kg treatment level
Cu 500mg/kg of sediment
y1 = 6,9652x + 7, 0157R2 = 0, 9997
y 2= 7,1785x + 8,7116R2 = 0, 9842
y3 = 7,6443x + 8, 7108R2 = 0, 9788
010203040506070
0 1 2 3 4 5 6 7 8Time (hours)
Cu 1000mg/kg of sediment
y2 = 6,313x + 8, 3169R2 = 0, 9942y1 = 4,0651x + 13,053
R2 = 0, 9827
y3 = 7,599x + 7, 5051R2 = 0, 9993
010203040506070
0 1 2 3 4 5 6 7 8Time (hours)
N2O (ppm)
N2O (ppm)
29
there seems to be no effects of Cu on denitrification. There were some stability and little
reduction of rate in subsequent levels; these are summarized in the following table (Table 3).
In a stepwise evaluation of the rate dynamics of the Cu treatment we can observe that there
were no effects in the 100 mg/kg trial. This result relates to findings reported by Sakadevan et
al (1999); that there were no effects of Cu at a treatment level of 100 mg/kg of sediment on
denitrification. At the Cu level 250mg/kg, the rate was 7.5 ppm/hr compare to the control
7.3, seems no much difference. At 500mg/kg sediment treatment, the rate of N2O production
was 7.0ppm/hr; this shows some drop in the N2O production rate. Finally, at 1000mg there
was a mixed response, i.e. a tendency for further inhibition or for tolerance. Among the
parallels in the 1000mg Cu treatment we recorded a range of 4-7.5ppm/hr. Sakadevan et al
(1999) reported that Cu treatment at 1000mg /kg shows less inhibition, in effect, there could
be a microbial tolerance, which may seems to produce a recovery rate in some samples.
Table 3 Cu treatment Exp 1a summary of denitrification rate Cu treatment mg/kg of sediment
Production rate of N2O (slope) ppm/h
R
R2
Remarks on rateppm/h
000.0 100.0 250.0 500.0 1000.0
7.3 7.6 7.5 7.0 6.0
0.98 0.98 0.98 0.98 0.99
0.98 0.98 0.97 0.98 0.99
6.4 -7.8 6.5 - 9 7 - 8 7 - 7.5 4.0 – 7.5
Experiment 1b Trials of Zn and Pb
The experimental set up 1b was carried out two weeks after field sampling of the sediment. It
was not a specific objective of our investigation, but, a result of some constraints there were
some delay in the schedule. The results of the initial experimental trial of Zn and Pb are
shown in table 4 below and in figures 4.6 a-j in the appendix 3.
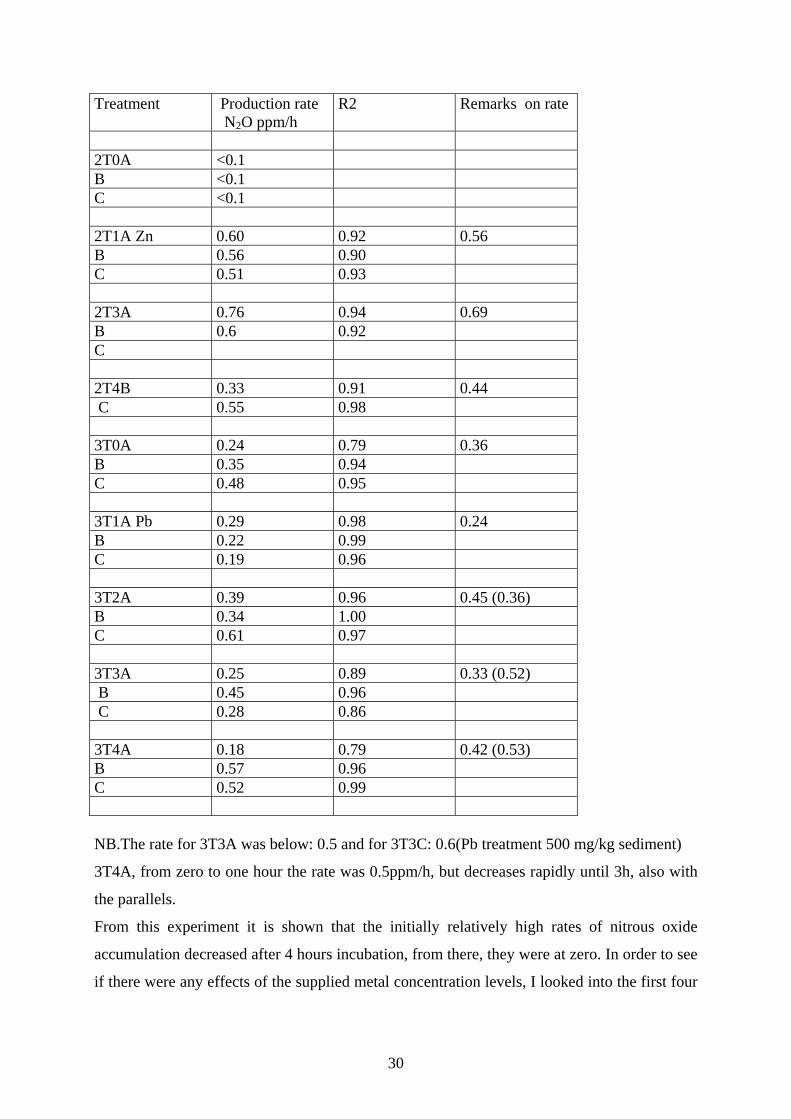
Table 4 Zn and Pb treatment results of initial experiment 1b (Detailed results in Appendix1
Table7)
30
Treatment Production rate N2O ppm/h
R2 Remarks on rate
2T0A <0.1 B <0.1 C <0.1 2T1A Zn 0.60 0.92 0.56 B 0.56 0.90 C 0.51 0.93 2T3A 0.76 0.94 0.69 B 0.6 0.92 C 2T4B 0.33 0.91 0.44 C 0.55 0.98 3T0A 0.24 0.79 0.36 B 0.35 0.94 C 0.48 0.95 3T1A Pb 0.29 0.98 0.24 B 0.22 0.99 C 0.19 0.96 3T2A 0.39 0.96 0.45 (0.36) B 0.34 1.00 C 0.61 0.97 3T3A 0.25 0.89 0.33 (0.52) B 0.45 0.96 C 0.28 0.86 3T4A 0.18 0.79 0.42 (0.53) B 0.57 0.96 C 0.52 0.99 NB.The rate for 3T3A was below: 0.5 and for 3T3C: 0.6(Pb treatment 500 mg/kg sediment)
3T4A, from zero to one hour the rate was 0.5ppm/h, but decreases rapidly until 3h, also with
the parallels.
From this experiment it is shown that the initially relatively high rates of nitrous oxide
accumulation decreased after 4 hours incubation, from there, they were at zero. In order to see
if there were any effects of the supplied metal concentration levels, I looked into the first four
31
measuring points by letting the 1-hour sampling be set to zero and the others adjusted
accordingly, this was taken as there could be a natural delay in microbial activity in a system.
The R2 values (0.8-1.0) show that there is an almost linear relationship for most of the
accumulation occurring during the first four hours. The graphs then seem flattens out at some
point before ten hour. There was also a remarkable difference between the replicates, which
seems very unusual as the experiment was conducted in the same condition (Appendix 3
(Figures 7 c, d, e, f, g, and i)).
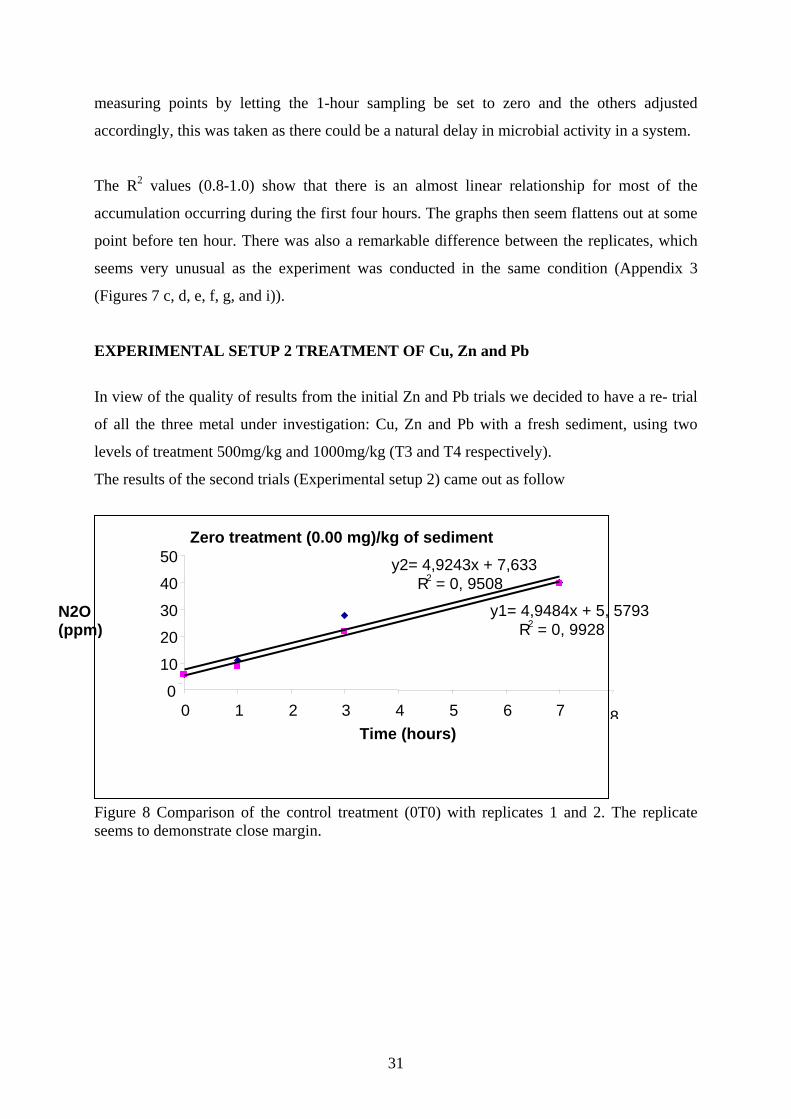
EXPERIMENTAL SETUP 2 TREATMENT OF Cu, Zn and Pb
In view of the quality of results from the initial Zn and Pb trials we decided to have a re- trial
of all the three metal under investigation: Cu, Zn and Pb with a fresh sediment, using two
levels of treatment 500mg/kg and 1000mg/kg (T3 and T4 respectively).
The results of the second trials (Experimental setup 2) came out as follow
Figure 8 Comparison of the control treatment (0T0) with replicates 1 and 2. The replicate seems to demonstrate close margin.
Zero treatment (0.00 mg)/kg of sediment
y1= 4,9484x + 5, 5793R2 = 0, 9928
y2= 4,9243x + 7,633R2 = 0, 9508
0
10
20
30
40
50
0 1 2 3 4 5 6 7 8Time (hours)
N2O (ppm)
32
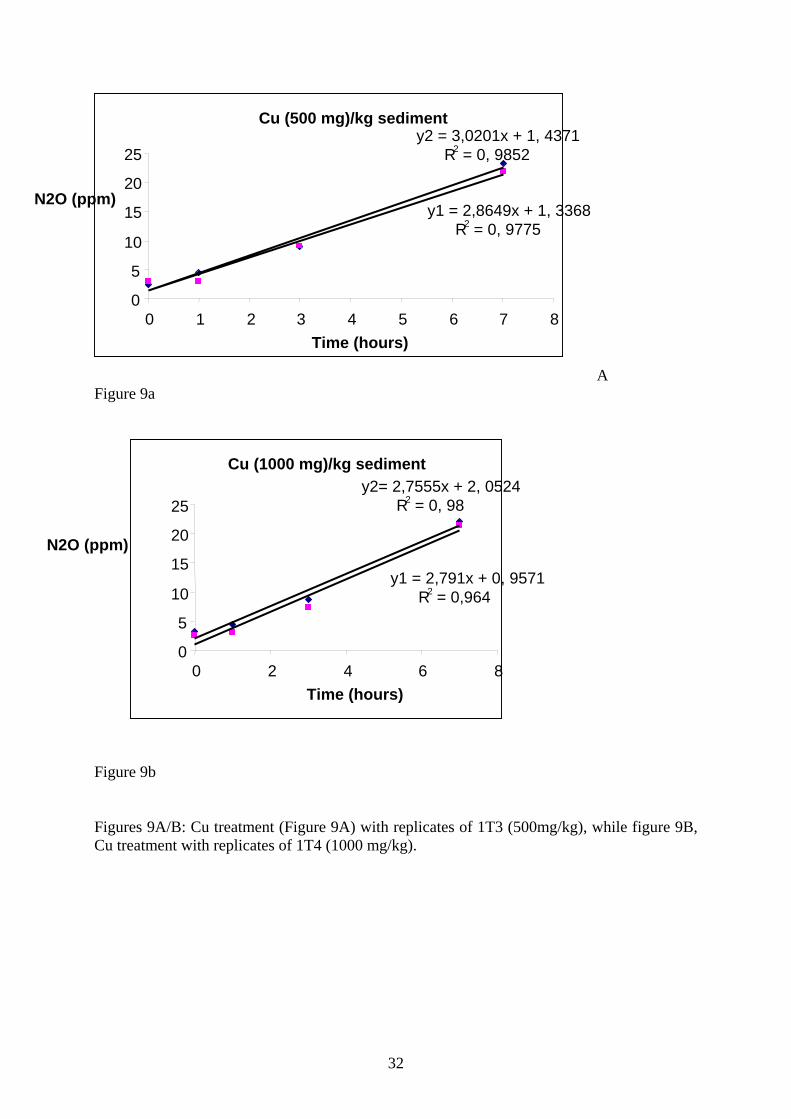
A Figure 9a
Figure 9b Figures 9A/B: Cu treatment (Figure 9A) with replicates of 1T3 (500mg/kg), while figure 9B, Cu treatment with replicates of 1T4 (1000 mg/kg).
Cu (500 mg)/kg sedimenty2 = 3,0201x + 1, 4371
R2 = 0, 9852
y1 = 2,8649x + 1, 3368R2 = 0, 9775
0
5
10
15
20
25
0 1 2 3 4 5 6 7 8Time (hours)
Cu (1000 mg)/kg sedimenty2= 2,7555x + 2, 0524
R2 = 0, 98
y1 = 2,791x + 0, 9571R2 = 0,964
0
5
10
15
20
25
0 2 4 6 8Time (hours)
N2O (ppm)
N2O (ppm)
33
A
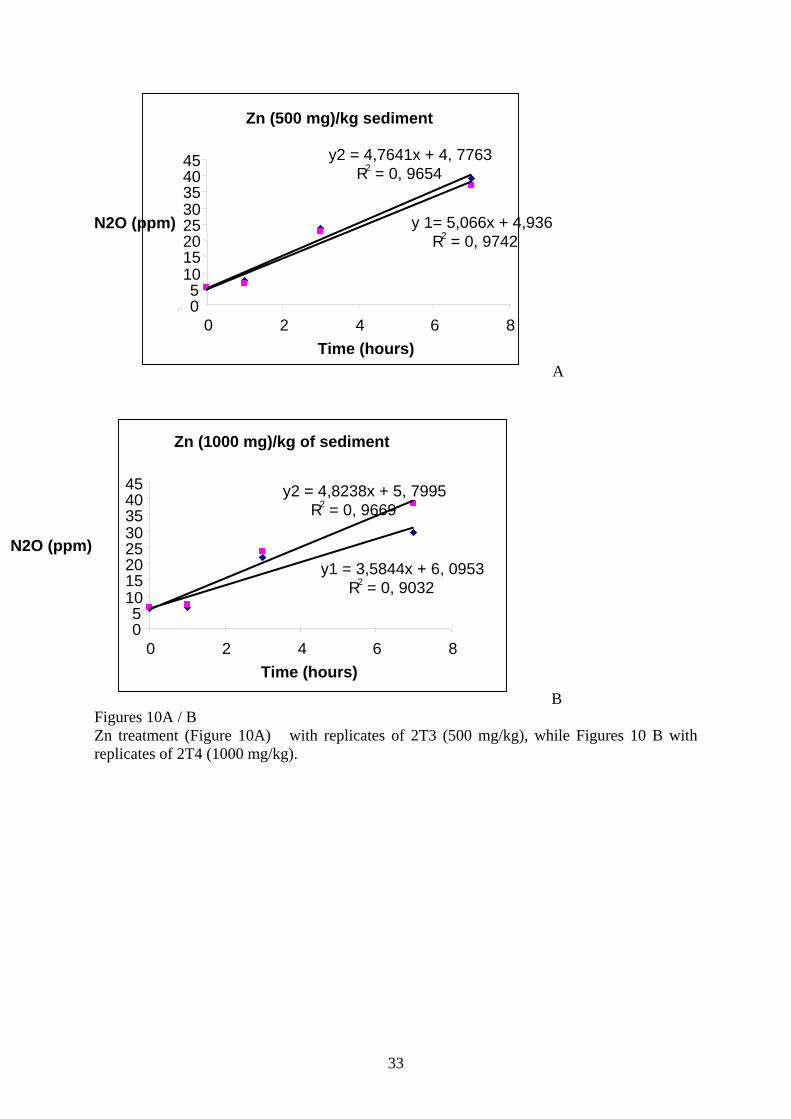
B Figures 10A / B Zn treatment (Figure 10A) with replicates of 2T3 (500 mg/kg), while Figures 10 B with replicates of 2T4 (1000 mg/kg).
Zn (500 mg)/kg sediment
y2 = 4,7641x + 4, 7763R2 = 0, 9654
y 1= 5,066x + 4,936R2 = 0, 9742
05
1015202530354045
0 2 4 6 8Time (hours)
N2O (ppm)
Zn (1000 mg)/kg of sediment
y2 = 4,8238x + 5, 7995R2 = 0, 9669
y1 = 3,5844x + 6, 0953R2 = 0, 9032
05
1015202530354045
0 2 4 6 8Time (hours)
N2O (ppm)
34
A
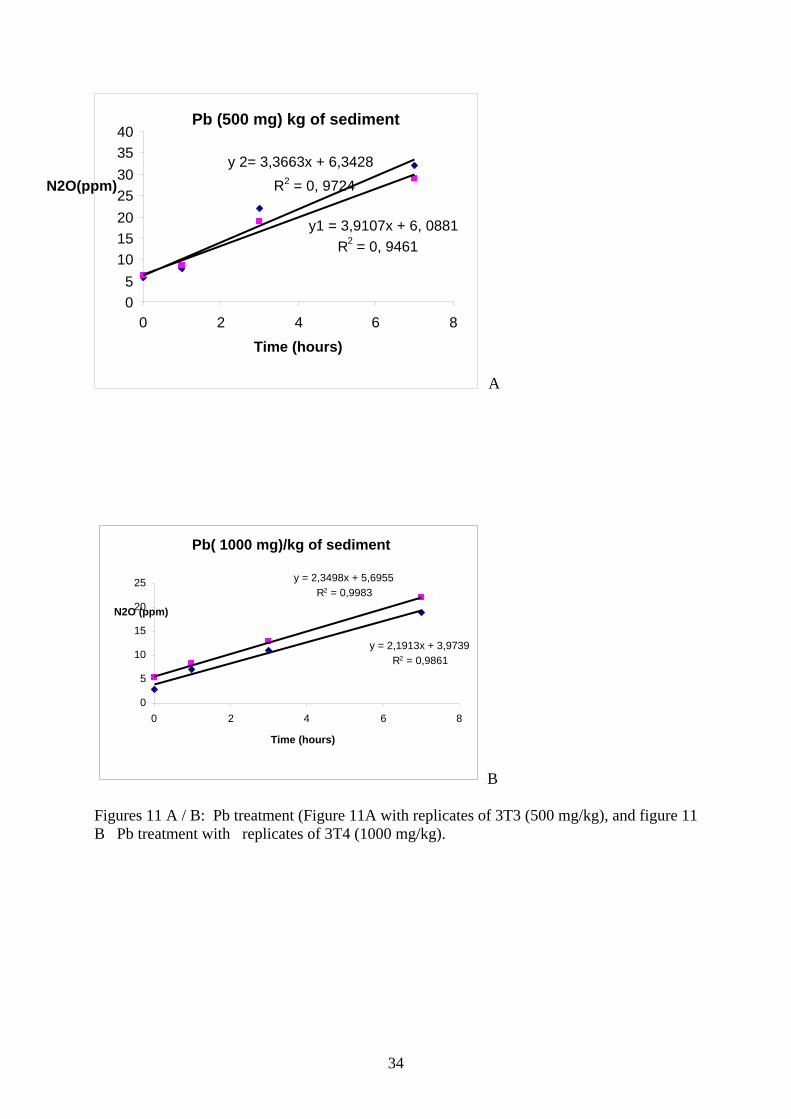
B Figures 11 A / B: Pb treatment (Figure 11A with replicates of 3T3 (500 mg/kg), and figure 11 B Pb treatment with replicates of 3T4 (1000 mg/kg).
Pb (500 mg) kg of sediment
y 2= 3,3663x + 6,3428
R2 = 0, 9724
y1 = 3,9107x + 6, 0881R2 = 0, 9461
05
10152025303540
0 2 4 6 8
Time (hours)
Pb( 1000 mg)/kg of sediment
y = 2,3498x + 5,6955R2 = 0,9983
y = 2,1913x + 3,9739R2 = 0,9861
0
5
10
15
20
25
0 2 4 6 8
Time (hours)
N2O (ppm)
N2O(ppm)
35
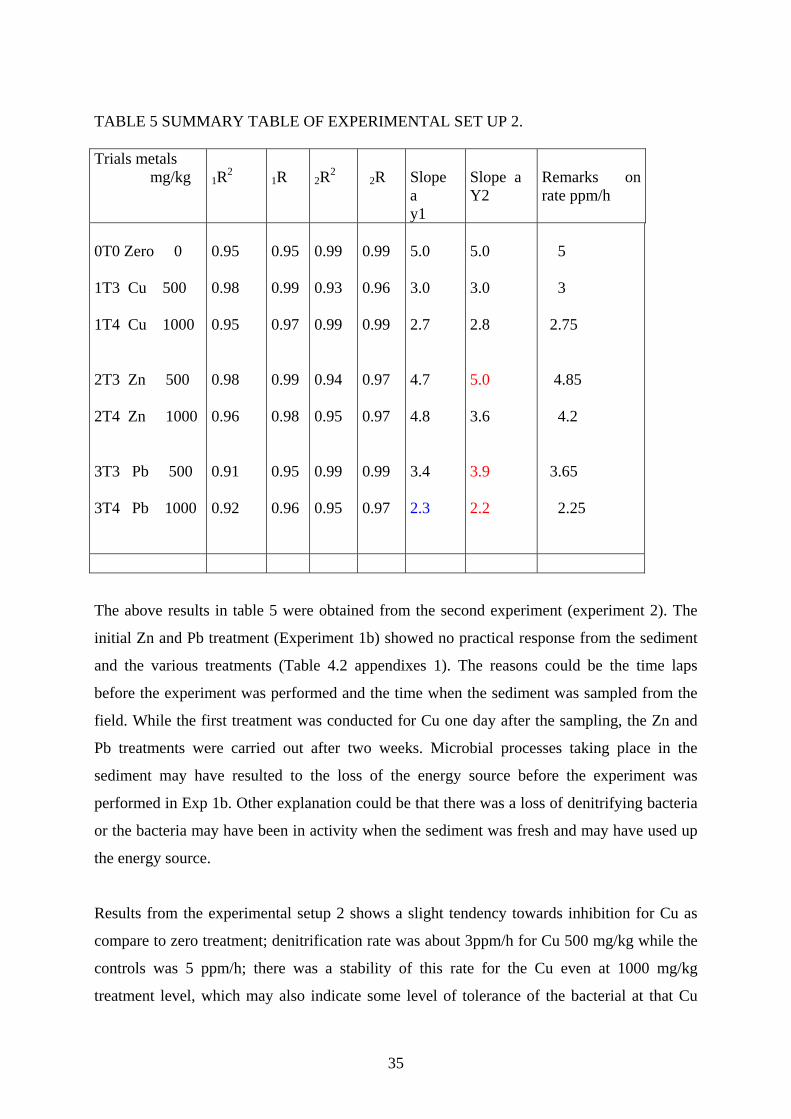
TABLE 5 SUMMARY TABLE OF EXPERIMENTAL SET UP 2. Trials metals mg/kg
1R2
1R
2R2
2R
Slope a y1
Slope a Y2
Remarks on rate ppm/h
0T0 Zero 0 1T3 Cu 500 1T4 Cu 1000 2T3 Zn 500 2T4 Zn 1000 3T3 Pb 500 3T4 Pb 1000
0.95 0.98 0.95 0.98 0.96 0.91 0.92
0.95 0.99 0.97 0.99 0.98 0.95 0.96
0.99 0.93 0.99 0.94 0.95 0.99 0.95
0.99 0.96 0.99 0.97 0.97 0.99 0.97
5.0 3.0 2.7 4.7 4.8 3.4 2.3
5.0 3.0 2.8 5.0 3.6 3.9 2.2
5 3 2.75 4.85 4.2 3.65 2.25
The above results in table 5 were obtained from the second experiment (experiment 2). The
initial Zn and Pb treatment (Experiment 1b) showed no practical response from the sediment
and the various treatments (Table 4.2 appendixes 1). The reasons could be the time laps
before the experiment was performed and the time when the sediment was sampled from the
field. While the first treatment was conducted for Cu one day after the sampling, the Zn and
Pb treatments were carried out after two weeks. Microbial processes taking place in the
sediment may have resulted to the loss of the energy source before the experiment was
performed in Exp 1b. Other explanation could be that there was a loss of denitrifying bacteria
or the bacteria may have been in activity when the sediment was fresh and may have used up
the energy source.
Results from the experimental setup 2 shows a slight tendency towards inhibition for Cu as
compare to zero treatment; denitrification rate was about 3ppm/h for Cu 500 mg/kg while the
controls was 5 ppm/h; there was a stability of this rate for the Cu even at 1000 mg/kg
treatment level, which may also indicate some level of tolerance of the bacterial at that Cu
36
treatment level (table 4). Zn shows comparable denitrification rate to the control at 500mg/kg
sediment treatment (4.85ppm/h) and a lesser rate of 4.2ppm/h at 1000 mg/kg of sediment
treatment. Pb shows a denitrification rate of about 3.7 ppm/h at 500 mg /kg of sediment
treatment and also. 2.25 ppm/hr in1000 mg /kg of sediment, such lower rate for Pb were
expected due to high toxicity of Pb to micro organisms (Sakadevan et al 1999). The data were
further analysed using multiple regression to see if there is any significant response by the
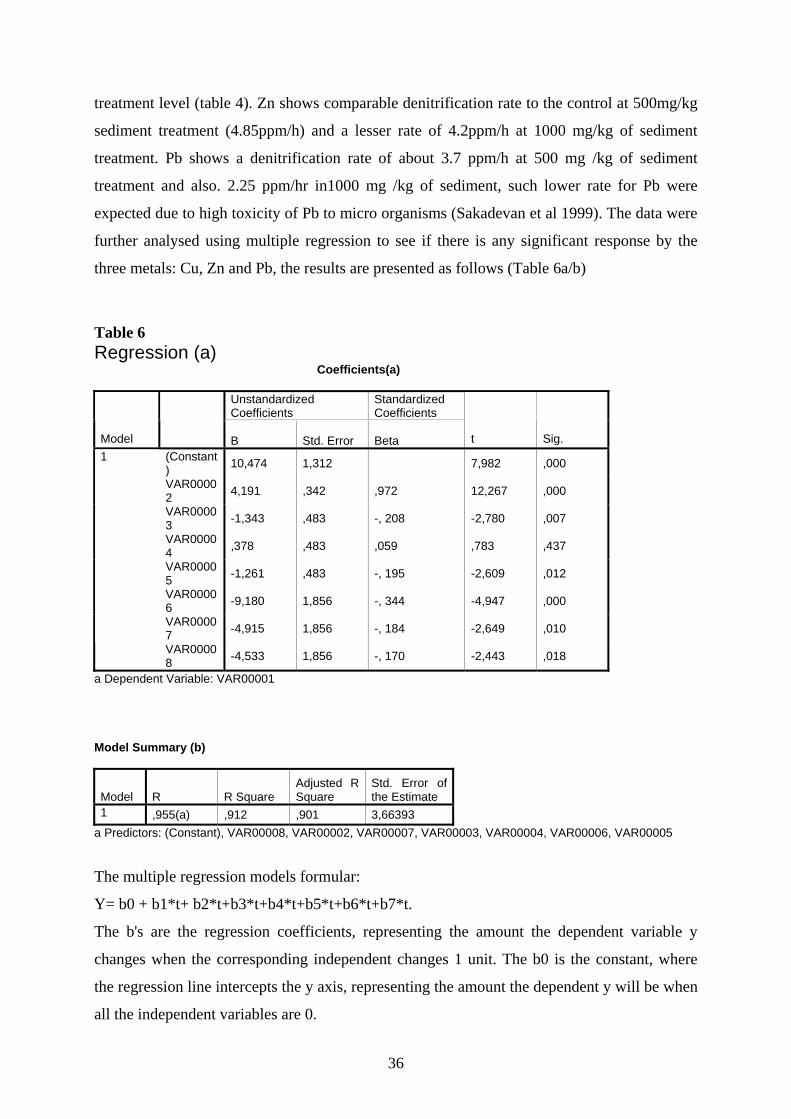
three metals: Cu, Zn and Pb, the results are presented as follows (Table 6a/b)
Table 6 Regression (a) Coefficients(a)
Unstandardized Coefficients
Standardized Coefficients
Model B Std. Error Beta t Sig. (Constant) 10,474 1,312 7,982 ,000
VAR00002 4,191 ,342 ,972 12,267 ,000
VAR00003 -1,343 ,483 -, 208 -2,780 ,007
VAR00004 ,378 ,483 ,059 ,783 ,437
VAR00005 -1,261 ,483 -, 195 -2,609 ,012
VAR00006 -9,180 1,856 -, 344 -4,947 ,000
VAR00007 -4,915 1,856 -, 184 -2,649 ,010
1
VAR00008 -4,533 1,856 -, 170 -2,443 ,018
a Dependent Variable: VAR00001 Model Summary (b)
Model R R Square Adjusted R Square
Std. Error of the Estimate
1 ,955(a) ,912 ,901 3,66393 a Predictors: (Constant), VAR00008, VAR00002, VAR00007, VAR00003, VAR00004, VAR00006, VAR00005
The multiple regression models formular:
Y= b0 + b1*t+ b2*t+b3*t+b4*t+b5*t+b6*t+b7*t.
The b's are the regression coefficients, representing the amount the dependent variable y
changes when the corresponding independent changes 1 unit. The b0 is the constant, where
the regression line intercepts the y axis, representing the amount the dependent y will be when
all the independent variables are 0.

37
Where, b0 is the B constant, b1, b2, b3, b4, b5, b6 and b7 are the beta for the various variables
2-8 respectively.
Cu is b5, Zn b6 and Pb b7.
Y0 = 10.47+ 4.19*0+ -1.3*0+0.34*0+-1.2*0+-9.1*0+-4.9*0+-4.5*0
Y0 = 10.5
Y1 intercept for Cu:
Y1 = bo + 4.19*0+ -1.3*0+0.34*0+-1.2*0+-9.18*1+-4.9*0+-4.5*0
Y1= 10.47- 9.18 = 1.3
Y2, intercept for Zn:
Y2 = bo+ 4.19*0+ -1.3*0+0.34*0+-1.2*0+-9.18*0+-4.9*1
Y1 = 10.47 -4.9 = 5.56
Y3, intercept for Pb
Y3 = bo+4.19*0+ -1.3*0+0.34*0+-1.2*0+-9.1*0+-4.9*0+-4.5*1
Y3 = 10.47-4.5 = 5.9
COMPARING RESULTS OF EXPERIMENTS 1 AND 2
A quick summary of the two experiments, the first experiment gives generally; twice as high
rate of N2O production as in the 2nd experiment. More precisely, in the control experiment
N2O production rate was 9ppm/h (Experimental set up 1) , while that of experimental set up
2(1T0) was 5ppm/h. 1T0 in these two experiments it shows a tendency towards less N2O
production in the experiment 2. In these two experiments, the sediment samples were taken
from the same pond; samples were homogenized and used a day after field sampling in each
case. The difference could be due to differences in the supply of energy from the organic
matter for the denitrification, as a result of differences in the dry weight of the sediment or
other nutritional difference between the two sediment samples. 1T3 treatment for Exp 1a was
7.2ppm/h while in Exp 2 was 3ppm/h. 1T4 treatment shows a similar trend, it was between
4.0 -7.5ppm/h in Exp 1 while in Exp 2 we observed approximately 3ppm/h.
The results in Exp 1b show some poor response for N2O production, when the sediment was
used after two weeks. It was indicated that sediment should be used when it is fresh so as to
38
avoid drying, water accumulation, freezing, loss of energy and value and microbial
community and enzyme activity resulting from prolong storage (Andersen 1987, Dick et al
1996, and Öhlinger 1995). Nevertheless, we used our sediment within a day, thus, the
differences in the result would rather be a product of the dynamics in the wetland influent vis-
avis the microbial activities and other factors outlined earlier in the discussion. Sun et al
(1999) and Dunne and Culleton (2004) indicated the possibility for differences in the results
between trials in the same wetland land sediments due to numerous interacting factors that
define the water quality and the sediment at different time.

39
CHAPTER FIVE
SUMMARY AND CONCLUSION
The research aimed at finding out if denitrification occurred in the wetland sediment and if
there were any effects of heavy metals (Cu, Zn and Pb) at different levels of concentration on
the rate of denitrification process. For this purpose we compared the rate of denitrification
resulting from the various treatments. The null hypothesis was: there were no effects of Cu,
Zn and Pb on the rate of denitrification and an alternative hypothesis, which stated that the
different concentrations of heavy metal Cu, Zn and Pb have significant effects on the rate of
denitrification.
In the acetylene inhibition technique, N2O gas is a major indicator of denitrification as N2 as
the final product is restricted by the C2H2 introduced into the gas phase of our bottles (Hallin
1998). Certainly, from our studies we observed that N2O gas was detected from the gas
samples injected into the GC
What were the effects of the heavy metals on the rate of denitrification?
Denitrification is an important process in nitrogen cycle. In a wetland situation it account for a
major pathway for nitrogen removal, thus, minimizing the problems associated to high
nutrient load such as eutrophication. Heavy metals, like Cu, Zn and Pb, are associated with
many materials, which can easily leach into the aquatic system. Thus, it is vital to ask if there
is any impacts of heavy metals on this, vital ecological process.
The observed production of N2O from the experiments, where wetland sediment was treated
with different concentrations of Cu, Zn or Pb, were compared with the control (where there
was no addition of metal), with a multiple regression the results were presented in table 6a/b,
details are in appendix 2.
40
As a summary, we found that there was no significant effect on the rate of denitrification by
Cu at 100 mg/kg concentration. Inhibition of denitrification occurred at the concentration
levels: of 500 mg/kg and 1000 mg /kg of sediment. However, Cu at the higher concentration
does not seem to create higher inhibition, as compare to 500mg/kg. There seems to be
tolerance in microbial response.
The results from Zn trials shows also inhibition of denitrification (Table 5), at 1000 mg /kg
sediment the rate of denitrification was reduced from 5ppm/h to about 3.6ppm/h this result
however buttresses the fact that higher concentration of Zn may increase the inhibition on the
rate of denitrification.
In a similar evaluation between the control samples and treatment with lead (Pb), at 500 mg /kg
sediment treatment, there was a reduction in the rate of denitrification 3.6ppm/h as compare to
5ppm/h of the control. Also, slow down in the rate of denitrification was observed in1000mg/kg
sediment treatment; the observed rate of denitrification was 2.25ppm/h (Table 5)
CONCLUSION In the studies we found out that heavy metals like Cu, Zn and Pb do inhibit the rate of
denitrification in wetland sediment when available in high concentration of 500mg/kg of
sediment. At lower concentration =<100 mg/kg of sediment) there were no significant
impacts on denitrification.
Also, the different heavy metals had different inhibition impacts on the rate of denitrification
and inhibition could result from different factors such as the quality of the sediment define by
the time after sampling.
SUGGESTIONS Studies of wetlands sediment is an interesting area useful in environmental management. To
be effective in undertaking such a research there is a need for interest and a sound knowledge
of the background. Wetland related research have been very interesting to me so, there was a
high motivation in all aspects of the studies. As noted in some parts of the work, wetlands
studies are relevant in getting research data concerning the human impacts on the ecosystem
within a catchments basin.
41
Granted, the duration of the studies was short, more research questions could be examined in
further investigations such as: What happens in the water phase e.g how does the
concentration of ammonium changes during denitrification?; What is the rate of
denitrification measured during a longer time study, than the ones presented in this study;
How does temperature affects the rate of denitrification?; What could be the result if we based
our treatment dosage on wet weight, instead of dried weight?
These questions are interesting because in the first place, ammonium is lethal to fish at high
concentrations. Measuring the rate of denitrification in a longer period of time will help to
assess what happens over time as the wetland continuously receives the heavy metals
pollutants. Temperature is equally a vital measure of water quality and process reactions. In
the wetland there are daily variations and seasonal variations which do have impacts on
microbial processes. In most experiments dried weight is often taken for measurement as
water constitutes the highest % of the sediment composition. However, in the field, all
wetland is inundated most seasons, thus the question of wet weight evaluation for treatment
level may sounds reasonable.
42
LIST OF REFERENCES Andersons J.P.E. (1987): Handling and storage of soils for pesticide experiments In: L. Somerville and M.P. Greaves, Editors, pesticides effects on Micro flora Taylor and Francis, London (1987), 45–60 Anderson B, Nyberg .U & Aspegren .H (1995): Methanol and ethanol as carbon sources for denitrification: Nordic seminar on nitrogen removal from municipal wastewater: 23-25 January 1995. Helsinki University Otaniemi Espoo Finland. Bartlett M S., Brown, L C Hanes N .B, & Nickerson N .H 1979. Denitrification in freshwater wetland soil. Journal of Environmental Quality, 8(4): 460-464 Bastviken. S K. (2002): Nitrogen removal in treatment wetlands _ model and microcosm studies. Institute of technology, department of biology IFM thesis no. 947, Linköpings University Beasley and Kneale (2001): Working Paper 01/07 Macro invertebrates, heavy metals, and PAHs in Urban Water course. Department of geography Leeds University BFR, Federal Institute for Risk Assessment, Thielallee 88-92. D-14195 Berlin 11/08/2005: Overview, Press Heavy Metals in Ceramic Glaze can pose risk to health. Bonin P. and Raymond N (1990): Effects of oxygen on denitrification in marine sediments: Hydrobiogia no. 207 , 115-122 Chandler R D 1994, Estimating annual non point pollution loads Journal of management in engineering 10. (6) 50-59 Cowardin L. M; Carter F.; C Golet & LaRoe E. T (1979): Classification of wetlands and deepwater or habitats of the United State. US Fish and Wildlife Service pub: FWS/OBS-79/31 Washington DC. 103 Crumpton W. G; Isenhart T. M & Fisher W .S (1993): Fate of non point source nitrate load in freshwater wetlands: Results from experimental wetland mesocosms. Chapter 29: Constructed wetland for water quality improvement, Ed Gerald Moshiri, Lewis publishers Florida. USA. Davidsson T E, R Stepanauskas and L Leonardson (1997): Vertical patterns of nitrogen transformation during infiltration in two wetland soil. Appl. Environ.Microbiol. 63: 3648-3656 Day, Michael (1998): Heavy metal 33 (5), 1999, pp.657-662. Day, Michael. 1998. "Lead in the womb". New Scientist, 23 May 1998, p. 7. Dickman, MD, Leung C. K. M, & Leong M K H Dick , D.R. Thomas and J.J. Halvorson, Standardized methods, sampling and sample pre-treatment In: J.W. Doran and A.J. Jones, Editors, Methods for Assessing Soil Quality , Soil Science Society of America, Special Publication 49, Madison, W .I (1996) 107-121pp.
43
Dickman .M .D , Lenng C. K, & Leong M K(1998): “ Hong Kong Male sub fertility ,link to mercury in human and fish” : The Science of the total Env Vol. 192 Issue 2, 2 December , 1996 183p. Dunne .E, Culleton. N (2004) Farm Scale Constructed Wetlands An interim Report , Nutrient management in agricultural watersheds- a Wetlands solution A symposium conducted at Teagasc research Centre Johnstown Castle Co. Wexford Ireland 24-26 May 2004. FAO/UNDP/UNEP (1994): World Agriculture: Towards 2015- 2030: An FAO perspective: Agriculture and the environment: Changing Pressures, Solution and trade- offs. Economic and Social Department 1994. Frostegård, A., A. Turnlid, and E. Bååth. 1993. Phospholipids fatty acid composition, biomass and activity of microbial communities from two soil types experimentally exposed to different heavy metal. Appl. Environ. Microbiol. 59:3605–3617. Abstract Gamble, T. N, Betlach, M. And Tiedje, M. (1977): Numerically dominant denitrifying bacteria from world soils. Applied and Environmental Microbiology 33, 926-939pp. Gelt J (1997): Constructed Wetlands: Using human ingenuity, Natural process to treat water, Build Habitat. Arroyo, March 1997. Volume 9, No 4. Gil F, Facio. A, Villanueva E, Perez .M L, Tojo R, and Gil. A (1996): “The Association of tooth lead content with dental health factors”. The Science of the total environment Vol 192 issue 2, 2nd December 1996. 183. Gosselink J G (1984): The ecology of delta marshes of coastal Louisiana: A community profile. US Fish and Wild life services: FWS/OBS 84/09, Washington DC. Gosselink G J and W. J Mitsch (1993): Wetlands 2nd edition .Van Reinhold, ITP Inc. New York USA. Hallin .S (1998): Dynamics of denitrifying populations in activated sludge processes with nitrogen removal. Doctoral thesis, Swedish University of Agricultural science: AGRARIA 114 Hammer D. A (1989): Constructed Wetlands for waste water treatment: municipal, industrial and agricultural. Hammer ed. Lewis publishers Inc. Chelsea Michigan USA. Howard W.C (1985): Cycling and retention of nitrogen and phosphorus in wetlands: a theoretical and applied perspective. Freshwater biology 15: 391-431 Isaacs .S &Hanze. M (1995): Controlled carbon source addition to an alternating nitrification and denitrification wastewater treatment process, including biological Phosphorus removal- Water Research 29. 77-89 Kadlec .R H & Knight R. L (1996): Treatment Wetlands, CRC Lewis Publishers, 1996 New York USA. Knowles. R (1982): Denitrification. Microbiological Reviews 46: 43-70
44
Kremser U & Schung E (2002): Impact of fertilizer on aquatic ecosystem and protection of water bodies from mineral nutrients: plan action against nutrient loss from agriculture. HELCOM working group on agriculture 6th and 19th September 2002 Kiel Germany. Masters. R. (1998): “Environmental Pollution Neurotoxicity and Criminal Violence” in Rose J Ed: Environmental Toxicology, Gordon and Breach 1998, London. Monteny. G .J (2001): The EU Nitrate Directive: A European Approach to Combat Water pollution from Agriculture. The Scientific World Journal Vol.1 927-935 Environmental management and Policy Ed J Wisniewski. Mulugeta .S (1994): Socio-economic determinants of Wetlands Cultivation in Kemise Illubabor Zone and South-Western Ethiopia.: Department of geography and environmental Studies, Addis Ababa University, Ethiopia. Nishio T., Koike. I & Hattori A (1983): Estimates of denitrification and nitrification in coastal and estuarine sediments. Appl. Environ. Microbiol. 45: 444-450 Nixon .W (1995): Coastal Marine eutrophication: a definition, social causes and future concerns. Graduate school of oceanography, University of Rhode Island, USA. Öhlinger. R, (1995) Soil sampling and sample preparation In: F. Schinner, R. Öhlinger, E. Kandeler and R. Margesin, Editors, Methods in soil Biology Springer, Berlin (1995), pp. 7–11. Parsons .L.L., Muray E R. &Smith M S (1991): Soil denitrification dynamics spatial and temporal variations of enzymes activity, population and nitrogen gas loss. Soil sciences Society of America. Journal 55, 90-95. Pell. M, B Stenberg, Stenström. J & Torstensson. L (1996): Potential denitrification and nitrification tests for evaluation of pesticides effects in soil. Ambio.27, 24-28 Sakadevan K , Huang Z, & Bavor H. J (1999) : Impact of heavy metals on denitrification in surface wetland sediments receiving wastewater , Water Science and Technology Vol 40, Issue 3 1999 Elsevier Ltd . 349-355 Seitzinger. S. P, Nielsen L .P, Calffrey J & Christensen P.B (1993): Denitrification measurement in aquatic sediments. A comparison of three methods. Biogeochemistry 23: 147-167 Simpson R. L, Whigham D. F& Walker R (1978): Seasonal pattern of nutrient movement in a freshwater tidal marsh. In freshwater Wetlands: Ecological processes and management potentials. R .E Good, D F Whigham and R .L Simpson eds. Academic press New York 243-257 Spain, A. (2003): Implication of microbial heavy metal tolerance in the environment, Review in Undergraduate Research Vol 2 1-6 2003. University of Oklahoma, communicated by Dr E Alms. Central Michigan University, Department of Biology.
45
Stengel, E., Carduck .W, & Jebsen. C (1987): Evidence for denitrification in artificial wetlands. p. 543-550 in: K.R. Reddy and W.H. Smith (Eds.). Aquatic Plants for Water Treatment and Resource Recovery. Magnolia Publishing Inc Sun .G, Gray K. R, Biddlestone A. J & Cooper .D. J (1999): Treatment of Agricultural wastewater in a combine tidal flow down reed bed system. Water science technology 2: 139-146 US Environmental Protection Agency, 1993: subsurface Flow constructed Wetlands for wastewater treatment: A Technology Assessment, Washington D.C UNEP / DEWA/ Earth Watch (2005): UNEP Global resources information database Europe: Emerging issues: Toxic Chemicals, heavy metals WFD (2000): Water Framework Directive of the European Union 2000/60/EC WHO 1997: Health and Environment in Sustainable Development, WHO, Geneva Yoshinari .T and Knowles R (1976): Acetylene inhibition of nitrous oxide reduction by denitrifying bacteria. Biochem. Biophys. Research Commun. 69. 705-710 http://oils.gpa.unep.org/facts/prevent-land.htm Global Marine Oil Pollution Information Gateway, Facts on marine oil pollution, sources as summarized by US National Oceanic and Atmospheric Administration (NOAA) Office of Response and Restoration
46
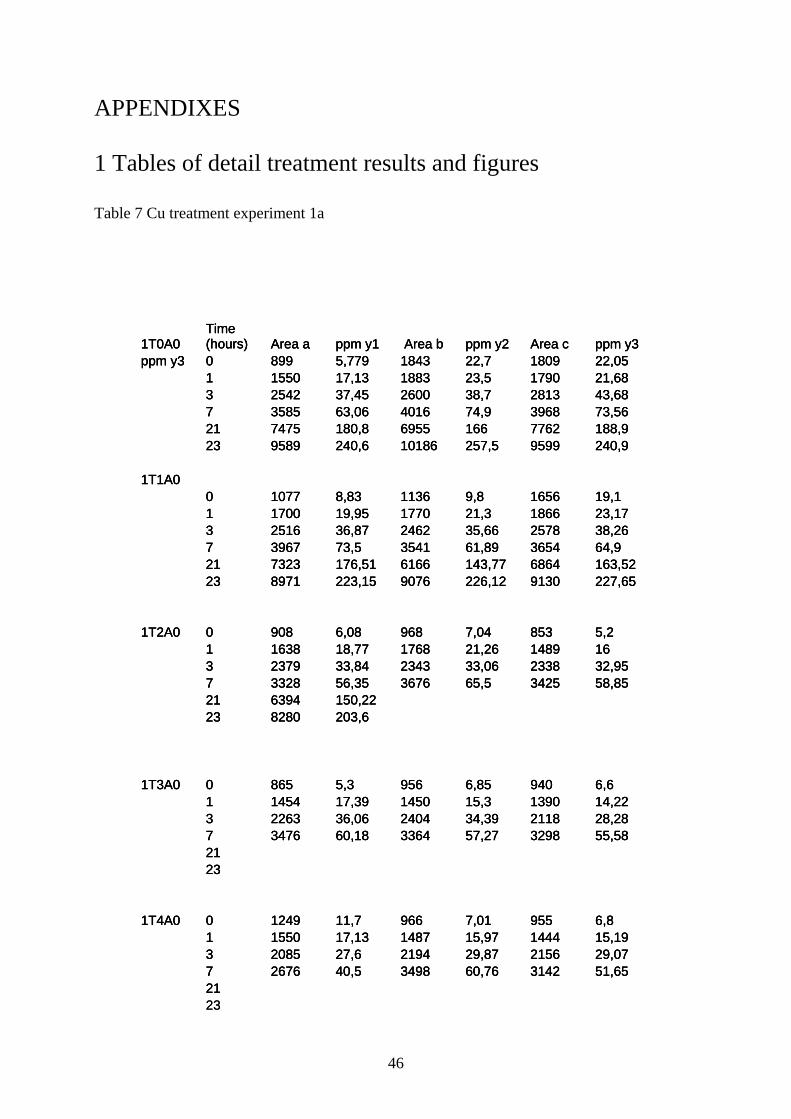
APPENDIXES 1 Tables of detail treatment results and figures Table 7 Cu treatment experiment 1a
1T0A0 Time (hours) Area a ppm y1 Area b ppm y2 Area c ppm y3
ppm y3 0 899 5,779 1843 22,7 1809 22,05 1 1550 17,13 1883 23,5 1790 21,68 3 2542 37,45 2600 38,7 2813 43,68 7 3585 63,06 4016 74,9 3968 73,56 21 7475 180,8 6955 166 7762 188,9 23 9589 240,6 10186 257,5 9599 240,9 1T1A0 0 1077 8,83 1136 9,8 1656 19,1 1 1700 19,95 1770 21,3 1866 23,17 3 2516 36,87 2462 35,66 2578 38,26 7 3967 73,5 3541 61,89 3654 64,9 21 7323 176,51 6166 143,77 6864 163,52 23 8971 223,15 9076 226,12 9130 227,65 1T2A0 0 908 6,08 968 7,04 853 5,2 1 1638 18,77 1768 21,26 1489 16 3 2379 33,84 2343 33,06 2338 32,95 7 3328 56,35 3676 65,5 3425 58,85 21 6394 150,22 23 8280 203,6
1T3A0 0 865 5,3 956 6,85 940 6,6 1 1454 17,39 1450 15,3 1390 14,22 3 2263 36,06 2404 34,39 2118 28,28 7 3476 60,18 3364 57,27 3298 55,58 21 23 1T4A0 0 1249 11,7 966 7,01 955 6,8 1 1550 17,13 1487 15,97 1444 15,19 3 2085 27,6 2194 29,87 2156 29,07 7 2676 40,5 3498 60,76 3142 51,65 21 23
1T0A0 Time (hours) Area a ppm y1 Area b ppm y2 Area c ppm y3
ppm y3 0 899 5,779 1843 22,7 1809 22,05 1 1550 17,13 1883 23,5 1790 21,68 3 2542 37,45 2600 38,7 2813 43,68 7 3585 63,06 4016 74,9 3968 73,56 21 7475 180,8 6955 166 7762 188,9 23 9589 240,6 10186 257,5 9599 240,9 1T1A0 0 1077 8,83 1136 9,8 1656 19,1 1 1700 19,95 1770 21,3 1866 23,17 3 2516 36,87 2462 35,66 2578 38,26 7 3967 73,5 3541 61,89 3654 64,9 21 7323 176,51 6166 143,77 6864 163,52 23 8971 223,15 9076 226,12 9130 227,65 1T2A0 0 908 6,08 968 7,04 853 5,2 1 1638 18,77 1768 21,26 1489 16 3 2379 33,84 2343 33,06 2338 32,95 7 3328 56,35 3676 65,5 3425 58,85 21 6394 150,22 23 8280 203,6
1T3A0 0 865 5,3 956 6,85 940 6,6 1 1454 17,39 1450 15,3 1390 14,22 3 2263 36,06 2404 34,39 2118 28,28 7 3476 60,18 3364 57,27 3298 55,58 21 23 1T4A0 0 1249 11,7 966 7,01 955 6,8 1 1550 17,13 1487 15,97 1444 15,19 3 2085 27,6 2194 29,87 2156 29,07 7 2676 40,5 3498 60,76 3142 51,65 21
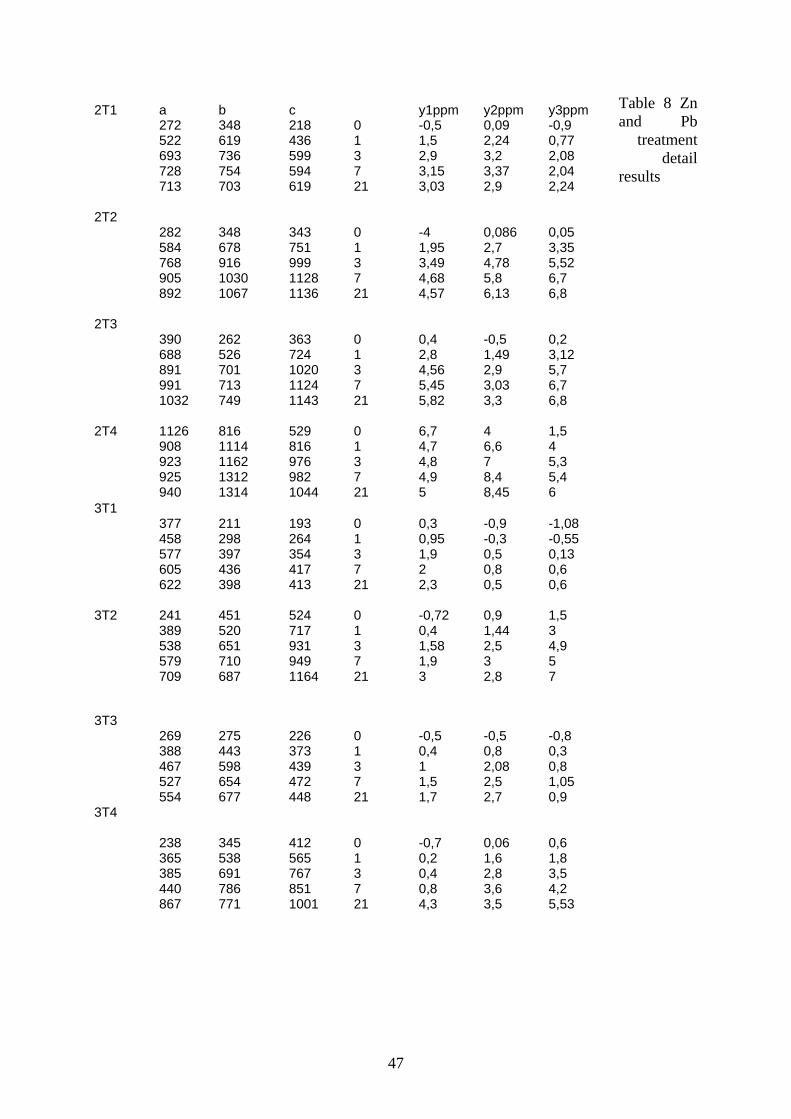
47
Table 8 Zn and Pb
treatment detail
results
2T1 a b c y1ppm y2ppm y3ppm 272 348 218 0 -0,5 0,09 -0,9 522 619 436 1 1,5 2,24 0,77 693 736 599 3 2,9 3,2 2,08 728 754 594 7 3,15 3,37 2,04 713 703 619 21 3,03 2,9 2,24 2T2 282 348 343 0 -4 0,086 0,05 584 678 751 1 1,95 2,7 3,35 768 916 999 3 3,49 4,78 5,52 905 1030 1128 7 4,68 5,8 6,7 892 1067 1136 21 4,57 6,13 6,8 2T3 390 262 363 0 0,4 -0,5 0,2 688 526 724 1 2,8 1,49 3,12 891 701 1020 3 4,56 2,9 5,7 991 713 1124 7 5,45 3,03 6,7 1032 749 1143 21 5,82 3,3 6,8 2T4 1126 816 529 0 6,7 4 1,5 908 1114 816 1 4,7 6,6 4 923 1162 976 3 4,8 7 5,3 925 1312 982 7 4,9 8,4 5,4 940 1314 1044 21 5 8,45 6 3T1 377 211 193 0 0,3 -0,9 -1,08 458 298 264 1 0,95 -0,3 -0,55 577 397 354 3 1,9 0,5 0,13 605 436 417 7 2 0,8 0,6 622 398 413 21 2,3 0,5 0,6 3T2 241 451 524 0 -0,72 0,9 1,5 389 520 717 1 0,4 1,44 3 538 651 931 3 1,58 2,5 4,9 579 710 949 7 1,9 3 5 709 687 1164 21 3 2,8 7
3T3 269 275 226 0 -0,5 -0,5 -0,8 388 443 373 1 0,4 0,8 0,3 467 598 439 3 1 2,08 0,8 527 654 472 7 1,5 2,5 1,05 554 677 448 21 1,7 2,7 0,9 3T4 238 345 412 0 -0,7 0,06 0,6 365 538 565 1 0,2 1,6 1,8 385 691 767 3 0,4 2,8 3,5 440 786 851 7 0,8 3,6 4,2 867 771 1001 21 4,3 3,5 5,53
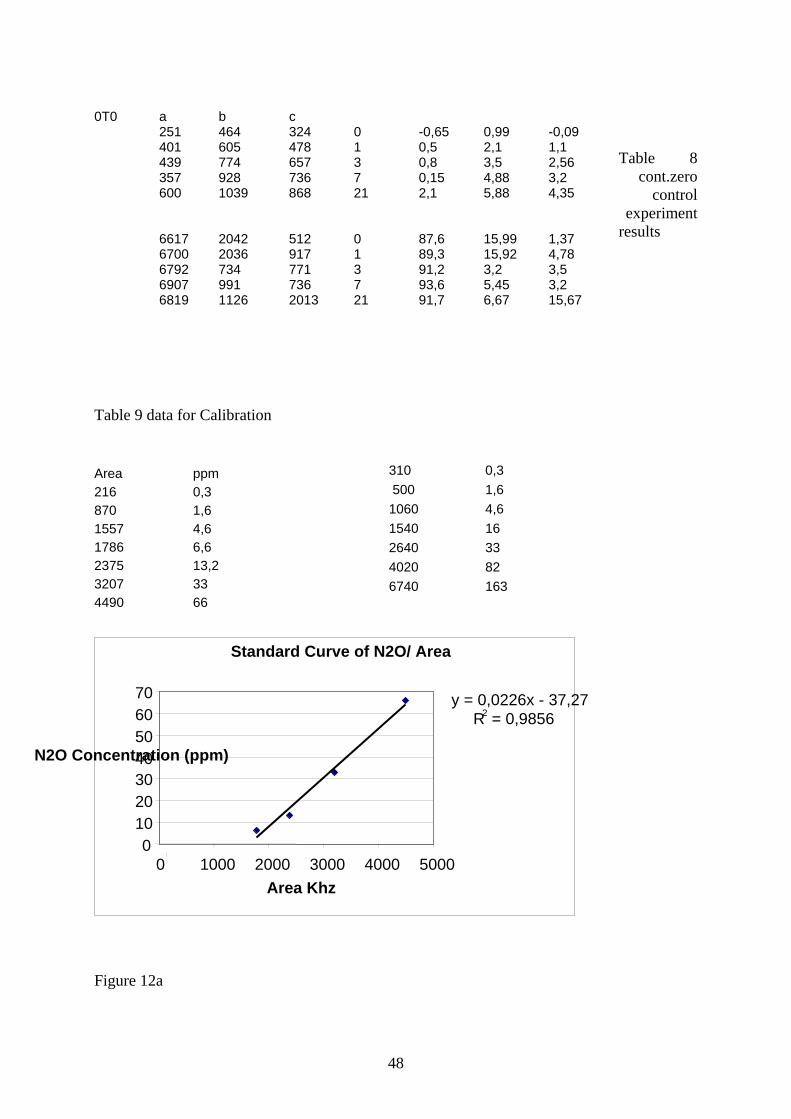
48
Table 8
cont.zero control
experiment results
Table 9 data for Calibration
Figure 12a
0T0 a b c 251 464 324 0 -0,65 0,99 -0,09 401 605 478 1 0,5 2,1 1,1 439 774 657 3 0,8 3,5 2,56 357 928 736 7 0,15 4,88 3,2 600 1039 868 21 2,1 5,88 4,35 6617 2042 512 0 87,6 15,99 1,37 6700 2036 917 1 89,3 15,92 4,78 6792 734 771 3 91,2 3,2 3,5 6907 991 736 7 93,6 5,45 3,2 6819 1126 2013 21 91,7 6,67 15,67
Area ppm 216 0,3 870 1,6 1557 4,6 1786 6,6 2375 13,2 3207 33 4490 66
310 0,3 500 1,6 1060 4,6 1540 16 2640 33 4020 82 6740 163
Standard Curve of N2O/ Area
y = 0,0226x - 37,27R2 = 0,9856
010203040506070
0 1000 2000 3000 4000 5000Area Khz
N2O Concentration (ppm)
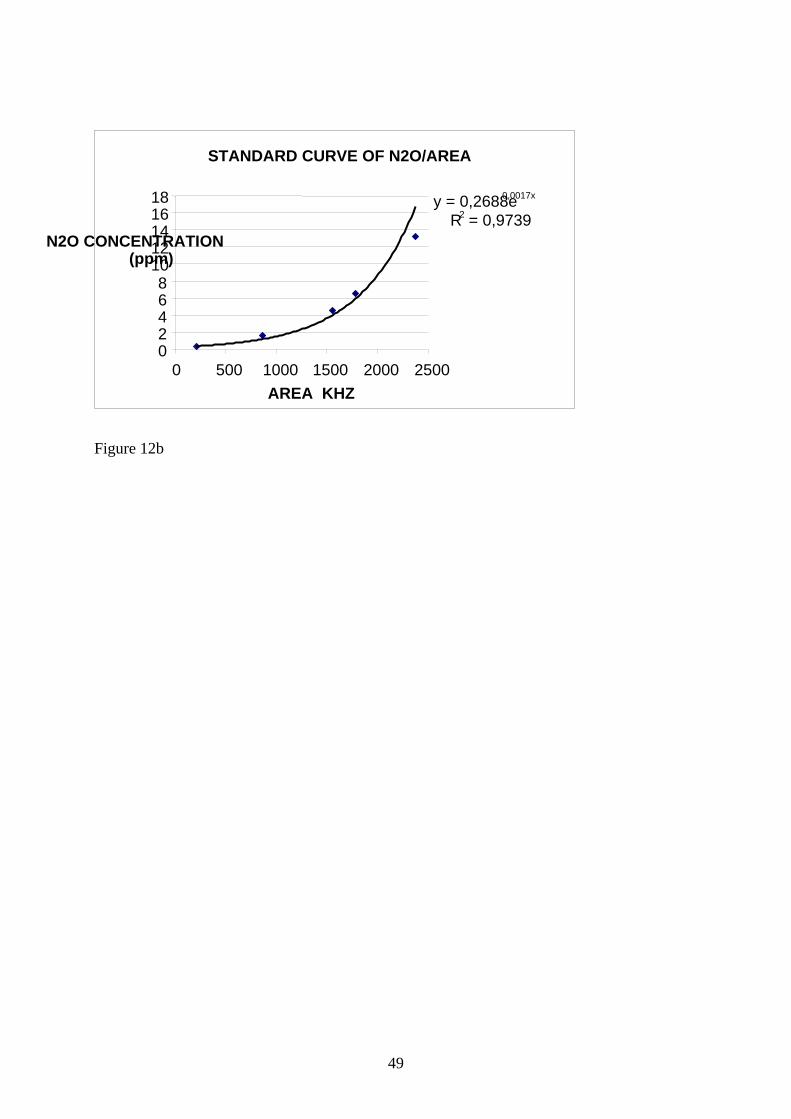
49
Figure 12b
STANDARD CURVE OF N2O/AREA
y = 0,2688e0,0017x
R2 = 0,9739
02468
1012141618
0 500 1000 1500 2000 2500AREA KHZ
(ppm)N2O CONCENTRATION
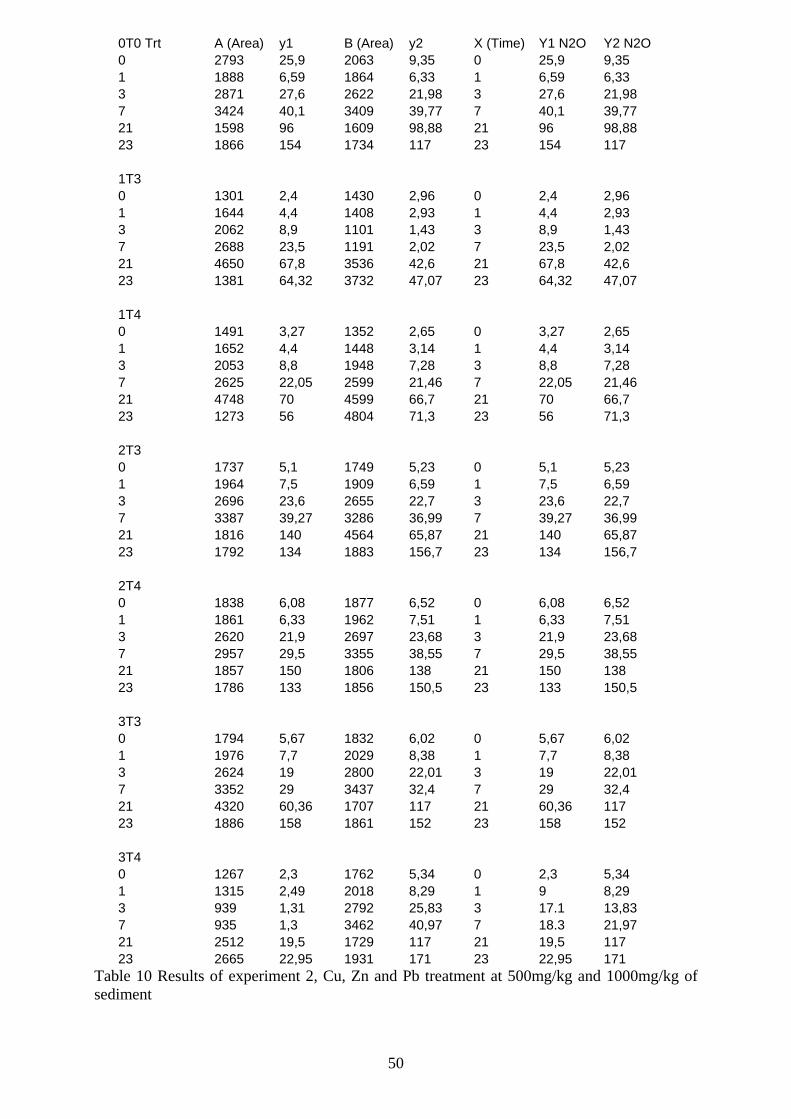
50
Table 10 Results of experiment 2, Cu, Zn and Pb treatment at 500mg/kg and 1000mg/kg of sediment
0T0 Trt A (Area) y1 B (Area) y2 X (Time) Y1 N2O Y2 N2O 0 2793 25,9 2063 9,35 0 25,9 9,35 1 1888 6,59 1864 6,33 1 6,59 6,33 3 2871 27,6 2622 21,98 3 27,6 21,98 7 3424 40,1 3409 39,77 7 40,1 39,77 21 1598 96 1609 98,88 21 96 98,88 23 1866 154 1734 117 23 154 117 1T3 0 1301 2,4 1430 2,96 0 2,4 2,96 1 1644 4,4 1408 2,93 1 4,4 2,93 3 2062 8,9 1101 1,43 3 8,9 1,43 7 2688 23,5 1191 2,02 7 23,5 2,02 21 4650 67,8 3536 42,6 21 67,8 42,6 23 1381 64,32 3732 47,07 23 64,32 47,07 1T4 0 1491 3,27 1352 2,65 0 3,27 2,65 1 1652 4,4 1448 3,14 1 4,4 3,14 3 2053 8,8 1948 7,28 3 8,8 7,28 7 2625 22,05 2599 21,46 7 22,05 21,46 21 4748 70 4599 66,7 21 70 66,7 23 1273 56 4804 71,3 23 56 71,3 2T3 0 1737 5,1 1749 5,23 0 5,1 5,23 1 1964 7,5 1909 6,59 1 7,5 6,59 3 2696 23,6 2655 22,7 3 23,6 22,7 7 3387 39,27 3286 36,99 7 39,27 36,99 21 1816 140 4564 65,87 21 140 65,87 23 1792 134 1883 156,7 23 134 156,7 2T4 0 1838 6,08 1877 6,52 0 6,08 6,52 1 1861 6,33 1962 7,51 1 6,33 7,51 3 2620 21,9 2697 23,68 3 21,9 23,68 7 2957 29,5 3355 38,55 7 29,5 38,55 21 1857 150 1806 138 21 150 138 23 1786 133 1856 150,5 23 133 150,5 3T3 0 1794 5,67 1832 6,02 0 5,67 6,02 1 1976 7,7 2029 8,38 1 7,7 8,38 3 2624 19 2800 22,01 3 19 22,01 7 3352 29 3437 32,4 7 29 32,4 21 4320 60,36 1707 117 21 60,36 117 23 1886 158 1861 152 23 158 152 3T4 0 1267 2,3 1762 5,34 0 2,3 5,34 1 1315 2,49 2018 8,29 1 9 8,29 3 939 1,31 2792 25,83 3 17.1 13,83 7 935 1,3 3462 40,97 7 18.3 21,97 21 2512 19,5 1729 117 21 19,5 117 23 2665 22,95 1931 171 23 22,95 171
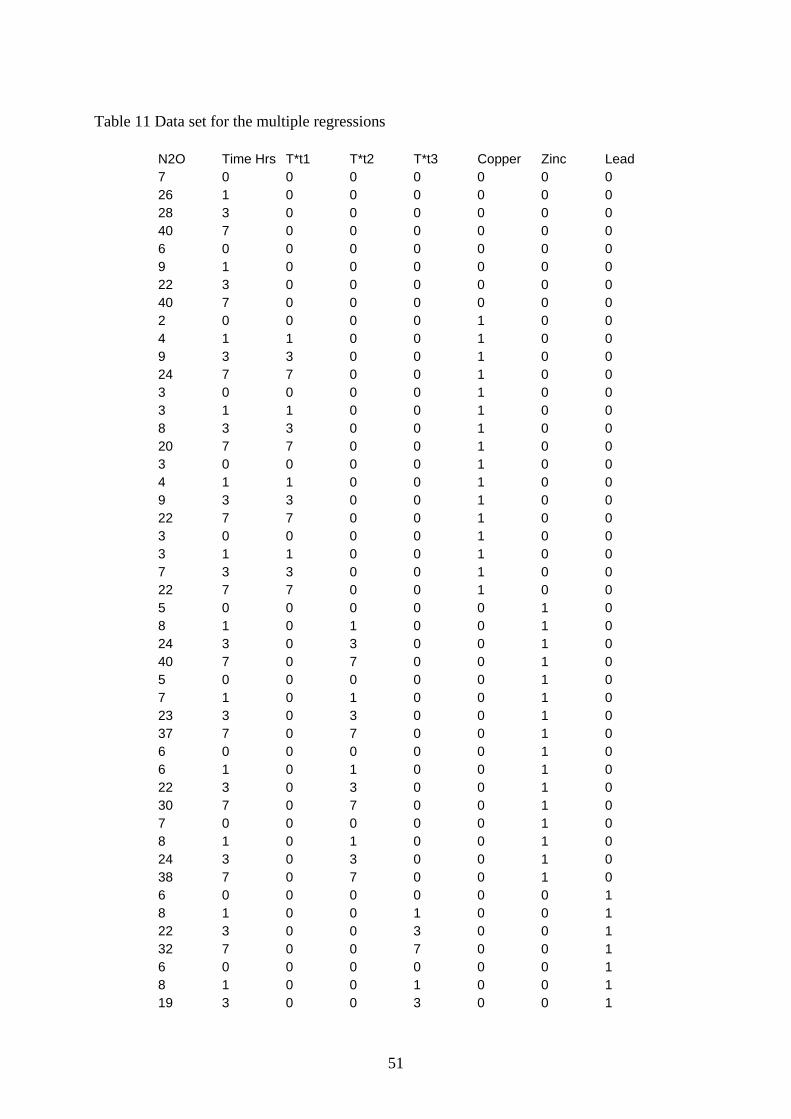
51
Table 11 Data set for the multiple regressions N2O Time Hrs T*t1 T*t2 T*t3 Copper Zinc Lead 7 0 0 0 0 0 0 0 26 1 0 0 0 0 0 0 28 3 0 0 0 0 0 0 40 7 0 0 0 0 0 0 6 0 0 0 0 0 0 0 9 1 0 0 0 0 0 0 22 3 0 0 0 0 0 0 40 7 0 0 0 0 0 0 2 0 0 0 0 1 0 0 4 1 1 0 0 1 0 0 9 3 3 0 0 1 0 0 24 7 7 0 0 1 0 0 3 0 0 0 0 1 0 0 3 1 1 0 0 1 0 0 8 3 3 0 0 1 0 0 20 7 7 0 0 1 0 0 3 0 0 0 0 1 0 0 4 1 1 0 0 1 0 0 9 3 3 0 0 1 0 0 22 7 7 0 0 1 0 0 3 0 0 0 0 1 0 0 3 1 1 0 0 1 0 0 7 3 3 0 0 1 0 0 22 7 7 0 0 1 0 0 5 0 0 0 0 0 1 0 8 1 0 1 0 0 1 0 24 3 0 3 0 0 1 0 40 7 0 7 0 0 1 0 5 0 0 0 0 0 1 0 7 1 0 1 0 0 1 0 23 3 0 3 0 0 1 0 37 7 0 7 0 0 1 0 6 0 0 0 0 0 1 0 6 1 0 1 0 0 1 0 22 3 0 3 0 0 1 0 30 7 0 7 0 0 1 0 7 0 0 0 0 0 1 0 8 1 0 1 0 0 1 0 24 3 0 3 0 0 1 0 38 7 0 7 0 0 1 0 6 0 0 0 0 0 0 1 8 1 0 0 1 0 0 1 22 3 0 0 3 0 0 1 32 7 0 0 7 0 0 1 6 0 0 0 0 0 0 1 8 1 0 0 1 0 0 1 19 3 0 0 3 0 0 1
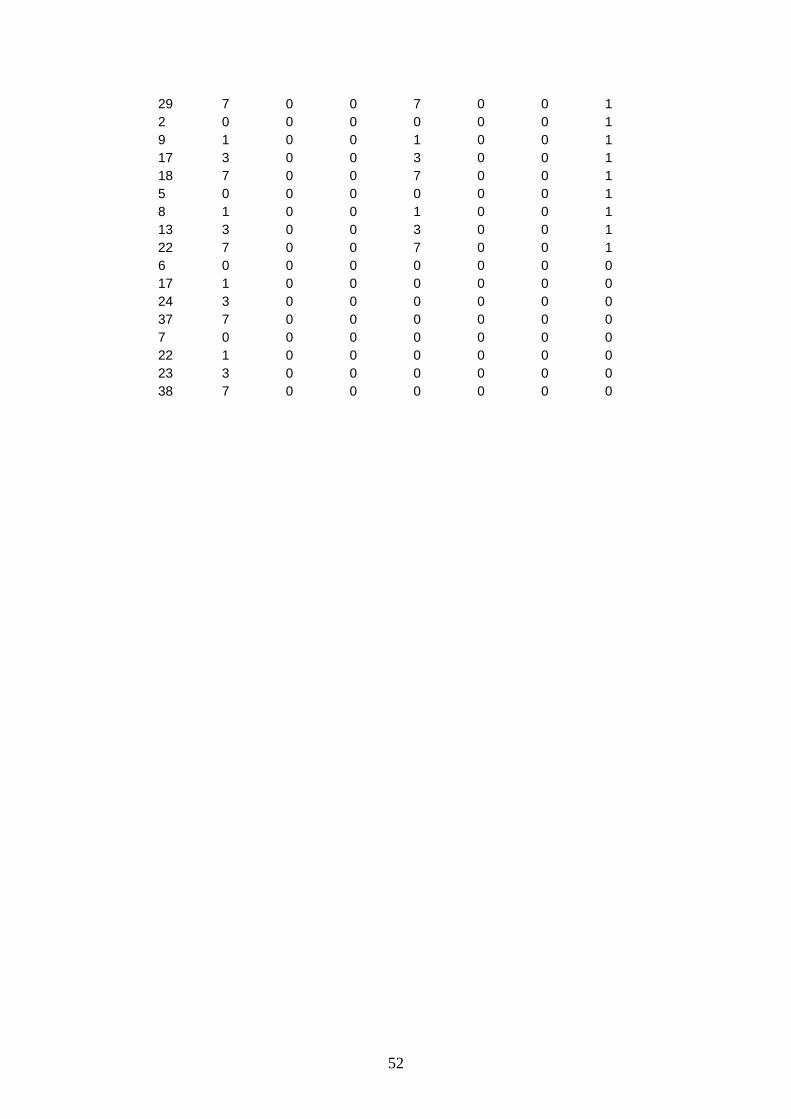
52
29 7 0 0 7 0 0 1 2 0 0 0 0 0 0 1 9 1 0 0 1 0 0 1 17 3 0 0 3 0 0 1 18 7 0 0 7 0 0 1 5 0 0 0 0 0 0 1 8 1 0 0 1 0 0 1 13 3 0 0 3 0 0 1 22 7 0 0 7 0 0 1 6 0 0 0 0 0 0 0 17 1 0 0 0 0 0 0 24 3 0 0 0 0 0 0 37 7 0 0 0 0 0 0 7 0 0 0 0 0 0 0 22 1 0 0 0 0 0 0 23 3 0 0 0 0 0 0 38 7 0 0 0 0 0 0
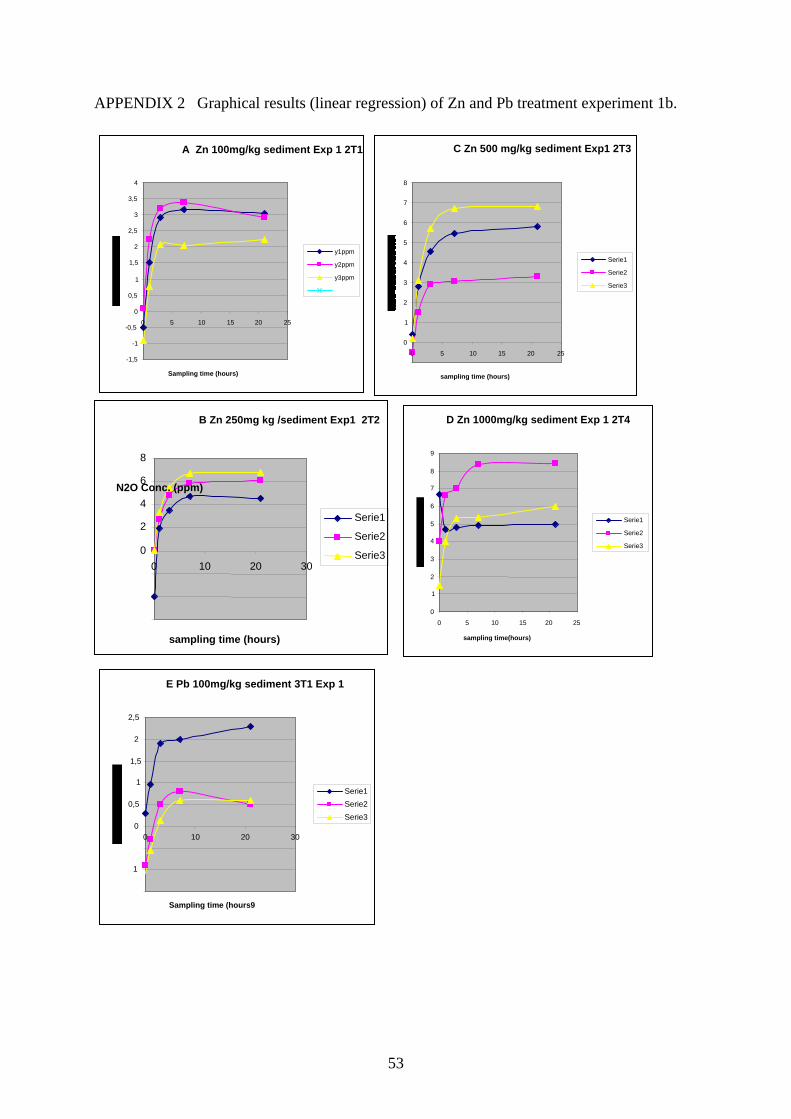
53
APPENDIX 2 Graphical results (linear regression) of Zn and Pb treatment experiment 1b.
C Zn 500 mg/kg sediment Exp1 2T3
0
1
2
3
4
5
6
7
8
0 5 10 15 20 25
sampling time (hours)
Serie1 Serie2 Serie3
B Zn 250mg kg /sediment Exp1 2T2
0
2
4
6
8
0 10 20 30
sampling time (hours)
N2O Conc. (ppm)
Serie1
Serie2
Serie3
E Pb 100mg/kg sediment 3T1 Exp 1
1
0
0,5
1
1,5
2
2,5
0 10 20 30
Sampling time (hours9
Serie1Serie2Serie3
D Zn 1000mg/kg sediment Exp 1 2T4
0
1
2
3
4
5
6
7
8
9
0 5 10 15 20 25
sampling time(hours)
Serie1 Serie2 Serie3
A Zn 100mg/kg sediment Exp 1 2T1
-1,5
-1
-0,5 0
0,5 1
1,5 2
2,5 3
3,5 4
0 5 10 15 20 25
Sampling time (hours)
y1ppm
y2ppm
y3ppm
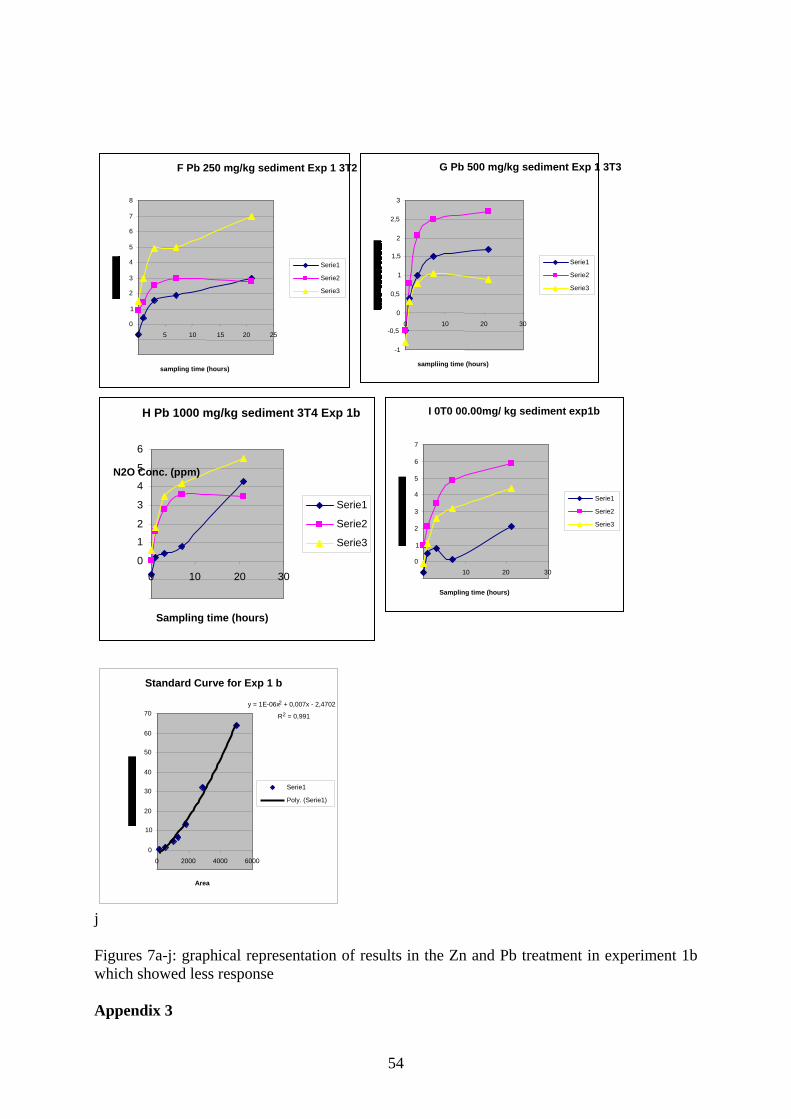
54
j Figures 7a-j: graphical representation of results in the Zn and Pb treatment in experiment 1b which showed less response Appendix 3
F Pb 250 mg/kg sediment Exp 1 3T2
0
1
2
3
4
5
6
7
8
0 5 10 15 20 25
sampling time (hours)
Serie1
Serie2
Serie3
G Pb 500 mg/kg sediment Exp 1 3T3
-1
-0,5
0
0,5
1
1,5
2
2,5
3
0 10 20 30
sampliing time (hours)
Serie1 Serie2 Serie3
H Pb 1000 mg/kg sediment 3T4 Exp 1b
0
1
2
3
4
5
6
0 10 20 30
Sampling time (hours)
N2O Conc. (ppm)
Serie1
Serie2
Serie3
I 0T0 00.00mg/ kg sediment exp1b
0
1
2
3
4
5
6
7
0 10 20 30
Sampling time (hours)
Serie1 Serie2 Serie3
Standard Curve for Exp 1 b y = 1E-06x2 + 0,007x - 2,4702
R2 = 0,991
0
10 20
30
40
50
60
70
0 2000 4000 6000 Area
Serie1 Poly. (Serie1)
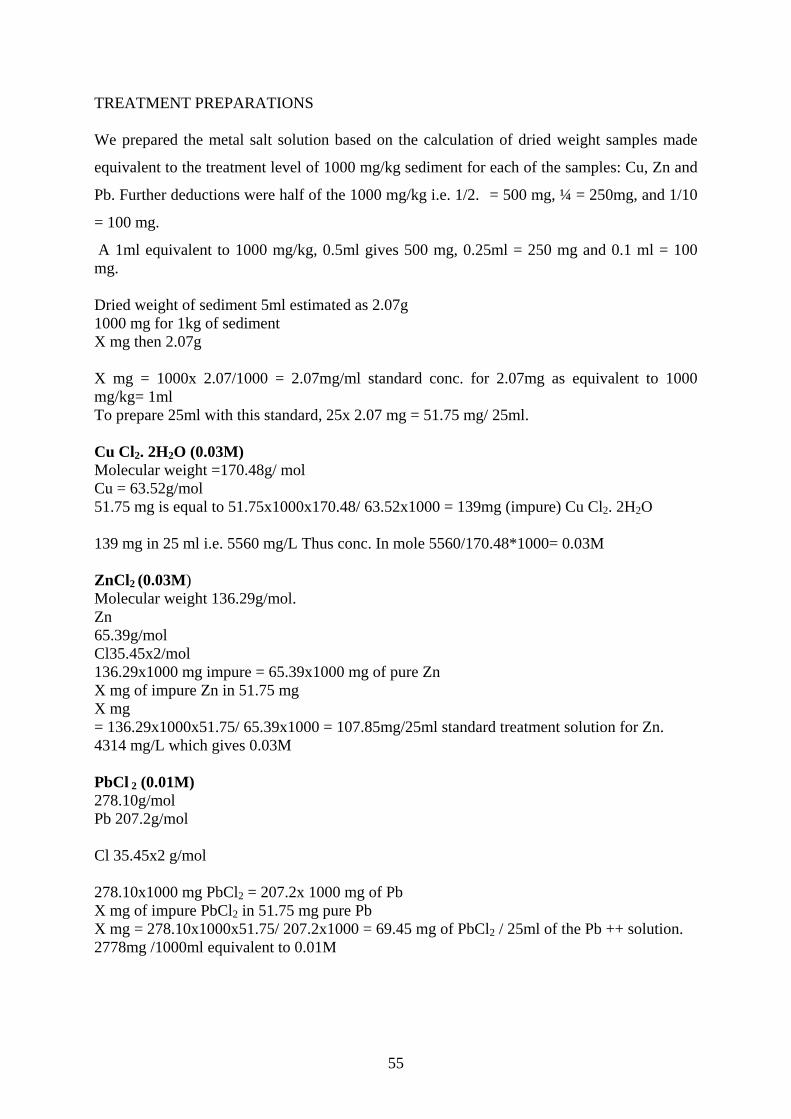
55
TREATMENT PREPARATIONS We prepared the metal salt solution based on the calculation of dried weight samples made
equivalent to the treatment level of 1000 mg/kg sediment for each of the samples: Cu, Zn and
Pb. Further deductions were half of the 1000 mg/kg i.e. 1/2. = 500 mg, ¼ = 250mg, and 1/10
= 100 mg.
A 1ml equivalent to 1000 mg/kg, 0.5ml gives 500 mg, 0.25ml = 250 mg and 0.1 ml = 100 mg. Dried weight of sediment 5ml estimated as 2.07g 1000 mg for 1kg of sediment X mg then 2.07g X mg = 1000x 2.07/1000 = 2.07mg/ml standard conc. for 2.07mg as equivalent to 1000 mg/kg= 1ml To prepare 25ml with this standard, 25x 2.07 mg = 51.75 mg/ 25ml. Cu Cl2. 2H2O (0.03M) Molecular weight =170.48g/ mol Cu = 63.52g/mol 51.75 mg is equal to 51.75x1000x170.48/ 63.52x1000 = 139mg (impure) Cu Cl2. 2H2O 139 mg in 25 ml i.e. 5560 mg/L Thus conc. In mole 5560/170.48*1000= 0.03M ZnCl2 (0.03M) Molecular weight 136.29g/mol. Zn 65.39g/mol Cl35.45x2/mol 136.29x1000 mg impure = 65.39x1000 mg of pure Zn X mg of impure Zn in 51.75 mg X mg = 136.29x1000x51.75/ 65.39x1000 = 107.85mg/25ml standard treatment solution for Zn. 4314 mg/L which gives 0.03M PbCl 2 (0.01M) 278.10g/mol Pb 207.2g/mol Cl 35.45x2 g/mol 278.10x1000 mg PbCl2 = 207.2x 1000 mg of Pb X mg of impure PbCl2 in 51.75 mg pure Pb X mg = 278.10x1000x51.75/ 207.2x1000 = 69.45 mg of PbCl2 / 25ml of the Pb ++ solution. 2778mg /1000ml equivalent to 0.01M

56
3b. The concentrations used.
N/B W1, W2 W3 and W5 Laboratory standard solutions (TEMA VAT TEN) Linköpings University.
Chemicals MW (g/mol
Final concentration mM
Buffer KH2PO4 (w1) Na2HPO4 (w2) Minerals w3 NH4Cl NaCl CaCl2.2H2O MgCl2.6H2O Trace mineral w5 FeCl2 .4H20 H3BO3 ZnCl2 CuCl2.2H2O MnCl2 .2H2O (NH4)6Mo7O24.4H2O AlCl3 CoCl2.6H2O NiCl2.6H2O EDTA(C10H14N2Na2O8.2H2O Nitrate: KNO3
136.09 141.96 53.49 58.44 147.02 203.30 198. 61. 136. 170. 161. 1235. 133 237. 237 372 101.1
3 (0.4g/l) 3 (0.4g/l) 5.6 (0.3g/l) 5.1 (0.3g/l) 0.8 (0.1g/l) 0.5 (0.1g/l) 10 (2000ug/l) 0.8 (50ug/l) 0.4 (50ug/l) 0.2 (38ug/l) 0.3 (50ug/l) 0.3 (50ug/l) 0.4 (50ug/l) 0.2 (50ug/l) 0.2 (50ug/l) 1.3 (500ug/l) 1.4mg/l