Embed Size (px)
Citation preview

The Synchronization of Business Cycles andFinancial Cycles in the Euro Area∗
William OmanInternational Monetary Fund and CES, Universite Paris 1
Pantheon-Sorbonne
Using a frequency-based filter, I document the existenceof a euro-area financial cycle and high- and low-amplitudenational financial cycles. Applying concordance and similar-ity analysis to business and financial cycles, I provide evidenceof five empirical regularities: (i) the aggregate euro-area credit-to-GDP ratio behaved procyclically in the years precedingeuro-area recessions; (ii) financial cycles are less synchronizedthan business cycles; (iii) business cycle synchronization hasincreased while financial cycle synchronization has decreased;(iv) financial cycle desynchronization was more pronouncedbetween high-amplitude and low-amplitude countries, espe-cially Germany; (v) high-amplitude countries and Germanyexperienced divergent leverage dynamics after 2002.
JEL Codes: E32, E44, E58, F36, F44, F45.
1. Introduction
The financial cycle is emerging as an important concept to capturemacrofinancial dynamics (Borio 2014) and predict systemic bankingcrises (Drehmann, Borio, and Tsatsaronis 2012; Schuler, Hiebert,and Peltonen 2017). As a result, central banks are increasingly usingthe financial cycle as a rationale for countercyclical macroprudential
∗I am very grateful to Michel Aglietta, Bergljot Barkbu, Rodolphe Blavy, StijnClaessens, Olivier Darmouni, Mathias Drehmann, Jeffrey Franks, Dirk Krueger,Luc Laeven, Eric Monnet, Hanni Schoelermann, Bruno Tinel, William White, andan anonymous referee for helpful comments and suggestions on previous versionsof this paper. The views expressed in this paper represent those of the authorand not necessarily those of the International Monetary Fund, its Management,or its Executive Directors. Author contact: International Monetary Fund, 70019th Street NW, Washington, DC 20431, USA. E-mail: [email protected].
327

328 International Journal of Central Banking March 2019
policies. For instance, Constancio (2016, 2017) argues that policiestargeting the financial cycle, such as macroprudential policy, canpowerfully complement policies that target the business cycle, suchas monetary policy, since business and financial cycles are not alwayssynchronized.
As a concept distinct from the business cycle, the financial cycleoriginates from work carried out at the Bank for International Settle-ments (Borio, Kennedy, and Prowse 1994; Borio, Furfine, and Lowe2001; Drehmann, Borio, and Tsatsaronis 2012; Borio, Disyatat, andJuselius 2013; Borio 2014; and Borio, Lombardi, and Zampolli 2016).Borio (2014) defines the financial cycle as “self-reinforcing interac-tions between perceptions of value and risk, attitudes towards riskand financing constraints, which translate into booms followed bybusts.” The financial cycle’s focus on the co-movement of creditand asset prices means that it is closely related to two new styl-ized facts from the literature: (i) the increase in financialization andleverage in advanced economies since the 1970s, which is associatedwith deeper recessions (see Jorda, Schularick and Taylor 2011, 2013,2016a, 2016b, 2017, and Schularick and Taylor 2012 for empiricalevidence), economic booms and busts (see Geanakoplos 2010 for amodel linking variations in leverage, asset price fluctuations) andfinancial instability (Brunnermeier and Sanikov 2014 and Adrianand Boyarchenko 2015); and (ii) the explosion of cross-border banklending (Shin 2012; Lane and McQuade 2014).
Empirical work on domestic financial cycles remains relativelysparse and falls into two main categories: attempts to improve themeasurement of financial cycles, and analyses of the synchronizationof financial cycles or their component variables.
Recent studies on domestic financial cycle measurement havefocused, like this paper, on euro-area financial cycles. European Cen-tral Bank (2014) documents heterogeneity across euro-area financialcycles. Stremmel (2015) identifies credit growth, the credit-to-GDPratio, and the ratio of house prices to income as the best-fitted meas-ures of financial cycles. Gorton and Ordonez (2016) provide furtherimplicit justification for using both credit and asset prices to studyfinancial cycles, as they show that not all credit booms are followedby financial crises. Building on the methodology used in Stremmel(2015), Stremmel and Zsamboki (2015) find that financial cyclesare less synchronized in tranquil periods and more synchronized

Vol. 15 No. 1 The Synchronization of Business Cycles 329
in periods of common financial stress. Galati et al. (2016), echoingDrehmann, Borio, and Tsatsaronis (2012), find that financial cyclesare longer and more ample than business cycles. Gerdrup, Kvinlog,and Schaanning (2013) and Detken et al. (2014) similarly find thatthe average length of the financial cycle is around four times that ofthe business cycle.
Two recent papers use different methodologies to measure thefinancial cycle and arrive at similar conclusions. Runstler and Vlekke(2018) apply multivariate unobserved-component models to France,Germany, Italy, Spain, the United Kingdom, and the United States,and find that, in those countries, financial cycles are longer thanbusiness cycles and range from thirteen to eighteen years. Moreover,they find that financial cycles are heterogeneous across Europeancountries, with Germany standing out due to its very short and low-amplitude financial cycle and Spain, by contrast, having a muchlonger and more ample financial cycle. Looking at G-7 countries,Schuler, Hiebert, and Peltonen (2017) use a new spectral approachand find that financial cycles exhibit higher amplitude and persis-tence than business cycles, with financial cycles lasting 15 years onaverage, versus 6.7 years for G-7 business cycles, excluding Japan.They too find that Germany’s financial cycle has the lowest ampli-tude and average length.
A related, nascent literature studies the synchronization offinancial cycles or their component variables. Claessens, Kose,and Terrones (2011, 2012) analyze credit, housing, and equitycycles in twenty-one advanced economies, finding them highly syn-chronized within and across countries. Rey (2015) finds evidenceof strong international co-movement among financial variables.Schuler, Hiebert, and Peltonen (2017) find that most G-7 finan-cial cycles are closely related, but Germany’s and Japan’s are not.They find that G-7 countries’ business cycles, by contrast, are closelylinked. Samarina, Zhang, and Bezemer (2016) study credit cycles insixteen euro-area countries over 1990–2013, which they decomposeinto mortgage credit and private non-financial credit. They find thatcredit cycles diverged between and within countries following theintroduction of the euro.
Focusing on business cycle synchronization in the futureEuropean Economic and Monetary Union (EMU) countries before

330 International Journal of Central Banking March 2019
the creation of EMU, Eichengreen (1991) finds a low degreeof correlation of economic shocks among European countries.Giannone and Reichlin (2006) find mixed evidence on businesscycle synchronization, with cyclical asymmetries among euro-areaeconomies being relatively limited and comparable to those amongU.S. regions. While McCarthy (2006) finds limited evidence thatthe creation of EMU has increased business cycle synchronizationacross euro-area countries, even if one includes the pre-EMU period,De Grauwe and Ji (2016) find a high degree of business cycle syn-chronization within the euro area over the period 1995–2014. Look-ing beyond Europe, Jorda, Schularick, and Taylor (2017) find thatadvanced economies have become more synchronized.
Finally, a third strand of the literature studies the relationshipbetween financial integration and business cycle synchronization.Kalemli-Ozcan, Papaioannou, and Perri (2013) provide evidence anddevelop a model in which financial integration affects business cycleco-movement differently depending on whether shocks to the econ-omy are real or financial.
According to the model, financial integration has a significanteffect on business cycle co-movement in tranquil times (less synchro-nization) and in crisis episodes (more co-movement), consistent withthe financial cycle evidence gathered by Stremmel and Zsamboki(2015). Monnet and Puy (2016) note that several studies find thattrade and financial integration are associated with more businesscycle synchronization (Bordo and Helbling 2003; Kose, Otrok, andWhiteman 2003, 2008; and Kose, Prasad, and Terrones 2003). Onthe other hand, Enderlein et al. (2016) argue that EMU has failedto promote better business cycle synchronization in the euro area.Cesa-Bianchi, Imbs, and Saleheen (2016) study the interaction ofcapital flows and business cycles, and find that, in response to com-mon shocks, capital tends to flow systematically between similarcountries, even as GDP growth rate discrepancies widen betweenthem. This means that, in response to common shocks, synchro-nization falls as financial integration increases. Conversely, financialintegration reinforces synchronization of business cycles in responseto country-specific shocks.
Despite the extensive ground covered by this literature, I amnot aware of any cross-country studies of the relationship betweenbusiness cycles and financial cycles over a long period of time and

Vol. 15 No. 1 The Synchronization of Business Cycles 331
analyzing both co-movement and amplitude. This paper attempts tohelp fill that gap by analyzing the synchronicity between businessand financial cycles in the euro area, both within and across coun-tries, thus bridging three strands of the literature: financial cycles,business cycle synchronization, and financial cycle synchronization.
This empirical analysis seems particularly relevant to the euroarea (EMU), for two main reasons. First, as noted above, thereis evidence of lack of business cycle synchronization across EMUcountries. This is problematic in a monetary union, as lack of cycli-cal convergence can complicate the monetary union’s central bank’sone-size-fits-all monetary policy. Significant differences in cyclicalpositions mean that the ECB’s policy interest rate, which the ECBsets based primarily on the weighted-average euro-area inflation,may at any point in time be simultaneously too high for individ-ual countries experiencing a depression and too low for countriesexperiencing a boom. Insofar as the financial cycle exacerbates busi-ness cycle divergence or generates its own cyclical divergence, thiscan pose a threat to macroeconomic and financial stability in EMU.Differences between the business cycle and the financial cycle, bothacross and within countries, may also create tensions between objec-tives of macroeconomic stabilization and financial stability. If suchdivergence exists, managing the euro-area financial cycle (or nationalfinancial cycles) should arguably be a priority for policymakers.The existence of financial cycle or business–financial cycle diver-gence would also strengthen the need to understand the relationshipbetween business and financial cycles.
The second reason why the financial cycle is particularly relevantto EMU is that it may have played a role in the real economic diver-gence across member states since the introduction of the euro. Inparticular, there is evidence of resource misallocation in peripheryEMU countries (Gopinath et al. 2015; Garcia-Santana et al. 2016),which resulted in very weak productivity growth and was plausiblyinduced by credit boom-bust cycles. Over time, lack of convergencerisks undermining EMU’s economic, social and political viability(Praet 2014; Enderlein et al. 2016; Franks et al. 2018).1 One channel
1Indeed, one of the main objectives of the euro was to foster economic con-vergence between the poorest and richest economies in the euro area, defined asa narrowing of income gaps (Eichengreen 2007).

332 International Journal of Central Banking March 2019
through which the financial cycle may hinder convergence is by gen-erating misallocation of resources in less-developed EMU economiesas a result of boom-bust dynamics in these countries—reflected inample financial cycles—preventing them from achieving sustainedeconomic convergence with wealthier EMU member states.2
I concentrate on the first of these two mechanisms. While bothmechanisms are potentially important, gathering the stylized factson the evolution of financial cycle synchronization within EMU isarguably a prerequisite to studying any possible link between finan-cial cycle synchronization and economic convergence. To analyzefinancial cycle synchronization, and the relationship between busi-ness and financial cycles, I first measure business cycles and financialcycles since 1971 for the twelve founding EMU member states minusLuxembourg (due to limited data availability), henceforth EA11. Tomeasure each country’s business cycle and financial cycle, I applythe bandpass filter proposed by Christiano and Fitzgerald (2003)to GDP growth, and credit growth, the credit-to-GDP ratio andresidential property price growth, respectively.3 I then use a concor-dance statistic and a similarity measure to study the evolution ofthe synchronization of business and financial cycles both across andwithin the EA11 since 1971.
My analysis confirms three stylized facts from the literatureon financial cycles, and contributes five new findings. In line withDrehmann, Borio, and Tsatsaronis (2012), Detken et al. (2014),Aglietta and Brand (2015), and Galati et al. (2016), I find thatdomestic financial cycles tend to be significantly more ample thanbusiness cycles, with their length and amplitude having increasedsince the mid-1980s.4 Second, I document the existence of an
2Praet (2014) argues that the incomplete single market in capital, and the lackof a common approach to bank supervision and resolution, led “the financial cycleto take hold too strongly in [periphery euro area] countries in the upswing, andlimited the potential for risk-sharing between jurisdictions in the downswing. This‘Minsky’ cycle in turn masked the underlying lack of productivity convergence inthe pre-crisis period.”
3The EA11 countries are Austria, Belgium, Finland, France, Germany, Greece,Ireland, Italy, Netherlands, Portugal, and Spain.
4This is true even though I use the same bandpass filter parameters to isolatemedium-term cycles with a duration ranging from 32 to 120 quarters for both thebusiness and the financial cycle. Indeed, medium-term business cycle fluctuationstend to be more ample than short-term fluctuations.

Vol. 15 No. 1 The Synchronization of Business Cycles 333
aggregate euro-area financial cycle, as in ECB (2014) and Merler(2015), and heterogeneous national financial cycles, in line withRunstler and Vlekke (2018) and Schuler, Hiebert, and Peltonen(2017). Finally, I find that average financial cycle synchronizationacross countries increased during the crisis, in line with Stremmeland Zsamboki (2015).
The main contributions of the paper are to show that (i) eachfive-year period that preceded a euro-area recession after 1990is characterized by a positive level of the aggregate euro-arealeverage cycle; (ii) financial cycles are less synchronized than busi-ness cycles; (iii) following euro introduction, average business cyclesynchronization increased while average financial cycle synchro-nization decreased; (iv) financial cycle desynchronization was morepronounced between high-amplitude and low-amplitude countries,especially Germany; and (v) the high-amplitude country group andGermany experienced divergence between their respective leveragecycles after 2002. The finding that Germany is atypical, with itsfinancial cycle desynchronized from the rest of the euro area andits leverage cycle exhibiting a different pattern from that of otherregions, enriches the finding of Runstler and Vlekke (2018) andSchuler, Hiebert, and Peltonen (2017) that Germany stands out dueto its very flat and desynchronized financial cycle.
The paper is organized as follows. Section 2 presents the method-ology used to estimate business and financial cycles and their degreeof synchronization within and across countries. Section 3 discussesthe main features of business and financial cycles in the samplecountries and country groups. Section 4 describes the results on busi-ness and financial cycle synchronization at the euro-area level andacross countries, and on leverage cycle dynamics at the euro-areaand country-group levels. Section 5 concludes.
2. Methodology
I measure the business cycle and financial cycle of each of thetwelve founding euro-area member states minus Luxembourg (due tolimited data availability): Austria, Belgium, Finland, France, Ger-many, Greece, Italy, Ireland, Netherlands, Portugal, and Spain, orEA11. As of 2016, these countries accounted for over 97 percent ofeuro-area GDP, justifying the use of EA11 as a proxy for the euro

334 International Journal of Central Banking March 2019
area as a whole. In the next three sub-sections, I describe themethodology used to measure the financial cycle, the business cycle,and the leverage cycle, respectively.
The business and financial cycle estimates and synchronizationcalculations presented in this paper expand on my contribution toFranks et al. (2018). This paper differs from, and adds to, Frankset al. (2018) in several ways. Whereas the latter paper focuses on realeconomic convergence in the euro area and provides only a small sub-set of results on, and a brief discussion of, business and financial cyclesynchronization, this paper provides a thorough discussion of the lit-erature and methodology pertaining to financial cycles and a muchlarger set of results on business and financial cycle synchronization—both within and across EMU countries. Finally, this paper expandson Franks et al. (2018) by explicitly discussing the empirical regu-larities that emerge as well as their relevance for academic researchand economic policy.
2.1 Financial Cycle, Business Cycle, andLeverage Cycle Measurement
2.1.1 Financial Cycle Measurement
In an influential contribution, Drehmann, Borio, and Tsatsaro-nis (2012) apply two approaches to measure the financial cycle—turning-point analysis and the bandpass filter developed by Chris-tiano and Fitzgerald (2003)—to five financial variables (credit, thecredit-to-GDP ratio, property prices, equity prices, and an aggregateasset price index). They distinguish short-term cycles (which theydefine as frequencies between 5 and 32 quarters) and medium-termcycles (which they define as frequencies between 32 and 120 quar-ters), and piece together four empirical findings: (i) they identifya well-defined financial cycle characterized by the co-movement ofmedium-term cycles in credit and property prices; (ii) the durationand amplitude of the financial cycle has increased since the mid-1980s, with an average duration of sixteen years; (iii) financial cyclepeaks are closely associated with systemic banking crises; and (iv)financial and business cycles are related but distinct phenomena,with the medium-term component significant for both cycles, butmore so for the financial cycle.

Vol. 15 No. 1 The Synchronization of Business Cycles 335
Although there is no consensus on the best measure of thefinancial cycle, recent studies provide support for the methodol-ogy proposed by Drehmann, Borio, and Tsatsaronis (2012). Strem-mel (2015) assesses various financial cycle measures using graphicaland statistical investigation techniques and finds that the best-fittedfinancial cycle measures include variables (the credit-to-GDP ratio,credit growth, and the ratio of house prices to income) that aresimilar to those used in this paper, as well as in Drehmann, Borio,and Tsatsaronis (2012), Aglietta and Brand (2015), Merler (2015),and Galati et al. (2016). Schuler, Hiebert, and Peltonen (2017) findthat a composite financial cycle exploiting the co-movement of creditgrowth and house prices is the best indicator of systemic bankingcrises for G-7 countries over the past fifty years. Given that theobjective of this paper is not to improve on the measurement ofthe financial cycle but to enhance our understanding of businessand financial cycle synchronization, I opt for the most standardmeasurement of the financial cycle and follow Drehmann, Borio, andTsatsaronis (2012) in the choice of filter and financial variables.5
Thus, to measure the financial cycle, I build a composite financialcycle based on the three variables proposed by Drehmann, Borio,and Tsatsaronis (2012): credit to the non-financial private sector,the ratio of credit to GDP, and residential property prices.6 Follow-ing Drehmann, Borio, and Tsatsaronis (2012), to standardize thecycles before aggregation, all series are normalized to 1985:Q1 toensure that the units are comparable. Also in line with Drehmann,Borio, and Tsatsaronis (2012), credit and residential property pricesare in real terms (deflated by CPI) and in logs.7 To isolate the
5As argued by Arnold et al. (2012) and Drehmann, Borio, and Tsatsaronis(2012), focusing on cyclical fluctuations at relatively low frequencies is appropri-ate given the lower frequency of systemic banking and financial crises.
6For three countries (Austria, Portugal, and Greece) residential property pricedata do not extend back far enough in time, and the house price cycle was there-fore excluded from the composite financial cycle measure for these countries.However, data on residential property prices available from the Bank of Greecesuggest that Greece experienced a pronounced house price boom between 1995and 2008, similarly to Spain and Ireland.
7Thus, general inflation does not distort the financial cycle estimates, in linewith the methodology used by Drehmann, Borio, and Tsatsaronis (2012), Agliettaand Brand (2015), and Schuler, Hiebert, and Peltonen (2017).

336 International Journal of Central Banking March 2019
cyclical component of each series, I use the bandpass filter devel-oped by Christiano and Fitzgerald (2003) and filter the data inannual growth rates.8 Following Drehmann, Borio, and Tsatsaro-nis (2012) and Stremmel (2015), I set the upper bound parameterfor the duration of each cycle that composes the financial cycle at120 quarters. For the lower bound, I follow Drehmann, Borio, andTsatsaronis (2012) and set it at thirty-two quarters. As these authorsnote, the 120-quarter upper bound ensures that the medium-termcyclical component does not include a long-term secular trend.9 Thefiltered time series being continuous and additive (as measurementunits are comparable), I build the composite financial cycle indicatorby taking the simple average of the three filtered time series with-out using weights to form the composite financial cycle, in line withthe methodology used in Drehmann, Borio, and Tsatsaronis (2012),Aglietta and Brand (2015), and Stremmel (2015).
2.1.2 Business Cycle Measurement
The aim of the paper being to establish stylized facts regarding thecomparative behavior of business and financial cycles in the euroarea, I use an agnostic statistical approach to measure both types ofcycles. Therefore, I apply the same bandpass filter frequency bandto measure the business cycle as for the financial cycle: a lowerbound of 32 quarters and an upper bound of 120 quarters. Thisensures that the two cycles are comparable. Another justificationfor this frequency band choice is the finding in Comin and Gertler(2006) that the medium-term cycle (defined as frequencies between32 and 200 quarters) captures sustained swings in economic activ-ity in the United States over the post-war period, and the find-ing in Beaudry, Galizia, and Portier (2016) that cyclically sensitivevariables display peaks in the spectral density occurring at around40 quarters. Finally, this frequency band choice is justified by thefinding in Runstler and Vlekke (2018) that cycles in credit and house
8The bandpass filter (Christiano and Fitzgerald 2003) is a two-sided univariatemoving-average filter that isolates chosen frequencies in the time series.
9As noted in footnote 10, Drehmann, Borio, and Tsatsaronis (2012) documentthe greater relative volatility of the medium-term cyclical component for variablesthat compose the financial cycle. This implies that medium-term cycles are moreimportant than short-term cycles in shaping the behavior of the financial cycle.

Vol. 15 No. 1 The Synchronization of Business Cycles 337
prices are highly correlated with the medium-term component ofGDP cycles.10,11
Thus, in the same manner as for the financial cycle, I use thebandpass filter proposed by Christiano and Fitzgerald (2003) toextract the medium-term cyclical component (defined as frequenciesbetween 32 and 120 quarters) of real, seasonally adjusted GDP, nor-malized to its value in 1985:Q1. The data are filtered in four-quarterdifferences in log levels.12 Conceptually, this approach is similar toestimating the business cycle as an output gap by using a univariateor multivariate filter (e.g., Berger et al. 2015), as both approachesentail decomposing GDP or other macroeconomic time series intotrend and cyclical components.
2.1.3 Leverage Cycle Measurement
To study the relationship between domestic business and finan-cial cycles, I focus on the leverage cycle. I define the latteras the medium-term cyclical fluctuations in the credit-to-GDPratio (in line with Drehmann, Borio, and Tsatsaronis 2012, who
10There are four further justifications for this frequency band choice. First,Drehmann, Borio, and Tsatsaronis (2012) document that, for several advancedeconomies, the medium-term cyclical component of GDP is more volatile than theshort-term cyclical component. Second, these authors confirm that the greaterrelative volatility of the medium-term cyclical component also applies to thevariables that compose the financial cycle, meaning that medium-term cycles aremore important than short-term cycles in shaping the behavior of the financialcycle. Third, they note that the low frequency of financial crises makes low-frequency analysis relevant, and show that only 20–30 percent of high-frequencypeaks are close to a crisis. Fourth, Schuler, Hiebert, and Peltonen (2017) findthat, across G-7 countries, business cycle indicators share important medium-and long-term cycles with credit.
11While the exclusion of traditional business cycle frequencies from the chosenfrequency band could justify calling the GDP cycle the “medium-term cycle,” forsimplicity and clarity when contrasting business and financial cycles—and giventhe findings in the literature on the low frequency of various cyclical dynamics—Irefer to the medium-term GDP cycle as the business cycle.
12Notwithstanding the reasons for focusing on medium-term frequencies pro-vided in footnote 10, the main findings of this paper are robust to using the same8- to 120-quarter frequency band to measure both business cycles and finan-cial cycles. See the robustness tests in online appendix A (online appendixes areavailable at http://www.ijcb.org). Such a frequency band broadly corresponds tothe conventional decomposition of the data using a bandpass filter with businesscycle frequencies set to be between two and thirty-two quarters (Christiano andFitzgerald 2003; Comin and Gertler 2006).

338 International Journal of Central Banking March 2019
identify the credit-to-GDP cycle as one of the three cycles that com-pose the financial cycle), and use the estimates generated for thefiltered credit-to-GDP ratio series described in section 2.1.1. Theleverage cycle therefore captures the medium-term cyclical com-ponent (defined as frequencies between 32 and 120 quarters) ofthe credit-to-GDP ratio (in percentage points and normalized to1985:Q1), filtered in annual growth rates. The EA11 leverage cycleis the GDP-weighted average of the national leverage cycles of eachof the eleven sample euro-area countries, measured in year-on-yearpercentage change.
2.2 Measurement of Business Cycle andFinancial Cycle Synchronization
I divide the sample period into three subperiods: 1971:Q1–1998:Q4 (pre-euro area), 1999:Q1–2007:Q1 (pre-crisis euro area),and 2007:Q2–2015:Q1 (crisis period). The justification for this choiceof periods is that the aim of this paper is to study business andfinancial cycle synchronization under EMU, which leads to a nat-ural break at the introduction of the euro in 1999. The choice of2007:Q1 is justified by the fact that, in many euro-area countries,the business cycle (and in several cases the housing boom) peakedaround 2007:H1, and by the fact that the turmoil of the global finan-cial crisis also began in the middle of 2007. An additional advantageof choosing 2007:Q1 is that this allows for the two EMU subperiodsto comprise a similar number of quarters. I focus on two comple-mentary measures of synchronization: the concordance statistic andthe similarity measure.
2.2.1 Co-movement: Concordance Statistic
The concordance statistic is a bivariate synchronization index, whichprovides a measure of the degree of co-movement between two cycles.The concordance statistic was proposed by Harding and Pagan(2003) (see also McDermott and Scott 2000, and Claessens, Kose,and Terrones 2011). Following these authors, the concordance sta-tistic, CIxy, for variables x and y is defined as
CIxy =1T
T∑t=1
[Cxt · Cy
t + (1 − Cxt ) · (1 − Cy
t )], (1)

Vol. 15 No. 1 The Synchronization of Business Cycles 339
whereCx
t = {0, if x is in recession phase at time t;1, if x is in expansion phase at time t}
Cyt = {0, if y is in recession phase at time t;
1, if y is in expansion phase at time t}.
The concordance static measures the fraction of time that twoseries are in the same phase of their respective cycles, with the seriesbeing fully procyclical (countercyclical) if the concordance statisticis equal to one (zero).
I compute concordance statistics for each of the fifty-five countrypairs in my sample and assemble summary statistics for the sampleof country pairs.
2.3 Amplitude: Similarity Measure
A second aspect of cyclical synchronicity, which complements con-cordance, is the difference in amplitude between two cycles at agiven point in time. What makes the focus on amplitude informativeis that, as noted by Mink, Jacobs, and de Haan (2012) and Belke,Domnick, and Gros (2016), there can be significant differences incyclical positions even when national cycles are highly correlated.
To study amplitude discrepancies between different cycles, I optfor the similarity measure proposed by Mink, Jacobs, and de Haan(2012). The similarity measure is defined by Mink, Jacobs, and deHaan (2012) such that it maximizes similarity of a given variable inthe cross-section. Although Mink, Jacobs, and de Haan (2012) applythe similarity measure to output gaps, the measure can readily beapplied to business and financial cycles. Indeed, conceptually busi-ness and financial cycles are analogous to output gaps, as they meas-ure the deviation of GDP and credit, credit-to-GDP, and residentialproperty prices, respectively, from their long-term trend.
Following Mink, Jacobs, and de Haan (2012), the similarity meas-ure, γir(t), is defined as
γir(t) = 1 − |gi(t) − gr(t)|∑ni=1 |gi(t)|/n
, (2)
where gi(t) is the level of the business cycle or financial cycle(depending on which cycle is being analyzed) of country i attime t, and gr(t) is the level of the reference business cycle or

340 International Journal of Central Banking March 2019
financial cycle for the country sample at time t. I follow Mink,Jacobs, and de Haan (2012) and set the reference business or finan-cial cycle to be the median business or financial cycle level amongsample countries at time t. This is done to maximize similarity inequation (2). As noted by Mink, Jacobs, and de Haan (2012), scalingby the average absolute business or financial cycle level implies thatthe similarity measure is scale invariant. Similarity is thus definedon a [1 − n, 1] scale, with unity indicating that both cycles have thesame amplitude.
To analyze the degree of amplitude similarity between the com-posite business and financial cycles of the high-amplitude and low-amplitude country groups, I apply equation (2) to these cycles bysetting gi(t) equal to the composite business or financial cycle of thehigh- or low-amplitude group and keeping gr(t) equal to the medianbusiness or financial cycle level among sample countries at time t.
3. Main Features of Business Cycles andFinancial Cycles in the Euro Area
I begin by describing the aggregate euro-area and national businessand financial cycle estimates. Figure 1 shows the aggregate finan-cial cycle and business cycle for the EA11, based on GDP-weightedaverages of national financial and business cycles. Several elementsstand out in the figure. First, the amplitude of the EA11 financial cycleis greater than that of the EA11 business cycle, and has increased sincethe mid-1980s. This result confirms the findings of studies that use thesame methodology to measure the financial cycle (Drehmann, Borio,and Tsatsaronis 2012; Aglietta and Brand 2015; ECB 2015; Merler2015; Galati et al. 2016). However, figure 1 shows that the magnitudeof the EA11 financial cycle is relatively moderate, as its fluctuationsare ranging from 3 to –4 percent.
Second, figure 2 shows significant heterogeneity in financial cyclesacross countries.13 This is consistent with ECB (2014), which finds
13For the financial cycles of individual countries, see online appendix figuresB1 and B2. Whereas Spain and Ireland experienced financial cycles of growingamplitude after around 1995, with the peak in their financial cycles (around 8percent for Spain and 12 percent for Ireland) coinciding with the global finan-cial crisis, Germany’s financial cycle is remarkably flat over the entire 1971–2015period, with the financial cycle oscillating between roughly 1 and –1 percent.

Vol. 15 No. 1 The Synchronization of Business Cycles 341
Figure 1. Euro-Area Financial Cycle and Business Cycle,and Recessions
Sources: BIS, OECD, CEPR, author’s calculations.Notes: The blue line (colors are shown in online version at http://www.ijcb.org)shows the composite EA11 financial cycle, corresponding to the GDP-weightedaverage of the financial cycles of the eleven sample euro-area countries, in year-on-year percentage change. Following the methodology proposed by Drehmann,Borio, and Tsatsaronis (2012), the financial cycle is based on the credit-to-GDPratio, credit to the non-financial private sector, and residential property prices.All series are normalized to 1985:Q1. The second and third variables are in realterms (deflated by CPI) and in logs. The financial cycle is defined as the simpleaverage of the medium-term cyclical component (defined as frequencies between32 and 120 quarters) of the three series, filtered in annual growth rates. Forthree countries (Austria, Portugal, and Greece) residential property price datado not extend back far enough in time and were therefore excluded from thecomposite financial cycle measure. The red line shows the composite EA11 busi-ness cycle, corresponding to the GDP-weighted average of the business cycles ofthe eleven sample euro-area countries, in year-on-year percentage change. Thebusiness cycle is defined as the medium-term cyclical component (also definedas frequencies between 32 and 120 quarters) of real, seasonally adjusted GDPnormalized to 1985:Q1. The shaded areas represent euro-area recessions (fromthe quarter following the peak through the quarter of the trough) as defined bythe CEPR Euro Area Business Cycle Dating Committee.
that, in the euro area, financial cycles tend to be more volatile thanbusiness cycles (with strong cross-country heterogeneity), as wellas Runstler and Vlekke (2018) and Schuler, Hiebert, and Peltonen(2017).
It is important to stress the high degree of heterogeneity betweenfinancial cycles across different regions. To investigate regional

342 International Journal of Central Banking March 2019
Figure 2. Standard Deviation of National Business andFinancial Cycles, 1999:Q1–2007:Q1, 2007:Q2–2015:Q1
Sources: Author’s calculations.Notes: See figure 1. The blue and red lines indicate the standard deviation,in percent, of the financial cycles of all eleven countries in the sample over1999:Q1–2015:Q1 and 2007:Q2–2015:Q1, respectively.
financial cycle patterns within EMU, I separate countries into fivecountry groups: (i) the entire sample of euro-area countries (EA11),(ii) countries with high financial cycle amplitude, (iii) countries withlow financial cycle amplitude, (iv) low-amplitude countries exclud-ing Germany, and (v) Germany (which is described as a “countrygroup” for simplicity). Germany is singled out due to its atypicalfinancial cycle, the dynamics of which are documented in section 4.14
Given that this paper focuses on the behavior of financial cycles inthe euro area, to determine whether a country falls into the “high-amplitude” or “low-amplitude” group, I analyze the volatility ofnational financial cycles over two periods: the entire euro period
14Indeed, Germany has by far the lowest overall financial cycle volatility. Theratio of the standard deviation, over the entire sample period, of Germany’s finan-cial cycle (1.1 percent) to the standard deviation of all eleven financial cycles inthe sample (3.4 percent) is a little lower than one-third. This result is robust tousing an 8- to 120-quarter bandpass filter to measure financial cycles. On thismeasure, the ratio of the standard deviation, over the entire sample period, ofthe German financial cycle (1.6 percent) to the standard deviation of all elevenfinancial cycles in the sample (4.3 percent) is a little higher than one-third.
Vol. 15 No. 1 The Synchronization of Business Cycles 343
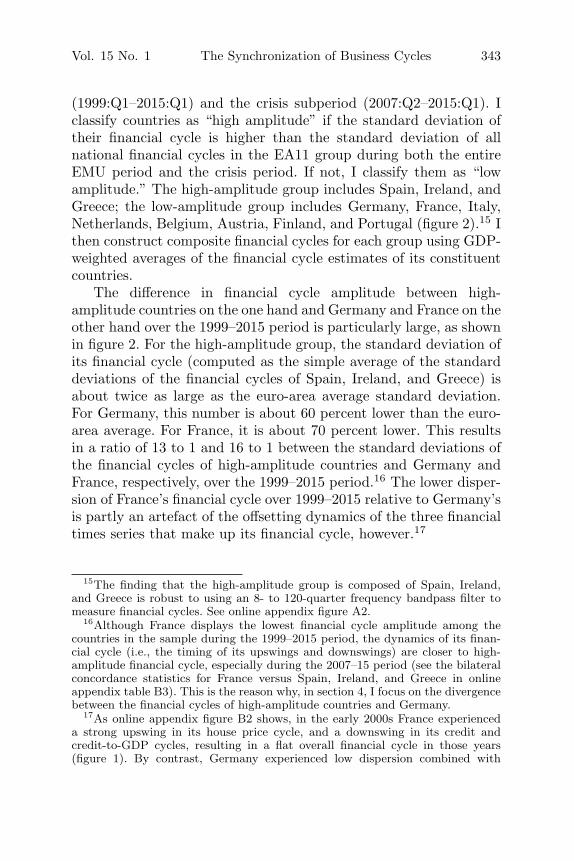
(1999:Q1–2015:Q1) and the crisis subperiod (2007:Q2–2015:Q1). Iclassify countries as “high amplitude” if the standard deviation oftheir financial cycle is higher than the standard deviation of allnational financial cycles in the EA11 group during both the entireEMU period and the crisis period. If not, I classify them as “lowamplitude.” The high-amplitude group includes Spain, Ireland, andGreece; the low-amplitude group includes Germany, France, Italy,Netherlands, Belgium, Austria, Finland, and Portugal (figure 2).15 Ithen construct composite financial cycles for each group using GDP-weighted averages of the financial cycle estimates of its constituentcountries.
The difference in financial cycle amplitude between high-amplitude countries on the one hand and Germany and France on theother hand over the 1999–2015 period is particularly large, as shownin figure 2. For the high-amplitude group, the standard deviation ofits financial cycle (computed as the simple average of the standarddeviations of the financial cycles of Spain, Ireland, and Greece) isabout twice as large as the euro-area average standard deviation.For Germany, this number is about 60 percent lower than the euro-area average. For France, it is about 70 percent lower. This resultsin a ratio of 13 to 1 and 16 to 1 between the standard deviations ofthe financial cycles of high-amplitude countries and Germany andFrance, respectively, over the 1999–2015 period.16 The lower disper-sion of France’s financial cycle over 1999–2015 relative to Germany’sis partly an artefact of the offsetting dynamics of the three financialtimes series that make up its financial cycle, however.17
15The finding that the high-amplitude group is composed of Spain, Ireland,and Greece is robust to using an 8- to 120-quarter frequency bandpass filter tomeasure financial cycles. See online appendix figure A2.
16Although France displays the lowest financial cycle amplitude among thecountries in the sample during the 1999–2015 period, the dynamics of its finan-cial cycle (i.e., the timing of its upswings and downswings) are closer to high-amplitude financial cycle, especially during the 2007–15 period (see the bilateralconcordance statistics for France versus Spain, Ireland, and Greece in onlineappendix table B3). This is the reason why, in section 4, I focus on the divergencebetween the financial cycles of high-amplitude countries and Germany.
17As online appendix figure B2 shows, in the early 2000s France experienceda strong upswing in its house price cycle, and a downswing in its credit andcredit-to-GDP cycles, resulting in a flat overall financial cycle in those years(figure 1). By contrast, Germany experienced low dispersion combined with
344 International Journal of Central Banking March 2019
The finding that Spain, Ireland, and Greece stand out amongeuro-area countries as having high-amplitude financial cycles is con-sistent with Hyppolite (2016), who identifies these three countriesas sharing the characteristic of having experienced strong growth inexternal debt linked to real estate bubbles that began in the mid-1990s. Hyppolite also notes that the balance of payments approachto explaining the euro-area crisis in so-called periphery countries fitsIreland, Portugal, and Spain, but not Greece, whereas an approachthat links external debt to real estate bubbles can explain cri-sis dynamics in Spain, Ireland, and Greece, and fits the case ofPortugal less well, which is consistent with the results of thispaper.
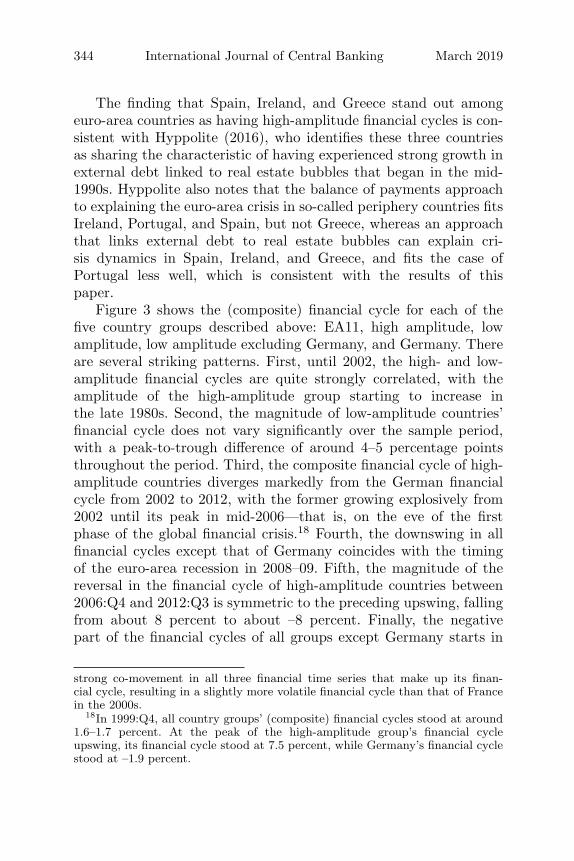
Figure 3 shows the (composite) financial cycle for each of thefive country groups described above: EA11, high amplitude, lowamplitude, low amplitude excluding Germany, and Germany. Thereare several striking patterns. First, until 2002, the high- and low-amplitude financial cycles are quite strongly correlated, with theamplitude of the high-amplitude group starting to increase inthe late 1980s. Second, the magnitude of low-amplitude countries’financial cycle does not vary significantly over the sample period,with a peak-to-trough difference of around 4–5 percentage pointsthroughout the period. Third, the composite financial cycle of high-amplitude countries diverges markedly from the German financialcycle from 2002 to 2012, with the former growing explosively from2002 until its peak in mid-2006—that is, on the eve of the firstphase of the global financial crisis.18 Fourth, the downswing in allfinancial cycles except that of Germany coincides with the timingof the euro-area recession in 2008–09. Fifth, the magnitude of thereversal in the financial cycle of high-amplitude countries between2006:Q4 and 2012:Q3 is symmetric to the preceding upswing, fallingfrom about 8 percent to about –8 percent. Finally, the negativepart of the financial cycles of all groups except Germany starts in
strong co-movement in all three financial time series that make up its finan-cial cycle, resulting in a slightly more volatile financial cycle than that of Francein the 2000s.
18In 1999:Q4, all country groups’ (composite) financial cycles stood at around1.6–1.7 percent. At the peak of the high-amplitude group’s financial cycleupswing, its financial cycle stood at 7.5 percent, while Germany’s financial cyclestood at –1.9 percent.

Vol. 15 No. 1 The Synchronization of Business Cycles 345
Figure 3. Euro-Area Financial Cycles: EA11,High-Amplitude Countries, Low-Amplitude Countries,
Low-Amplitude Countries excluding Germany,and Germany
Sources: BIS, OECD, CEPR, author’s calculations.Notes: See figure 1. High-amplitude countries include Spain, Ireland, and Greece;low-amplitude countries include Germany, France, Italy, Netherlands, Belgium,Austria, Finland, and Portugal.
2009:Q2—that is, at the same time as the euro-area crisis, whicherupted in Greece in 2009 and spread to Ireland in 2010 and Portu-gal, Spain, and Italy in 2011.19
Figure 4 shows the business cycles of the same five countrygroups. Two main differences between it and figure 3 are appar-ent. First, the amplitudes of all country-group business cycles are
19Financial cycles are very heterogeneous across euro-area countries. Onlineappendix figure B4 shows enormous divergence between Germany’s and Spain’sfinancial cycles between 1999 and 2015. Germany’s financial cycle entered a down-ward phase around 1999, which lasted until 2007. In contrast, Spain’s financialcycle remained in an upturn phase from 1995 until 2007, and then experienced asevere reversal until 2013. Online appendix figure B5 shows that France’s financialcycle is highly correlated with that of the EA11 throughout the period 1971–2015. Interestingly, France also stands close to the euro-area average in terms ofkey macroeconomic indicators, such as GDP growth, inflation, investment, andunemployment.

346 International Journal of Central Banking March 2019
Figure 4. Euro-Area Business Cycles: EA11,High-Amplitude Countries, Low-Amplitude Countries,
Low-Amplitude Countries excluding Germany,and Germany
Sources: OECD, CEPR, author’s calculations.Notes: See figure 1. High-amplitude countries include Spain, Ireland, and Greece;low-amplitude countries include Germany, France, Italy, Netherlands, Belgium,Austria, Finland, and Portugal.
much smaller and much more homogeneous. Indeed, the standarddeviation, over the sample period, of the financial cycles of all EA11countries is over twice the standard deviation of the business cyclesof all EA11 countries.20 Second, the business cycles are much morecorrelated, with no clear divergence between the business cycles ofany of the five country groups. There is one commonality with figure3, however. Similarly to the boom-bust financial cycle it experiencedaround the 2008–09 eura-area recession, the high-amplitude countrygroup exhibits a more positive business cycle than other countrygroups in the run-up to the 2008–09 euro-area recession, followed bya deeper downturn.
20This finding is robust to using an 8- to 120-quarter frequency band to meas-ure business and financial cycles. On this measure, the standard deviation ofEA11 financial cycles is 1.8 times that of EA11 business cycles.

Vol. 15 No. 1 The Synchronization of Business Cycles 347
4. Results
In this section, I study the synchronization of business and finan-cial cycles across and within countries, and between selected countrygroups.21 Building on the stylized facts documented in section 3 onthe distinct cyclical dynamics of different country groups, I centerthe analysis around the same country breakdown: the entire sam-ple of euro-area countries (EA11), high-amplitude countries, low-amplitude countries, low-amplitude countries excluding Germany,and Germany. Germany is singled out and compared with thesecountry groups, reflecting the idiosyncratic nature of the Germanfinancial cycle, which is documented below.22
Findings focus on six areas: (i) the leverage cycle at the aggre-gate euro-area level (figure 5); (ii) business cycle and financial cycleconcordance and similarity across the euro area (table 1, first sixrows); (iii) the concordance of the composite business cycles andfinancial cycles of high-amplitude countries and low-amplitude coun-tries and of Germany and high-amplitude countries (table 1, first twocolumns, fourth to twelfth rows); (iv) the similarity of the compositebusiness cycles and financial cycles of high-amplitude countries andlow-amplitude countries relative to the median euro-area businesscycle and financial cycle (table 1, last two columns, last six rows);(v) the concordance of business cycles and financial cycles withineuro-area countries (table 2); and (vi) the leverage cycle at the levelof country groups (figure 6). I discuss each finding in turn, fromthe more general (pertaining to the euro area) to the more specific(pertaining to groups of countries within the monetary union).
The first finding is summarized in figure 5, which plots the aggre-gate EA11 leverage cycle. The figure shows that, in the five-yearperiods preceding each euro-area recession after 1990, the averagelevel of the aggregate euro-area leverage cycle was positive. This isconfirmed by online appendix table A1, which quantifies the EA11leverage cycle in each of these five-year periods.23
21For detailed results, including figures and tables on individual countries, seeonline appendix figures B1–B7 and tables B1–B3.
22As noted in section 3, each composite business or financial cycle is weightedby the GDP levels of its constituent countries.
23This finding is robust to using the same 8- to 120-quarter frequency bandpassfilter to measure the leverage cycle. See online appendix figure A5 and table A2.

348 International Journal of Central Banking March 2019
Figure 5. Euro-Area Leverage Cycle
Sources: BIS, OECD, CEPR, author’s calculations.Notes: The composite EA11 leverage cycle corresponds to the GDP-weightedaverage of the leverage cycles of the eleven sample euro-area countries, in year-on-year percentage change. Following the methodology proposed by Drehmann,Borio, and Tsatsaronis (2012), the leverage cycle corresponds to the medium-term cyclical component (defined as frequencies between 32 and 120 quarters)of the credit-to-GDP ratio (in percentage points and normalized to 1985:Q1),filtered in annual growth rates.
Several empirical regularities stand out. First, the volatility ofthe aggregate euro-area leverage cycle has increased, with peaksrising from a little under 2 percent prior to the 1990–93 recessionto close to 3 percent prior to the 2008–09 recession, and troughswidening from less than –1.5 percent in the 1970s and 1980s toaround –3 percent in the 1990s and 2000s. Troughs were observedtwo to five years after the end of each euro-area recession thatoccurred after 1980. Second, the number of years during which theleverage cycle was positive is roughly proportional to the severityof the ensuing recession: the buildup in leverage lasted four yearsprior to the 1992–93 recession, and eight years prior to the 2008–09 recession. This empirical regularity is consistent with Jorda,Schularick, and Taylor (2013) and Jorda, Schularick, and Taylor(2016a), who find that aftermaths of leveraged booms are associ-ated with slower growth in GDP, investment, and credit, and withJorda, Schularick, and Taylor (2017), who document an association

Vol. 15 No. 1 The Synchronization of Business Cycles 349
Table 1. Concordance Statistics and Similarity Measuresfor Business Cycles and Financial Cycles across
Euro-Area Countries
Concordance Similarity
Business Financial Business FinancialPeriod Cycles Cycles Cycles Cycles
EA11
1971–1998 0.76 0.66 0.54 0.32(0.76) (0.65) (0.33) (0.15)
1999–2007 0.78 0.49 0.27 0.33(0.78) (0.57) (0.08) (0.21)
2007–2015 0.94 0.64 0.52 0.37(0.95) (0.71) (0.38) (0.32)
1971–1998 0.69 0.65 — —
High- vs.(0.68) (0.67)
Low-Amplitude1999–2007 0.77 0.52 — —
Countries(0.80) (0.50)
2007–2015 0.94 0.68 — —(0.95) (0.75)
1971–1998 0.71 0.68 — —High- vs. (0.69) 0.68Low-Amplitude 1999–2007 0.81 0.67 — —Countries (ex. (0.81) (0.53)Germany) 2007–2015 0.95 0.87 — —
(0.96) (0.81)
Germany vs. 1971–1998 0.65 0.59 — —High-Amplitude 1999–2007 0.70 0.24 — —Countries 2007–2015 0.91 0.32 — —
High-Amplitude1971–1998 — — 0.18 0.39
Countries1999–2007 — — −0.38 −0.242007–2015 — — 0.04 −0.15
Low-Amplitude1971–1998 — — 0.84 0.69
Countries1999–2007 — — 0.67 0.722007–2015 — — 0.73 0.62
Source: Author’s calculations.Notes: Cells show the concordance statistics and similarity measures for various country groups. Allnumbers are GDP-weighted averages, with simple averages in parentheses, except for the concordancestatistics for Germany versus high-amplitude countries and the similarity measures for high- and low-amplitude countries, which are simple averages (as they are calculated using the composite businessand financial cycles for high- and low-amplitude countries). The similarity measures for high- and low-amplitude countries correspond to the similarity of these country groups’ composite business or financialcycles with the median euro-area business or financial cycle, respectively (see section 2.2.2 for details onthe methodology). The concordance statistic measures the fraction of time that two series are in the samephase of the cycle, with the series being perfectly procyclical (countercyclical) if the statistic is equalto one (zero). The similarity measure maximizes similarity of a given variable in the cross-section withrespect to a reference value (set to be the median value, for all sample countries, of the variable under con-sideration). GDP-weighted averages and simple averages are calculated using the bilateral concordancestatistics or similarity measures of all sample countries. High-amplitude countries include Spain, Ireland,and Greece; low-amplitude countries include Germany, France, Italy, Netherlands, Belgium, Austria, Fin-land, and Portugal. The exact periods shown in the table are 1971:Q1–1998:Q4, 1999:Q1–2007:Q1, and2007:Q2–2015:Q1.

350 International Journal of Central Banking March 2019
Table 2. Concordance of Business Cycles and FinancialCycles within Individual Euro-Area Countries
1971–1998 1999–2007 2007–2015
Austria 0.86 0.76 0.75Belgium 0.62 0.64 0.56Finland 0.62 0.58 0.72France 0.90 0.42 0.75Germany 0.79 045 0.56Greece 0.68 0.27 0.53Ireland 0.77 0.61 0.63Italy 0.41 0.36 0.78Netherlands 0.77 0.67 0.75Portugal 0.46 0.55 0.28Spain 0.80 0.55 0.88Average 0.70 0.53 0.65GDP-Weighted Average 0.72 0.47 0.69
Source: Author’s calculations.Notes: See table 1 for the definition of the concordance statistic. The exact periods shownin the table are 1971:Q1–1998:Q4, 1999:Q1–2007:Q1, and 2007:Q2–2015:Q1.
between higher leverage and lower real volatility but larger tailevents.
The second finding is that, across countries, the overall degreeof financial cycle synchronicity is lower than the overall degree ofbusiness cycle synchronicity. Table 1 (first three rows, first twocolumns) shows that the average degree of bilateral concordanceis much higher for business cycles than for financial cycles. Table 1(first three rows, last two columns) shows that the average similarityof cyclical amplitude is higher for business cycles than for finan-cial cycles.24 The evidence of a high degree of co-movement acrosseuro-area economies is consistent with De Grauwe and Ji (2016),who find similar levels of cross-country bilateral business cyclecorrelations.
24These findings, as well as those in the rest of this section that refer to table 1,are robust to using an 8- to 120-quarter frequency band to measure both businessand financial cycles. See online appendix table A1.

Vol. 15 No. 1 The Synchronization of Business Cycles 351
Figure 6. Euro-Area Leverage Cycles:EA11, High-Amplitude Countries, Low-Amplitude
Countries, Low-Amplitude Countries excludingGermany, and Germany
Sources: BIS, OECD, CEPR, author’s calculations.Notes: Each line represents the (composite) leverage cycle of a country groupor country. See figure 5 for the definition of the leverage cycle. High-amplitudecountries include Spain, Ireland, and Greece; low-amplitude countries includeGermany, France, Italy, Netherlands, Belgium, Austria, Finland, and Portugal.
The third finding is that, following euro introduction, averagebusiness cycle synchronization increased while average financial cyclesynchronization decreased. As summarized in table 1 (first twelverows, first column), business cycle concordance increased continu-ously and in a broad-based manner, reaching a very high level inthe crisis period.25 By contrast, financial cycle concordance fell inthe boom period and rose in the crisis period (table 1, first threerows, second column).26 The latter rise likely reflects the role of theglobal financial crisis, which was associated with a severe financial
25For average business cycle concordance statistics for individual countries, seeonline appendix table B1.
26Average financial cycle concordance statistics for individual countries werealso much more dispersed following euro introduction, especially in the boomperiod. See online appendix table B2.

352 International Journal of Central Banking March 2019
cycle downturn in most euro-area countries (see online appendixfigure B3). This pattern is consistent with Stremmel and Zsamboki(2015), who find evidence that financial cycles are less synchronizedin tranquil periods and more synchronized in episodes of commonfinancial stress.
While the average degree of business cycle amplitude similaritydecreased somewhat in the boom period (table 1, first three rows,third column), it remained relatively high, and increased in the crisisperiod. The finding that business cycle concordance increased withthe introduction of the euro, which increased trade and financial inte-gration among euro-area countries, is consistent with the literatureon the global co-movement in output in the post-war period.27 High-amplitude countries are an exception, as there was increased businesscycle amplitude dispersion between high- and low-amplitude coun-tries in the crisis period (table 1, bottom six rows, third column),likely reflecting the severity of the recessions in these countries. Forfinancial cycles, amplitude similarity remained stable at a lower level(table 1, first three rows, fourth column) but also masked amplitudedispersion between high- and low-amplitude countries. I turn to thisresult below.
The fourth finding is that financial cycle desynchronization wasmore pronounced between countries with high financial cycle ampli-tude and countries with low financial cycle amplitude, especiallyGermany. There is evidence of divergence between the financialcycles of high- and low-amplitude countries, especially Germany,in terms of concordance (table 1, fourth to twelfth rows, secondcolumn). This pattern partly reflects the explosive financial cycleupswing and the severe financial cycle downswing experienced bySpain, Ireland, and Greece before and after 2007, respectively.28 The
27Bordo and Helbling (2003) find much higher output correlation among six-teen countries during the 1973–2001 period than during the 1942–1973 period,with common shocks being the dominant influence across all regimes.
28High-amplitude countries consistently had the lowest business cycle simi-larity in the two euro subperiods, with similarity measures ranging from 0.1to −1.1, while Germany had the fourth-lowest similarity in the crisis period(0.44). See online appendix figure B6. High-amplitude countries had the low-est financial cycle similarity in the two euro subperiods (except for Greece in theboom period), with similarity measures ranging from −0.1 to −0.9, and Germanyhad the fourth-lowest similarity in the crisis period (0.18). See online appendixfigure B7.

Vol. 15 No. 1 The Synchronization of Business Cycles 353
relatively high and stable degree of average financial cycle similaritycontrasts with the divergence in amplitude similarity between high-and low-amplitude countries (table 1, last six rows, last column).Furthermore, Germany stands out due to its decorrelated financialcycle, in terms of concordance, in both the boom period and the crisisperiod (online appendix table B2). In the crisis period, the dynam-ics of Germany’s financial cycle contrasted even more sharply witheuro-area dynamics, as average financial cycle concordance rose toclose to its pre-euro level.29
This is particularly striking vis-a-vis high-amplitude countries(online appendix table B3). The asymmetric nature of the euro-area crisis may account for the coexistence, in the crisis period, ofhigh average concordance of financial cycles and, especially, busi-ness cycles, and low business and financial cycle similarity betweenhigh- and low-amplitude countries. The increased concordance ofthe cycles following the onset of the crisis likely reflects the factthat most euro-area countries experienced a deterioration in finan-cial conditions during this period. This pattern is consistent withthe finding of Monnet and Puy (2016) that financial crisis periodsare characterized by a strong positive impact of financial integrationon co-movement. By contrast, the increase in the dispersion of finan-cial cycle amplitudes likely reflects the fact that only some countries’financial systems were severely affected in 2009–11 (notably Greece,Ireland, Portugal, Spain, and Italy, as reflected in the increasein their sovereign bond spreads—roughly in that chronologicalorder).
The fifth finding is that the concordance of business and finan-cial cycles within individual euro-area countries exhibits a similarpattern to that of financial cycles across countries. Indeed, the aver-age degree of concordance of business and financial cycles within
29Although France had the lowest average concordance statistic in the region inthe 1999–2007 period at 0.38, its financial cycle experienced relative resynchingwith the rest of the euro area in the crisis period, with France’s average concor-dance statistic rising to 0.78, above the euro-area average of 0.64. Spain displaysa similar pattern to France, being relatively desynchronized from the other coun-tries in 1999–2007, but resynchronizing in 2007–15, with its average concordancestatistic rising from 0.45 in the former period to 0.75 in the latter. Overall, there-fore, Germany seems to be a much more significant outlier than France in termsof the relative desynching of its financial cycle from other euro-area countries.See online appendix table B2.

354 International Journal of Central Banking March 2019
countries fell significantly in the boom phase that followed eurointroduction and rose back to its pre-euro level in the crisis phase(table 2), as did the average concordance of financial cycles acrosscountries (table 1, first three rows, second column).
The finding that business cycle synchronization is high andincreased between the 1970s and 2015 while financial cycle syn-chronization decreased in the ebullient 1999–2007 period is con-sistent with the evidence presented by Schuler, Hiebert, and Pel-tonen (2017). The finding that Germany is an outlier withinthe euro area due to its very low-amplitude financial cycle andits desynchronization from high-amplitude countries is consistentwith the evidence in Runstler and Vlekke (2018) and Schuler,Hiebert, and Peltonen (2017) that Germany’s financial cycle standsout among major advanced economies. The evidence that high-amplitude countries stand out due to the large amplitude of theirfinancial cycles is, prima facie, consistent with the finding of Runstlerand Vlekke (2018) that Spain has a particularly large financialcycle.
Finally, to further investigate regional patterns in the rela-tionship between domestic business and financial cycles, I ana-lyze the behavior of the leverage cycle, which captures medium-term fluctuations in the credit-to-GDP ratio, as described insection 2.1.3.
Figure 6 plots the leverage cycle for the five country groupsdescribed at the beginning of this section. The key features of thefigure are consistent with the heterogeneous financial cycle patternsacross country groups documented in figure 3. First, the magnitudesof the leverage cycles of the high- and low-amplitude groups aresimilar until 2002 but diverge after 2002. This divergence is drivenby the increase in volatility of the high-amplitude group’s leveragecycle. The volatility of the low-amplitude group’s leverage cycle isstable over the sample period, with a peak-to-trough difference ofaround 4 percentage points throughout. By contrast, the volatility ofthe high-amplitude group’s leverage cycle increases fourfold, risingfrom a peak-to-trough difference of around 5 percentage points inthe 1980s to a peak-to-trough difference of over 20 percentage pointsin the 2000s. Second, the leverage cycle of the high-amplitude groupdiverges markedly from that of Germany from 2003 to 2014, withthe former rising explosively from 2003 until its peak in 2007 and

Vol. 15 No. 1 The Synchronization of Business Cycles 355
the latter becoming increasingly negative between 2003 and 2006.30
Third, the downswing in all the leverage cycles except Germany’scoincides with the 2008–09 euro-area recession. Fourth, the reversalin the leverage cycle of the high-amplitude group between 2008:Q1and 2014:Q3 is of a similar magnitude as the preceding upswing,with the leverage cycle falling from around 11 percent to around –9percent. Moreover, the leverage cycles of all country groups exceptGermany became negative around 2012:Q1, close to the peak of theeuro-area crisis. Finally, Germany displays a unique pattern. Notonly does Germany’s leverage cycle exhibit different cyclical pat-terns from the other country groups starting in 1990, but Germanyis also the only region where the leverage cycle is negative at theheight of the boom period, becoming negative in 2003:Q2 and reach-ing its trough in 2006:Q1. Conversely, Germany exhibits a positiveleverage cycle as early as 2013:Q4, whereas all the other regions’leverage cycles remain negative throughout the second half of thecrisis period.
In addition to the divergence between Germany and the high-amplitude group with respect to the leverage cycle, figure 6 showsthat the 1992–93 and 2008–09 euro-area recessions were precededby upswings in the leverage cycle of all country groups except Ger-many. Strikingly, the countries that diverged—Germany and high-amplitude countries—all played a systemic role during the crisis, asa creditor country for the former and as debtor countries for the lat-ter. Taken together, these elements suggest that the procyclicalityof financial and leverage cycles in some countries and their strongheterogeneity across countries matter.
5. Conclusion
This paper studies business cycle and financial cycle synchroniza-tion across and within euro-area countries. To the best of my
30In 2003:Q1, the leverage cycle of all country groups was close to zero.Between 2003:Q2 and 2007:Q4, the high-amplitude group’s leverage cycle rose to11 percent. Conversely, Germany’s leverage cycle fell to –2 percent over thesame period. The divergence continued for seven years after Germany’s and thehigh-amplitude group’s leverage cycles turned (in opposite directions) in 2006:Q1and 2007:Q4, respectively. In 2014:Q2, the high-amplitude group’s leverage cyclestood at –8.6 percent, while Germany’s leverage cycle stood at 0.1 percent.

356 International Journal of Central Banking March 2019
knowledge, financial cycle synchronization in the euro area has notbeen extensively analyzed so far. Three main results emerge. First,each five-year period that preceded a euro-area recession after 1990 ischaracterized by a procyclical upturn in the euro-area leverage cycle.This confirms the literature’s findings on the relevance of the finan-cial cycle in predicting financial crises (Borio 2014; Schuler, Hiebert,and Peltonen 2017), as financial crises have been shown typicallyto be followed by deep slumps (Reinhart and Rogoff 2009; Jorda,Schularick, and Taylor 2016a).
Second, I document heterogeneity and divergence across nationalfinancial cycles. I find that Germany’s financial cycle has beenremarkably flat throughout the sample period (1971–2015), whileSpain, Ireland, and Greece—which I name “high-amplitude”countries—experienced remarkably ample financial cycles after theintroduction of the euro. I also find that Germany’s financial cyclediverged from the composite high-amplitude financial cycle after2002. Average euro-area financial cycle concordance fell markedlyduring the boom period, and the financial cycle concordance ofhigh-amplitude countries and Germany fell sharply during theboom and crisis periods that followed euro introduction. By con-trast, I find that average business cycle synchronization increasedgradually over time, albeit with the similarity of the compos-ite business cycle of high-amplitude countries falling in the boomperiod.
Finally, consistent with the evidence of financial cycle divergencebetween high-amplitude countries and Germany, I find that lever-age cycles diverged between high-amplitude countries and Germanyfrom 2003 to 2014.
These findings contribute to the growing literature on thefinancial cycle (Borio 2014; Stremmel 2015; Schuler, Hiebert, andPeltonen 2017) and link it to the literature on business cyclesynchronization (Kalemli-Ozcan, Papaioannou, and Perri 2013; DeGrauwe and Ji 2016). The finding that, on average, the lever-age cycle was positive in each five-year period preceding euro-area recessions after 1990 confirms the procyclical role of finan-cial cycles, and hence of the financial system (Jorda, Schularick,and Taylor 2013; Borio 2014). The finding that financial cycleconcordance across euro-area countries fell after the introduction

Vol. 15 No. 1 The Synchronization of Business Cycles 357
of the euro is consistent with Samarina, Zhang, and Bezemer(2016). The finding that Germany’s financial cycle stands outas being particularly flat and desynchronized from the rest ofthe euro area is consistent with Runstler and Vlekke (2018) andSchuler, Hiebert, and Peltonen (2017). The finding that busi-ness cycle concordance is relatively strong and broad based isconsistent with De Grauwe and Ji (2016) and Schuler, Hiebert, andPeltonen (2017), respectively.
There are three reasons why the evidence on business and finan-cial cycle synchronization presented in this paper matters for euro-area monetary and macroprudential policies. First, the financialcycle can have a large impact on economic fluctuations, notablythrough the leverage cycle, which generates economic booms andbusts (Geankoplos 2010; Borio 2014; Jorda, Schularick, and Taylor2017). Second, the existence of financial cycle asymmetries acrosseuro-area member states implies that, at any given point in time,monetary policy may be inappropriate, for different reasons, for sev-eral member states. Third, to the extent that euro-area countries’position in the financial cycle and the magnitude of their finan-cial cycles are influenced by the position and amplitude of otherfinancial cycles (e.g., via cross-border capital flows), the synchro-nization of financial cycles may influence resource allocation andgenerate asset price bubbles, hindering cross-country economic con-vergence and making a systemic financial crisis more likely. Thefinding that financial cycles can become persistently desynchro-nized (in both concordance and amplitude) across member statestherefore suggests that the ECB should integrate the financialcycle into its monetary and macroprudential policy framework, andthat macroprudential policies should be countercyclical and countryspecific.
Three avenues for research would enhance our understanding ofthe relationship between business cycles and financial cycles: exam-ining the relationship between financial cycles, potential growthand its drivers, and natural interest rates; studying the interactionbetween cross-border credit, financial cycles, and resource misallo-cation, including the effect of rising collateral values on credit andlabor misallocation; and investigating the links, at the country level,between the structure of the financial system and the dynamics ofthe financial cycle.

358 International Journal of Central Banking March 2019
References
Adrian, T., and N. Boyarchenko. 2015. “Intermediary LeverageCycles and Financial Stability.” Staff Report No. 567 (February),Federal Reserve Bank of New York.
Aglietta, M., and T. Brand. 2015. “La stagnation seculaire dansles cycles financiers de longue periode.” In CEPII, L’economiemondiale 2016. Paris: La Decouverte.
Arnold, B., C. Borio, L. Ellis, and F. Moshirian. 2012. “SystemicRisk, Macroprudential Policy Frameworks, Monitoring FinancialSystems and the Evolution of Capital Adequacy.” Journal ofBanking and Finance 36 (12): 3125–32.
Beaudry, P., D. Galizia, and F. Portier. 2016. “Putting the CycleBack into Business Cycle Analysis.” NBER Working Paper No.22825 (November).
Belke, A., C. Domnick, and D. Gros. 2016. “Business Cycle Syn-chronization in the EMU: Core vs. Periphery.” CEPS WorkingDocument No. 427 (November).
Berger, H., T. Dowling, S. Lanau, W. Lian, M. Mrkaic, P. Rabanal,and M. Taheri Sanjani. 2015. “Steady as She Goes: EstimatingPotential Output During Financial ‘Booms and Busts’.” IMFWorking Paper No. 15/233 (November).
Bordo, M., and T. Helbling. 2003. “Have National Business CyclesBecome More Synchronized?” NBER Working Paper No. 10130(December).
Borio, C. 2014. “The Financial Cycle and Macroeconomics: WhatHave We Learnt?” Journal of Banking and Finance 45 (August):182–98.
Borio, C., P. Disyatat, and M. Juselius. 2013. “Rethinking Poten-tial Output: Embedding Information about the Financial Cycle.”BIS Working Paper No. 404 (February).
Borio, C., C. Furfine, and P. Lowe. 2001. “Procyclicality of theFinancial System and Financial Stability: Issues and PolicyOptions.” BIS Papers 1 (March): 1–57.
Borio, C., N. Kennedy, and S. D. Prowse. 1994. “Exploring Aggre-gate Asset Price Fluctuations across Countries: Measurement,Determinants and Monetary Policy Implications.” BIS EconomicPaper No. 40 (April).

Vol. 15 No. 1 The Synchronization of Business Cycles 359
Borio, C., M. Lombardi, and F. Zampolli. 2016. “Fiscal Sustain-ability and the Financial Cycle.” BIS Working Paper No. 552(March).
Brunnermeier, M. K., and Y. Sannikov. 2014. “A MacroeconomicModel with a Financial Sector.” American Economic Review 104(2): 379–421.
Cesa-Bianchi, A., J. Imbs, and J. Saleheen. 2016. “Finance andSynchronization.” CEPR Discussion Paper No. 11037.
Christiano, L., and T. Fitzgerald. 2003. “The Band Pass Filter.”International Economic Review 44 (2): 435–65.
Claessens, S., M. A. Kose, and M. E. Terrones. 2011. “FinancialCycles: What? How? When?” In NBER International Seminaron Macroeconomics 2010, ed. R. Clarida and F. Giavazzi, 303–43(chapter 7). National Bureau of Economic Research.
———. 2012. “How Do Business and Financial Cycles Interact?”Journal of International Economics 87 (1): 178–90.
Comin, D., and M. Gertler. 2006. “Medium-Term Business Cycles.”American Economic Review 96 (3, June): 523–51.
Constancio, V. 2016. “Principles for Macroprudential Policy.”Speech at the ECB-IMF Conference on Macroprudential Policy,Frankfurt am Main, April 26.
———. 2017. “Macroprudential Policy in a Changing Financial Sys-tem.” Second ECB Macroprudential Policy and Research Con-ference, Frankfurt am Main, May 11.
De Grauwe, P., and Y. Ji. 2016. “Synchronisation in Business Cycles:An Endogenous Explanation.” VoxEU.
Detken, C., O. Weeken, L. Alessi, D. Bonfim, M. M. Boucinha,C. Castro, S. Frontczak, G. Giordana, J. Giese, N. Jahn, andJ. Kakes. 2014. “Operationalising the Countercyclical CapitalBuffer.” ESRB Occasional Paper No. 5.
Drehmann, M., C. Borio, and K. Tsatsaronis. 2012. “Characterisingthe Financial Cycle: Don’t Lose Sight of the Medium Term!” BISWorking Paper No. 380 (June).
Eichengreen, B. 1991. “Is Europe an Optimum Currency Area?”NBER Working Paper No. 3579 (January).
———. 2007. The European Economy since 1945: Coordinated Cap-italism and Beyond. Princeton and Oxford: Princeton UniversityPress.

360 International Journal of Central Banking March 2019
Enderlein, H., E. Letta, J. Asmussen, L. Boone, A. De Geus, P.Lamy, P. Maystadt, M. Joao Rodrigues, G. Tumpel-Gugerell, andA. Vitorino. 2016. Repair and Prepare: Growth and the Euro afterBrexit. Gutersloh, Berlin, Paris: Bertelsmann Stiftung, JacquesDelors Institut – Berlin and Jacques Delors Institute in Paris.
European Central Bank. 2014. “Financial Stability Review: Captur-ing the Financial Cycle in Euro Area Countries.” November.
———. 2015. “Real Convergence in the Euro Area: Evidence, The-ory and Policy Implications.” Economic Bulletin 5/2015 (July):30–45.
Franks, J., B. Barkbu, R. Blavy, W. Oman, and H. Schoeler-mann. 2018. “Economic Convergence in the Euro Area: ComingTogether or Drifting Apart?” IMF Working Paper No. 18/10(January).
Galati, G., I. Hindrayanto, S. J. Koopman, and M. Vlekke. 2016.“Measuring Financial Cycles in a Model-Based Analysis: Empir-ical Evidence for the United States and the Euro Area.” Eco-nomics Letters 145 (C): 83–87.
Garcia-Santana, M., E. Moral-Benito, J. Prijoan-Mas, and R.Ramos. 2016. “Growing like Spain: 1995-2007.” CEPR WorkingPaper No. 11144 (March).
Geanakoplos, J. 2010. “The Leverage Cycle.” In NBER Macroeco-nomics Annual 2009, Vol. 24, ed. D. Acemoglu, K. Rogoff, andM. Woodford, 1–65 (chapter 1). Chicago: University of ChicagoPress.
Gerdrup, K., A. Kvinlog, and E. Schaanning. 2013. “Key Indica-tors for a Countercyclical Capital Buffer in Norway—Trends andUncertainty.” Staff Memo No. 13, Norges Bank.
Giannone, D., and L. Reichlin. 2006. “Trends and Cycles in the EuroArea: How Much Heterogeneity and Should We Worry about It?”ECB Working Paper No. 595.
Gopinath, G., S. Kalemli-Ozcan, L. Karabarbounis, and C. Villegas-Sanchez. 2015. “Capital Allocation and Productivity in SouthEurope.” NBER Working Paper No. 21453.
Gorton, G., and G. Ordonez. 2016. “Good Booms, Bad Booms.”NBER Working Paper No. 22008.
Harding, D., and A. Pagan. 2003. “A Comparison of Two Busi-ness Cycle Dating Methods.” Journal of Economic Dynamicsand Control 27 (9): 1681–90.

Vol. 15 No. 1 The Synchronization of Business Cycles 361
Hyppolite, P.-A. 2016. “Towards a Theory on the Causes of theGreek Depression: An Investigation of National Balance SheetData (1997-2014).” Center for European Studies Paper Series,Harvard University.
Jorda, O., M. Schularick, and A. Taylor. 2011. “Financial Crises,Credit Booms, and External Imbalances: 140 Years of Lessons.”IMF Economic Review 59 (2): 340–78.
———. 2013. “When Credit Bites Back.” Journal of Money, Creditand Banking 45 (s2): 3–28.
———. 2016a. “Sovereigns versus Banks: Credit, Crises, and Conse-quences.” Journal of the European Economic Association 14 (1):45–79.
———. 2016b. “The Great Mortgaging: Housing Finance, Crisesand Business Cycles.” Economic Policy 31 (85): 107–52.
———. 2017. “Macrofinancial History and the New Business CycleFacts.” In NBER Macroeconomics Annual 2016, Vol. 31, ed.M. Eichenbaum and J. A. Parker, 213–63. University of ChicagoPress.
Kalemli-Ozcan, S., E. Papaioannou, and F. Perri. 2013. “GlobalBanks and Crisis Transmission.” Journal of International Eco-nomics 89 (2): 495–510.
Kose, M. A., C. Otrok, and C. Whiteman. 2003. “InternationalBusiness Cycles: World, Region, and Country-Specific Factors.”American Economic Review 93 (4): 1216–39.
———. 2008. “Understanding the Evolution of World Busi-ness Cycles.” Journal of International Economics 75 (1):110–30.
Kose, M. A., E. Prasad, and M. E. Terrones. 2003. “Financial Inte-gration and Macroeconomic Volatility.” IMF Staff Papers 50(Special Issue): 119–42.
Lane, P. R., and P. McQuade. 2014. “Domestic Credit Growth andInternational Capital Flows.” Scandinavian Journal of Econom-ics 116 (1): 218–52.
McCarthy, M. 2006. “Comments on the Paper: Trends and Cycles inthe Euro Area: How Much Heterogeneity and Should We WorryAbout It?” ECB Working Paper No. 595.
McDermott, M., and A. Scott. 2000. “Concordance in BusinessCycles.” IMF Working Paper No. 00/37 (March).

362 International Journal of Central Banking March 2019
Merler, S. 2015. “Squaring the Cycle: Capital Flows, FinancialCycles, and Macro-prudential Policy in the Euro Area.” BruegelWorking Paper No. 2015/14 (November).
Mink, M., J. P. A. M. Jacobs, and J. de Haan. 2012. “MeasuringCoherence of Output Gaps with an Application to the EuroArea.” Oxford Economic Papers 64 (2): 217–36.
Monnet, E., and D. Puy. 2016. “Has Globalization Really IncreasedBusiness Cycle Synchronization?” IMF Working Paper No. 16/54(March).
Praet, P. 2014. “The Financial Cycle and Real Convergence in theEuro Area.” Speech at the Annual Hyman P. Minsky Conferenceon the State of the US and World Economies, Washington D.C.,April 10.
Reinhart, C., and K. Rogoff. 2009. “The Aftermath of FinancialCrises.” American Economic Review 99 (2): 466–72.
Rey, H. 2015. “Dilemma Not Trilemma: The Global Financial Cycleand Monetary Policy Independence.” NBER Working Paper No.21162.
Runstler, G., and M. Vlekke. 2018. “Business, Housing, and CreditCycles.” Journal of Applied Econometrics 33 (2): 212–26.
Samarina, A., L. Zhang, and D. Bezemer. 2016. “Credit Cycle Coher-ence in the Eurozone: Was There an Euro Effect?” Mimeo, Uni-versity of Groningen.
Schularick, M., and A. Taylor. 2012. “Credit Booms Gone Bust:Monetary Policy, Leverage Cycles, and Financial Crises.” Amer-ican Economic Review 102 (2): 1029–61.
Schuler, Y. S., P. Hiebert, and T. A. Peltonen. 2017. “CoherentFinancial Cycles for G-7 Countries: Why Extending Credit CanBe an Asset.” Working Paper No. 43, European Systemic RiskBoard (May).
Shin, H. S. 2012. “Global Banking Glut and Loan Risk Premium.”IMF Economic Review 60 (2): 155–92.
Stremmel, H. 2015. “Capturing the Financial Cycle in Europe.” ECBWorking Paper No. 1811.
Stremmel, H., and B. Zsamboki. 2015. “The Relationship betweenStructural and Cyclical Features of the EU Financial Sector.”ECB Working Paper No. 1812.