Embed Size (px)
Citation preview

1© 2013 TOCICO. All rights reserved.
The supply chain solutions of TOC:
Drum-Buffer Rope (DBR)Simplified DBR (SDBR)DistributionMake to Availability (MTA)
Presented By: Roy Stratton and Rudi BurkhardDate: June 2013
2© 2013 TOCICO. All rights reserved.
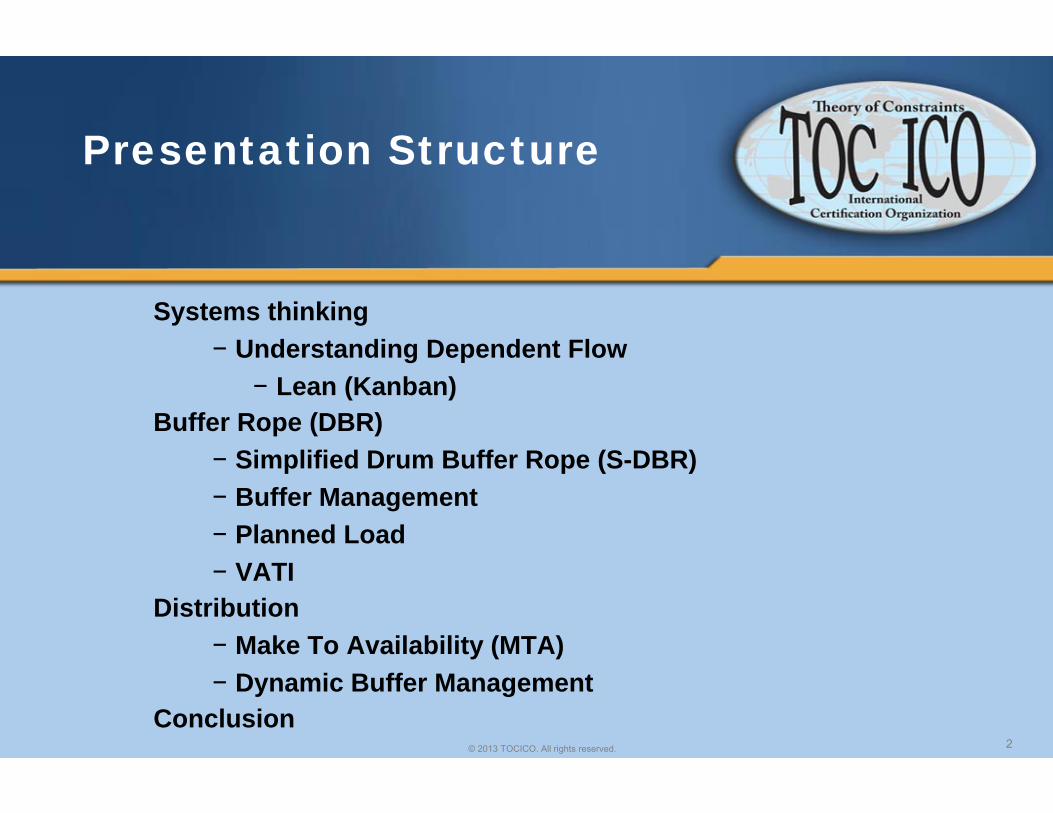
Presentation Structure
Systems thinking− Understanding Dependent Flow
− Lean (Kanban)Buffer Rope (DBR)
− Simplified Drum Buffer Rope (S-DBR)− Buffer Management− Planned Load− VATI
Distribution− Make To Availability (MTA)− Dynamic Buffer Management
Conclusion

3© 2013 TOCICO. All rights reserved.
From Cost to Systems Thinking
Systems thinking (Von Bertalanffy, 1954)- An approach to problem solving, byviewing "problems" as parts of anoverall system
Analysis – Scientific reductionism (Descartes, 1596-1650)
Take apart, understand, reassemble

4© 2013 TOCICO. All rights reserved.
The Goal (Goldratt, 1984)
• This challenging of basic assumptions is essential tobreakthroughs. Almost everyone who has worked in aplant is at least uneasy about the use of costaccounting efficiencies to control our actions. Yet fewhave challenged this sacred cow directly. Progress inunderstanding requires that we challenge basicassumptions about how the world is and why it is thatway. If we can better understand our world and theprinciples that govern it, I suspect all our lives will bebetter.”
− Goldratt’s forward to The Goal (1984)

5© 2013 TOCICO. All rights reserved.
The Cloud of Operations(Goldratt, 1999: Satellite Program viewer notes)
A resource standing idle is a major waste.Because...
DUse efficiencies as prime measurement
D’Don’t use efficiencies as a measurement
ABe a good manager
BConstantly fight to reduce waste
CConstantly fight to increase flow

6© 2013 TOCICO. All rights reserved.
TOC: The Five Steps of Focusing: the Value Focused (Throughput) Paradigm
• 1 Identify the system’s constraint(s)− (Improve Throughput (T))
• 2 Decide how to exploit the system’s constraint(s)− (Improve T)
• 3 Subordinate everything else to the above decision− Reducing variation reduces the levels of buffering (I) needed to
protect T• 4 Elevate the system’s constraint
− (Improve T)• 5 If in the previous steps a constraint has been broken, go
back to step one. − Warning – don’t allow inertia to cause a system’s constraint.
(Improve T)

7© 2013 TOCICO. All rights reserved.
UNDERSTANDING DEPENDENT FLOW

8© 2013 TOCICO. All rights reserved.
Operations Management Laws
Law (Variability): Increasing variability always degrades the performance of a delivery system (Hopp and Spearman, 1995, 2007).
Law (Variability Buffering): Variability in a delivery system will be buffered by some combination of Inventory, Capacity and Time (Hopp and Spearman, 1995, 2007).
Law (Little’s): Inventory =Throughput × Flow Time (Little, 1961)

9© 2013 TOCICO. All rights reserved.
22 May 2013
101010 10 10
Should all resources work at 100%?
A dependent sequential process with no fluctuation
• Processing time per station is 10 min • No buffers
Case 1
10 t
RM Customer
Distribution profile
What is the projected Throughput?
FLOW

10© 2013 TOCICO. All rights reserved.
22 May 2013
101010 10 10
Should all resources work at 100%?
A dependent sequential process with fluctuation
• Processing time per station averages 10 min• No buffering
Case 2
10 t
RM C
Distribution profile
What is the effect on Throughput?

11© 2013 TOCICO. All rights reserved.
22 May 2013
101010 10 10
Should all resources work at 100%?
A dependent sequential process with fluctuation
• Processing time per station averages 10 min • With inventory buffers
Case 3
10 t
RM C
Distribution profile
What is the effect on Throughput?What has happened to the lead time?
Inventory

12© 2013 TOCICO. All rights reserved.
22 May 2013
101010 10 10
Should all resources work at 100%?
A dependent sequential process with reduced fluctuation
• Processing time per station averages 10 min • Reduced variation • Reduced need for inventory
Case 4
10 t
RM C
Distribution profile
What is the effect on lead time?

13© 2013 TOCICO. All rights reserved.
22 May 2013
101010 10 10
Should all resources work at 100%?
• Processing time per station averages 10 min • Reduced variation • Reduced need for inventory• Under capacity scheduling
Case 5
10 t
RM C
Distribution profile
Lean thinking – reducing wasteful variation
Capacity buffer

14© 2013 TOCICO. All rights reserved.
22 May 2013
101010 10 10
Should all resources work at 100%?
• Processing time per station averages 10 min• Acknowledge the role of buffer capacity • Strategically manage buffers• Target variation reduction
Case 6
10 t
RM C
Distribution profile
TOC thinking – manage variation

15© 2013 TOCICO. All rights reserved.
Presentation Structure
Systems thinking− Understanding Dependent Flow− Lean (Kanban)
Buffer Rope (DBR)− Simplified Drum Buffer Rope (S-DBR)− Planned load− Buffer management− VATI
Distribution− Make To Availability (MTA)− Dynamic Buffer Management
Conclusion

16© 2013 TOCICO. All rights reserved.
22 May 2013 16
WORK-IN-PROCESS
RAW MATERIALGOODS FINISHED
Spreading troops means high inventory (long lead time) Closely packed troops means lower inventory (short lead time)
Marching soldiers analogy(Goldratt and Fox, 1986)

17© 2013 TOCICO. All rights reserved.
22 May 2013 17
Marching soldiers analogy (push)
• The traditional operations environment would have the separate soldiers (processes/ departments) work at their own rate (push).
• The first (gating) operation determines the level of WIP in the system.
Drum
18© 2013 TOCICO. All rights reserved.
22 May 2013 18
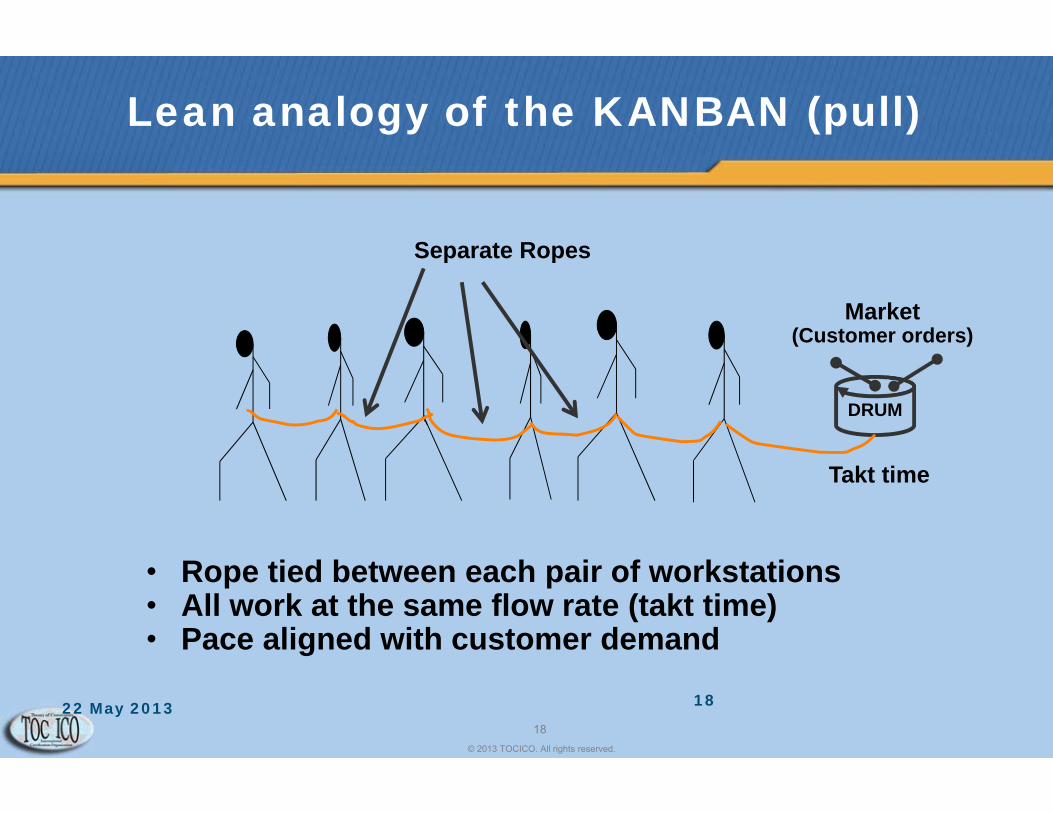
Lean analogy of the KANBAN (pull)
• Rope tied between each pair of workstations • All work at the same flow rate (takt time)• Pace aligned with customer demand
Separate Ropes
DRUM
Market(Customer orders)
Takt time

19© 2013 TOCICO. All rights reserved.
22 May 2013 19
Drum-Buffer-Rope (market drum)
• In DBR the rope simply controls the front row (raw material release) which in this case is tied directly to market demand (customer orders) leaving slack to protect overall pace.
Market(Customer orders)
Shipping Rope
Shipping Buffer
DRUM

20© 2013 TOCICO. All rights reserved.
22 May 2013 20
DBR (CCR drum)
Where there is a Capacity-Constrained Resource (CCR) this acts as the system Drum and has a detailed schedule (classic
DBR). In this case the CCR Rope is tied to the front row.
Drumschedule
CCR Rope
CCR BufferCCR

21© 2013 TOCICO. All rights reserved.
Rope/Buffer System
CCR
Customer Order
RM-1 RM2 RM-3 RM-4
The CCR buffer is a certain
fraction of the shipping buffer
A certain part of the shipping buffer is
reserved for the last part leaving the CCR to be fully completed
The order's due-date is protected by one shipping buffer, so all materials are released at the same time
Capacity-constrained resource: CCR

22© 2013 TOCICO. All rights reserved.
22 May 2013 22
Simplified Drum-Buffer-Rope (SDBR)
Shipping Rope
Shipping Buffer
• With SDBR the market acts as the only drum with one rope and buffer (shipping).
• Promise dates to the customer may vary due to the overall load on the CCR (Planned Load).
CCRMarket
(Customer orders)
DRUM

23© 2013 TOCICO. All rights reserved.
22 May 2013
101010 10 10
1 Rope and Buffer
RM DRUM
Simplified Drum-Buffer-Rope (SDBR)
Customerorders
Shipping rope (time)
TimeShipping Buffer
CCR
10 t
In SDBR the CCR load needs to becarefully planned (Planned Load)

24© 2013 TOCICO. All rights reserved.
DBR/SDBRBUFFER MANAGEMENT

25© 2013 TOCICO. All rights reserved.
25
The Functions of Buffer Management (DBR; SDBR)
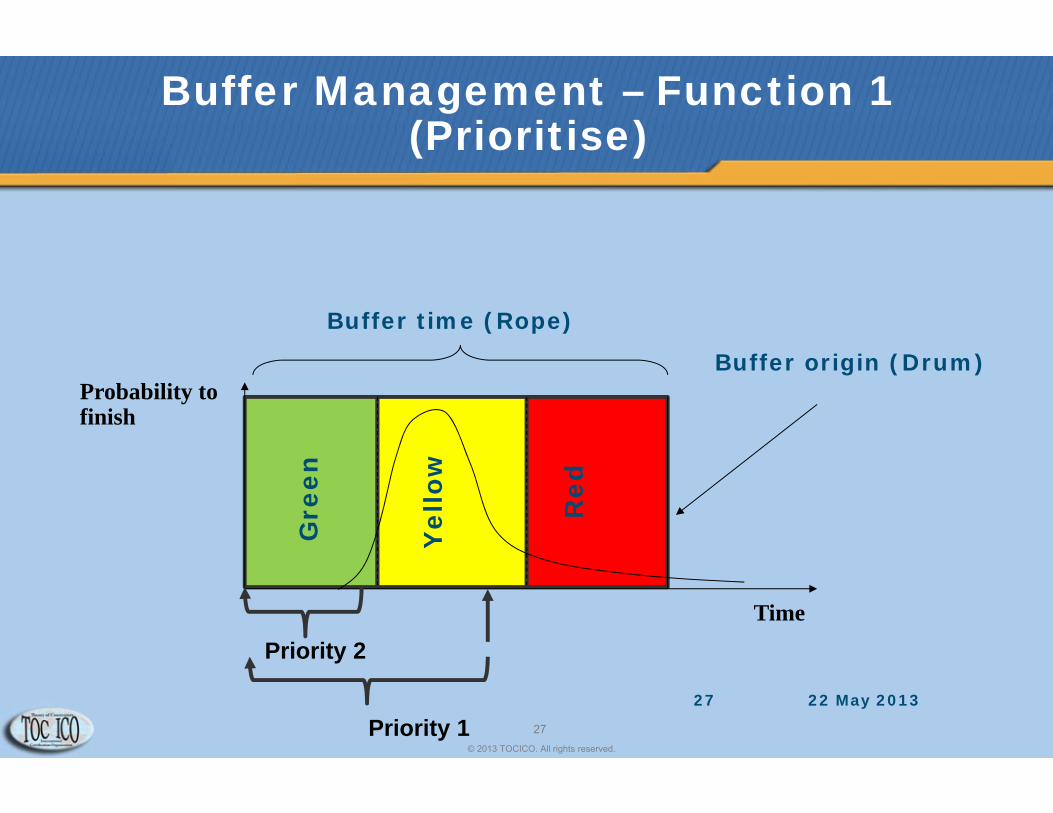
1. Prioritise the flow of work− buffer penetration
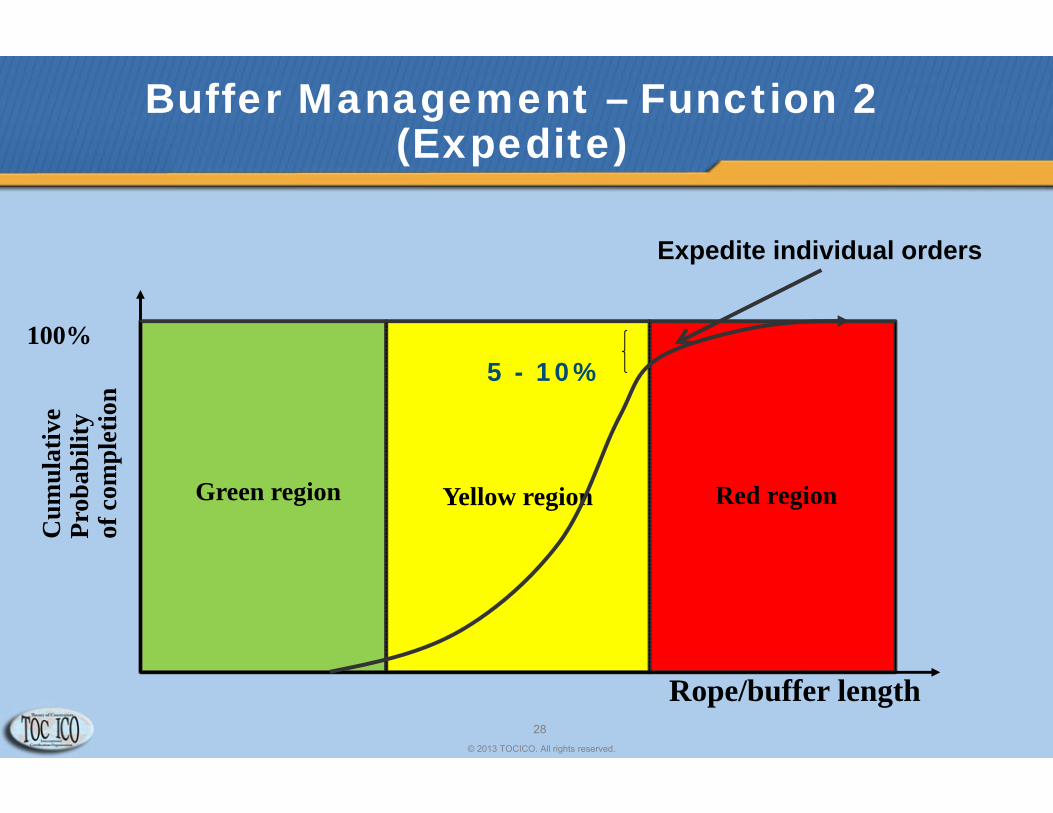
2. Identify when to expedite potential delay.− Respond to individual red zone penetration
3. Signal when there is a need to escalate intervention.− Respond to significant and growing red zone penetration
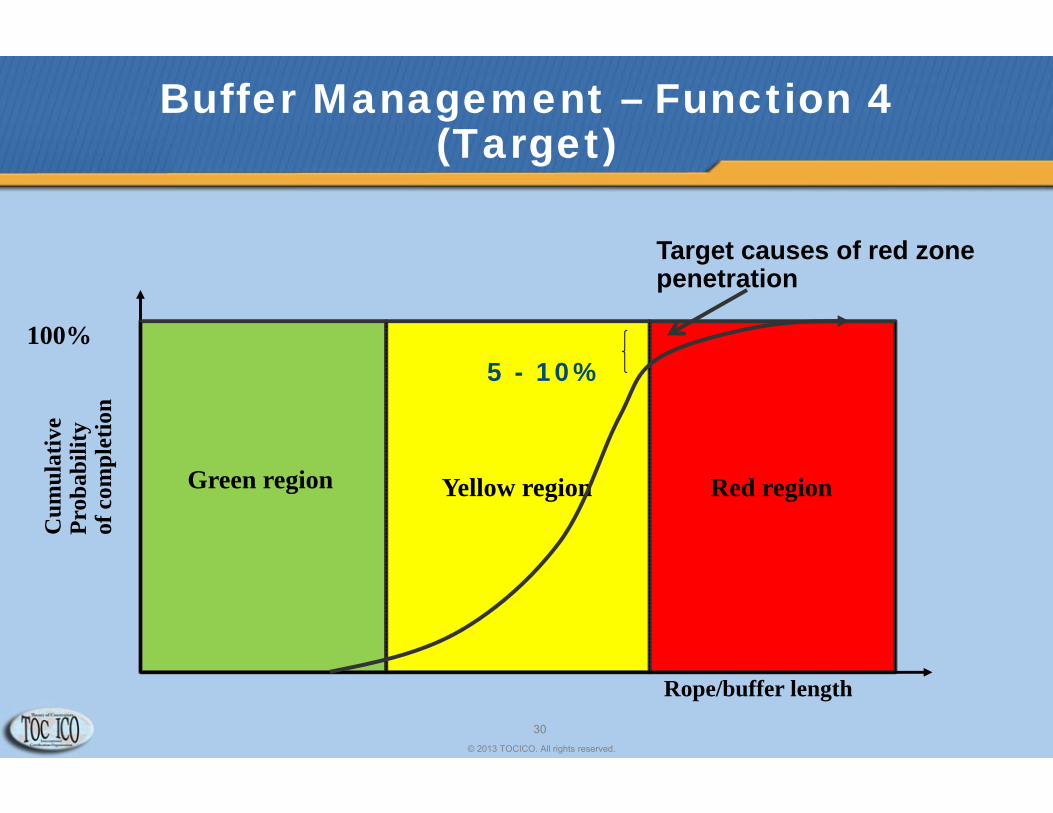
4. Identify and target main sources of delay for improvement− Pareto analysis of causes of red zone penetration

26© 2013 TOCICO. All rights reserved.
22 May 2013 26
Buffer Management (DBR; SDBR)
Time
Probability to finish
Gre
en
Yel
low
Red
Buffer time (Rope)
Buffer origin (Drum)
Skewed distribution
27© 2013 TOCICO. All rights reserved.
22 May 201327
Buffer Management – Function 1(Prioritise)
Time
Probability to finish
Gre
en
Yel
low
Red
Buffer time (Rope)
Buffer origin (Drum)
Priority 2
Priority 1
28© 2013 TOCICO. All rights reserved.
Buffer Management – Function 2(Expedite)
Rope/buffer length
Cum
ulat
ive
Prob
abili
tyof
com
plet
ion
100%
Green region
5 - 10%
Yellow region Red region
Expedite individual orders

29© 2013 TOCICO. All rights reserved.
Buffer Management - Function 3(Escalate)
Rope/buffer length
Cum
ulat
ive
Prob
abili
tyof
com
plet
ion
100%
Green region
5 - 10%
Yellow region Red region
Growing red zone signals instabilityEscalate immediate action
30© 2013 TOCICO. All rights reserved.
Buffer Management – Function 4(Target)
Rope/buffer length
Cum
ulat
ive
Prob
abili
tyof
com
plet
ion
100%
Green region
5 - 10%
Yellow region Red region
Target causes of red zonepenetration

31© 2013 TOCICO. All rights reserved.
SDBRCCR PLANNED LOAD

32© 2013 TOCICO. All rights reserved.
22 May 2013
101010 10 10
1 Rope and Buffer
RM DRUM
Simplified Drum-Buffer-Rope (SDBR)
Customerorders
Shipping rope (time)
TimeShipping Buffer
CCR
10 t
In SDBR the CCR load needs to becarefully planned (Planned Load)

33© 2013 TOCICO. All rights reserved.
The planned load on the CCR is used to determinerelease and safe promise dates
Time (days)
DailyLoad
We cansafely
deliver here
ReleaseReleasepointpoint
50% of buffer
full buffer
50% of buffer

34© 2013 TOCICO. All rights reserved.
Shipping buffer when the safe date is earlier than the standard lead time
Time (days)
DailyLoad
StandardStandardlead timelead time
Safedelivery
WeWepromisepromisestandardstandardlead timelead timerelease
point
Addition toAddition tothe bufferthe bufferfull buffer
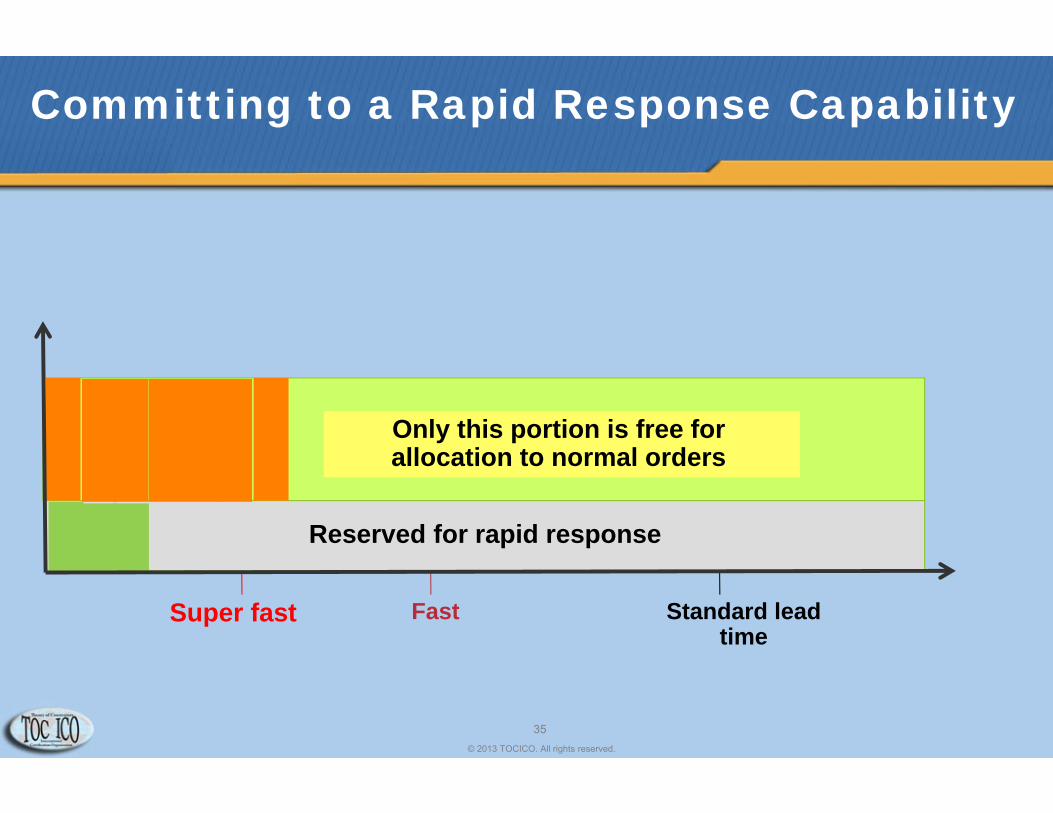
35© 2013 TOCICO. All rights reserved.
Committing to a Rapid Response Capability
Super fast Fast Standard lead time
Reserved for rapid response
Only this portion is free for allocation to normal orders

36© 2013 TOCICO. All rights reserved.
APPLYING THE 5 STEPS

37© 2013 TOCICO. All rights reserved.
Choking WIP release(Goldratt, 2008; p19: modified)
Man
agem
ent
atte
nti
on
Insufficient reactiontime
Jams,missedpriorities
Buffer(Work in progress)
Reduced variation - Ford and OhnoAggregate variation - Goldratt

38© 2013 TOCICO. All rights reserved.
22 May 201338
timeDDBuffer
Departmental performance protected by separate queues
DDMaterial Release
time
Buffer Aggregation & Buffer Management
Material Release
Drum-Buffer-RopeBuffer is aggregated: No intermediate due dates(Assumes touch time is insignificant <10%)
Rope = MLT Drum
Manufacturing lead time (MLT)
Buffer:Touch time:

39© 2013 TOCICO. All rights reserved.
– 1 IDENTIFY the system’s constraint(s)–Resource / Market demand
–2 Decide how to EXPLOIT the system’s constraint(s)–Maximise CCR throughput / Delivery speed
–3 SUBORDINATE everything else to the above decision.
–Choke material release–Buffer aggregation–Buffer management–Cut batches where possible –Planned load
Operations Management (DBR; SDBR)

40© 2013 TOCICO. All rights reserved.
VATI ANALYSIS

41© 2013 TOCICO. All rights reserved.
The characteristics of structure ‘A’
• Description: Many raw materials are processed and assembled into relatively fewer end products
• Synchronization and availability of materials are the obvious problems
• This environment is where MRP was developed
• Typical industries: electronics, furniture
M1
M7
M2
M3
M1
M4
M1
M2
M10
M6
M5
M1
M3
M7
M9
Product A
RM-1 RM2 RM-3 RM-4
M6
M7
M5
M3
M2
M1
RM-4 RM-2
M2
M9
Product B
RM-5
M1
M5
M3
M4

42© 2013 TOCICO. All rights reserved.
The characteristics of structure ‘V’
RM
M1
M3 M2
M4 M4 M5 M5 M6 M4 M7 M7 M7 M8
M9M9M10M10M9
Product A1
Product A2
Product Z1
Product Z2
Product Z3
M10M10 M10
Product E1
Product E2
Product E3

43© 2013 TOCICO. All rights reserved.
The characteristics of structure ‘T’
M1
M7
M1
M4
M1
RM2 RM-3 RM-4
M2
M1
RM-4 RM-2
M2
RM-5
M1
M5
M6 M3 M3 M2 M5 M6
ASS ASS ASS ASS ASS
ASS1 ASS1 ASS1 ASS1 ASS1 ASS1 ASS1 ASS1 ASS! ASS1
Product A
Product B
Product C
Product D
Product E
Product F
Product G
Product H
Product I
Product J
44© 2013 TOCICO. All rights reserved.
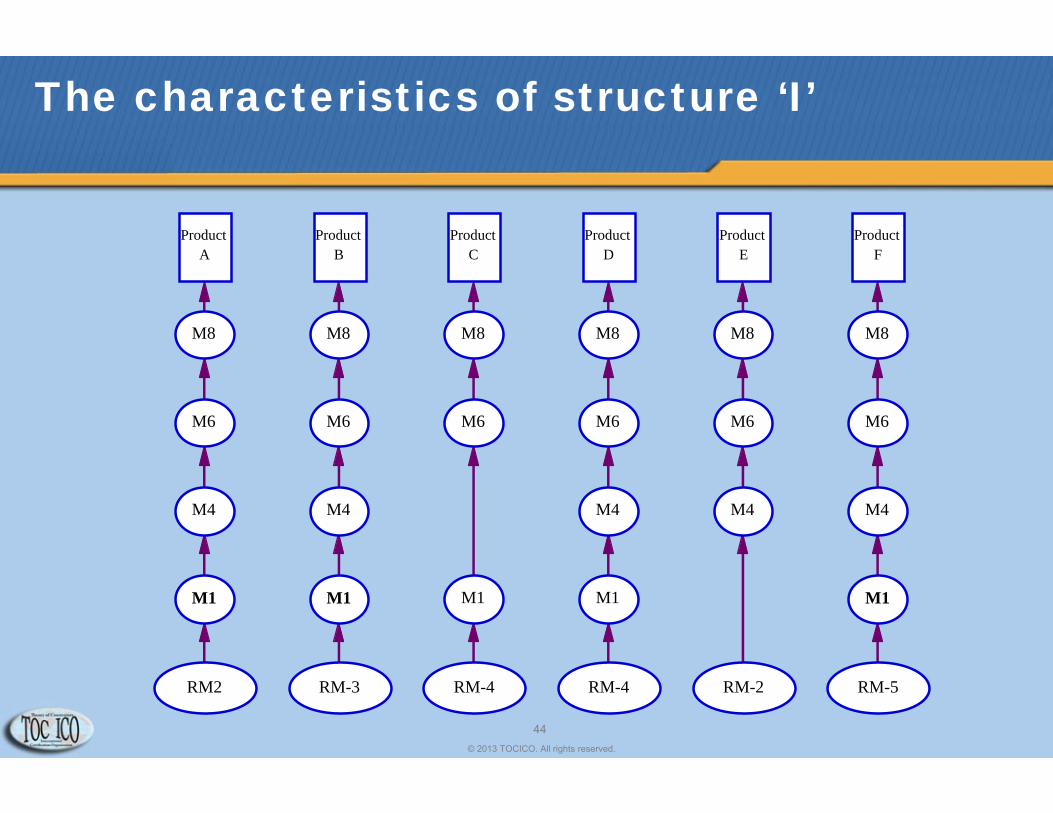
The characteristics of structure ‘I’
M1
M4
M1
M4
M1
RM2 RM-3 RM-4
M4
M1
RM-4 RM-2
M4
RM-5
M1
M4
M6 M6 M6 M6 M6 M6
M8 M8 M8 M8 M8 M8
Product A
Product B
Product C
Product D
Product E
Product F

45© 2013 TOCICO. All rights reserved.
Presentation Structure
Systems thinking− Understanding Dependent Flow− Lean (Kanban)
Buffer Rope (DBR)− Simplified Drum Buffer Rope (S-DBR)− Planned load− Buffer management− VATI
Distribution− Make To Availability (MTA)− Dynamic Buffer Management
Conclusion

46© 2013 TOCICO. All rights reserved.
DISTRIBUTION

47© 2013 TOCICO. All rights reserved.
The Cloud of Distribution(Goldratt, 1999: Satellite Program viewer notes)
BReduce costs.
CProtect
throughput
DHold less inventory
D’Hold more inventory
AManage well.
Because…Replenishment time is too long.
Vendors are unreliable.Forecasts are inaccurate

48© 2013 TOCICO. All rights reserved.
CONSTRAINT?
• Constraint – The factor that ultimately limits the performance of a system or organization. The factor that, if the organization were able to increase it, more fully exploit it, or more effectively subordinate to it, would result in achieving more of the goal. (TOCICO Dictionary, 2012).

49© 2013 TOCICO. All rights reserved.
–1 IDENTIFY the system’s constraint(s)–Footfall (customer who come to buy)–The more customers the more Throughput
–2 Decide how to EXPLOIT the system’s constraint(s)–Having the right inventory in the right place at the
right time –3 SUBORDINATE everything else to the above
decision.–This is where the challenge lies
Distribution (MTA)
50© 2013 TOCICO. All rights reserved.
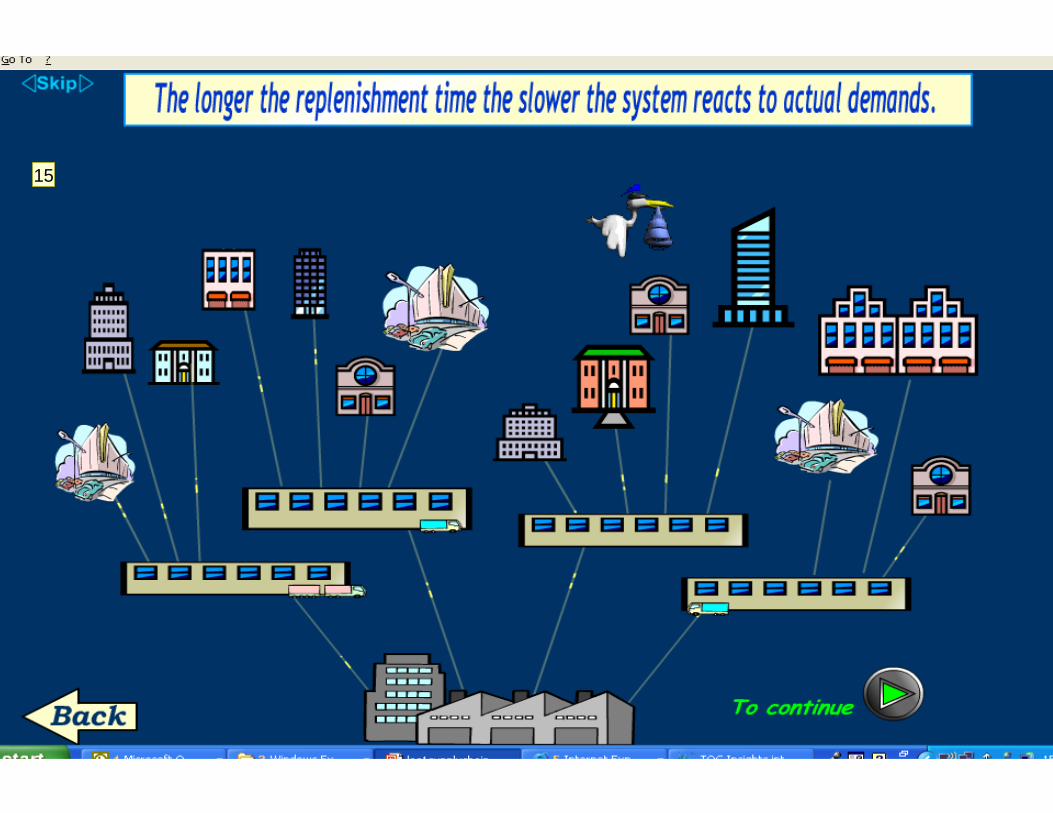
22 May 2013 50
15

Slide 50
15 It is possible to 'film' sections of the Insights using software like Screenium (Mac).
However, those slieds with lots of words do not work in German!Rudi Burkhard, 4/15/2013

51© 2013 TOCICO. All rights reserved.
Replenishment Time
Orderinglead time
Productionlead time
Transportlead time
Supply time
Elements of Replenishment time

52© 2013 TOCICO. All rights reserved.
22 May 2013 52

53© 2013 TOCICO. All rights reserved.
22 May 2013 53

54© 2013 TOCICO. All rights reserved.
Client or Store
Production
Central Warehouse
Regional Warehouse
~2-4 weeks ~2-4 days ~1 day
Flow in the Supply Chain (Pull)
~3-6 weeksinventory
3 daysinventory
~7 daysinventory
Lead Times
NODemand Surprises

55© 2013 TOCICO. All rights reserved.
Each distribution point should order inventory to the following target:
Average consumption within the average replenishment time, factored for uncertainty in demand and supply
As a result the distribution system has inventory equal to this target minus ongoing consumption.
Sizing the Target Inventory Level

56© 2013 TOCICO. All rights reserved.
–1 IDENTIFY the system’s constraint(s)–Footfall (customer who come to buy)–The more customers the more Throughput
–2 Decide how to EXPLOIT the system’s constraint(s)–Having the right inventory in the right place at the
right time –3 SUBORDINATE everything else to the above decision.
–Aggregate stock buffer (plant warehouse)–Set stock target level based on replenishment time–Make to Availability
Distribution (MTA)

57© 2013 TOCICO. All rights reserved.
MAKE TO AVAILABILITY

58© 2013 TOCICO. All rights reserved.
Make To Availability (MTA)
1. For each item a stock target level is defined.− This concept actually fixes the stock in the system.
2. Replenish the stocks very fast.− The shorter the production time is the lower should be the
inventories and safer is the availability.− Every day, decisions regarding release to the floor are taken based
on the updated information regarding the stock levels.
3. Priorities are dictated by available stock relative to the target level at the node.

59© 2013 TOCICO. All rights reserved.
Penetration into buffer
Buffer Status: Percentage of penetration into the buffer.Or(target – on-hand)*100
targetThe target levelEmergency
Level
On-handstock
Stock in the
pipeline
The Structure of the Stock Buffer
RedZone
YellowZone
GreenZone

60© 2013 TOCICO. All rights reserved.
MTA - Prioritizing Orders on the Way

61© 2013 TOCICO. All rights reserved.
MTA – Prioritizing Orders on the Way
Three separate orders are in progress
Current on-hand stock
0
Penetration into the buffer
Target level
Order 1Order 2Order 3

62© 2013 TOCICO. All rights reserved.
22 May 2013 62

63© 2013 TOCICO. All rights reserved.
22 May 2013 63

64© 2013 TOCICO. All rights reserved.
DYNAMIC BUFFER MANAGEMENT
The buffer status signals whether the target level is too large or too small and this can be used to signal automatic adjustments.

65© 2013 TOCICO. All rights reserved.
22 May 2013 65

66© 2013 TOCICO. All rights reserved.
22 May 2013 66

67© 2013 TOCICO. All rights reserved.
22 May 2013 67

68© 2013 TOCICO. All rights reserved.
22 May 2013 68

69© 2013 TOCICO. All rights reserved.
Distribution (MTA)
–1 IDENIFY the system’s constraint(s)–Footfall (customer entering shop)
–2 Decide how to EXPLOIT the systems constraint(s)–Ensure products are available
–3 SUBORDINATE everything to the above decision.–Aggregate stock buffer (plant warehouse)–Set stock target level based on replenishment
time–MTA
–Signal consumption daily and replenishment periodically
–Adopt buffer management

70© 2013 TOCICO. All rights reserved.
70
Buffer Management applied to MTA and Distribution
1. Prioritise the flow of work− % Buffer penetration (consistent with DBR BM)
2. Identify when to expedite potential delays.− If the stock buffer availability shows red then chased next order in
the system
3. Signals when there is a need to escalate intervention− If the on-hand is repeatedly in the red increase the target level− If the on-hand is repeatedly in the green reduce the target
4. Identify and target main sources of delay for improvement− Pareto analyse causes of red zone penetration due to supply

71© 2013 TOCICO. All rights reserved.
Presentation Structure
Systems thinking− Understanding Dependent Flow
− Lean (Kanban)Buffer Rope (DBR)
− Simplified Drum Buffer Rope (S-DBR)− Buffer management− Planned load− VATI
Distribution− Make To Availability (MTA)− Dynamic Buffer Management
Conclusion

72© 2013 TOCICO. All rights reserved.
Conclusion
• Consistent with systems thinking and operations laws• Change of rules enables immediate improvement
− Choke material release (pull)− Buffer aggregation− Buffer management
• Buffer management− Applicable to complex environments − Shop floor control consistent across MTO (DBR) and MTS (MTA)− Targeted reduction of wasteful variation

73© 2013 TOCICO. All rights reserved.
Roy Stratton
Roy is a Reader in Operations and Supply ChainManagement and actively involved in TOC related teaching,research and consultancy. He is Director of the Centre forPerformance Management and Lean Leadership and Directorof studies of a number of TOC based doctoral students. Hisis also the Programme Manager of a portfolio of part timeTOC based MSc courses delivered in collaboration with QFIConsulting. Previously, Roy worked for Rolls Royce AeroEngines in an internal consultancy role and has since beenactively involved in a wide range of industry-based researchprojects. He has published widely in both professional andacademic journals and has co-authored two educationalbooks.Roy is a Chartered Engineer (F.I.Mech.E.) and has beenawarded a BSc in Mechanical Engineering (Nottingham), anMSc in Manufacturing System Engineering (Warwick), and aPhD in Supply Chain Management (Nottingham Trent). He iscertified in all TOC ICO fields.
Place for your photo
Nottingham Business School,Nottingham Trent [email protected]

74© 2013 TOCICO. All rights reserved.
Rudolf Burkhard:
Rudolf brings more than 40 years of varied business experience to his work. He held positions in finance, technical service, sales, marketing, supply chain, project and business management and, most recently, management consulting at Du Pont’s European headquarters in Geneva. Except for a short period running a small company his experience comes from working in several of Du Pont’s business units within the Textile Fibres and Electronics Departments. In 2001 he left Du Pont to focus on Theory of Constraints consulting. He is the author of the article “You Can’t Spot Serious Shareholder Value? Check your Paradigms.” that won the 1999 PricewaterhouseCoopers prize for the best article on ‘Can you Spot Serious Shareholder Value?’
Rudolf has been consulting with TOC since 2001. In 2008 he and 4 partners started VISTEM GmbH und Co KG and the TOC Institute in Germany. He moderates the TOC4U discussion group on Linkedin and occasionally writes for his blog TOC4U-Focus.


![Stewart, Amy (DBR) · From: Bannister, Jorge (DBR) To: Stewart, Amy (DBR) Cc: Taylor, Tina (DBR); Desilets, LeeAnn (DBR) Subject: FW: [EXTERNAL] : Food Trucks Date: Friday, February](https://img.pdfslide.us/doc/110x75/5fb3a34c68602c67914aec27/stewart-amy-dbr-from-bannister-jorge-dbr-to-stewart-amy-dbr-cc-taylor.jpg)