Embed Size (px)
Citation preview
FISH
ERIE
S A
ND
AQ
UA
CULT
UR
E
The fi sheries and aquaculture sector in France
> K
ey fi
gure
s
> EDITION april 2013
Les cahiers de
ProductionFirmsTradeConsumption
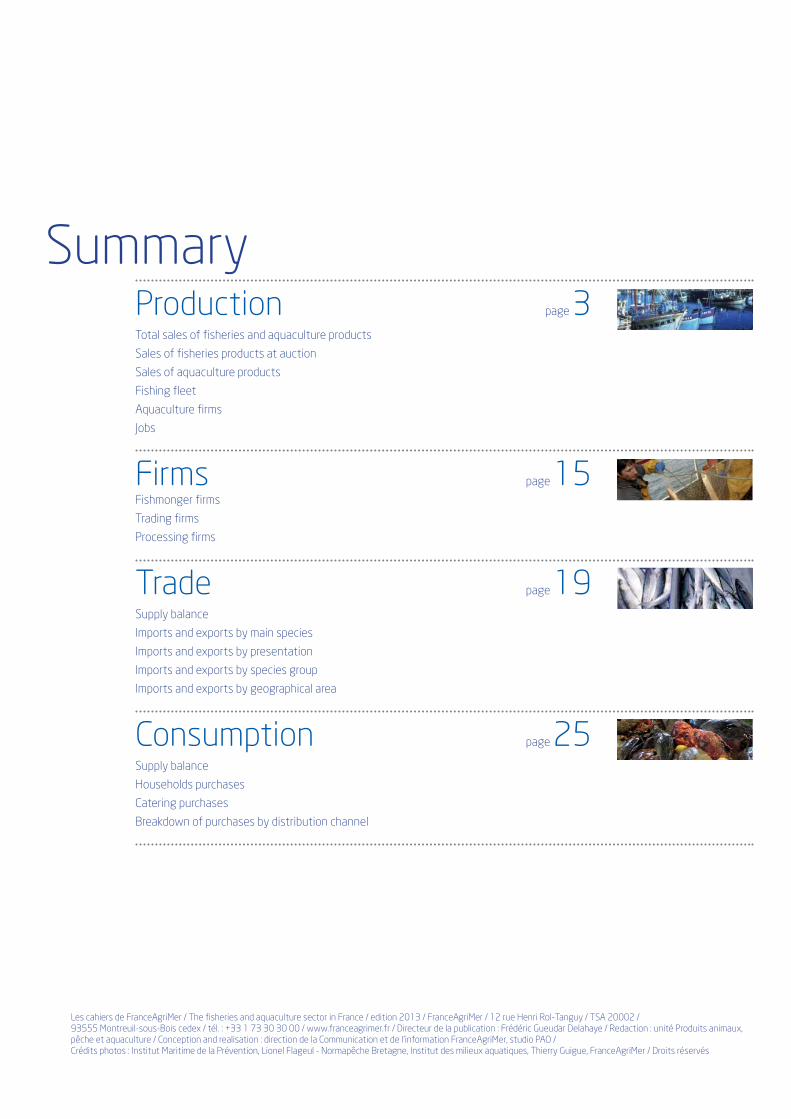
SummaryProduction page 3Total sales of fi sheries and aquaculture products
Sales of fi sheries products at auction
Sales of aquaculture products
Fishing fl eet
Aquaculture fi rms
Jobs
Firms page 15Fishmonger fi rms
Trading fi rms
Processing fi rms
Trade page 19Supply balance
Imports and exports by main species
Imports and exports by presentation
Imports and exports by species group
Imports and exports by geographical area
Consumption page 25Supply balance
Households purchases
Catering purchases
Breakdown of purchases by distribution channel
Les cahiers de FranceAgriMer / The fi sheries and aquaculture sector in France / edition 2013 / FranceAgriMer / 12 rue Henri Rol-Tanguy / TSA 20002 /
93555 Montreuil-sous-Bois cedex / tél. : +33 1 73 30 30 00 / www.franceagrimer.fr / Directeur de la publication : Frédéric Gueudar Delahaye / Redaction : unité Produits animaux,
pêche et aquaculture / Conception and realisation : direction de la Communication et de l’information FranceAgriMer, studio PAO /
Crédits photos : Institut Maritime de la Prévention, Lionel Flageul - Normapêche Bretagne, Institut des milieux aquatiques, Thierry Guigue, FranceAgriMer / Droits réservés

Production
Les cahiers de FranceAgriMer 2013 / Key fi gures / FISHERIES AND AQUACULTURE. /3
fi shing fl eet /u
total sales of fi sheries and aquaculture productsfi
>
4/ Fisheries and aquaculture sector in France > EDITION april 2013. © FranceAgriMer 2013 /
Production / landings and aquaculture
by method of production (tons) (3)
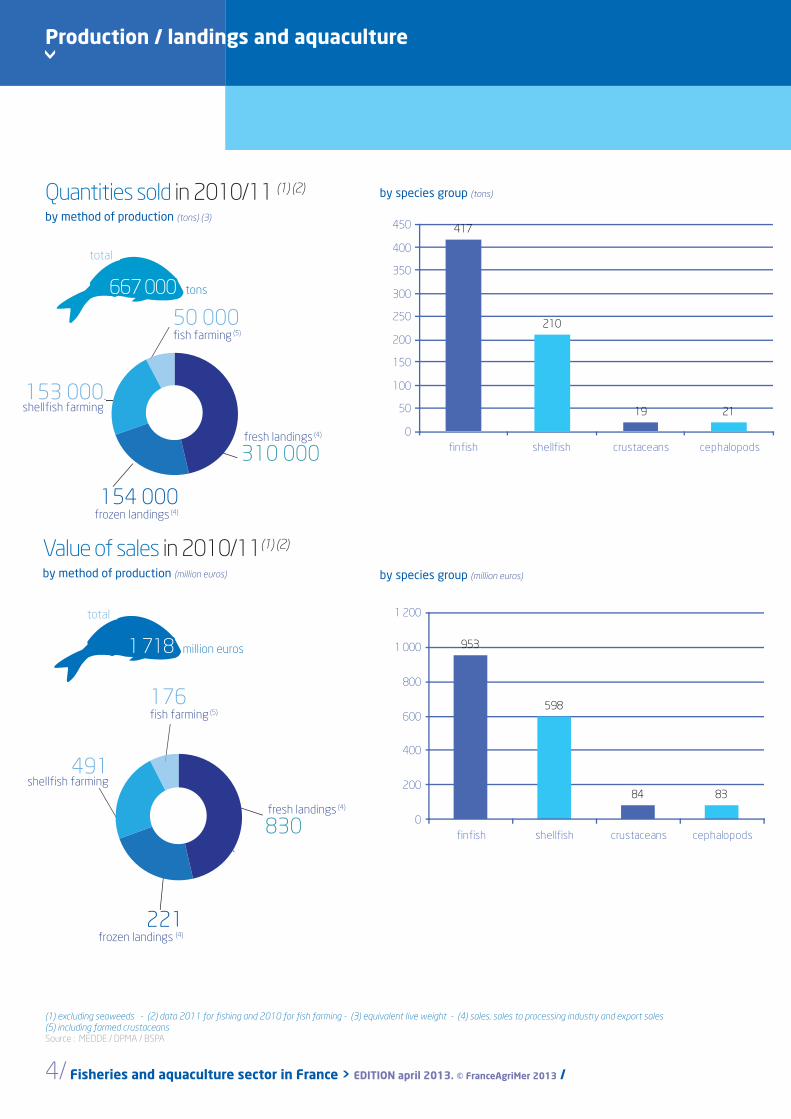
Quantities sold in 2010/11 (1) (2)
Value of sales in 2010/11(1) (2)
by method of production (million euros)
total
1 718 million euros
total
667 000 tons
50 000fi sh farming (5)
153 000 shellfi sh farming
fresh landings (4)
310 000
154 000frozen landings (4)
176fi sh farming (5)
fresh landings (4)
830
491 shellfi sh farming
221frozen landings (4)
(1) excluding seaweeds - (2) data 2011 for fi shing and 2010 for fi sh farming - (3) equivalent live weight - (4) sales, sales to processing industry and export sales(5) including farmed crustaceans Source : MEDDE / DPMA / BSPA
417
210
19 21
0
50
100
150
200
250
300
350
400
450
finfish shellfish crustaceans cephalopods
953
598
84 83
0
200
400
600
800
1 000
1 200
finfish shellfish crustaceans cephalopods
by species group (tons)
by species group (million euros)
Les cahiers de FranceAgriMer 2013 / Key fi gures / FISHERIES AND AQUACULTURE. /5
Total sales / metropolitan FranceTotal sales / metropolitan Franceand overseas territories
es / metropolitan Francees / metropolitan France
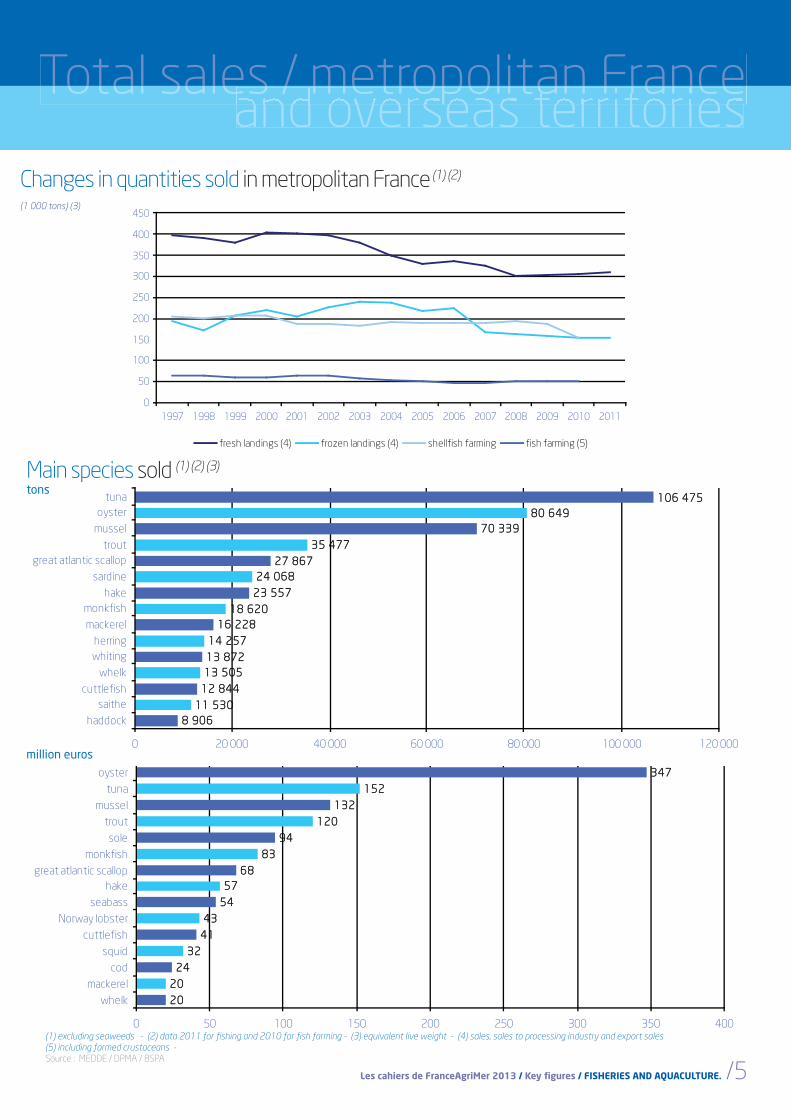
Main species sold (1) (2) (3)
tons
(1) excluding seaweeds - (2) data 2011 for fi shing and 2010 for fi sh farming - (3) equivalent live weight - (4) sales, sales to processing industry and export sales(5) including farmed crustaceans - Source : MEDDE / DPMA / BSPA
Changes in quantities sold in metropolitan France (1) (2)
(1 000 tons) (3)
million euros
8 9068 906
11 53011 530
12 84412 844
13 50513 505
13 87213 872
14 25714 257
16 22816 228
18 62018 620
23 55723 557
24 06824 068
27 86727 867
35 47735 477
70 33970 339
80 64980 649
106 475106 475
0 20 000 40 000 60 000 80 000 100 000 120 000
haddock
saithe
cuttlefish
whelk
whiting
herring
mackerel
monkfish
hake
sardine
great atlantic scallop
trout
mussel
oyster
tuna
2020
2020
2424
3232
4141
4343
5454
5757
6868
8383
9494
120120
132132
152152
347347
0 50 100 150 200 250 300 350 400
whelk
mackerel
cod
squid
cuttlefish
Norway lobster
seabass
hake
great atlantic scallop
monkfish
sole
trout
mussel
tuna
oyster
0
50
100
150
200
250
300
350
400
450
1997 1998 1999 2000 2001 2002 2003 2004 2005 2006 2007 2008 2009 2010 2011
fresh landings (4) frozen landings (4) shellfish farming fish farming (5)
>
6/ Fisheries and aquaculture sector in France > EDITION april 2013. © FranceAgriMer 2013 /
Production / landings
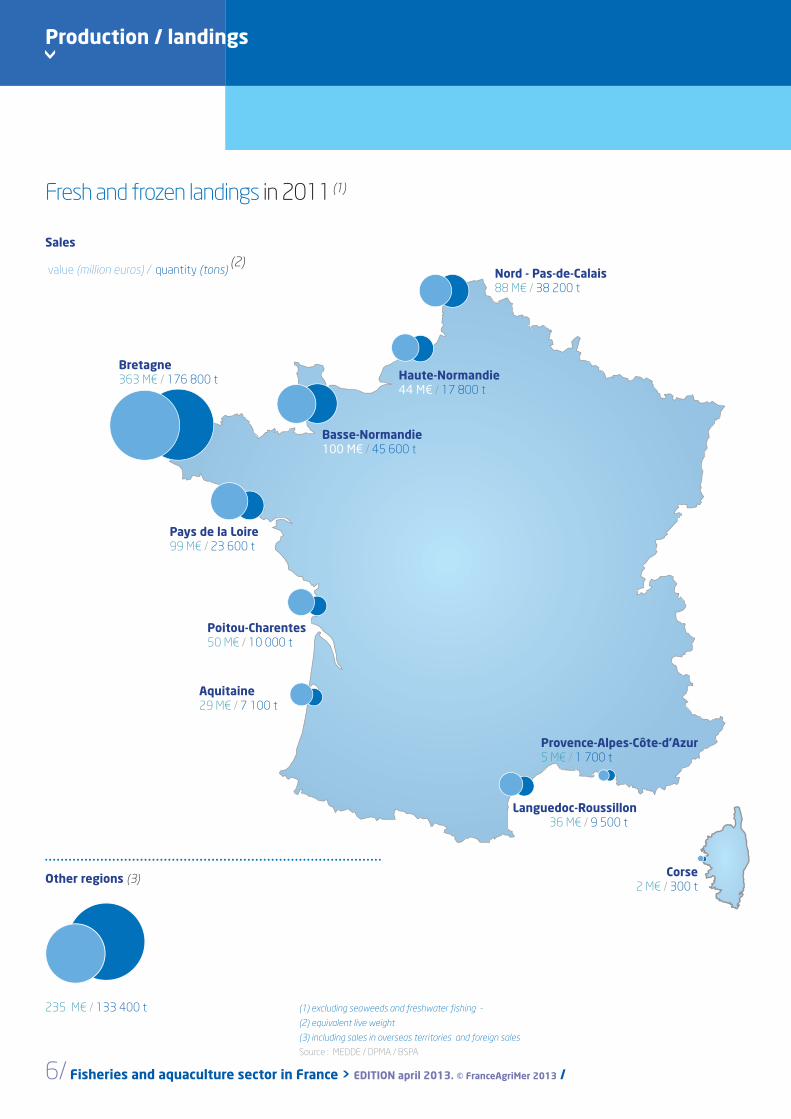
Fresh and frozen landings in 2011 (1)
Sales
value (million euros) / quantity (tons) (2)
Other regions (3)
235 M¤ / 133 400 t
Nord - Pas-de-Calais88 M€ / 38 200 t
Haute-Normandie 44 M€ / 17 800 t
Basse-Normandie100 M€ / 45 600 t
Bretagne363 M€ / 176 800 t
Pays de la Loire99 M€ / 23 600 t
Poitou-Charentes50 M€ / 10 000 t
Aquitaine29 M€ / 7 100 t
Languedoc-Roussillon 33 M€ 36 M€ / 9 500 t
Provence-Alpes-Côte-d’Azur5 M€ / 1 700 t
Corse2 M€ / 300 t
(1) excluding seaweeds and freshwater fi shing -
(2) equivalent live weight
(3) including sales in overseas territories and foreign sales
Source : MEDDE / DPMA / BSPA
Les cahiers de FranceAgriMer 2013 / Key fi gures / FISHERIES AND AQUACULTURE. /7
Sales of fi shery products Sales of fishery products
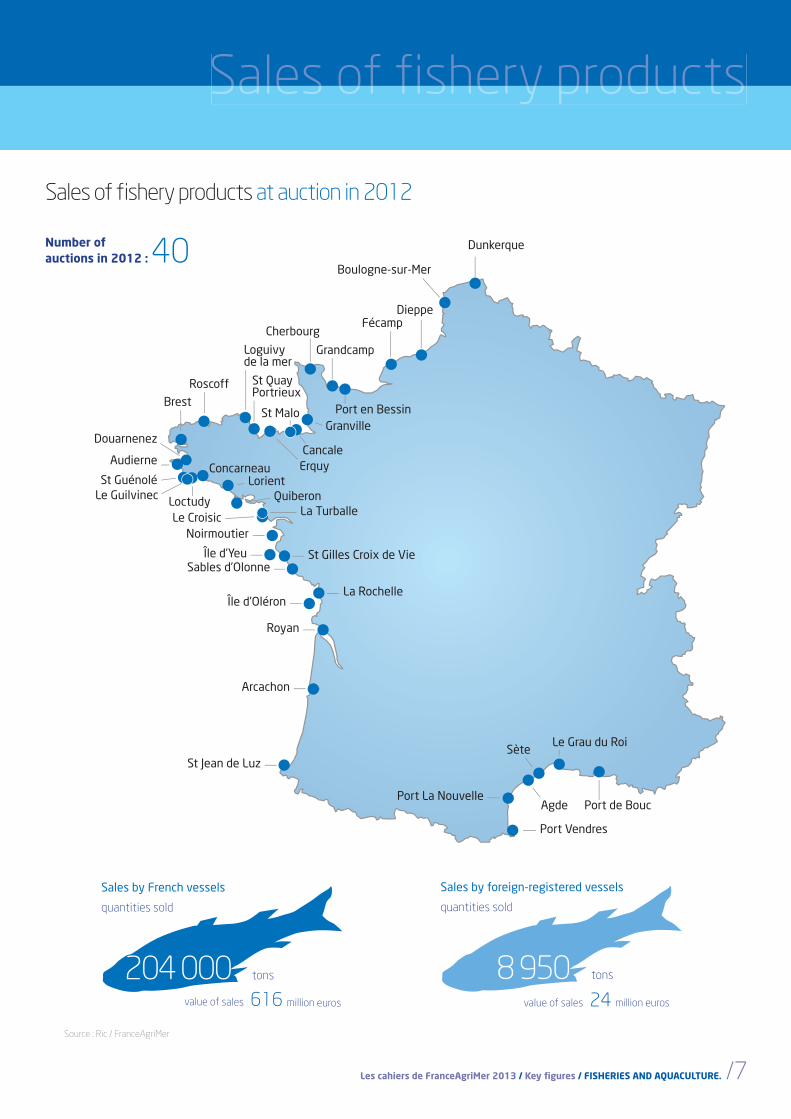
Sales of fi shery products at auction in 2012
Source : Ric / FranceAgriMer
Number of auctions in 2012 : 40
Douarnenez
Audierne
St GuénoléLe Guilvinec
Dunkerque
Boulogne-sur-Mer
DieppeFécamp
Grandcamp
St QuayPortrieux
Loguivyde la mer
Roscoff
BrestPort en Bessin
ErquyConcarneau
Granville
Cancale
Cherbourg
St Malo
Île d’Yeu
La Rochelle
St Gilles Croix de Vie
La Turballe
Port Vendres
Port de BoucAgde
SèteLe Grau du Roi
LorientQuiberon
Sables d’Olonne
Île d’Oléron
Royan
Arcachon
St Jean de Luz
Port La Nouvelle
NoirmoutierLe Croisic
Loctudy
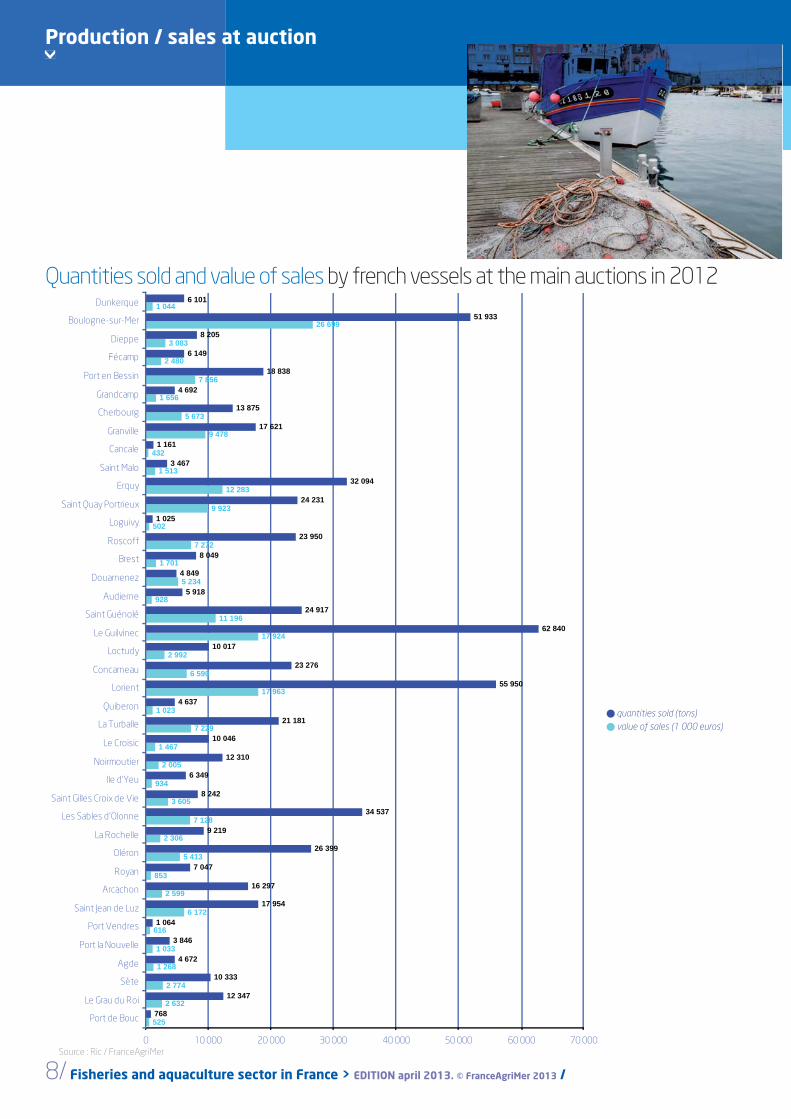
value of sales 616 million euros
Sales by French vessels
quantities sold
204 000 tons
value of sales 24 million euros
Sales by foreign-registered vessels
quantities sold
8 950 tons
>
8/ Fisheries and aquaculture sector in France > EDITION april 2013. © FranceAgriMer 2013 /
Source : Ric / FranceAgriMer
Quantities sold and value of sales by french vessels at the main auctions in 2012
quantities sold (tons) value of sales (1 000 euros)
>> Production / sales at auction
525
2 632
2 774
1 268
1 033
616
6 172
2 599
853
5 413
2 306
7 128
3 605
934
2 005
1 467
7 229
1 023
17 963
6 590
2 992
17 924
11 196
928
5 234
1 701
7 272
502
9 923
12 283
1 513
432
9 478
5 673
1 656
7 856
2 480
3 083
26 699
1 044
768
12 347
10 333
4 672
3 846
1 064
17 954
16 297
7 047
26 399
9 219
34 537
8 242
6 349
12 310
10 046
21 181
4 637
55 950
23 276
10 017
62 840
24 917
5 918
4 849
8 049
23 950
1 025
24 231
32 094
3 467
1 161
17 621
13 875
4 692
18 838
6 149
8 205
51 933
6 101
0 10 000 20 000 30 000 40 000 50 000 60 000 70 000
Port de Bouc
Le Grau du Roi
Sète
Agde
Port la Nouvelle
Port Vendres
Saint Jean de Luz
Arcachon
Royan
Oléron
La Rochelle
Les Sables d'Olonne
Saint Gilles Croix de Vie
Ile d'Yeu
Noirmoutier
Le Croisic
La Turballe
Quiberon
Lorient
Concarneau
Loctudy
Le Guilvinec
Saint Guénolé
Audierne
Douarnenez
Brest
Roscoff
Loguivy
Saint Quay Portrieux
Erquy
Saint Malo
Cancale
Granville
Cherbourg
Grandcamp
Port en Bessin
Fécamp
Dieppe
Boulogne-sur-Mer
Dunkerque
Les cahiers de FranceAgriMer 2013 / Key fi gures / FISHERIES AND AQUACULTURE. /9
Sales of fi shery products Sales of fishery products
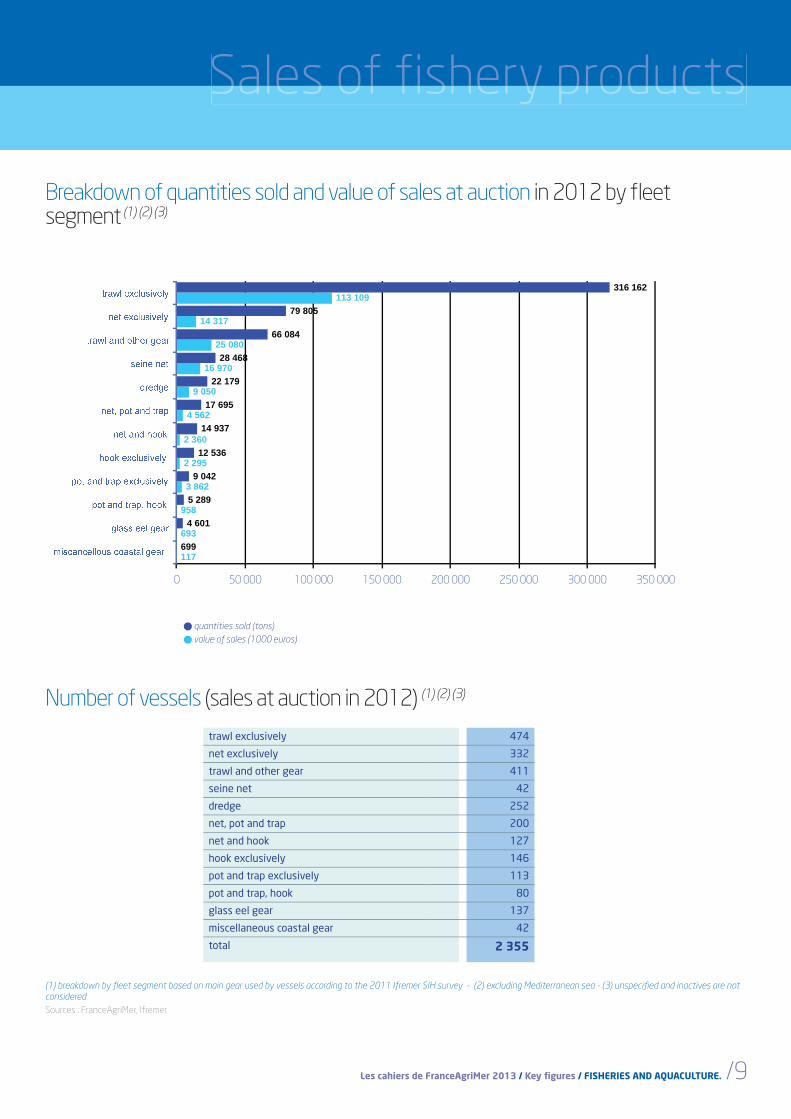
quantities sold (tons) value of sales (1000 euros)
Breakdown of quantities sold and value of sales at auction in 2012 by fl eet segment (1) (2) (3)
(1) breakdown by fl eet segment based on main gear used by vessels according to the 2011 Ifremer SIH survey - (2) excluding Mediterranean sea - (3) unspecifi ed and inactives are not considered
Number of vessels (sales at auction in 2012) (1) (2) (3)
trawl exclusively 474
net exclusively 332
trawl and other gear 411
seine net 42
dredge 252
net, pot and trap 200
net and hook 127
hook exclusively 146
pot and trap exclusively 113
pot and trap, hook 80
glass eel gear 137
miscellaneous coastal gear 42
total 2 355
117
693
958
3 862
2 295
2 360
4 562
9 050
16 970
25 080
14 317
113 109
699
4 601
5 289
9 042
12 536
14 937
17 695
22 179
28 468
66 084
79 805
316 162
0 50 000 100 000 150 000 200 000 250 000 300 000 350 000
������������������� ���
��������� ���
���������������
����������������������
�������������
����������
����������������
���� �
���������
��������������� ���
��������������
����������������
Sources : FranceAgriMer, Ifremer
>
10/ Fisheries and aquaculture sector in France > EDITION april 2013. © FranceAgriMer 2013 /
Production / sales at auction
SSales of fi shery productsSSales of fishery products
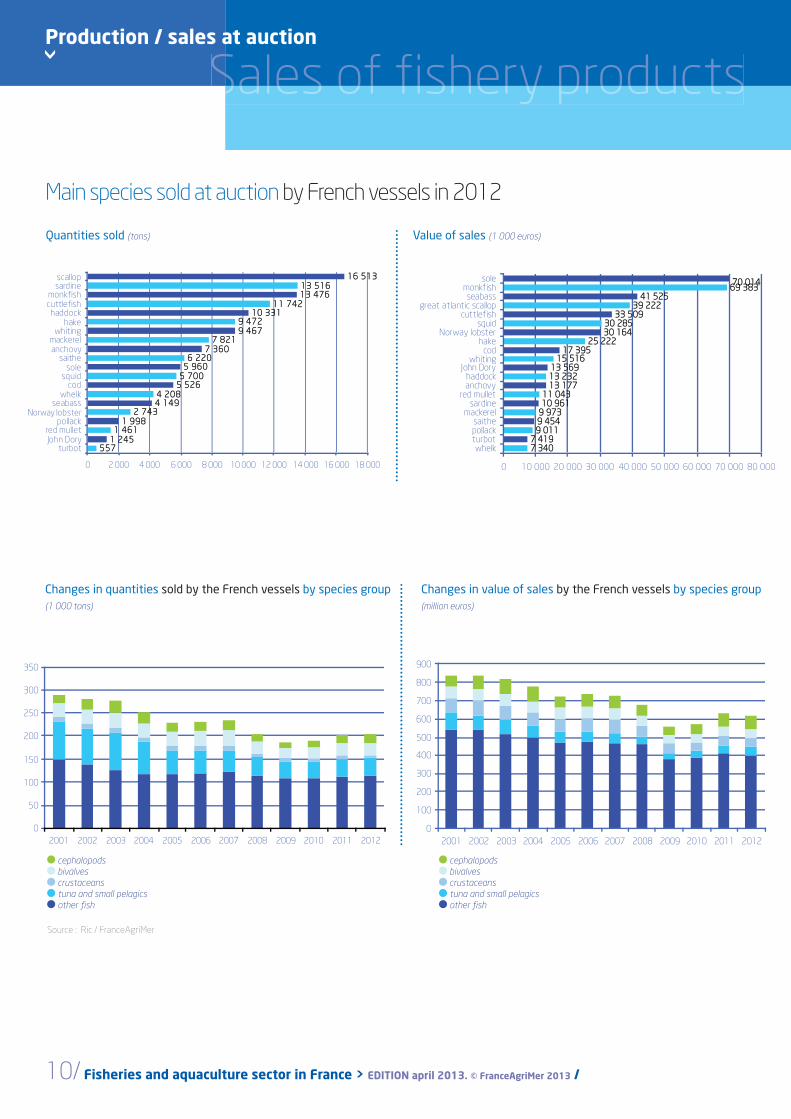
Main species sold at auction by French vessels in 2012
Changes in quantities sold by the French vessels by species group (1 000 tons)
Changes in value of sales by the French vessels by species group(million euros)
Value of sales (1 000 euros)
cephalopods bivalves crustaceans tuna and small pelagics other fi sh
Quantities sold (tons)
Source : Ric / FranceAgriMer
7 3407 3407 4197 419
9 0119 0119 4549 4549 9739 97310 96110 96111 04311 043
13 17713 17713 23213 23213 56913 569
15 51615 51617 39517 395
25 22225 22230 16430 16430 28530 285
33 50933 50939 22239 222
41 52541 52569 38369 38370 01470 014
0 10 000 20 000 30 000 40 000 50 000 60 000 70 000 80 000
whelkturbotpollacksaithe
mackerelsardine
red mulletanchovyhaddock
John Dorywhiting
codhake
Norway lobstersquid
cuttlefishgreat atlantic scallop
seabassmonkfish
sole
0
100
200
300
400
500
600
700
800
900
2001 2002 2003 2004 2005 2006 2007 2008 2009 2010 2011 2012
cephalopods bivalves crustaceans tuna and small pelagics other fi sh
5575571 2451 245
1 4611 4611 9981 998
2 7432 7434 1494 1494 2084 208
5 5265 5265 7005 700
5 9605 9606 2206 220
7 3607 3607 8217 821
9 4679 4679 4729 472
10 33110 33111 74211 742
13 47613 47613 51613 516
16 51316 513
0 2 000 4 000 6 000 8 000 10 000 12 000 14 000 16 000 18 000
turbotJohn Doryred mullet
pollackNorway lobster
seabasswhelk
codsquid
solesaithe
anchovymackerel
whitinghake
haddockcuttlefishmonkfish
sardine scallop
0
50
100
150
200
250
300
350
2001 2002 2003 2004 2005 2006 2007 2008 2009 2010 2011 2012
Les cahiers de FranceAgriMer 2013 / Key fi gures / FISHERIES AND AQUACULTURE. /11
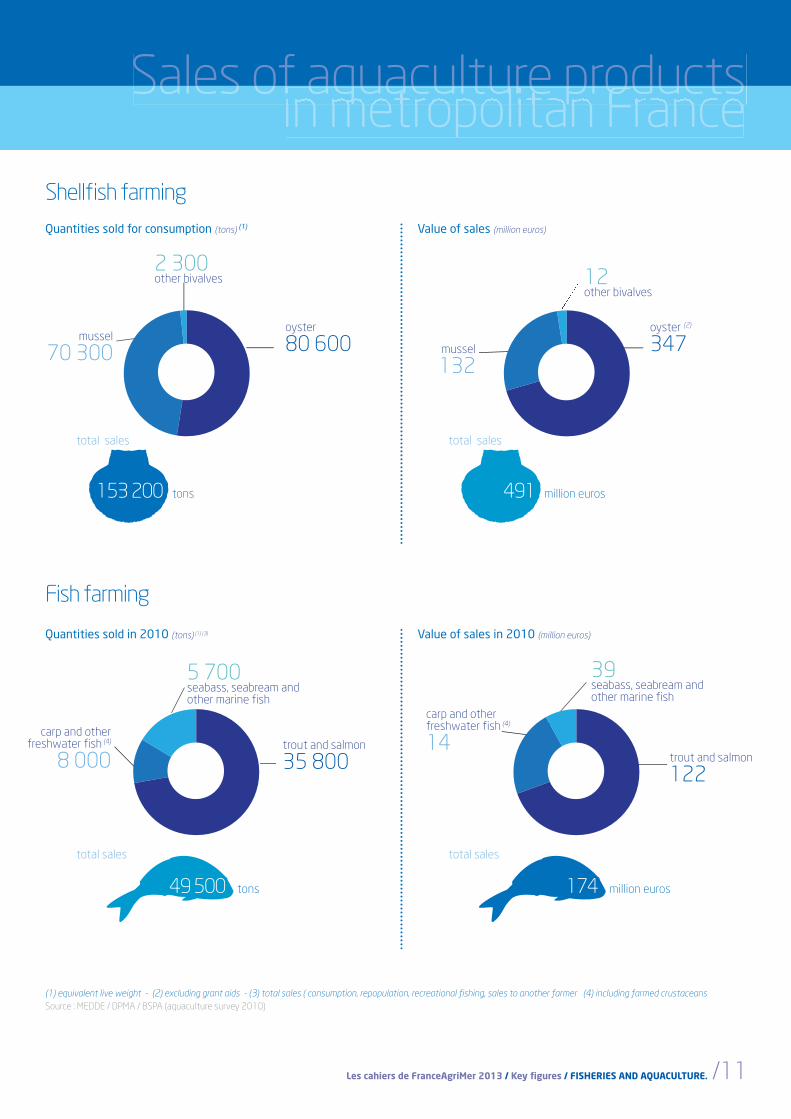
Sales of aquaculture products Sales of aquaculture productsin metropolitan Francef aquaculture productsf aquaculture products
Shellfi sh farming
Fish farming
Quantities sold for consumption (tons) (1) Value of sales (million euros)
total sales
491 million euros
total sales
153 200 tons
Quantities sold in 2010 (tons) (1) (3) Value of sales in 2010 (million euros)
(1) equivalent live weight - (2) excluding grant aids - (3) total sales ( consumption, repopulation, recreational fi shing, sales to another farmer (4) including farmed crustaceans
total sales
174 million euros
total sales
49 500 tons
2 300other bivalves
oyster
80 600mussel
70 300
12other bivalves
oyster (2)
347mussel
132
5 700seabass, seabream and other marine fi sh
trout and salmon
35 800
carp and other freshwater fi sh (4)
8 000
39seabass, seabream and other marine fi sh
trout and salmon
122
carp and other freshwater fi sh (4)
14
Source : MEDDE / DPMA / BSPA (aquaculture survey 2010)
>
12/ Fisheries and aquaculture sector in France > EDITION april 2013. © FranceAgriMer 2013 /
Production
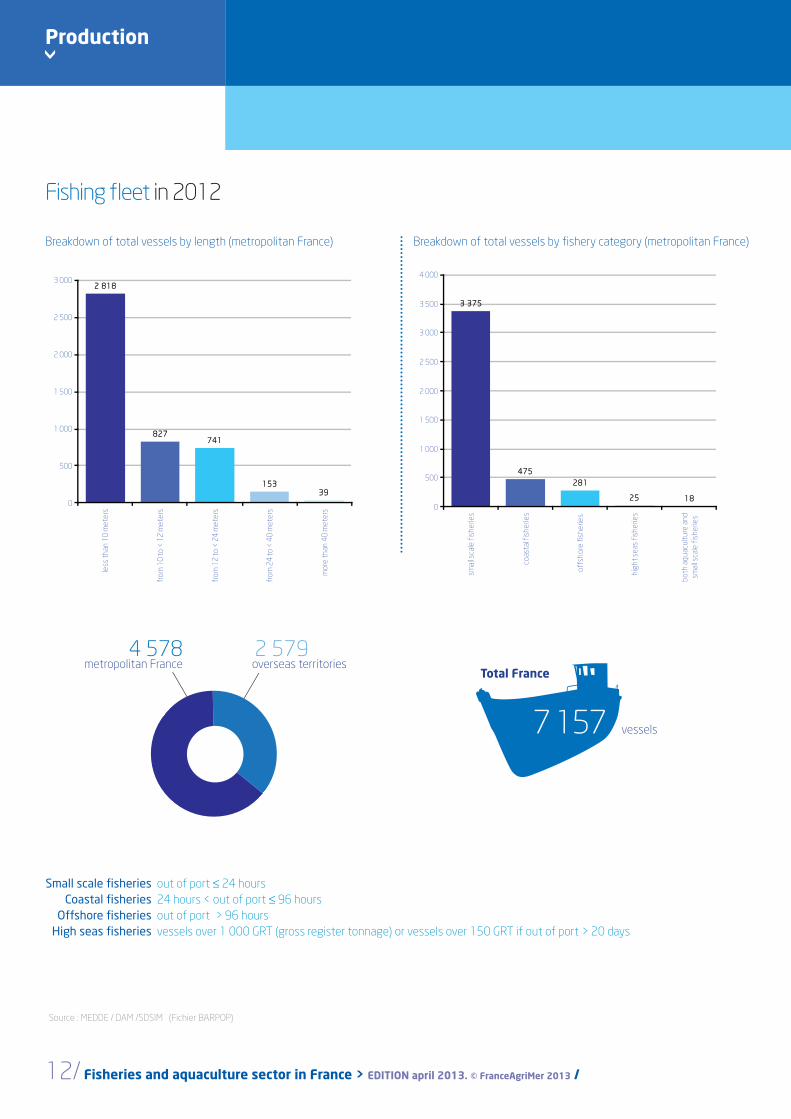
Fishing fl eet in 2012
Breakdown of total vessels by length (metropolitan France) Breakdown of total vessels by fi shery category (metropolitan France)
Small scale fi sheries out of port ≤ 24 hours
Coastal fi sheries 24 hours < out of port ≤ 96 hours
Offshore fi sheries out of port > 96 hours
High seas fi sheries vessels over 1 000 GRT (gross register tonnage) or vessels over 150 GRT if out of port > 20 days
Total France
7 157 vessels
Source : MEDDE / DAM /SDSIM (Fichier BARPOP)
4 578metropolitan France
2 579overseas territories
2 8182 818
827827741741
1531533939
0
500
1 000
1 500
2 000
2 500
3 000
less
th
an 1
0 m
ete
rs
fro
m 1
0 t
o <
12
me
ters
fro
m 1
2 t
o <
24
me
ters
fro
m 2
4 t
o <
40
me
ters
mo
re t
han
40
me
ters
3 3753 375
475475
281281
2525 18180
500
1 000
1 500
2 000
2 500
3 000
3 500
4 000
smal
l sca
le f
ish
erie
s
coas
tal f
ish
erie
s
off
sho
re f
ish
erie
s
hig
ht
seas
fis
he
ries
bo
th a
qu
acu
ltu
re a
nd
smal
l sca
le f
ish
erie
s
Les cahiers de FranceAgriMer 2013 / Key fi gures / FISHERIES AND AQUACULTURE. /13
Fishing fl eet / Aquaculture fi rmsFishing fleet / Aquaculture firms
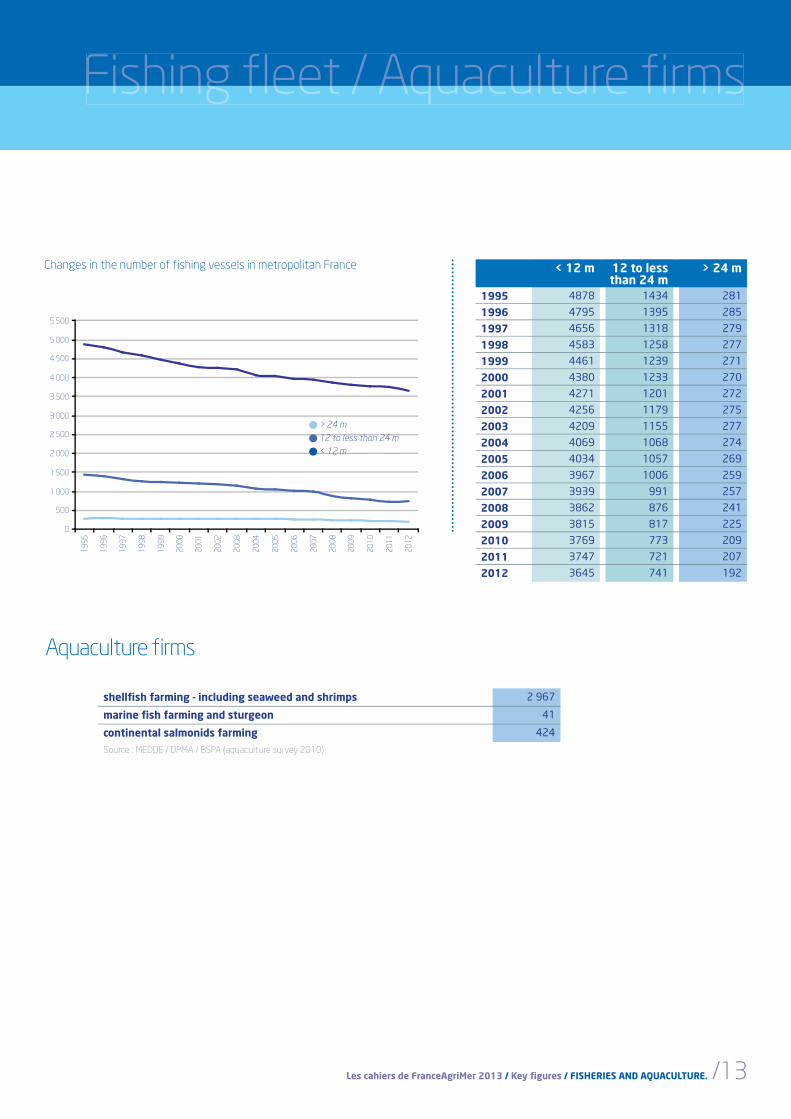
Aquaculture fi rms
Changes in the number of fishing vessels in metropolitan France
shellfi sh farming - including seaweed and shrimps 2 967
marine fi sh farming and sturgeon 41
continental salmonids farming 424
< 12 m 12 to less than 24 m
> 24 m
1995 4878 1434 281
1996 4795 1395 285
1997 4656 1318 279
1998 4583 1258 277
1999 4461 1239 271
2000 4380 1233 270
2001 4271 1201 272
2002 4256 1179 275
2003 4209 1155 277
2004 4069 1068 274
2005 4034 1057 269
2006 3967 1006 259
2007 3939 991 257
2008 3862 876 241
2009 3815 817 225
2010 3769 773 209
2011 3747 721 207
2012 3645 741 192
Source : MEDDE / DPMA / BSPA (aquaculture survey 2010)
Source : MEDDE / DAM /SDSIM (Fichier BARPOP)
0
500
1 000
1 500
2 000
2 500
3 000
3 500
4 000
4 500
5 000
5 500
19
95
19
96
19
97
19
98
19
99
20
00
20
01
20
02
20
03
20
04
20
05
20
06
20
07
20
08
20
09
20
10
20
11
20
12
> 24 m 12 to less than 24 m < 12 m
14/ Fisheries and aquaculture sector in France > EDITION april 2013. © FranceAgriMer 2013 /
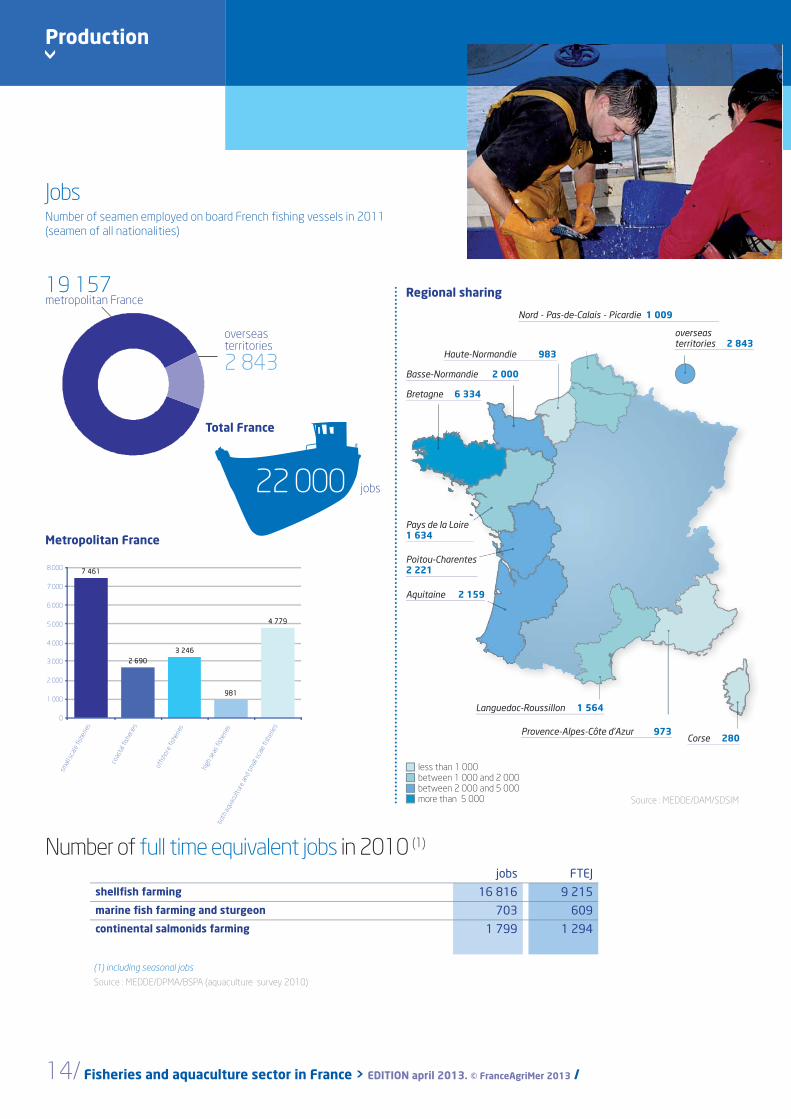
JobsNumber of seamen employed on board French fi shing vessels in 2011
(seamen of all nationalities)
> Production
Metropolitan France
22 000 jobs
Total France
Number of full time equivalent jobs in 2010 (1)
Regional sharing19 157metropolitan France
overseas territories
2 843
Languedoc-Roussillon 1 564
Haute-Normandie 983
Basse-Normandie 2 000
Pays de la Loire1 634
Poitou-Charentes2 221
Aquitaine 2 159
Provence-Alpes-Côte d’Azur 973
Bretagne 6 334
Corse 280
less than 1 000between 1 000 and 2 000between 2 000 and 5 000more than 5 000
overseas territories 2 843
Source : MEDDE/DAM/SDSIM
jobs FTEJshellfi sh farming 16 816 9 215marine fi sh farming and sturgeon 703 609continental salmonids farming 1 799 1 294
(1) including seasonal jobs
Source : MEDDE/DPMA/BSPA (aquaculture survey 2010)
Nord - Pas-de-Calais - Picardie 1 009
7 4617 461
2 6902 690
3 2463 246
981981
4 7794 779
0
1 000
2 000
3 000
4 000
5 000
6 000
7 000
8 000
smal
l sca
le f
ishe
ries
coas
tal f
ishe
ries
offs
hore
fis
herie
s
high
sea
s fis
herie
s
both
aqu
acul
ture
and
sm
all s
cale
fish
erie
s
fi shmongefi shmongeer's / trading // processinggion by sales / by ree
g
Firms
Les cahiers de FranceAgriMer 2013 / Key fi gures / FISHERIES AND AQUACULTURE. /15
>
16/ Fisheries and aquaculture sector in France > EDITION april 2013. © FranceAgriMer 2013 /
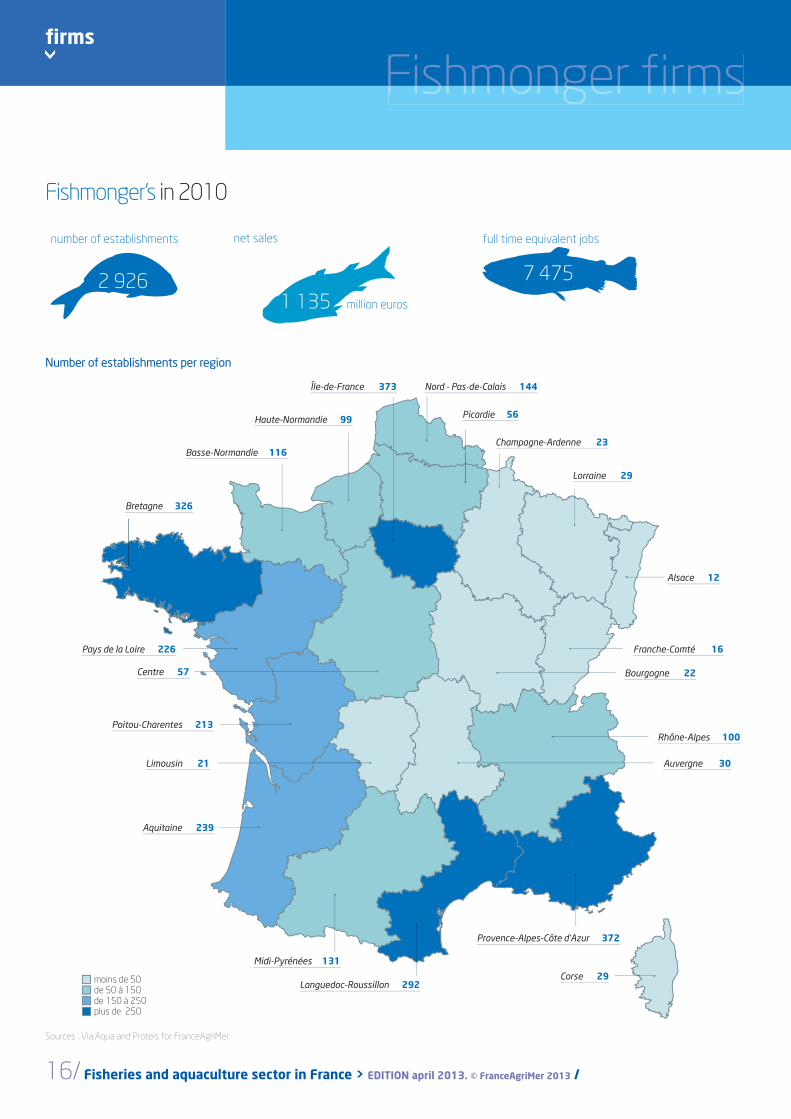
fi rms
Fishmonger's in 2010
2 926
number of establishments net sales
1 135 million euros
7 475
full time equivalent jobs
Sources : Via.Aqua and Proteis for FranceAgriMer
Number of establishments per region
moins de 50de 50 à 150de 150 à 250plus de 250
Languedoc-Roussillon 292
Haute-Normandie 99
Île-de-France 373
Alsace 12
Franche-Comté 16
Lorraine 29
Basse-Normandie 116Champagne-Ardenne 23
Limousin 21
Picardie 56
Nord - Pas-de-Calais 144
Provence-Alpes-Côte d’Azur 372
Bretagne 326
Bourgogne 22
Rhône-Alpes 100
Auvergne 30
Midi-Pyrénées 131
Centre 57
Pays de la Loire 226
Poitou-Charentes 213
Aquitaine 239
Corse 29
Fishmonger fi rmsFishmonger firms
Les cahiers de FranceAgriMer 2013 / Key fi gures / FISHERIES AND AQUACULTURE. /17
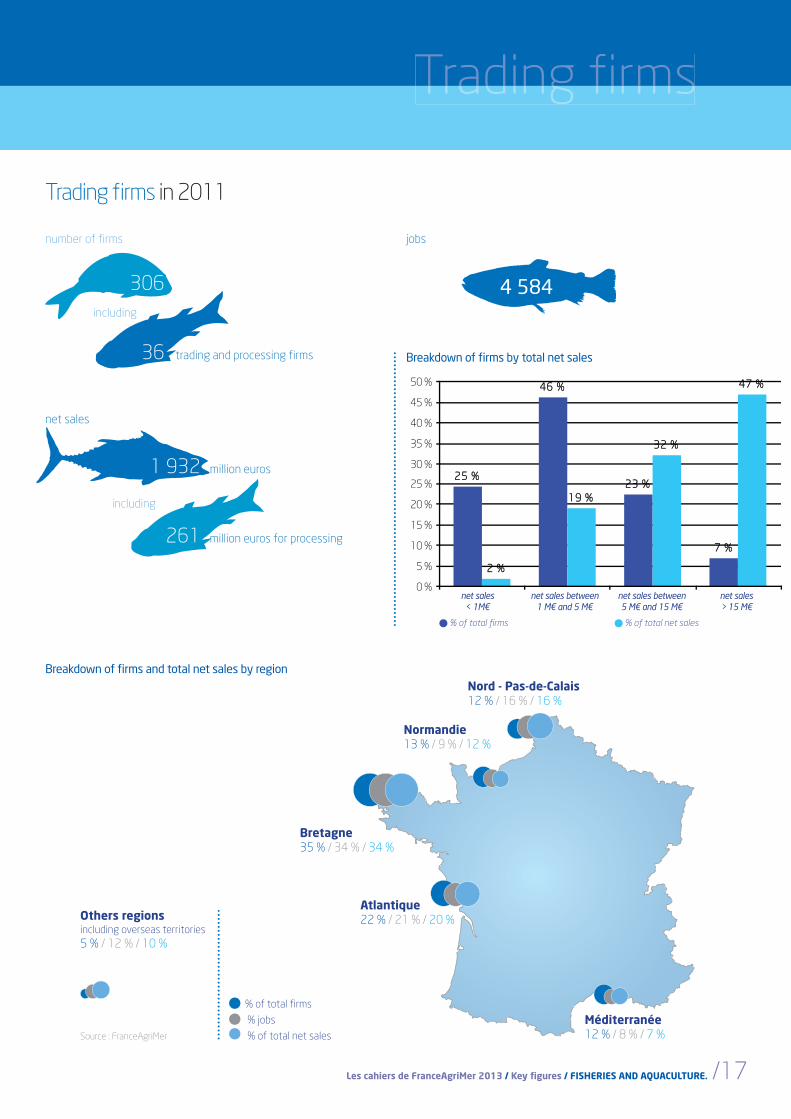
Trading fi rmsTrading firms
Trading fi rms in 2011
306
number of fi rms
36 trading and processing fi rms
including
4 584
jobs
Breakdown of fi rms and total net sales by region
% of total fi rms
Breakdown of fi rms by total net sales
% of total net sales
1 932 million euros
net sales
261 million euros for processing
including
net sales between 5 M€ and 15 M€
net sales between 1 M€ and 5 M€
net sales > 15 M€
net sales < 1M€
Nord - Pas-de-Calais 12 % / 16 % / 16 %
Normandie 13 % / 9 % / 12 %
Bretagne 35 % / 34 % / 34 %
Atlantique 22 % / 21 % / 20 %
Méditerranée 12 % / 8 % / 7 %
% of total fi rms
% jobs
% of total net sales
Others regionsincluding overseas territories
5 % / 12 % / 10 %
Source : FranceAgriMer
25 %25 %
46 %46 %
23 %23 %
7 %7 %
2 %2 %
19 %19 %
32 %32 %
47 %47 %
0 %
5 %
10 %
15 %
20 %
25 %
30 %
35 %
40 %
45 %
50 %
>
18/ Fisheries and aquaculture sector in France > EDITION april 2013. © FranceAgriMer 2013 /
fi rms
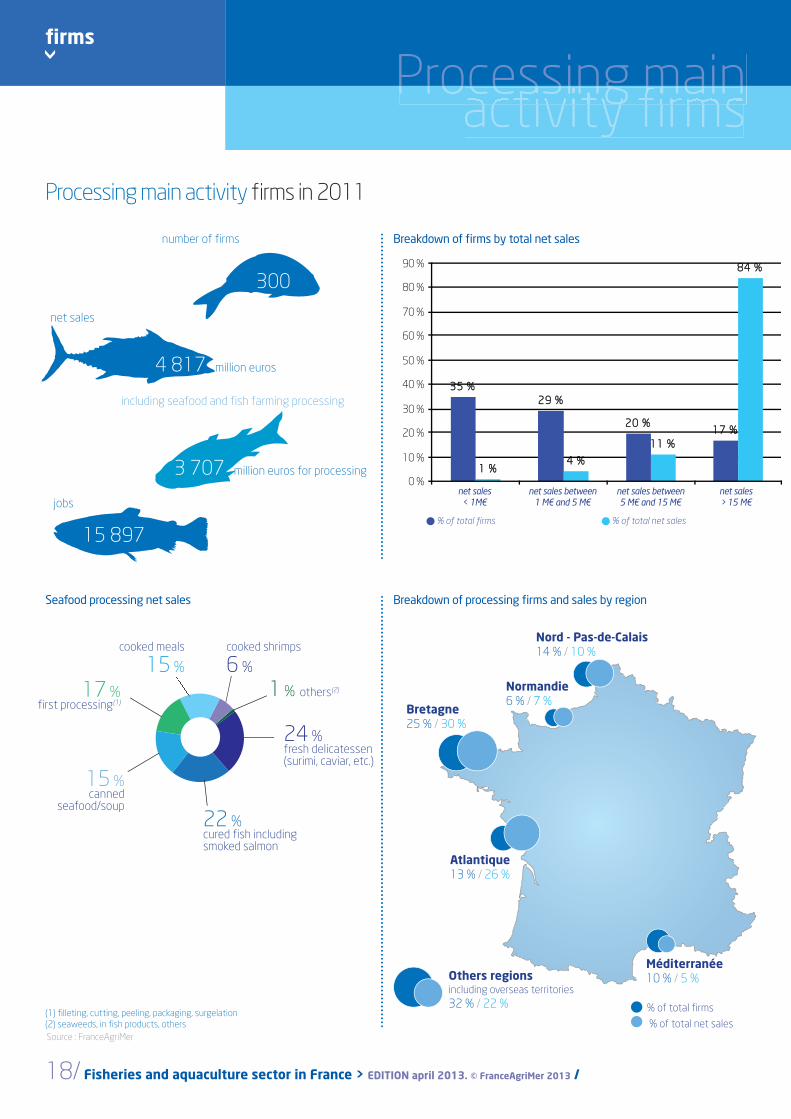
Processing main Processing mainactivity fi rmscessing maincessing main
Seafood processing net sales
Processing main activity fi rms in 2011
Breakdown of processing fi rms and sales by region
cooked shrimps
6 %
cooked meals
15 %
17 %fi rst processing(1)
15 %canned
seafood/soup
24 %fresh delicatessen(surimi, caviar, etc.)
1 % others(2)
22 %cured fi sh including smoked salmon
Source : FranceAgriMer
(1) fi lleting, cutting, peeling, packaging, surgelation(1) fi lleting, cutting, peeling, packaging, surgelation
(2) seaweeds, in fi sh products, others(2) seaweeds, in fi sh products, others
300
number of fi rms
15 897
jobs
% of total fi rms
Breakdown of fi rms by total net sales
% of total net sales
% of total fi rms
% of total net sales
net sales between 5 M€ and 15 M€
net sales between 1 M€ and 5 M€
net sales > 15 M€
net sales < 1M€
Others regionsincluding overseas territories
32 % / 22 %
Nord - Pas-de-Calais 14 % / 10 %
Normandie 6 % / 7 %
Bretagne 25 % / 30 %
Atlantique 13 % / 26 %
Méditerranée 10 % / 5 %
4 817 million euros
net sales
3 707 million euros for processing
including seafood and fi sh farming processing
35 %35 %
29 %29 %
20 %20 %17 %17 %
1 %1 %4 %4 %
11 %11 %
84 %84 %
0 %
10 %
20 %
30 %
40 %
50 %
60 %
70 %
80 %
90 %

imports / eexportsexports by presentation / by species / by geographical origine /nmain species
Trade
Les cahiers de FranceAgriMer 2013 / Key fi gures / FISHERIES AND AQUACULTURE. /19
>
20/ Fisheries and aquaculture sector in France > EDITION april 2013. © FranceAgriMer 2013 /
Trade
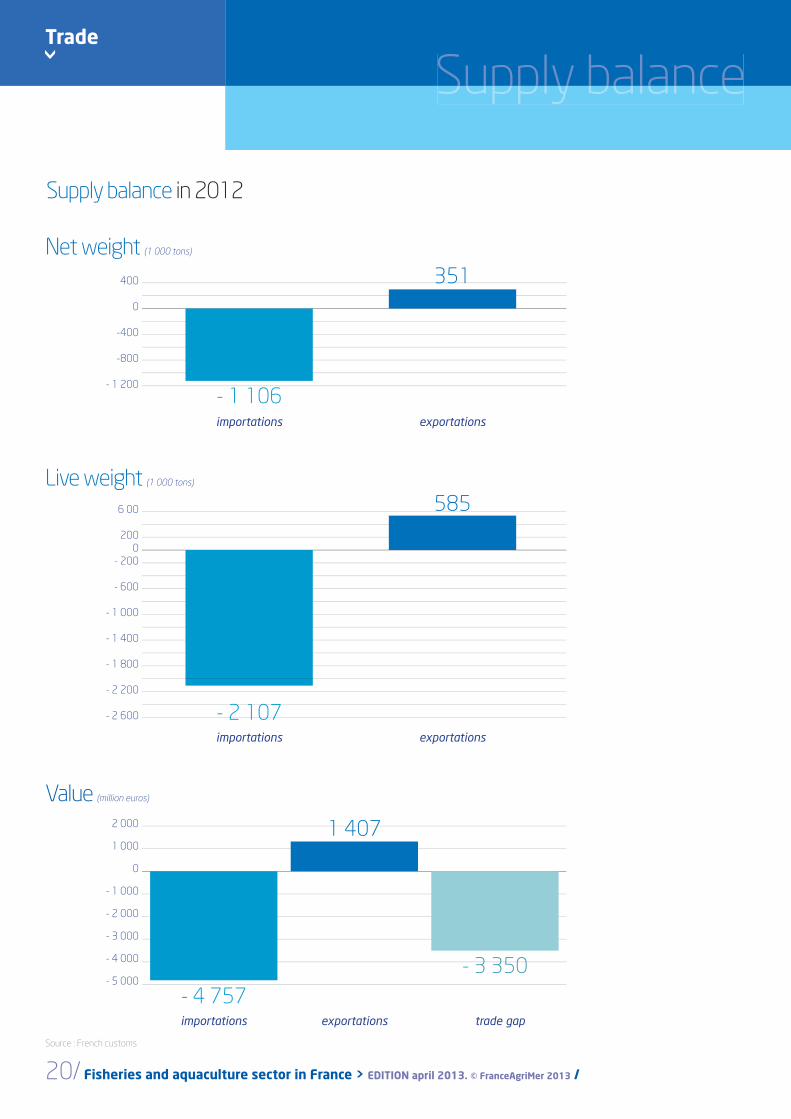
Supply balanceSupply balance
Net weight (1 000 tons)
Source : French customs
trade gap
Value (million euros)
exportationsimportations
- 1 106
351400
0
-400
-800
- 1 200
importations exportations
1 407
- 3 350
2 000
1 000
0
- 1 000
- 2 000
- 3 000
- 4 000
- 5 000
- 4 757
6 00
200
0
- 200
- 600
- 1 000
- 1 400
- 1 800
- 2 200
- 2 600 - 2 107
585Live weight (1 000 tons)
exportationsimportations
Supply balance in 2012

Les cahiers de FranceAgriMer 2013 / Key fi gures / FISHERIES AND AQUACULTURE. /21
Imports - main species in 2012
Exports - main species in 2012
Source : French customs
Value (million euros)
Value (million euros)
Imports and exports / metropolitan Imports and exports / metropolitanFrance and overseas territoriesorts and exports / metropolitanorts and exports / metropolitan
47
56
67
73
78
78
78
90
133
210
250
349
528
655
832
0 100 200 300 400 500 600 700 800 900
seabream
hake
Norway lobster
mackerel
sardine
cephalopods
mussel
crab
lobster
saithe, pollack
scallop
cod
tuna
shrimp
salmon
1818
1818
1919
1919
2121
2121
2121
2222
2626
3535
5252
9393
9494
151151
218218
0 50 100 150 200 250
crab
cod
trout
hake
scallop
monkfish
anchovy
seabass
lobster
sole
oyster
cephalopods
shrimp
salmon
tuna

>
22/ Fisheries and aquaculture sector in France > EDITION april 2013. © FranceAgriMer 2013 /
>
Trade / aquatic products
Imports by volume (1 000 tons) Imports by value (million euros)
Imports by presentation in 2012
(1) data collection methodology is detailed on inside back cover - Source : French customs
Imports by volume (1 000 tons) Imports by value (million euros)
Imports by species group in 2012
net weightlive weight (1)
net weightlive weight (1)
87
207
28
434
351
177
439
65
969
457
0 200 400 600 800 1 000 1 200
non food use
canned
salted, dried, smoked
frozen
live, fresh, chilled
152
908
170
1 927
1 600
0 500 1 000 1 500 2 000 2 500
non food use
canned
salted, dried,
smoked
frozen
live, fresh, chilled
87
128
143
202
548
177
339
183
272
1 136
0 200 400 600 800 1 000 1 200
non food use
bivalves and
cephalopods
crustaceans
trout, salmon, eel and
fresh water fish
marine fish
152
537
972
936
2 160
0 500 1 000 1 500 2 000 2 500
non food use
bivalves and
cephalopods
crustaceans
trout, salmon, eel and
fresh water fish
marine fish
Les cahiers de FranceAgriMer 2013 / Key fi gures / FISHERIES AND AQUACULTURE. /23
Imports and exports / metropolitan Imports and exports / metropolitanFrance and overseas territoriesorts and exports / metropolitanorts and exports / metropolitan
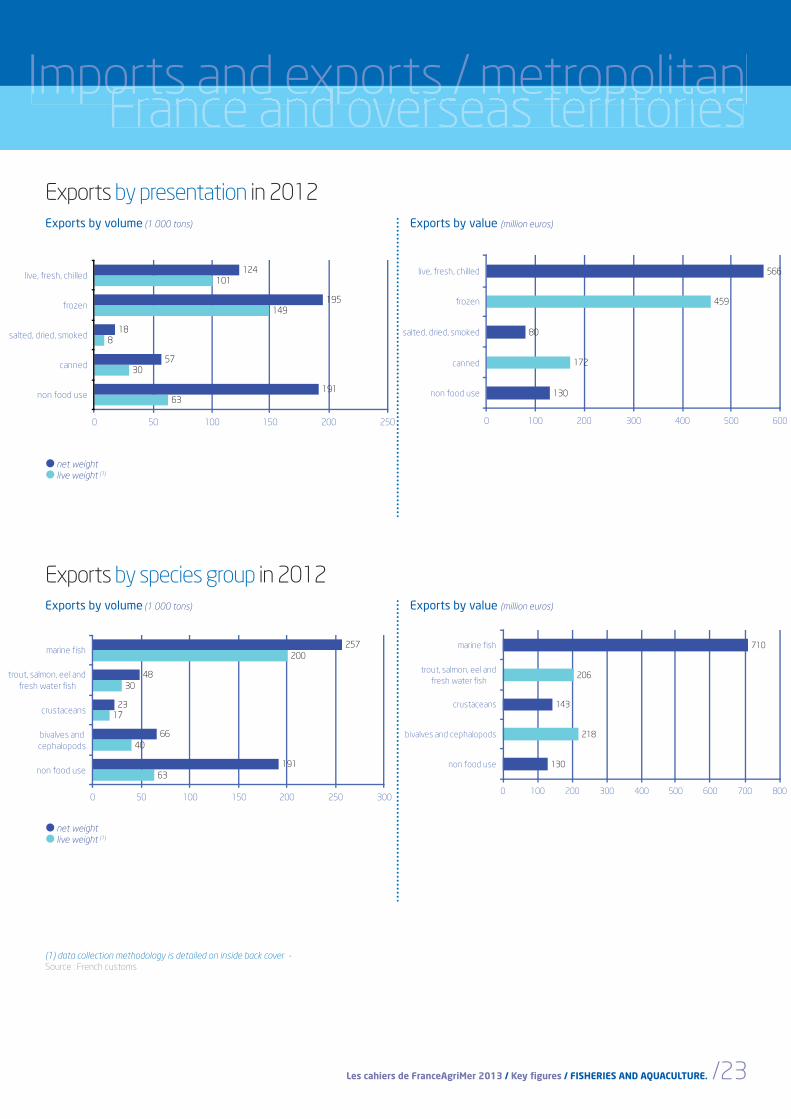
Exports by presentation in 2012
(1) data collection methodology is detailed on inside back cover - Source : French customs
Exports by volume (1 000 tons) Exports by value (million euros)
net weightlive weight (1)
Exports by species group in 2012Exports by volume (1 000 tons) Exports by value (million euros)
net weightlive weight (1)
63
30
8
149
101
191
57
18
195
124
0 50 100 150 200 250
non food use
canned
salted, dried, smoked
frozen
live, fresh, chilled
130
172
80
459
566
0 100 200 300 400 500 600
non food use
canned
salted, dried, smoked
frozen
live, fresh, chilled
63
40
17
30
200
191
66
23
48
257
0 50 100 150 200 250 300
non food use
bivalves and
cephalopods
crustaceans
trout, salmon, eel and
fresh water fish
marine fish
130
218
143
206
710
0 100 200 300 400 500 600 700 800
non food use
bivalves and cephalopods
crustaceans
trout, salmon, eel and
fresh water fish
marine fish

>
24/ Fisheries and aquaculture sector in France > EDITION april 2013. © FranceAgriMer 2013 /
Trade
Imports of aquatic products by geographical origin in 2012
Exports of aquatic products by destination in 2012
Source : French Customs
Value (million euros)
Value (million euros)
Imports and exportsImports and exports
1 901European Union of 27
2 196other countries
660 EFTA(Norway, Iceland, Switzerland)
1 037European Union of 27
306other countries
64EFTA (Norway, Iceland,Switzerland)
100
106
107
109
124
129
133
164
185
201
207
223
333
395
562
0 100 200 300 400 500 600
Belgium
India
Madagascar
Vietnam
Poland
Germany
Irland
Denmark
China
Ecuador
United States
Netherlands
Spain
United Kingdom
Norway
20
21
25
28
28
33
34
37
47
61
72
111
161
232
245
0 50 100 150 200 250 300
Portugal
Luxembourg
Seychelles
United States
Vietnam
Denmark
Mauritius
Ivory Coast
Netherlands
Switzerland
United Kingdom
Germany
Belgium
Spain
Italy

ance / purchaasesasessupply balholds / catering / breakdown of purchases by distribution channelhohohohohohohohohohohohohohohohohohohohhooooohohohoooohoohohohohohoohohhhoohhhoooohoohoooooooohohohooooohhhohhhohhhohohoohoohoohooooh ususususususususuususususususususususususususuusususussususuuusususususuussssssssussusssusususususuusuuusuuuussusssssusssususuuuususuusssssssusususuuuuuuusussussssusuuuuussssuusussusssssuussssssssusssssssssssssssssssssusssusuusussssusususussusssssssssssssssssssusususuususu eheehhehehhehehehheheheheheheeeeehehehehhhhhhehehehhhhheheheehehehehhhhhhehehhhehehehehehheheeheheeheheeheheheeheeheeeeeeeeehhheeeeeeehheeeeeeeeeeeeehheeeeeeeeeeeeeeheeeeeeeehhheeeeeeeeeheeeeeeeeeehheeeeeeeeeeeheeeeeeeeeheeeeeeeeheeeeheeeeeeheeeeeeeheheeeeeeeeeeeeehhheeeeeeeeeeeeeeeeeeeheeeeeeeeeeeeeeeeeeeeeeeheeeeeheheeheehh
Consumption
Les cahiers de FranceAgriMer 2013 / Key fi gures / FISHERIES AND AQUACULTURE. /25
>
26/ Fisheries and aquaculture sector in France > EDITION april 2013. © FranceAgriMer 2013 /
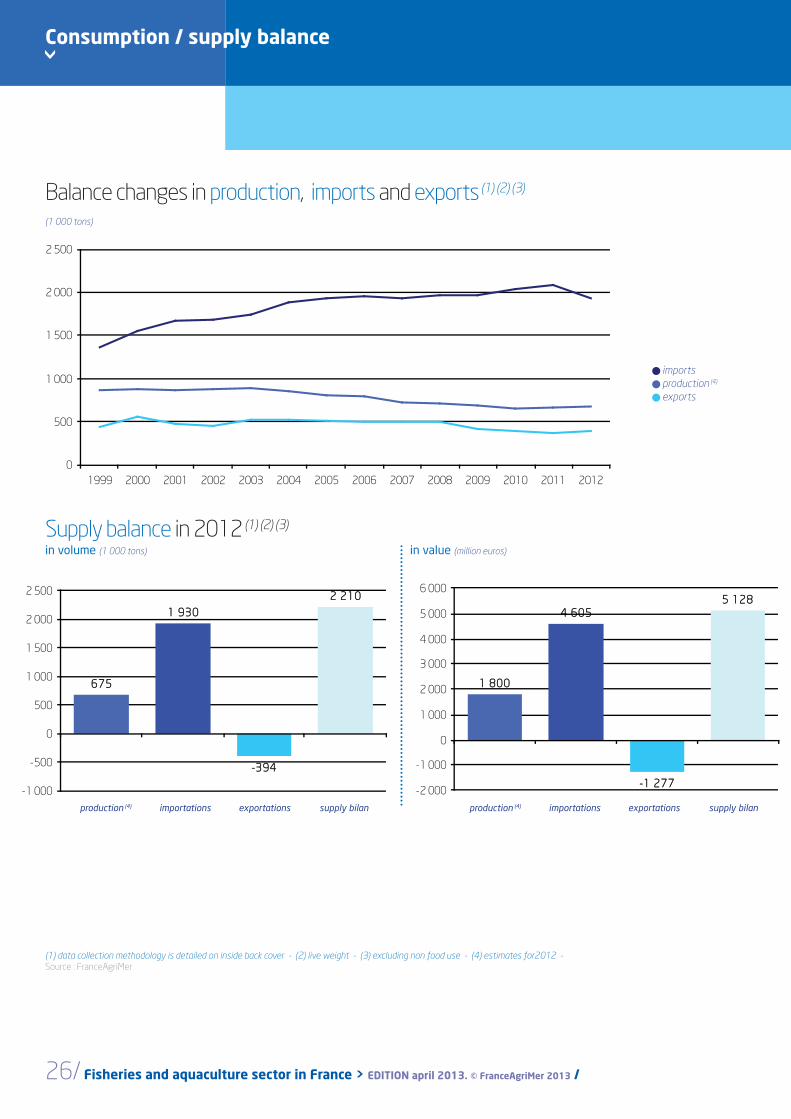
Consumption / supply balance
Supply balance in 2012 (1) (2) (3)
Balance changes in production, imports and exports (1) (2) (3)
production (4) supply bilanexportationsimportations
(1) data collection methodology is detailed on inside back cover - (2) live weight - (3) excluding non food use - (4) estimates for2012 - Source : FranceAgriMer
in volume (1 000 tons) in value (million euros)
(1 000 tons)
imports production (4)
exports
0
500
1 000
1 500
2 000
2 500
1999 2000 2001 2002 2003 2004 2005 2006 2007 2008 2009 2010 2011 2012
675675
1 9301 930
-394-394
2 2102 210
-1 000
-500
0
500
1 000
1 500
2 000
2 500
1 8001 800
4 6054 605
-1 277-1 277
5 1285 128
-2 000
-1 000
0
1 000
2 000
3 000
4 000
5 000
6 000
production (4) supply bilanexportationsimportations

Les cahiers de FranceAgriMer 2013 / Key fi gures / FISHERIES AND AQUACULTURE. /27
(1) data collection methodology is detailed on inside back cover - (2) live weight - (3) average 2009-2011 - Source : FranceAgriMer
Breakdown by products in 2011 (1) (2)
13 %shellfi sh from captures
54 %fi nfi sh from captures
23 %farmed shellfi sh
10 % farmed fi nfi sh
36 kg
Average annual consumptionper capita (2) (3)
Supply balanceSupply balance
(kg)
Changes in supply balance (1) (2)
total fi nfi sh shellfi sh (bivalves, crustaceans
and cephalopods)
Average
growth rate
over the last
ten years 1 %
0
5
10
15
20
25
30
35
40
1999 2000 2001 2002 2003 2004 2005 2006 2007 2008 2009 2010 2011
28/ Fisheries and aquaculture sector in France > EDITION april 2013. © FranceAgriMer 2013 /
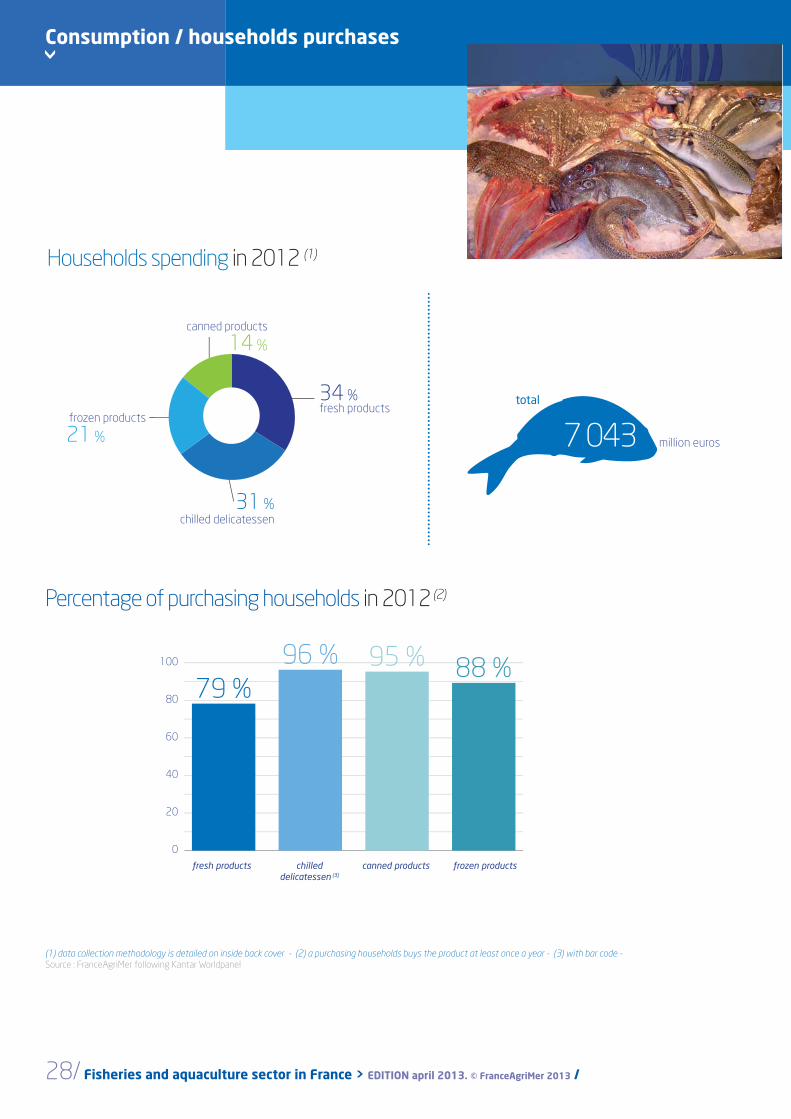
Percentage of purchasing households in 2012 (2)
31 %chilled delicatessen
frozen products
21 %
canned products
14 %
34 %fresh products
fresh products chilled canned products frozen products delicatessen (3)
79 %
96 % 95 % 88 %100
80
60
40
20
0
Households spending in 2012 (1)
(1) data collection methodology is detailed on inside back cover - (2) a purchasing households buys the product at least once a year - (3) with bar code -Source : FranceAgriMer following Kantar Worldpanel
total
7 043 million euros
> Consumption / households purchases
Les cahiers de FranceAgriMer 2013 / Key fi gures / FISHERIES AND AQUACULTURE. /29
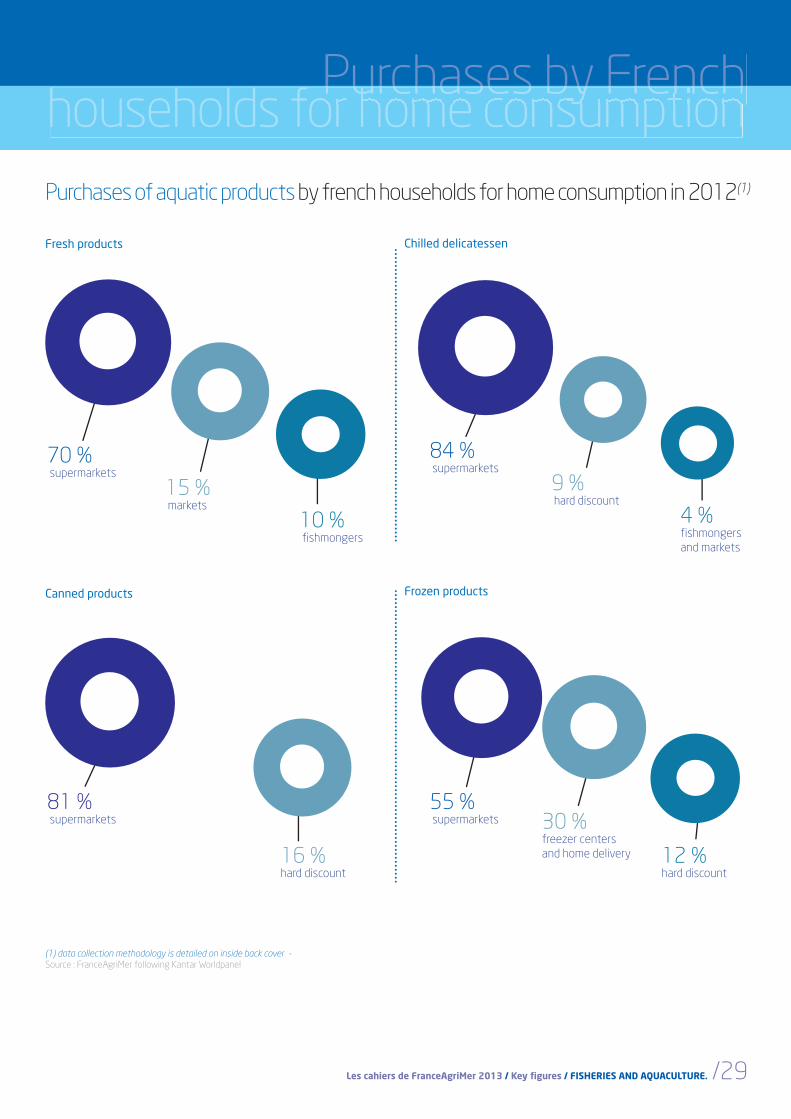
Purchases of aquatic products by french households for home consumption in 2012(1)
Fresh products
Canned products
Chilled delicatessen
Frozen products
Purchases by Frenchhouseholds for home consumption
Purchases by FrenchPurchases by French
(1) data collection methodology is detailed on inside back cover - Source : FranceAgriMer following Kantar Worldpanel
81 % supermarkets
16 %hard discount
84 % supermarkets
9 % hard discount
4 %fi shmongers
and markets
55 % supermarkets 30 %
freezer centers
and home delivery 12 %hard discount
70 % supermarkets
15 % markets
10 % fi shmongers

>
30/ Fisheries and aquaculture sector in France > EDITION april 2013. © FranceAgriMer 2013 /
Consumption / households purchases
Breakdown of expenditures by presentation and species group in 2012 (1)
18 %cooked shrimp
cured fi sh
35 %
32 %others
15 %surimi
53 %fi sh fi llets
crustaceans
8 %
bivalves and
cephalopods
23 %
16 %whole fi sh
Fresh products
Frozen products
Chilled delicatessen
Canned products
(1) data collection methodology is detailed on inside back cover - Source : FranceAgriMer following Kantar Worldpanel
ready meals
26 %
crustaceans
12 %
fi sh
51 %
11 %bivalves and
cephalopods
5 %tuna salads
others
18 %
sardine
14 %
mackerel
16 %
48 %tuna (excluding tuna salads)

Les cahiers de FranceAgriMer 2013 / Key fi gures / FISHERIES AND AQUACULTURE. /31
Purchases by French householdsPurchases by French householdsfor home consumption
s by French householdss by French households
(1) data collection methodology is detailed on inside back cover - (2) net weight Source : FranceAgriMer following Kantar Worldpanel
percentage of purchasing households (%)
tons (2)
million euros
Main species purchased fresh in 2012 (1)
3 5493 549
3 7853 785
4 1264 126
4 2734 273
4 3374 337
4 7824 782
5 1045 104
5 1605 160
7 2697 269
7 6667 666
18 97818 978
24 25924 259
33 57933 579
45 02545 025
0 5 000 10 000 15 000 20 000 25 000 30 000 35 000 40 000 45 000 50 000
haddock
seabass
trout
seabream
mackerel
monkfish
hake
whiting
saithe
scallop
cod
oyster
salmon
mussel
43 97143 971
43 99243 992
47 26947 269
48 76048 760
56 46356 463
60 25460 254
64 18064 180
71 73871 738
82 03082 030
85 44285 442
150 020150 020
188 575188 575
283 434283 434
410 504410 504
0 50 000 100 000 150 000 200 000 250 000 300 000 350 000 400 000 450 000
haddock
trout
hake
seabream
seabass
sole
whiting
saithe
scallop
monkfish
mussel
oyster
cod
salmon
1111
1111
1111
1111
1212
1414
1515
1515
1818
1919
2121
3636
3838
4848
0 10 20 30 40 50 60
mackerel
ling
seabass
seabrem
sardine
scallop
haddock
trout
oyster
whiting
saithe
mussel
cod
salmon
32/ Fisheries and aquaculture sector in France > EDITION april 2013. © FranceAgriMer 2013 /
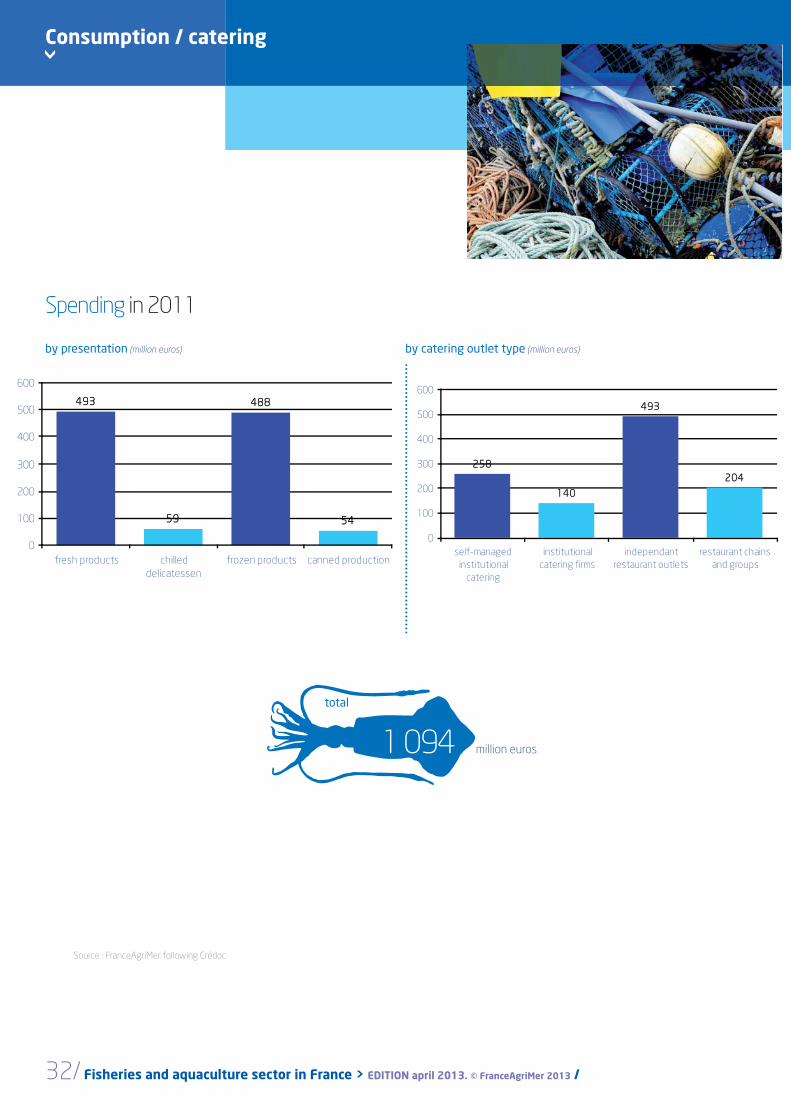
Spending in 2011
Source : FranceAgriMer following Crédoc
by presentation (million euros) by catering outlet type (million euros)
1 094 million euros
total
> Consumption / catering
493493
5959
488488
5454
0
100
200
300
400
500
600
fresh products chilled
delicatessen
frozen products canned production
258258
140140
493493
204204
0
100
200
300
400
500
600
self-managed
institutional
catering
institutional
catering firms
independant
restaurant outlets
restaurant chains
and groups
Les cahiers de FranceAgriMer 2013 / Key fi gures / FISHERIES AND AQUACULTURE. /33
Purchases of aquatic products Purchases of aquatic productsby the catering sectores of aquatic productses of aquatic products
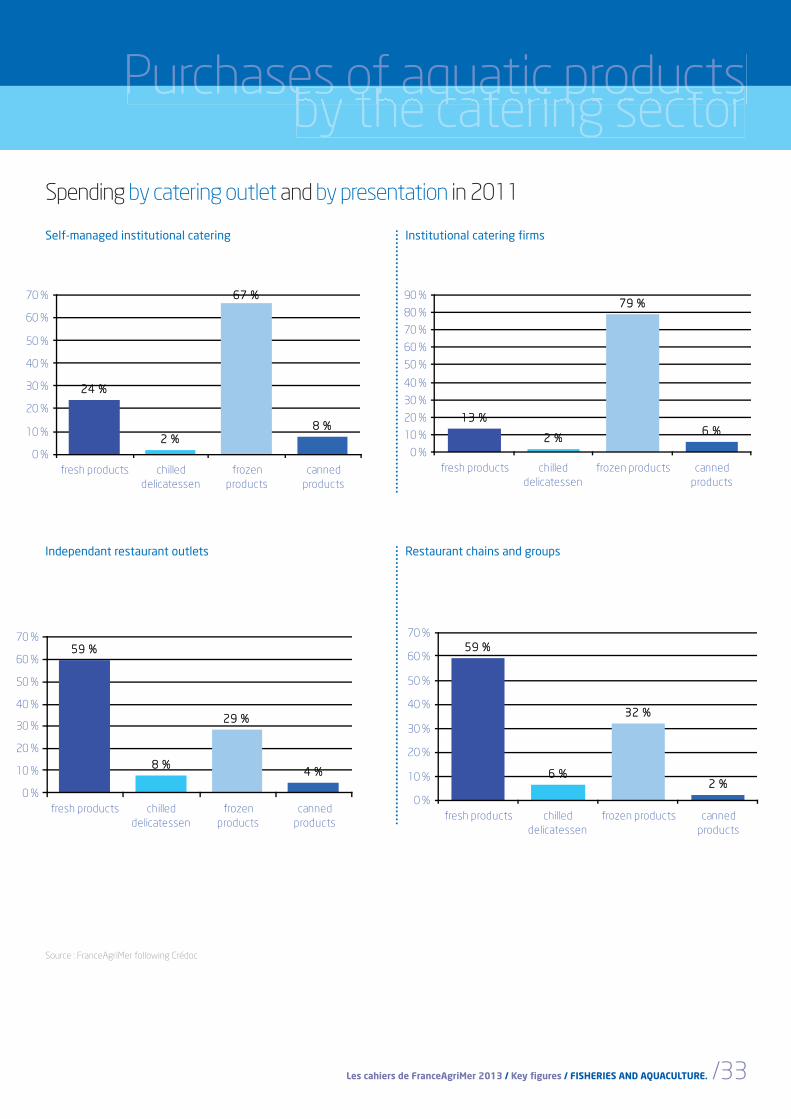
Spending by catering outlet and by presentation in 2011
Self-managed institutional catering
Independant restaurant outlets
Institutional catering fi rms
Restaurant chains and groups
Source : FranceAgriMer following Crédoc
24 %24 %
2 %2 %
67 %67 %
8 %8 %
0 %
10 %
20 %
30 %
40 %
50 %
60 %
70 %
fresh products chilled
delicatessen
frozen
products
canned
products
13 %13 %
2 %2 %
79 %79 %
6 %6 %
0 %
10 %
20 %
30 %
40 %
50 %
60 %
70 %
80 %
90 %
fresh products chilled
delicatessen
frozen products canned
products
59 %59 %
8 %8 %
29 %29 %
4 %4 %
0 %
10 %
20 %
30 %
40 %
50 %
60 %
70 %
fresh products chilled
delicatessen
frozen
products
canned
products
59 %59 %
6 %6 %
32 %32 %
2 %2 %
0 %
10 %
20 %
30 %
40 %
50 %
60 %
70 %
fresh products chilled
delicatessen
frozen products canned
products

>
34/ Fisheries and aquaculture sector in France > EDITION april 2013. © FranceAgriMer 2013 /
Consumption
Breeakdown of purchases byBreeakdown of purchases bydistribution channel
own of purchases byown of purchases by
Breakdown of purchases by presentation for different outlets (value)
Breakdown of purchases by outlet for different presentations (quantities) (3)
(1) including hard discount, freezer centres and home delivery - (2) including direct sales - (3) net weight
Source : Kantar Worldpanel and Crédoc for FranceAgriMer
supermarkets (1) fi shmongers and markets (2)
restaurantsinstitutional catering
fresh products chilled delicatessenfrozen productscanned products
20 %20 %
59 %59 %
87 %87 %
2 %2 %
7 %7 %
13 %13 %
35 %35 %
71 %71 %
30 %30 %
21 %21 %
7 %7 %
4 %4 %
17 %17 %27 %27 %
0 % 10 % 20 % 30 % 40 % 50 % 60 % 70 % 80 % 90 % 100 %
institutional catering
restaurants
fishmongers and markets (2)
supermarkets (1)
93 %93 %
65 %65 %
94 %94 %
58 %58 %
13 %13 %
17 %17 %
4 %4 %
22 %22 %
5 %5 %20 %20 %
3 %3 %
3 %3 %
3 %3 %
0 % 10 % 20 % 30 % 40 % 50 % 60 % 70 % 80 % 90 % 100 %
canned products
frozen products
chilled delicatessen
fresh products
Les cahiers de FranceAgriMer 2013 / Key fi gures / FISHERIES AND AQUACULTURE. /35
Data collection methodology
Data Included data are the last available in april 2013.
Foreign Trade Raw Import/export data is provided by French Customs on a net weight basis.
It is converted here into their live weight equivalent, i.e. before any product processing, using
coeffi cients that have been established for each product code.
Processing Processing fi rms data arise from a survey carried out in 2012 among main or
secondary processing activity identifi ed fi rms. Besides, information about non-processing trading
fi rms arises from FranceAgriMer's updated fi sh trading fi rms database (notably following the
French National Institute for Statistics and Economic Studies' fi rm lists, sanitary approvals, fi nancial
databases and professional sources).
Consumption French consumption may be measured in two ways :
• fi rstly, by calculating supply balance or apparent consumption (production + imports - exports),
• secondly by using consumer and restaurant panels.
Apparent consumption is measured in live weight equivalent and includes the overseas territories
(French Caribbean Islands, Reunion Island and French Guyana). In contrast, consumer and restaurant
data are expressed in net weight, meaning the weight as purchased by the fi nal consumer
(consumer panel) or by restaurants (restaurant panel), and exclude consumption in the overseas
territories (and in Corsica for consumer panels). Panel data is based on declarations made by
consumers and restaurant buyers and is thus non-exhaustive. Coverage varies according to the
product in question, and the overall rate of coverage is approximately 80 %.
To fi nd out more information, especially about prices at all levels of the sector (production, trade,
consumption), and their trends :
• Bilan annuel FranceAgriMer 2012 des ventes déclarées en halles à marée*
• Bilan annuel FranceAgriMer 2012 du commerce extérieur des produits de la pêche et de
l’aquaculture*
• Bilan annuel FranceAgriMer 2012 de la consommation des produits de la pêche et de
l’aqua culture*
* coming 2013
Ric Réseau inter criées
MEDDE Ministère de l'Écologie, du Développement durable et de l'Énergie DPMA Direction des Pêches Maritimes et de l'AquacultureBSPA Bureau des statistiques de la Pêche et de l'AquacultureDAM Direction des Affaires Maritimes
SDSIM Sous Direction des Systèmes d'information maritimes
Ifremer Institut français de recherche pour l'exploitation de la mer

MINISTÈREDE L’AGRICULTURE
DE L'AGROALIMENTAIREET DE LA FORÊT
MINISTÈRE DE L'ÉCOLOGIEDU DÉVELOPPEMENT
DURABLEET DE L’ÉNERGIE www.franceagrimer.fr / www.agriculture.gouv.fr