Embed Size (px)
Citation preview
The search for MH370 and ocean surface drift – Part II
David Griffin, Peter Oke and Emlyn Jones report number EP172633 13 April 2017
Prepared for the Australian Transport Safety Bureau
CSIRO OCEANS AND ATMOSPHERE

Citation
Griffin, DA, Oke, PR and Jones, EM (2017). The search for MH370 and ocean surface drift – Part II. CSIRO Oceans and Atmosphere, Australia. Report number EP172633. April 2017.
Copyright
© Commonwealth Scientific and Industrial Research Organisation 2017. To the extent permitted by law, all rights are reserved and no part of this publication covered by copyright may be reproduced or copied in any form or by any means except with the written permission of CSIRO.
Important disclaimer
CSIRO advises that the information contained in this publication comprises general statements based on scientific research. The reader is advised and needs to be aware that such information may be incomplete or unable to be used in any specific situation. No reliance or actions must therefore be made on that information without seeking prior expert professional, scientific and technical advice. To the extent permitted by law, CSIRO (including its employees and consultants) excludes all liability to any person for any consequences, including but not limited to all losses, damages, costs, expenses and any other compensation, arising directly or indirectly from using this publication (in part or in whole) and any information or material contained in it.
CSIRO is committed to providing web accessible content wherever possible. If you are having difficulties with accessing this document please contact [email protected].

Foreword
This work is dedicated to the 239 people aboard flight MH370.
The search for MH370 and ocean surface drift – Part II | i
Contents
Foreword i
Acknowledgments iii
Executive summary iv
1 Introduction 1
2 Workshop and field work 2
2.1 Cutting down and tank testing a second-hand flaperon .................................................... 2
2.2 Field work with flaperons and drifting buoys ..................................................................... 7
2.3 Results ............................................................................................................................... 10
3 Revised estimates of the flaperon’s potential trajectories across the Indian Ocean 12
4 High-windage items 15
5 Conclusion 17
Glossary 18
References 19
ii | The search for MH370 and ocean surface drift – Part II
Acknowledgments
This work was funded by the Australian Transport Safety Bureau. We thank 1) the NTSB for help locating a genuine flaperon, 2) the Direction Generale de L’Armement (DGA) for access to and permission to reproduce photographs of the buoyancy tests of 9M-MRO’s flaperon, and 3) David Kruse and Rob Gregor (CSIRO) for help with fieldwork and instrumentation, and Chris Blood (CSIRO) for supervising the modification of the flaperon.
The search for MH370 and ocean surface drift – Part II | iii
Executive summary
This report explores the possibility that an improved ability to simulate the path taken by the flaperon across the Indian Ocean might yield an improved estimate of the location of the remains of the aircraft on the sea floor.
Our earlier field testing of replicas of the flaperon was unable to confirm numerical predictions by the Direction Generale de L’Armement (DGA) that the flaperon drifted left of the wind. Field testing of a genuine Boeing 777 flaperon cut down to match photographs of 9M-MRO’s flaperon has now largely confirmed the DGA predictions, at least with respect to drift angle. The impact of this information on simulated trajectories across the Indian Ocean is that the July 2015 arrival time at La Reunion is now very easy to explain.
This new information does not change our earlier estimate of the most probable location of the aircraft. It does, however, increase our confidence in that estimate, so we are now even more confident that the aircraft is within the new search area identified and recommended in the MH370 First Principles Review (ATSB 2016).
The proposed new search area has been determined by combining many lines of evidence, the strongest being that the descent began close to the SatCom 7th arc. The following evidence from drift modelling helps indicate where along the 7th arc the aircraft impacted the sea surface:
• The July 2015 arrival date of the flaperon at La Reunion island is consistent with impact occurring between latitudes 40°S and 30.5°S.
• Arrival off Africa of other debris exclusively after December 2015 favours impact latitudes south of 32°S, as does the failure of the 40-day aerial search off Western Australia to find any floating debris.
• Absence of debris findings on Australian shores is only consistent with a few impact latitudes – the region near 35°S is the only one that is also consistent with other factors.
The new search area, near 35°S, comprises thin strips either side of the previously-searched strip close to the 7th arc. If the aircraft is not found there, then the rest of the search area is still likely to contain the plane. The available evidence suggests that all other regions are unlikely.
iv | The search for MH370 and ocean surface drift – Part II
1 Introduction
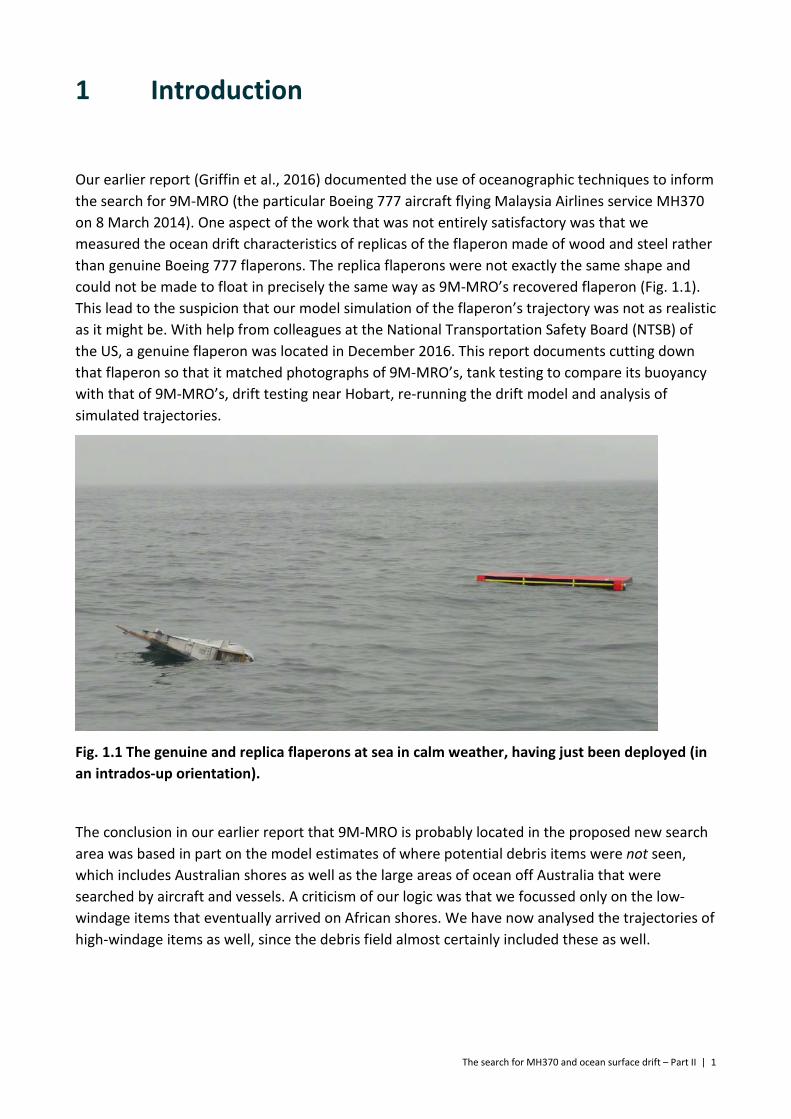
Our earlier report (Griffin et al., 2016) documented the use of oceanographic techniques to inform the search for 9M-MRO (the particular Boeing 777 aircraft flying Malaysia Airlines service MH370 on 8 March 2014). One aspect of the work that was not entirely satisfactory was that we measured the ocean drift characteristics of replicas of the flaperon made of wood and steel rather than genuine Boeing 777 flaperons. The replica flaperons were not exactly the same shape and could not be made to float in precisely the same way as 9M-MRO’s recovered flaperon (Fig. 1.1). This lead to the suspicion that our model simulation of the flaperon’s trajectory was not as realistic as it might be. With help from colleagues at the National Transportation Safety Board (NTSB) of the US, a genuine flaperon was located in December 2016. This report documents cutting down that flaperon so that it matched photographs of 9M-MRO’s, tank testing to compare its buoyancy with that of 9M-MRO’s, drift testing near Hobart, re-running the drift model and analysis of simulated trajectories.
Fig. 1.1 The genuine and replica flaperons at sea in calm weather, having just been deployed (in an intrados-up orientation).
The conclusion in our earlier report that 9M-MRO is probably located in the proposed new search area was based in part on the model estimates of where potential debris items were not seen, which includes Australian shores as well as the large areas of ocean off Australia that were searched by aircraft and vessels. A criticism of our logic was that we focussed only on the low-windage items that eventually arrived on African shores. We have now analysed the trajectories of high-windage items as well, since the debris field almost certainly included these as well.
The search for MH370 and ocean surface drift – Part II | 1
2 Workshop and field work
2.1 Cutting down and tank testing a second-hand flaperon
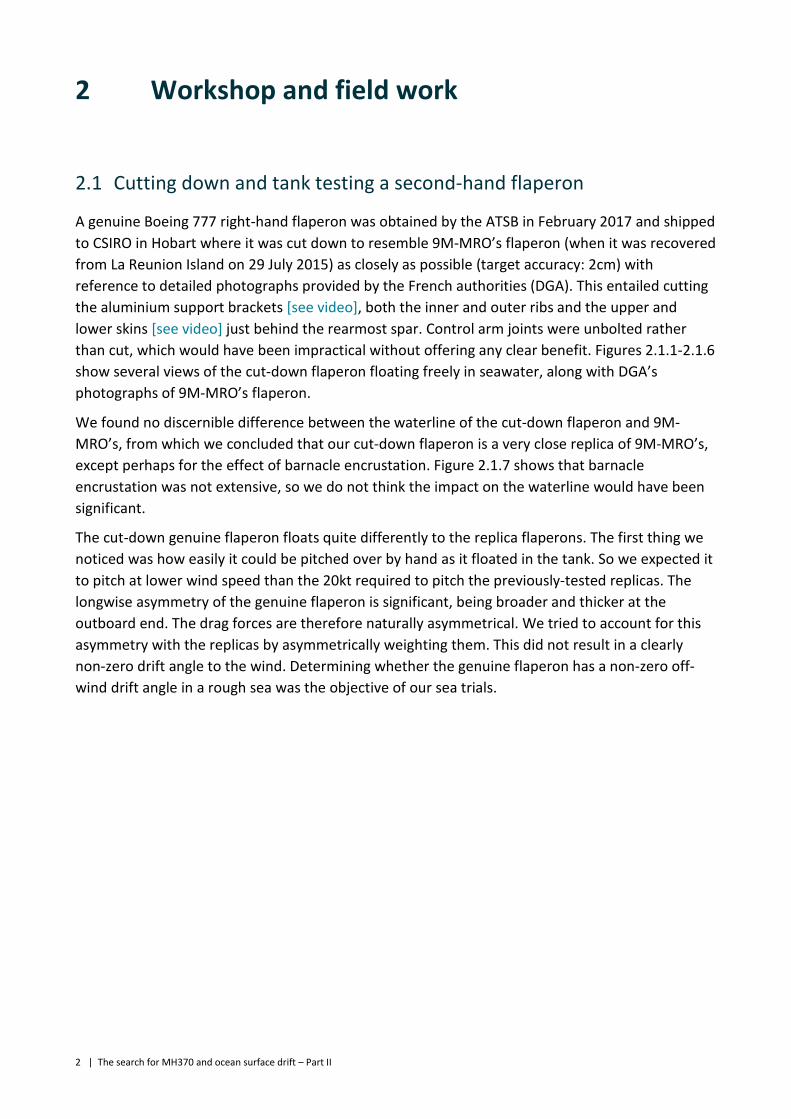
A genuine Boeing 777 right-hand flaperon was obtained by the ATSB in February 2017 and shipped to CSIRO in Hobart where it was cut down to resemble 9M-MRO’s flaperon (when it was recovered from La Reunion Island on 29 July 2015) as closely as possible (target accuracy: 2cm) with reference to detailed photographs provided by the French authorities (DGA). This entailed cutting the aluminium support brackets [see video], both the inner and outer ribs and the upper and lower skins [see video] just behind the rearmost spar. Control arm joints were unbolted rather than cut, which would have been impractical without offering any clear benefit. Figures 2.1.1-2.1.6 show several views of the cut-down flaperon floating freely in seawater, along with DGA’s photographs of 9M-MRO’s flaperon.
We found no discernible difference between the waterline of the cut-down flaperon and 9M-MRO’s, from which we concluded that our cut-down flaperon is a very close replica of 9M-MRO’s, except perhaps for the effect of barnacle encrustation. Figure 2.1.7 shows that barnacle encrustation was not extensive, so we do not think the impact on the waterline would have been significant.
The cut-down genuine flaperon floats quite differently to the replica flaperons. The first thing we noticed was how easily it could be pitched over by hand as it floated in the tank. So we expected it to pitch at lower wind speed than the 20kt required to pitch the previously-tested replicas. The longwise asymmetry of the genuine flaperon is significant, being broader and thicker at the outboard end. The drag forces are therefore naturally asymmetrical. We tried to account for this asymmetry with the replicas by asymmetrically weighting them. This did not result in a clearly non-zero drift angle to the wind. Determining whether the genuine flaperon has a non-zero off-wind drift angle in a rough sea was the objective of our sea trials.
2 | The search for MH370 and ocean surface drift – Part II
Fig. 2.1.1. Upper: 9M-MRO’s flaperon floating intrados up in seawater, seen from outboard (photo courtesy of DGA). Lower: our cut-down 777 flaperon. The string shows the waterline.
The search for MH370 and ocean surface drift – Part II | 3
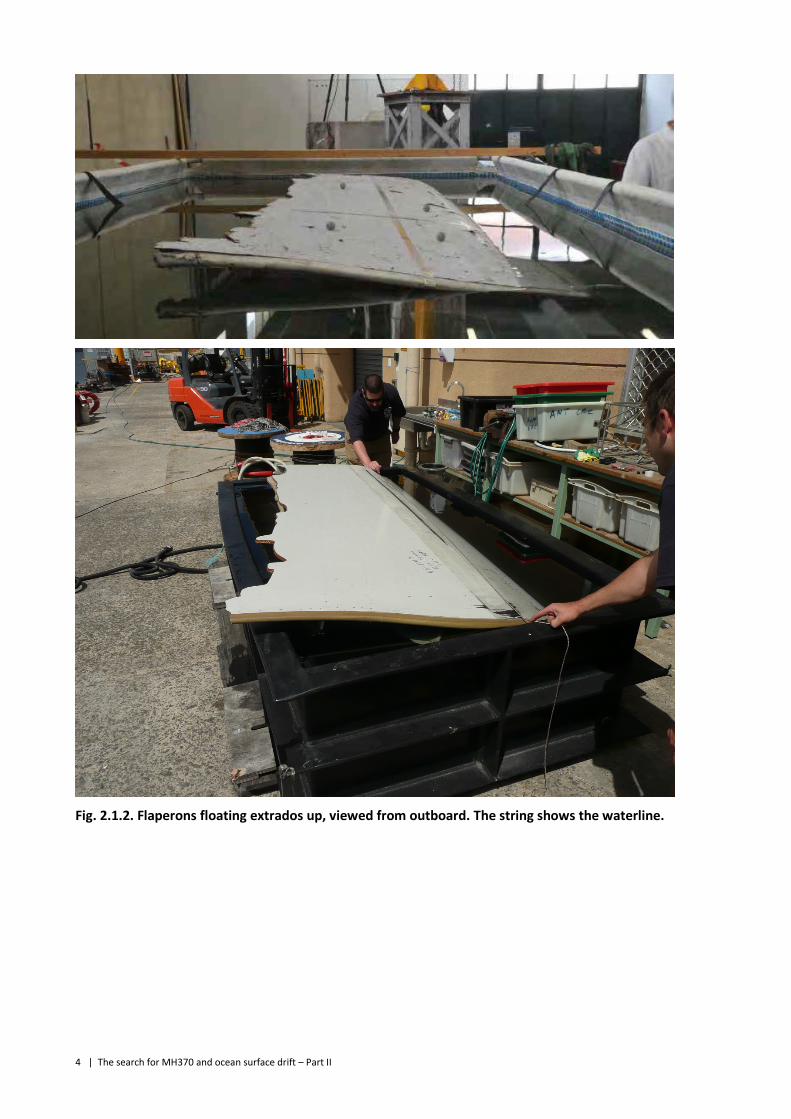
Fig. 2.1.2. Flaperons floating extrados up, viewed from outboard. The string shows the waterline.
4 | The search for MH370 and ocean surface drift – Part II
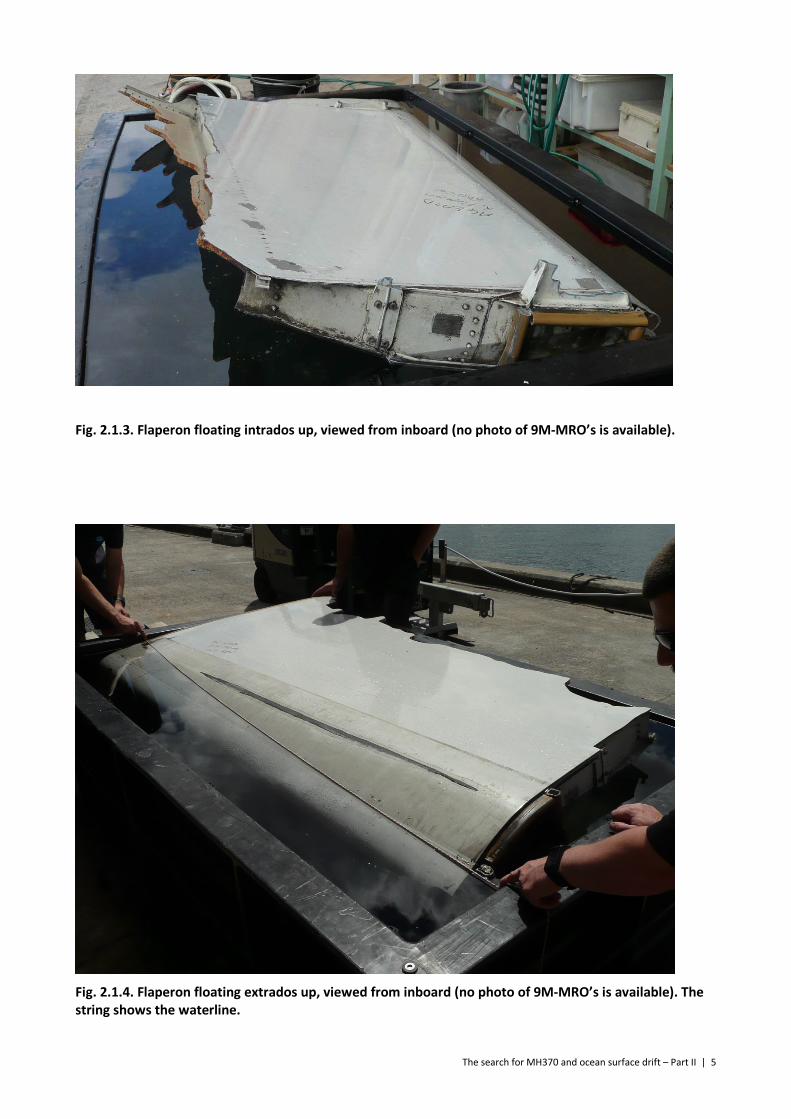
Fig. 2.1.3. Flaperon floating intrados up, viewed from inboard (no photo of 9M-MRO’s is available).
Fig. 2.1.4. Flaperon floating extrados up, viewed from inboard (no photo of 9M-MRO’s is available). The string shows the waterline.
The search for MH370 and ocean surface drift – Part II | 5
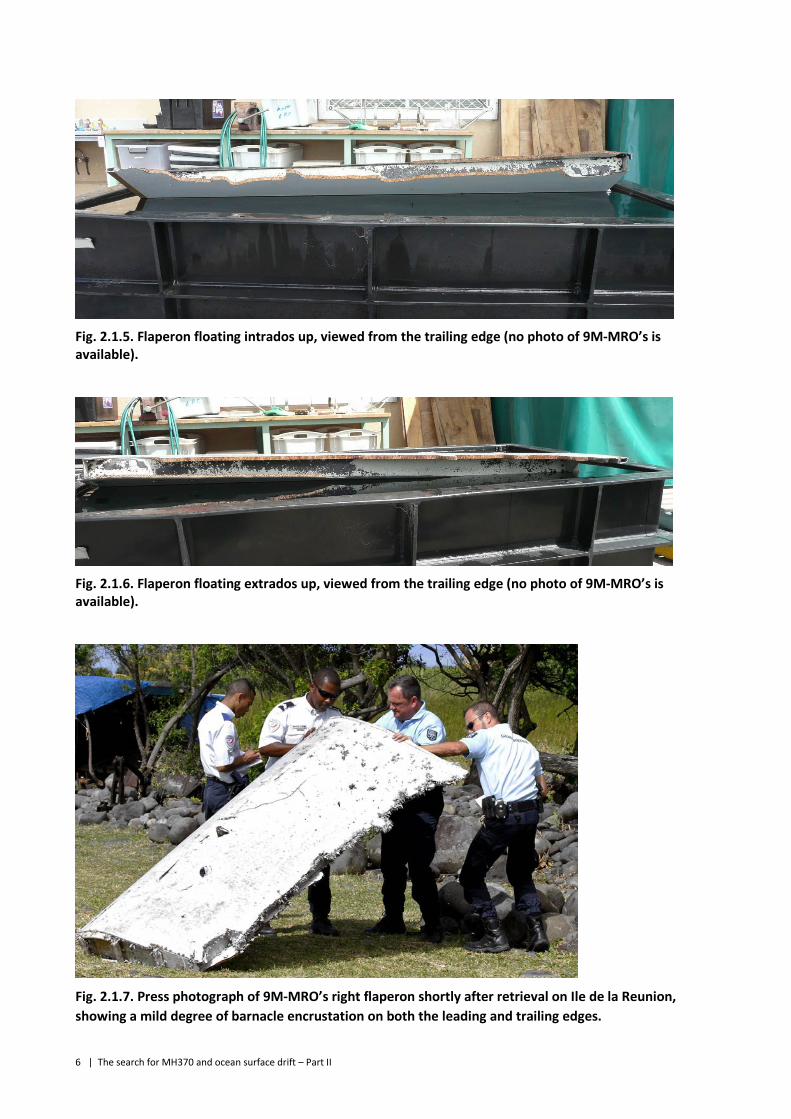
Fig. 2.1.5. Flaperon floating intrados up, viewed from the trailing edge (no photo of 9M-MRO’s is available).
Fig. 2.1.6. Flaperon floating extrados up, viewed from the trailing edge (no photo of 9M-MRO’s is available).
Fig. 2.1.7. Press photograph of 9M-MRO’s right flaperon shortly after retrieval on Ile de la Reunion, showing a mild degree of barnacle encrustation on both the leading and trailing edges.
6 | The search for MH370 and ocean surface drift – Part II
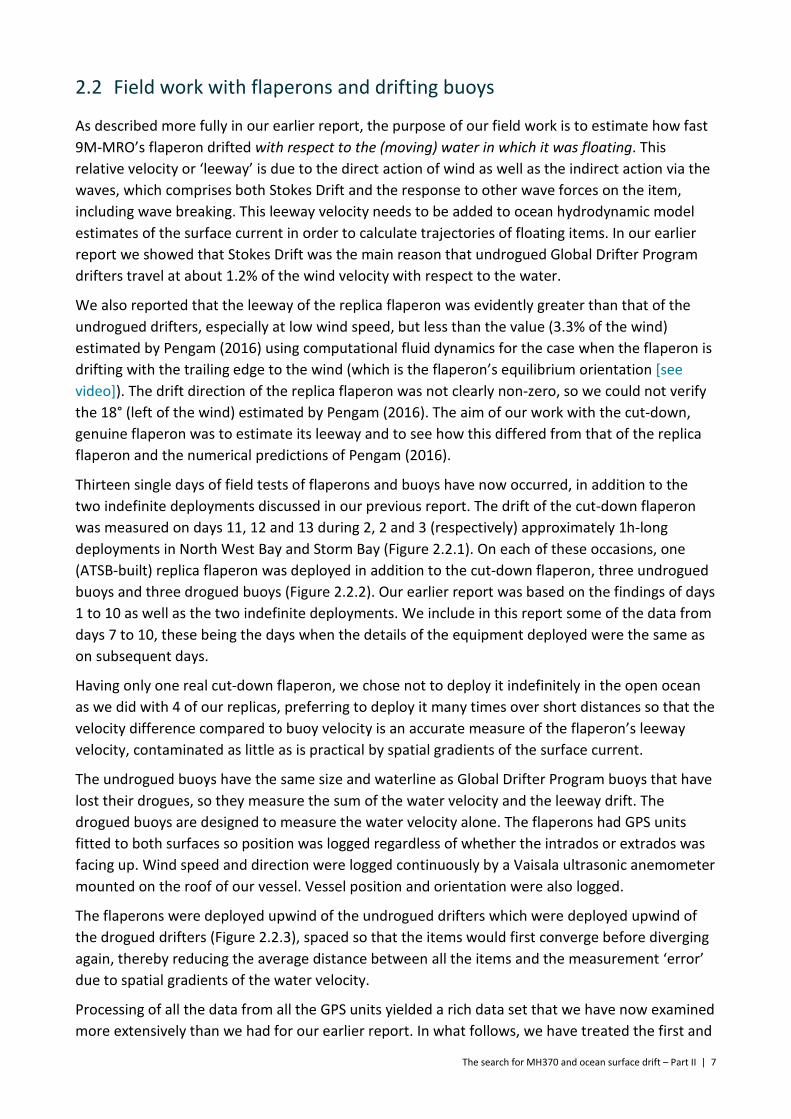
2.2 Field work with flaperons and drifting buoys
As described more fully in our earlier report, the purpose of our field work is to estimate how fast 9M-MRO’s flaperon drifted with respect to the (moving) water in which it was floating. This relative velocity or ‘leeway’ is due to the direct action of wind as well as the indirect action via the waves, which comprises both Stokes Drift and the response to other wave forces on the item, including wave breaking. This leeway velocity needs to be added to ocean hydrodynamic model estimates of the surface current in order to calculate trajectories of floating items. In our earlier report we showed that Stokes Drift was the main reason that undrogued Global Drifter Program drifters travel at about 1.2% of the wind velocity with respect to the water.
We also reported that the leeway of the replica flaperon was evidently greater than that of the undrogued drifters, especially at low wind speed, but less than the value (3.3% of the wind) estimated by Pengam (2016) using computational fluid dynamics for the case when the flaperon is drifting with the trailing edge to the wind (which is the flaperon’s equilibrium orientation [see video]). The drift direction of the replica flaperon was not clearly non-zero, so we could not verify the 18° (left of the wind) estimated by Pengam (2016). The aim of our work with the cut-down, genuine flaperon was to estimate its leeway and to see how this differed from that of the replica flaperon and the numerical predictions of Pengam (2016).
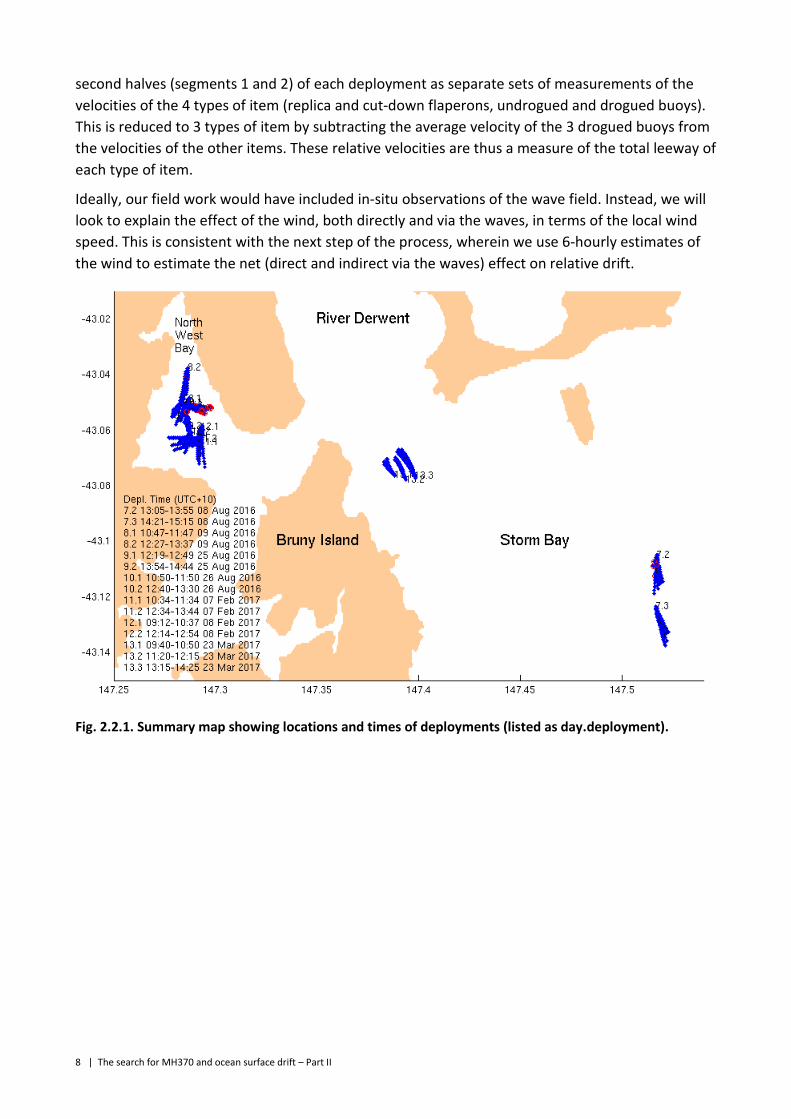
Thirteen single days of field tests of flaperons and buoys have now occurred, in addition to the two indefinite deployments discussed in our previous report. The drift of the cut-down flaperon was measured on days 11, 12 and 13 during 2, 2 and 3 (respectively) approximately 1h-long deployments in North West Bay and Storm Bay (Figure 2.2.1). On each of these occasions, one (ATSB-built) replica flaperon was deployed in addition to the cut-down flaperon, three undrogued buoys and three drogued buoys (Figure 2.2.2). Our earlier report was based on the findings of days 1 to 10 as well as the two indefinite deployments. We include in this report some of the data from days 7 to 10, these being the days when the details of the equipment deployed were the same as on subsequent days.
Having only one real cut-down flaperon, we chose not to deploy it indefinitely in the open ocean as we did with 4 of our replicas, preferring to deploy it many times over short distances so that the velocity difference compared to buoy velocity is an accurate measure of the flaperon’s leeway velocity, contaminated as little as is practical by spatial gradients of the surface current.
The undrogued buoys have the same size and waterline as Global Drifter Program buoys that have lost their drogues, so they measure the sum of the water velocity and the leeway drift. The drogued buoys are designed to measure the water velocity alone. The flaperons had GPS units fitted to both surfaces so position was logged regardless of whether the intrados or extrados was facing up. Wind speed and direction were logged continuously by a Vaisala ultrasonic anemometer mounted on the roof of our vessel. Vessel position and orientation were also logged.
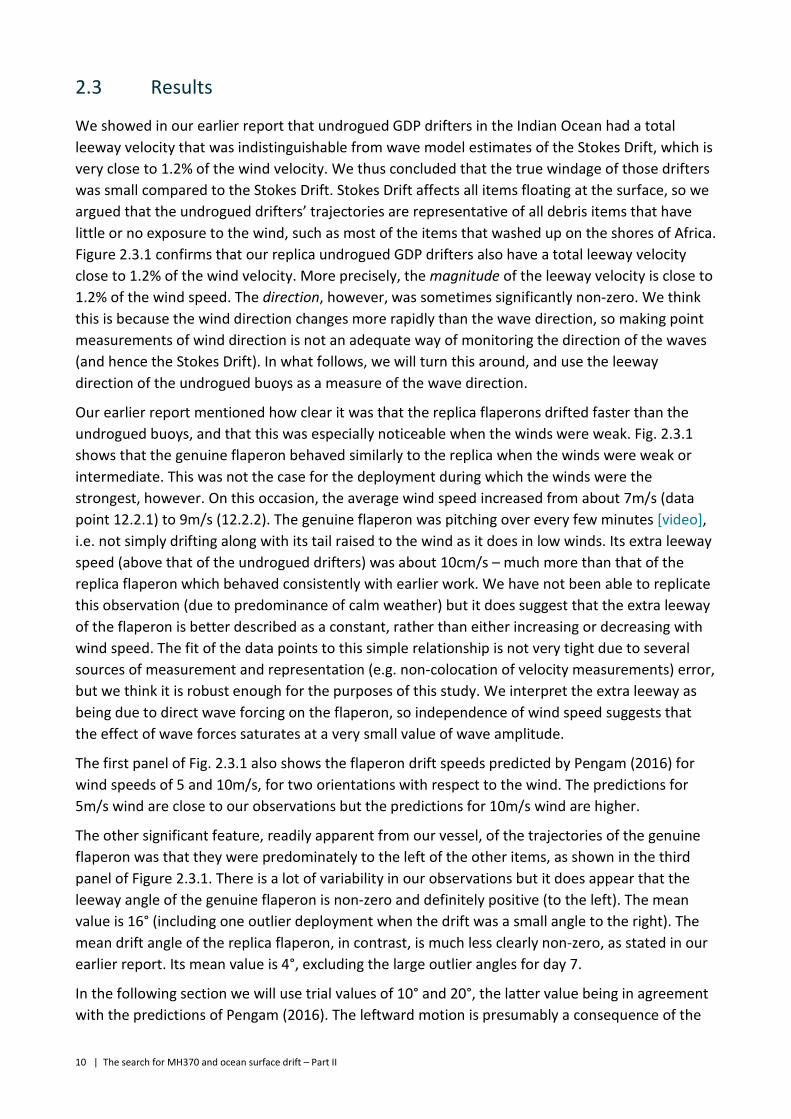
The flaperons were deployed upwind of the undrogued drifters which were deployed upwind of the drogued drifters (Figure 2.2.3), spaced so that the items would first converge before diverging again, thereby reducing the average distance between all the items and the measurement ‘error’ due to spatial gradients of the water velocity.
Processing of all the data from all the GPS units yielded a rich data set that we have now examined more extensively than we had for our earlier report. In what follows, we have treated the first and
The search for MH370 and ocean surface drift – Part II | 7
second halves (segments 1 and 2) of each deployment as separate sets of measurements of the velocities of the 4 types of item (replica and cut-down flaperons, undrogued and drogued buoys). This is reduced to 3 types of item by subtracting the average velocity of the 3 drogued buoys from the velocities of the other items. These relative velocities are thus a measure of the total leeway of each type of item.
Ideally, our field work would have included in-situ observations of the wave field. Instead, we will look to explain the effect of the wind, both directly and via the waves, in terms of the local wind speed. This is consistent with the next step of the process, wherein we use 6-hourly estimates of the wind to estimate the net (direct and indirect via the waves) effect on relative drift.
Fig. 2.2.1. Summary map showing locations and times of deployments (listed as day.deployment).
8 | The search for MH370 and ocean surface drift – Part II
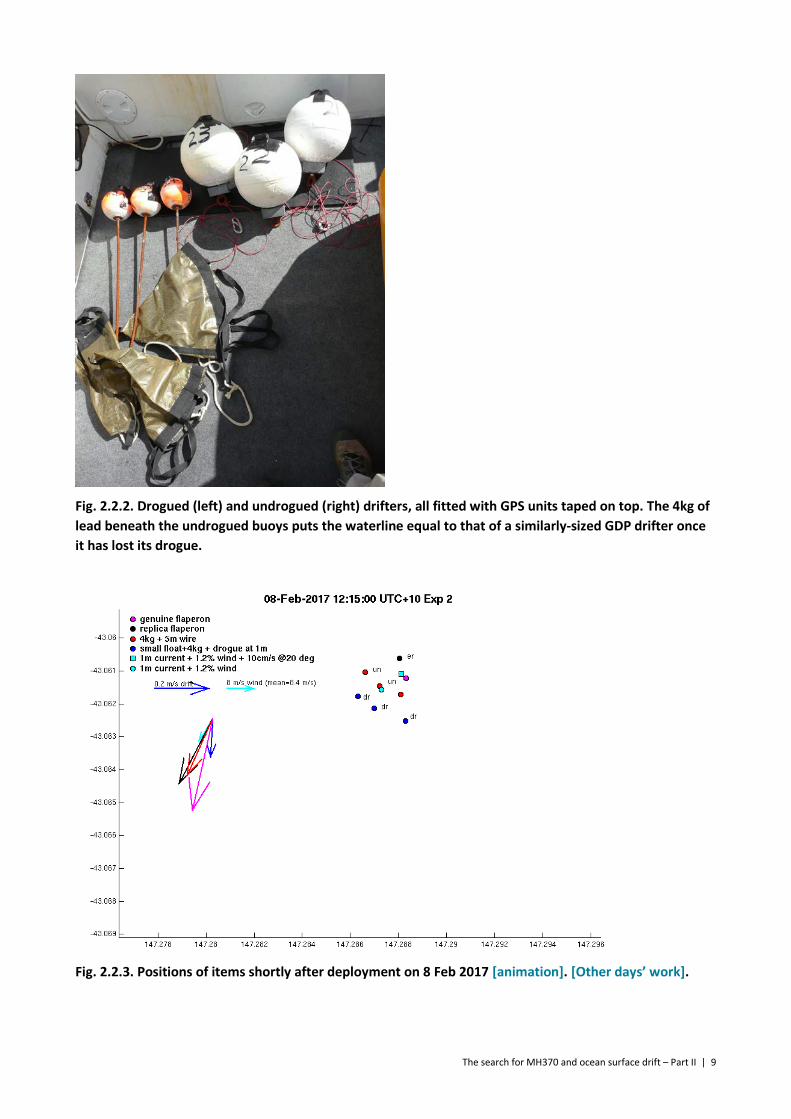
Fig. 2.2.2. Drogued (left) and undrogued (right) drifters, all fitted with GPS units taped on top. The 4kg of lead beneath the undrogued buoys puts the waterline equal to that of a similarly-sized GDP drifter once it has lost its drogue.
Fig. 2.2.3. Positions of items shortly after deployment on 8 Feb 2017 [animation]. [Other days’ work].
The search for MH370 and ocean surface drift – Part II | 9
2.3 Results
We showed in our earlier report that undrogued GDP drifters in the Indian Ocean had a total leeway velocity that was indistinguishable from wave model estimates of the Stokes Drift, which is very close to 1.2% of the wind velocity. We thus concluded that the true windage of those drifters was small compared to the Stokes Drift. Stokes Drift affects all items floating at the surface, so we argued that the undrogued drifters’ trajectories are representative of all debris items that have little or no exposure to the wind, such as most of the items that washed up on the shores of Africa. Figure 2.3.1 confirms that our replica undrogued GDP drifters also have a total leeway velocity close to 1.2% of the wind velocity. More precisely, the magnitude of the leeway velocity is close to 1.2% of the wind speed. The direction, however, was sometimes significantly non-zero. We think this is because the wind direction changes more rapidly than the wave direction, so making point measurements of wind direction is not an adequate way of monitoring the direction of the waves (and hence the Stokes Drift). In what follows, we will turn this around, and use the leeway direction of the undrogued buoys as a measure of the wave direction.
Our earlier report mentioned how clear it was that the replica flaperons drifted faster than the undrogued buoys, and that this was especially noticeable when the winds were weak. Fig. 2.3.1 shows that the genuine flaperon behaved similarly to the replica when the winds were weak or intermediate. This was not the case for the deployment during which the winds were the strongest, however. On this occasion, the average wind speed increased from about 7m/s (data point 12.2.1) to 9m/s (12.2.2). The genuine flaperon was pitching over every few minutes [video], i.e. not simply drifting along with its tail raised to the wind as it does in low winds. Its extra leeway speed (above that of the undrogued drifters) was about 10cm/s – much more than that of the replica flaperon which behaved consistently with earlier work. We have not been able to replicate this observation (due to predominance of calm weather) but it does suggest that the extra leeway of the flaperon is better described as a constant, rather than either increasing or decreasing with wind speed. The fit of the data points to this simple relationship is not very tight due to several sources of measurement and representation (e.g. non-colocation of velocity measurements) error, but we think it is robust enough for the purposes of this study. We interpret the extra leeway as being due to direct wave forcing on the flaperon, so independence of wind speed suggests that the effect of wave forces saturates at a very small value of wave amplitude.
The first panel of Fig. 2.3.1 also shows the flaperon drift speeds predicted by Pengam (2016) for wind speeds of 5 and 10m/s, for two orientations with respect to the wind. The predictions for 5m/s wind are close to our observations but the predictions for 10m/s wind are higher.
The other significant feature, readily apparent from our vessel, of the trajectories of the genuine flaperon was that they were predominately to the left of the other items, as shown in the third panel of Figure 2.3.1. There is a lot of variability in our observations but it does appear that the leeway angle of the genuine flaperon is non-zero and definitely positive (to the left). The mean value is 16° (including one outlier deployment when the drift was a small angle to the right). The mean drift angle of the replica flaperon, in contrast, is much less clearly non-zero, as stated in our earlier report. Its mean value is 4°, excluding the large outlier angles for day 7.
In the following section we will use trial values of 10° and 20°, the latter value being in agreement with the predictions of Pengam (2016). The leftward motion is presumably a consequence of the
10 | The search for MH370 and ocean surface drift – Part II
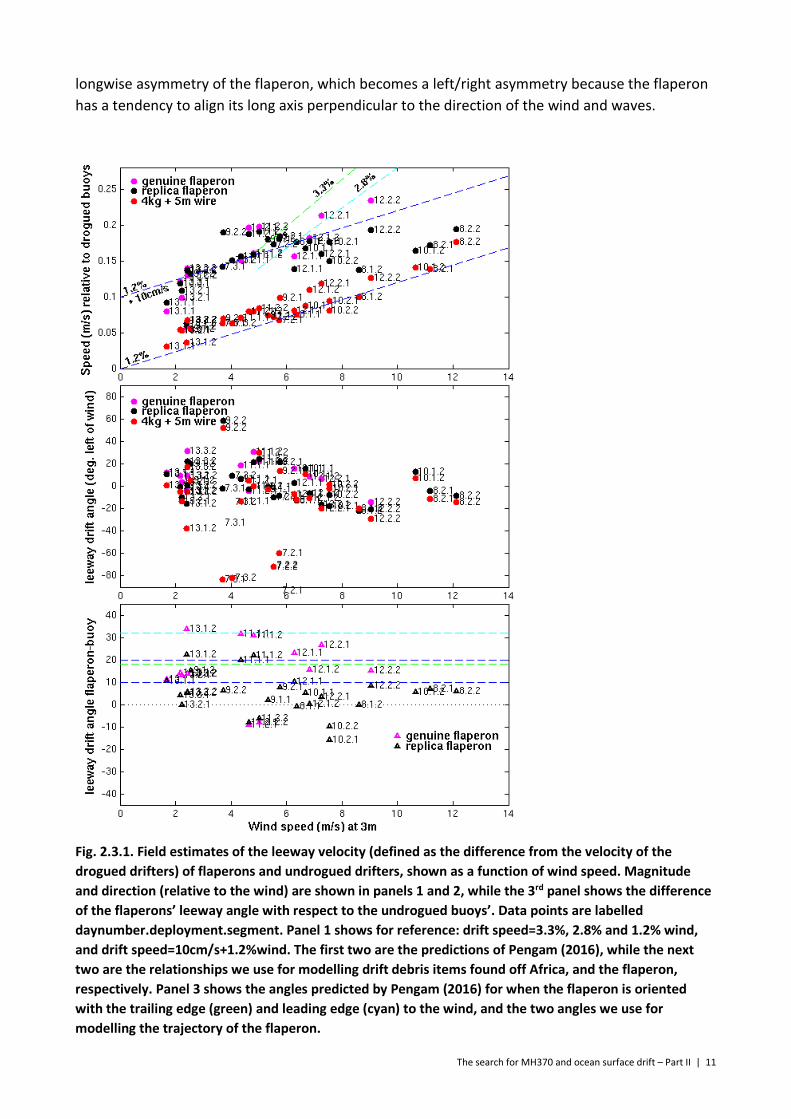
longwise asymmetry of the flaperon, which becomes a left/right asymmetry because the flaperon has a tendency to align its long axis perpendicular to the direction of the wind and waves.
Fig. 2.3.1. Field estimates of the leeway velocity (defined as the difference from the velocity of the drogued drifters) of flaperons and undrogued drifters, shown as a function of wind speed. Magnitude and direction (relative to the wind) are shown in panels 1 and 2, while the 3rd panel shows the difference of the flaperons’ leeway angle with respect to the undrogued buoys’. Data points are labelled daynumber.deployment.segment. Panel 1 shows for reference: drift speed=3.3%, 2.8% and 1.2% wind, and drift speed=10cm/s+1.2%wind. The first two are the predictions of Pengam (2016), while the next two are the relationships we use for modelling drift debris items found off Africa, and the flaperon, respectively. Panel 3 shows the angles predicted by Pengam (2016) for when the flaperon is oriented with the trailing edge (green) and leading edge (cyan) to the wind, and the two angles we use for modelling the trajectory of the flaperon.
The search for MH370 and ocean surface drift – Part II | 11
3 Revised estimates of the flaperon’s potential trajectories across the Indian Ocean
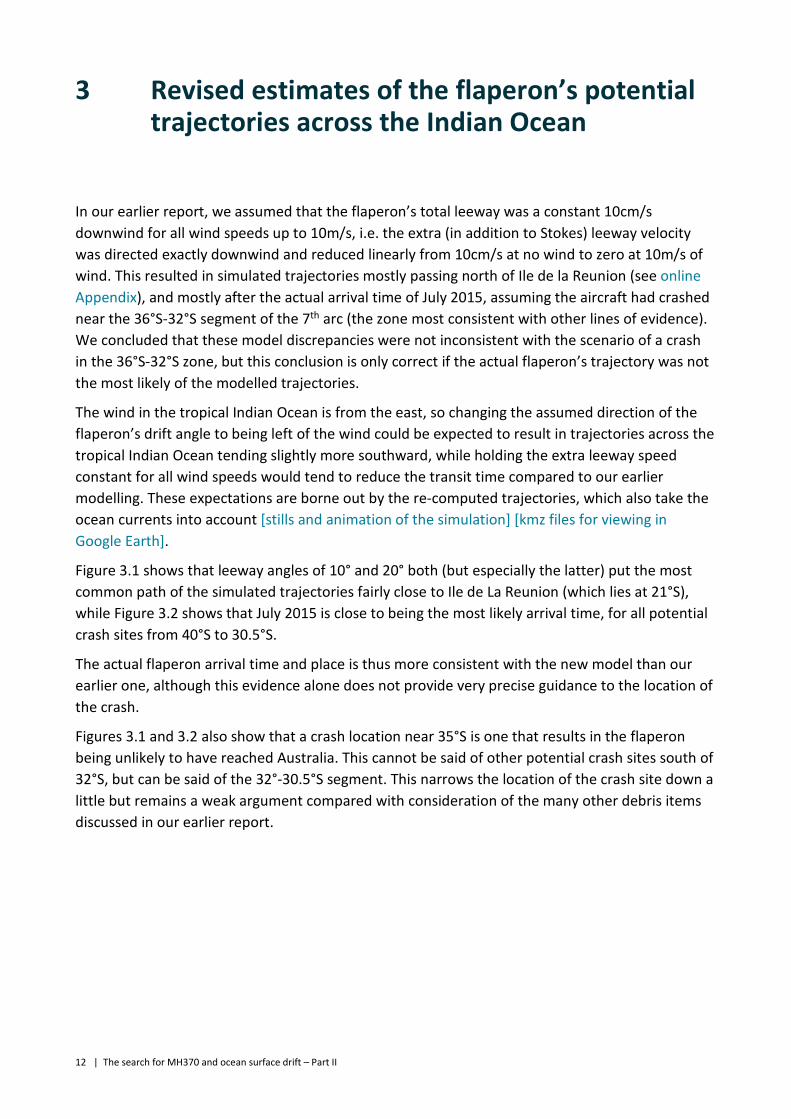
In our earlier report, we assumed that the flaperon’s total leeway was a constant 10cm/s downwind for all wind speeds up to 10m/s, i.e. the extra (in addition to Stokes) leeway velocity was directed exactly downwind and reduced linearly from 10cm/s at no wind to zero at 10m/s of wind. This resulted in simulated trajectories mostly passing north of Ile de la Reunion (see online Appendix), and mostly after the actual arrival time of July 2015, assuming the aircraft had crashed near the 36°S-32°S segment of the 7th arc (the zone most consistent with other lines of evidence). We concluded that these model discrepancies were not inconsistent with the scenario of a crash in the 36°S-32°S zone, but this conclusion is only correct if the actual flaperon’s trajectory was not the most likely of the modelled trajectories.
The wind in the tropical Indian Ocean is from the east, so changing the assumed direction of the flaperon’s drift angle to being left of the wind could be expected to result in trajectories across the tropical Indian Ocean tending slightly more southward, while holding the extra leeway speed constant for all wind speeds would tend to reduce the transit time compared to our earlier modelling. These expectations are borne out by the re-computed trajectories, which also take the ocean currents into account [stills and animation of the simulation] [kmz files for viewing in Google Earth].
Figure 3.1 shows that leeway angles of 10° and 20° both (but especially the latter) put the most common path of the simulated trajectories fairly close to Ile de La Reunion (which lies at 21°S), while Figure 3.2 shows that July 2015 is close to being the most likely arrival time, for all potential crash sites from 40°S to 30.5°S.
The actual flaperon arrival time and place is thus more consistent with the new model than our earlier one, although this evidence alone does not provide very precise guidance to the location of the crash.
Figures 3.1 and 3.2 also show that a crash location near 35°S is one that results in the flaperon being unlikely to have reached Australia. This cannot be said of other potential crash sites south of 32°S, but can be said of the 32°-30.5°S segment. This narrows the location of the crash site down a little but remains a weak argument compared with consideration of the many other debris items discussed in our earlier report.
12 | The search for MH370 and ocean surface drift – Part II
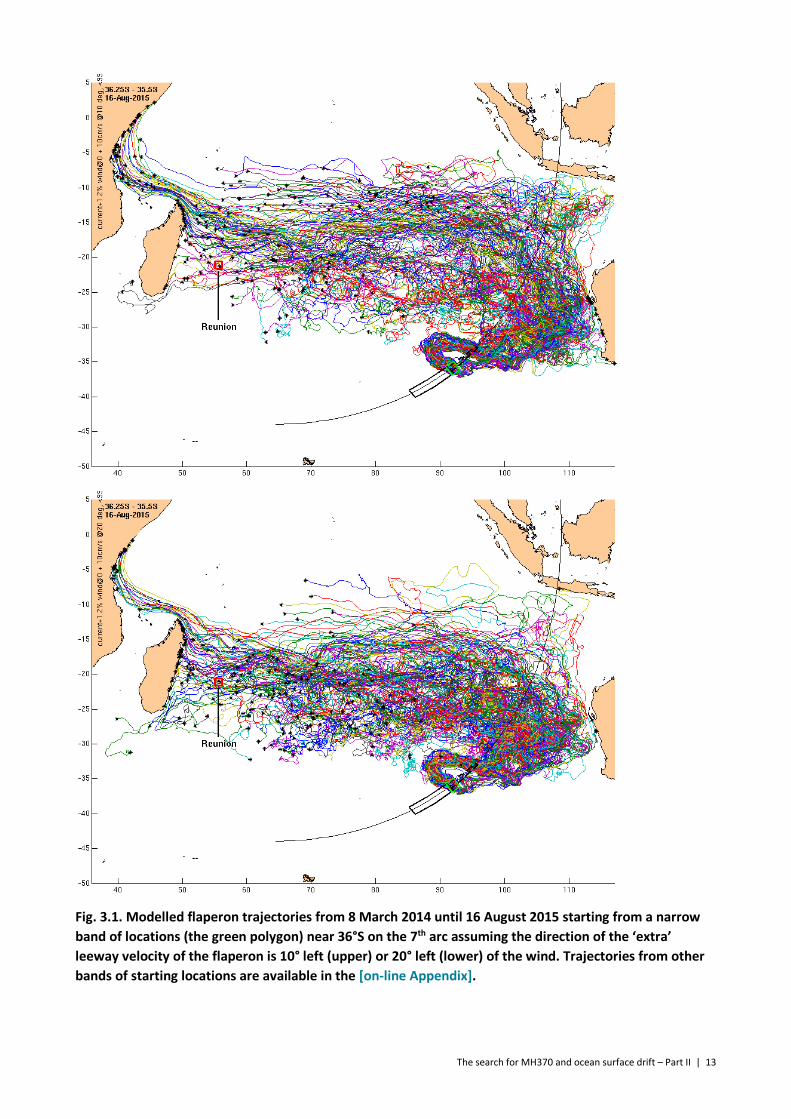
Fig. 3.1. Modelled flaperon trajectories from 8 March 2014 until 16 August 2015 starting from a narrow band of locations (the green polygon) near 36°S on the 7th arc assuming the direction of the ‘extra’ leeway velocity of the flaperon is 10° left (upper) or 20° left (lower) of the wind. Trajectories from other bands of starting locations are available in the [on-line Appendix].
The search for MH370 and ocean surface drift – Part II | 13
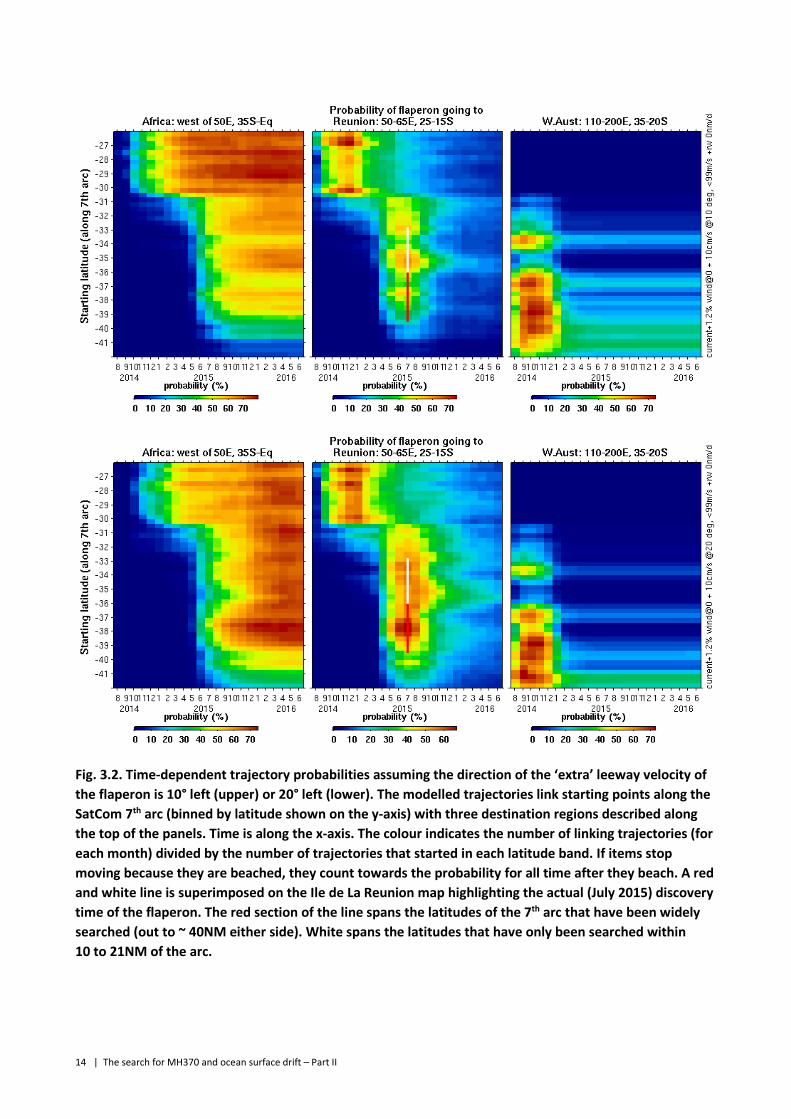
Fig. 3.2. Time-dependent trajectory probabilities assuming the direction of the ‘extra’ leeway velocity of the flaperon is 10° left (upper) or 20° left (lower). The modelled trajectories link starting points along the SatCom 7th arc (binned by latitude shown on the y-axis) with three destination regions described along the top of the panels. Time is along the x-axis. The colour indicates the number of linking trajectories (for each month) divided by the number of trajectories that started in each latitude band. If items stop moving because they are beached, they count towards the probability for all time after they beach. A red and white line is superimposed on the Ile de La Reunion map highlighting the actual (July 2015) discovery time of the flaperon. The red section of the line spans the latitudes of the 7th arc that have been widely searched (out to ~ 40NM either side). White spans the latitudes that have only been searched within 10 to 21NM of the arc.
14 | The search for MH370 and ocean surface drift – Part II
4 High-windage items
In our earlier report, we argued that the absence of debris findings on Australian shores, and failure of the aerial search off Western Australia to find any of the debris items that subsequently arrived off Africa, could be used to narrow down the location of the crash. To do this we identified crash sites that the model predicts to be consistent with those outcomes. That work only considered trajectories of the items that drifted similarly to the ones that were later found. Here, we have also considered the trajectories of items with greater exposure to the wind, that were also quite likely to have been part of the debris field, but have not been located, possibly because they became water-logged with time and sank. We have characterised these ‘high windage’ items as having a windage coefficient of 3%, a value commonly used for small buoyant items such as seat cushions.
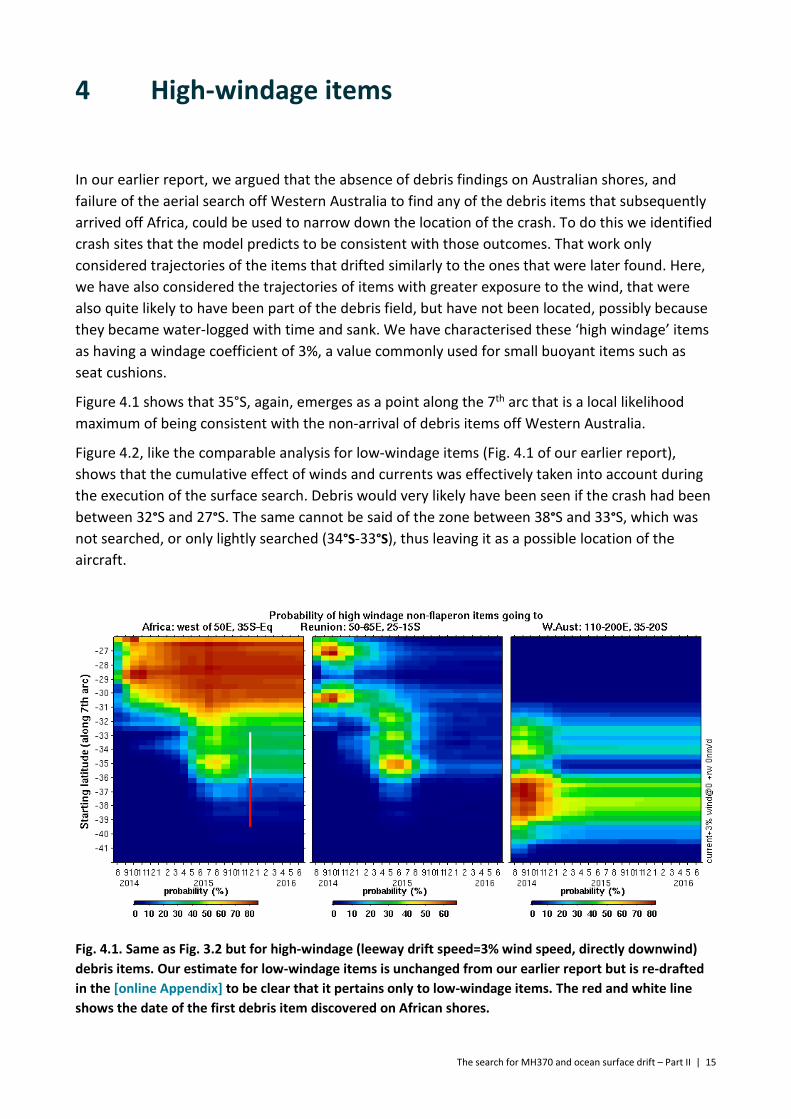
Figure 4.1 shows that 35°S, again, emerges as a point along the 7th arc that is a local likelihood maximum of being consistent with the non-arrival of debris items off Western Australia.
Figure 4.2, like the comparable analysis for low-windage items (Fig. 4.1 of our earlier report), shows that the cumulative effect of winds and currents was effectively taken into account during the execution of the surface search. Debris would very likely have been seen if the crash had been between 32°S and 27°S. The same cannot be said of the zone between 38°S and 33°S, which was not searched, or only lightly searched (34°S-33°S), thus leaving it as a possible location of the aircraft.
Fig. 4.1. Same as Fig. 3.2 but for high-windage (leeway drift speed=3% wind speed, directly downwind) debris items. Our estimate for low-windage items is unchanged from our earlier report but is re-drafted in the [online Appendix] to be clear that it pertains only to low-windage items. The red and white line shows the date of the first debris item discovered on African shores.
The search for MH370 and ocean surface drift – Part II | 15
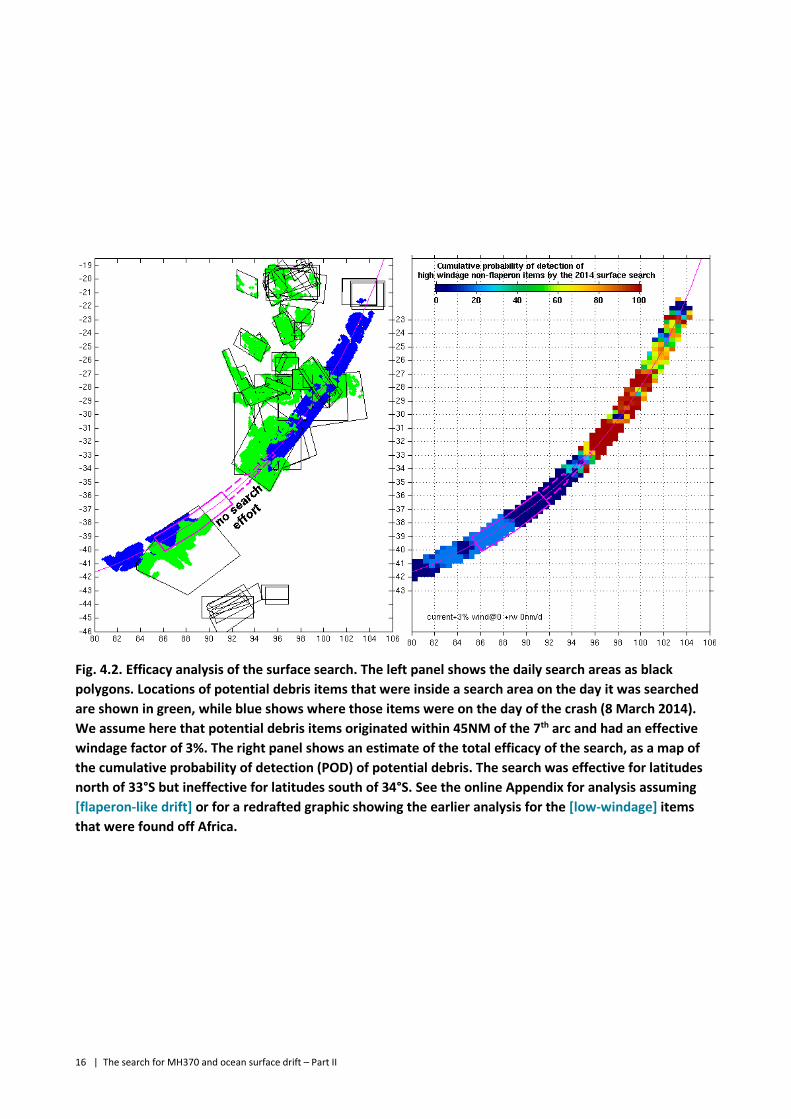
Fig. 4.2. Efficacy analysis of the surface search. The left panel shows the daily search areas as black polygons. Locations of potential debris items that were inside a search area on the day it was searched are shown in green, while blue shows where those items were on the day of the crash (8 March 2014). We assume here that potential debris items originated within 45NM of the 7th arc and had an effective windage factor of 3%. The right panel shows an estimate of the total efficacy of the search, as a map of the cumulative probability of detection (POD) of potential debris. The search was effective for latitudes north of 33°S but ineffective for latitudes south of 34°S. See the online Appendix for analysis assuming [flaperon-like drift] or for a redrafted graphic showing the earlier analysis for the [low-windage] items that were found off Africa.
16 | The search for MH370 and ocean surface drift – Part II
5 Conclusion
Field testing of a genuine B777 flaperon, cut down to match photographs of 9M-MRO’s, revealed fairly strong evidence that it drifts at a non-zero angle to the wind (between 0 and 30° left), in broad agreement with numerical predictions (18° or 28° depending on orientation) by Pengam (2016), and in contrast with earlier testing of replica flaperons. The genuine flaperon also drifted faster than the replica flaperon under high-wind conditions, as we had anticipated it might.
Modelling the flaperon’s drift as being 20° left of the wind, and 10cm/s in excess of the Stokes Drift, is very consistent with the July 2015 arrival time of the flaperon at La Reunion. But this is true for all potential crash locations between 40°S and 30.5°S, showing that the arrival time at La Reunion of a single item is, unfortunately, not a precise guide to the location of the crash.
The value of this revised estimate of the flaperon’s drift parameters is that it increases our confidence in the accuracy of the drift model. The earlier simulations of the flaperon trajectory were only consistent with the arrival of the flaperon at La Reunion if a chance encounter with an ocean eddy took the flaperon south. That was plausible but not particularly likely.
Our earlier report argued that it was where debris was not found that is the key to identifying a fairly precise location of the crash. This aspect of the earlier work is unchanged, other than being reinforced by also considering the trajectories of high-windage items that were probably also within the debris field (our earlier work considered only items that drifted at the same speed as items that were confirmed to have been part of the debris field).
In summary, our conclusions with respect to the location of the aircraft are unchanged. The only thing that our recent work changes is our confidence in the accuracy of the estimated location, which is within the new search area identified and recommended by the First Principles Review (ATSB2016), and most likely at the southern end of that, near 35°S.
The search for MH370 and ocean surface drift – Part II | 17
Glossary
7th arc. The curved line defined by a set of points that are all equidistant from the Inmarsat satellite via which 9M-MRO was in communication with a satellite ground station. This distance is inferred from the Burst Timing Offset associated with the 7th communication since losing contact with traffic controllers. For more detail, see ATSB 2015.
9M-MRO. The designation of the particular Boeing 777 aircraft operating Malaysia Airlines Flight MH-370 on 8 March 2014.
Extrados. The upper surface of a wing (the Intrados is the lower surface).
Flaperon. A flight control surface on the trailing edge of an aircraft wing that combines the functions of both flaps and ailerons. The flaperons are primarily used to improve stability during low-speed take-off and landing flight phases. The Boeing 777-200 flaperon is constructed from a lightweight composite structure that floats in water.
GDP. Global Drifter Program, housed at the US National Oceanic and Atmospheric Administration Atlantic Oceanographic and Meteorological Laboratory (NOAA AOML). FFI see http://www.aoml.noaa.gov/phod/dac/gdp_information.php
NM. Nautical mile. Equivalent to one minute of latitude, or 1.85km.
SatCom. Satellite communication between the aircraft and ground stations via an Inmarsat satellite. In the present case, this refers to system-initiated handshake signals, but no transmission of any user or engineering data.
SVP drifter. Surface Velocity Program drifter. These are used by the GDP. In this document we call these ‘GDP drifters’.
Stokes Drift. Movement in the direction of waves due to the fact that the orbital velocity of a parcel of water, due to the passage of a wave, is not a closed ellipse.
Windage. Strictly speaking, this is defined as the wind-driven motion with respect to the water of a floating object, due to the force of the wind on the object. More commonly, it is taken to be the wind-driven motion with respect to specific measure of the surface velocity. If that measure does not include the Stokes Drift or other wind-related quantities, then the windage factor (ratio of windage to wind speed) will be a measure of them too.
18 | The search for MH370 and ocean surface drift – Part II
References
ATSB (2016) MH370 – First Principles Review Report. ATSB, 20 December 2016.
Griffin DA, Oke PR, Jones EM (2016) The search for MH370 and ocean surface drift. CSIRO Oceans and Atmosphere, Australia. Report number EP167888. 8 December 2016. DOI: 10.4225/08/5892224dec08c
Pengam (2016) Simulations de polaires aerodynamiques et hydrodynamics (Lot 2) in Essai de flottabilite pour DGA TA. Direction Generale de l’Armement. DGA Techniques hydrodynamics. No 16-500-560 DT/DGA TH/SDT/UP_PERF du 1/4/2016.
The search for MH370 and ocean surface drift – Part II | 19

CONTACT US t 1300 363 400 +61 3 9545 2176 e [email protected] w www.csiro.au
AT CSIRO, WE DO THE EXTRAORDINARY EVERY DAY We innovate for tomorrow and help improve today – for our customers, all Australians and the world. Our innovations contribute billions of dollars to the Australian economy every year. As the largest patent holder in the nation, our vast wealth of intellectual property has led to more than 150 spin-off companies. With more than 5,000 experts and a burning desire to get things done, we are Australia’s catalyst for innovation. CSIRO. WE IMAGINE. WE COLLABORATE. WE INNOVATE.
FOR FURTHER INFORMATION CSIRO Oceans and Atmosphere David Griffin t +61 3 6232 5244 e [email protected] w www.csiro.au
20 | The search for MH370 and ocean surface drift – Part II


![MH370 & The Bayes Theory [autosaved]](https://img.pdfslide.us/doc/110x75/53ea7b2d8d7f7289708b5119/mh370-the-bayes-theory-autosaved.jpg)