Embed Size (px)
Citation preview

The SA Economy and
Lessons from Africa
Presented by:Dawie Roodt30 October 2006

Real Economy
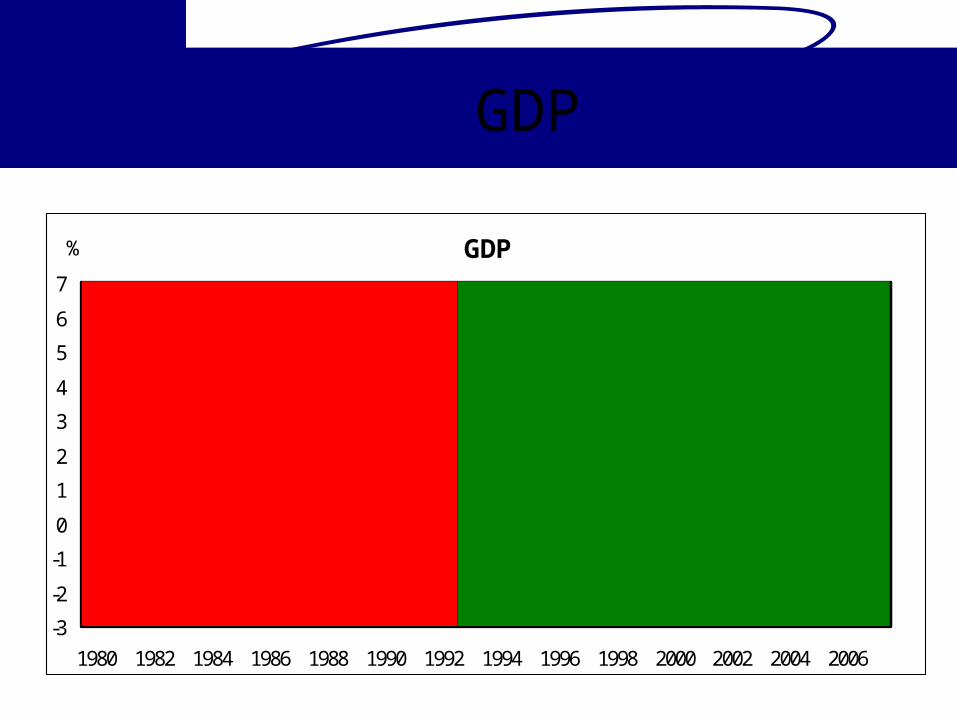
GDP
GDP
-3
-2
-1
0
1
2
3
4
5
6
7
1980 1982 1984 1986 1988 1990 1992 1994 1996 1998 2000 2002 2004 2006
%
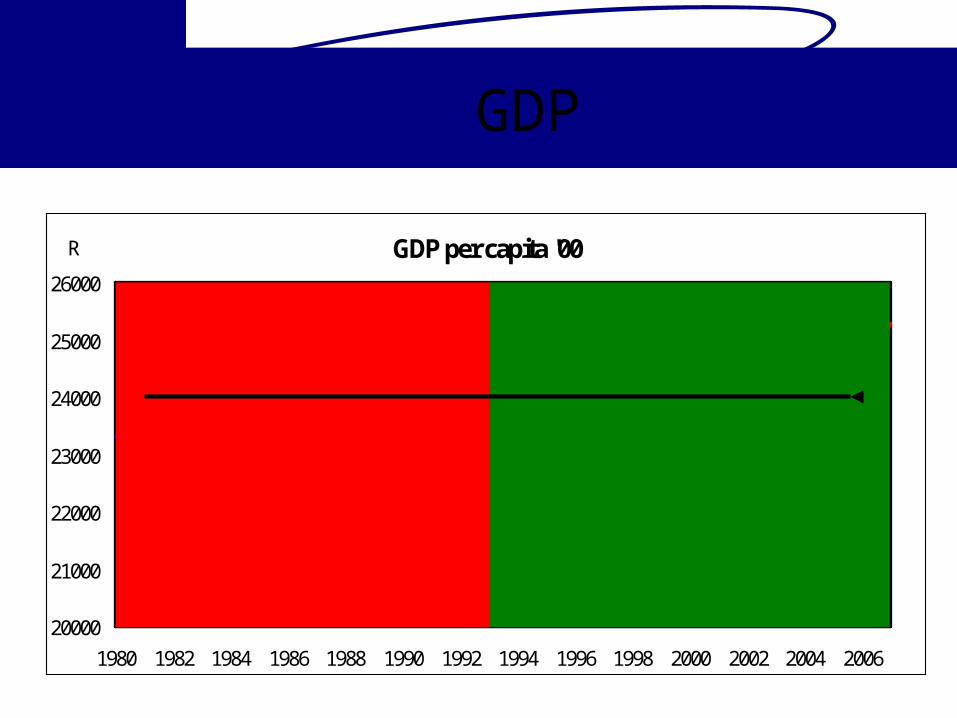
GDP
GDP per capita '00
20000
21000
22000
23000
24000
25000
26000
1980 1982 1984 1986 1988 1990 1992 1994 1996 1998 2000 2002 2004 2006
R
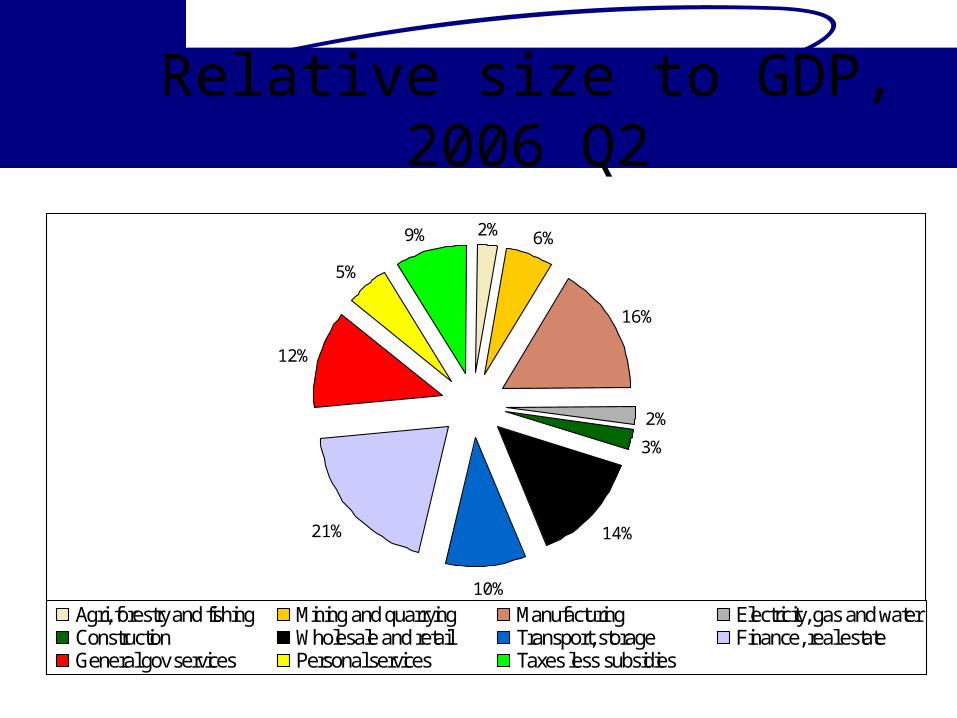
Relative size to GDP, 2006 Q2
2% 6%
16%
2%
3%
14%
10%
21%
12%
5%
9%
Agri, forestry and fishing Mining and quarrying Manufacturing Electricity, gas and waterConstruction Wholesale and retail Transport, storage Finance, real estate General gov services Personal services Taxes less subsidies

Fiscal Policy
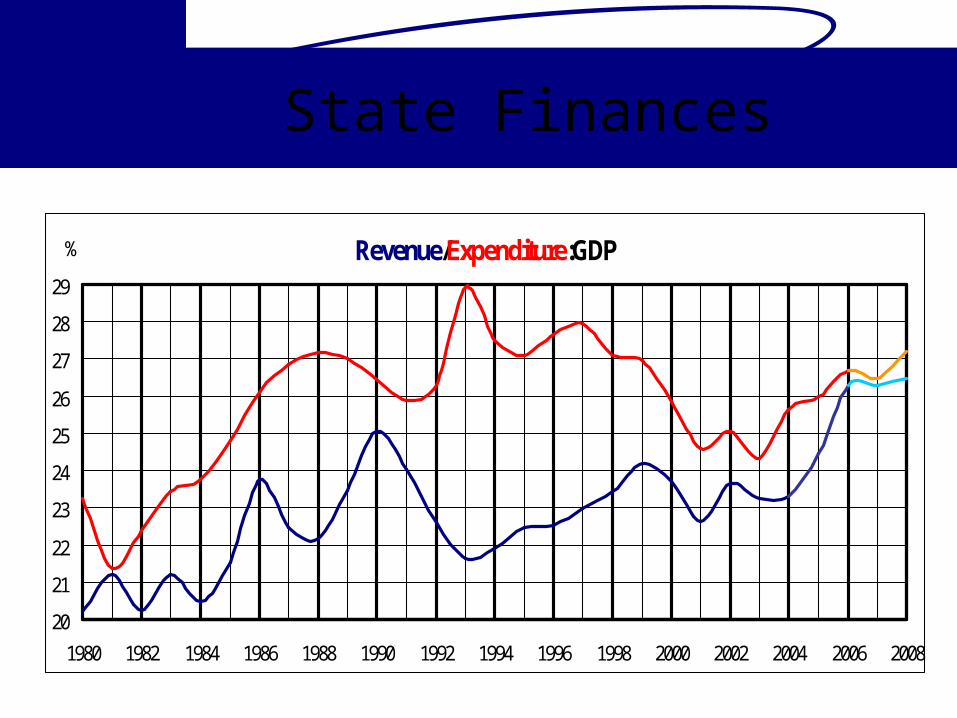
State Finances
Revenue/Expenditure:GDP
20
21
22
23
24
25
26
27
28
29
1980 1982 1984 1986 1988 1990 1992 1994 1996 1998 2000 2002 2004 2006 2008
%
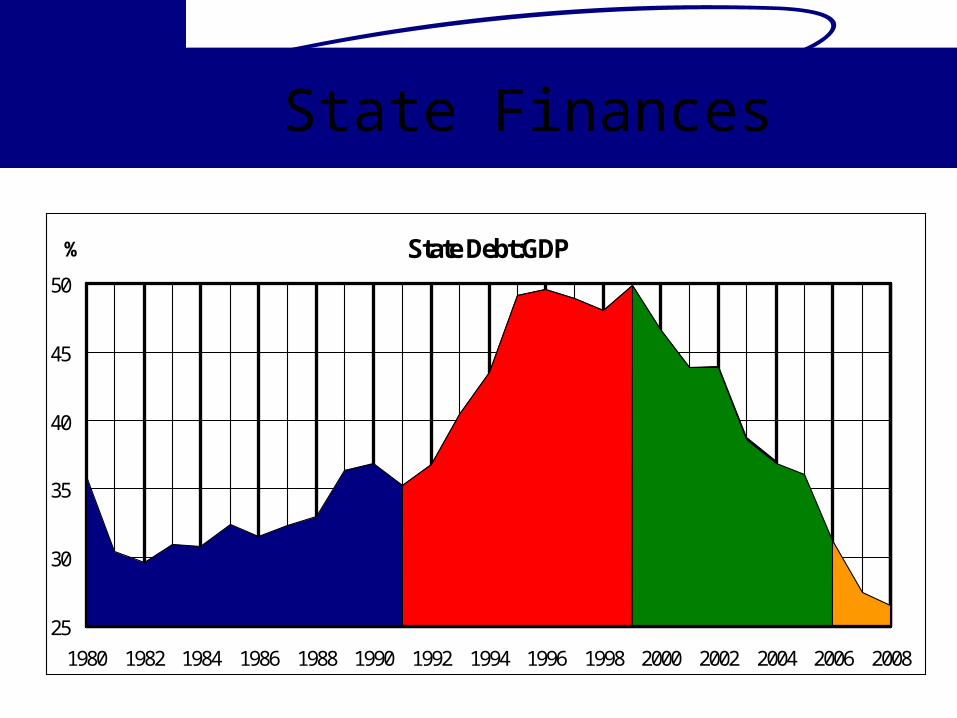
State Finances
State Debt:GDP
25
30
35
40
45
50
1980 1982 1984 1986 1988 1990 1992 1994 1996 1998 2000 2002 2004 2006 2008
%
Debt trapRecovery
Normal Normal

Monetary Policy
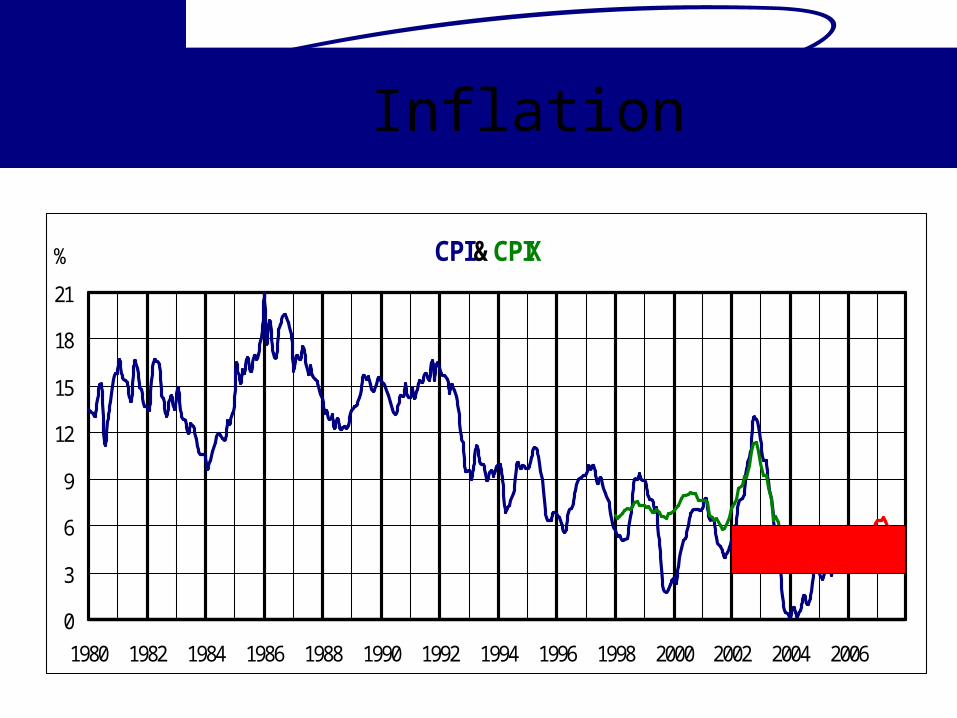
Inflation
CPI & CPIX
0
3
6
9
12
15
18
21
1980 1982 1984 1986 1988 1990 1992 1994 1996 1998 2000 2002 2004 2006
%
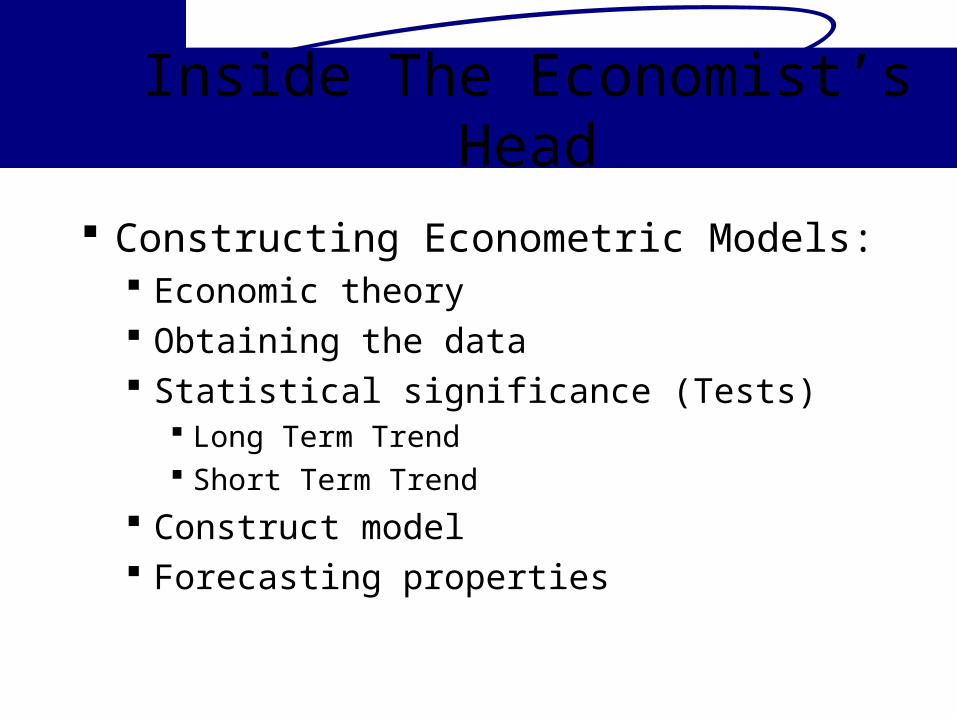
Inside The Economist’s Head
Constructing Econometric Models: Economic theory Obtaining the data Statistical significance (Tests)
Long Term Trend Short Term Trend
Construct model Forecasting properties
Economic Theory
Theoretic Drivers of Inflation: Fuel prices Interest rates Exchange rates Private credit Consumer spending Cost of production
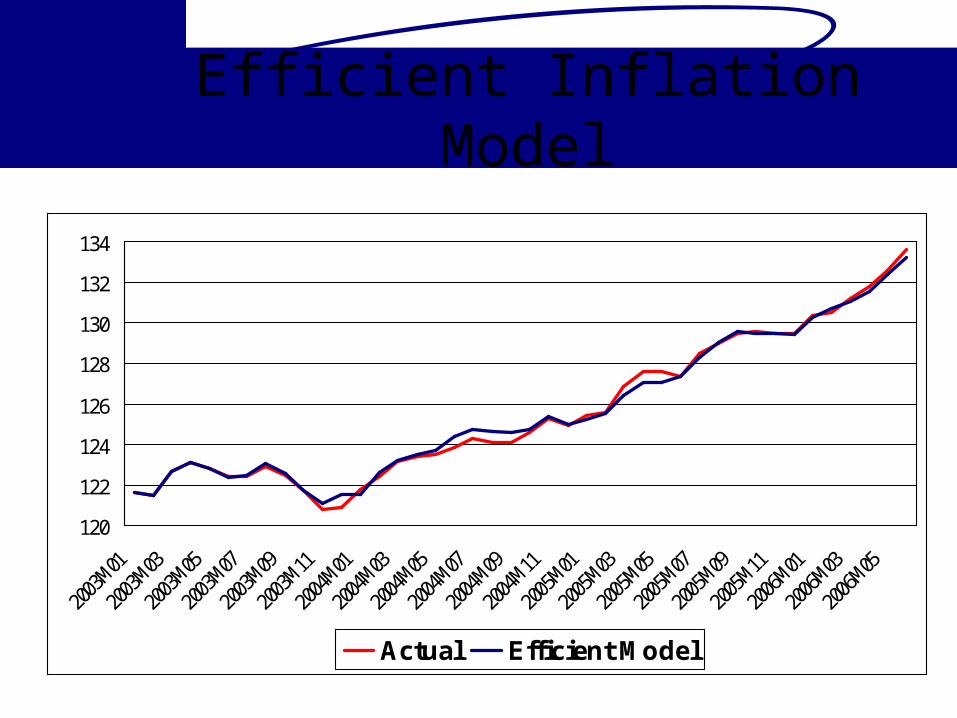
Efficient Inflation Model
120
122
124
126
128
130
132
134
2003
M01
2003
M03
2003
M05
2003
M07
2003
M09
2003
M11
2004
M01
2004
M03
2004
M05
2004
M07
2004
M09
2004
M11
2005
M01
2005
M03
2005
M05
2005
M07
2005
M09
2005
M11
2006
M01
2006
M03
2006
M05
Actual Efficient Model
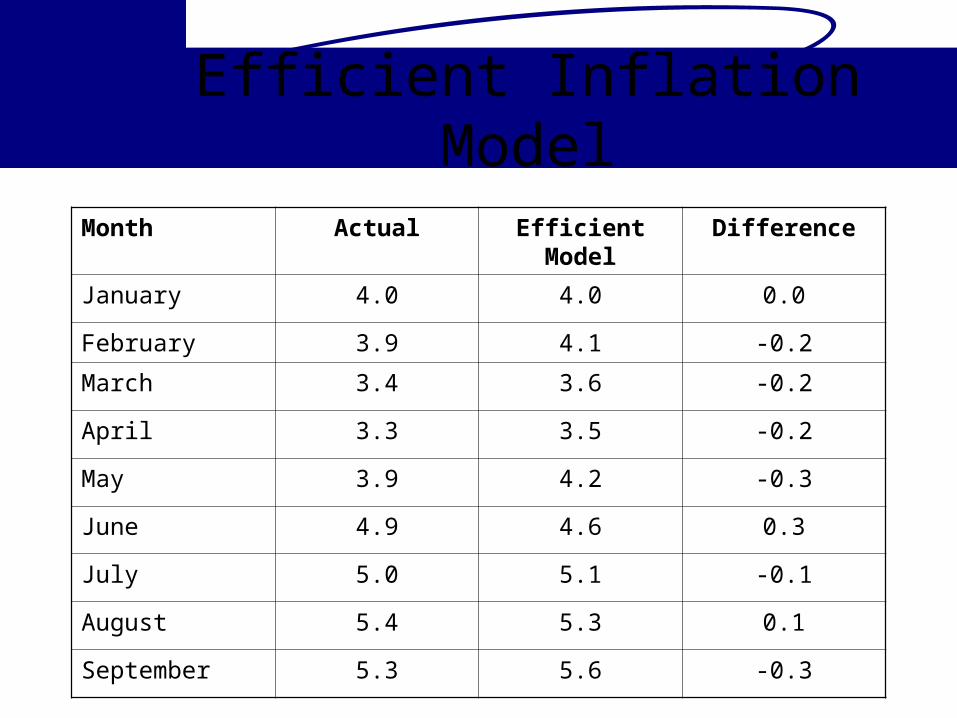
Efficient Inflation Model
Month Actual Efficient Model Difference
January 4.0 4.0 0.0
February 3.9 4.1 -0.2
March 3.4 3.6 -0.2
April 3.3 3.5 -0.2
May 3.9 4.2 -0.3
June 4.9 4.6 0.3
July 5.0 5.1 -0.1
August 5.4 5.3 0.1
September 5.3 5.6 -0.3
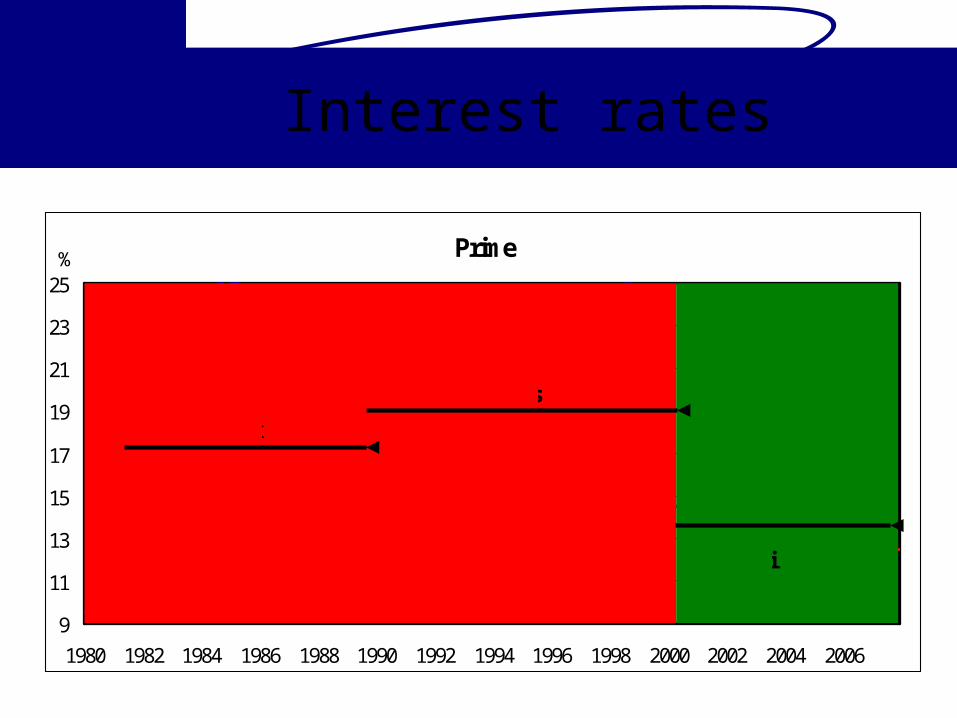
Interest rates
Prime
9
11
13
15
17
19
21
23
25
1980 1982 1984 1986 1988 1990 1992 1994 1996 1998 2000 2002 2004 2006
%
De Kock
Stals
Mboweni
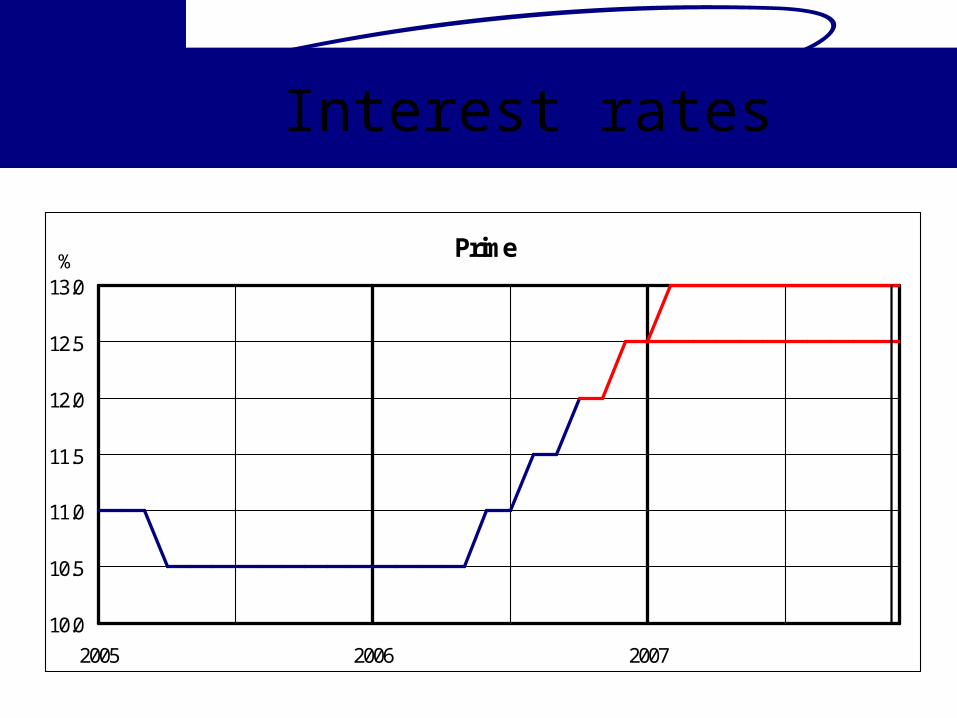
Interest rates
Prime
10.0
10.5
11.0
11.5
12.0
12.5
13.0
2005 2006 2007
%
Oil?
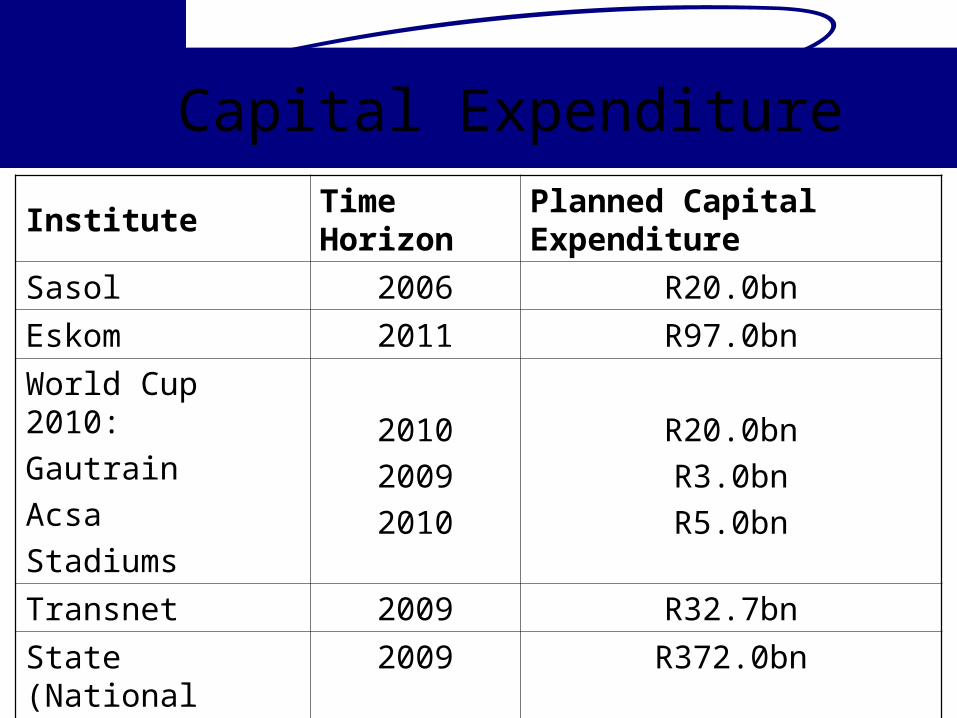
Capital Expenditure Institute Time Horizon Planned Capital Expenditure
Sasol 2006 R20.0bnEskom 2011 R97.0bnWorld Cup 2010:GautrainAcsaStadiums
201020092010
R20.0bnR3.0bnR5.0bn
Transnet 2009 R32.7bnState (National Budget) 2009 R372.0bn
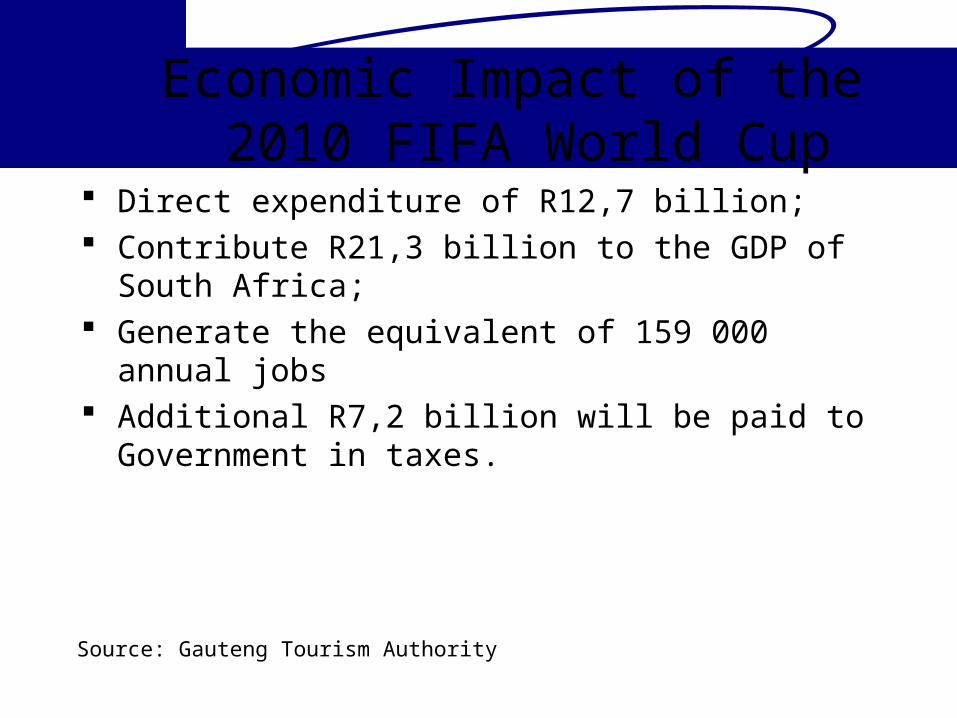
Economic Impact of the 2010 FIFA World Cup
Direct expenditure of R12,7 billion; Contribute R21,3 billion to the GDP of South Africa; Generate the equivalent of 159 000 annual jobs Additional R7,2 billion will be paid to Government in taxes.
Source: Gauteng Tourism Authority

Debt Levels
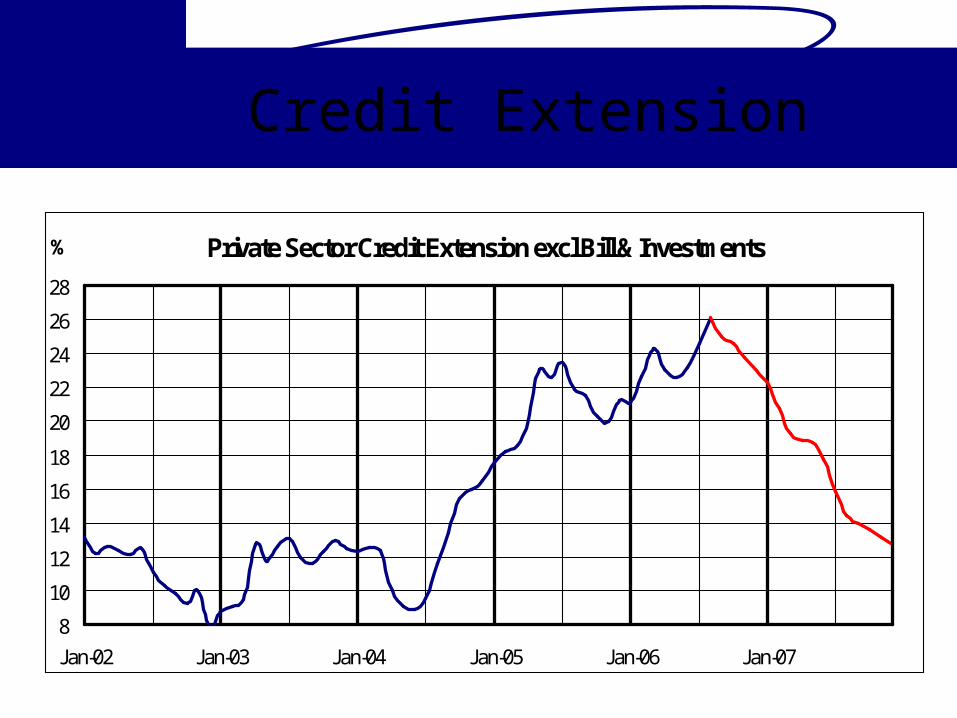
Credit Extension
Private Sector Credit Extension excl Bill & Investments
8
10
12
14
16
18
20
22
24
26
28
Jan-02 Jan-03 Jan-04 Jan-05 Jan-06 Jan-07
%
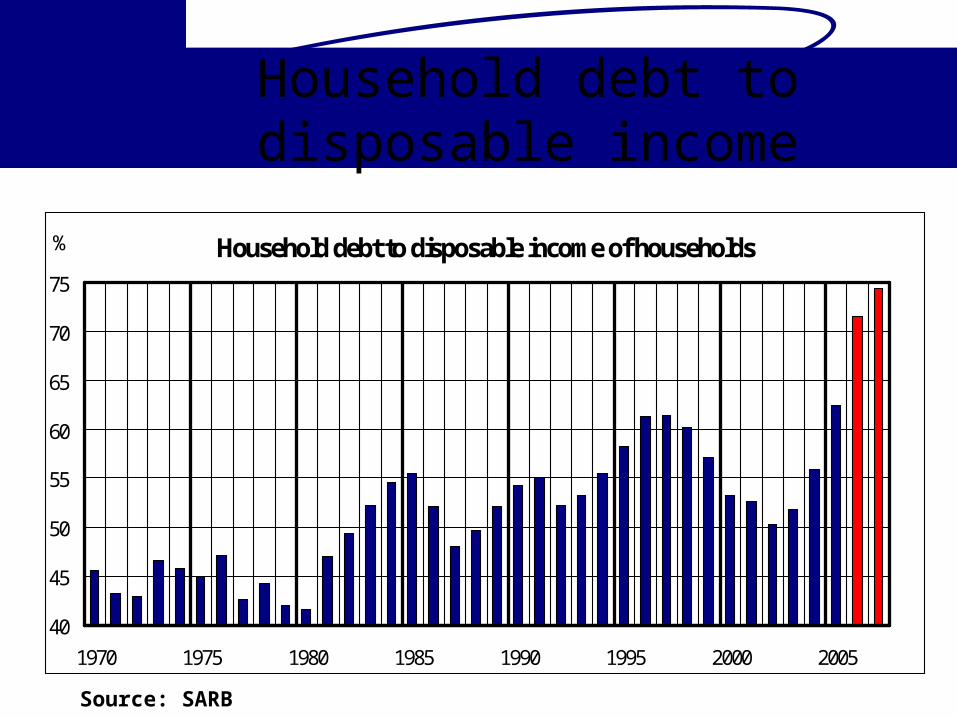
Household debt to disposable income
Household debt to disposable income of households
40
45
50
55
60
65
70
75
1970 1975 1980 1985 1990 1995 2000 2005
%
Source: SARB
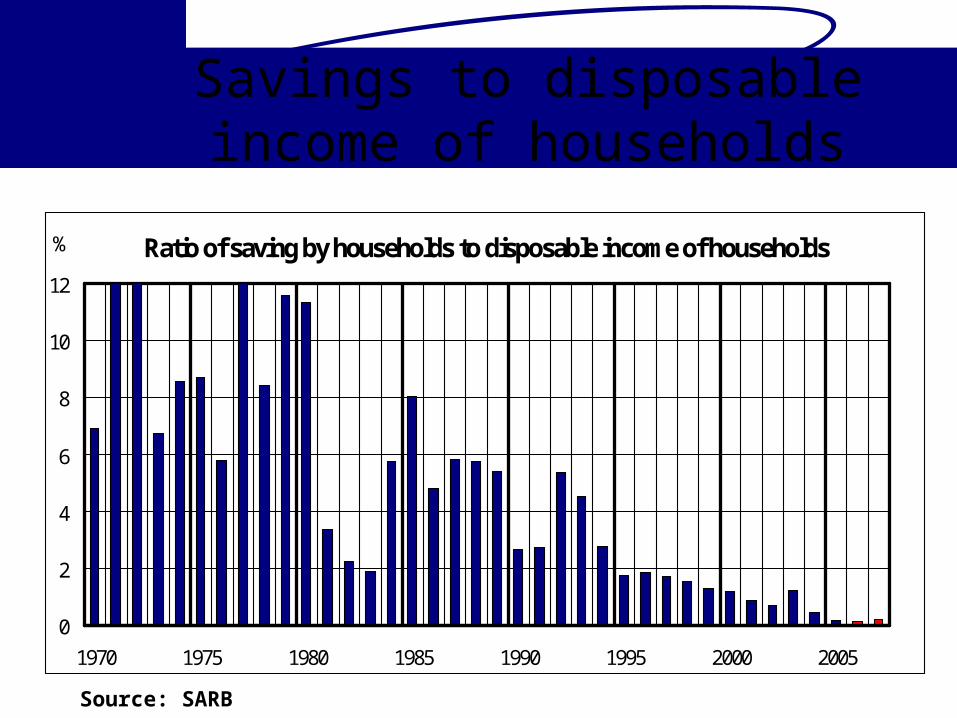
Savings to disposable income of households
Ratio of saving by households to disposable income of households
0
2
4
6
8
10
12
1970 1975 1980 1985 1990 1995 2000 2005
%
Source: SARB

Balance of Payments
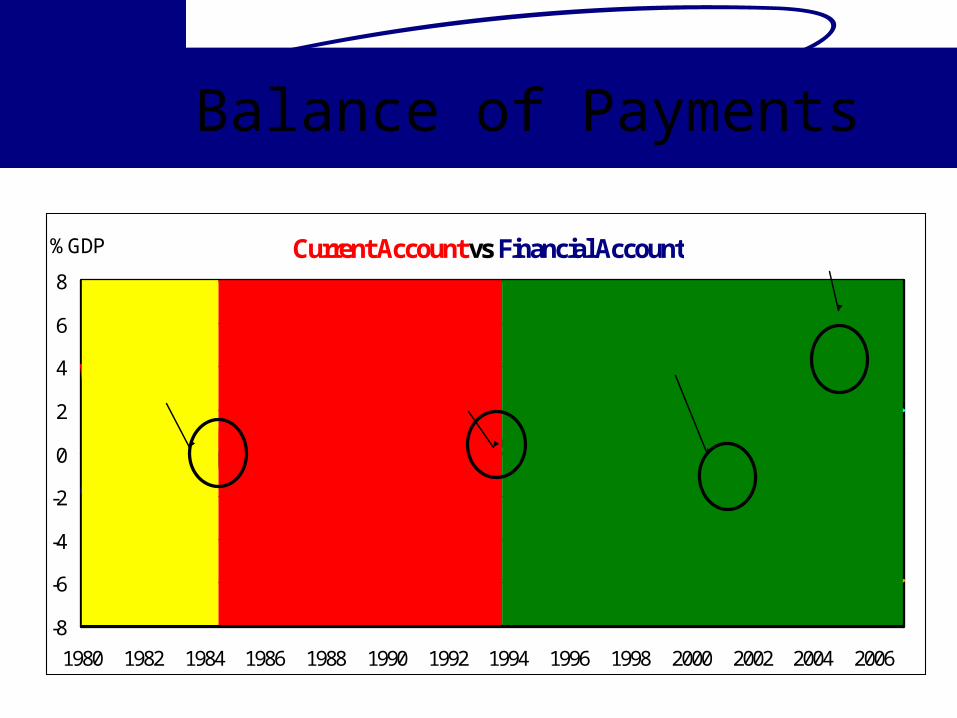
Balance of Payments
Current Account vs Financial Account
-8
-6
-4
-2
0
2
4
6
8
1980 1982 1984 1986 1988 1990 1992 1994 1996 1998 2000 2002 2004 2006
% GDPBarclays/Absa
De Beers delisting
Sanctions liftedDebt Standstill
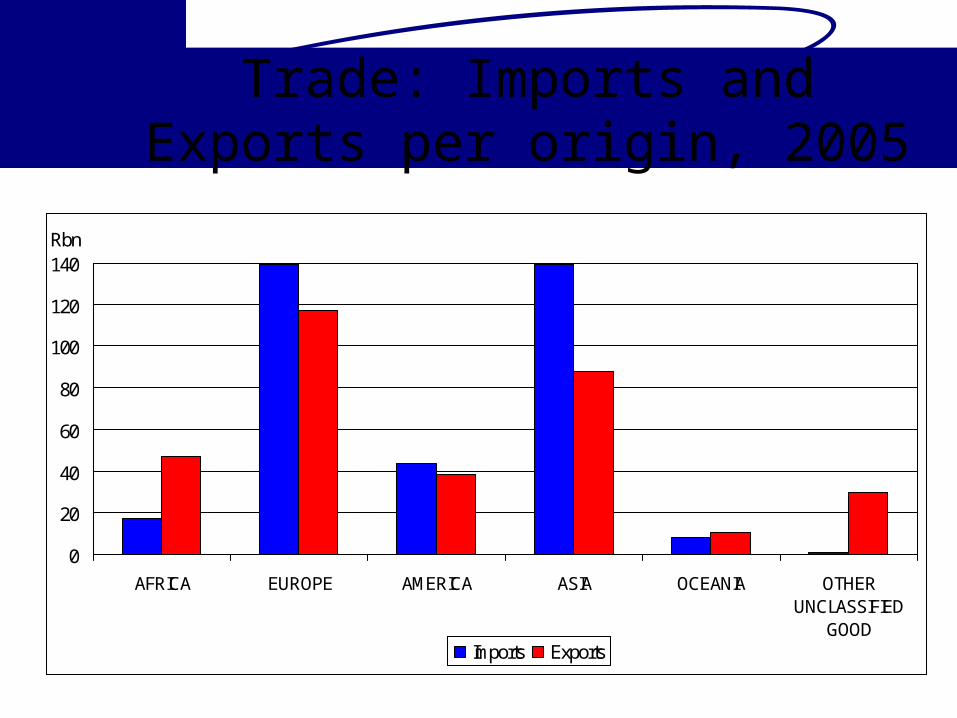
Trade: Imports and Exports per origin, 2005
0
20
40
60
80
100
120
140
AFRICA EUROPE AMERICA ASIA OCEANIA OTHERUNCLASSIFIED
GOOD
Rbn
Imports Exports
A comparison
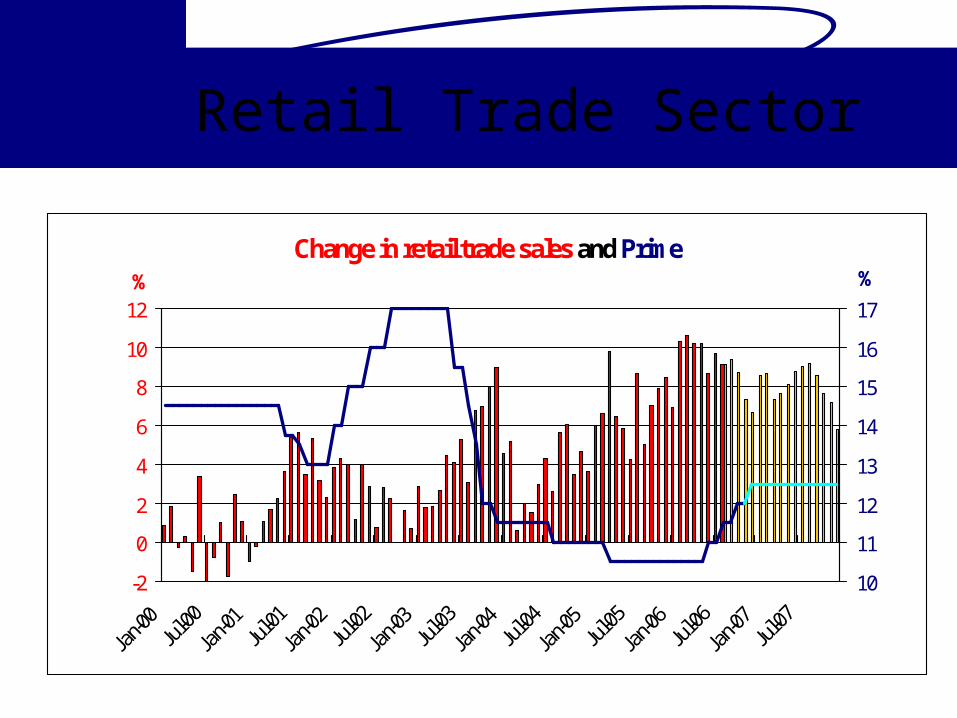
Retail Trade Sector
Change in retail trade sales and Prime
-2
0
2
4
6
8
10
12
Jan-0
0Ju
l-00
Jan-0
1Ju
l-01
Jan-0
2Ju
l-02
Jan-0
3Ju
l-03
Jan-0
4Ju
l-04
Jan-0
5Ju
l-05
Jan-0
6Ju
l-06
Jan-0
7Ju
l-07
%
10
11
12
13
14
15
16
17
%
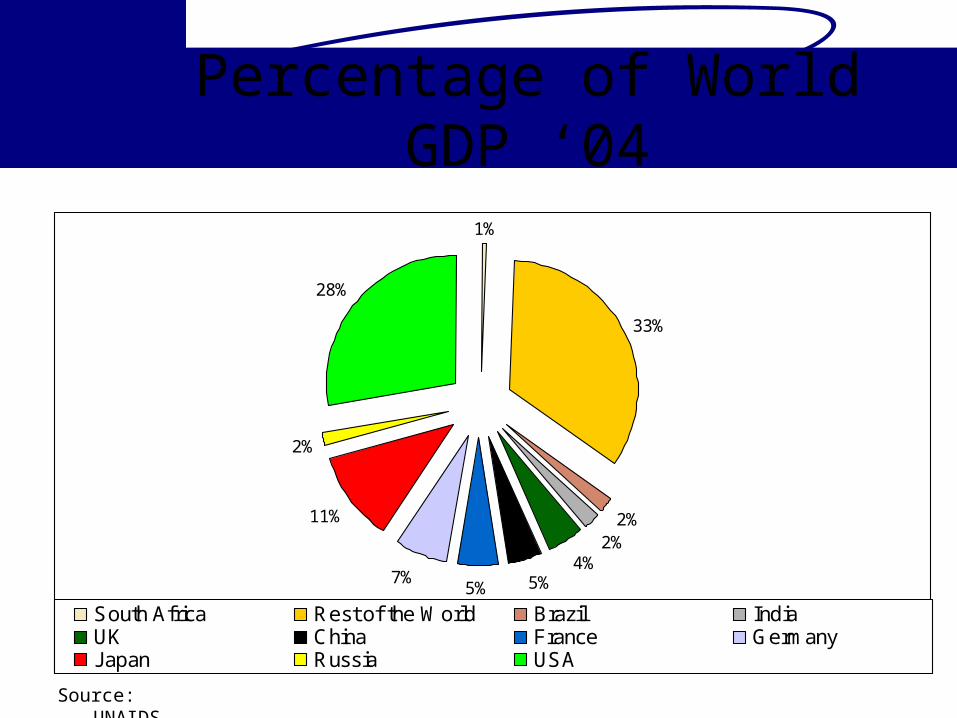
Percentage of World GDP ‘04
1%
33%
2%2%
4%5%5%
7%
11%
2%
28%
South Africa Rest of the World Brazil IndiaUK China France GermanyJapan Russia USA
Source: UNAIDS
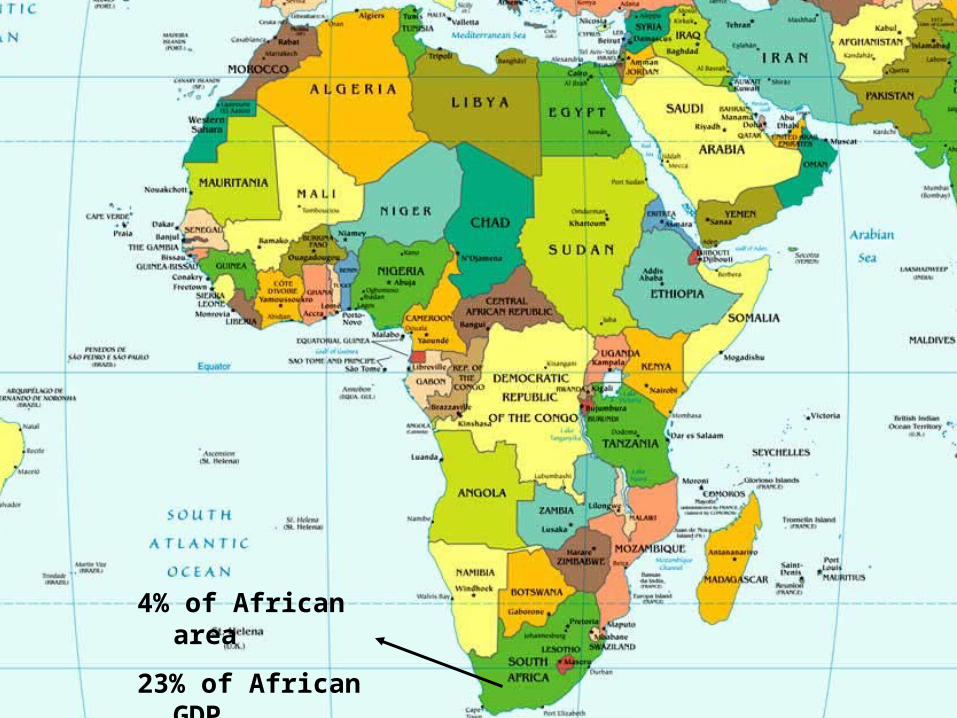
4% of African area
23% of African GDP
21.2% of African Exports
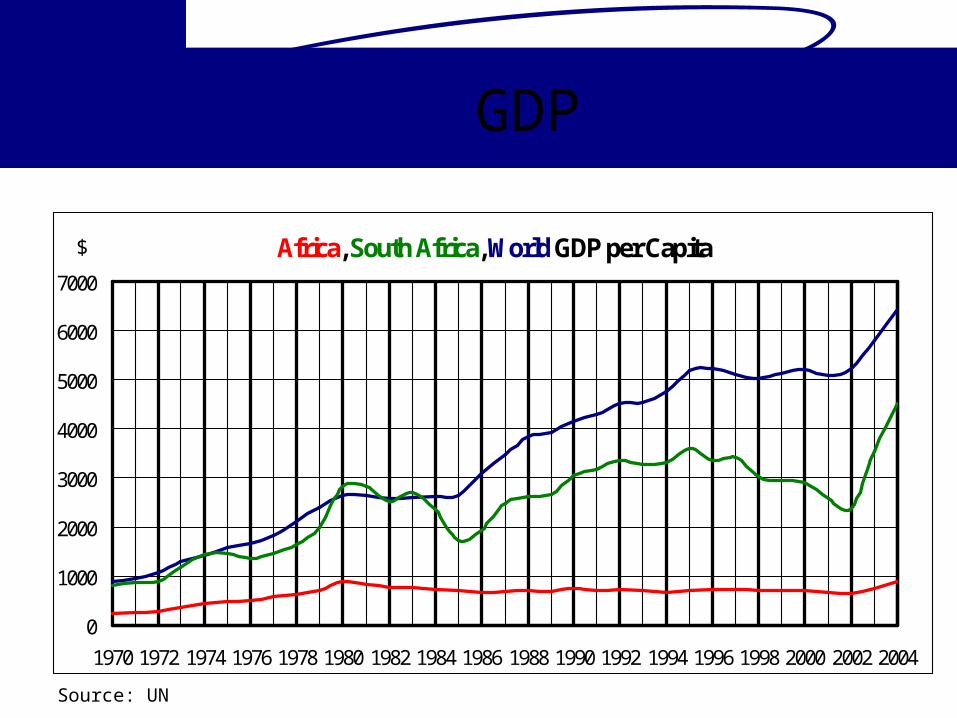
GDP
Africa, South Africa, World GDP per Capita
0
1000
2000
3000
4000
5000
6000
7000
1970 1972 1974 1976 1978 1980 1982 1984 1986 1988 1990 1992 1994 1996 1998 2000 2002 2004
$
Source: UN
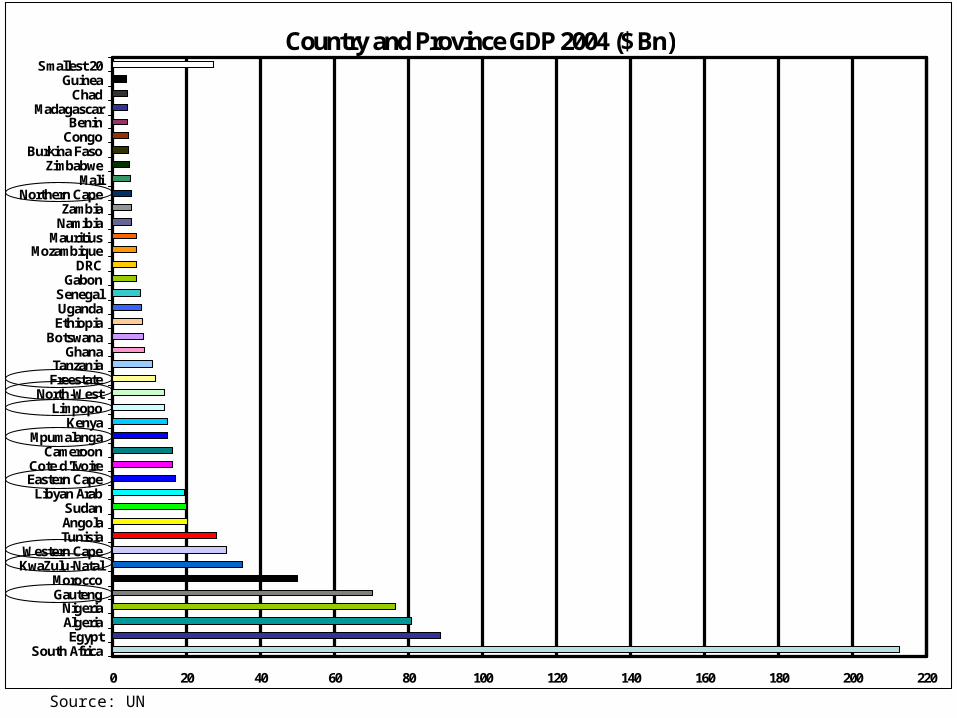
Countries Compared to Provinces
Country and Province GDP 2004 ($ Bn)
0 20 40 60 80 100 120 140 160 180 200 220
South AfricaEgypt
AlgeriaNigeria
GautengMorocco
KwaZulu-NatalWestern Cape
TunisiaAngolaSudan
Libyan ArabEastern CapeCote d'Ivoire
CameroonMpumalanga
KenyaLimpopo
North-WestFreestateTanzania
GhanaBotswana
EthiopiaUgandaSenegal
GabonDRC
MozambiqueMauritius
NamibiaZambia
Northern CapeMali
ZimbabweBurkina Faso
CongoBenin
MadagascarChad
GuineaSmallest 20
Source: UN
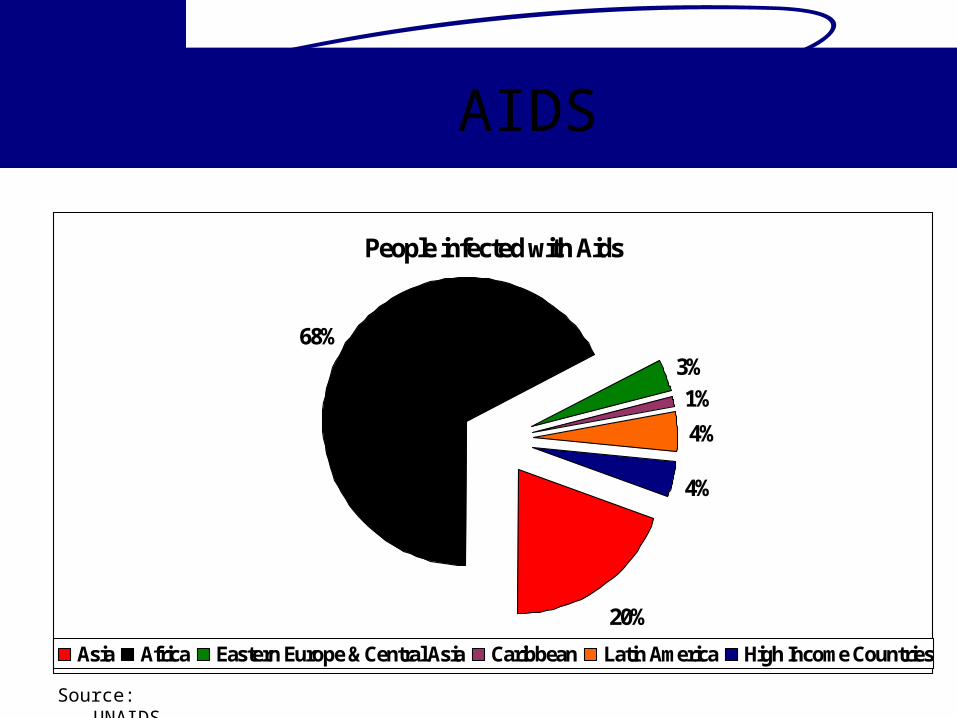
AIDS
People infected with Aids
20%
68%3%1%
4%
4%
Asia Africa Eastern Europe & Central Asia Caribbean Latin America High Income Countries
Source: UNAIDS
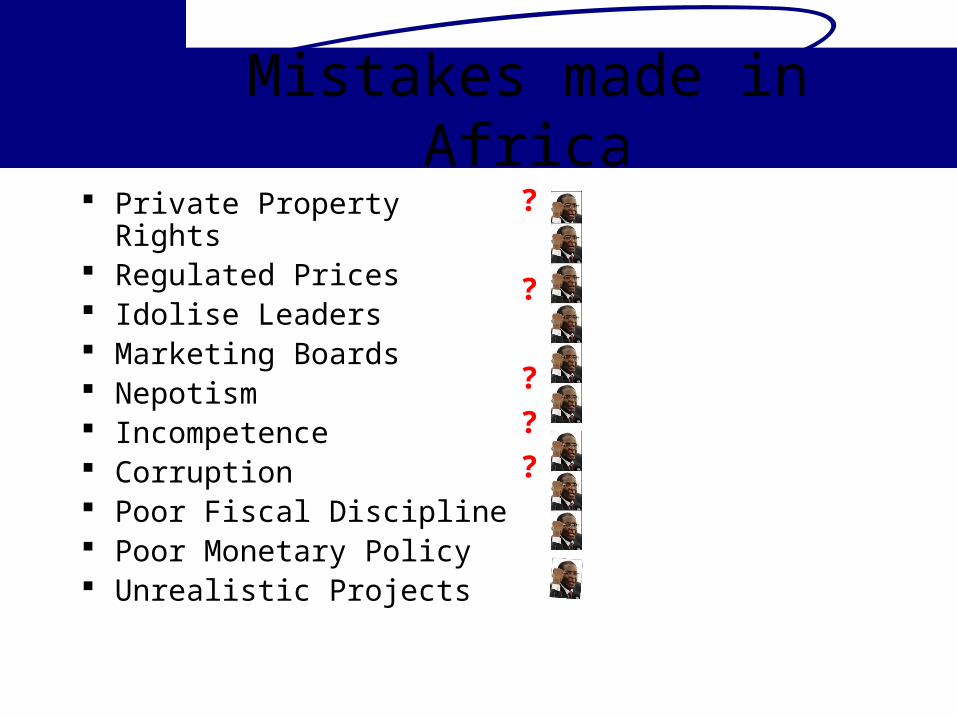
Mistakes made in Africa Private Property Rights Regulated Prices Idolise Leaders Marketing Boards Nepotism Incompetence Corruption Poor Fiscal Discipline Poor Monetary Policy Unrealistic Projects
?
?
?
?
?

The Zim disaster
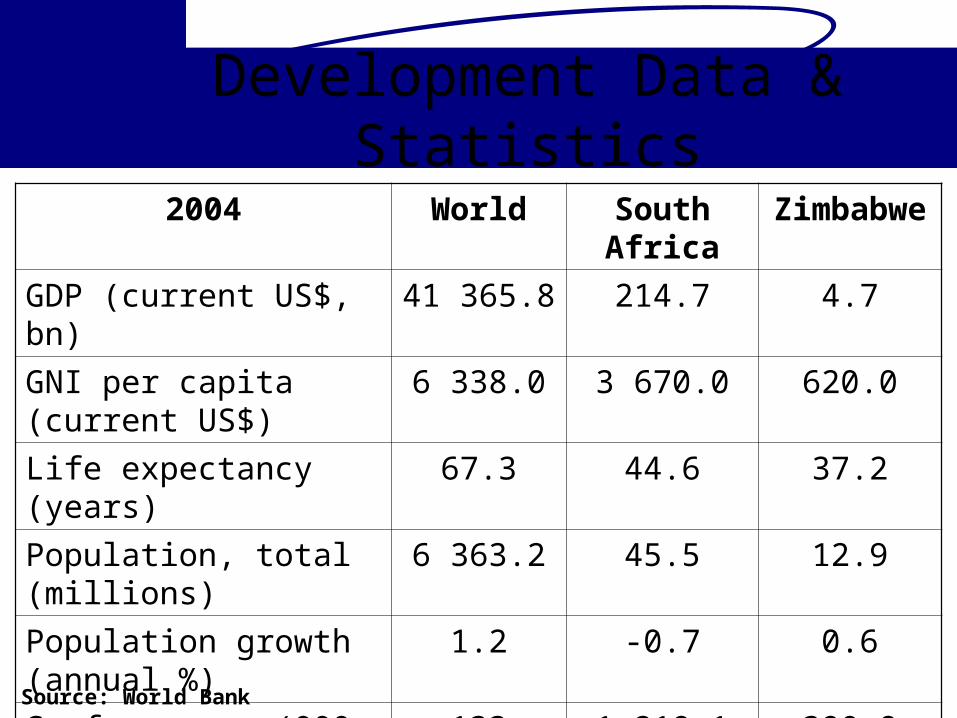
Development Data & Statistics
2004 World South Africa Zimbabwe
GDP (current US$, bn) 41 365.8 214.7 4.7
GNI per capita (current US$) 6 338.0 3 670.0 620.0
Life expectancy (years) 67.3 44.6 37.2
Population, total (millions) 6 363.2 45.5 12.9
Population growth (annual %) 1.2 -0.7 0.6
Surface area (000, sq km) 133 940.9 1 219.1 390.8
Source: World Bank
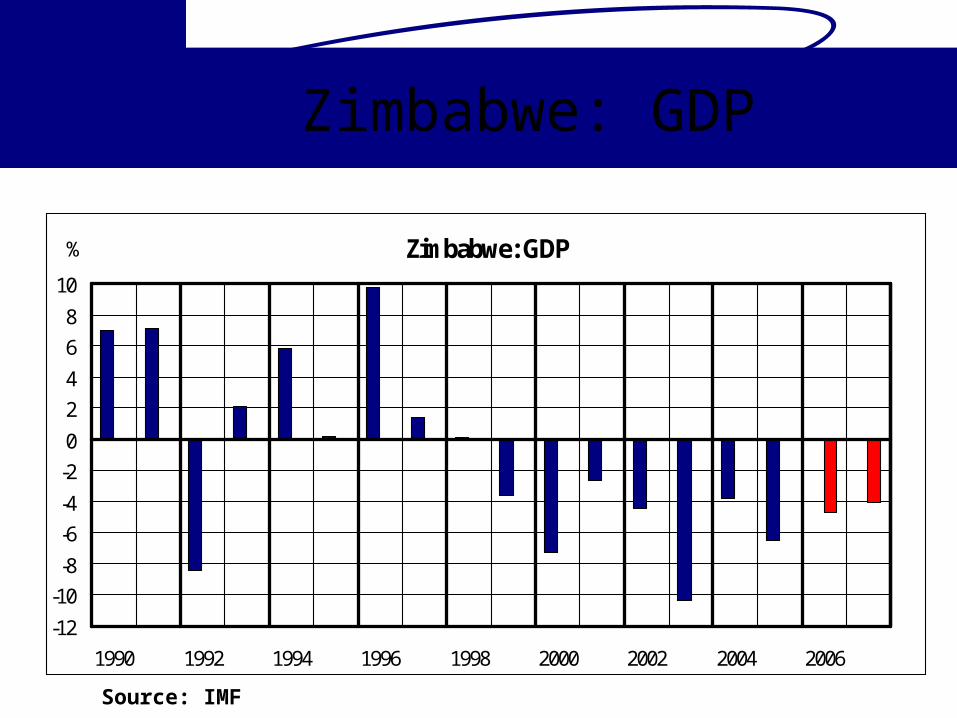
Zimbabwe: GDP
Zimbabwe: GDP
-12
-10-8
-6-4
-20
24
68
10
1990 1992 1994 1996 1998 2000 2002 2004 2006
%
Source: IMF
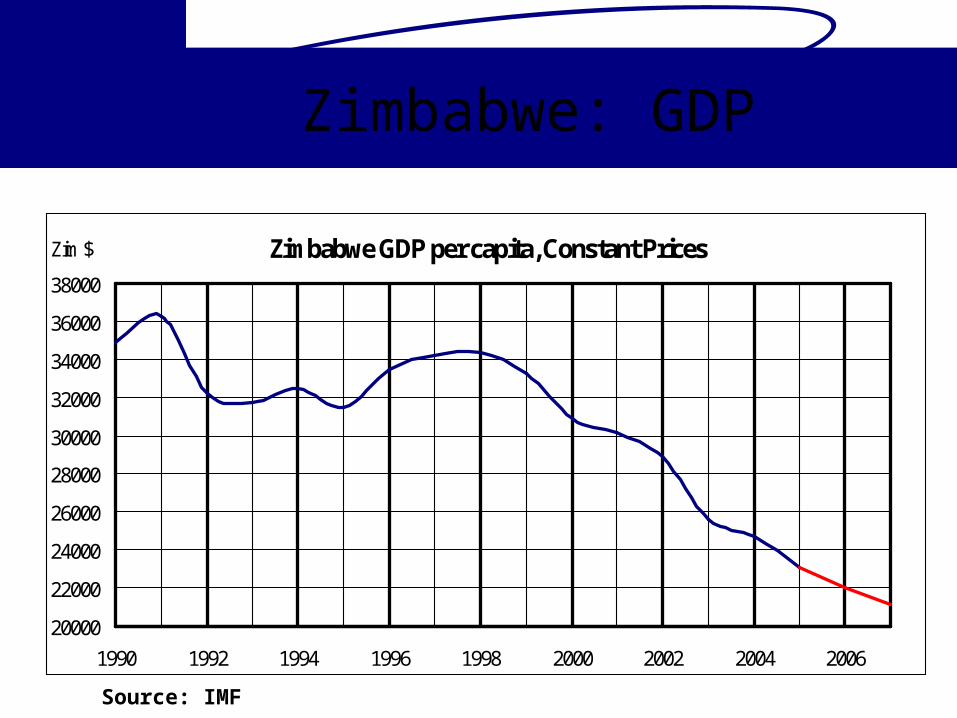
Zimbabwe: GDP
Zimbabwe GDP per capita, Constant Prices
20000
22000
24000
26000
28000
30000
32000
34000
36000
38000
1990 1992 1994 1996 1998 2000 2002 2004 2006
Zim $
Source: IMF
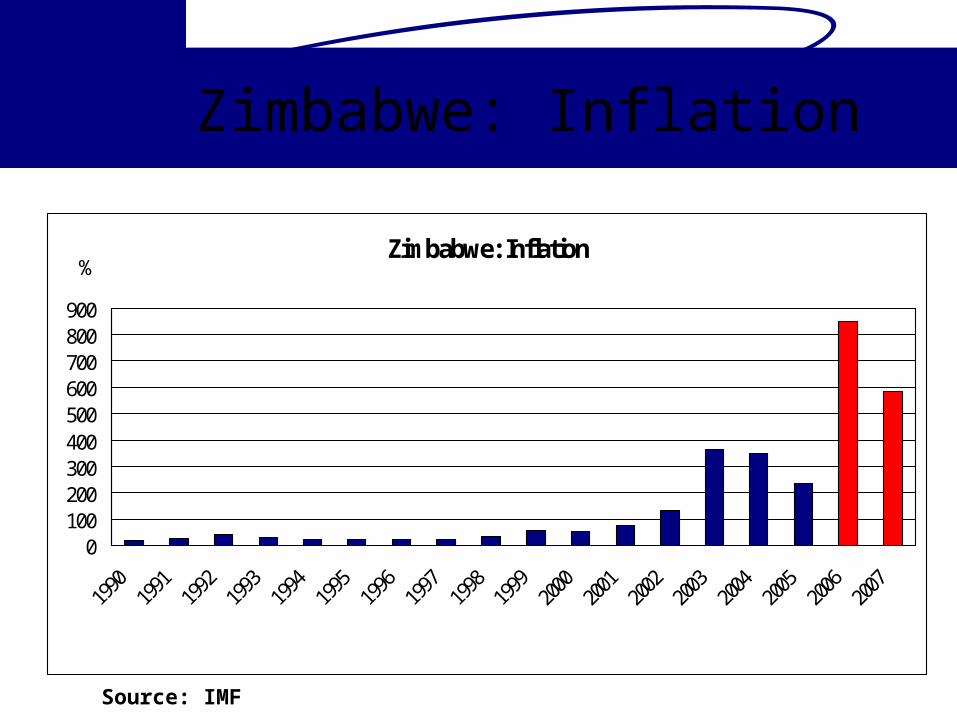
Zimbabwe: Inflation
Zimbabwe: Inflation
0100200300400500600700800900
1990
1991
1992
1993
1994
1995
1996
1997
1998
1999
2000
2001
2002
2003
2004
2005
2006
2007
%
Source: IMF
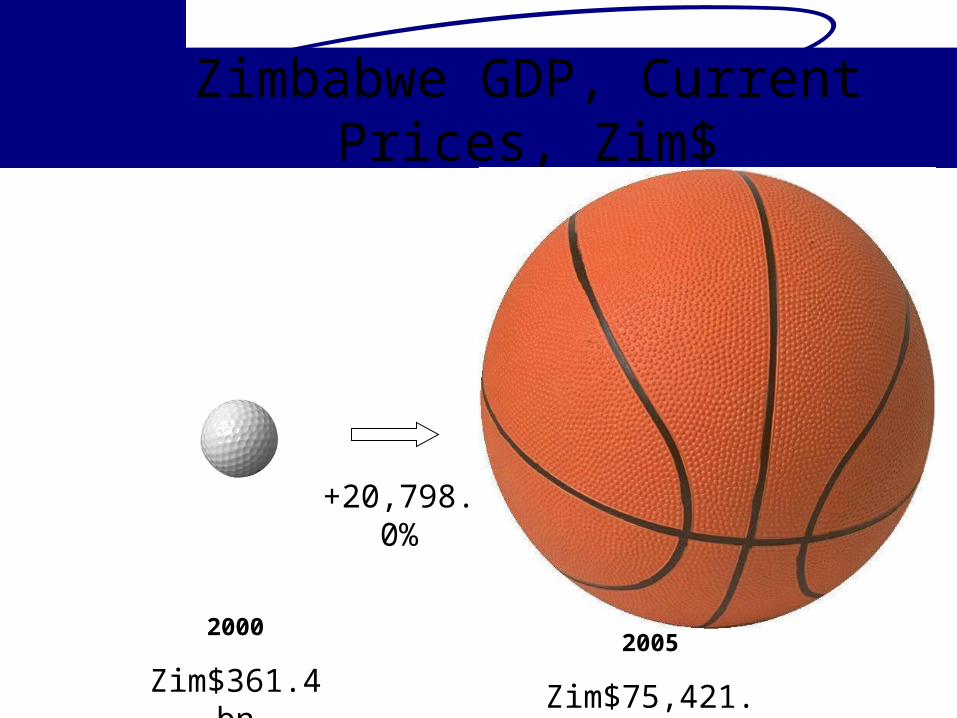
Zimbabwe GDP, Current Prices, Zim$
2000
Zim$361.4 bn2005
Zim$75,421.1 bn
+20,798.0%
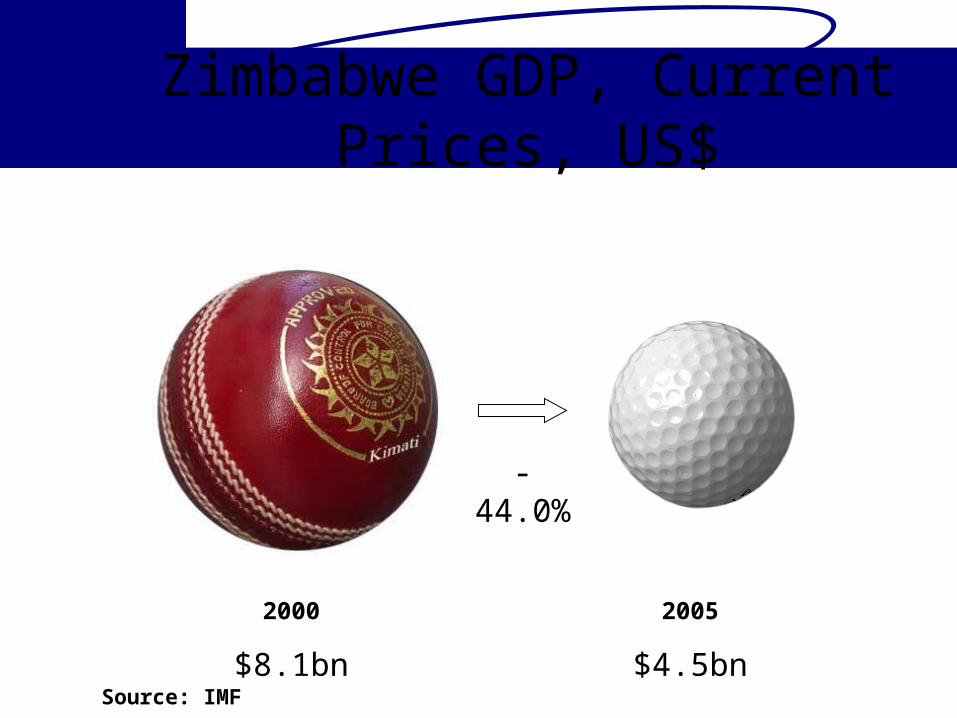
Zimbabwe GDP, Current Prices, US$
2000
$8.1bn
2005
$4.5bnSource: IMF
-44.0%

Commodity Analysis
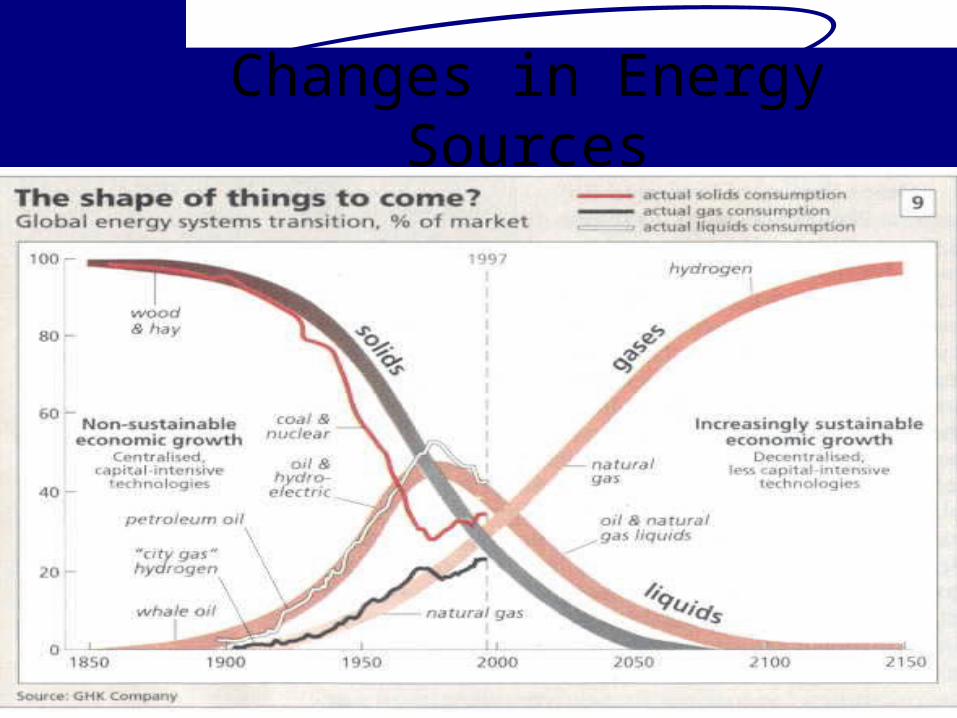
Changes in Energy Sources
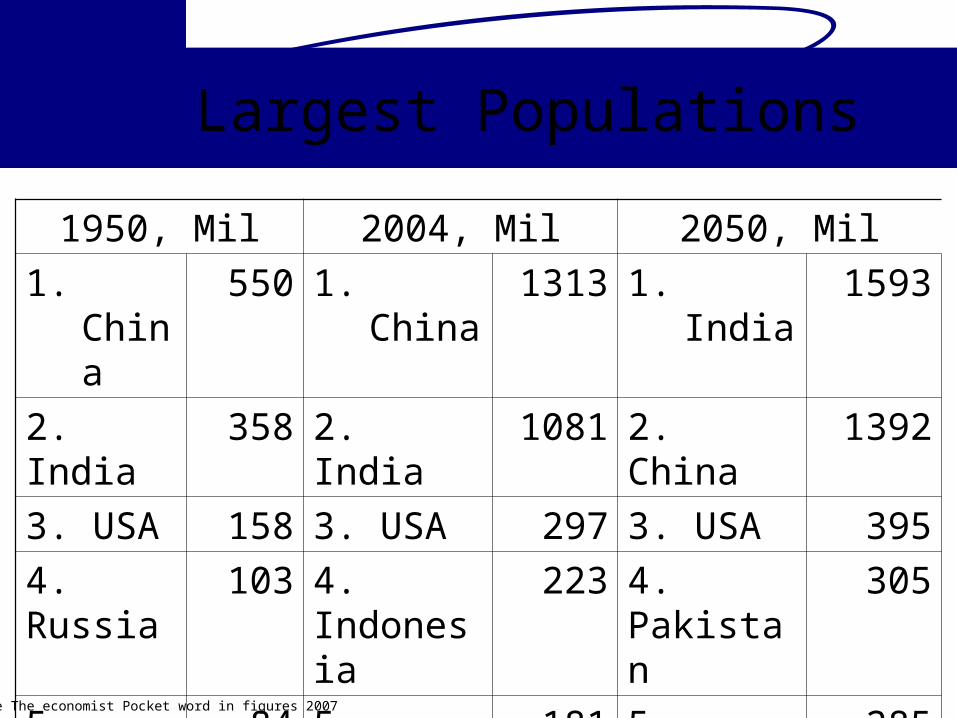
Largest Populations
Source The economist Pocket word in figures 2007
1950, Mil 2004, Mil 2050, Mil1. China 550 1. China 1313 1. India 15932. India 358 2. India 1081 2. China 13923. USA 158 3. USA 297 3. USA 3954. Russia 103 4. Indonesia 223 4. Pakistan 3055. Japan 84 5. Brazil 181 5. Indonesia 285
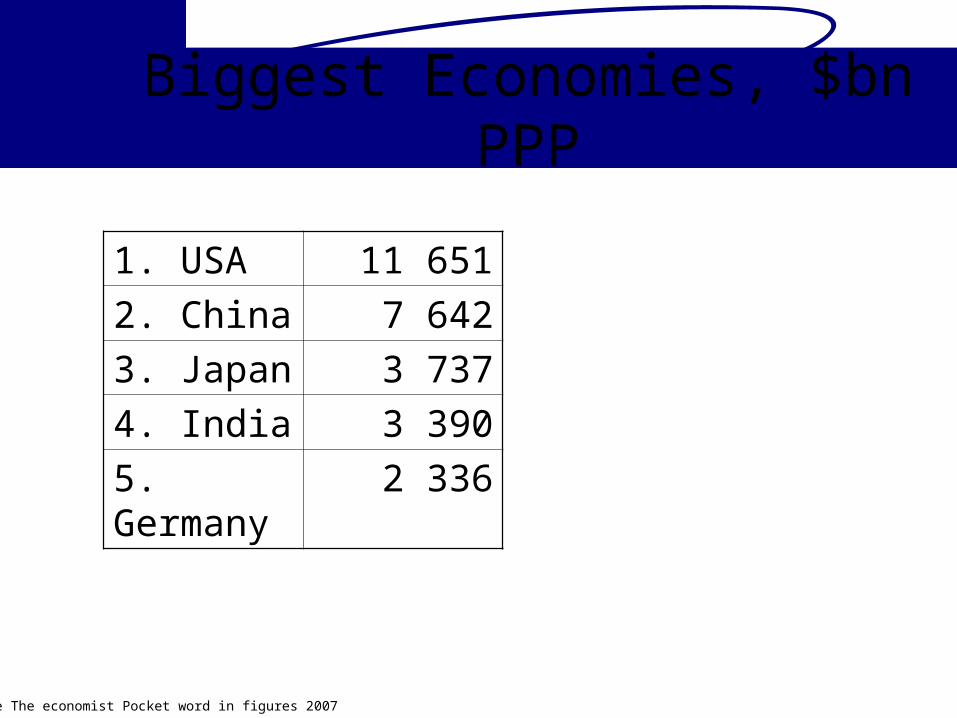
Biggest Economies, $bn PPP
Source The economist Pocket word in figures 2007
1. USA 11 6512. China 7 6423. Japan 3 7374. India 3 3905. Germany 2 336
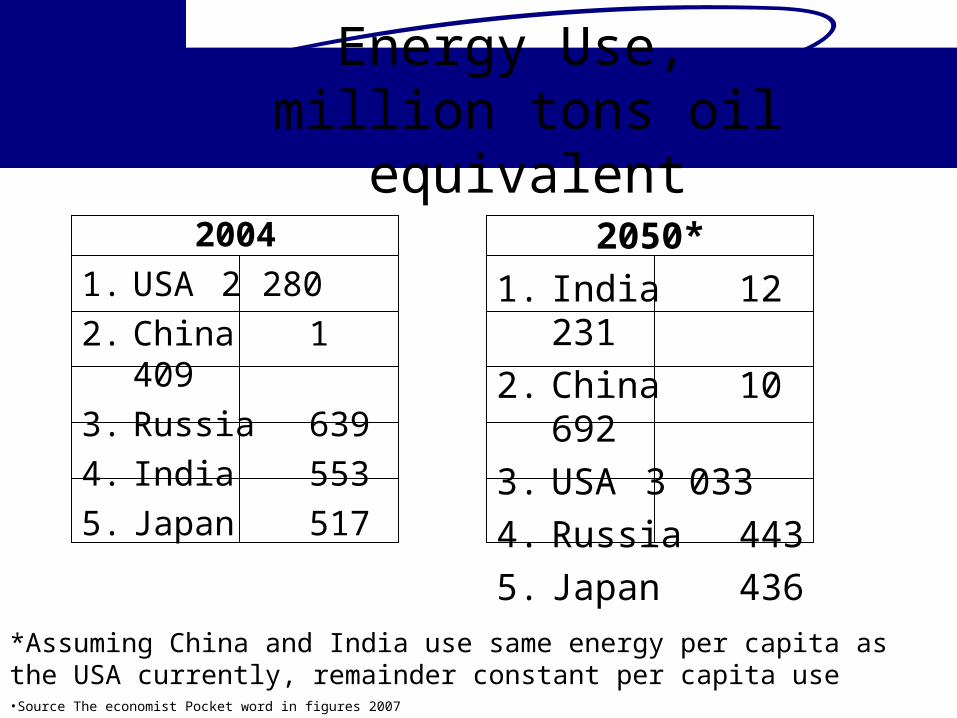
Energy Use, million tons oil equivalent
2004
1. USA 2 2802. China 1 4093. Russia6394. India 5535. Japan 517
2050*
1. India 12 2312. China 10 6923. USA 3 0334. Russia4435. Japan 436
*Assuming China and India use same energy per capita as the USA currently, remainder constant per capita use•Source The economist Pocket word in figures 2007
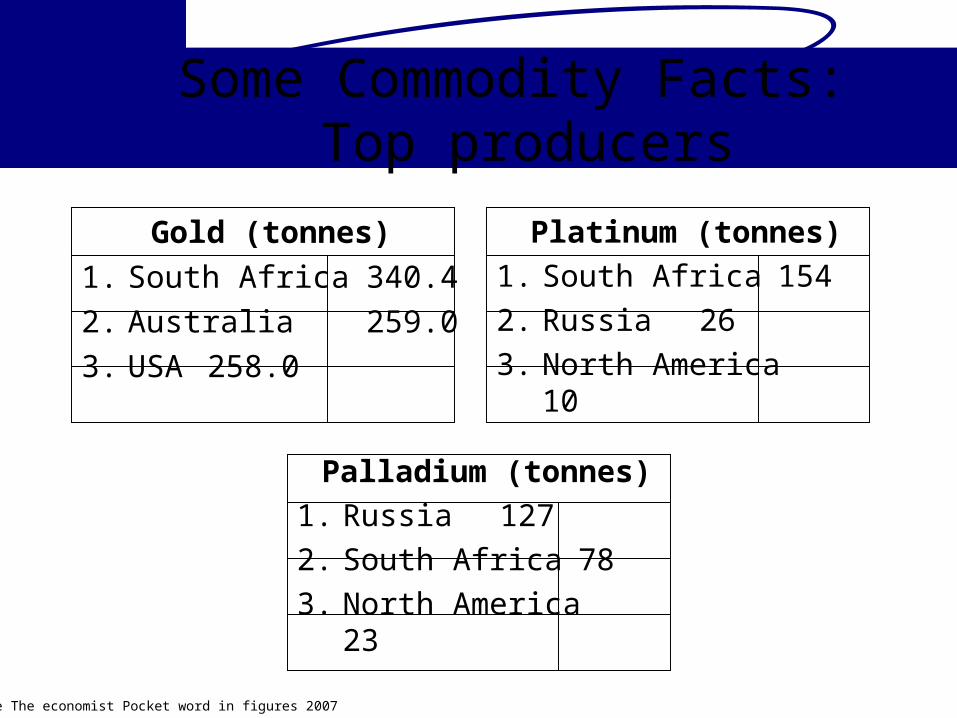
Some Commodity Facts: Top producers
Gold (tonnes)
1. South Africa 340.42. Australia 259.03. USA 258.0
Platinum (tonnes)
1. South Africa 1542. Russia 263. North America 10
Palladium (tonnes)
1. Russia 1272. South Africa 783. North America 23
Source The economist Pocket word in figures 2007
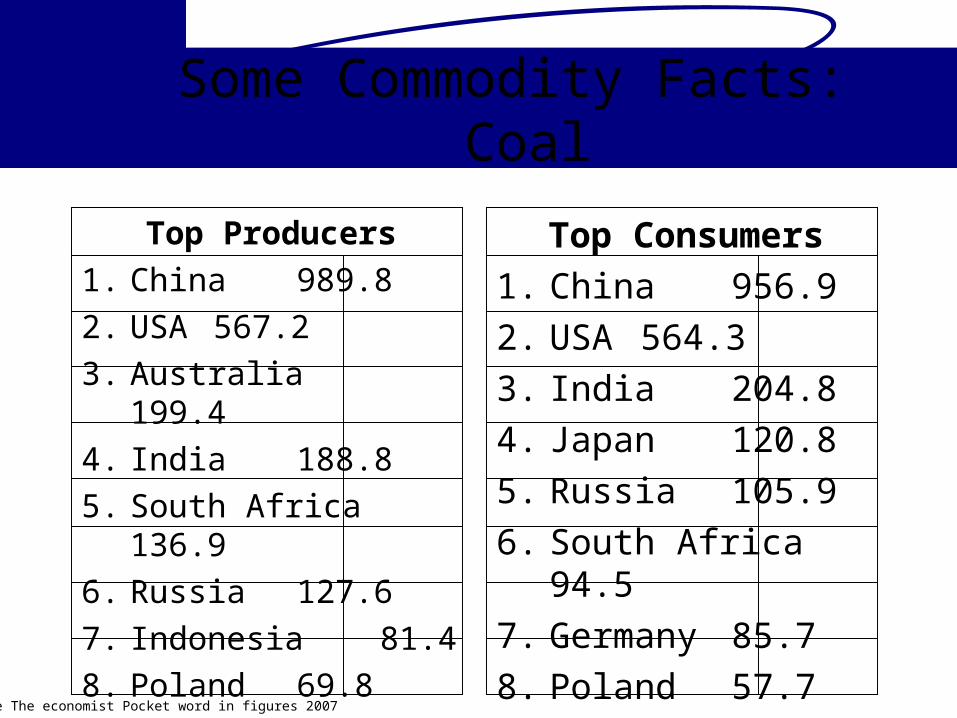
Some Commodity Facts: Coal
Top Producers
1. China 989.82. USA 567.23. Australia
199.44. India 188.85. South Africa 136.96. Russia 127.67. Indonesia 81.48. Poland 69.8
Top Consumers
1. China 956.92. USA 564.33. India 204.84. Japan 120.85. Russia 105.96. South Africa 94.57. Germany
85.78. Poland 57.7Source The economist Pocket word in figures 2007
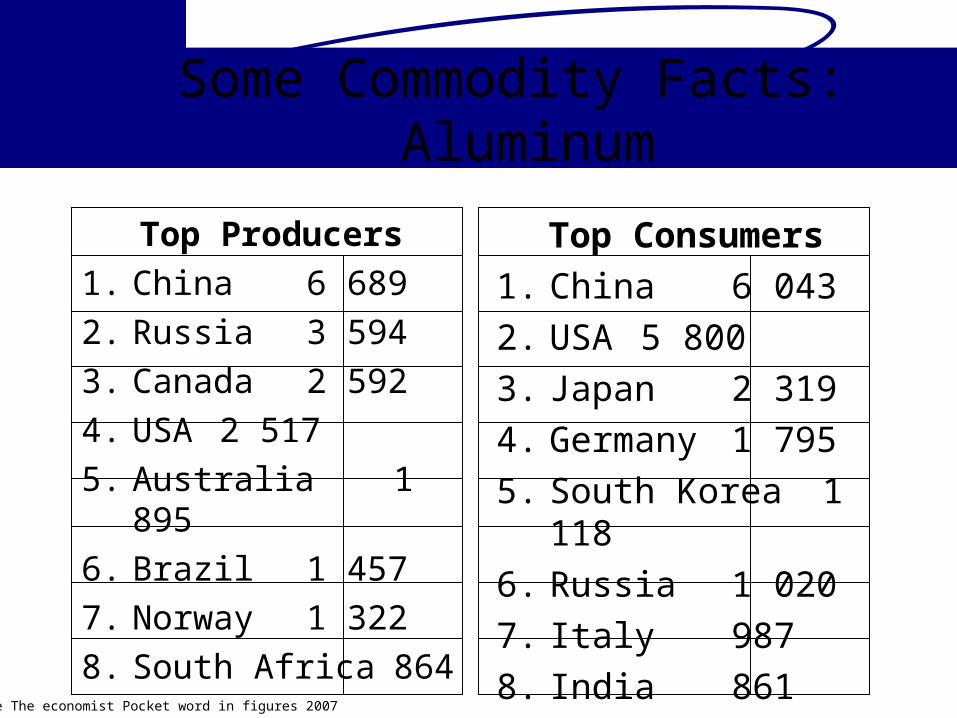
Some Commodity Facts: Aluminum
Top Producers
1. China 6 6892. Russia 3 5943. Canada 2 5924. USA 2 5175. Australia 1 8956. Brazil 1 4577. Norway 1 3228. South Africa 864
Top Consumers
1. China 6 0432. USA 5 8003. Japan 2 3194. Germany 1
7955. South Korea 1 1186. Russia 1 0207. Italy 9878. India 861Source The economist Pocket word in figures 2007

Asset Allocation
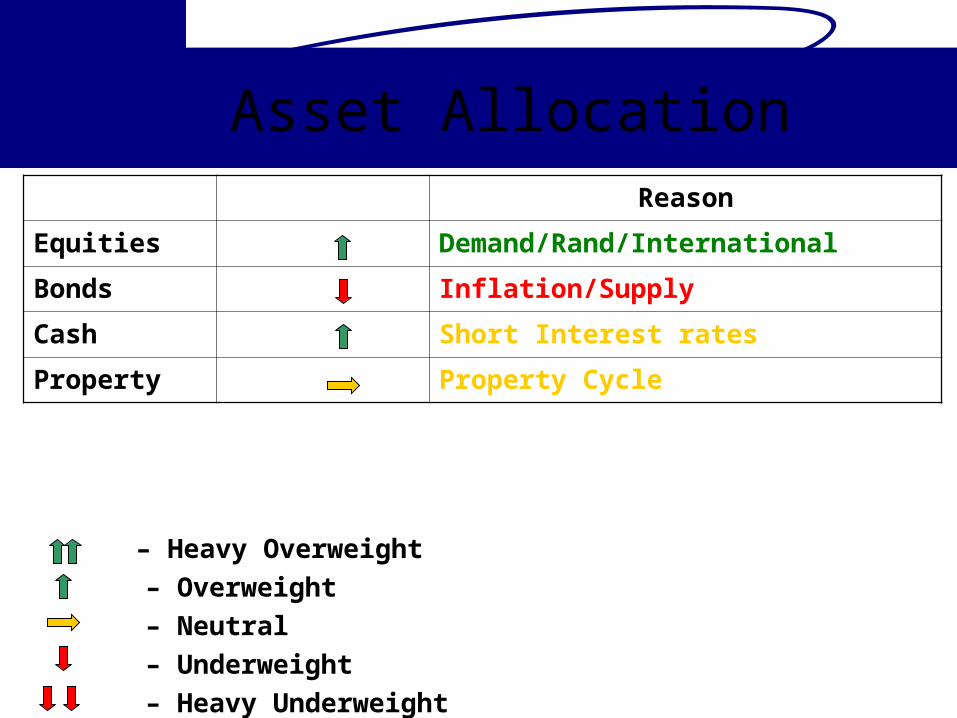
Asset Allocation Reason
Equities Demand/Rand/International
Bonds Inflation/Supply
Cash Short Interest rates
Property Property Cycle
– Heavy Overweight
– Overweight
– Neutral
– Underweight
– Heavy Underweight
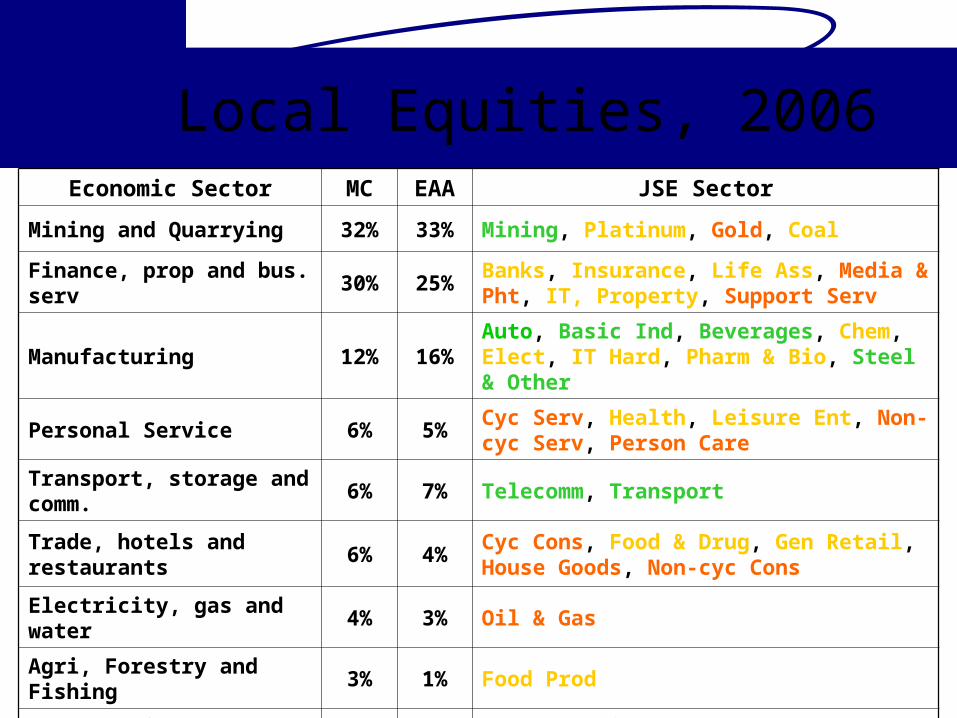
Local Equities, 2006Economic Sector MC EAA JSE Sector
Mining and Quarrying 32% 33% Mining, Platinum, Gold, Coal
Finance, prop and bus. serv 30% 25%Banks, Insurance, Life Ass, Media & Pht, IT, Property, Support Serv
Manufacturing 12% 16%Auto, Basic Ind, Beverages, Chem, Elect, IT Hard, Pharm & Bio, Steel & Other
Personal Service 6% 5%Cyc Serv, Health, Leisure Ent, Non-cyc Serv, Person Care
Transport, storage and comm. 6% 7% Telecomm, Transport
Trade, hotels and restaurants 6% 4%Cyc Cons, Food & Drug, Gen Retail, House Goods, Non-cyc Cons
Electricity, gas and water 4% 3% Oil & Gas
Agri, Forestry and Fishing 3% 1% Food Prod
Construction 2% 6% Const & Build
100% 100%

www.efgroup.co.za