Embed Size (px)
Citation preview

The South African Economy
Presented by:Dawie Roodt14 September 2006

Real Economy
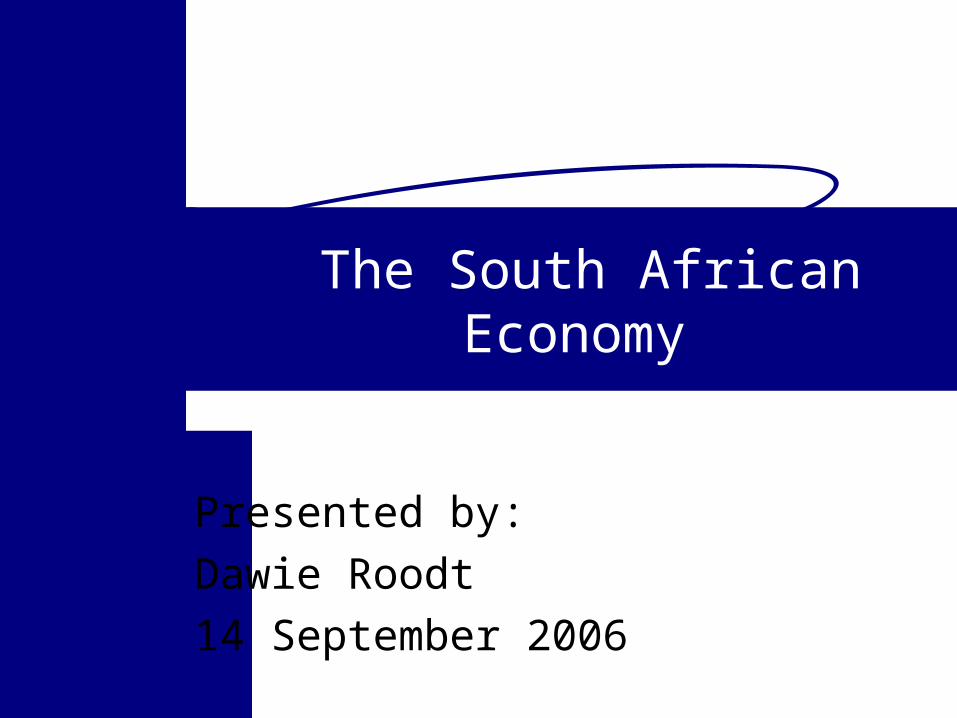
GDP
GDP
-3
-2
-1
0
1
2
3
4
5
6
7
1980 1982 1984 1986 1988 1990 1992 1994 1996 1998 2000 2002 2004 2006
%
GDP
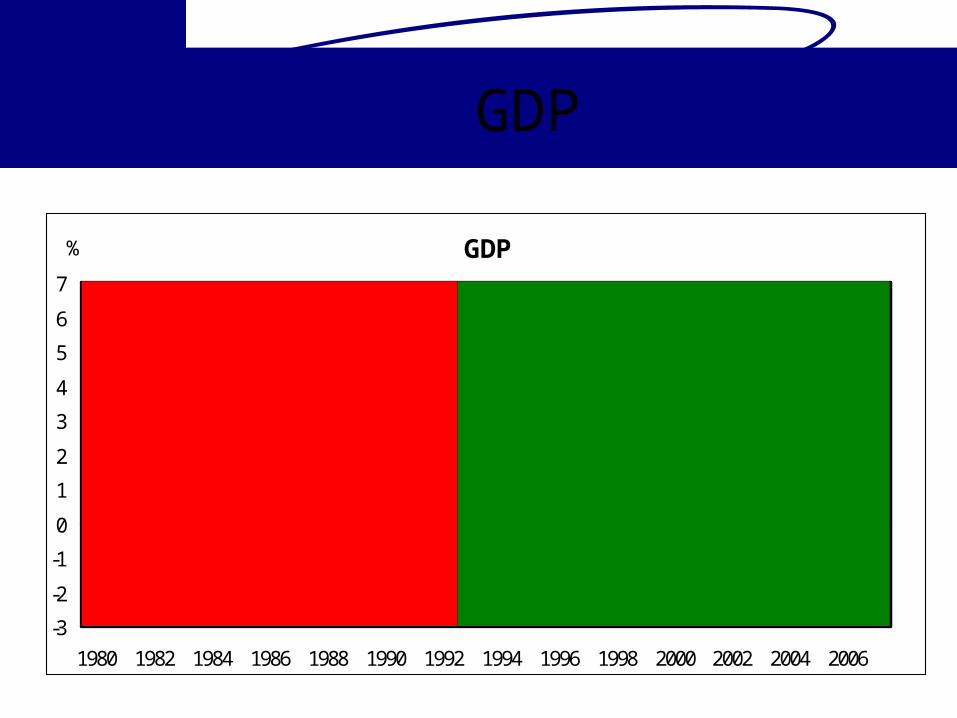
GDP per capita '00
20000
21000
22000
23000
24000
25000
26000
1980 1982 1984 1986 1988 1990 1992 1994 1996 1998 2000 2002 2004 2006
R
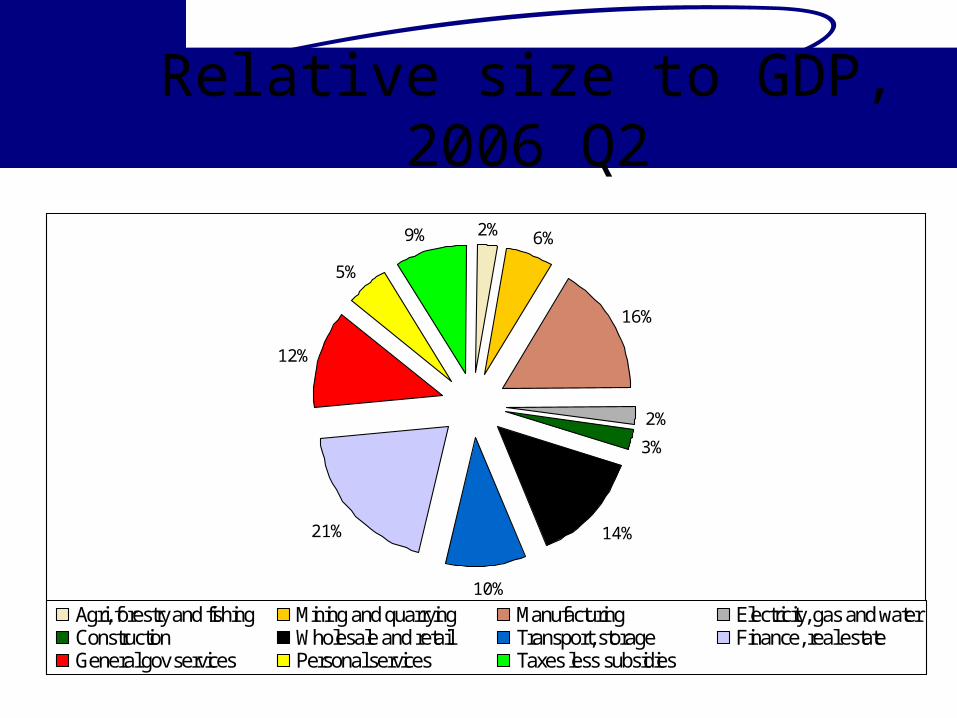
Relative size to GDP, 2006 Q2
2% 6%
16%
2%
3%
14%
10%
21%
12%
5%
9%
Agri, forestry and fishing Mining and quarrying Manufacturing Electricity, gas and waterConstruction Wholesale and retail Transport, storage Finance, real estate General gov services Personal services Taxes less subsidies
Fiscal Policy
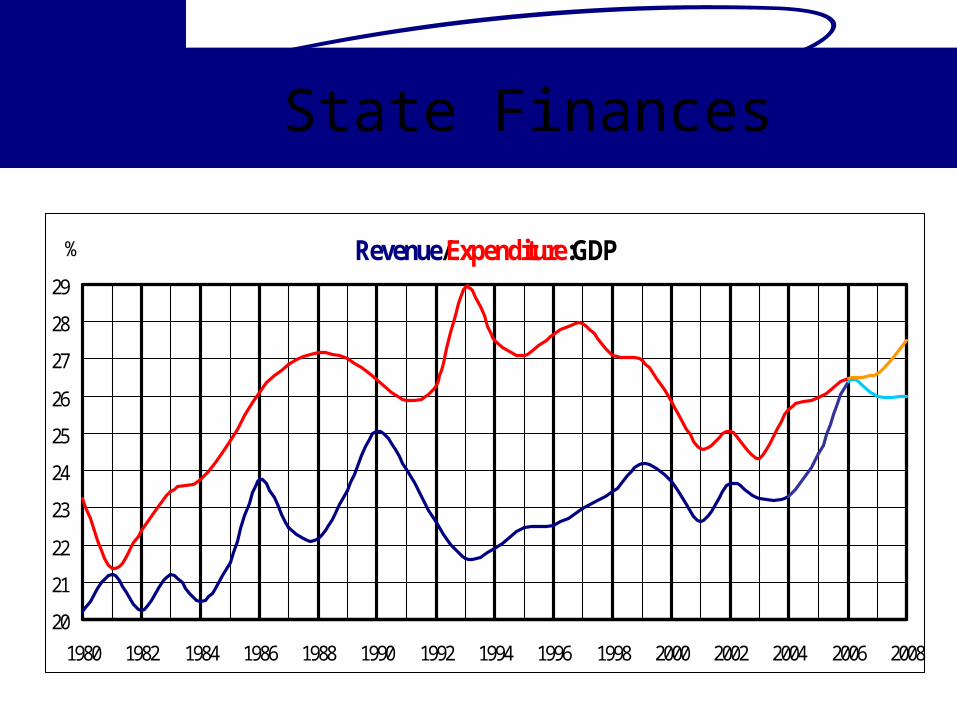
State Finances
Revenue/Expenditure:GDP
20
21
22
23
24
25
26
27
28
29
1980 1982 1984 1986 1988 1990 1992 1994 1996 1998 2000 2002 2004 2006 2008
%
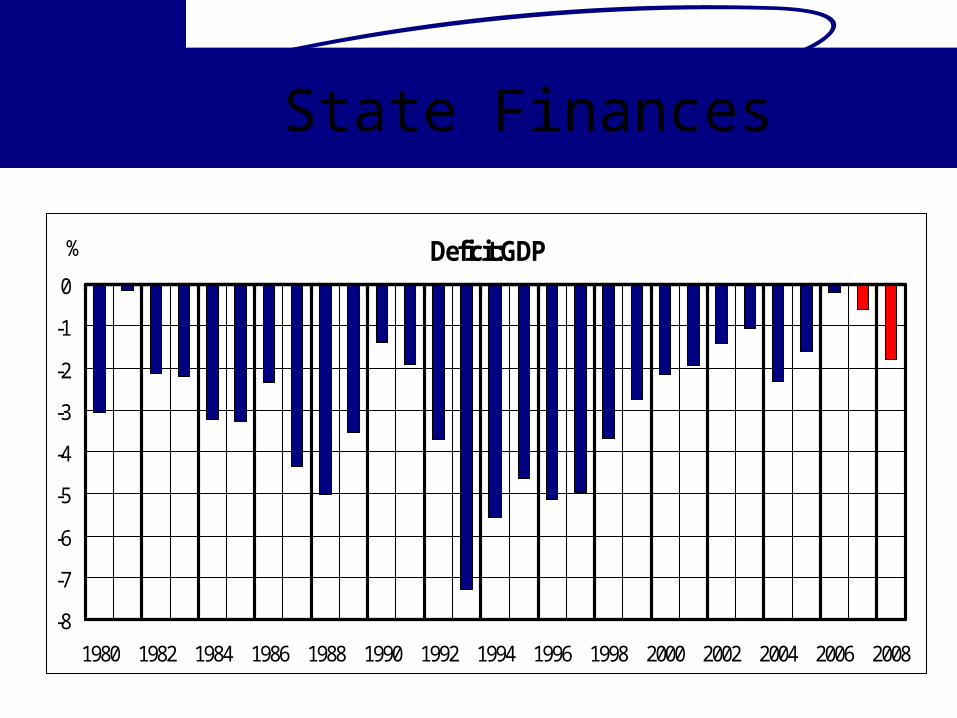
State Finances
Deficit:GDP
-8
-7
-6
-5
-4
-3
-2
-1
0
1980 1982 1984 1986 1988 1990 1992 1994 1996 1998 2000 2002 2004 2006 2008
%
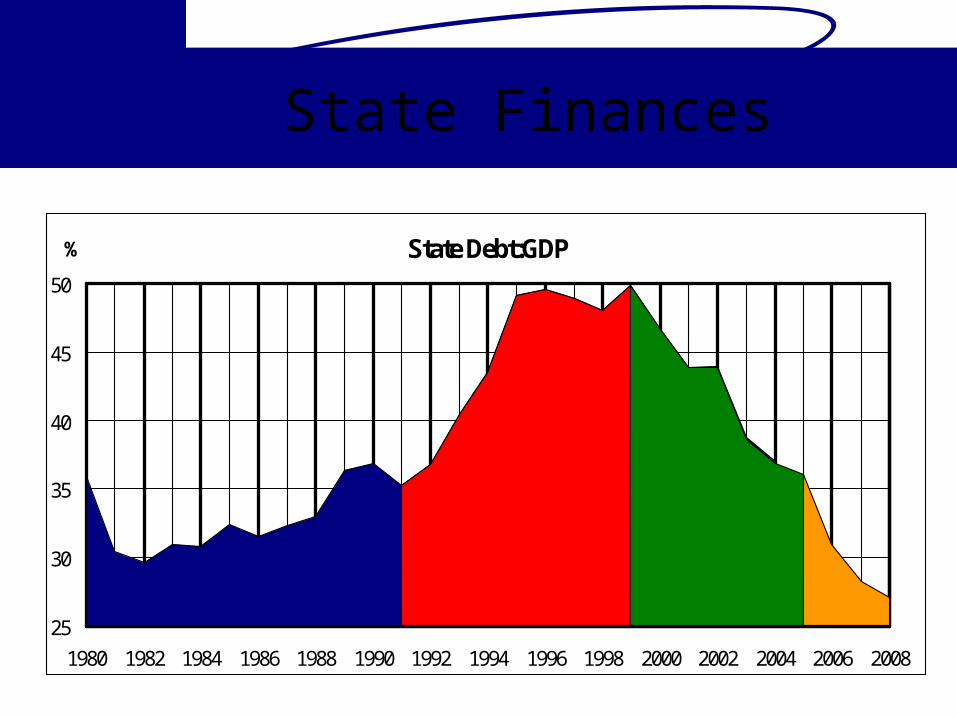
State Finances
State Debt:GDP
25
30
35
40
45
50
1980 1982 1984 1986 1988 1990 1992 1994 1996 1998 2000 2002 2004 2006 2008
%
Debt trapRecovery
Normal Normal
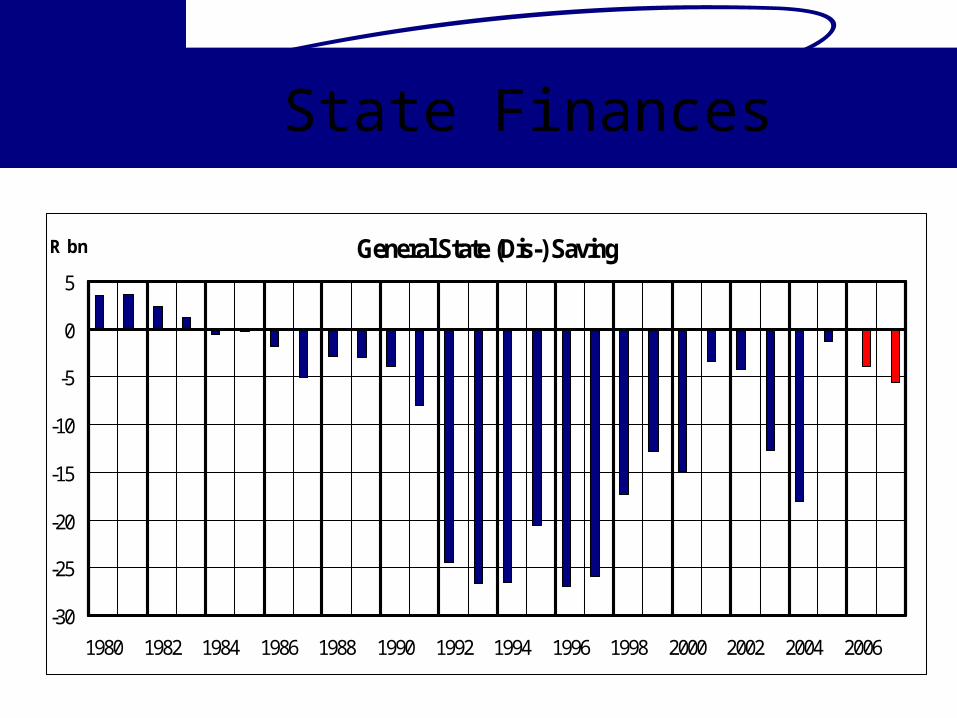
State Finances
General State (Dis-) Saving
-30
-25
-20
-15
-10
-5
0
5
1980 1982 1984 1986 1988 1990 1992 1994 1996 1998 2000 2002 2004 2006
R bn

Monetary Policy
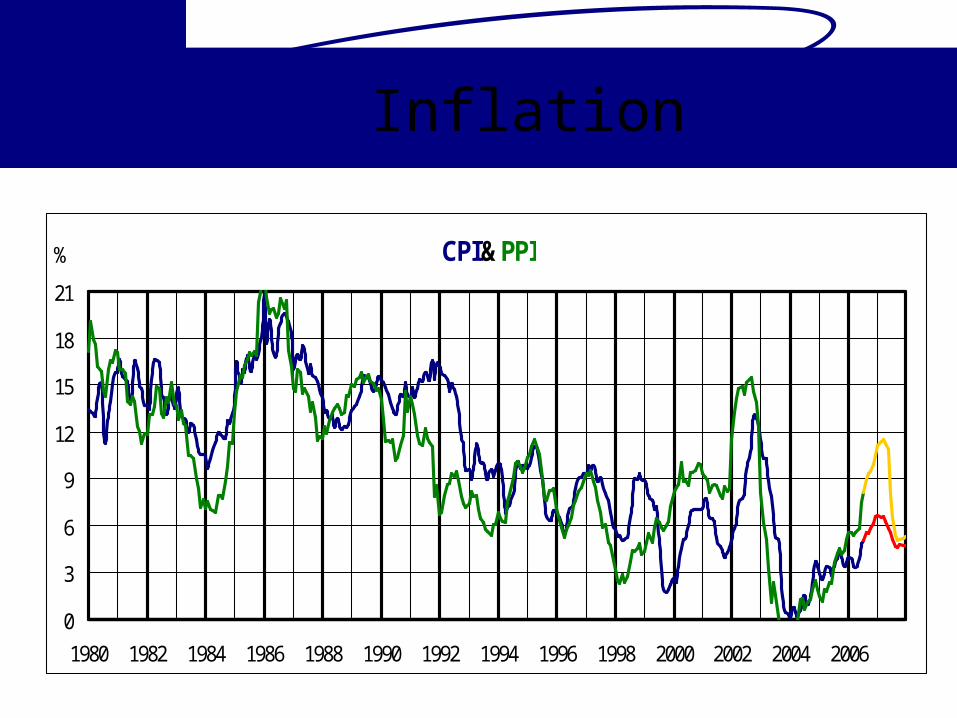
Inflation
CPI & PPI
0
3
6
9
12
15
18
21
1980 1982 1984 1986 1988 1990 1992 1994 1996 1998 2000 2002 2004 2006
%
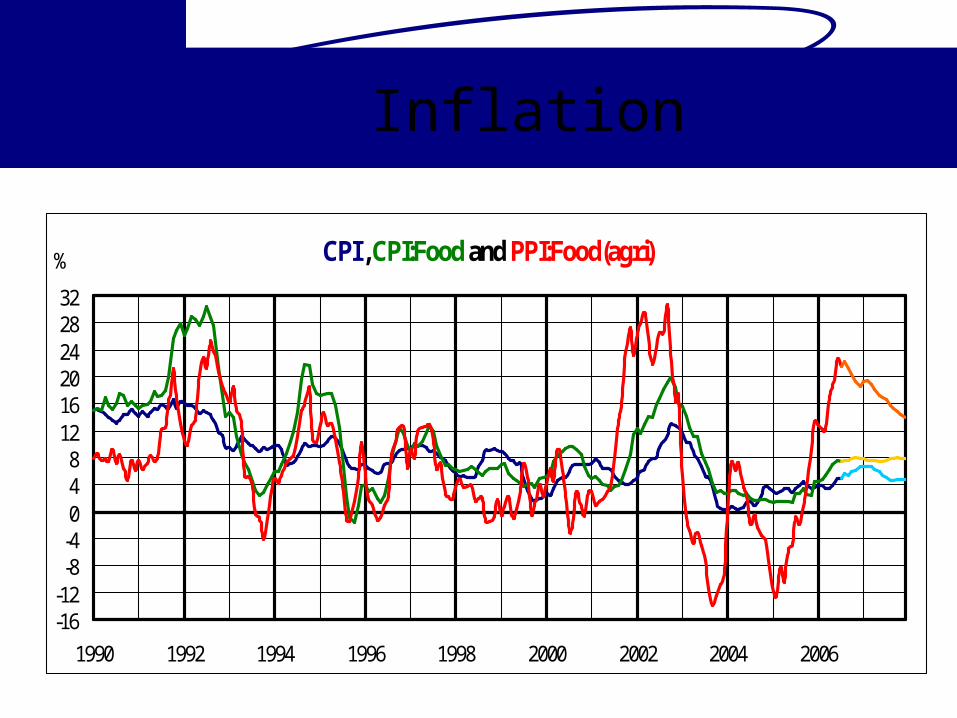
Inflation
CPI , CPI:Food and PPI:Food(agri)
-16-12
-8-4048
121620242832
1990 1992 1994 1996 1998 2000 2002 2004 2006
%
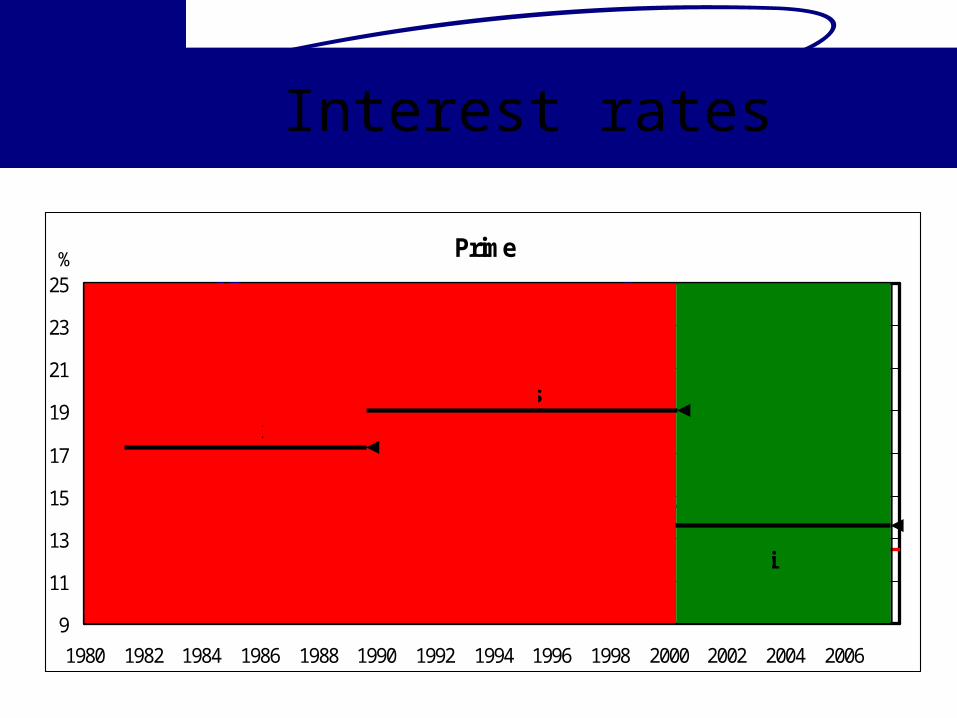
Interest rates
Prime
9
11
13
15
17
19
21
23
25
1980 1982 1984 1986 1988 1990 1992 1994 1996 1998 2000 2002 2004 2006
%
De Kock
Stals
Mboweni
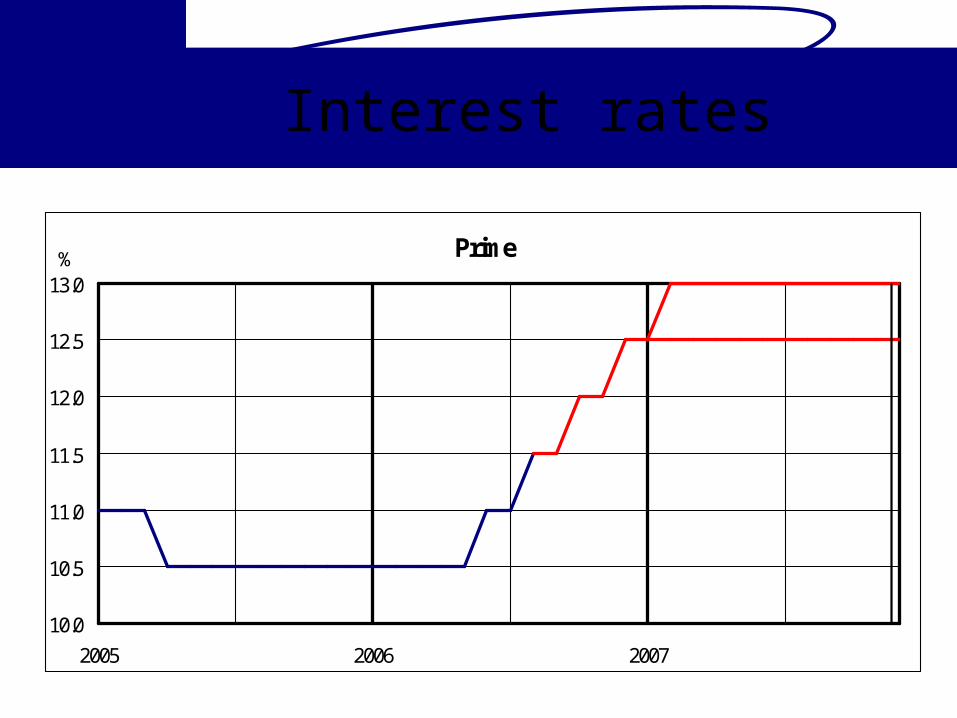
Interest rates
Prime
10.0
10.5
11.0
11.5
12.0
12.5
13.0
2005 2006 2007
%
?
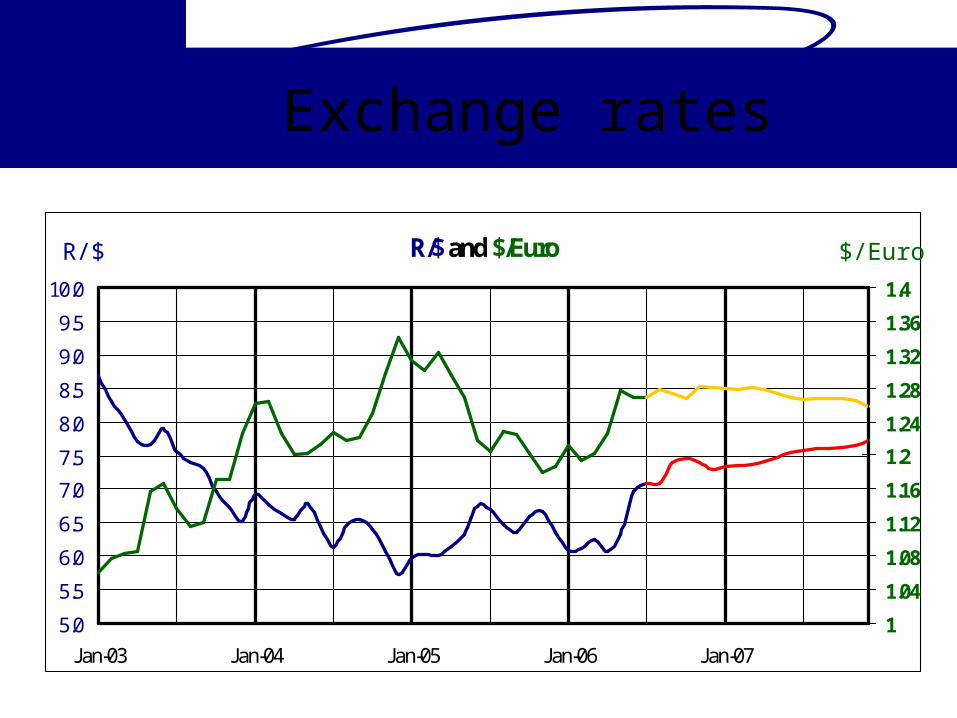
Exchange rates
R/$ and $/Euro
5.0
5.5
6.0
6.5
7.0
7.5
8.0
8.5
9.0
9.5
10.0
Jan-03 Jan-04 Jan-05 Jan-06 Jan-071
1.04
1.08
1.12
1.16
1.2
1.24
1.28
1.32
1.36
1.4
R/$ $/Euro
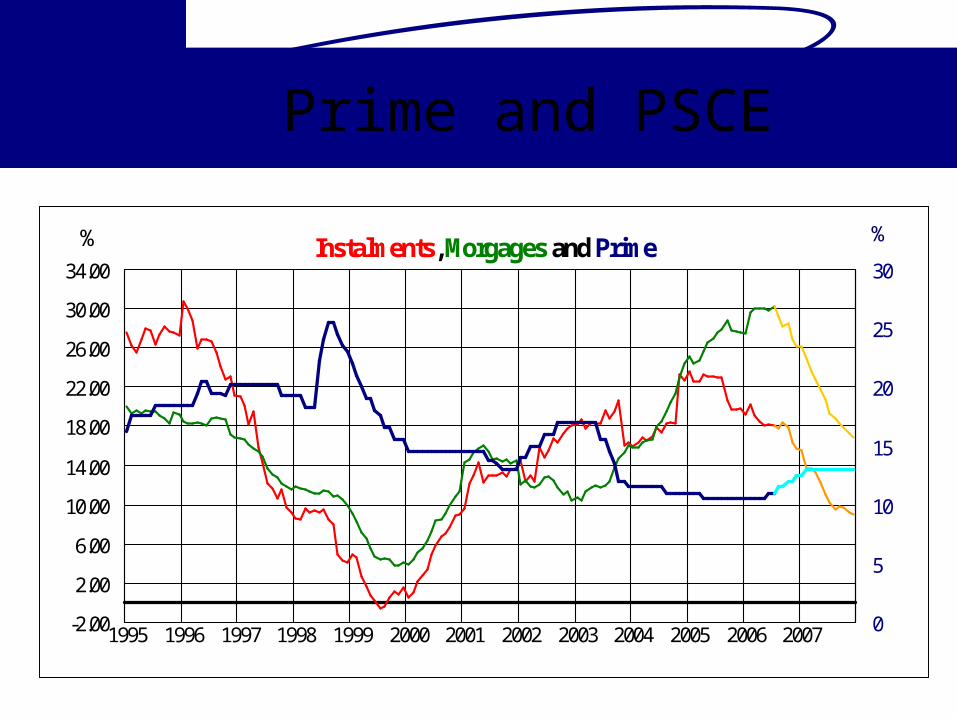
Prime and PSCE
Instalments, Morgages and Prime
-2.00
2.00
6.00
10.00
14.00
18.00
22.00
26.00
30.00
34.00
1995 1996 1997 1998 1999 2000 2001 2002 2003 2004 2005 2006 2007
%
0
5
10
15
20
25
30%
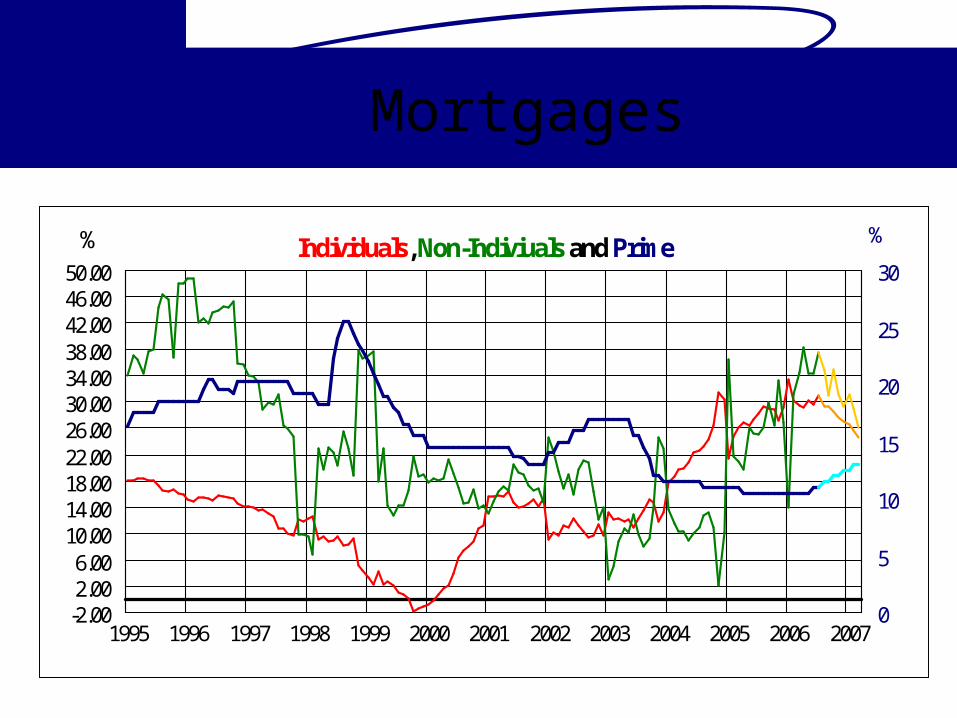
Mortgages
Individuals, Non-Indiviuals and Prime
-2.002.006.00
10.0014.0018.0022.0026.0030.0034.0038.0042.0046.0050.00
1995 1996 1997 1998 1999 2000 2001 2002 2003 2004 2005 2006 2007
%
0
5
10
15
20
25
30
%
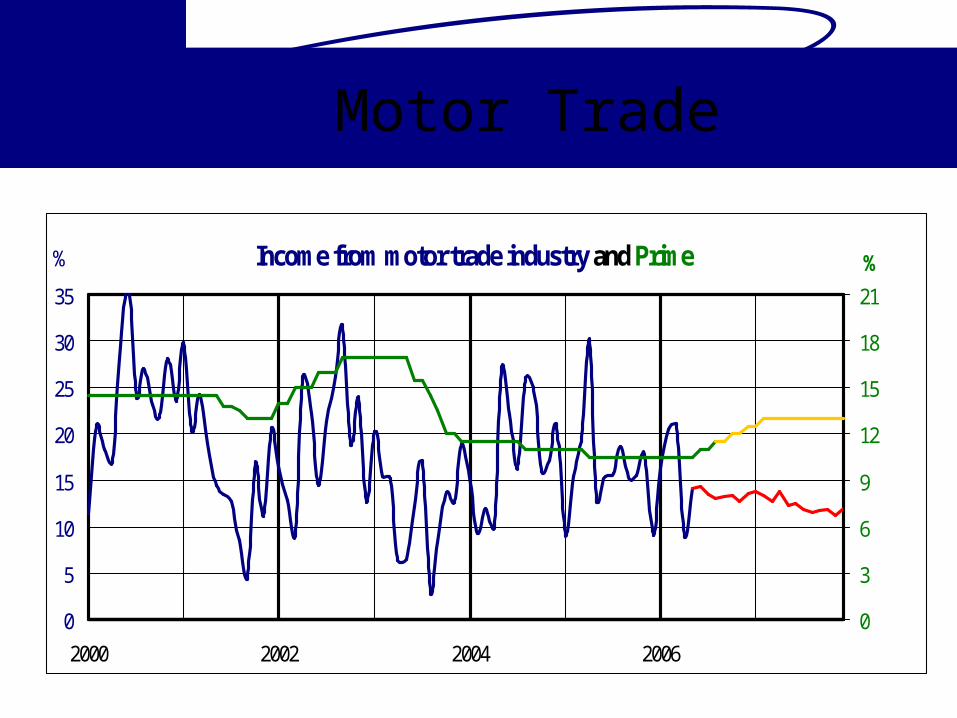
Motor Trade
Income from motor trade industry and Prime
0
5
10
15
20
25
30
35
2000 2002 2004 2006
%
0
3
6
9
12
15
18
21
%
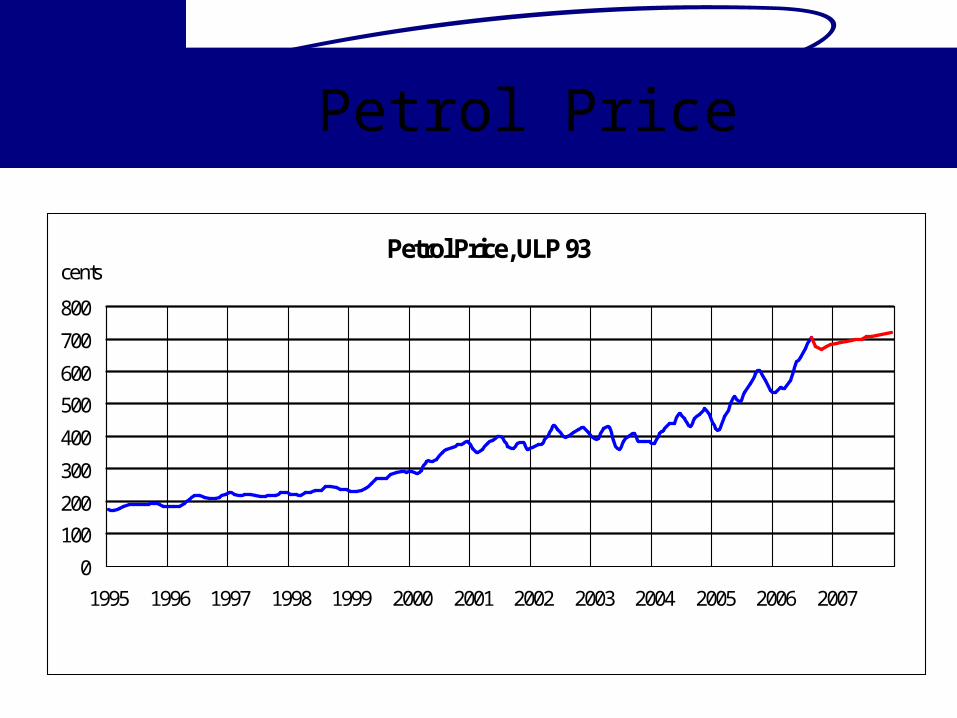
Petrol Price
Petrol Price, ULP 93
0
100
200
300
400
500
600
700
800
1995 1996 1997 1998 1999 2000 2001 2002 2003 2004 2005 2006 2007
cents
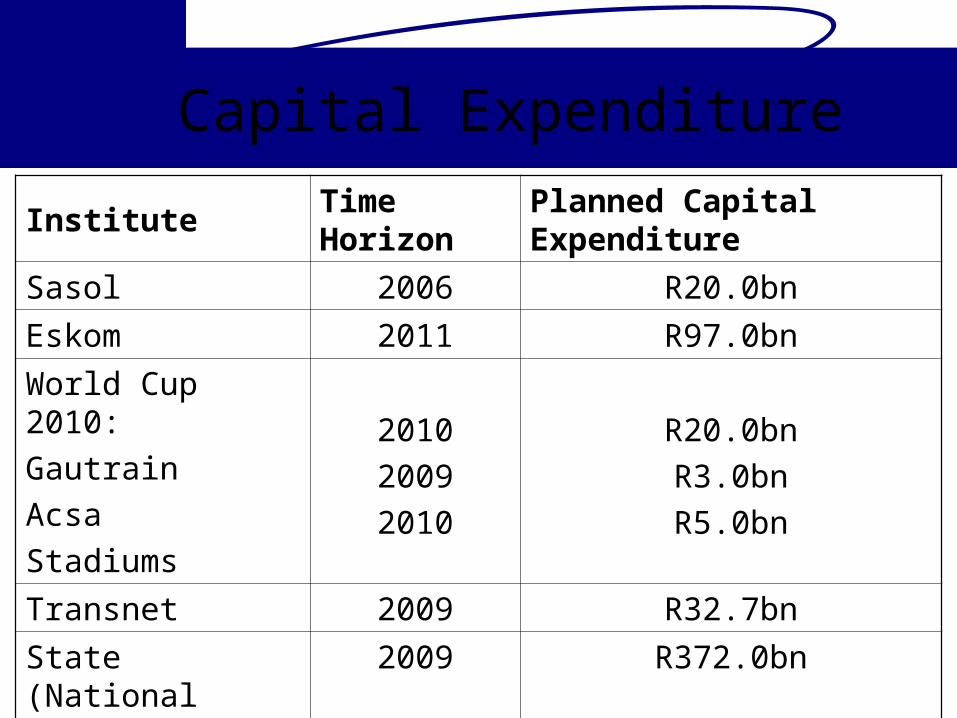
Capital Expenditure Institute Time Horizon Planned Capital Expenditure
Sasol 2006 R20.0bnEskom 2011 R97.0bnWorld Cup 2010:GautrainAcsaStadiums
201020092010
R20.0bnR3.0bnR5.0bn
Transnet 2009 R32.7bnState (National Budget) 2009 R372.0bn

Economic Impact of the 2010 FIFA World Cup
Direct expenditure of R12,7 billion; Contribute R21,3 billion to the GDP of South Africa; Generate the equivalent of 159 000 annual jobs Additional R7,2 billion will be paid to Government in taxes.
Source: Gauteng Tourism Authority

Debt Levels
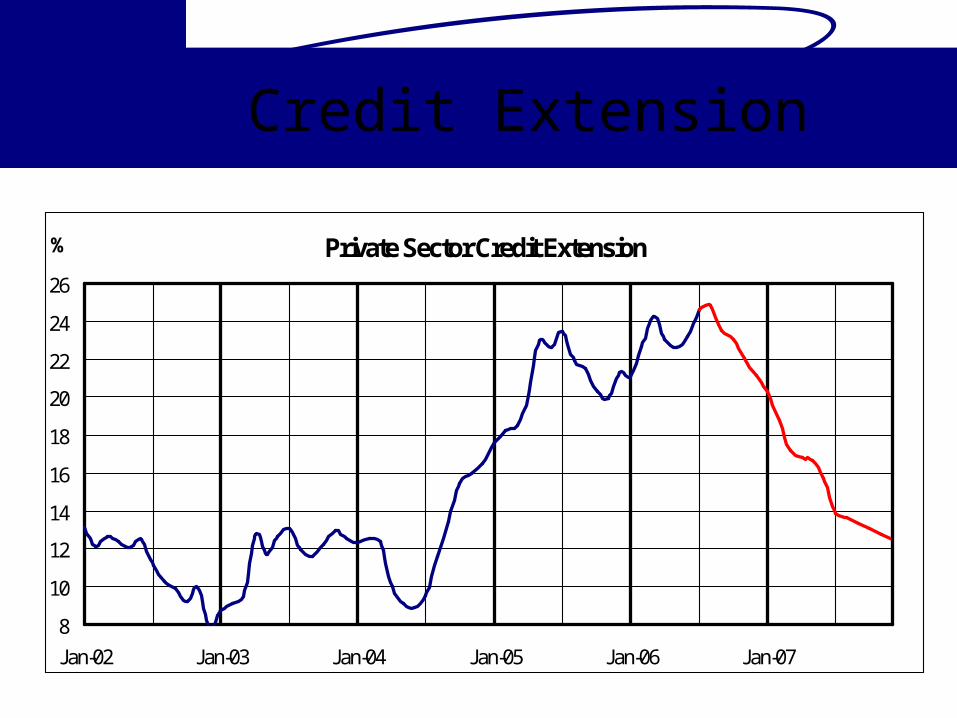
Credit Extension
Private Sector Credit Extension
8
10
12
14
16
18
20
22
24
26
Jan-02 Jan-03 Jan-04 Jan-05 Jan-06 Jan-07
%
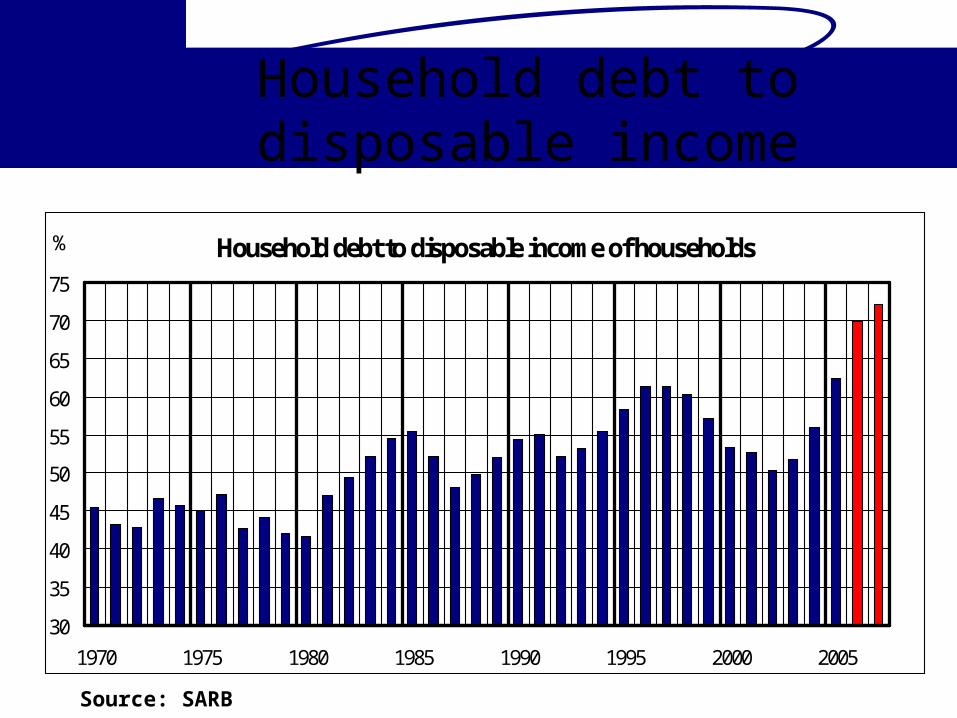
Household debt to disposable income
Household debt to disposable income of households
30
35
40
45
50
55
60
65
70
75
1970 1975 1980 1985 1990 1995 2000 2005
%
Source: SARB
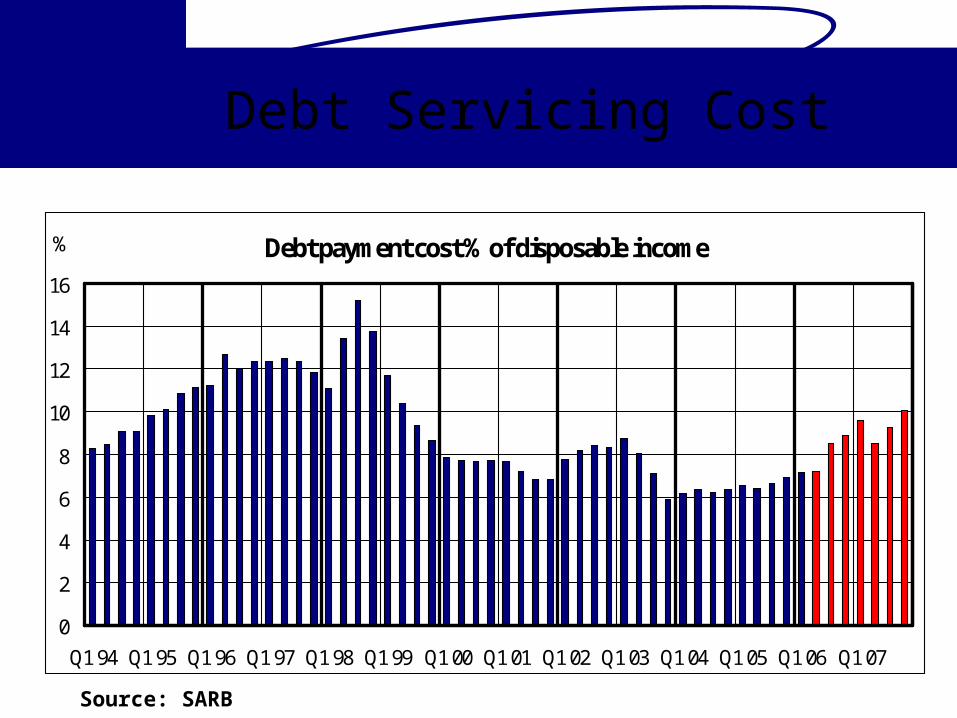
Debt Servicing Cost
Debt payment cost % of disposable income
0
2
4
6
8
10
12
14
16
Q1 94 Q1 95 Q1 96 Q1 97 Q1 98 Q1 99 Q1 00 Q1 01 Q1 02 Q1 03 Q1 04 Q1 05 Q1 06 Q1 07
%
Source: SARB
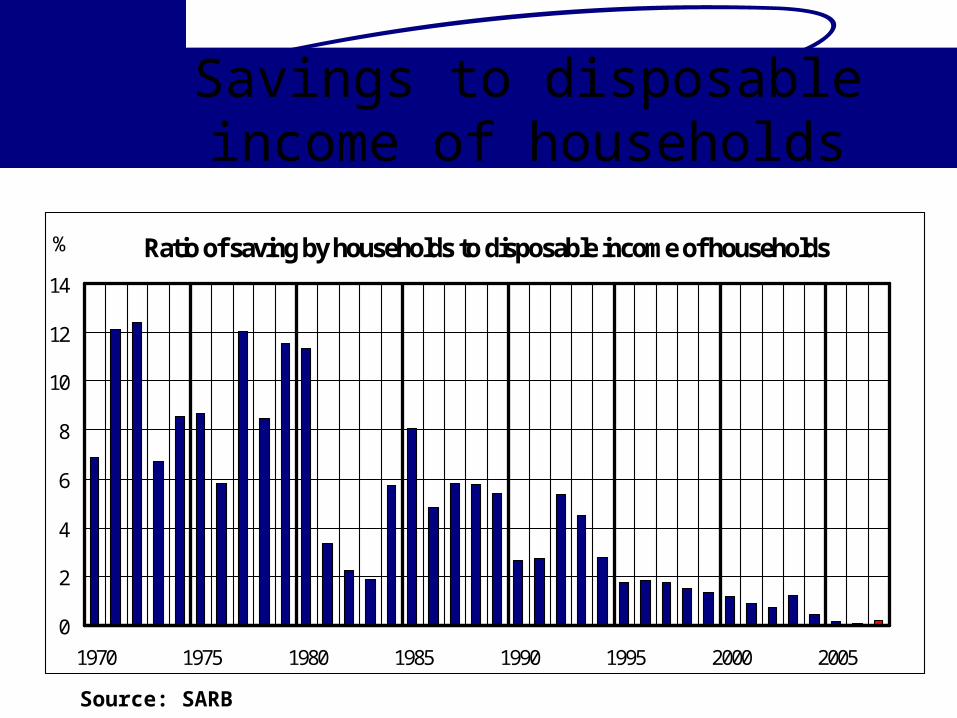
Savings to disposable income of households
Ratio of saving by households to disposable income of households
0
2
4
6
8
10
12
14
1970 1975 1980 1985 1990 1995 2000 2005
%
Source: SARB
Summary Strong capital expenditure Short term inflation risk (PPI) Interest rate in upwards cycle Currency less volatile Effect of interest rate on consumer spending

Building Statistics
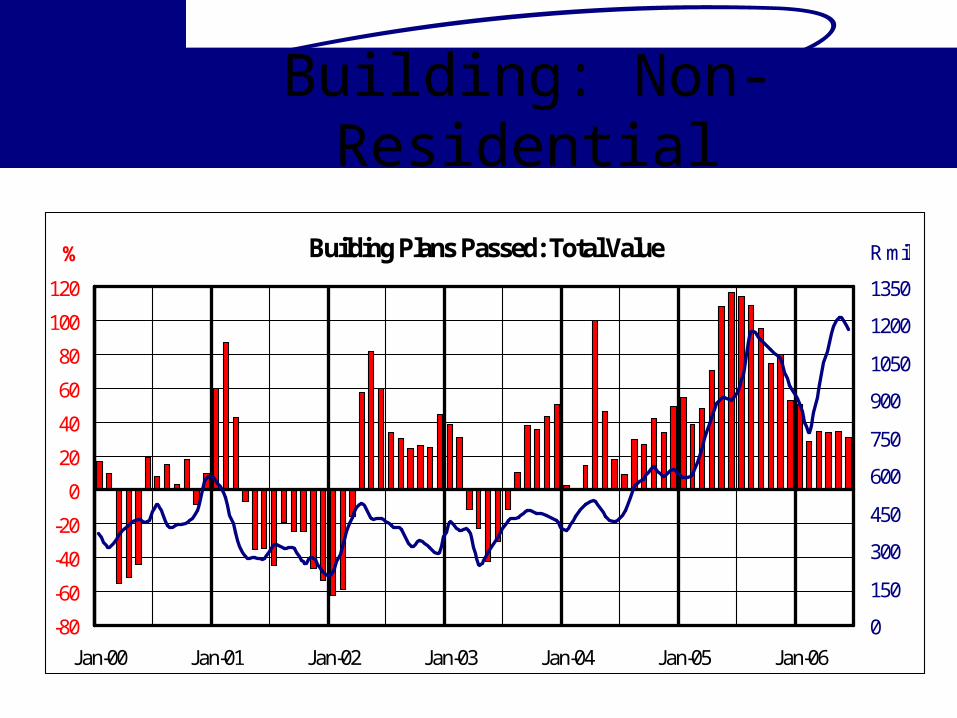
Building: Non-Residential
Building Plans Passed: Total Value
-80
-60
-40
-20
0
20
40
60
80
100
120
Jan-00 Jan-01 Jan-02 Jan-03 Jan-04 Jan-05 Jan-06
%
0
150
300
450
600
750
900
1050
1200
1350
R mil
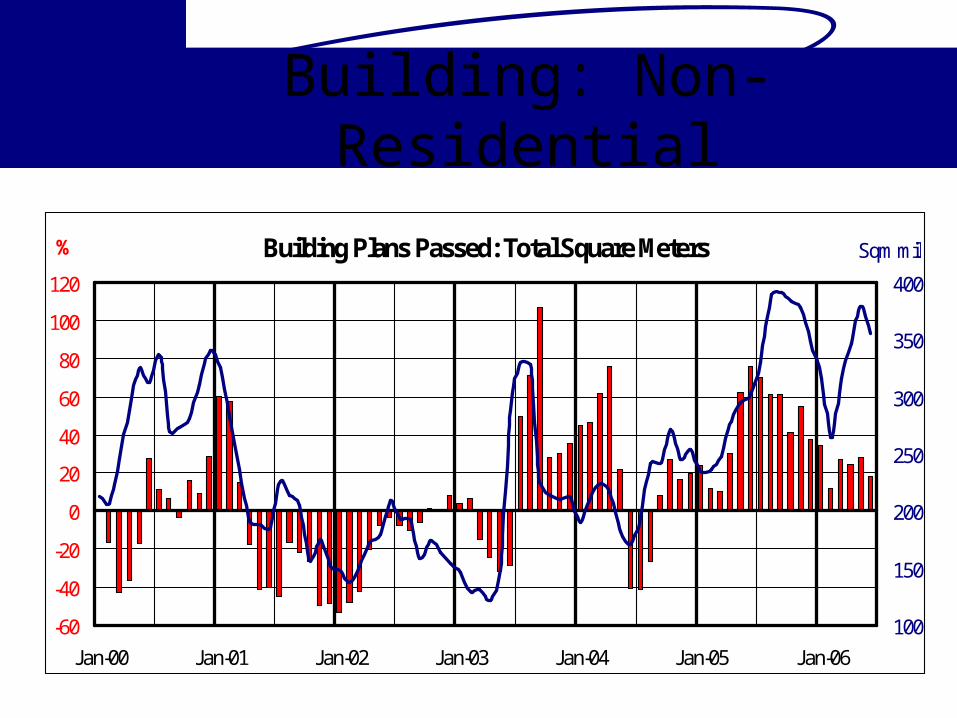
Building: Non-Residential
Building Plans Passed: Total Square Meters
-60
-40
-20
0
20
40
60
80
100
120
Jan-00 Jan-01 Jan-02 Jan-03 Jan-04 Jan-05 Jan-06
%
100
150
200
250
300
350
400
Sqm mil
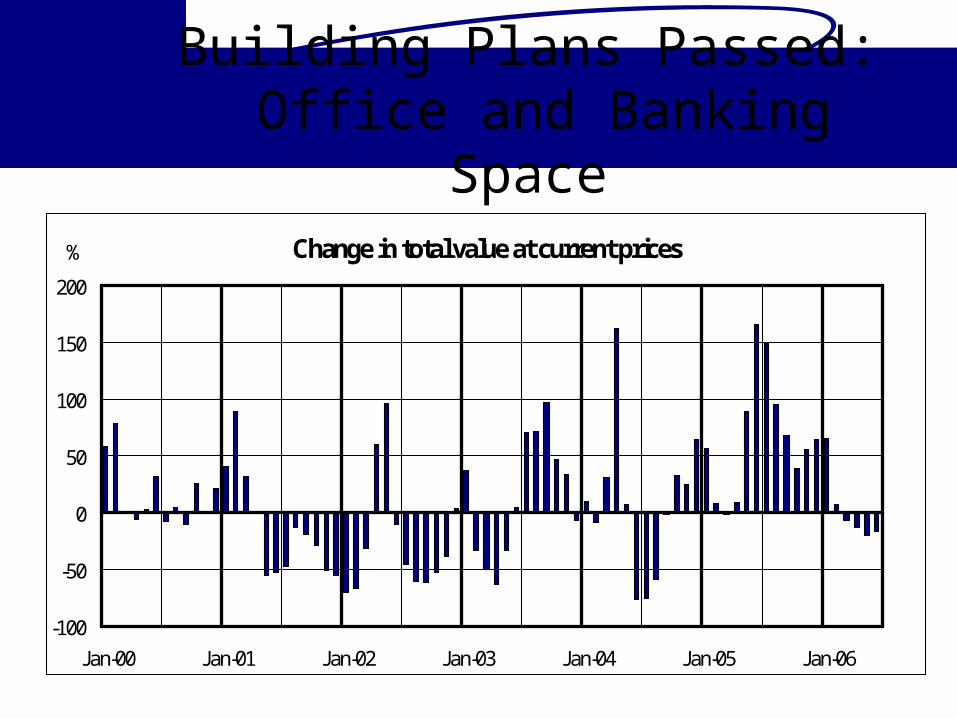
Building Plans Passed: Office and Banking Space
Change in total value at current prices
-100
-50
0
50
100
150
200
Jan-00 Jan-01 Jan-02 Jan-03 Jan-04 Jan-05 Jan-06
%
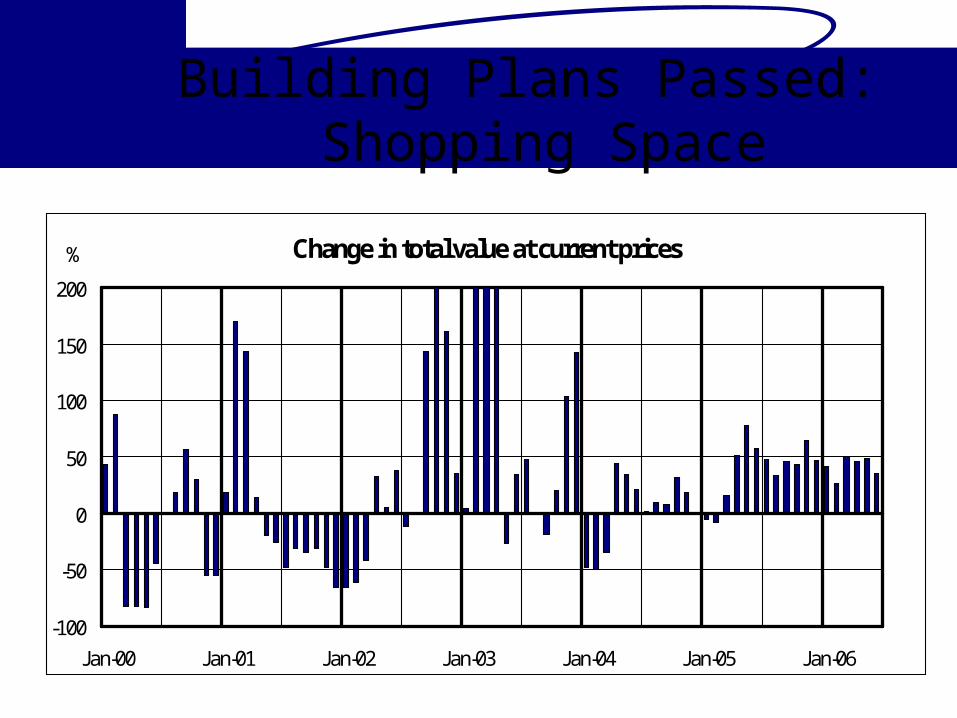
Building Plans Passed: Shopping Space
Change in total value at current prices
-100
-50
0
50
100
150
200
Jan-00 Jan-01 Jan-02 Jan-03 Jan-04 Jan-05 Jan-06
%
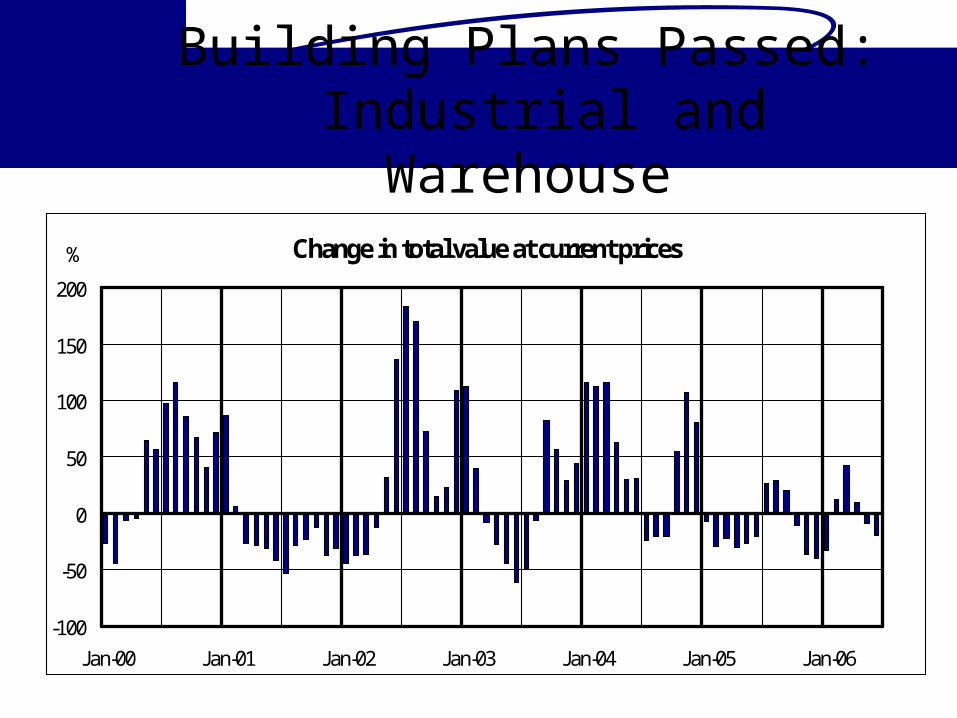
Building Plans Passed: Industrial and Warehouse
Change in total value at current prices
-100
-50
0
50
100
150
200
Jan-00 Jan-01 Jan-02 Jan-03 Jan-04 Jan-05 Jan-06
%

Balance of Payments
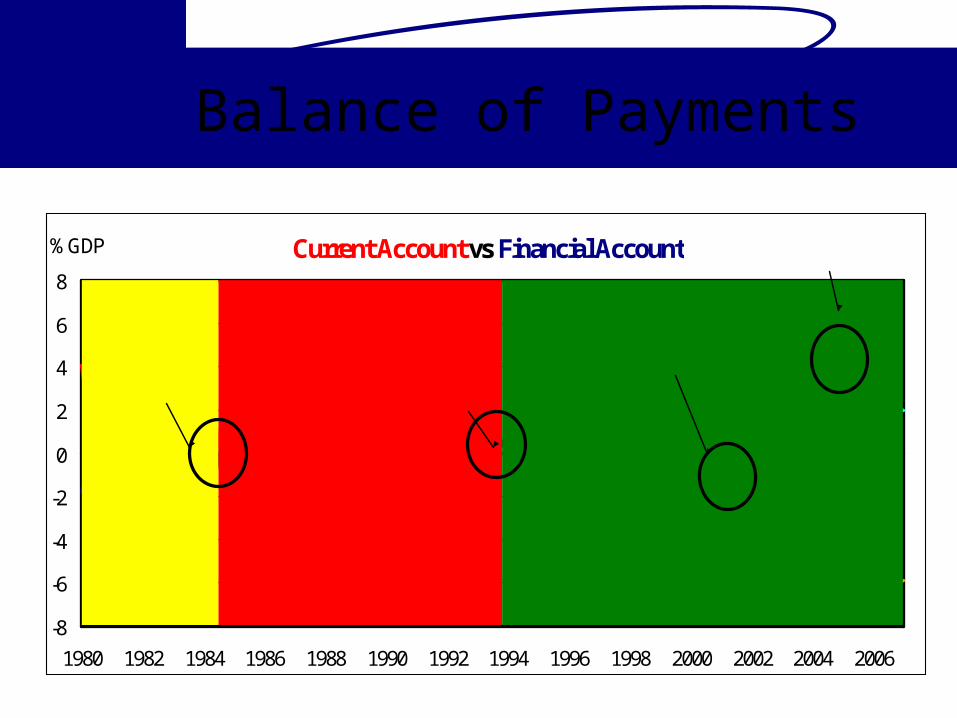
Balance of Payments
Current Account vs Financial Account
-8
-6
-4
-2
0
2
4
6
8
1980 1982 1984 1986 1988 1990 1992 1994 1996 1998 2000 2002 2004 2006
% GDPBarclays/Absa
De Beers delisting
Sanctions liftedDebt Standstill
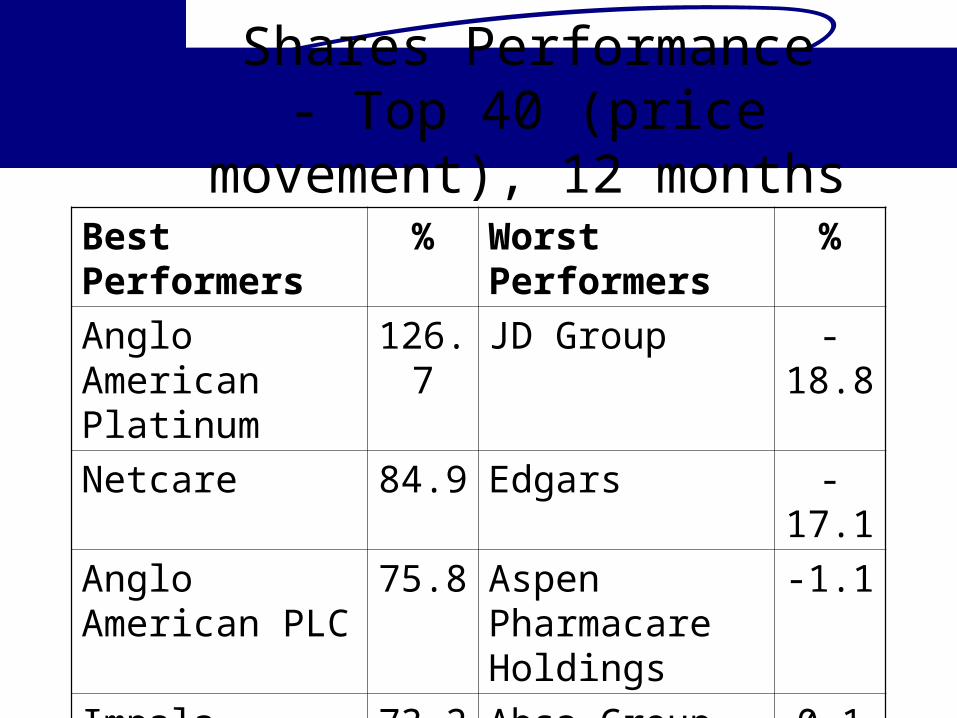
Shares Performance- Top 40 (price movement), 12 months
Best Performers % Worst Performers %
Anglo American Platinum
126.7 JD Group -18.8
Netcare 84.9 Edgars -17.1
Anglo American PLC
75.8 Aspen Pharmacare Holdings
-1.1
Impala Platinum 73.2 Absa Group Limited 0.1
Gold Fields 72.4 Pick ‘n Pay 0.4

A comparison
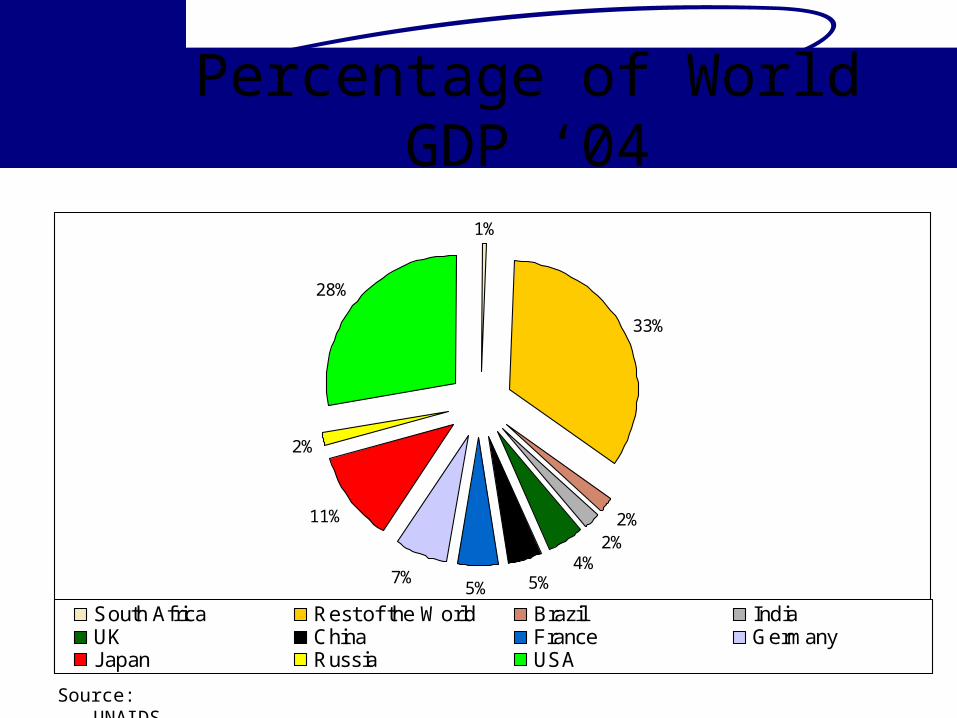
Percentage of World GDP ‘04
1%
33%
2%2%
4%5%5%
7%
11%
2%
28%
South Africa Rest of the World Brazil IndiaUK China France GermanyJapan Russia USA
Source: UNAIDS
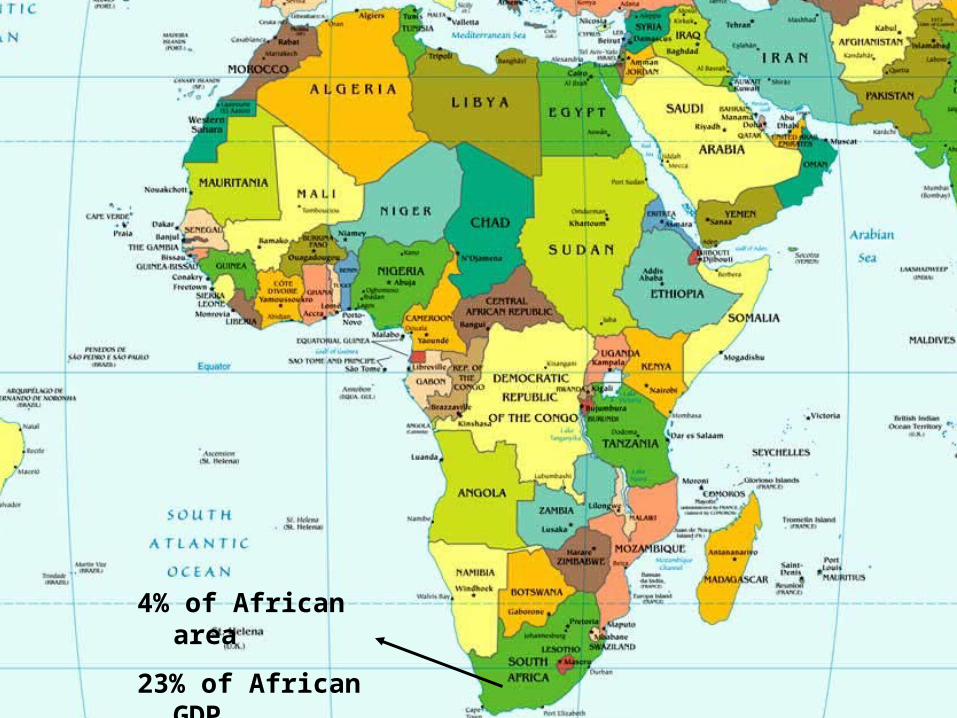
4% of African area
23% of African GDP
21.2% of African Exports
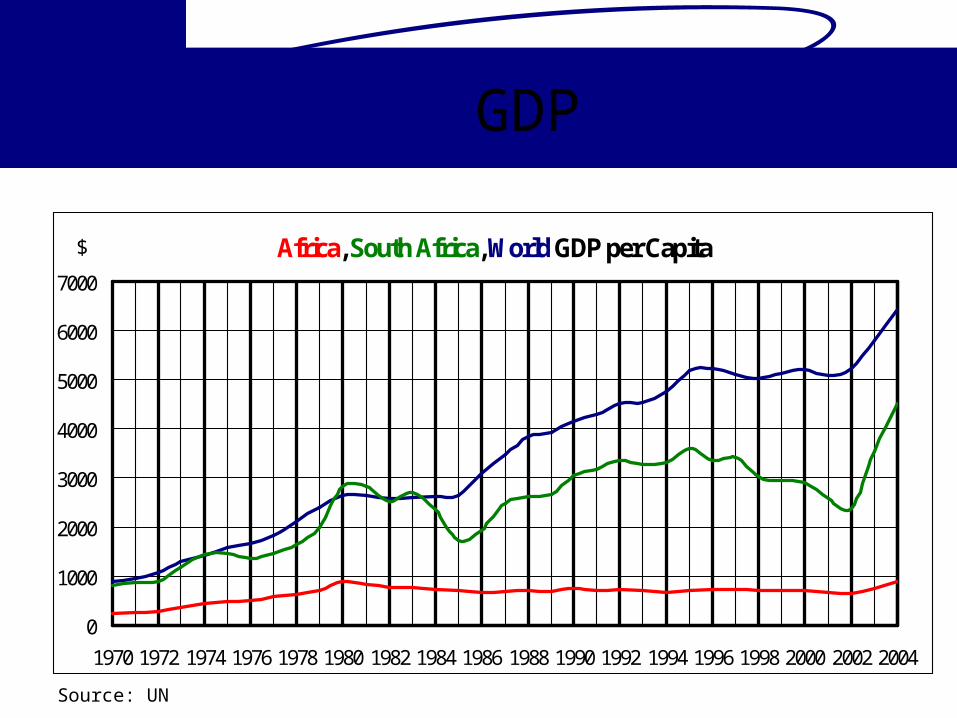
GDP
Africa, South Africa, World GDP per Capita
0
1000
2000
3000
4000
5000
6000
7000
1970 1972 1974 1976 1978 1980 1982 1984 1986 1988 1990 1992 1994 1996 1998 2000 2002 2004
$
Source: UN
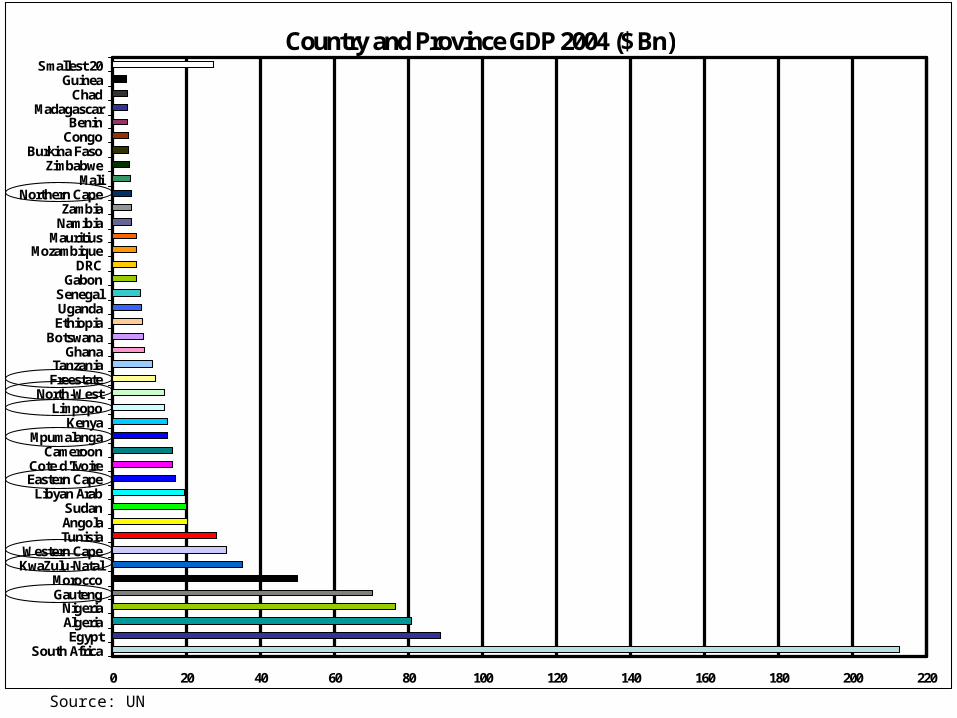
Countries Compared to Provinces
Country and Province GDP 2004 ($ Bn)
0 20 40 60 80 100 120 140 160 180 200 220
South AfricaEgypt
AlgeriaNigeria
GautengMorocco
KwaZulu-NatalWestern Cape
TunisiaAngolaSudan
Libyan ArabEastern CapeCote d'Ivoire
CameroonMpumalanga
KenyaLimpopo
North-WestFreestateTanzania
GhanaBotswana
EthiopiaUgandaSenegal
GabonDRC
MozambiqueMauritius
NamibiaZambia
Northern CapeMali
ZimbabweBurkina Faso
CongoBenin
MadagascarChad
GuineaSmallest 20
Source: UN
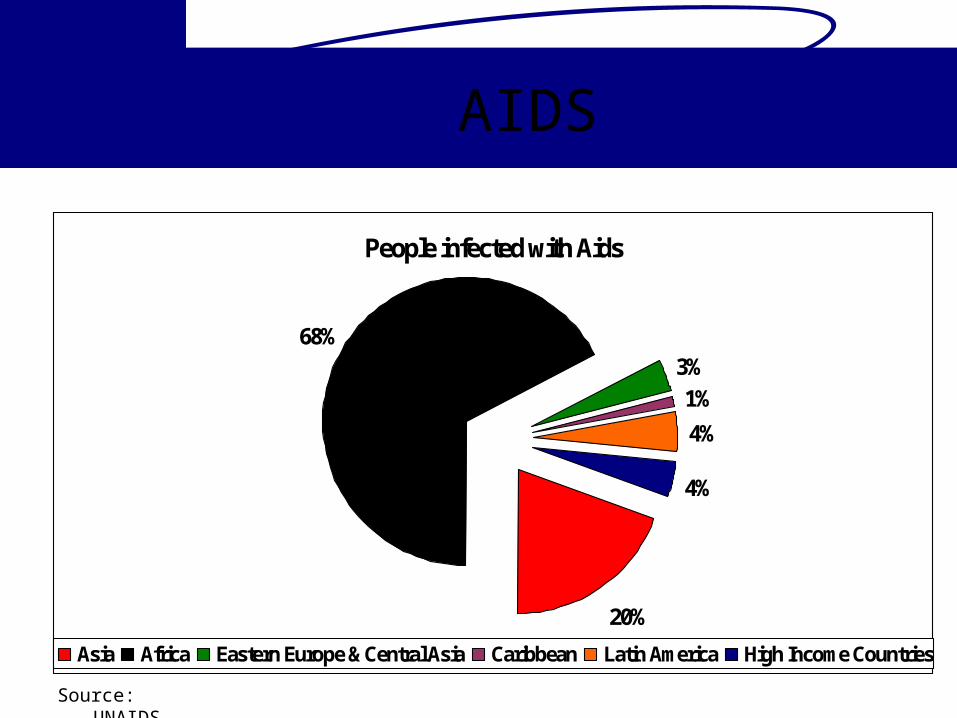
AIDS
People infected with Aids
20%
68%3%1%
4%
4%
Asia Africa Eastern Europe & Central Asia Caribbean Latin America High Income Countries
Source: UNAIDS
Mistakes made in Africa Private Property Rights Regulated Prices Idolise Leaders Marketing Boards Nepotism Incompetence Corruption Poor Fiscal Discipline Poor Monetary Policy Unrealistic Projects
?
?
?
?
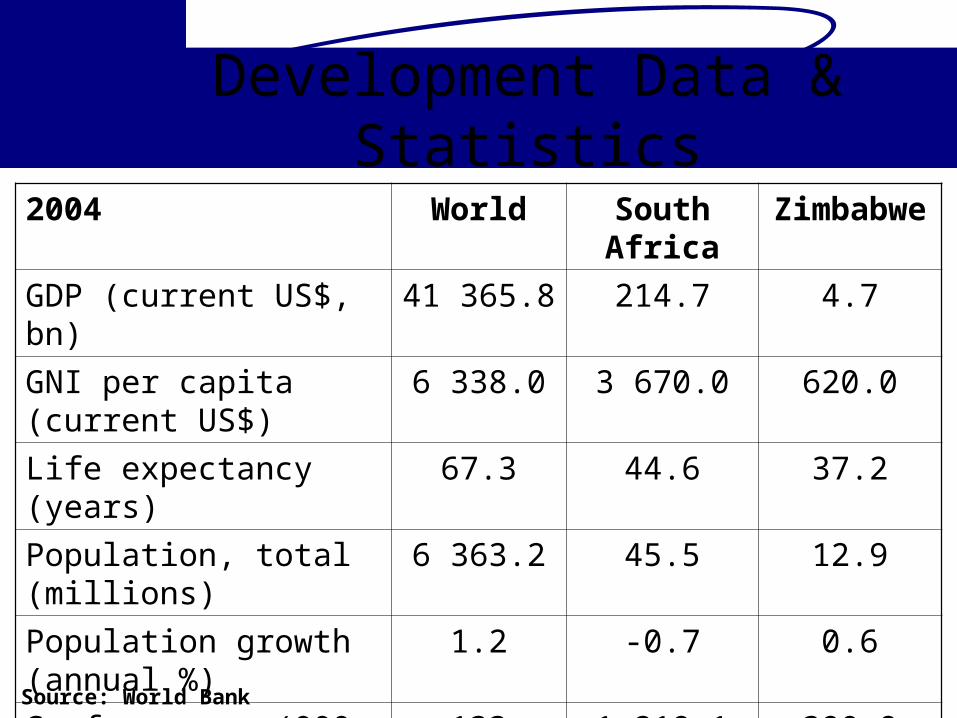
Development Data & Statistics
2004 World South Africa Zimbabwe
GDP (current US$, bn) 41 365.8 214.7 4.7
GNI per capita (current US$) 6 338.0 3 670.0 620.0
Life expectancy (years) 67.3 44.6 37.2
Population, total (millions) 6 363.2 45.5 12.9
Population growth (annual %) 1.2 -0.7 0.6
Surface area (000, sq km) 133 940.9 1 219.1 390.8
Source: World Bank
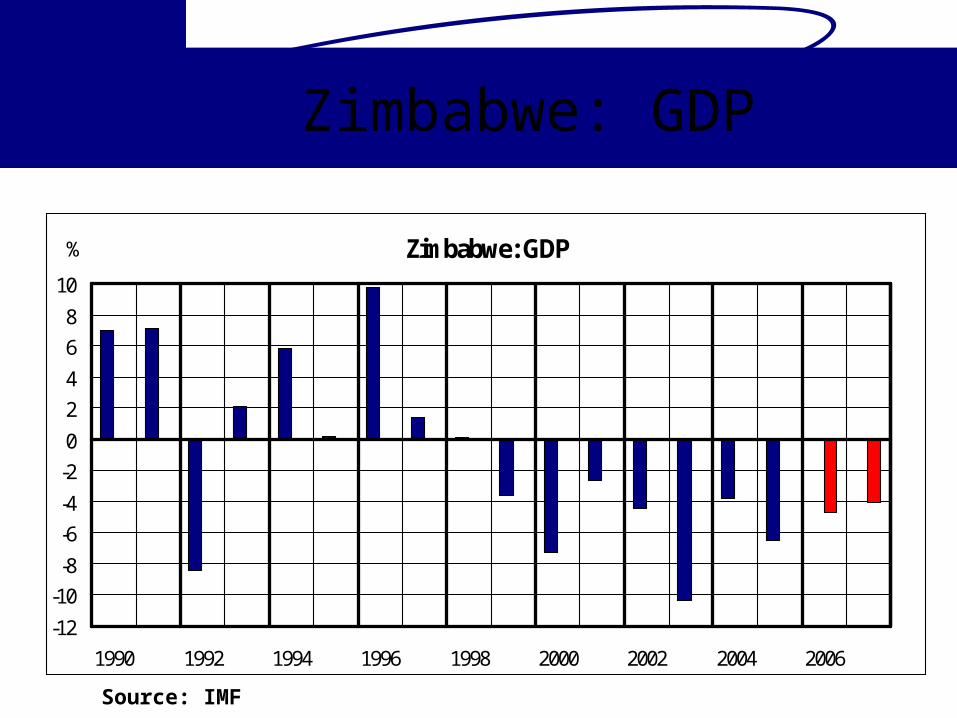
Zimbabwe: GDP
Zimbabwe: GDP
-12
-10-8
-6-4
-20
24
68
10
1990 1992 1994 1996 1998 2000 2002 2004 2006
%
Source: IMF
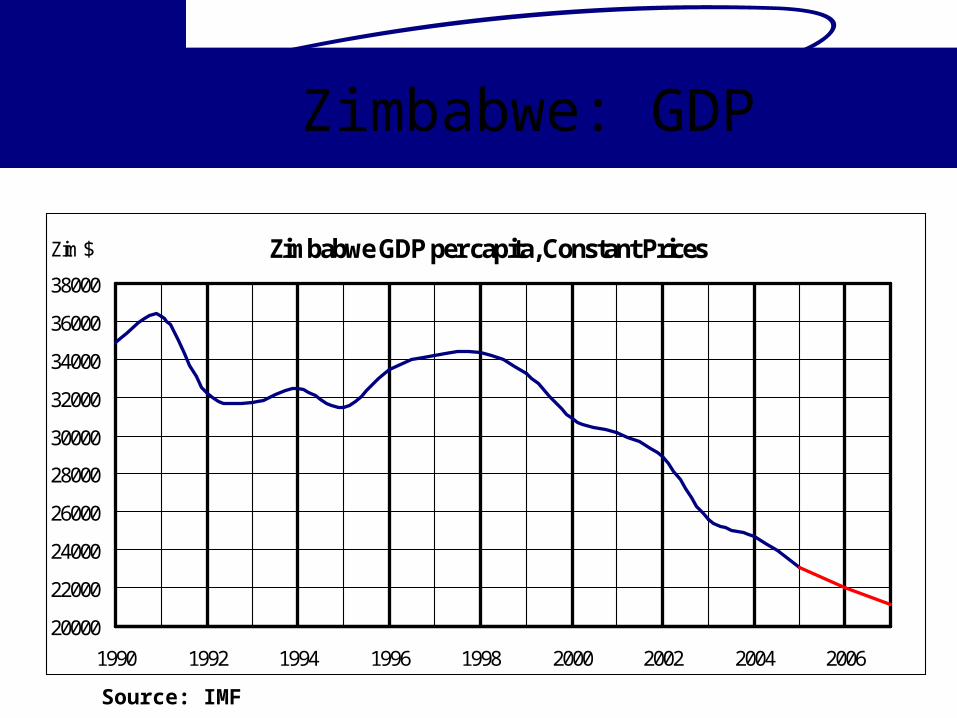
Zimbabwe: GDP
Zimbabwe GDP per capita, Constant Prices
20000
22000
24000
26000
28000
30000
32000
34000
36000
38000
1990 1992 1994 1996 1998 2000 2002 2004 2006
Zim $
Source: IMF

Zimbabwe: Inflation
Zimbabwe: Inflation
0100200300400500600700800900
1990
1991
1992
1993
1994
1995
1996
1997
1998
1999
2000
2001
2002
2003
2004
2005
2006
2007
%
Source: IMF

Asset Allocation
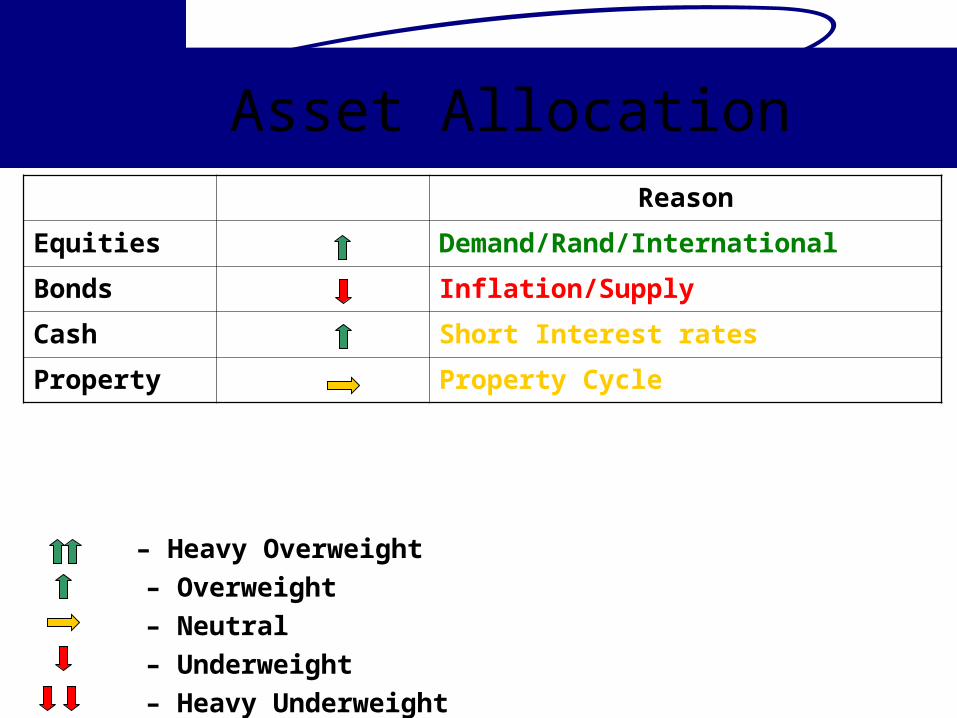
Asset Allocation Reason
Equities Demand/Rand/International
Bonds Inflation/Supply
Cash Short Interest rates
Property Property Cycle
– Heavy Overweight
– Overweight
– Neutral
– Underweight
– Heavy Underweight
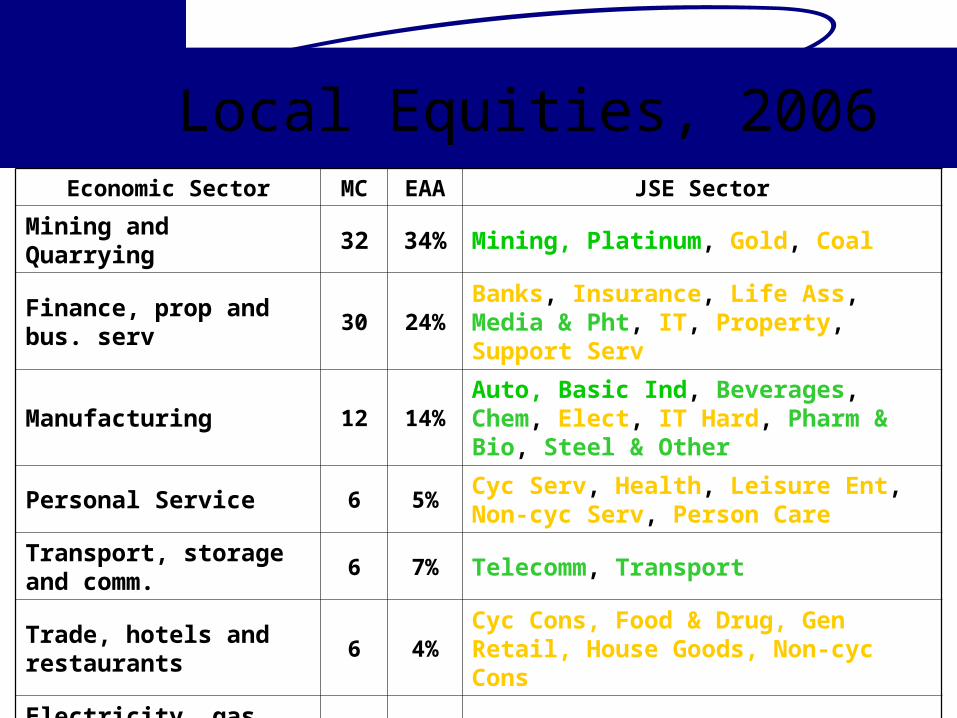
Local Equities, 2006Economic Sector MC EAA JSE Sector
Mining and Quarrying 32 34% Mining, Platinum, Gold, Coal
Finance, prop and bus. serv 30 24%Banks, Insurance, Life Ass, Media & Pht, IT, Property, Support Serv
Manufacturing 12 14%Auto, Basic Ind, Beverages, Chem, Elect, IT Hard, Pharm & Bio, Steel & Other
Personal Service 6 5%Cyc Serv, Health, Leisure Ent, Non-cyc Serv, Person Care
Transport, storage and comm. 6 7% Telecomm, Transport
Trade, hotels and restaurants 6 4%Cyc Cons, Food & Drug, Gen Retail, House Goods, Non-cyc Cons
Electricity, gas and water 4 3% Oil & Gas
Agri, Forestry and Fishing 3 1% Food Prod
Construction 2 8% Const & Build
100 100%

www.efgroup.co.za