Embed Size (px)
Citation preview
Presented by: Dawie Roodt23 January 2007
Time for Real Tax Cuts

Chairman and Chief EconomistEfficient Group81 Dely Road
Hazelwood0081
Tel: (012) 460-9580Cell: 082 456 0204
Email: [email protected]
Dawie Roodt

Economic Overview
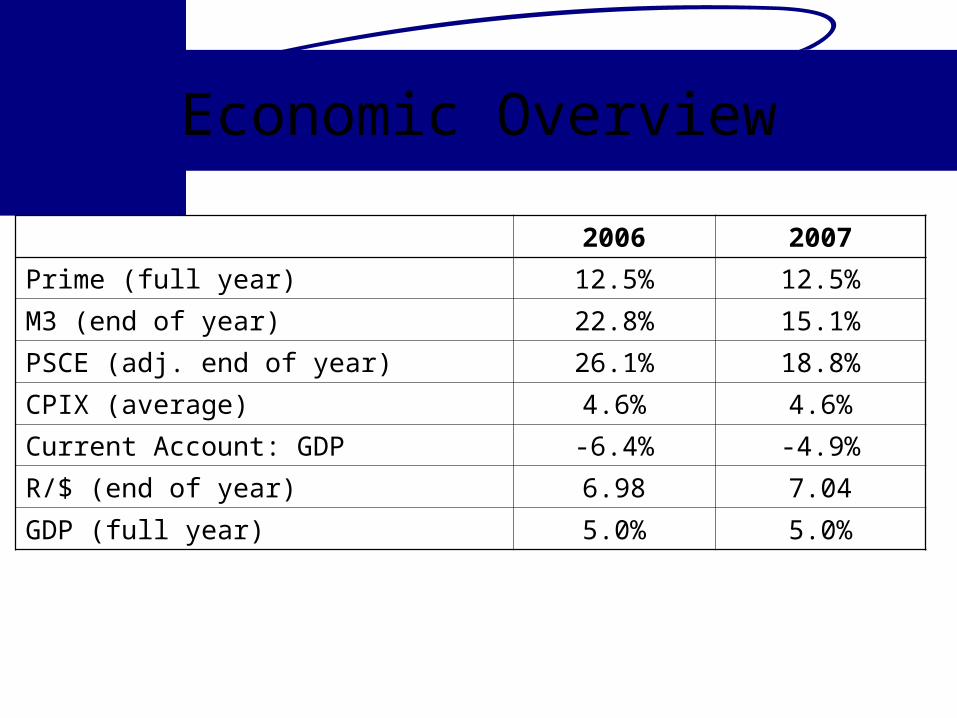
2006 2007
Prime (full year) 12.5% 12.5%
M3 (end of year) 22.8% 15.1%
PSCE (adj. end of year) 26.1% 18.8%
CPIX (average) 4.6% 4.6%
Current Account: GDP -6.4% -4.9%
R/$ (end of year) 6.98 7.04
GDP (full year) 5.0% 5.0%
Economic Overview

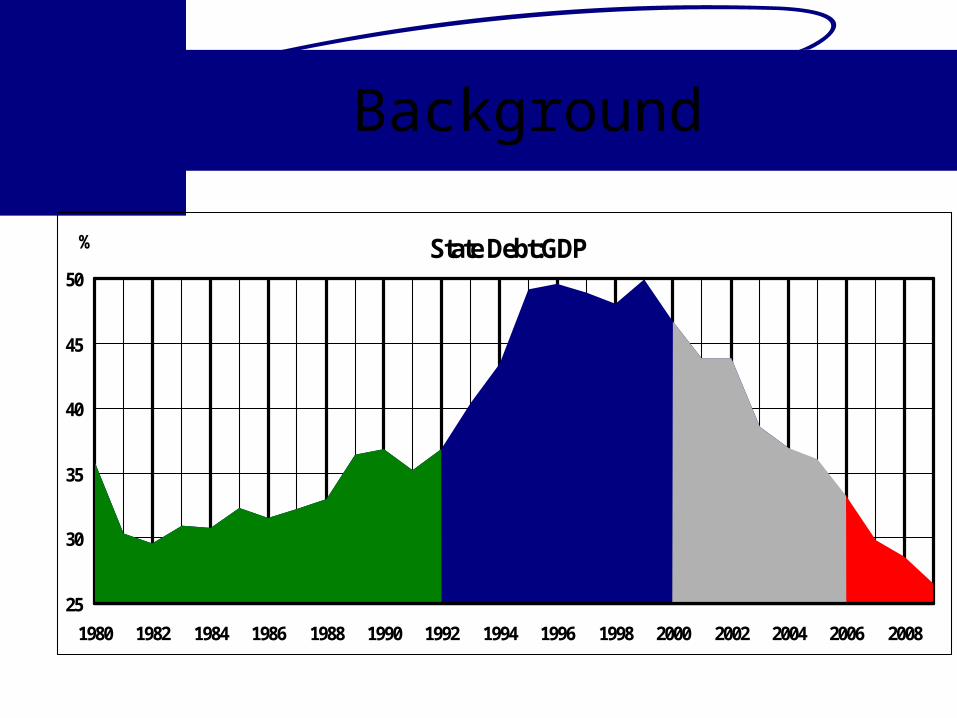
Background
Individual & Corporate Credit Demand
5
10
15
20
25
30
35
Jan-05 May-05 Sep-05 Jan-06 May-06 Sep-06
%
Individual Non - Individuals

Background

Background
Revenue & Expenditure:GDP
20
21
22
23
24
25
26
27
28
29
30
1980 1982 1984 1986 1988 1990 1992 1994 1996 1998 2000 2002 2004 2006 2008
%
Gold
Trevor’s reign!

Background
Deficit:GDP
-8
-7
-6
-5
-4
-3
-2
-1
0
1
1980 1982 1984 1986 1988 1990 1992 1994 1996 1998 2000 2002 2004 2006 2008
%
Background
State Debt:GDP
25
30
35
40
45
50
1980 1982 1984 1986 1988 1990 1992 1994 1996 1998 2000 2002 2004 2006 2008
%
Good/Stable
Debt Trap Recovery
…Contributed to
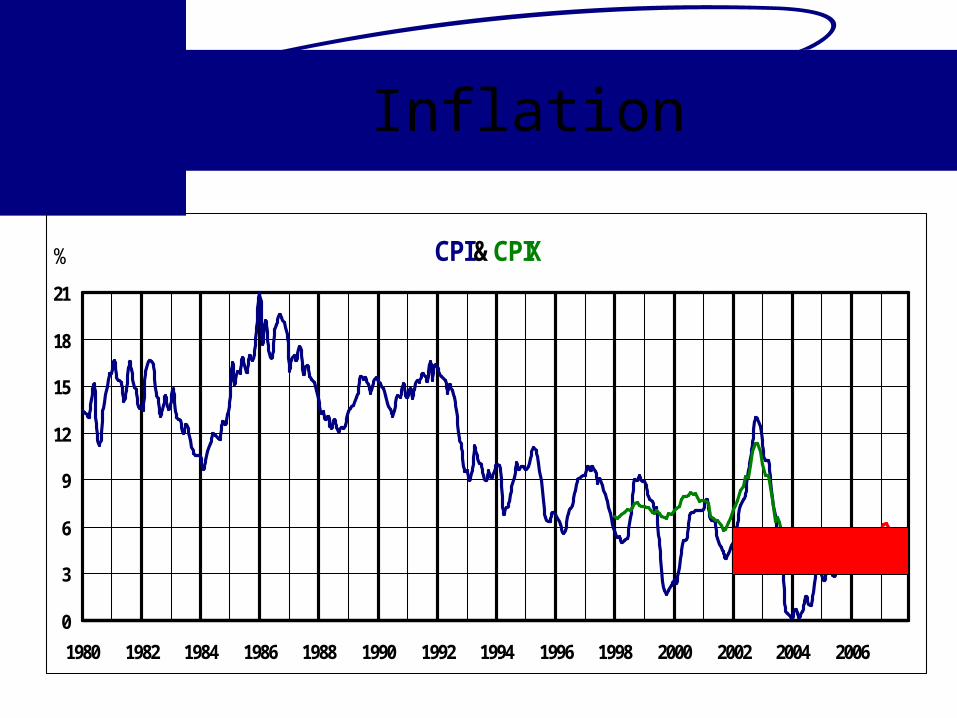
Inflation
CPI & CPIX
0
3
6
9
12
15
18
21
1980 1982 1984 1986 1988 1990 1992 1994 1996 1998 2000 2002 2004 2006
%
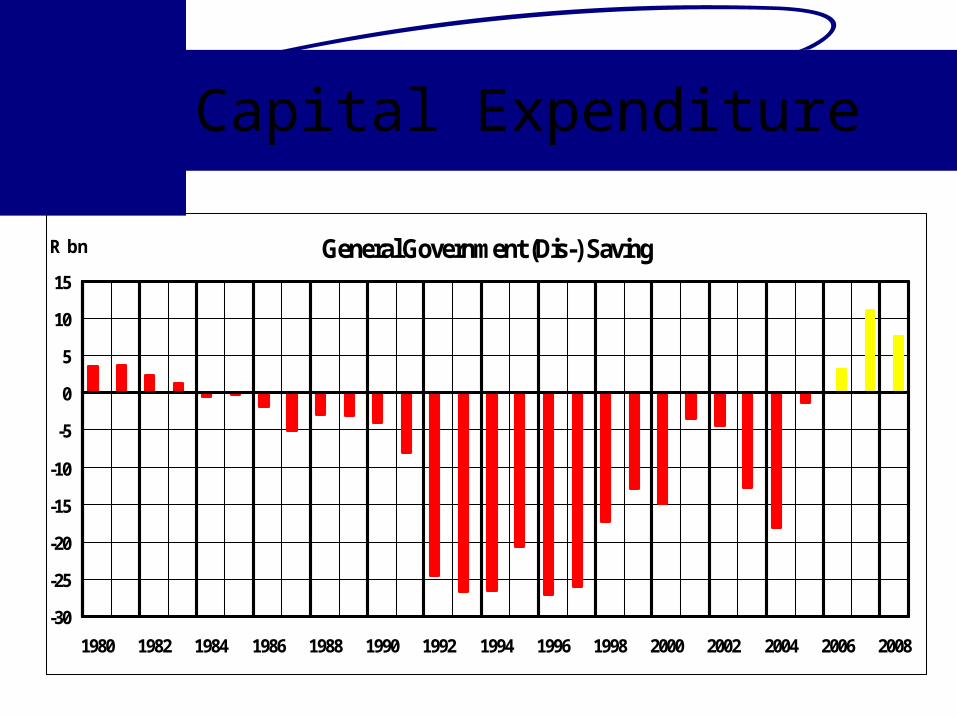
Capital Expenditure
General Government (Dis-) Saving
-30
-25
-20
-15
-10
-5
0
5
10
15
1980 1982 1984 1986 1988 1990 1992 1994 1996 1998 2000 2002 2004 2006 2008
R bn
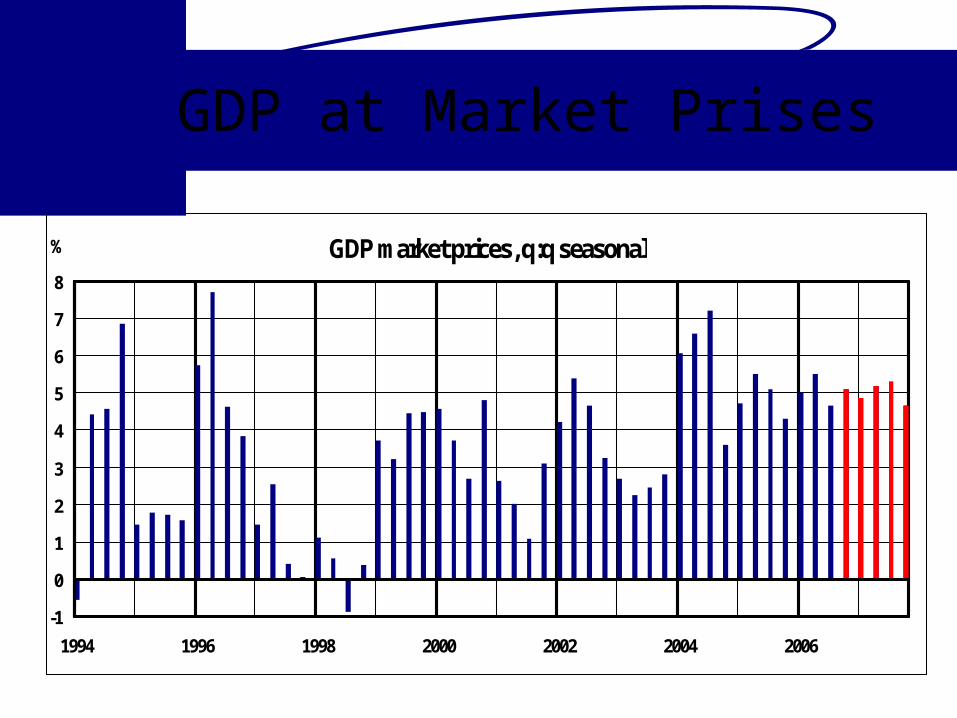
GDP at Market Prises
GDP market prices, q:q seasonal
-1
0
1
2
3
4
5
6
7
8
1994 1996 1998 2000 2002 2004 2006
%
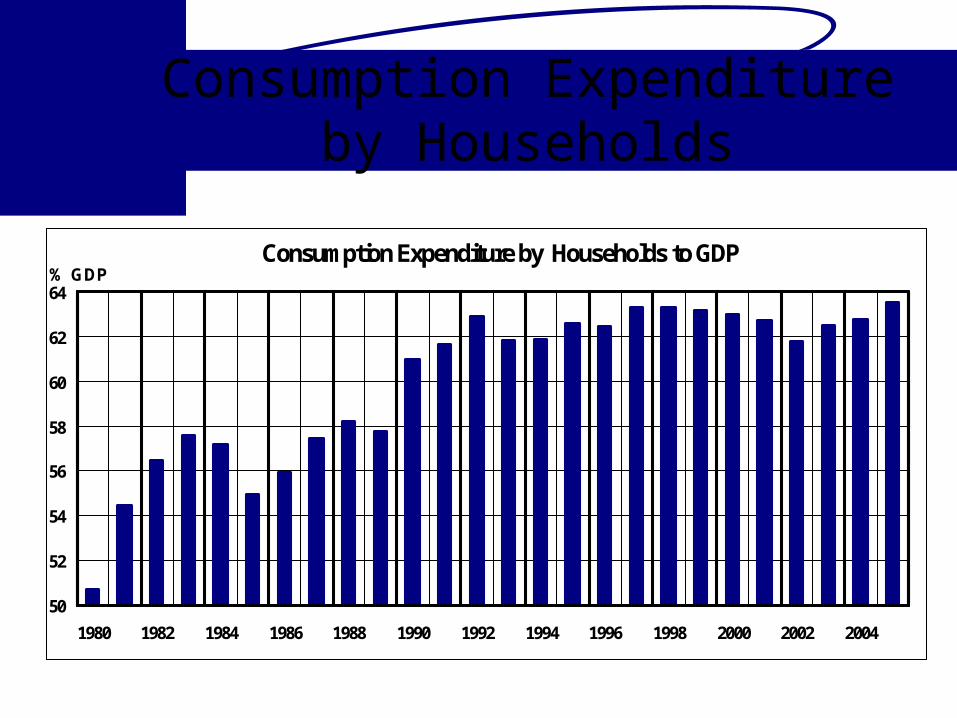
Consumption Expenditure by Households
Consumption Expenditure by Households to GDP
50
52
54
56
58
60
62
64
1980 1982 1984 1986 1988 1990 1992 1994 1996 1998 2000 2002 2004
% GDP
Summary
Increase Revenue Decrease Expenditure Boast Supply Increase consumption expenditure Saving (government vs households)

FISCAL 2006/07…

Revenue

Revenue Sources (1994)
39%
13% 26%
5%
8%
9%
Individual Tax
Company Tax
VAT
Excise Duties
Fuel Levy
Other
Revenue Sources (Est. 2006/07)
29%
25%28%
4%
4%
10%
Individual Tax
Company Tax
VAT
Excise Duties
Fuel Levy
Other
Contribution to Fiscus

2006/07 in Review:Revenue
R bn Budget ’06 MTBPS ’06 Expected Diff. (%)
Income Tax 245.8 269.9 272.6 26.8 (10.9%)
Individual 132.5 138.8 139.8 7.3 (5.5%)
Company 95.2 115.9 116.7 21.5 (22.6%)
STC 13.9 12.9* 13.2 -0.6 (-4.3%)
Other 4.3 2.4* 3.0 -1.3 (-30.2%)
VAT 131.2 132.9 134.4 3.2 (2.4%)
Excise Duty 16.6 16.6 17.0 0.4 (2.4%)
Fuel Levy 21.8 21.8 21.1 -0.7 (-3.2%)
Other 49.1 40.6 45.1 -4.7 (9.6%)
Total 446.4 466.6 473.3 26.9 (6.0%)
* Estimated

Tax Table
2006/07 Efficient 2007/08
Taxable Inc (R) Rates of Tax Taxable Inc (R) Rates of Tax
0 – 100 000 18% 0 – 110 000 18%
100 001 – 160 000 R18 000 + 25% 110 001 – 170 000 R19 800 + 25%
160 001 – 220 000 R33 000 + 30% 170 001 – 230 000 R34 800 + 30%
220 001 – 300 000 R51 000 + 35% 230 001 – 315 000 R52 800 + 35%
300 001 – 400 000 R79 000 + 38% 315 001 – 420 000 R82 550 + 38%
400 001 – R117 000 + 40% 420 001 – R122 450 + 40%
Rebates Rebates
Primary 7 200 Primary 7 632
Tax Threshold Tax Threshold
Below 65 40 000 Below 65 42 400

Effect of Adjustment
Income 2006/07 Tax 2007/08 Tax Difference
R100k R10 800 R10 368 R432 (4.0%)
R150k R23 300 R22 168 R1 132 (4.8%)
R200k R37 800 R36 168 R1 632 (4.3%)
R300k R71 800 R69 668 R2 132 (2.9%)
R400k R109 800 R107 218 R2 582 (2.3%)
R500k R149 800 R146 818 R2 982 (1.9%)

Quick Calculation
1995: Revenue (22.5% GDP) 2005: GDP (fiscal): R1,417bn 22.5% of GDP = Revenue (2005): R319bn Actual Revenue: R347bn Difference: R28bn
Where is the tax cuts?
Expenditure
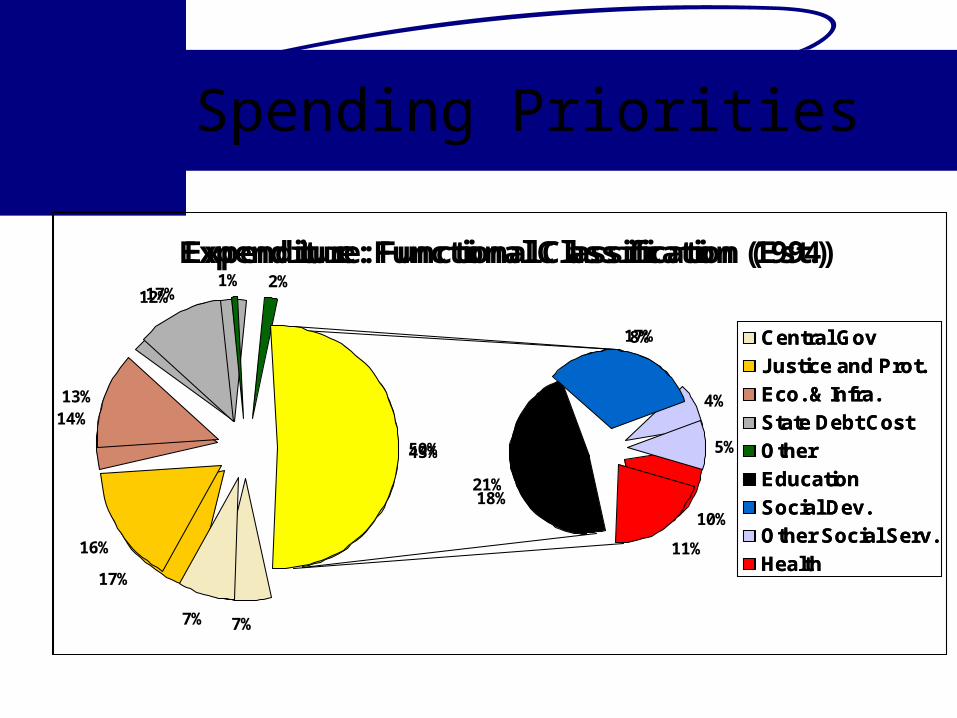
Spending Priorities
Expenditure: Functional Classification (1994)
7%
17%
14%
17%2%
21%
8%
4%
10%
43%
Central Gov
Justice and Prot.
Eco. & Infra.
State Debt Cost
Other
Education
Social Dev.
Other Social Serv.
Health
Expenditure: Functional Classification (Est.)
7%
16%
13%
12%1%
18%
17%
5%
11%
50%
Central Gov
Justice and Prot.
Eco. & Infra.
State Debt Cost
Other
Education
Social Dev.
Other Social Serv.
Health

2006/07 in Review:Expenditure
R bn Budget ’06 MTBPS ’06 Expected Diff. (%)
Voted Amounts 263.1* 252.8 265.7 2.6
Central Gov. 34.9 35.7 0.8
Fin. & Admin. 18.1 19.6 1.5
Social Services 90.6 95.5 4.9
Justice & Protect. 73.4 71.8 -1.6
Eco. & Infrastruc. 43.1 43.2 0.1
State Debt Cost 52.0 52.6 48.5 -3.5
Transfer Provinces 150.8 150.8 150.8 0.0
Other 6.8 7.0 6.8 0.1
Total 472.7 474.2 471.9 -0.8
* Includes: Contingency Reserve (R3.1bn)

Main Expenditure trends
More for Education and Health Services delivery to get more and more Capital spending
• World Cup• Housing
Let’s hope; safety and security - World Cup
Higher revenue helps spending higher – danger!!
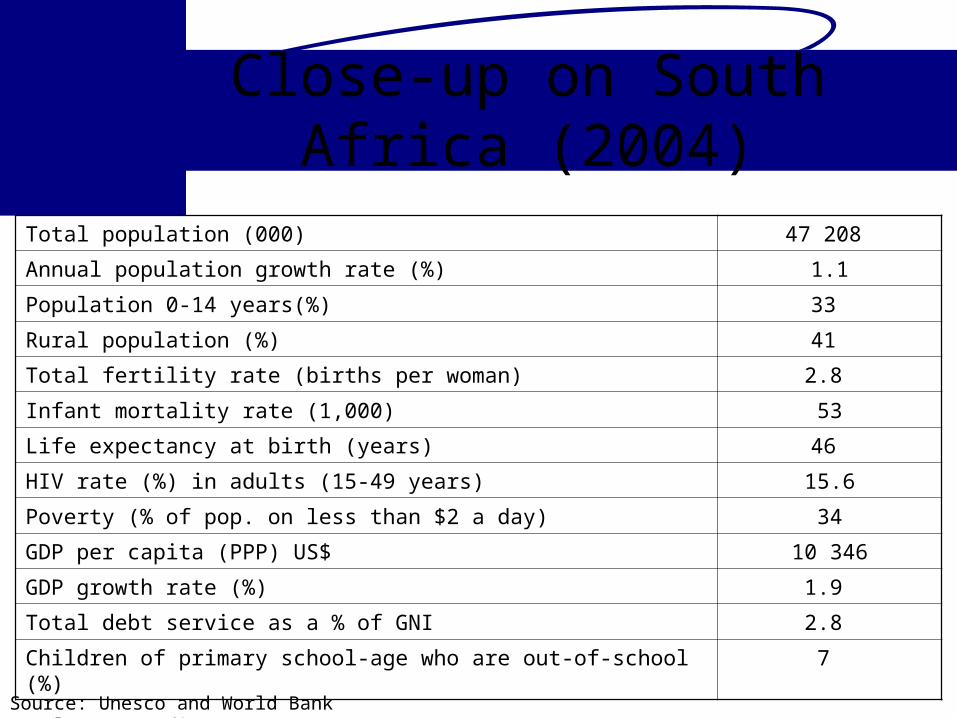
Close-up on South Africa (2004)
Total population (000) 47 208
Annual population growth rate (%) 1.1
Population 0-14 years(%) 33
Rural population (%) 41
Total fertility rate (births per woman) 2.8
Infant mortality rate (1,000) 53
Life expectancy at birth (years) 46
HIV rate (%) in adults (15-49 years) 15.6
Poverty (% of pop. on less than $2 a day) 34
GDP per capita (PPP) US$ 10 346
GDP growth rate (%) 1.9
Total debt service as a % of GNI 2.8
Children of primary school-age who are out-of-school (%) 7
Source: Unesco and World Bank Development Indicators

Education
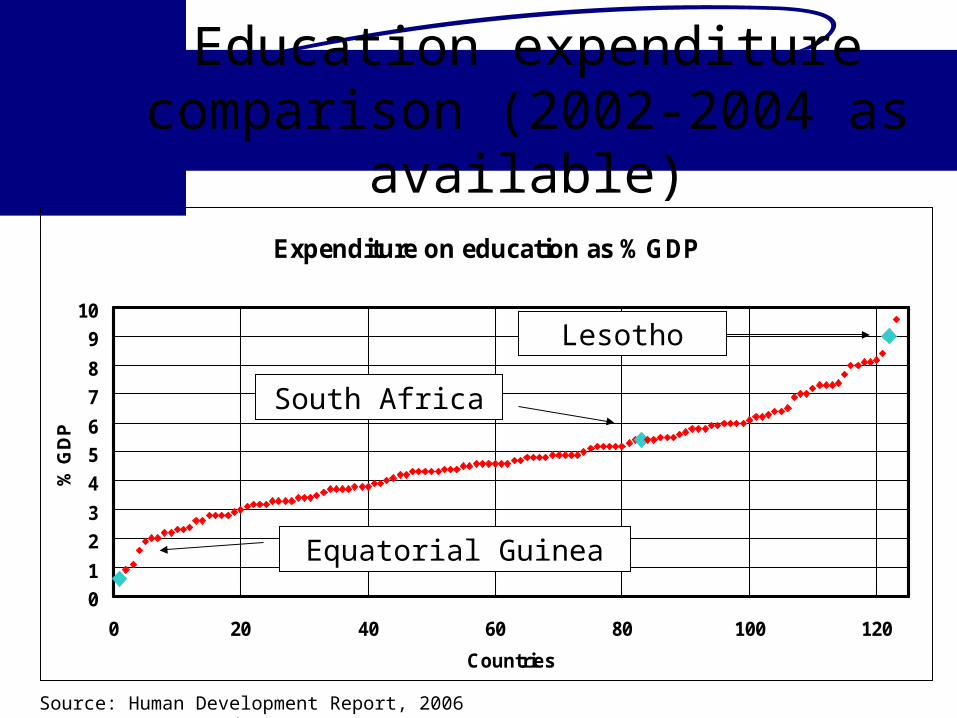
Education expenditure comparison (2002-2004 as available)
Expenditure on education as % GDP
0
1
2
3
4
5
6
7
8
9
10
0 20 40 60 80 100 120
Countries
% G
DP
Source: Human Development Report, 2006 (undp.org)
South Africa
Equatorial Guinea
Lesotho

Adult Literacy Rate (2004)
Adult Literacy Rate
10
20
30
40
50
60
70
80
90
100
0 20 40 60 80 100Countries
% o
f P
op
ula
tio
n
Source: Human Development Report, 2006 (undp.org)
South Africa
Mali
Estonia

Pass Rate of SCE and Matriculation Exemption
Pass Rate vs Matric Exemption
0
10
20
30
40
50
60
70
80
1995 1996 1997 1998 1999 2000 2001 2002 2003 2004 2005
%
Pass Rates Matriculation Exemption
Source: HSRC

Pass Rate of SCE and Education Spending
Pass Rate vs Education Spending
40
45
50
55
60
65
70
75
1995 1996 1997 1998 1999 2000 2001 2002 2003 2004 2005
%
5
6
7
8
% GDP
Pass Rates Education Spending
Source: HSRC
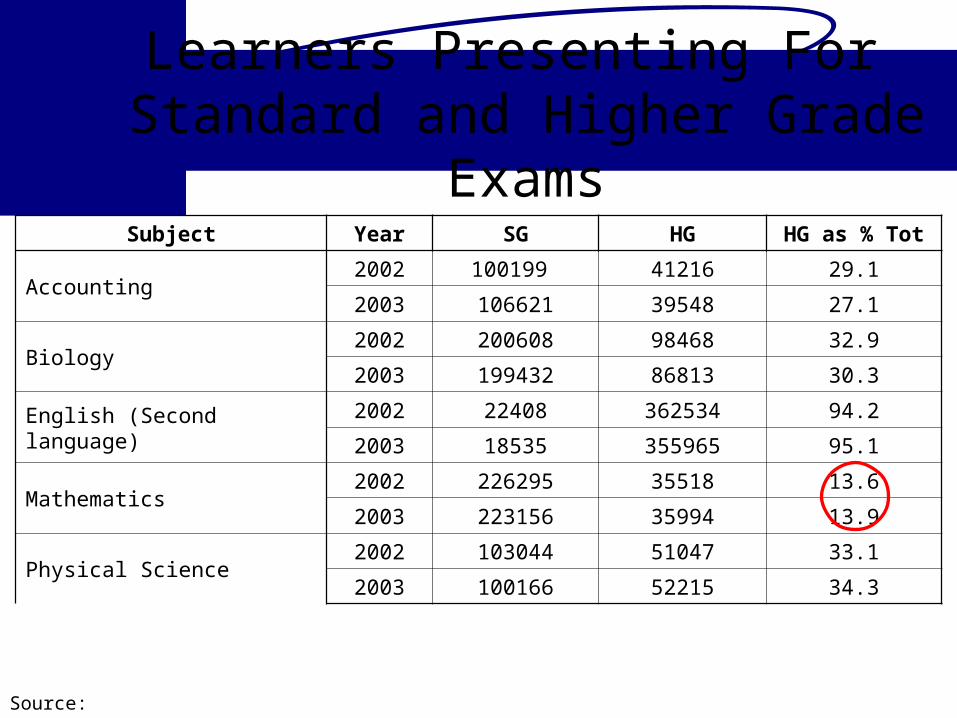
Learners Presenting For Standard and Higher Grade Exams
Subject Year SG HG HG as % Tot
Accounting2002 100199 41216 29.1
2003 106621 39548 27.1
Biology2002 200608 98468 32.9
2003 199432 86813 30.3
English (Second language)2002 22408 362534 94.2
2003 18535 355965 95.1
Mathematics2002 226295 35518 13.6
2003 223156 35994 13.9
Physical Science2002 103044 51047 33.1
2003 100166 52215 34.3
Source: HSRC

Case Study: Flow of Pupils from Grade 1(1991) to Grade 12 (2002)
Flow Through for 1991 Pupils
100.0 99.095.5
88.8 89.4
80.678.0
85.8
75.9
69.3
58.8
40.340
50
60
70
80
90
100
1991Gr1
1992Gr2
1993Gr3
1994Gr4
1995Gr5
1996Gr6
1997Gr7
1998Gr8
1999Gr9
2000Gr10
2001Gr11
2002Gr12
Source: HSRC Note: Repeaters and drop outs not indicated
1 207 066 learners
486 786 learners
Home Schooling?

Pupils-Teacher Ratio in Primary Education (Newest data available)
Pupils-Teacher Ratio
0
10
20
30
40
50
60
70
80
0 20 40 60 80 100 120 140 160
Countries
Ave
rag
e n
um
ber
of
pu
pils
Source: UNESCO
South Africa
Central African Republic
Libya
Weighted Average: 27.1
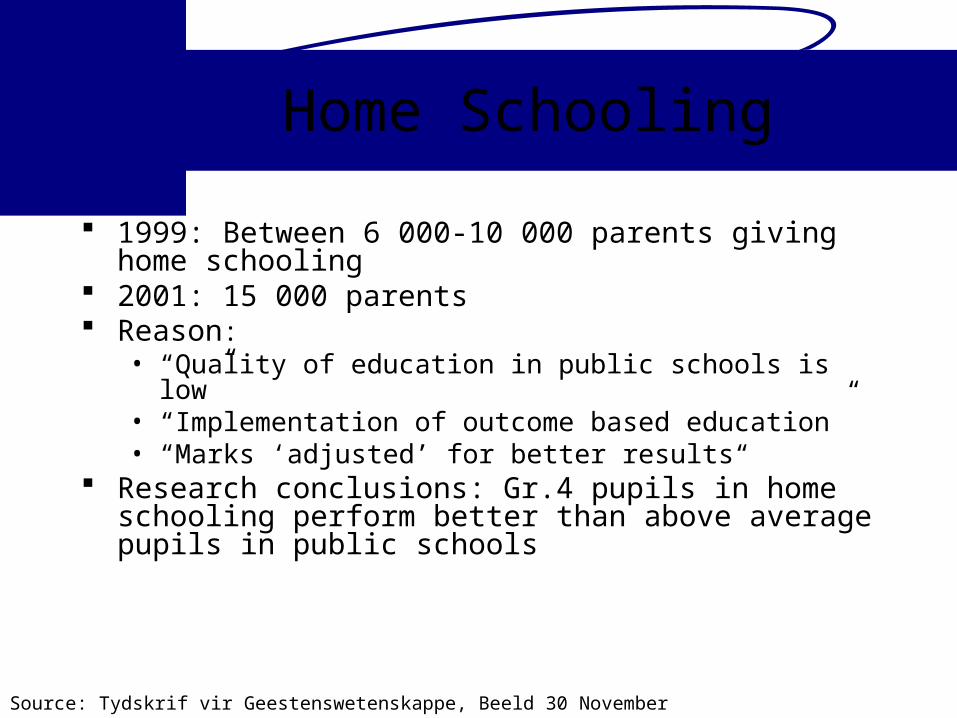
Home Schooling
1999: Between 6 000-10 000 parents giving home schooling 2001: 15 000 parents Reason:
• “Quality of education in public schools is low”• “Implementation of outcome based education”• “Marks ‘adjusted’ for better results“
Research conclusions: Gr.4 pupils in home schooling perform better than above average pupils in public schools
Source: Tydskrif vir Geestenswetenskappe, Beeld 30 November 2006

Health
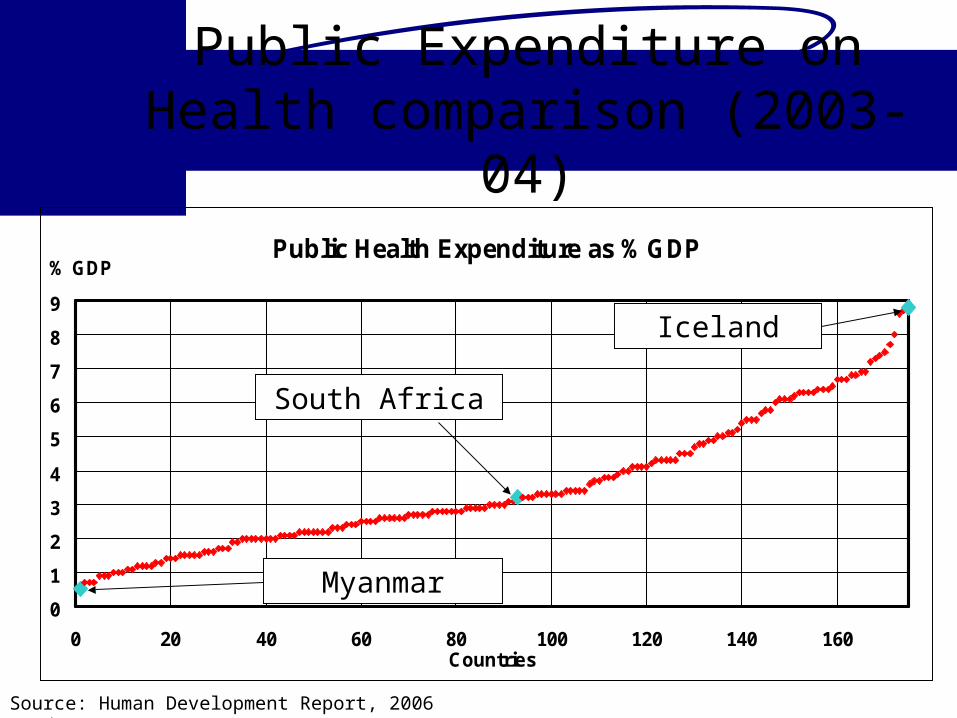
Public Expenditure on Health comparison (2003-04)
Public Health Expenditure as % GDP
0
1
2
3
4
5
6
7
8
9
0 20 40 60 80 100 120 140 160Countries
% GDP
Source: Human Development Report, 2006 (undp.org)
South Africa
Myanmar
Iceland
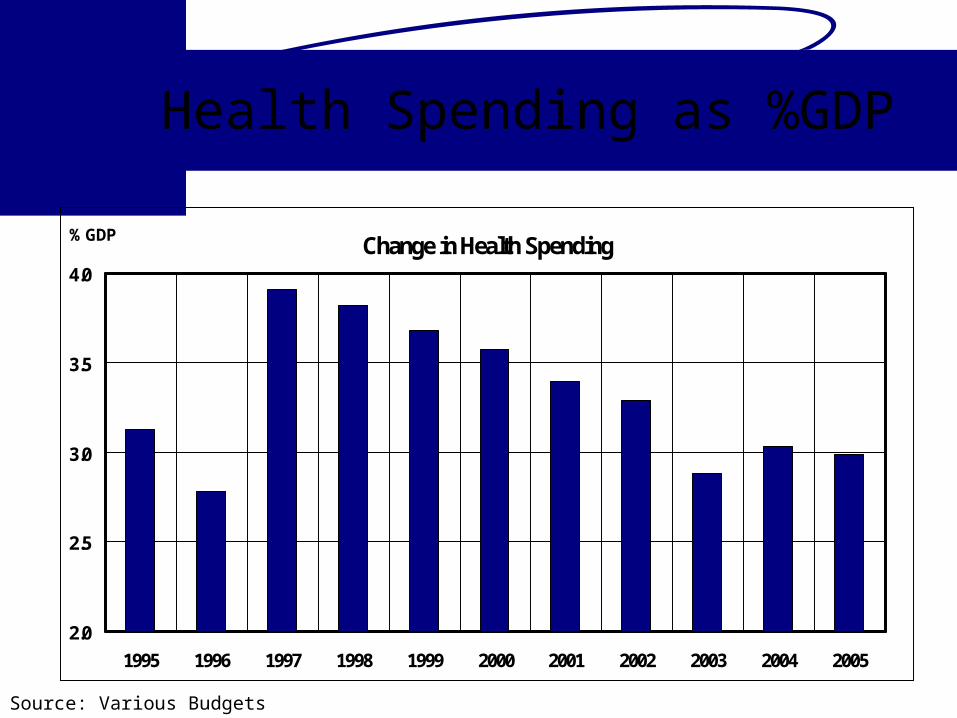
Health Spending as %GDP
Change in Health Spending
2.0
2.5
3.0
3.5
4.0
1995 1996 1997 1998 1999 2000 2001 2002 2003 2004 2005
% GDP
Source: Various Budgets
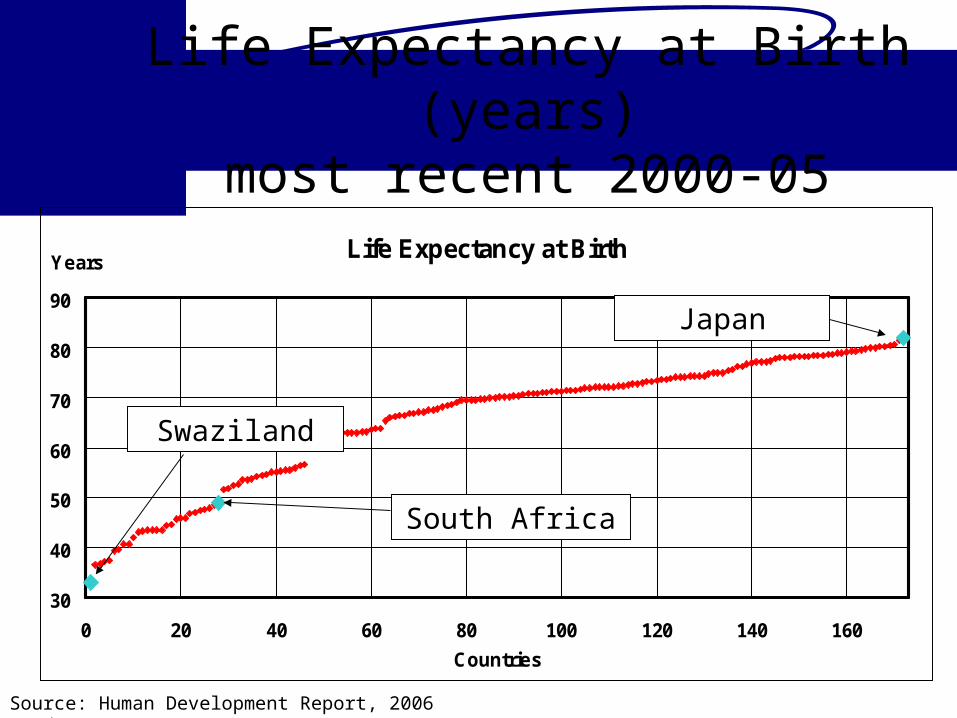
Life Expectancy at Birth (years)most recent 2000-05
Life Expectancy at Birth
30
40
50
60
70
80
90
0 20 40 60 80 100 120 140 160
Countries
Years
Source: Human Development Report, 2006 (undp.org)
South Africa
Swaziland
Japan
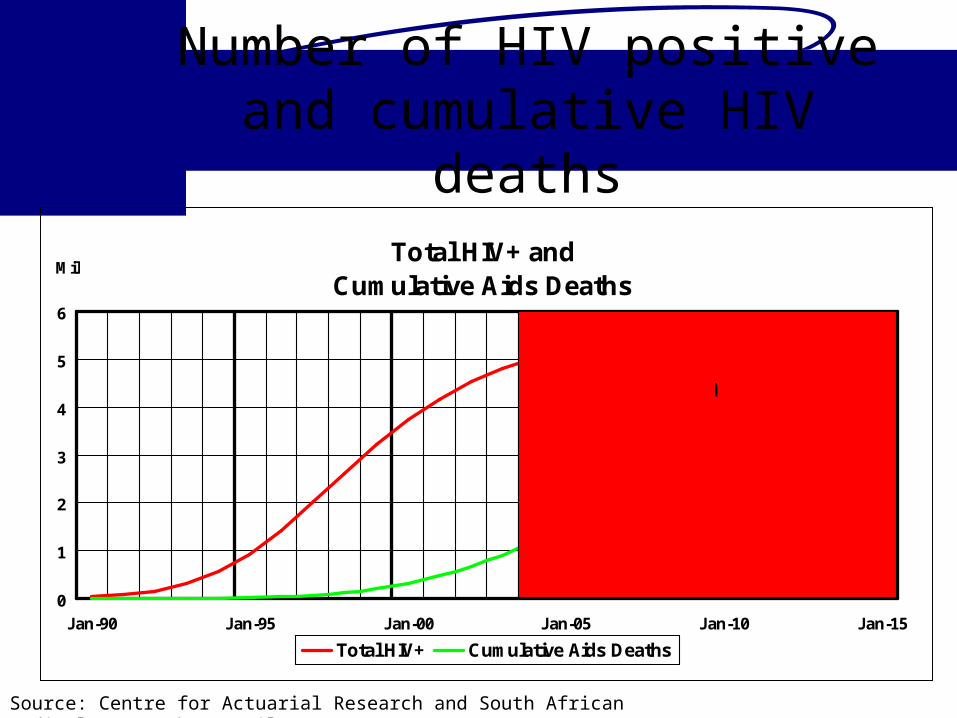
Number of HIV positive and cumulative HIV deaths
Total HIV+ and Cumulative Aids Deaths
0
1
2
3
4
5
6
Jan-90 Jan-95 Jan-00 Jan-05 Jan-10 Jan-15
Mil
Total HIV+ Cumulative Aids Deaths
Projection
Source: Centre for Actuarial Research and South African Medical Research Council, 2004
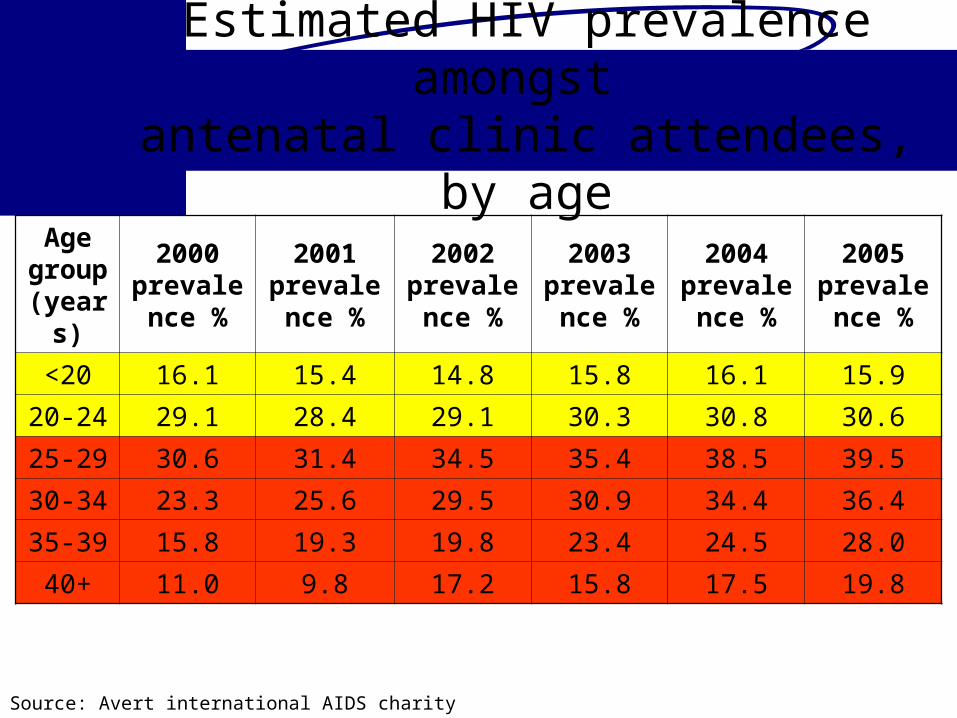
Estimated HIV prevalence amongst antenatal clinic attendees, by age
Age group (years)
2000 prevalence
%
2001 prevalence
%
2002 prevalence
%
2003 prevalence
%
2004 prevalence
%
2005 prevalence
%
<20 16.1 15.4 14.8 15.8 16.1 15.9
20-24 29.1 28.4 29.1 30.3 30.8 30.6
25-29 30.6 31.4 34.5 35.4 38.5 39.5
30-34 23.3 25.6 29.5 30.9 34.4 36.4
35-39 15.8 19.3 19.8 23.4 24.5 28.0
40+ 11.0 9.8 17.2 15.8 17.5 19.8
Source: Avert international AIDS charity

Defence and Police
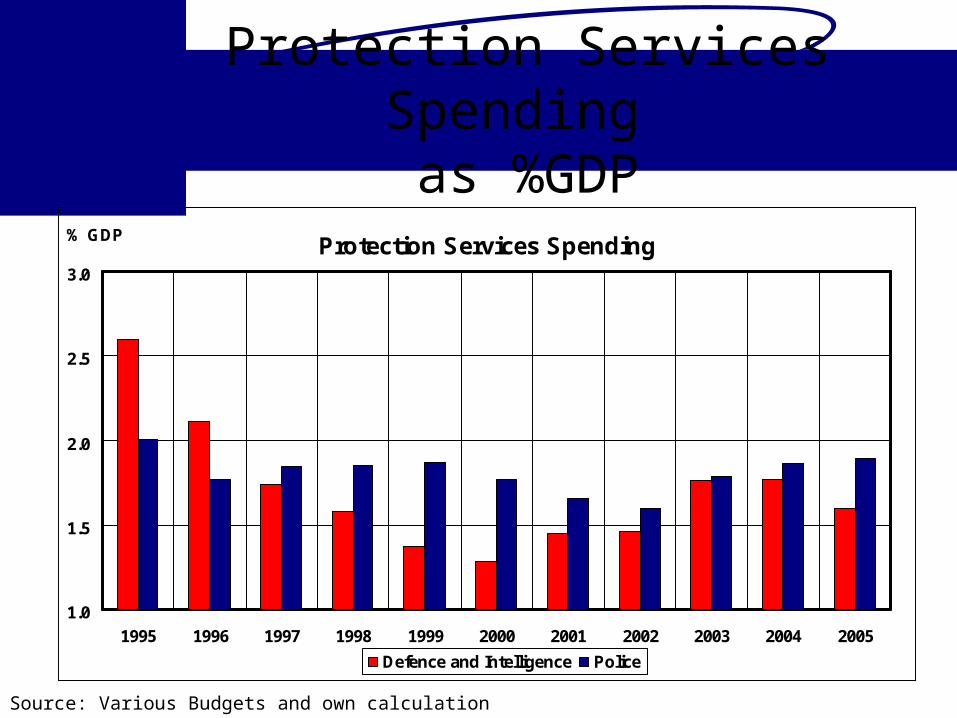
Protection Services Spending as %GDP
Protection Services Spending
1.0
1.5
2.0
2.5
3.0
1995 1996 1997 1998 1999 2000 2001 2002 2003 2004 2005
% GDP
Defence and Intelligence Police
Source: Various Budgets and own calculation

Reported Crime Figures for the financial years 1994/95 to 2002/03
Crime Categories, per 100 000 population
0
50
100
150
200
250
300
1995 1996 1997 1998 1999 2000 2001 2002 2003
Rat
io p
er 1
00 0
00
Rape and attempted rape Murder Aggrevated Robbery
Source: Institute for Security Studies (issafrica.org)
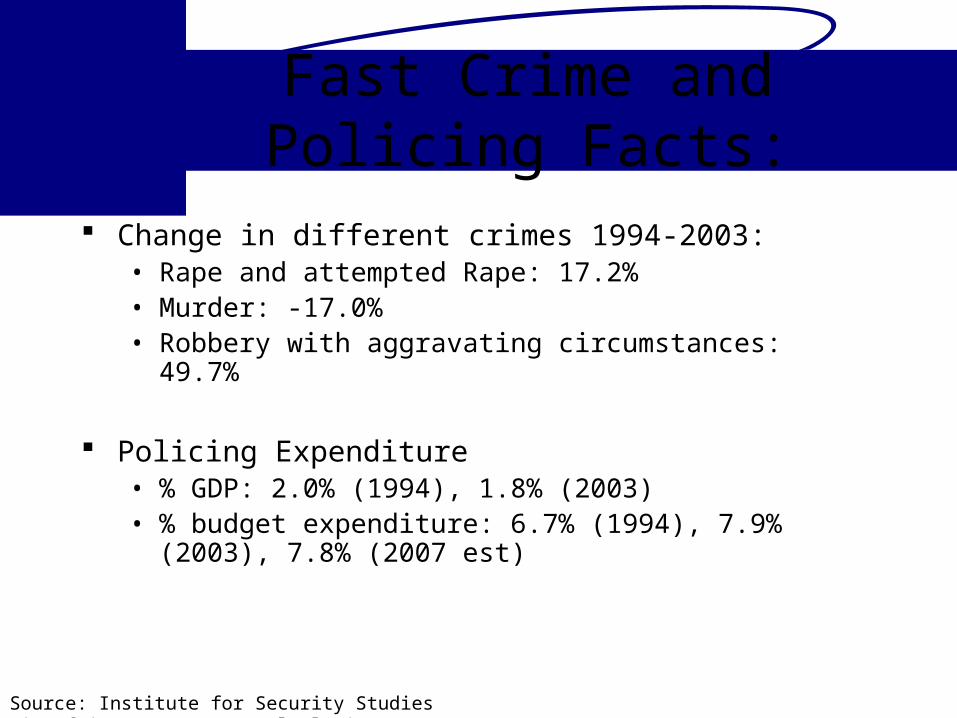
Fast Crime and Policing Facts:
Change in different crimes 1994-2003:• Rape and attempted Rape: 17.2%• Murder: -17.0%• Robbery with aggravating circumstances: 49.7%
Policing Expenditure • % GDP: 2.0% (1994), 1.8% (2003)• % budget expenditure: 6.7% (1994), 7.9% (2003), 7.8% (2007 est)
Source: Institute for Security Studies (issafrica.org) / own calculations
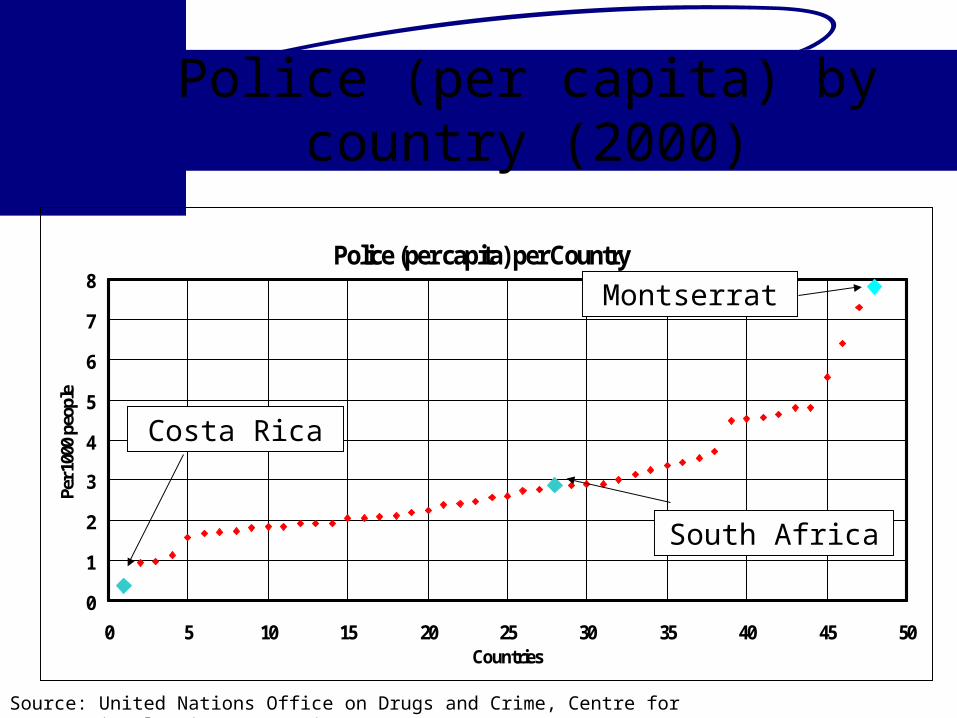
Police (per capita) by country (2000)
Police (per capita) per Country
0
1
2
3
4
5
6
7
8
0 5 10 15 20 25 30 35 40 45 50Countries
Per 1
000
peop
le
Source: United Nations Office on Drugs and Crime, Centre for International Crime Prevention
South Africa
Costa Rica
Montserrat
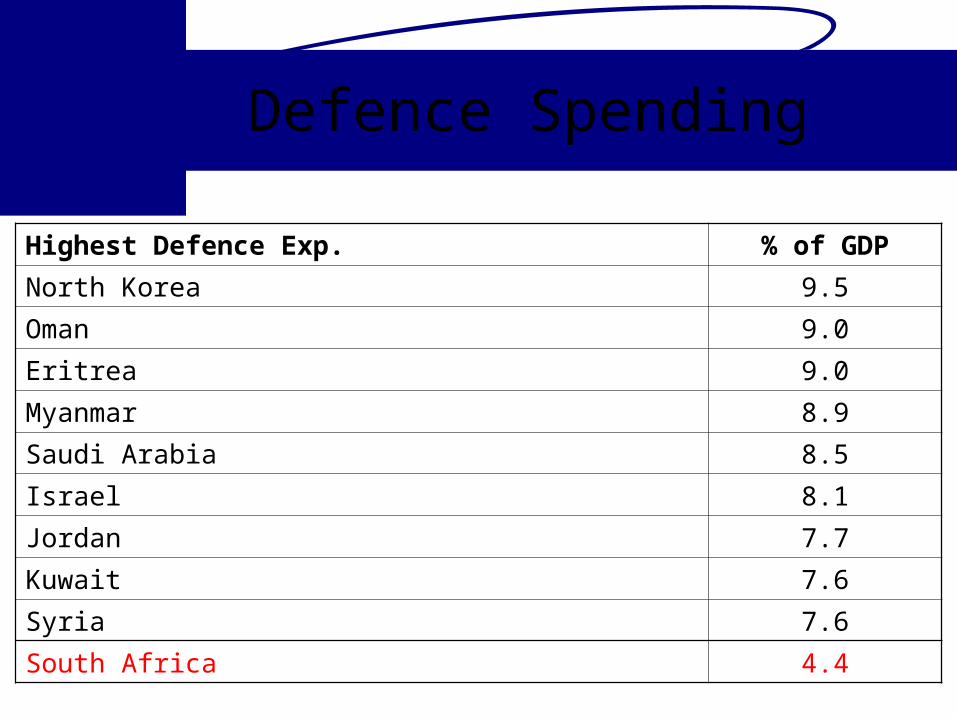
Defence Spending
Highest Defence Exp. % of GDP
North Korea 9.5
Oman 9.0
Eritrea 9.0
Myanmar 8.9
Saudi Arabia 8.5
Israel 8.1
Jordan 7.7
Kuwait 7.6
Syria 7.6
South Africa 4.4

Funding
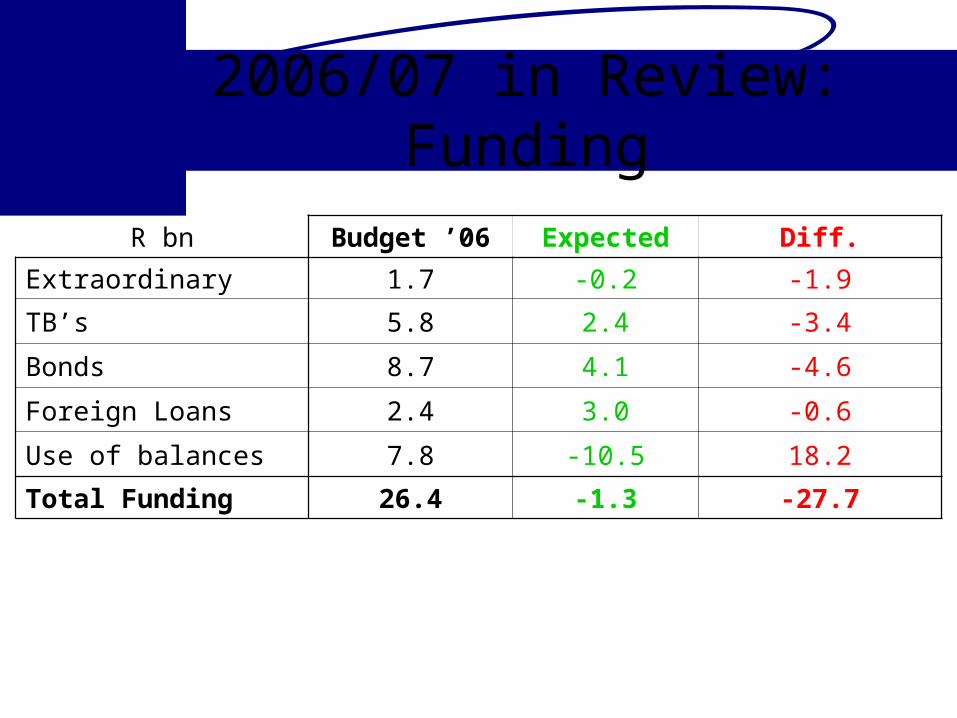
2006/07 in Review:Funding
R bn Budget ’06 Expected Diff.
Extraordinary 1.7 -0.2 -1.9
TB’s 5.8 2.4 -3.4
Bonds 8.7 4.1 -4.6
Foreign Loans 2.4 3.0 -0.6
Use of balances 7.8 -10.5 18.2
Total Funding 26.4 -1.3 -27.7

Summary 2005/06
R bn Budget ’06 MTBPS ’06 Expected Difference
Revenue 446.4 466.6 473.3 26.9
Expenditure 472.7 474.2 471.9 -0.8
Deficit/Surplus -26.4 -7.6 1.3 27.7
% of GDP -1.5% -0.4% 0.1%
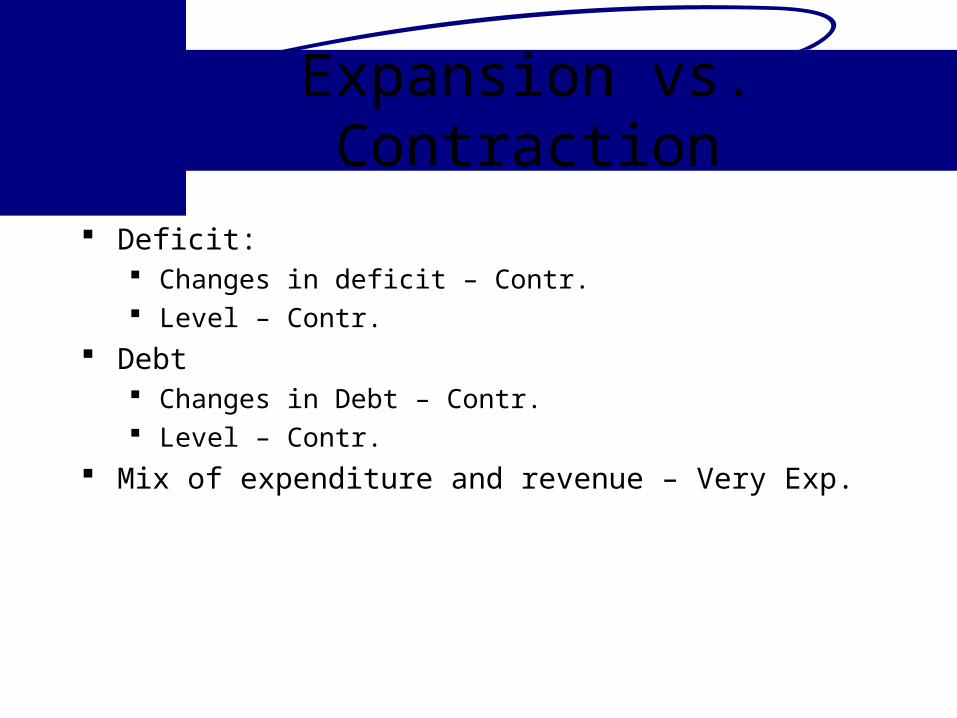
Expansion vs. Contraction
Deficit: Changes in deficit – Contr. Level – Contr.
Debt Changes in Debt – Contr. Level – Contr.
Mix of expenditure and revenue – Very Exp.
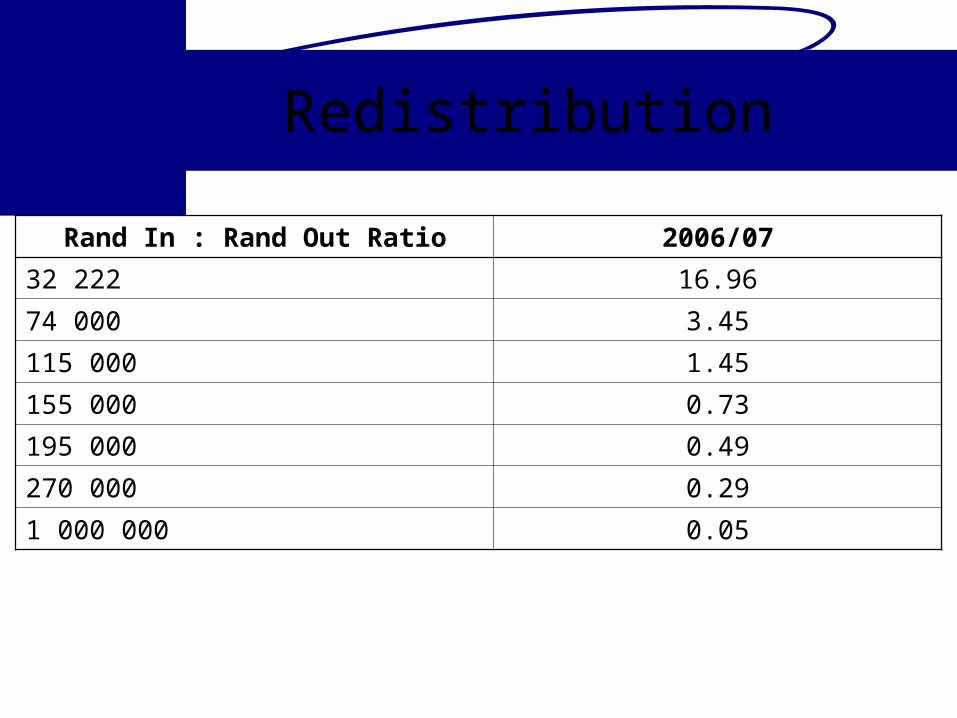
Redistribution
Rand In : Rand Out Ratio 2006/07
32 222 16.96
74 000 3.45
115 000 1.45
155 000 0.73
195 000 0.49
270 000 0.29
1 000 000 0.05
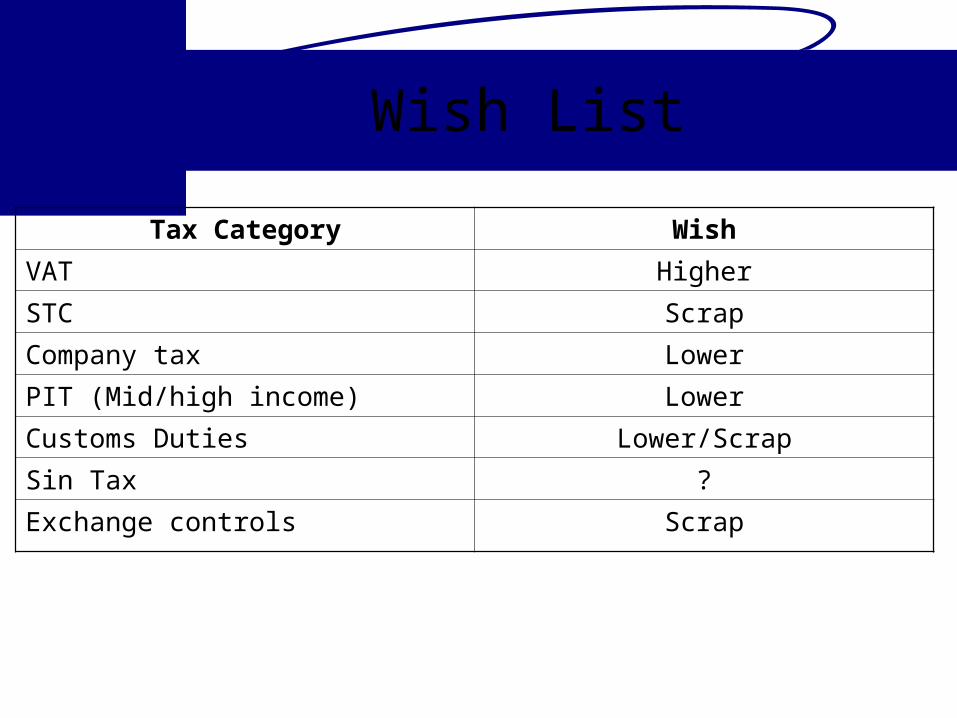
Wish List
Tax Category Wish
VAT Higher
STC Scrap
Company tax Lower
PIT (Mid/high income) Lower
Customs Duties Lower/Scrap
Sin Tax ?
Exchange controls Scrap
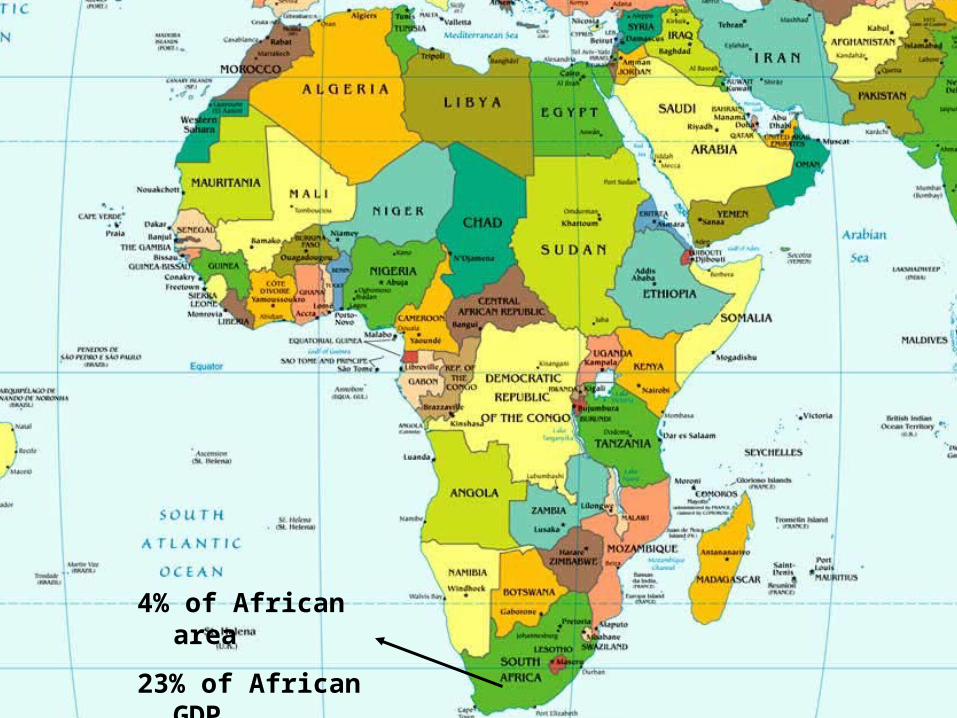
4% of African area
23% of African GDP
21.2% of African Exports

GDP
Africa, South Africa, World GDP per Capita
0
1000
2000
3000
4000
5000
6000
7000
1970 1972 1974 1976 1978 1980 1982 1984 1986 1988 1990 1992 1994 1996 1998 2000 2002 2004
$
Source: UN
Mistakes made in Africa Private Property Rights Regulated Prices Idolise Leaders Marketing Boards Nepotism Incompetence Corruption Poor Fiscal Discipline Poor Monetary Policy Unrealistic Projects
?
?
?
?
?

Asset Allocation
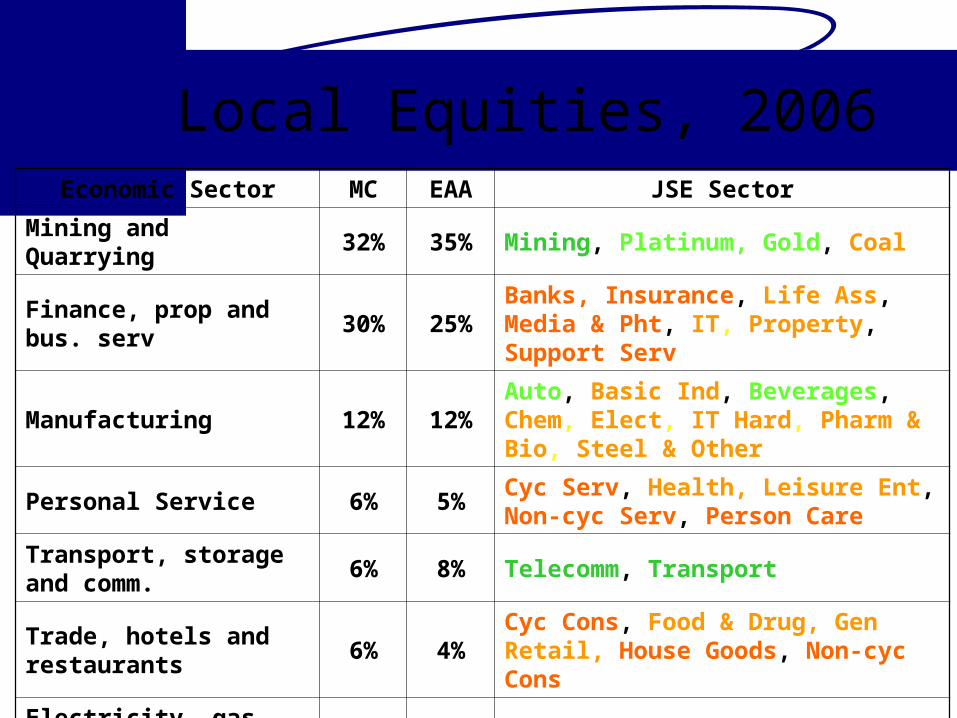
Local Equities, 2006Economic Sector MC EAA JSE Sector
Mining and Quarrying 32% 35% Mining, Platinum, Gold, Coal
Finance, prop and bus. serv 30% 25%Banks, Insurance, Life Ass, Media & Pht, IT, Property, Support Serv
Manufacturing 12% 12%Auto, Basic Ind, Beverages, Chem, Elect, IT Hard, Pharm & Bio, Steel & Other
Personal Service 6% 5%Cyc Serv, Health, Leisure Ent, Non-cyc Serv, Person Care
Transport, storage and comm. 6% 8% Telecomm, Transport
Trade, hotels and restaurants 6% 4%Cyc Cons, Food & Drug, Gen Retail, House Goods, Non-cyc Cons
Electricity, gas and water 4% 3% Oil & Gas
Agri, Forestry and Fishing 3% 2% Food Prod
Construction 2% 6% Const & Build
100% 100%