Embed Size (px)
Citation preview
I'
Jurnal Ekonomi 29 (1995) 113 -130
The Role of Human Capital Formation and Skills Development in Enhancing Competitiveness of the Malaysian Manufacturing Sector
Logan Markandoo
ABSTRACT
The increasing importance of manufacturing exports has led to the need to acquire a competitive edge in the exports of this sector. Vital components in the acquisition of competitiveness lies in human capital formation and skills development. Malaysia's current net manpower requirements demonstrate an acute shortage in skilled labor which can impede her competitiveness in the international arena. Although current policies have recoguised this, nonetheless there is still a need to consider supplementary measures such as tracking technology trends in order to ascertain new skills required. Furthermore, inculcating a training culture as well as enhancing professionalism will undoubtedly help skills development. Lastly, industry associations can also contribute to training while a more flexible system of wage determination will improve labor's contribution to increasing competitiveness.
ABSTRAK
Eksport perkilangan menjadi semakin penting dan ini menimbulkan keperluan untuk memperoleh daya saingan dalam eksport sektor ini. Faktor-faktor penting dalam usaha meningkatkan daya saingan adalah pembentukan modal manusia dan pembangunan kemah iran buruh. Keperluan gunatenaga bersih Malaysia pada masa kini menunjukkan wujudnya kekurangan kemah iran buruh yang mungkin menghalang daya saingannya dalam pasaran antarabangsa. Sungguhpun dasar-dasar kini sedang cuba mengatasi masalah ini, tetapi terdapatnya keperluan untuk menggenapi dasar-dasar ini dengan dasar lain seperti menjejak arah aliran teknologi untuk menentukan kemah iran baru yang diperlukan. Tambahan lagi, usaha untuk

114 Jurnal Ekonomi Malaysia 29
menanamkan kebudayaan melatih dan keikhtisasan tentu akan menolong pembangunan kemahiran. Selain itu, persatuan-persatuan industri boleh juga menyumbang kepada latihan serta sistem upah yang lebih mudah diubah-ubah akan membaiki sumbangan buruh kepada daya saingan yang semakin bertambah.
INTRODUCTION
Over the past three decades, Malaysia has undergone a significant structural transformation, evolving from a primary commoditybased economy into a more diversified economy with an expanding industrial base. At the time of independence in 1957, Malaysia was largely dependent on rubber and tin which accounted for about 80 per cent of total export revenue. In 1933, these two commodities together contributed only about 2.2 per cent of total export earnings, while that of the manufacturing sector was 71 per cent. The increasing importance of manufacturing exports has led to new challenges in the international arena with the liberalization in world trade and globalization of industries. Industries in each country are forced to choose, acquire, generate and apply technologies which will enhance their international competitiveness in the race to enlarge their global market shares. However, technological supremacy depends critically on the stock and quality of human capital in each country. Timely investment in human capital formation, through education, training and retraining is therefore a crucial element in the direction and speed of industrial development.
This paper seeks to evaluate the role of human capital formation and skills development in enhancing the export competitiveness of the Malaysian manufacturing sector. There are five sections in this paper; Section II briefly discusses Malaysia's competitiveness relative to the Newly Industrialized Economies (NIBs). Section III focuses on the supply and demand for manpower in Malaysia and its implications on the labor market while current policy measures as well as some future policy suggestions are given in Section IV. The conclusion in Section V summarizes the salient points of this paper.

The Role of Human Capital Formation 115
MALAYSIA'S COMPETITIVENESS VIS-A-VIS OTHER NIEs
Malaysia's competitiveness relative to other NIEs can be obtained from the Annual World Competitiveness Report (weR), published by the World Economic Forum in conjunction with the International Institute for Management. The competitiveness ranking of the countries are based on eight main factors that describe competitiveness. These factors are based on 371 criteria covering a wide range of issues. It combines statistical indicators of competitiveness as recorded by international organizations and perceptions of business executives on the competitiveness of respective countries drawn from yearly Executive Opinion Survey. The rankings of countries are computed based on the performance relative to other countries. The eight factors are domestic economic strength, international, government, finance, infrastructure, management, science and technology and people factors. In 1991, among the NIEs,
Malaysia was ranked fifth behind the leader Singapore, followed by Taiwan, Hongkong and South Korea. However in the following year, Malaysia moved up to fourth position displacing South Korea. Malaysia has maintained this position in 1993, while South Korea was further relegated to sixth position.
Table 1 indicates Malaysia's relative position to the other selected countries based on the ranking of the eight competitive factors. Malaysia's lowest position is in the area of infrastructure and people, where it was ranked sixth among the fifteen countries. As for the people factor, Malaysia's nearest competitors were Chile in fifth position and Thailand in seventh position. While most other factors did well to move Malaysia from fifth to fourth position in 1993, the people factor was lagging behind despite the large sums allocated by the government for education and training. For example, in the Sixth Malaysia Plan (6MP), a total of RM 7.8 billion or 13.2 per cent of total public development budget is allocated for education and training. Among some of the key factors cited for the relatively low ranking of the people factor are the low labor force participation rates amongst women, unavailability of skilled people including engineers, as well as the brain drain.
Apart from the eight competitive factors in Table 2, the growth in productivity constitutes another important component in the evaluation of competitiveness. Experiences of many countries has shown that the standard of living, as measured by the quality and

116 Jurnal Ekonomi Malaysia 29
quantity of goods and services available, depends upon the productivity of the country. It has also been widely accepted that the long-term gams in real wages are the consequences of productivity increases. Using the GOP per employee as the measure of productivity at national level, Table 2 shows changes m productivity between the years 1988-1991 for selected countries in the Asian region. Malaysia's productivity registered an annual growth of 5.2 per cent during the period. This growth matched those of South Korea (5.4 per cent) and Taiwan (5.4 per cent) and surpassed those of Singapore (3.9 per cent), Hong Kong (3.9 per cent), Indonesia (4.1 per cent) and the Philippines (1.0 per cent).
TABLE 1. Newly industrialized countries and other selected countries, 1993
Factor
Brazil
Chile
Hong Kong
Hungary
India
Indonesia
Korea
Malaysia
Mexico
Pakistan
Singapore
South Africa
Taiwan
Thailand
Venezuela
Note:
ABC
15 14 15
836
622
14 10 12
9 15 10
798
2 11 9
354
10 7 7
12 12 13
1 1
11 13 14
543
465
13 8 11
D E
13 11
5 9
2 2
12 10
15 14
9 12
10 7 3 6
8 8
14 15
1 1
6 5
4 3
7 13
11 4
F
11
4
14
12
13
6
5
9
15
2
7
3
8
10
G
14
6
4
8
12
9
3
5
11
15
2
7
3
8
10
A = Domestic Economic Strength E = Infrastructure B = International F = Management
H Overall
10 14
5 5
3 2
9 12
13 13
13 10
4 6
6 4
11 8
15 15
1
14 11
2 3
7 7
8 9
C = Government G = Science and Technology o = Finance H = People
Source: The World Competitiveness Report, 1993.

The Role of Human Capital Formation
TABLE 2. Productivity growth of selected countries, 1988-1991
Countries
Malaysia
South Korea
Taiwan
Singapore
Hong Kong
Indonesia
Philippines
Annual Productivity Growth (%)
5.2
5.4
5.4
3.9
3.9
4.1
1.0
Note: Productivity is measured as GDP per employee. Source: The World Competitiveness Report, 1993.
117
Based on both Tables 1 and 2, it can be seen that despite the relatively high rate of growth in productivity, as measured by GDP
per employee, Malaysia needs to improve her competitive position in the people factor.
SUPPL Y AND DEMAND FOR MANPOWER IN MALAYSIA
According to the statistics given by the Mid-Term Review of the Sixth Malaysia Plan, population growth rate was 2.3 per cent during the review period and reached 19 million in 1993 (this includes an estimated one million foreign workers). About 60 per cent were in the working age group. More than half of the labor force had undergone secondary level education compared to 43 per cent in the mid-80s. The economy as a whole generated about 725,000 new jobs, while the manufacturing sector accounted for about 60 per cent of total jobs generated.
The employment generation grew by 3.5 per cent during the review period to reach 7.41 million in 1993, while the manufacturing employment growth increased by 9.8 per cent per annum to reach 1.766 million. Full employment was also achieved during the period, with unemployment rate falling to 3.0 per cent in 1993. Except for the agriculture/forestry sector and mind/quarrying sector, all other sectors recorded positive growth rates. Growth in labor force was 2.8 per cent as compared to the employment growth rate of 3.5 per cent for the overall economy during this period.

118 Jurnal Ekonomi Malaysia 29
SUPPLY OF MANPOWER!
This section examines the production of professional and technical manpower by both government and private sectors. It should be noted that there are difficulties in assessing the stock of industrial manpower in the country, especially in the absence of complete and reliable data on the output of educational institutions, both public and private, as well as Malaysian students returning from abroad.
Table 3 displays the percentage distribution of enrollment in public institutions by level. According to the table, primary schooling absorbed the largest percentage of enrollment for all the years shown. In fact, the Sixth Malaysia Plan (Malaysia 1991) reported a participation level of 99 per cent of the relevant schoolgoing population during the Fifth Malaysia plan (5MP) indicating the accessibility of universal education. Technical and vocational schooling which accounted for a mere 4.53 per cent of upper secondary school enrollment in 1970 has grown substantially to 9.62 per cent in 1993. However, the percentage enrollment at Teacher Training Colleges has reduced by approximately half from 1.31 per cent in 1970 to 0.55 per cent in 1990, increasing marginally to 0.77 per cent in 1993 due to the significant decline in the annual growth rate in teacher education. Consequently, the 6MP recorded the utilization of slightly more than 11.5 per cent of untrained teachers in the government and government-aided schools. On the other hand, enrollment at the tertiary level witnessed a steady increase from 0.37 per cent in 1970 to 1.72 per cent in 1993. Arts education continued to dominate over science and technical at the degree level throughout all the years shown although the ratio between arts and science/technical education has decreased with the proportion of arts enrollment declining from 65 per cent in 1970 to 58 per cent in 1990.
Despite the steady increase in enrollment for tertiary education, there remains a significant shortfall in the supply of tertiary education. Table 4 gives an indication of the extent in excess demand. As a result, Malaysian students have resorted to tertiary education overseas (Table 5). However after 1985, private tertiary education has expanded rapidly in order to meet the excess demand for higher education as can be seen by the increase from 15,000 students in 1985 to 35,600 in 1990 (Table 5). These local private institutions offer a wide range of professional, technical and

TABLE 3. Percentage distribution of enrollment in public institutions by level
Level 1970 1975 1980 1985 1990 1993 1995
Primary 74.97 68.10 63.76 6l.l2 61.90 61.69 58.67 Lower Secondary 19.31 23.32 25.77 25.72 23.88 23.06 23.53 Arts/Science (100.00) (l00.00) (99.67) (99.57) (99.88) (99.94) (99.78) MARA Junior Science (0.33) (0.43) (0.12) (0.06) (0.22)
Colleges Upper Secondary 4.24 6.00 7.27 8.63 8.38 9.85 (11.07) Art/Science (95.31) (92.10) (92.38) (92.62) (89.90) (88.85) (89.83) Technical/Vocational (4.53) (7.90) (7.28) (6.11) (8.42) (9.62) (8.85) MARA Junior Science (0.33) (0.89) (1.64) (1.54) (1.32)
Colleges Tunku Abdul Rahman (0.16) (0.02) (0.04) (0.03) n.a
College Post-School Mainstream 0.61 0.79 0.99 1.46 1.90 1.72 1.73
Sixth Forms (84.81 ) (82.80) (85.77) (83.70) (83.46) (78.45)d (83.84) MARA Junior Science (0.02) (1.60) (0.90) (1.72) (2.55) (2.55)
Colleges Pre-diploma/Pre- (4.74) . (2.06) (6.39) (10.08) (11.99) (18.99) (11.35)
Universitya Tunku Abdul Rahman (7.58) (13.50) (7.83) (5.53) (2.83) n.a (2.76)
College Teacher Training Colleges 1.31 0.29 0.42 0.46 0.55 0.77 0.57 Certificate
002) 0.08 0.03 0.23 0.37 0.38 Artsb n.a (2.04) (14.37) (22.44) n.a (36.25) Science and Technicalc n.a (97.96) (85.63) (77.56) n.a (63.75)
0.49 Diploma 0.15 0.39 0.69 0.71 0.83 0.93 Artsb n.a (35.98) (5l.l8) (53.27) n.a (46.63) Science and Technicalc n.a (64.02) (48.82) (46.73) n.a (53.37) Degree 0.37 0.50 0.70 1.04 1.53 1.72 1.87 Artsb (65.46) (55.48) (52.46) (53.78) (57.74) n.a (57.33) Science and Technicalc (34.54) (44.52) (47.54) (46.22) (42.46) n.a (42.67)
Note: a Mainly matriculation courses conducted at ITM and all university except
UTM. b Arts and humanities, economics and business. C Courses such as in agriculture, sciences, engineering, architecture,
material technology d Classified under Government and Government-aided schools in
MTR6MP n.a: not available Figures in parentheses refer to percentage share within the given level
Source: Sulaiman Mahbob, et al. (1994)
TABLE 4. Malaysia: Applicants and intake into local universities, sessions 1981/82-1991/92. (First degree only)
Year Applications Intake Accepted (No.) (No.) (%)
1981/82 16,698 5,847 35.0
1982/83 19,522 6,127 31.4
1983/84 28,858 6,890 23.9
1984/85 32,168 7,192 22.4
1985/86 32,209 8,213 25.5
1986/87 28,755 8,595 29.9
1987/88 27,658 9,289 33.6
1988/89 24,155 8,599 35.6
1989/90 23,331 8,757 37.5
1990/91 24,081 9,489 39.4
1991/92 25,730 10,668 41.5
Note: Based on applicants and intake into local universities administered by the University Unit, Higher Education Division of Ministry of Education.
Source: Sulaiman Mahbob, et al. (1994)
TABLE 5. Enrollment in tertiary (certificate, diploma and degree) education in local and overseas institutions
Type of 1970 1980 1985 Institutions No % No % No %
Local Public 11,364 100.0 36,800 48.1 69,770 51.0 Insti tu tions
Local Private 10,060 13.1 15,000 11.0 Institutions
Institutions 29,726 38.8 51,950 38.0 Overseas
Total 11,364 100.0 76,595 100.0 136,720 100.0
Note: lInc1uding those at primary and secondary school levels. Source: SuI aim an Mahbob, et al. (1994)
1990
No %
97,190 52.6
35,600 19.3
52,000 1 28.1
132,790 100.0

The Role of Human Capital Formation 121
managerial courses at various levels such as pre-university, degree, diploma, post-graduate as well as external professional examinations (Young and Ng 1992).
TABLE 6. Malaysia: Output of students from the public vocational schools and technical schools, 1986-95
Public Institutions
Vocational School Technical Schools Total
1986 5,269 3,028 8,297
1987 6,806 2,857 9,663
1988 7,473 2,643 10,116
1989 7,541 2,764 10,276
1990 9,623 2,276 12,387
Total 1986-90 36,712 14,027 50,739
1991 11,550 3,158 14,708
1992 11,490 3,360 14,850
1993 14,090 3,360 17,450
1994 14,090 3,360 17,450
1995 14,090 3,360 17,450
Total (expected)
1991-95 65,310 16,598 81,908
Source: Sulaiman Mahbob, et al. (1994)
The increase in enrollment for vocational and technical schooling has resulted in a steady increase in output from the public vocational as well as technical schools (Table 6). Of these output, more than half are trained in the engineering trades (Table 7), in recognition of the Industrial Master Plan (IMP) proposal that the number of engineers/technicians in the manufacturing sector can be increased from 12,000 in 1986 to at least 50,000 in 1995 (Anuwar Ali 1992). On the other hand, at the tertiary level, in line with the higher enrollment for Arts courses, the output of Arts graduates continue to exceed those graduating from the science and technical fields. Similarly, this holds true for the output of diploma holders for all the years shown in Table 8.

122 Jurnal Ekonomi Malaysia 29
TABLE 7. Output of skilled and semi-skilled manpower from public training institutions, 1981-1985
Courses 1981-85 (%) 1986-90 (%) 1991-93 (%) 1994-95 (%)
Engineering Trades 47,091 59.1 64,040 57.7 38,380 66.6 48,460 69.3
Building Trades 8,162 10.3 12,850 11.6 7,380 12.8 8,430 12.0
Printing Trades 460 0.6 170 0.1 120 0.2 80 0.1
Commerce 9,230 11.6 8,890 8.0 6,330 11.0 5,280 7.5
Agriculture 4,459 5.6 4,470 4.0 1,130 2.0 980 1.4
Home Science 5,847 7.3 4,690 4.2 3,220 5.6 5,020 7.2
Others 2,954 3.7 11,190 10.1 120 0.2 160 0.2
Skill Upgrading 1,437 1.8 4,730 4.3 920 1.6 1,560 2.2
Total 76,640 100.0 111,030 100.0 57,600 100.0 69,970 100.0
Source: SuI aim an Mahbob, et al. (1994)
DEMAND FOR MANPOWER
Based on a survey 1 conducted by the Ministry of Human Resources in collaboration with MIDA, a total of 314,955 workers be demanded will demanded by the investors for the period 1990-98. Table 9 shows the manpower requirements by broad categories of skilled occupations for the period 1994-2000. From the table it can be seen that the demand is the greatest for semi-skilled workers, followed by craft-skills workers and engineers/technicians.
The main engineering skill required lies in mechanical engineering (25.8 per cent), followed by production engineering (17.9 per cent) and electronic engineering (15.8 per cent) (Sulaiman Mahbob, et aI., 1994). The survey highlighted the need for engineers from non-traditional engineering trades/disciplines such as production engineers, industrial efficiency engineers, electro-mechanical engineers and software engineers.
The demand for technicians followed the same trend as that of the engineers due to the complementarity between the two types of occupations. From a total of 13,312 technicians required over the period 1990-98, as reported by the investors, 22.2 per cent are for mechanical technicians, 19.6 per cent for production technicians
i I

The Role of Human Capital Formation 123
TABLE 8. Output of degree and diploma holders, 1981-1995
Course 1981-85 1986-90 1991-93 1994-95
Degree
Arts 14,802 27,780 29,740 23,300 (55.2) (52.6) (63.5) (54.1)
Science 9,317 17,510 11,520 12,860 (34.7) (33.1) (24.6) (29.9)
Technical 2,719 7,550 5,550 6,878 (10.1) (14.3) (11.9) (16.0)
Total 26,838 52,840 46,810 43,038 (100.0) (100.0) (100.0) (100.0)
Diploma
Arts 9,808 18,450 14,350 12,850 (42.9) (50.1) (51.0) (50.0)
Science 5,636 7,950 6,210 4,380 (24.7) (21.6) (22.0) (17.0)
Technical 7,404 10,450 7,780 8,440 (32.4) (28.3) (27.0) (33.0)
Total 22,848 36,850 28,340 25,720 (100.0) (100.0) (100.0) (100.0)
Source: Sulaiman Mahbob, et al. (1994)
and 12 per cent electrical technicians (Sulaiman Mahbob, et al. 1994).
Apart from engineers and technicians, craft-skills workers and CAD-CAM operators are also highly demanded. Craft-skills workers demanded are machinists, electricians, plant maintenance mechan-ics and welders.
NET MANPOWER REQUIREMENTS
The net annual manpower requirements in broad terms are shown in Table 9. Figures on the supply side are assumed to remain constant for the 1994-2000 period to merely show the seriousness if the existing education and skill delivery system remains unchanged

124 Jurnal Ekonomi Malaysia 29
TABLE 9. Annual manpower requirement and supply, 1994-2000
Category
Prof/Technical
Craft Skills/Semi
Total
Requirement
9,970
49,130
59,100
Supply
5,720
35,420
41,140
Net. Req.
4,250
13,710
17,960
Notes: Requirement for craft skills, CAD-CAM plus half of semi-skilled requirement of 71,720 ie. 13,270 + 35,860 = 49,130. It is assumed that 50% of semi-skilled workers can be trained on the job.
Source: 1. Supply figures for professional/technical category from Mid-Term Review of Sixth Malaysia Plan.
ii. Supply figures for craft skills/semi-skill from National Vocational Training Council, Ministry of Human Resources, 1992 figures adjusted for 1993 (unpublished).
during the period. It is estimated that an additional 18,000 trained personnel per annum need to be made available in the labor market.
The rapid increase in demand, propelled by strong economic growth coupled with the slower expansion of the labor force has led to labor shortages and a very low rate of unemployment particularly in the first three years of the nineties.
Consequently, the wage bill in the manufacturing sector has been on the rise since 1988. The percentage change in wage bill has increased steadily from 2 per cent in 1989 to 6.4 per cent in 1990, further increasing to 7.6 per cent in 1991, and escalating to 10.0 per cent in 1992 (Table 10).
TABLE 10. Malaysia wage bill and sales per employee, manufacturing sector, 1988-1992
Year Wage Bill Per % Change Sales Per % Change Employee Employee (RM'OOO) (RM'OOO)
1988 7.6 120.9
1989 7.7 2.0 126.3 4.5
1990 8.2 6.4 137.0 8.5
1991 8.8 7.6 148.0 8.0
1992 9.7 10.0 147.9 -0.05
Source: Department of Statistics

The Role of Human Capital Formation 125
At the same time, labor cost per employee (an indicator of competitiveness) has been increasing faster than productivity (GDP
per employee) between the period 1990 and 1992 (Table 11). During this period, there was concern that the competitiveness of the manufacturing sector was declining. However, in 1993 there were some positive developments, whereby productivity increases surpassed growth in labor cost per employee as well as Unit Labor Cost. This development could be attributed to capital investments made earlier to mitigate the labor shortage problems. Furthermore, the move into capital intensive operations involving modern technology is also necessary to keep abreast with global trends in technological progress in order to stay competitive in terms of product quality, variety and cost.
TABLE 11. Productivity, labour cost per employee and unit labour cost (ULC) growth rates (%)
1988 1989 1990 1991 1992 1993
Prod ucti vi ty 6.92 -1.21 5.03 6.94 4.85 6.96
Lab. Cost/Empl. -2.52 3.53 4.13 11.93 10.02 2.91
Unit Lab. Cost -11.90 -2.31 6.23 3.17 10.08 -2.29
Source: i. NPC, Malaysia ii. EPU: Data on labour Cost/Employee & ULC for 1992 & 1993 were
estimated based on monthly manufacturing statistics, DOS. Both indicators are up to third quarter 1993. Data on Productivity are from sectoral computation.
CURRENT AND FUTURE POLICIES
The excess demand shown in the above indicates that the nineties will be a crucial turning point in human capital formation with an increased and unprecedented private sector involvement in the skills delivery system in terms of both pre-employment training and retraining activities.
For example, the Human Resource Development Fund (HRDF),
launched in 1993, was aimed at encouraging and facilitating companies in the manufacturing sector to provide training for employees. It has received tremendous response. During the second half of 1993, applications for training received approval covering over 25,000 workers. For the first two months of 1994, approval
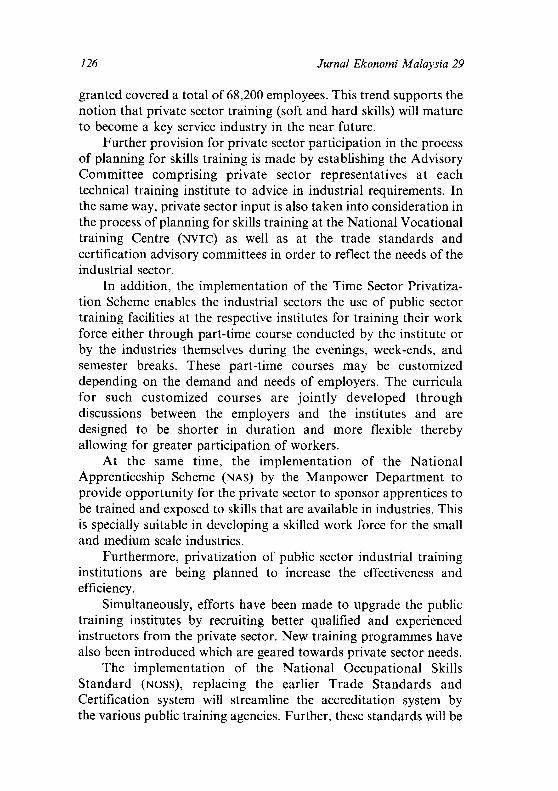
126 Jurnal Ekonomi Malaysia 29
granted covered a total of 68,200 employees. This trend supports the notion that private sector training (soft and hard skills) will mature to become a key service industry in the near future.
Further provision for private sector participation in the process of planning for skills training is made by establishing the Advisory Committee comprising private sector representatives at each technical training institute to advice in industrial requirements. In the same way, private sector input is also taken into consideration in the process of planning for skills training at the National Vocational training Centre (NVTC) as well as at the trade standards and certification advisory committees in order to reflect the needs of the industrial sector.
In addition, the implementation of the Time Sector Privatization Scheme enables the industrial sectors the use of public sector training facilities at the respective institutes for training their work force either through part-time course conducted by the institute or by the industries themselves during the evenings, week-ends, and semester breaks. These part-time courses may be customized depending on the demand and needs of employers. The curricula for such customized courses are jointly developed through discussions between the employers and the institutes and are designed to be shorter in duration and more flexible thereby allowing for greater participation of workers.
At the same time, the implementation of the National Apprenticeship Scheme (NAS) by the Manpower Department to provide opportunity for the private sector to sponsor apprentices to be trained and exposed to skills that are available in industries. This is specially suitable in developing a skilled work force for the small and medium scale industries.
Furthermore, privatization of public sector industrial training institutions are being planned to increase the effectiveness and efficiency.
Simultaneously, efforts have been made to upgrade the public training institutes by recruiting better qualified and experienced instructors from the private sector. New training programmes have also been introduced which are geared towards private sector needs.
The implementation of the National Occupational Skills Standard (NOSS), replacing the earlier Trade Standards and Certification system will streamline the accreditation system by the various public training agencies. Further, these standards will be

The Role of Human Capital Formation 127
reviewed periodically in line with the technological development in the industry.
The need for better labor market information is also recognized thereby leading to an increase in tracer studies as well as other labor market studies.
Although the current policy measures represent a move in the right direction for enhancing the competitiveness of the manufacturing sector by upgrading the skills of the labor force, the following policy suggestions may help to fine-tune current policy measures by complementing these existing measures.
1. Tracking Technology Trends And Specializing in Training Areas From the days of the invention of the wheel to the age of the 'chip', the life-span of a technology is getting shorter. The 1990s and the decades ahead will see dramatic developments that would add to the complexities of today. Hence any "open system" has to posses the requisite variety in the form of knowledge, resources and internal processes to sustain itself in relation to changes in the external environment. In this context, internal strengths and weakness must be assessed vis-a-vis with external opportunities and threats in relation to technology development.
Technology prognosis then is an essential first step towards this end that would enable us to identify key technologies (where we have a clear influence on the competitive advantage of products) and build upon it for industrial application and development. Having done this, it is vital for translating technology information into skills requirement to support the production process. In other words, a mechanism for the exchange of technology information must incorporate with it the skill content necessary for manning industrial production processes. In this way, appropriate prior adjustment can be made to the training and education curriculum. This would make it "Just-in-Time" and reduce the long gestation periods in the relevant specialist area.
Ideally, skill requirements in new and emerging technologies should be the precept of specialized government initiated/funded institutions (as in the case of the German Malaysian Institute and other similar institutes) with expertise coming largely from the 'owners' (eg. governments providing technical aids, vendors etc.). In turn skill requirements in the form of retraining/upgrading can be the specialization of industry based training such as the Penang Skills Development centre (PSDC), or similar institutions, with

128 Jurnal Ekonomi Malaysia 29
significant industry involvement. Private industrial training institutions should be earmarked for both pre-employment training and retraining. This would entail a planned and gradual phasing-out of public industrial training institution which traditionally provided basic skills training.
2. Training Culture and Professionalism Under the Pro Ius Scheme of the HRDF, employers are encouraged to draw training programs by seeking the services of training consultants. This was a deliberate attempt by the government to instill a sense of training cultufe and consciousness. Though this has been gaining popularity, there are two areas that need special attention:-
a. more training and consultancy enterprises need to be encouraged. The level of professionalism of these enterprises need to be assessed continually; and
b. Training consciousness is more prevalent in larger companies than the smaller and largely locally incorporated companies. The small and medium industries should be focussed for assistance.
3. Involving Industry Association In The Mainstream of Training Traditionally training was not within the ambit of industry associations. As technology progresses, generic skills are giving way to specialized industry specific skills. The best industrial knowhow comes from the masters within the industry itself. With proper organization, industries can pool their vast human and capital resources to provide industry specific training. For this purpose it would be necessary for some industries to re-group or affiliate with one another based on commonality in technology usage. This would especially be more relevant to export-oriented industries where the question of domestic competition does not arise.
4. Labor productivity Wage increases that commensurate with acquired skills and application in the production process will yield a higher output which can then contribute to real growth. Influences that are irrelevant to productivity need to be minimized or if possible shut out altogether. In the long run, it is productivity that counts for a stable and sustained economic growth and competitiveness which contributes to the well-being of workers themselves.
In this respect a more flexible system of wage determination which takes into consideration performance variables need to be

The Role of Human Capital Formation 129
encouraged both in the unionized as well as non-unionized sectors of the economy. Automatic wage movements must be reviewed as well, in consideration of elements such as variable bonus based on both company profits and individual/group performance. But before any such initiatives are made all parties involved should be clear of the subject matter - namely the employees, employee unions, employers, employer unions and the industrial courts too. Therefore prior preparation need to be done to educate the respective parties in the light of new global developments.
CONCLUSION
Competitiveness basically boils down to two key areas, namely the efficiency of skill delivery system and productivity growth by the work force. Productivity of the work force is bound by genesismaturity-decline curve where at the maturity stage, changes need to be considered and introduced through capital investments in new technology in order to avoid the inevitable decline in labor productivity. With the ready availability of technology and increased global economic liberalization, other countries can also leap-frog in the development continuum. Therefore, the timely supply of labor with the requisite skills become a very pertinent aspect in facilitating competitiven·ess.
For Malaysia, the excess demand for skilled labor further underscores the need to upgrade the skills of the labor force continuously. In this matter, technology prognosis and the translation of this prognosis into skills required will definitely enhance our competitive edge. Further encouragement toward the development of a training culture as well as deepening the level of professionalism of training enterprises will undoubtedly contribute to the development of a flexible and skilled labor force. Industry associations can provide additional support in this area as well. Finally, the development of a flexible wage system will ensure wage increments which are commensurate with productivity improvements.
NOTES
1 This section is extracted from Sulaiman Mahbob, Anuwar Ali, Tham Siew Yean and Ng Siew Kiat (1994).

130 Jurnal Ekonomi Malaysia 29
2The survey covers a total of 1,461 new investors in the manufacturing sector seeking approval from MIDA over 1989-92. They were required to state future manpower needs by categories and occupations from the year of commencement until 1988. However, since the survey was not mandatory, it received a respond rate of 36.14 per cent. In addition, 20 per cent of the approved projects may not take off. Further, some of the investors were not able to determine exactly the type of occupations required.
REFERENCES
Anuwar Ali. 1992. Malaysia's Industrialization: The Quest for Technology. South East Asian Social Science Monographs. Singapre: Oxford University Press.
Department of Statistics. Unpublished data. Malaysia. 1991. Sixth Malaysia Plan, 1991-1995. Kuala Lumpur.
Percetakan Kerajaan. -------. 1993. Mid-Term Review of Sixth Malaysia Plan, 1991-
1995. Kuala Lumpur. Percetakan Kerajaan. Ministry of Human Resources. 1993. Prospective Employment in the
Manufacturing Sector, 1990-1998. Kuala Lumpur: Ministry of Human Resources.
National Productivity Centre. Unpublished Data. Sulaiman Mahbob, Anuwar Ali, Tham Siew Yean & Ng Siew Kiat. 1994.
Human Resource Requirements: Are We Equipped to Attain Vision 2020? Presented at the MIER 1994 National Outlook Conference. Kuala Lumpur.
World Economic Forum. 1993. The Annual Competiveness Report. Geneva. Young Mei Ling & Ng Siew Kiat. 1992. Balancing the Role of Public and
Private Sectors in Education and Training. Presented at the Conference on Educational Restructuring and Economic Growth: Role of the Private Sector. Friedrich Naumann Foundatin and MIER. Kuala Lumpur.
Ministry of Human Resources Kuala Lumpur Malaysia