Embed Size (px)
Citation preview
Draft
Human Capital and Capital Formation in Agriculture of Bangladesh
Prof. S.M. Fakhrul Islam
Chapter 1
The Agriculture, Economy and Growth Scenarios
1. Current Situation of Agriculture and Food Security
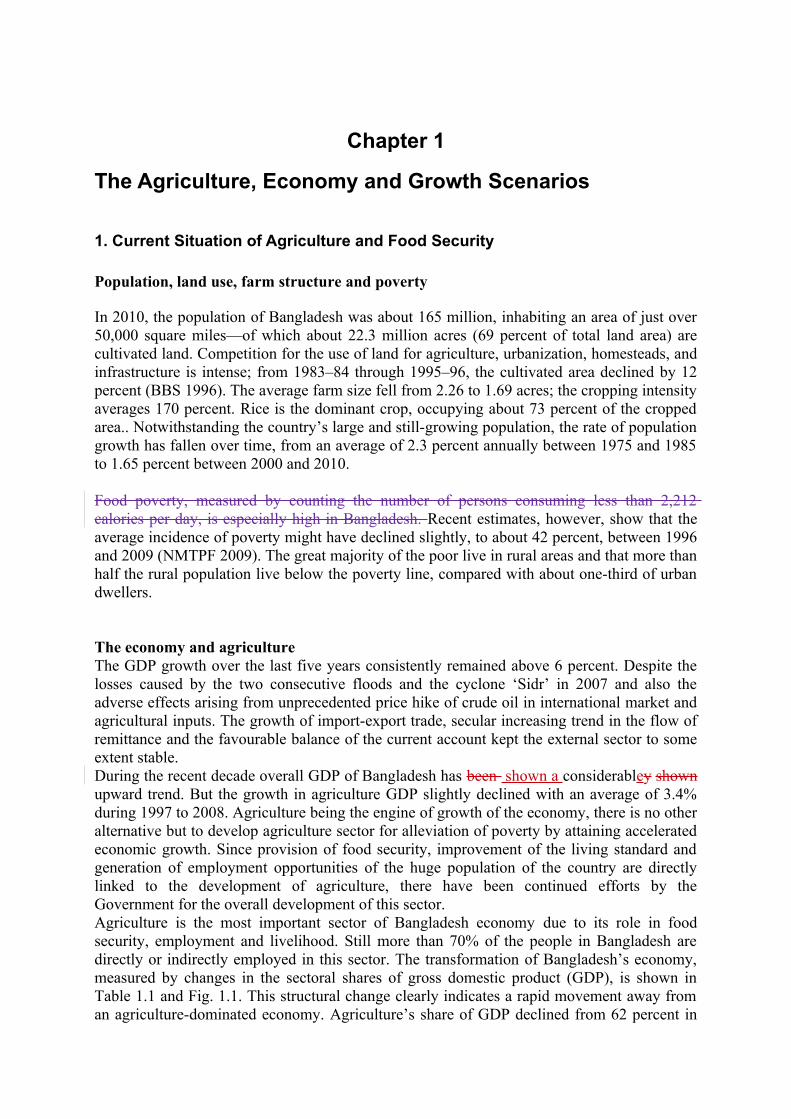
Population, land use, farm structure and poverty
In 2010, the population of Bangladesh was about 165 million, inhabiting an area of just over 50,000 square miles—of which about 22.3 million acres (69 percent of total land area) are cultivated land. Competition for the use of land for agriculture, urbanization, homesteads, and infrastructure is intense; from 1983–84 through 1995–96, the cultivated area declined by 12 percent (BBS 1996). The average farm size fell from 2.26 to 1.69 acres; the cropping intensity averages 170 percent. Rice is the dominant crop, occupying about 73 percent of the cropped area.. Notwithstanding the country’s large and still-growing population, the rate of population growth has fallen over time, from an average of 2.3 percent annually between 1975 and 1985 to 1.65 percent between 2000 and 2010.
Food poverty, measured by counting the number of persons consuming less than 2,212 calories per day, is especially high in Bangladesh. Recent estimates, however, show that the average incidence of poverty might have declined slightly, to about 42 percent, between 1996 and 2009 (NMTPF 2009). The great majority of the poor live in rural areas and that more than half the rural population live below the poverty line, compared with about one-third of urban dwellers.
The economy and agriculture The GDP growth over the last five years consistently remained above 6 percent. Despite the losses caused by the two consecutive floods and the cyclone ‘Sidr’ in 2007 and also the adverse effects arising from unprecedented price hike of crude oil in international market and agricultural inputs. The growth of import-export trade, secular increasing trend in the flow of remittance and the favourable balance of the current account kept the external sector to some extent stable.During the recent decade overall GDP of Bangladesh has been shown a considerabley shown upward trend. But the growth in agriculture GDP slightly declined with an average of 3.4% during 1997 to 2008. Agriculture being the engine of growth of the economy, there is no other alternative but to develop agriculture sector for alleviation of poverty by attaining accelerated economic growth. Since provision of food security, improvement of the living standard and generation of employment opportunities of the huge population of the country are directly linked to the development of agriculture, there have been continued efforts by the Government for the overall development of this sector.Agriculture is the most important sector of Bangladesh economy due to its role in food security, employment and livelihood. Still more than 70% of the people in Bangladesh are directly or indirectly employed in this sector. The transformation of Bangladesh’s economy, measured by changes in the sectoral shares of gross domestic product (GDP), is shown in Table 1.1 and Fig. 1.1. This structural change clearly indicates a rapid movement away from an agriculture-dominated economy. Agriculture’s share of GDP declined from 62 percent in
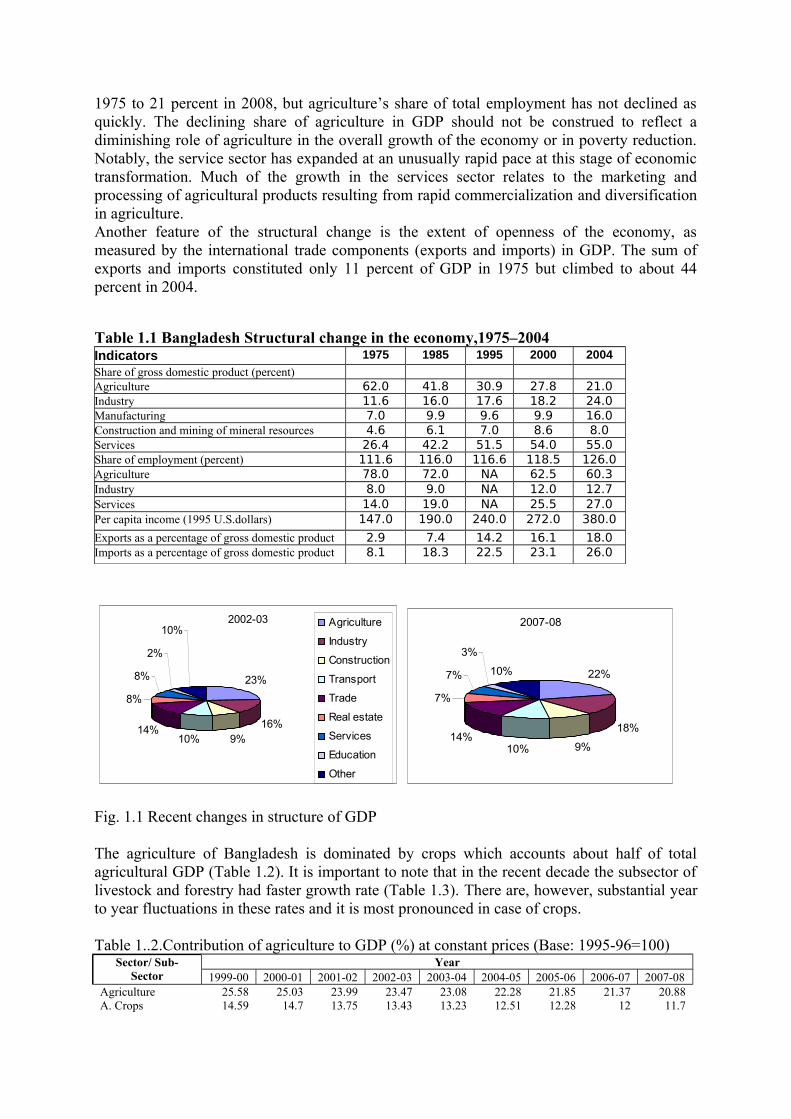
1975 to 21 percent in 2008, but agriculture’s share of total employment has not declined as quickly. The declining share of agriculture in GDP should not be construed to reflect a diminishing role of agriculture in the overall growth of the economy or in poverty reduction. Notably, the service sector has expanded at an unusually rapid pace at this stage of economic transformation. Much of the growth in the services sector relates to the marketing and processing of agricultural products resulting from rapid commercialization and diversification in agriculture. Another feature of the structural change is the extent of openness of the economy, as measured by the international trade components (exports and imports) in GDP. The sum of exports and imports constituted only 11 percent of GDP in 1975 but climbed to about 44 percent in 2004.
Table 1.1 Bangladesh Structural change in the economy,1975–2004Indicators 1975 1985 1995 2000 2004Share of gross domestic product (percent)Agriculture 62.0 41.8 30.9 27.8 21.0Industry 11.6 16.0 17.6 18.2 24.0Manufacturing 7.0 9.9 9.6 9.9 16.0Construction and mining of mineral resources 4.6 6.1 7.0 8.6 8.0Services 26.4 42.2 51.5 54.0 55.0Share of employment (percent) 111.6 116.0 116.6 118.5 126.0Agriculture 78.0 72.0 NA 62.5 60.3Industry 8.0 9.0 NA 12.0 12.7Services 14.0 19.0 NA 25.5 27.0Per capita income (1995 U.S.dollars) 147.0 190.0 240.0 272.0 380.0
Exports as a percentage of gross domestic product 2.9 7.4 14.2 16.1 18.0Imports as a percentage of gross domestic product 8.1 18.3 22.5 23.1 26.0
2002-03
23%
16%9%10%
14%
8%
8%
2%
10%Agriculture
Industry
Construction
Transport
Trade
Real estate
Services
Education
Other
2007-08
22%
18%
9%10%14%
7%
7%
3%
10%
Fig. 1.1 Recent changes in structure of GDP
The agriculture of Bangladesh is dominated by crops which accounts about half of total agricultural GDP (Table 1.2). It is important to note that in the recent decade the subsector of livestock and forestry had faster growth rate (Table 1.3). There are, however, substantial year to year fluctuations in these rates and it is most pronounced in case of crops.
Table 1..2.Contribution of agriculture to GDP (%) at constant prices (Base: 1995-96=100)Sector/ Sub-
SectorYear
1999-00 2000-01 2001-02 2002-03 2003-04 2004-05 2005-06 2006-07 2007-08Agriculture 25.58 25.03 23.99 23.47 23.08 22.28 21.85 21.37 20.88A. Crops 14.59 14.7 13.75 13.43 13.23 12.51 12.28 12 11.7
B. Livestock 3.02 2.95 2.96 2.93 2.91 2.95 2.92 2.88 2.79C. Forestry 1.88 1.87 1.88 1.86 1.83 1.82 1.79 1.76 1.75D. Fishing 6.09 5.51 5.4 5.25 5.11 5 4.86 4.73 4.64
Source: Statistical Yearbook of Bangladesh 2007
Table 1.3.Growth rate of agriculture and its sub-sectors at constant price (Base: 1995-96=100)Sector/ Sub-
SectorYear
1999-00 2000-01 2001-02 2002-03 2003-04 2004-05 2005-06 2006-07 2007-08GDP growth rate 5.94 5.27 4.42 5.26 6.27 5.96 6.63 6.43 6.21Agriculture 6.16 4.59 2.36 3.54 4.13 4.03 5.07 4.81 3.85A. Crops 8.10 6.18 -2.39 2.88 4.27 0.15 5.03 4.43 3.44B. Livestock 2.74 2.81 4.70 4.51 4.98 7.23 6.15 5.49 2.41C. Forestry 4.94 4.85 4.91 4.43 4.18 5.09 5.18 5.24 5.42D. Fishing 8.87 4.53 2.22 2.33 3.09 3.65 3.91 4.07 4.11
Source: Statistical Yearbook of Bangladesh 2007 & Statistical Pocket Book 2008
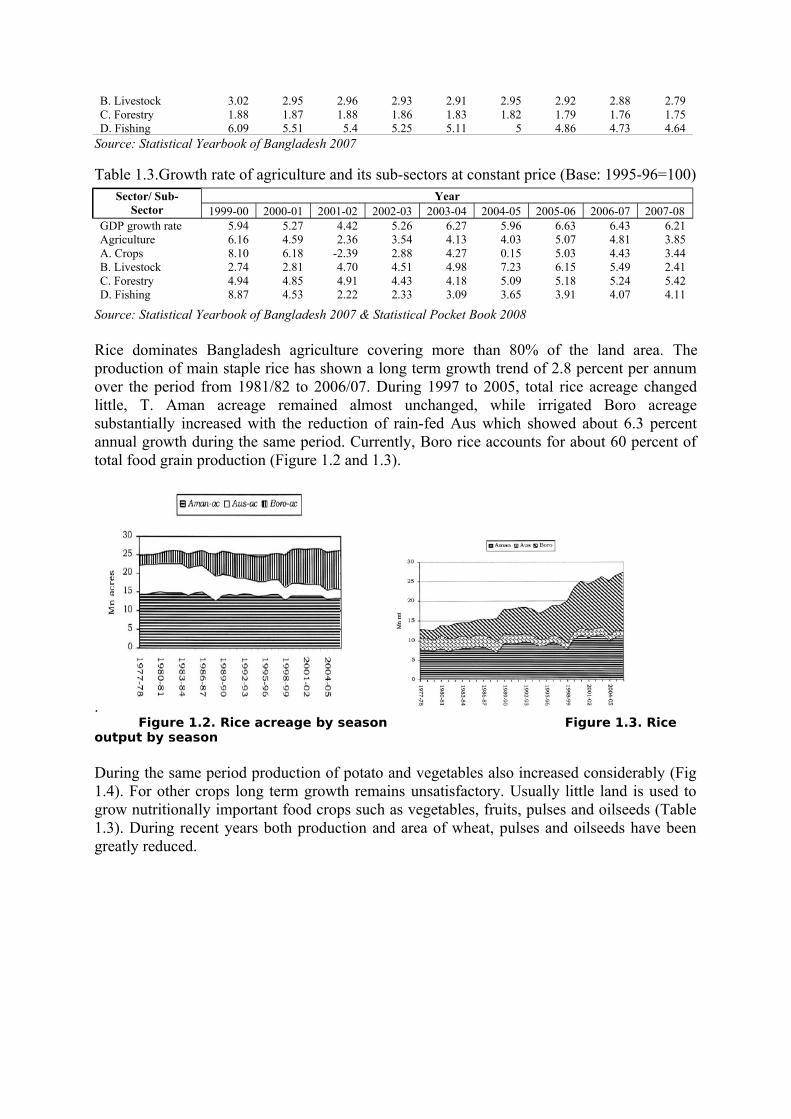
Rice dominates Bangladesh agriculture covering more than 80% of the land area. The production of main staple rice has shown a long term growth trend of 2.8 percent per annum over the period from 1981/82 to 2006/07. During 1997 to 2005, total rice acreage changed little, T. Aman acreage remained almost unchanged, while irrigated Boro acreage substantially increased with the reduction of rain-fed Aus which showed about 6.3 percent annual growth during the same period. Currently, Boro rice accounts for about 60 percent of total food grain production (Figure 1.2 and 1.3).
. Figure 1.2. Rice acreage by season Figure 1.3. Rice output by season
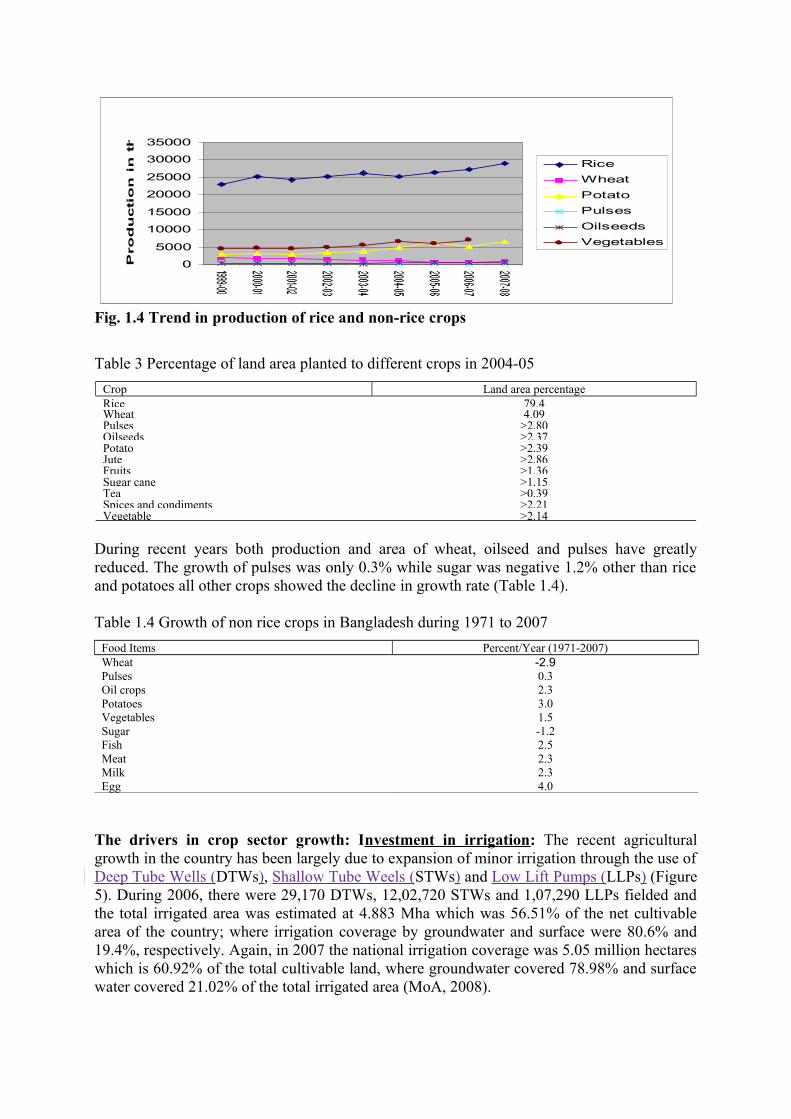
During the same period production of potato and vegetables also increased considerably (Fig 1.4). For other crops long term growth remains unsatisfactory. Usually little land is used to grow nutritionally important food crops such as vegetables, fruits, pulses and oilseeds (Table 1.3). During recent years both production and area of wheat, pulses and oilseeds have been greatly reduced.
0
5000
10000
15000
20000
25000
30000
35000P
ro
du
cti
on
in
th
ou
san
d M
t
Rice
Wheat
Potato
Pulses
Oilseeds
Vegetables
Fig. 1.4 Trend in production of rice and non-rice crops
Table 3 Percentage of land area planted to different crops in 2004-05
Crop Land area percentageRice 79.4Wheat 4.09Pulses >2.80Oilseeds >2.37Potato >2.39Jute >2.86Fruits >1.36Sugar cane >1.15Tea >0.39Spices and condiments >2.21Vegetable >2.14
During recent years both production and area of wheat, oilseed and pulses have greatly reduced. The growth of pulses was only 0.3% while sugar was negative 1.2% other than rice and potatoes all other crops showed the decline in growth rate (Table 1.4).
Table 1.4 Growth of non rice crops in Bangladesh during 1971 to 2007
Food Items Percent/Year (1971-2007)Wheat -2.9Pulses 0.3Oil crops 2.3Potatoes 3.0Vegetables 1.5Sugar -1.2Fish 2.5Meat 2.3Milk 2.3Egg 4.0
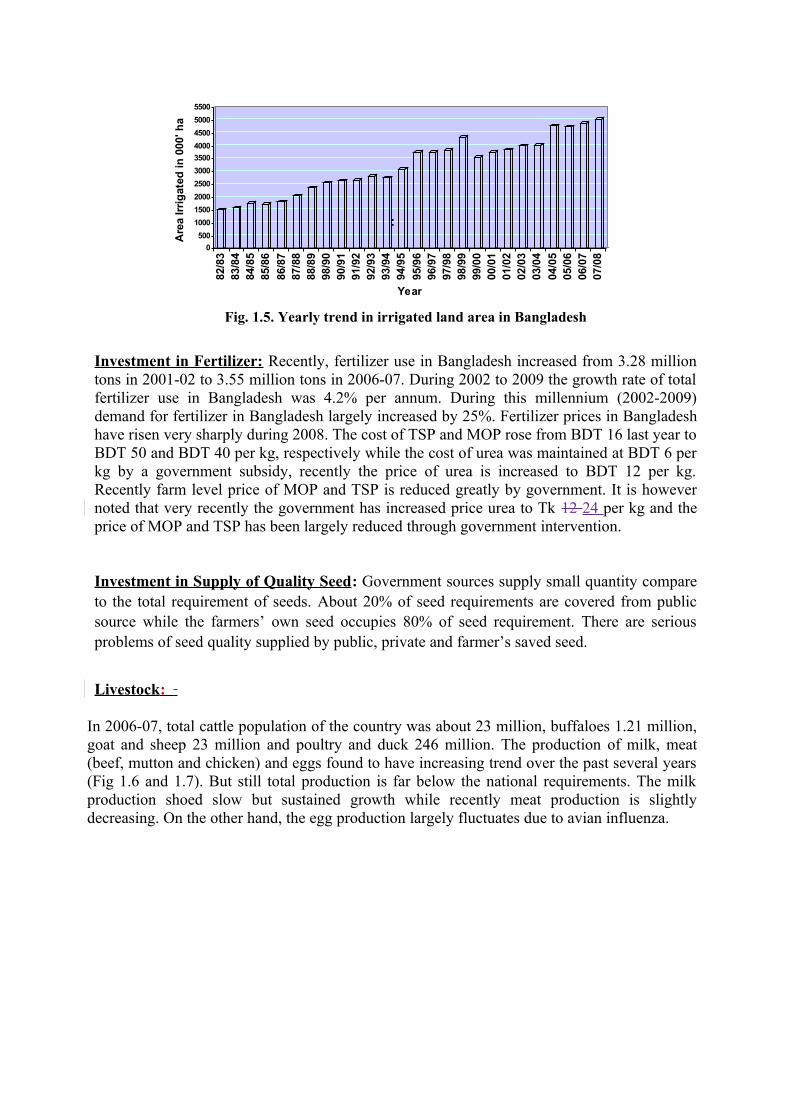
The drivers in crop sector growth: Investment in irrigation: The recent agricultural growth in the country has been largely due to expansion of minor irrigation through the use of Deep Tube Wells (DTWs), Shallow Tube Weels (STWs) and Low Lift Pumps (LLPs) (Figure 5). During 2006, there were 29,170 DTWs, 12,02,720 STWs and 1,07,290 LLPs fielded and the total irrigated area was estimated at 4.883 Mha which was 56.51% of the net cultivable area of the country; where irrigation coverage by groundwater and surface were 80.6% and 19.4%, respectively. Again, in 2007 the national irrigation coverage was 5.05 million hectares which is 60.92% of the total cultivable land, where groundwater covered 78.98% and surface water covered 21.02% of the total irrigated area (MoA, 2008).
0
500
1000
1500
2000
2500
3000
3500
4000
4500
5000
5500
Are
a Ir
rig
ated
in 0
00' h
a
82/8
383
/84
84/8
585
/86
86/8
787
/88
88/8
998
/90
90/9
191
/92
92/9
393
/94
94/9
5
95/9
696
/97
97/9
898
/99
99/0
000
/01
01/0
202
/03
03/0
4
04/0
505
/06
06/0
707
/08
Year
Fig 1: Trend of Irrigation Growth in Bangladesh
:
Investment in Fertilizer: Recently, fertilizer use in Bangladesh increased from 3.28 million tons in 2001-02 to 3.55 million tons in 2006-07. During 2002 to 2009 the growth rate of total fertilizer use in Bangladesh was 4.2% per annum. During this millennium (2002-2009) demand for fertilizer in Bangladesh largely increased by 25%. Fertilizer prices in Bangladesh have risen very sharply during 2008. The cost of TSP and MOP rose from BDT 16 last year to BDT 50 and BDT 40 per kg, respectively while the cost of urea was maintained at BDT 6 per kg by a government subsidy, recently the price of urea is increased to BDT 12 per kg. Recently farm level price of MOP and TSP is reduced greatly by government. It is however noted that very recently the government has increased price urea to Tk 12 24 per kg and the price of MOP and TSP has been largely reduced through government intervention.
Investment in Supply of Quality Seed: Government sources supply small quantity compare to the total requirement of seeds. About 20% of seed requirements are covered from public source while the farmers’ own seed occupies 80% of seed requirement. There are serious problems of seed quality supplied by public, private and farmer’s saved seed.
Livestock :
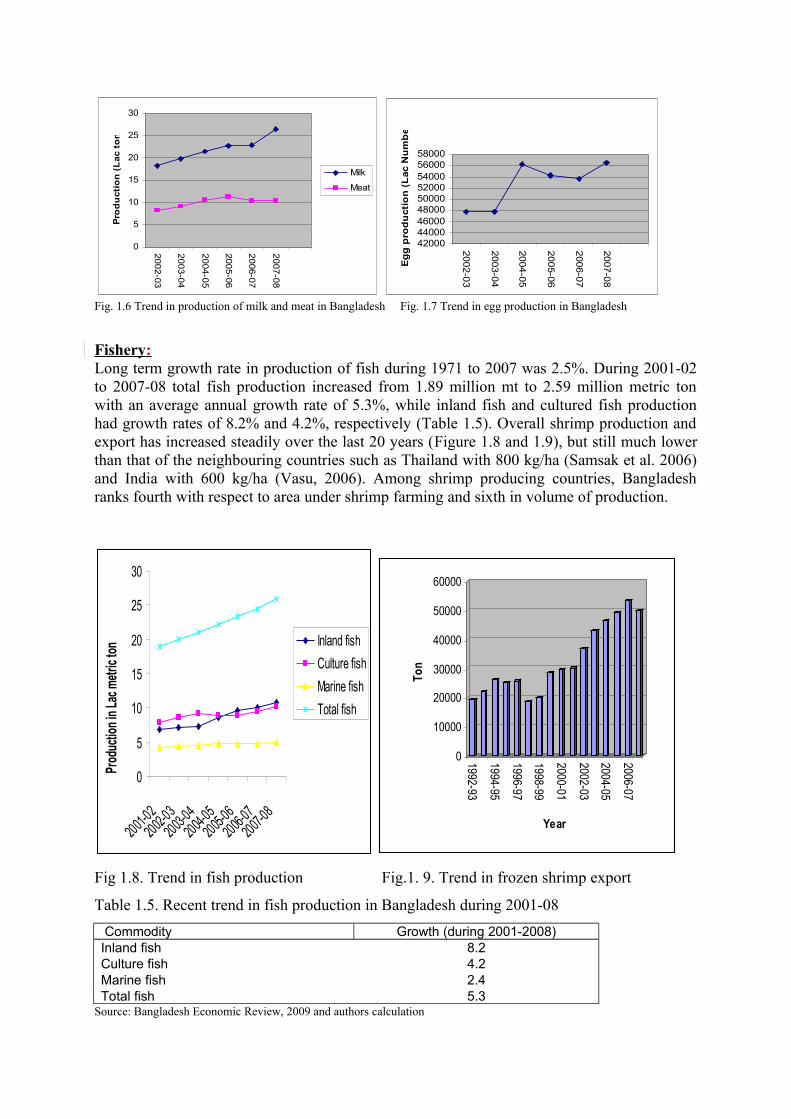
In 2006-07, total cattle population of the country was about 23 million, buffaloes 1.21 million, goat and sheep 23 million and poultry and duck 246 million. The production of milk, meat (beef, mutton and chicken) and eggs found to have increasing trend over the past several years (Fig 1.6 and 1.7). But still total production is far below the national requirements. The milk production shoed slow but sustained growth while recently meat production is slightly decreasing. On the other hand, the egg production largely fluctuates due to avian influenza.
Fig. 1.5. Yearly trend in irrigated land area in Bangladesh
0
5
10
15
20
25
30
200
2-0
3
2003-0
4
2004-0
5
2005-0
6
2006-0
7
2007
-08
Pro
du
cti
on
(L
ac t
on
)
Milk
Meat
420004400046000480005000052000540005600058000
2002-0
3
2003-0
4
2004-0
5
2005-0
6
2006-0
7
2007-0
8
Eg
g p
rod
ucti
on
(L
ac N
um
ber)
Fig. 1.6 Trend in production of milk and meat in Bangladesh Fig. 1.7 Trend in egg production in Bangladesh
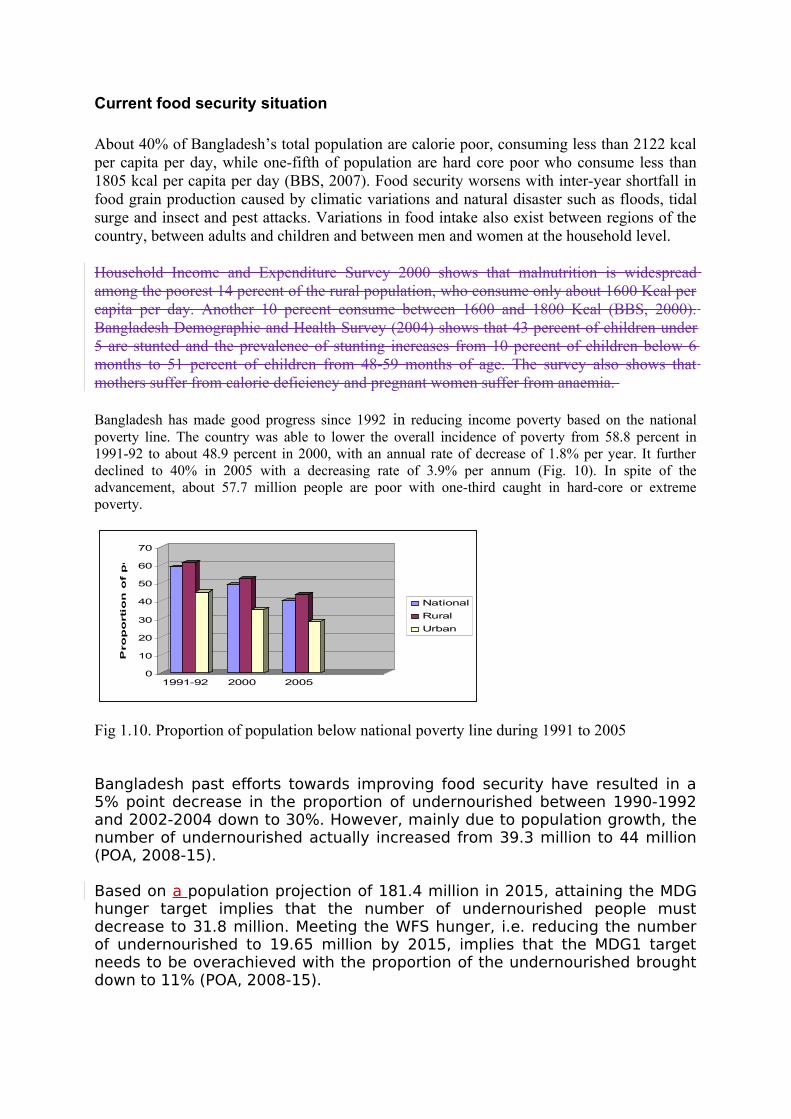
Fishery : Long term growth rate in production of fish during 1971 to 2007 was 2.5%. During 2001-02 to 2007-08 total fish production increased from 1.89 million mt to 2.59 million metric ton with an average annual growth rate of 5.3%, while inland fish and cultured fish production had growth rates of 8.2% and 4.2%, respectively (Table 1.5). Overall shrimp production and export has increased steadily over the last 20 years (Figure 1.8 and 1.9), but still much lower than that of the neighbouring countries such as Thailand with 800 kg/ha (Samsak et al. 2006) and India with 600 kg/ha (Vasu, 2006). Among shrimp producing countries, Bangladesh ranks fourth with respect to area under shrimp farming and sixth in volume of production.
0
5
10
15
20
25
30
2001-02
2002-03
2003-04
2004-05
2005-06
2006-07
2007-08
Prod
uctio
n in
Lac
met
ric to
n Inland fish
Culture fish
Marine fish
Total fish
0
10000
20000
30000
40000
50000
60000
Ton
1992-93
1994-95
1996-97
1998-99
2000-01
2002-03
2004-05
2006-07
Year
Fig 1.8. Trend in fish production Fig.1. 9. Trend in frozen shrimp export
Table 1.5. Recent trend in fish production in Bangladesh during 2001-08
Commodity Growth (during 2001-2008)Inland fish 8.2Culture fish 4.2Marine fish 2.4Total fish 5.3
Source: Bangladesh Economic Review, 2009 and authors calculation
Current food security situation
About 40% of Bangladesh’s total population are calorie poor, consuming less than 2122 kcal per capita per day, while one-fifth of population are hard core poor who consume less than 1805 kcal per capita per day (BBS, 2007). Food security worsens with inter-year shortfall in food grain production caused by climatic variations and natural disaster such as floods, tidal surge and insect and pest attacks. Variations in food intake also exist between regions of the country, between adults and children and between men and women at the household level.
Household Income and Expenditure Survey 2000 shows that malnutrition is widespread among the poorest 14 percent of the rural population, who consume only about 1600 Kcal per capita per day. Another 10 percent consume between 1600 and 1800 Kcal (BBS, 2000). Bangladesh Demographic and Health Survey (2004) shows that 43 percent of children under 5 are stunted and the prevalence of stunting increases from 10 percent of children below 6 months to 51 percent of children from 48-59 months of age. The survey also shows that mothers suffer from calorie deficiency and pregnant women suffer from anaemia.
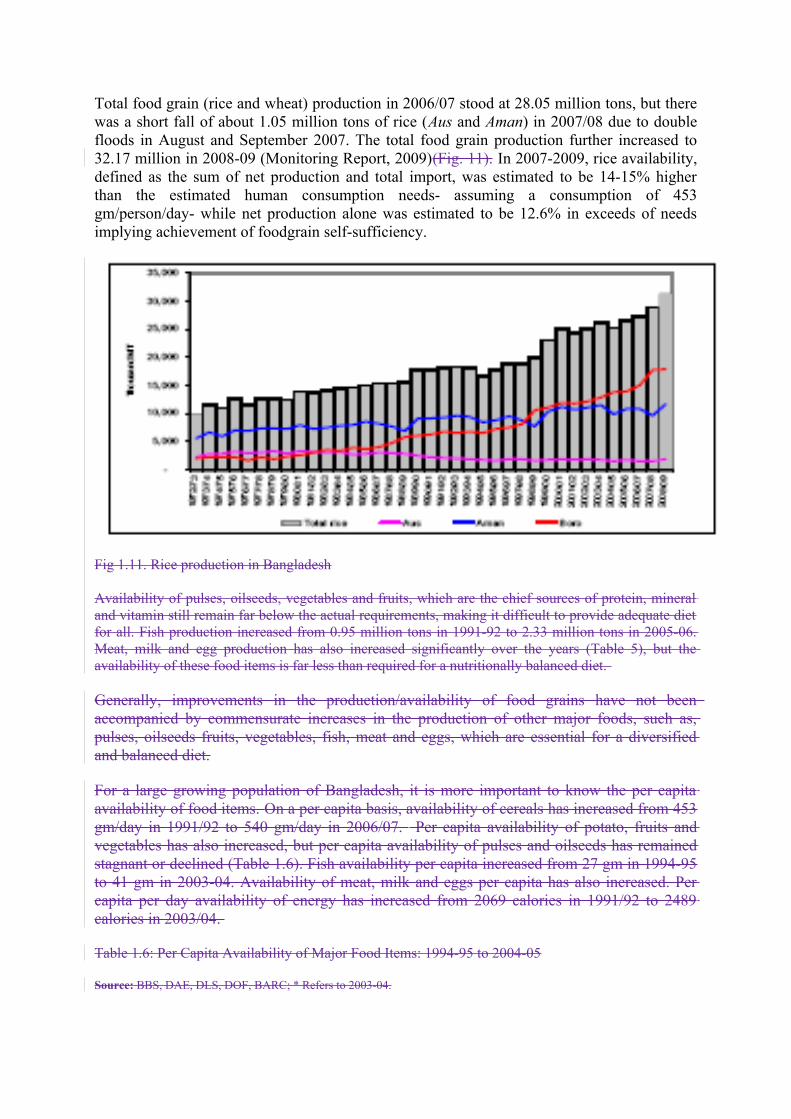
Bangladesh has made good progress since 1992 in reducing income poverty based on the national poverty line. The country was able to lower the overall incidence of poverty from 58.8 percent in 1991-92 to about 48.9 percent in 2000, with an annual rate of decrease of 1.8% per year. It further declined to 40% in 2005 with a decreasing rate of 3.9% per annum (Fig. 10). In spite of the advancement, about 57.7 million people are poor with one-third caught in hard-core or extreme poverty.
0
10
20
30
40
50
60
70
Pro
po
rti
on
of
po
pu
lati
on
1991-92 2000 2005
National
Rural
Urban
Fig 1.10. Proportion of population below national poverty line during 1991 to 2005
Bangladesh past efforts towards improving food security have resulted in a 5% point decrease in the proportion of undernourished between 1990-1992 and 2002-2004 down to 30%. However, mainly due to population growth, the number of undernourished actually increased from 39.3 million to 44 million (POA, 2008-15).
Based on a population projection of 181.4 million in 2015, attaining the MDG hunger target implies that the number of undernourished people must decrease to 31.8 million. Meeting the WFS hunger, i.e. reducing the number of undernourished to 19.65 million by 2015, implies that the MDG1 target needs to be overachieved with the proportion of the undernourished brought down to 11% (POA, 2008-15).
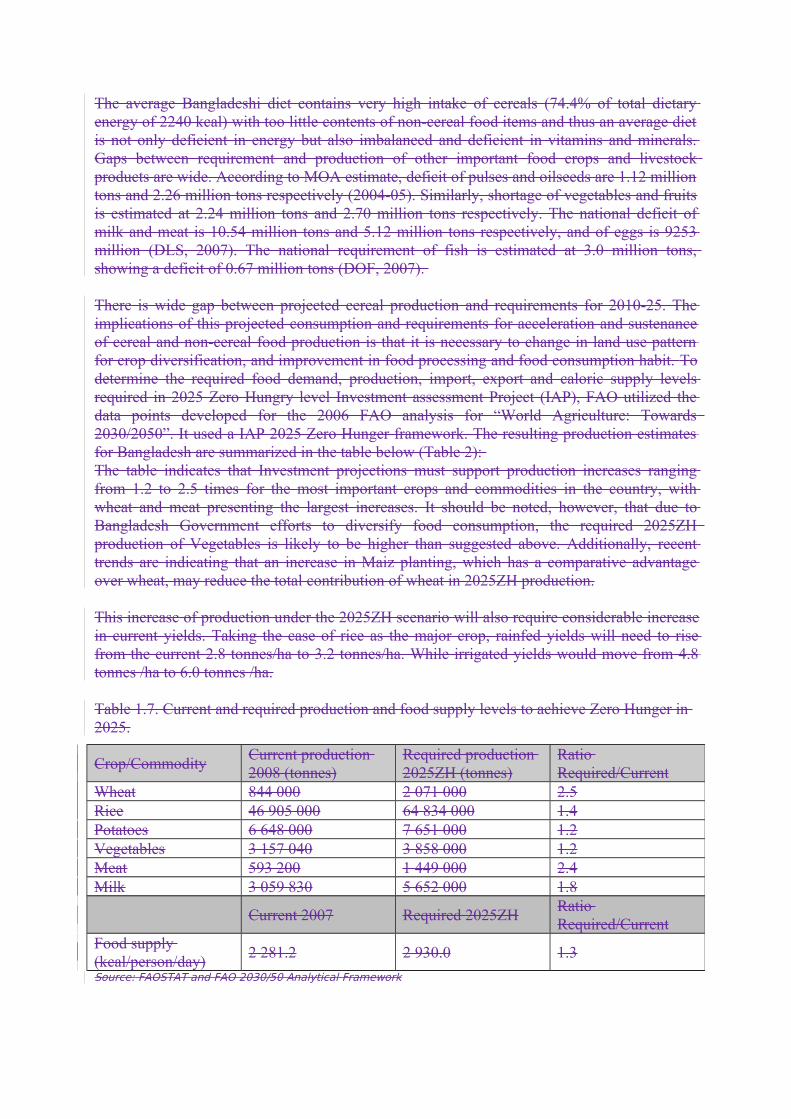
Total food grain (rice and wheat) production in 2006/07 stood at 28.05 million tons, but there was a short fall of about 1.05 million tons of rice (Aus and Aman) in 2007/08 due to double floods in August and September 2007. The total food grain production further increased to 32.17 million in 2008-09 (Monitoring Report, 2009)(Fig. 11). In 2007-2009, rice availability, defined as the sum of net production and total import, was estimated to be 14-15% higher than the estimated human consumption needs- assuming a consumption of 453 gm/person/day- while net production alone was estimated to be 12.6% in exceeds of needs implying achievement of foodgrain self-sufficiency.
Fig 1.11. Rice production in Bangladesh
Availability of pulses, oilseeds, vegetables and fruits, which are the chief sources of protein, mineral and vitamin still remain far below the actual requirements, making it difficult to provide adequate diet for all. Fish production increased from 0.95 million tons in 1991-92 to 2.33 million tons in 2005-06. Meat, milk and egg production has also increased significantly over the years (Table 5), but the availability of these food items is far less than required for a nutritionally balanced diet.
Generally, improvements in the production/availability of food grains have not been accompanied by commensurate increases in the production of other major foods, such as, pulses, oilseeds fruits, vegetables, fish, meat and eggs, which are essential for a diversified and balanced diet.
For a large growing population of Bangladesh, it is more important to know the per capita availability of food items. On a per capita basis, availability of cereals has increased from 453 gm/day in 1991/92 to 540 gm/day in 2006/07. Per capita availability of potato, fruits and vegetables has also increased, but per capita availability of pulses and oilseeds has remained stagnant or declined (Table 1.6). Fish availability per capita increased from 27 gm in 1994-95 to 41 gm in 2003-04. Availability of meat, milk and eggs per capita has also increased. Per capita per day availability of energy has increased from 2069 calories in 1991/92 to 2489 calories in 2003/04.
Table 1.6: Per Capita Availability of Major Food Items: 1994-95 to 2004-05
Source: BBS, DAE, DLS, DOF, BARC; * Refers to 2003-04.
The average Bangladeshi diet contains very high intake of cereals (74.4% of total dietary energy of 2240 kcal) with too little contents of non-cereal food items and thus an average diet is not only deficient in energy but also imbalanced and deficient in vitamins and minerals. Gaps between requirement and production of other important food crops and livestock products are wide. According to MOA estimate, deficit of pulses and oilseeds are 1.12 million tons and 2.26 million tons respectively (2004-05). Similarly, shortage of vegetables and fruits is estimated at 2.24 million tons and 2.70 million tons respectively. The national deficit of milk and meat is 10.54 million tons and 5.12 million tons respectively, and of eggs is 9253 million (DLS, 2007). The national requirement of fish is estimated at 3.0 million tons, showing a deficit of 0.67 million tons (DOF, 2007).
There is wide gap between projected cereal production and requirements for 2010-25. The implications of this projected consumption and requirements for acceleration and sustenance of cereal and non-cereal food production is that it is necessary to change in land use pattern for crop diversification, and improvement in food processing and food consumption habit. To determine the required food demand, production, import, export and caloric supply levels required in 2025 Zero Hungry level Investment assessment Project (IAP), FAO utilized the data points developed for the 2006 FAO analysis for “World Agriculture: Towards 2030/2050”. It used a IAP 2025 Zero Hunger framework. The resulting production estimates for Bangladesh are summarized in the table below (Table 2): The table indicates that Investment projections must support production increases ranging from 1.2 to 2.5 times for the most important crops and commodities in the country, with wheat and meat presenting the largest increases. It should be noted, however, that due to Bangladesh Government efforts to diversify food consumption, the required 2025ZH production of Vegetables is likely to be higher than suggested above. Additionally, recent trends are indicating that an increase in Maiz planting, which has a comparative advantage over wheat, may reduce the total contribution of wheat in 2025ZH production.
This increase of production under the 2025ZH scenario will also require considerable increase in current yields. Taking the case of rice as the major crop, rainfed yields will need to rise from the current 2.8 tonnes/ha to 3.2 tonnes/ha. While irrigated yields would move from 4.8 tonnes /ha to 6.0 tonnes /ha.
Table 1.7. Current and required production and food supply levels to achieve Zero Hunger in 2025.
Source: FAOSTAT and FAO 2030/50 Analytical Framework
Crop/CommodityCurrent production 2008 (tonnes)
Required production 2025ZH (tonnes)
Ratio Required/Current
Wheat 844 000 2 071 000 2.5Rice 46 905 000 64 834 000 1.4Potatoes 6 648 000 7 651 000 1.2Vegetables 3 157 040 3 858 000 1.2Meat 593 200 1 449 000 2.4Milk 3 059 830 5 652 000 1.8
Current 2007 Required 2025ZHRatio Required/Current
Food supply (kcal/person/day)
2 281.2 2 930.0 1.3

2. Growth Experiences in Bangladesh
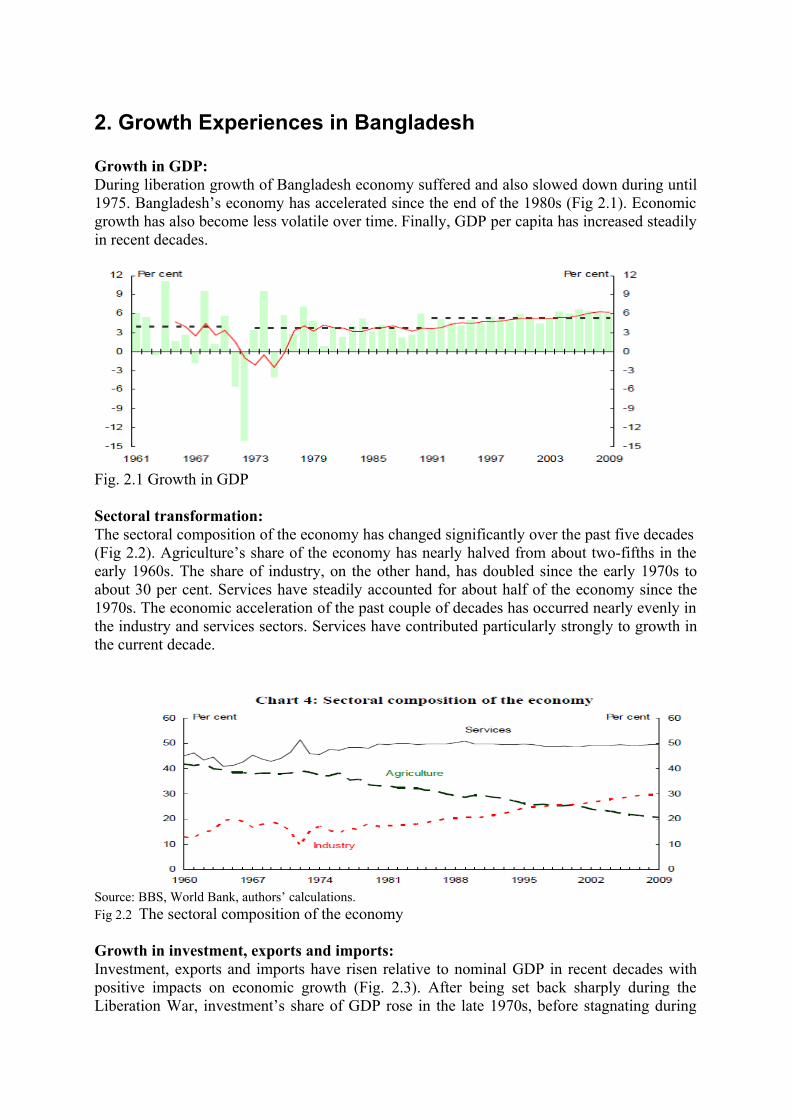
Growth in GDP:During liberation growth of Bangladesh economy suffered and also slowed down during until 1975. Bangladesh’s economy has accelerated since the end of the 1980s (Fig 2.1). Economic growth has also become less volatile over time. Finally, GDP per capita has increased steadily in recent decades.
Fig. 2.1 Growth in GDP
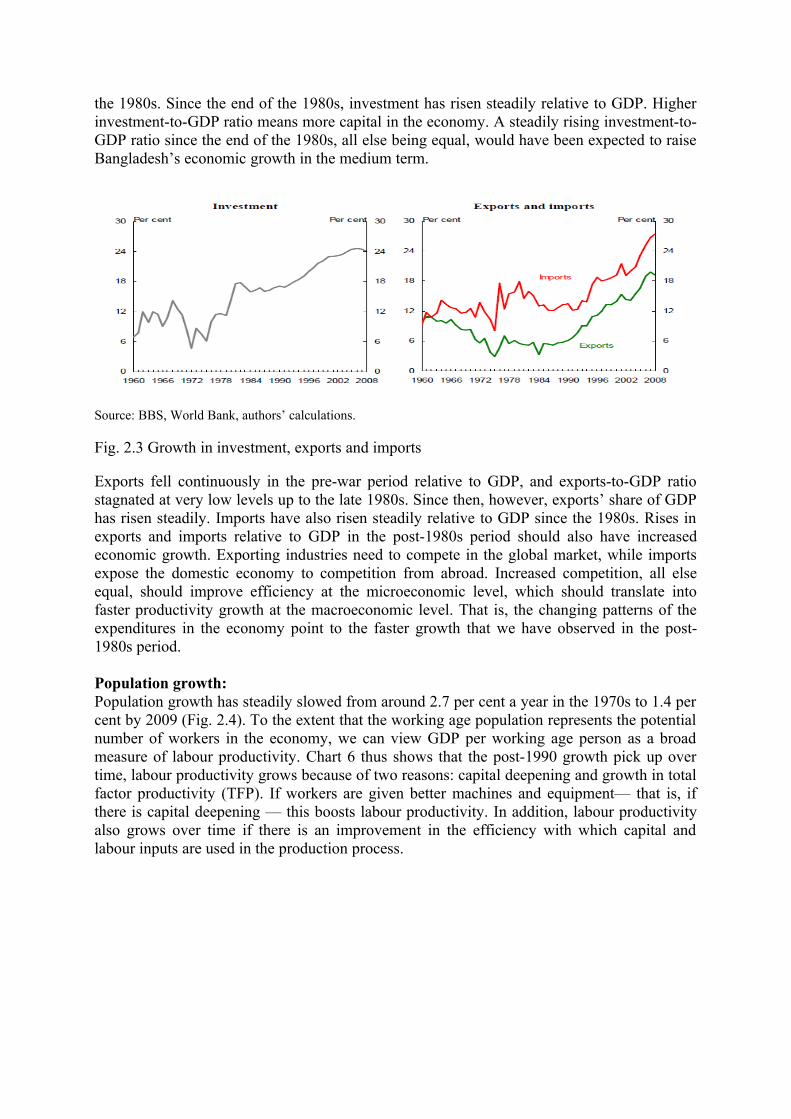
Sectoral transformation:The sectoral composition of the economy has changed significantly over the past five decades(Fig 2.2). Agriculture’s share of the economy has nearly halved from about two-fifths in the early 1960s. The share of industry, on the other hand, has doubled since the early 1970s to about 30 per cent. Services have steadily accounted for about half of the economy since the 1970s. The economic acceleration of the past couple of decades has occurred nearly evenly in the industry and services sectors. Services have contributed particularly strongly to growth in the current decade.
Source: BBS, World Bank, authors’ calculations.Fig 2.2 The sectoral composition of the economy
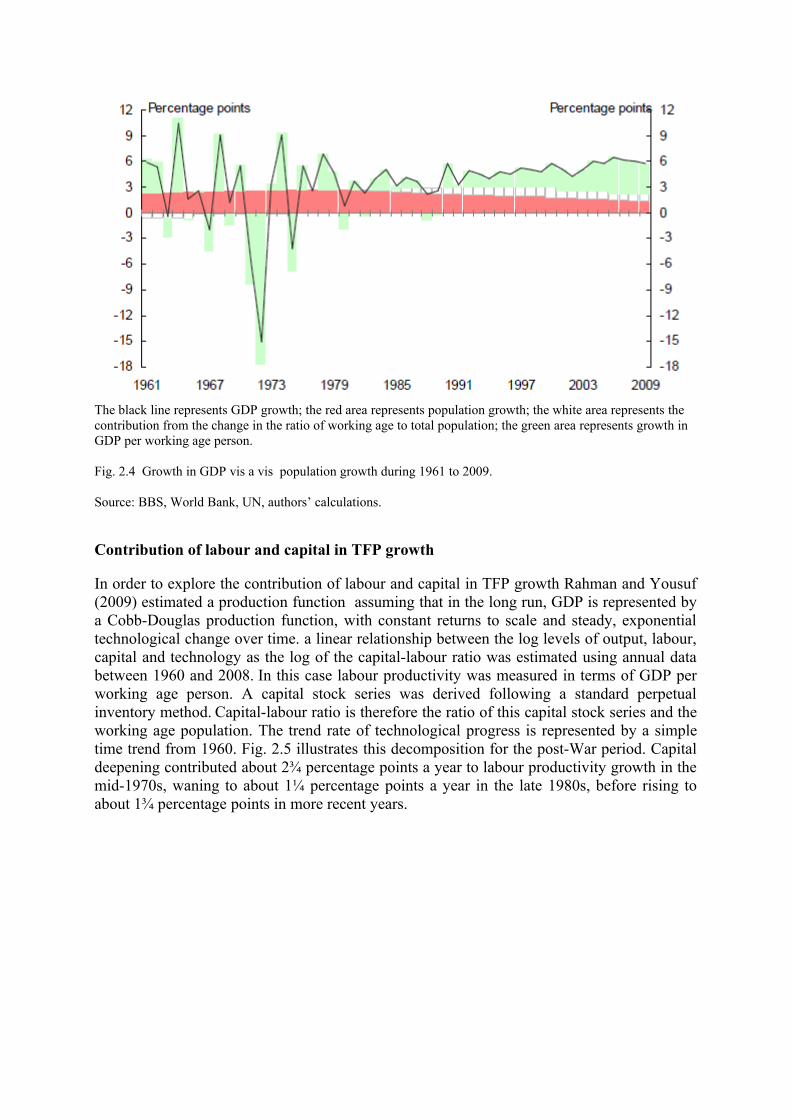
Growth in investment, exports and imports:Investment, exports and imports have risen relative to nominal GDP in recent decades with positive impacts on economic growth (Fig. 2.3). After being set back sharply during the Liberation War, investment’s share of GDP rose in the late 1970s, before stagnating during
the 1980s. Since the end of the 1980s, investment has risen steadily relative to GDP. Higher investment-to-GDP ratio means more capital in the economy. A steadily rising investment-to-GDP ratio since the end of the 1980s, all else being equal, would have been expected to raise Bangladesh’s economic growth in the medium term.
Source: BBS, World Bank, authors’ calculations.
Fig. 2.3 Growth in investment, exports and imports
Exports fell continuously in the pre-war period relative to GDP, and exports-to-GDP ratio stagnated at very low levels up to the late 1980s. Since then, however, exports’ share of GDP has risen steadily. Imports have also risen steadily relative to GDP since the 1980s. Rises in exports and imports relative to GDP in the post-1980s period should also have increased economic growth. Exporting industries need to compete in the global market, while imports expose the domestic economy to competition from abroad. Increased competition, all else equal, should improve efficiency at the microeconomic level, which should translate into faster productivity growth at the macroeconomic level. That is, the changing patterns of the expenditures in the economy point to the faster growth that we have observed in the post-1980s period.
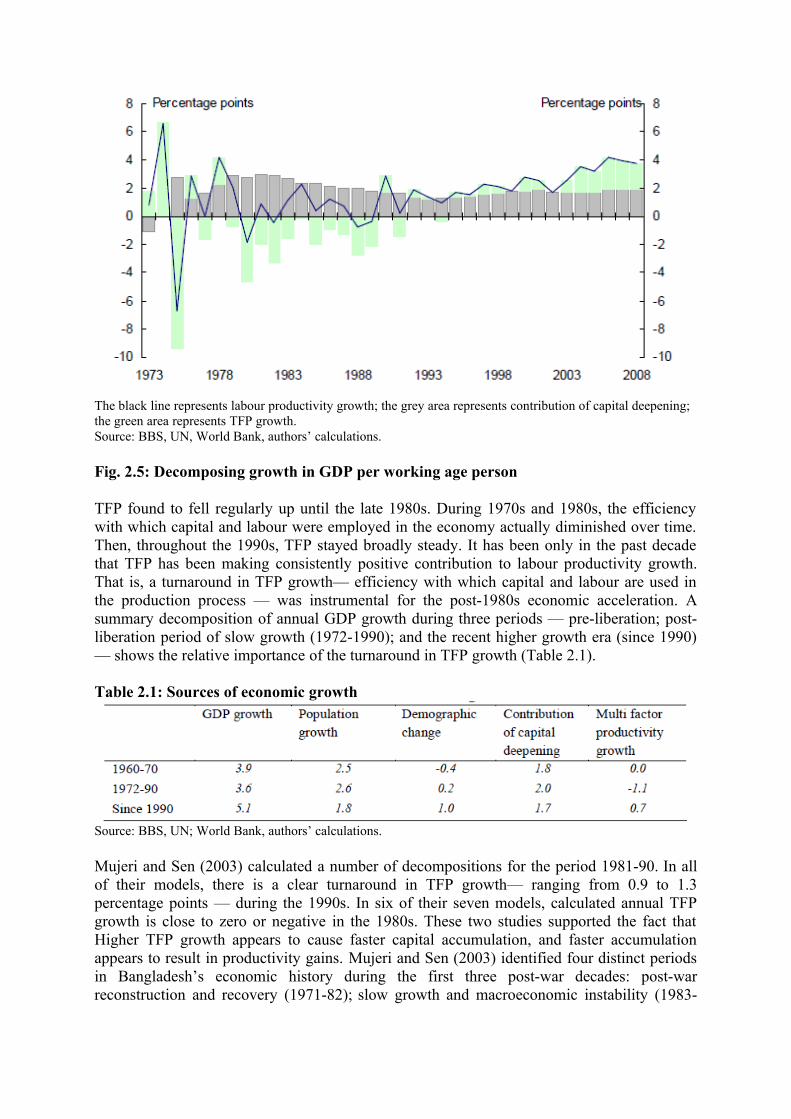
Population growth:Population growth has steadily slowed from around 2.7 per cent a year in the 1970s to 1.4 per cent by 2009 (Fig. 2.4). To the extent that the working age population represents the potential number of workers in the economy, we can view GDP per working age person as a broad measure of labour productivity. Chart 6 thus shows that the post-1990 growth pick up over time, labour productivity grows because of two reasons: capital deepening and growth in total factor productivity (TFP). If workers are given better machines and equipment— that is, if there is capital deepening — this boosts labour productivity. In addition, labour productivity also grows over time if there is an improvement in the efficiency with which capital and labour inputs are used in the production process.
The black line represents GDP growth; the red area represents population growth; the white area represents thecontribution from the change in the ratio of working age to total population; the green area represents growth inGDP per working age person.
Fig. 2.4 Growth in GDP vis a vis population growth during 1961 to 2009.
Source: BBS, World Bank, UN, authors’ calculations.
Contribution of labour and capital in TFP growth
In order to explore the contribution of labour and capital in TFP growth Rahman and Yousuf (2009) estimated a production function assuming that in the long run, GDP is represented by a Cobb-Douglas production function, with constant returns to scale and steady, exponential technological change over time. a linear relationship between the log levels of output, labour, capital and technology as the log of the capital-labour ratio was estimated using annual data between 1960 and 2008. In this case labour productivity was measured in terms of GDP per working age person. A capital stock series was derived following a standard perpetual inventory method. Capital-labour ratio is therefore the ratio of this capital stock series and the working age population. The trend rate of technological progress is represented by a simple time trend from 1960. Fig. 2.5 illustrates this decomposition for the post-War period. Capital deepening contributed about 2¾ percentage points a year to labour productivity growth in the mid-1970s, waning to about 1¼ percentage points a year in the late 1980s, before rising to about 1¾ percentage points in more recent years.
The black line represents labour productivity growth; the grey area represents contribution of capital deepening;the green area represents TFP growth.Source: BBS, UN, World Bank, authors’ calculations.
Fig. 2.5: Decomposing growth in GDP per working age person
TFP found to fell regularly up until the late 1980s. During 1970s and 1980s, the efficiency with which capital and labour were employed in the economy actually diminished over time. Then, throughout the 1990s, TFP stayed broadly steady. It has been only in the past decade that TFP has been making consistently positive contribution to labour productivity growth. That is, a turnaround in TFP growth— efficiency with which capital and labour are used in the production process — was instrumental for the post-1980s economic acceleration. A summary decomposition of annual GDP growth during three periods — pre-liberation; post-liberation period of slow growth (1972-1990); and the recent higher growth era (since 1990) — shows the relative importance of the turnaround in TFP growth (Table 2.1).
Table 2.1: Sources of economic growth
Source: BBS, UN; World Bank, authors’ calculations.
Mujeri and Sen (2003) calculated a number of decompositions for the period 1981-90. In all of their models, there is a clear turnaround in TFP growth— ranging from 0.9 to 1.3 percentage points — during the 1990s. In six of their seven models, calculated annual TFP growth is close to zero or negative in the 1980s. These two studies supported the fact that Higher TFP growth appears to cause faster capital accumulation, and faster accumulation appears to result in productivity gains. Mujeri and Sen (2003) identified four distinct periods in Bangladesh’s economic history during the first three post-war decades: post-war reconstruction and recovery (1971-82); slow growth and macroeconomic instability (1983-
89); crisis-driven reforms (1990-93); and stronger economic growth and social development (1994-2000).
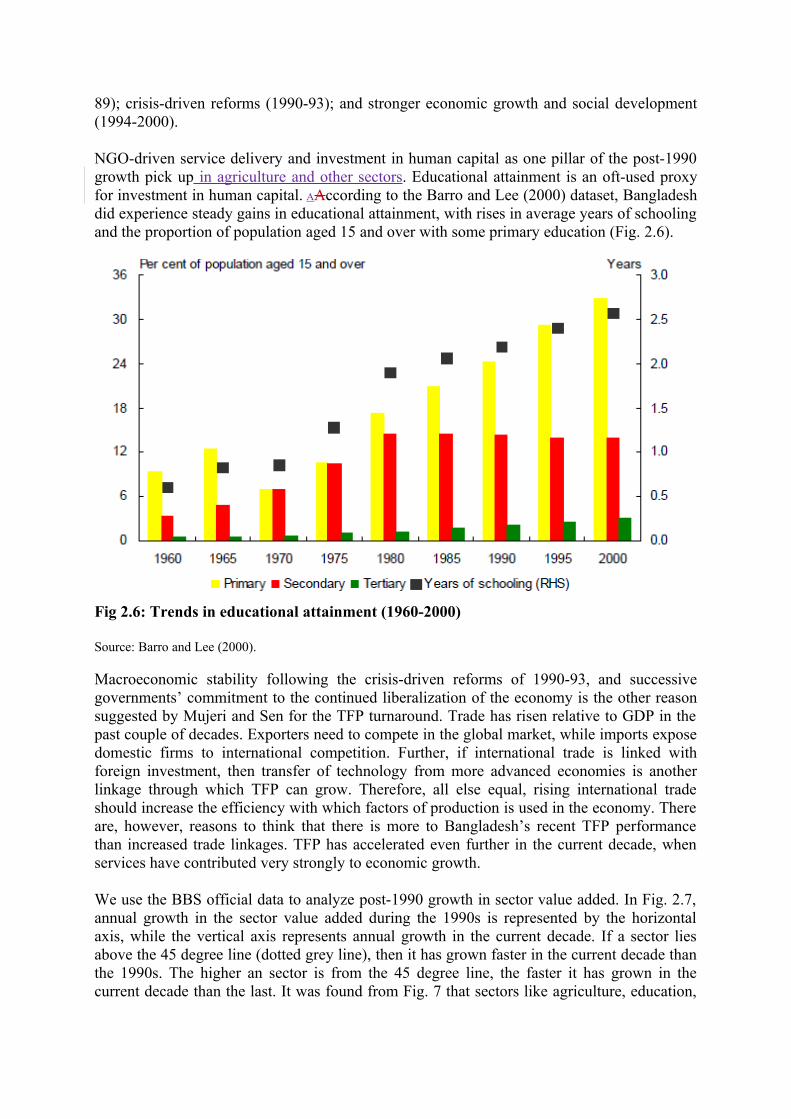
NGO-driven service delivery and investment in human capital as one pillar of the post-1990 growth pick up in agriculture and other sectors. Educational attainment is an oft-used proxy for investment in human capital. AAccording to the Barro and Lee (2000) dataset, Bangladesh did experience steady gains in educational attainment, with rises in average years of schooling and the proportion of population aged 15 and over with some primary education (Fig. 2.6).
Fig 2.6: Trends in educational attainment (1960-2000)
Source: Barro and Lee (2000).
Macroeconomic stability following the crisis-driven reforms of 1990-93, and successive governments’ commitment to the continued liberalization of the economy is the other reason suggested by Mujeri and Sen for the TFP turnaround. Trade has risen relative to GDP in the past couple of decades. Exporters need to compete in the global market, while imports expose domestic firms to international competition. Further, if international trade is linked with foreign investment, then transfer of technology from more advanced economies is another linkage through which TFP can grow. Therefore, all else equal, rising international trade should increase the efficiency with which factors of production is used in the economy. There are, however, reasons to think that there is more to Bangladesh’s recent TFP performance than increased trade linkages. TFP has accelerated even further in the current decade, when services have contributed very strongly to economic growth.
We use the BBS official data to analyze post-1990 growth in sector value added. In Fig. 2.7, annual growth in the sector value added during the 1990s is represented by the horizontal axis, while the vertical axis represents annual growth in the current decade. If a sector lies above the 45 degree line (dotted grey line), then it has grown faster in the current decade than the 1990s. The higher an sector is from the 45 degree line, the faster it has grown in the current decade than the last. It was found from Fig. 7 that sectors like agriculture, education,
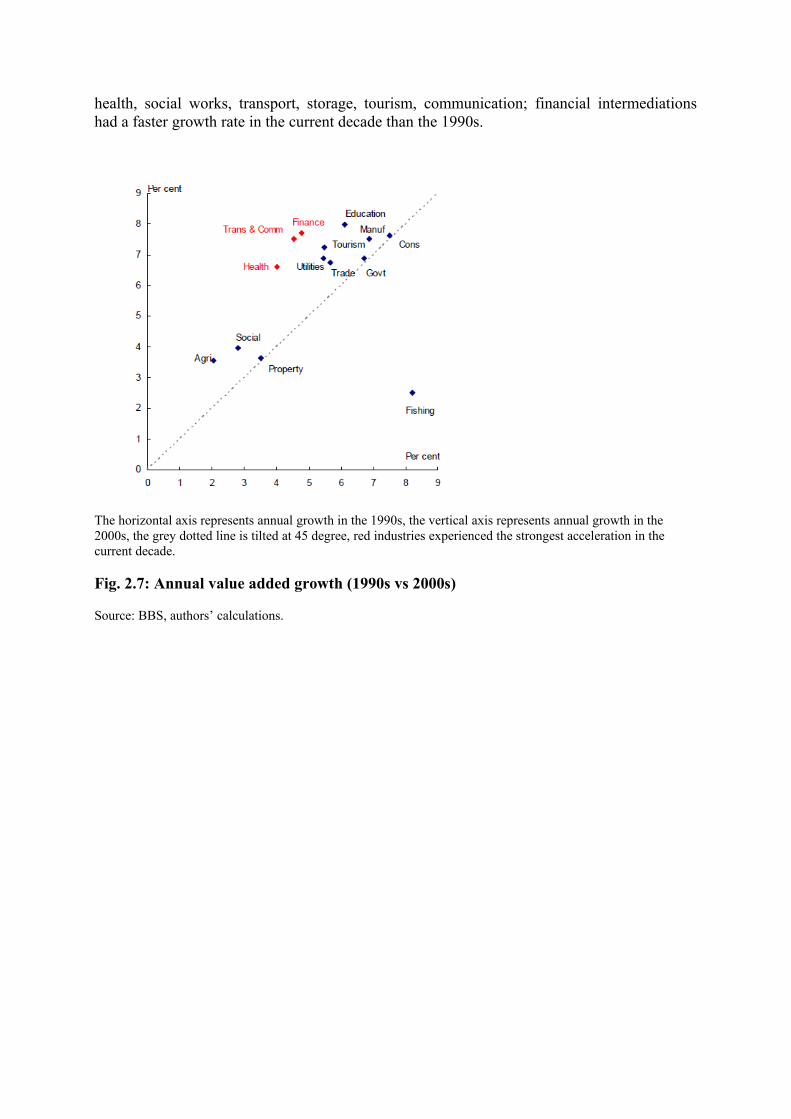
health, social works, transport, storage, tourism, communication; financial intermediations had a faster growth rate in the current decade than the 1990s.
The horizontal axis represents annual growth in the 1990s, the vertical axis represents annual growth in the2000s, the grey dotted line is tilted at 45 degree, red industries experienced the strongest acceleration in thecurrent decade.
Fig. 2.7: Annual value added growth (1990s vs 2000s)
Source: BBS, authors’ calculations.
Chapter 3
Public policies promoting the formation of human capital in the rural sector
Government Policy and Interventions
Education receives the highest allocation of resources in the Bangladeshi social sector. Primary education has been a priority in Bangladeshi politics since independence in 1971: basic measures to implement universal primary education were taken from the outset. The Bangladesh government has a success story in that its education programs dramatically improved in the 1990s, especially during the latter half of the decade. The 90s saw a rekindled dedication for interventions off primary education, and as a consequence the Bangladeshi primary education system experienced significant enhancement during this period. A large part of this renewed commitment was a direct result of the 1990 World Conference on Education for All (WCEFA), which encouraged all participating nations to expand their vision to meet goals in the education sector, especially the goal of making primary education universal. Following this conference, donors in Bangladesh invested in the education sector much more heavily and NGOs increased their involvement in assisting the Bangladeshi government in meeting its primary education goals.
The Government of Bangladesh itself took many initiatives in the years following the WCEFA, including: the 1993 Compulsory Primary Education Act, which made the five-year primary education program free in all government schools and declared education for girls in rural areas free through grade eight; the establishment of the ministry for Primary and Mass Education in 1992, which set as its objective the universalization of primary education as well as the elimination of the gender- and poverty-gaps; demand-side interventions such as the Female Stipend program, the Food for Education (FFE) program; and most recently the Primary Education Development Program (PEDP II), a six-year program beginning in the year 2000 which aims to increase access, quality and efficiency across the board in the primary education sector. These measures have resulted in impressive gains in the achievement of Bangladesh’s primary education goals. Nationwide enrollment rates have sharply increased both in rural and urban areas, dropout rates have gone down, significant progress has been made in raising equality of access between different geographic and socioeconomic groups both in rural and rural areas, and the gender gap has literally been removed at the primary level. Girls have actually overtaken boys in rates of enrollment, completion, and attendance in primary schools (Kabeer et al, 292).
The Government’s Food-for-Work Program and the stipend scheme for girls up to grade 8 are some of the important factors behind the rise in enrollment of girls at the primary level in rural areas. To achieve a 100 percent literacy rate by the year 2005, the Government has also started a massive total literacy movement. Various program and policy measures have been undertaken to increase enrollment and arrest dropout rates, especially for girls. Adult education for rural women has also been
emphasized. There is also provision for increasing teachers’ training of women for both the primary and secondary levels. Non-formal education programs run by Bangladeshi NGOs such as the Bangladesh Rural Advancement Committee have been internationally acclaimed. Some large NGOs run thousands of schools providing education to children in rural areas who are not able to avail of Government-sponsored education. The Government has recognized this contribution of NGOs and there is significant collaboration between them. There is a special emphasis on girls’ education as education and the eradication of illiteracy are considered to be the first steps toward the empowerment of women.
Bangladesh’s achievements in education over the last two decades have been impressive, especially when seen against the backdrop of the performance of other countries in the region. Major successes include (a) rapid expansion of primary education – the gross primary enrolment increased from 72 per cent in 1990 to 91 per cent in 2000 (b) a narrowing of disparity between rural and urban primary enrolment and (c) the closing of the gender gap, including the very poor. Moreover, enrolment in secondary education expanded at an annual rate of 10 per cent during the 1993-99 period. Gender and urban rural parity in Bangladesh are comparable to that in Sri Lanka. Roughly 9 out of every 10 children eventually enroll in primary school, and Bangladesh has achieved levels of primary and secondary gross enrolment similar to those in countries with higher per capita income, such as Vietnam, Thailand and Indonesia (BIDS 2001; GoB 2003; World Bank 2002; World Bank 2003).
What explains this success in accumulating favourable social conditions for pro-poor growth at a relatively low level of income? One important factor of political commitment to social development has been reflected in the policy consistency that cut across the regime types since the Independence. Successive governments emphasized the need for reducing population growth, the importance of investing in primary and girl’s education, the role of primary health care in the forms of child and maternal immunization, and universal coverage of safe drinking water. Perhaps the agony of governing a state in the context of highest population density in the world and least amount of natural resources sustained this commitment to basic population, health and education—a concern widely shared in popular imagination in Bangladesh, igniting actions and adoption behaviour conducive to technological change.
Policy reforms affecting formation of human capital
For analytical purposes, the development of human capital and growth-history of Bangladesh may conveniently be divided into four distinct phases using the policy-based periodization. The first period, covering the period until 1981/82, may be termed as the period of ‘reconstruction and recovery amidst political turbulence’ during which the country achieved the pre-independence level of per capita GNP as well as other macroeconomic ratios relative to GDP, such as gross savings and investment. The subsequent period of the 1980s (until 1988/89) was the period of ‘slow economic growth with growing macroeconomic instability’. The slow growth of the
period, however, became increasingly unsustainable and the ensuing macroeconomic crisis led to the compulsion for undertaking a range of stabilization measures. Although the reform measures in Bangladesh signalled a qualitatively new phase of development. This transitional period, covering 1989/90 to 1992/93, may be considered as the period of ‘crisis-driven economic reforms and formation of favourable initial condition state’ both in terms of improved economic fundamentals and attaining a ‘threshold level’ of human and other forms of capital. With the necessary conditions for graduating into a higher level of economic growth in place, the subsequent period since 1993/94 exhibited much improved performance both in terms of economic growth and the pace of social development. Accordingly, the period may be characterized as the period of ‘higher economic growth and faster social development’. The better performance of the last period may be viewed as the outcome of the interactions between the improved ‘initial condition state’ and the policy and institutional changes during the 1990s toward more market-responsive and democratic policy regimes. The 1990s witnessed a more facilitating macroeconomic environment and achieved higher economic growth.
The period of the 1990s, which may be termed as an era of higher economic growth and faster social development, provides a potentially instructive story of development with a key message: higher human and social development outcomes can be achieved even at relatively low levels of per capita income. Several features of the period are noteworthy: (i) favourable macroeconomic fundamentals; (ii) continued emphasis on the private sector as the engine of economic growth; (iii) liberalization and outward orientation; (iv) emphasis on agriculture and rural development; (v) reduced income poverty and child malnutrition; (vi) impressive success in human development; (vii) strong emphasis on NGOs in social and economic development; (viii) enhanced disaster management capacity; (ix) continued political confrontation and uncertainties; and (x) continued deterioration of governance, especially law and order situation. In short, building on favourable conditions and pursuing more prudent policies, the period achieved higher economic growth accompanied by faster improvement in social indicators.
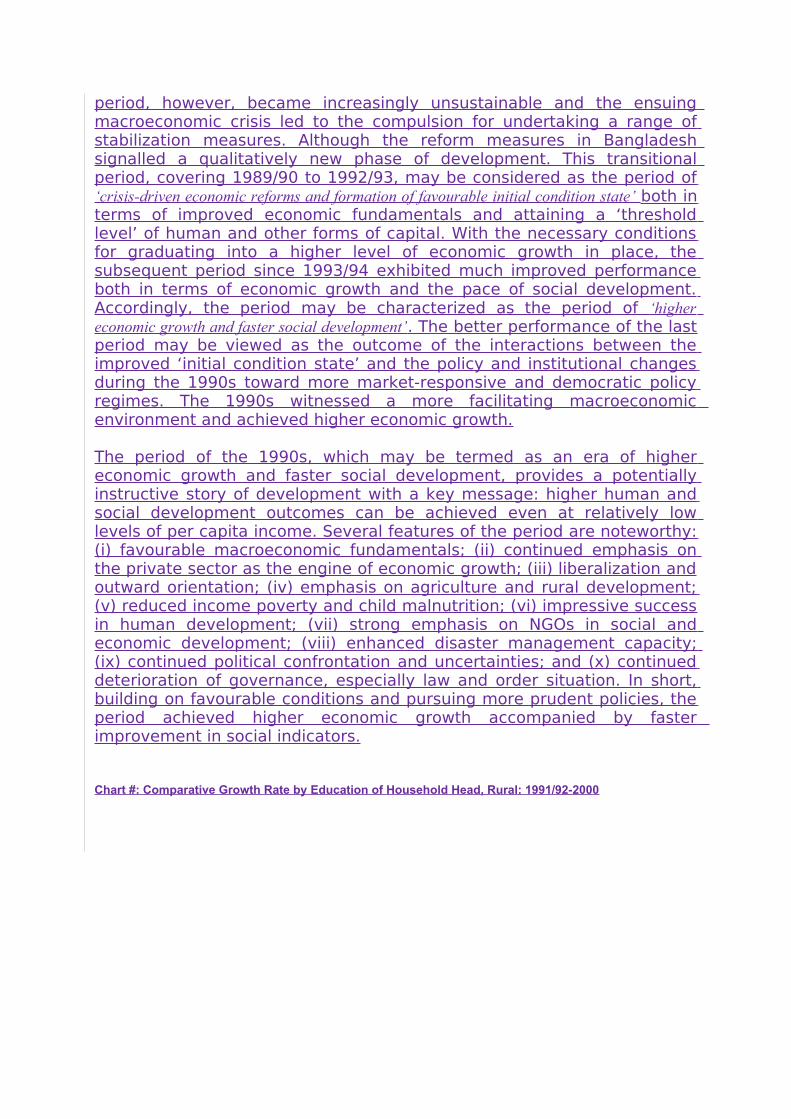
Chart #: Comparative Growth Rate by Education of Household Head, Rural: 1991/92-2000
Implementation of family planning programs through favourable public policy
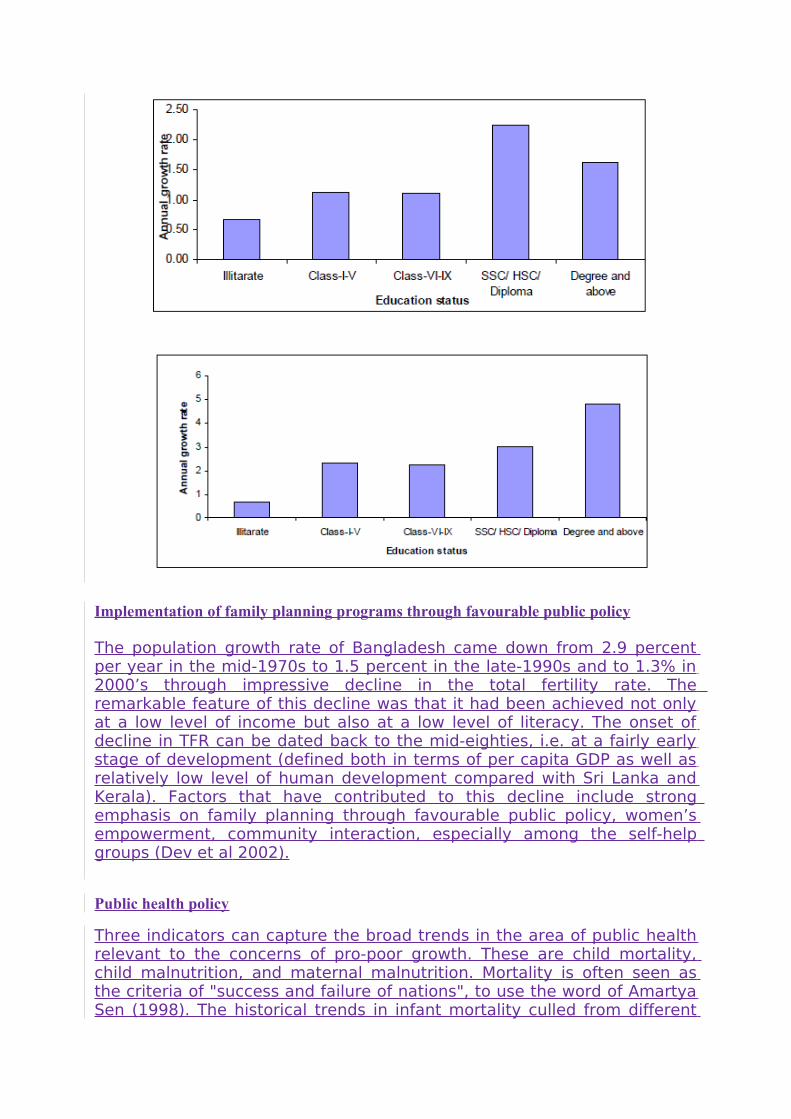
The population growth rate of Bangladesh came down from 2.9 percent per year in the mid-1970s to 1.5 percent in the late-1990s and to 1.3% in 2000’s through impressive decline in the total fertility rate. The remarkable feature of this decline was that it had been achieved not only at a low level of income but also at a low level of literacy. The onset of decline in TFR can be dated back to the mid-eighties, i.e. at a fairly early stage of development (defined both in terms of per capita GDP as well as relatively low level of human development compared with Sri Lanka and Kerala). Factors that have contributed to this decline include strong emphasis on family planning through favourable public policy, women’s empowerment, community interaction, especially among the self-help groups (Dev et al 2002).
Public health policy
Three indicators can capture the broad trends in the area of public health relevant to the concerns of pro-poor growth. These are child mortality, child malnutrition, and maternal malnutrition. Mortality is often seen as the criteria of "success and failure of nations", to use the word of Amartya Sen (1998). The historical trends in infant mortality culled from different
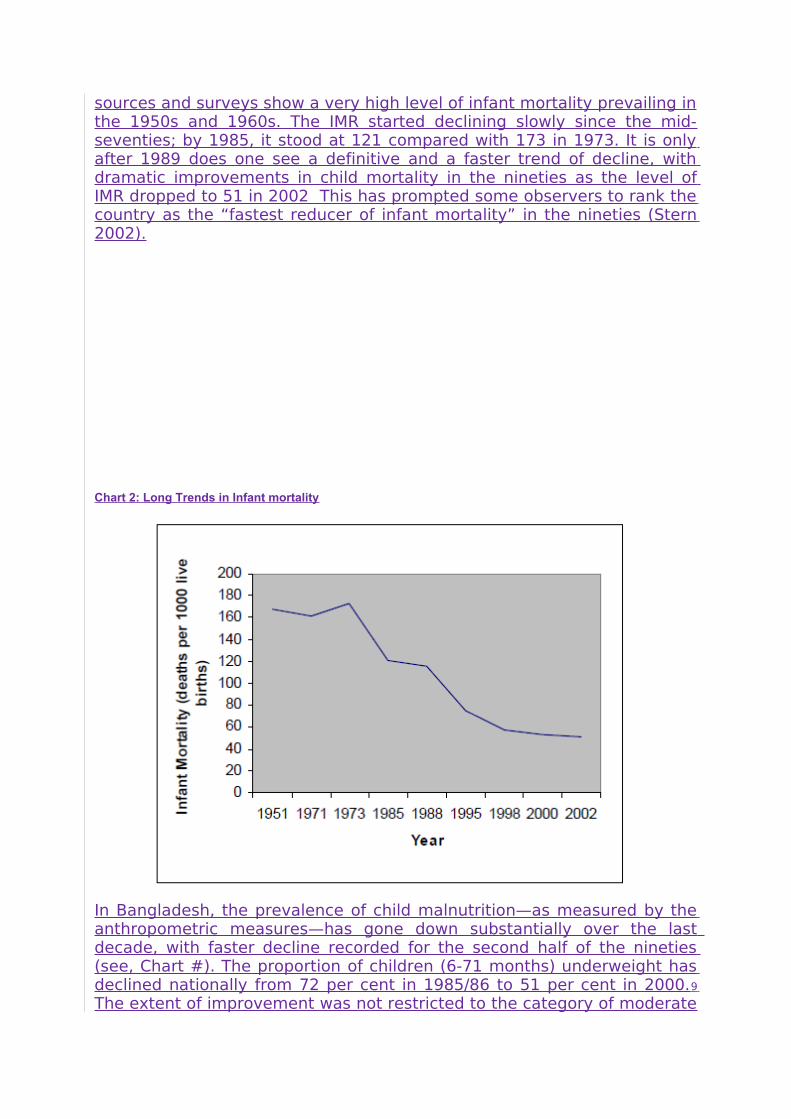
sources and surveys show a very high level of infant mortality prevailing in the 1950s and 1960s. The IMR started declining slowly since the mid-seventies; by 1985, it stood at 121 compared with 173 in 1973. It is only after 1989 does one see a definitive and a faster trend of decline, with dramatic improvements in child mortality in the nineties as the level of IMR dropped to 51 in 2002 This has prompted some observers to rank the country as the “fastest reducer of infant mortality” in the nineties (Stern 2002).
Chart 2: Long Trends in Infant mortality
In Bangladesh, the prevalence of child malnutrition—as measured by the anthropometric measures—has gone down substantially over the last decade, with faster decline recorded for the second half of the nineties (see, Chart #). The proportion of children (6-71 months) underweight has declined nationally from 72 per cent in 1985/86 to 51 per cent in 2000.9
The extent of improvement was not restricted to the category of moderate
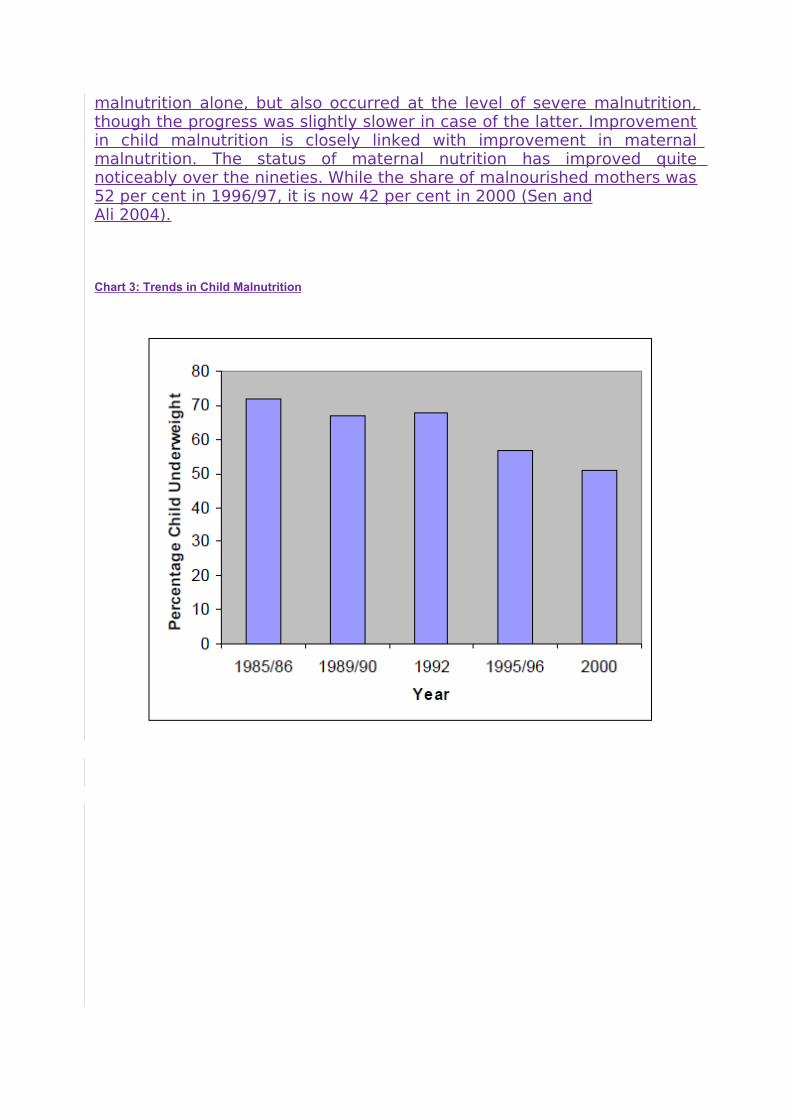
malnutrition alone, but also occurred at the level of severe malnutrition, though the progress was slightly slower in case of the latter. Improvement in child malnutrition is closely linked with improvement in maternal malnutrition. The status of maternal nutrition has improved quite noticeably over the nineties. While the share of malnourished mothers was 52 per cent in 1996/97, it is now 42 per cent in 2000 (Sen andAli 2004).
Chart 3: Trends in Child Malnutrition

Chapter 4
Training programs provided by additional sectors for improving farmers´ abilities and skills
1. KATALYST’s intervention
KATALYST, which started in 2002, is supported by DFID, SDC and SIDA. It is implemented by Swisscontact and GTZ International Services and partners with the Ministry of Commerce. KATALYST is currently promoting more than 25 sectors and markets comprised of services such as accounting, marketing and quality management services; manufacturing sectors such as plastics, furniture, private health care and agro-tools & machineries to agricultural sectors like pond fishery, vegetables, maize and poultry. It also works with business associations to improve the enabling environment for businesses. The project has nationwide activities but has a special focus on areas in and around Dhaka, Faridpur, Rajshahi, Rangpur, Bogra and Jessore.
This section describes KATALYST’s experience with one intervention in the vegetable sector in Rangpur. The project undertakes other activities in the sector – notably in relation to soil testing and packaging. However, KATALYST’s work in stimulating training of agricultural input retailers and the flow of knowledge and information within the distribution system is especially interesting and has wider implications for other development organizations.
The performance of Bangladesh’s important vegetable sector is undermined by very low productivity. Early evidence from this 2-year pilot project in Rangpur suggests that improving knowledge and information services embedded within the supply chain offers one means of addressing this problem. Focusing on training retailers of agricultural inputs, the results from the project - instigated by KATALYST in collaboration with Syngenta, an input supplier - hold the promise of improvements in the competitiveness and poverty reducing benefits of the sector.
The analysis of main sources of information to the poor vegetable farmers
Rangpur, located in the north of Bangladesh, is predominately rural, one of the country’s poorest regions. Within Rangpur, the vegetable sector represents a logical focus for KATALYST for different reasons. First, the vegetable sector is important in terms of size. Vegetables are estimated to contribute 3.68% to the economy nationally and more than this in Rangpur. Out of Rangpur’s 1.6m rural households 60% are estimated to be engaged in vegetable cultivation and a further 50,000 people are estimated to be employed downstream in the industry in trading, distribution and packing. Second, it is growing. A number of factors have combined to generate per annum volume growth of 5-6% in Bangladesh, faster than agriculture as a whole.
For women in particular, vegetables is an important sector. While women are rarely involved in buying inputs (such as seeds and fertilizers), homestead production is undertaken primarily by them and there has been a recent marked increase in female employment in vegetable
cultivation. Anecdotally, women’s wage rates in vegetables are closer to men’s than in other spheres of employment.
A weak productivity performance is a problem for the Rangpur and Bangladesh economies as a whole. Although regional trade in vegetables is currently limited, it is growing. If productivity is not addressed, Bangladesh – as in other sectors – will have to rely on low labour costs to be competitive. More generally, the potential for wider economic growth from efficient food production cannot be realized without productivity growth. But for the poor in particular, low productivity is a barrier to their development. As consumers, it ensures that prices are relatively high; as producers, it prevents them from getting the most from their own resources and as labourers it is likely to mean less opportunity to increase earnings. Other problems, of course, do impinge on the sector. For example, although there appear to be few major regulatory constraints, there is a general absence of formal standards relating to seeds and other inputs. The structure of different value chains linking farmers to the ultimate consumer market limits farmers’ access to appropriate information and concentrates power in key traders and other intermediaries.
The general problem of low productivity is related with low levels of knowledge and information among farmers about good vegetable farming practices. There is broad consensus in the sector that farming practices – especially in this still new activity for many farmers - are deficient with regard to, for example, use of inputs (where dosage rates are commonly incorrect), planting techniques, and recognition and treatment of problems. For KATALYST, therefore, it was vital to address the knowledge and information issue at the heart of the productivity malaise.
Recognition of the importance of knowledge and information in enhancing productivity prompted another question for KATALYST: why wasn’t the wider market system providing a solution to weak knowledge and information? Why were existing knowledge and information services not addressing the wider productivity problem in the vegetable sector? KATALYST’s intervention had to be shaped by answers to these questions – by an understanding of the underlying systemic constraints impinging on the supply and demand for information. It therefore had to understand the existing picture – including which sources of information were commonly being used by farmers, their perceptions of these and the wider experience of development agencies in engaging with farmers. From a combination of consumer research surveys, interviews and document analysis a number of potential sources of information related to productivity were evident (Figure 2).
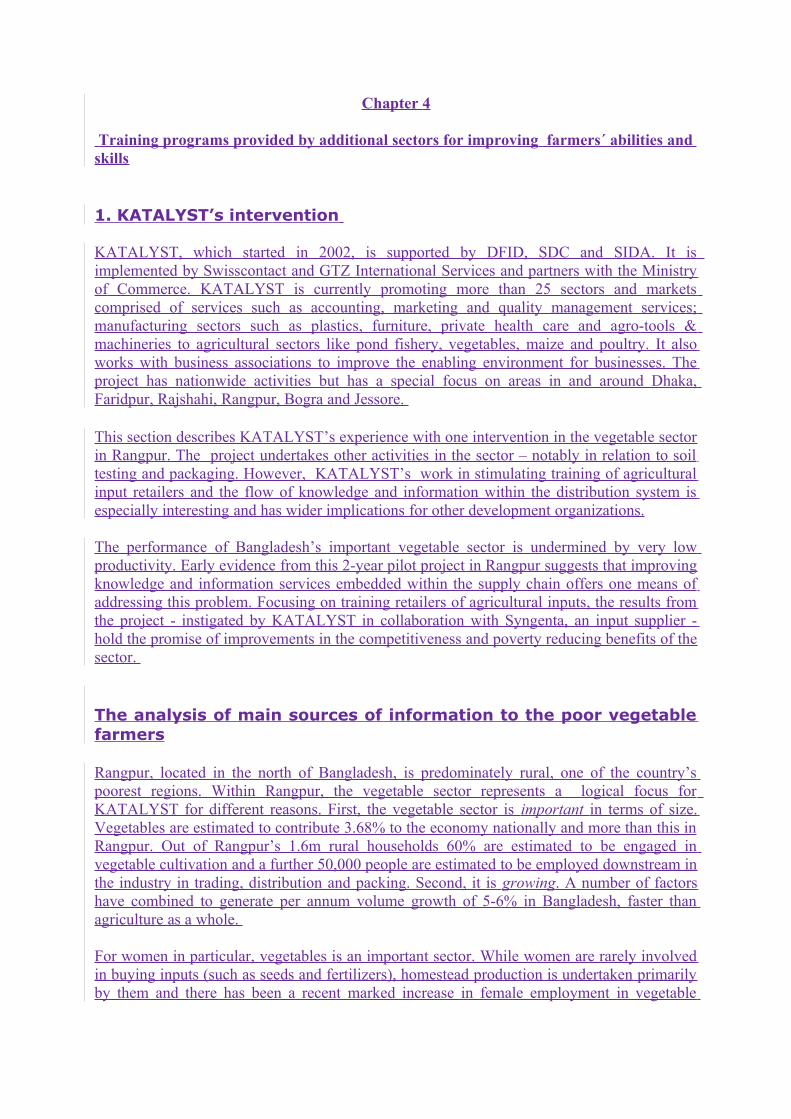
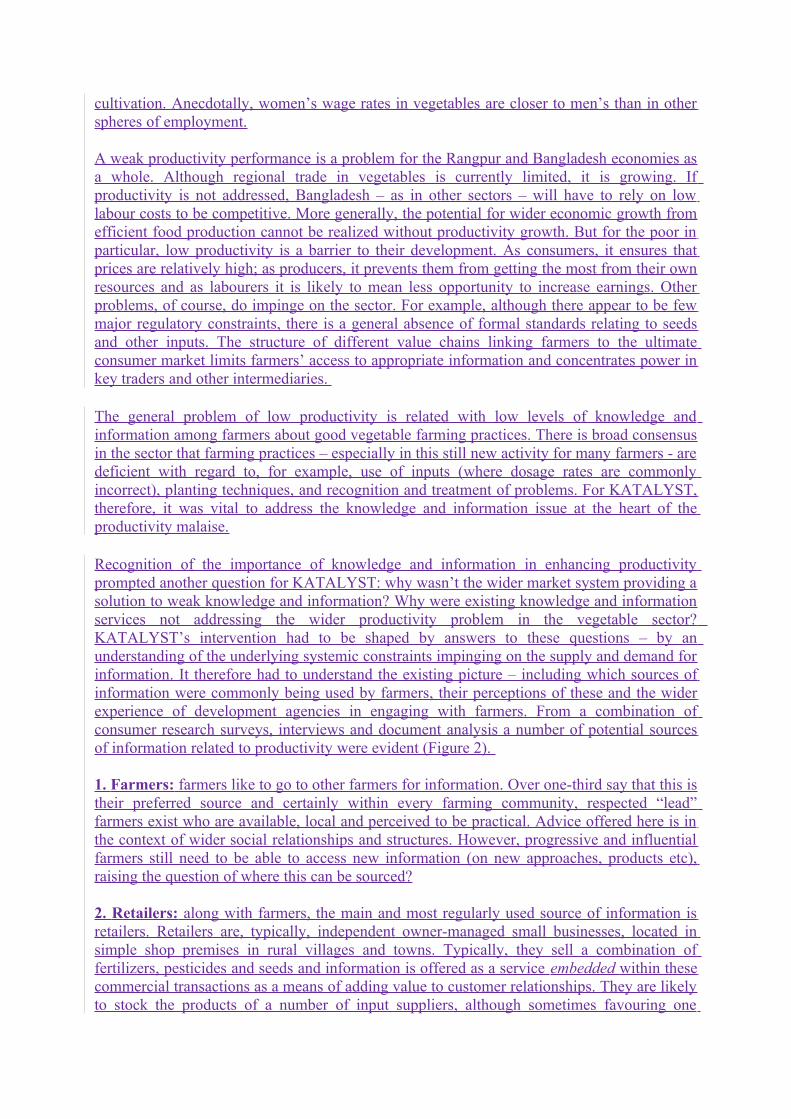
1. Farmers: farmers like to go to other farmers for information. Over one-third say that this is their preferred source and certainly within every farming community, respected “lead” farmers exist who are available, local and perceived to be practical. Advice offered here is in the context of wider social relationships and structures. However, progressive and influential farmers still need to be able to access new information (on new approaches, products etc), raising the question of where this can be sourced?
2. Retailers: along with farmers, the main and most regularly used source of information is retailers. Retailers are, typically, independent owner-managed small businesses, located in simple shop premises in rural villages and towns. Typically, they sell a combination of fertilizers, pesticides and seeds and information is offered as a service embedded within these commercial transactions as a means of adding value to customer relationships. They are likely to stock the products of a number of input suppliers, although sometimes favouring one
supplier over another. Some are sole stockists for one company. Retailers as sources of knowledge and information have a number of characteristics:
They are used widely and regularly. Like farmers, their closeness to and frequent interaction with farmers offers a real opportunity to influence. About 60% of farmers going to a retailer do so in search of a solution to a farming problem rather than to buy a specific product (or brand). They are often reactive in their approach to customers, don’t know how to deal with them positively and lack technical knowledge. More commonly they see themselves as sellers of products rather than providers of solutions
Figure 2: Sources and flows of knowledge and information in the Vegetable market in Rangpur
Figure 3: Main source of advice for farmers
3. Input supply companies: these fall into three main categories – seeds, fertilizers and pesticides suppliers. The seed supply sector is the most disparate with a vast array of informal suppliers, NGOs, a large parastatal and emerging new corporate ventures co-existing. Pesticide suppliers, on the other hand, totalling around 8-10 main players, are relatively large-scale firms, both Bangladeshi and multinational, with the latter predominating. While input suppliers do undertake product demonstrations with farmers directly on an occasional basis, in the main, their route to their final consumer is through retailers.
4. Government extension officers: the role of the Department of Agricultural Extension (DAE) is to advise farmers directly and to organise fairs to bring different actors together. In Rangpur there are believed to be around 200-300 block supervisors (ie officers with responsibility for a particular “block” of land). Although most farmers are aware of the government extension service and respect block supervisors’ technical knowledge, few are regular users of their services. The main beneficiaries tend to be larger farmers.
5. NGOs: like many parts of Bangladesh, there is an extensive NGO presence in rural Rangpur. They work with groups of low income “beneficiaries/clients” and provide a range of advisory and more tangible (seeds) support. Their coverage is limited and they depend upon further external funding for their continuance.
6. Media: beyond these sources, farmers may also gather relevant information from the wider media. However, newspapers are not widely read and while there are relevant advertisements contained within them there are few user-friendly articles on vegetable production. Similarly, radio and television coverage is poor and their content of limited relevance. Within the above picture of the different providers of information, four main characteristics stood out:
(a) Farmers are often unsure of what information they can expect from whom but are certainly largely unhappy with what they are receiving! The relatively high rates of return available from vegetables in the last few years appear to have allowed farmers to “sit back” and wait for the market to deliver high prices rather than pursue greater efficiency. However, when vegetable prices begin to stabilize there will be more incentive to improve practices and therefore greater demand for information.(b) While farmers advising other farmers is a practical form of information provision, for this information to be new and relevant it needs to be up-dated and this requires access to other sources, external to farmers. (c) Existing public providers of information in government are regarded widely as irrelevant. Increasingly, their structures and operations are seen to be dysfunctional and, more simply, they are usually not there!(d) Private sector retailers, even though they interact with farmers regularly and farmers would like useful information from them, generally do not provide an appropriate service. In general, both retailers and input suppliers undervalue the importance of information within commercial relationships. From the above analysis, the most practical immediate focus to bring about significant impact lay with a KATALYST intervention to develop private sector capacities.
The intervention design and implementation
The underlying reasons for the weak level of information provision in the vegetable sector left KATALYST with a clear direction for intervention. The strategic challenge - given the players involved – was to build the capacity of the private sector to strengthen existing relationships and offer relevant knowledge and information services. The analysis provided the context for a future vision of farmers (consumers) demanding good quality information and providers offering this (on a sustainable basis) because it was in their commercial interests to do so.
In undertaking the project, KATALYST followed its market development approach to business services characterized by:
• Identification of the underlying cause: low levels of knowledge and information in the market (a key cause of poor productivity) can be attributed to weak private sector capacities. • A clear strategic focus of KATALYST was developing the capacities of retailers – with whom farmers interact regularly - and input suppliers (retailers’ main source of information) within the market system was therefore the main project goal.• Operational flexibility: within these strategic boundaries, engaging with appropriate players in an entrepreneurial manner that builds ownership with them. Indeed, the idea of retailer training emerged from such discussions. • Scaling up with other players: in order to promote change throughout the market system, encouraging other input providers to invest in knowledge and information. Around 480 retailers, 20% of all Rangpur retailers and serving approximately 350,000 farmers, were trained over the 2-year period. Taking account of both direct financial costs and staff time, overall cost per (retailer) trainee was $90- 100, with the effective Syngenta: KATALYST share of costs estimated around 60:40. Early results from the project show positive impacts on each of the market players:• Farmers’ perception of their experience with retailers’ service has improved.• Retailers have greater self-confidence, place more emphasis on advice and information, have better customer relations and, in most cases, increased sales.• Syngenta’s sales have grown 3-4 times faster than in other regions. The strategic importance of knowledge and information in the supply-chain has been re-emphasized. Syngenta plan to invest in retailer training throughout the country.
Other input suppliers, who have often lost out competitively in the short-term, are now showing positive signs of interest in retailer training. This is the critical issue – “crowding in” - in determining wider market change. The case highlights the importance of knowledge and information in improving agriculture performance - and the opportunity presented by this – and poses challenges for agencies in how to intervene effectively to stimulate more effectiveand large-scale market development.
Useful, capacity-building knowledge and information can be offered in supply chains as an integral element of companies’ operations within a market context and can be a successful strategy. The notion that information should be seen, somewhat preciously, as a “public good” that must be delivered by public agencies is incorrect – and such agencies can therefore be released to play other (still important) roles in markets.
It is possible to engage successfully with large private sector companies provided that this is done within a clear strategic framework, there is recognition of the (legitimate) differences between public and private aims and agencies intervene in a flexible and entrepreneurial manner.
2. Farmers’ Field School approach of DANIDA
The Objectives of Agriculture Sector Programme Suport II (ASPSII) of DANIDA aree:
• To support d ecentralised approach by delegating planning, decision-making and implementation to local authorities, NGO’s and Community Based Organisations (CBO).
• Develop the negotiating capacity of CBOs to formulate and demand an adequate agricultural extension service from the public and private sector.
The components of ASPSII are:
i) Agricultural Extension Component (AEC):The target groups are groups of small and marginal farmers, and women, cultivating 0.5 – 2.5 acres of land with a focus on crop-based agricultural development, and with scope for integrating livestock and aquaculture production. Activities are concentrated in the poor districts in the north and northwest. Field activities will build on the positive experiences gained during ASPS I with respect to the Farmer Field Schools concept, the development of farmer groups and the use of Farmer Trainers. There will also be an increased use of mass media and information communication technology for the dissemination of extension messages and market information. The overall approach is integrated crop management covering the crops sub-sector, but with operational links established at field level to the livestock and aquaculture/fisheries sub-sectors.
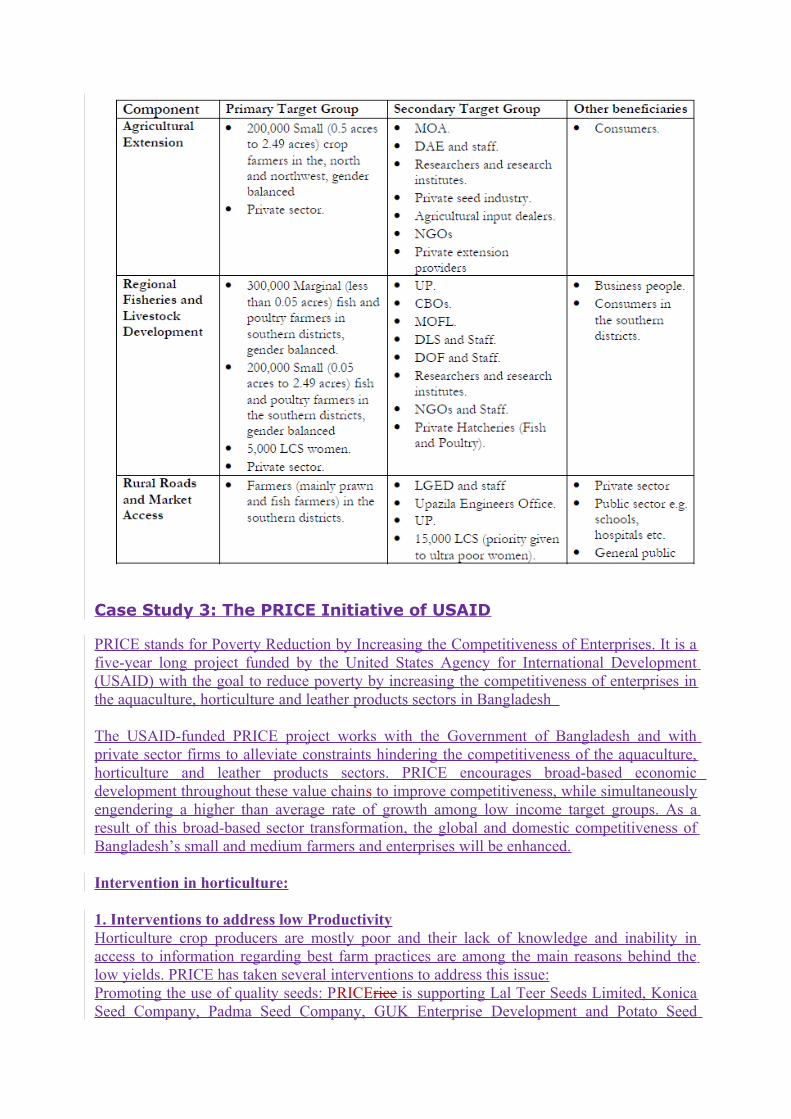
ii) Regional Fisheries and Livestock Development Component (RFLDC):The target groups are small and marginal farmers and the functionally landless, with focus on specific groups such as women-headed households, women poultry rearers, inshore fishers, Labour Contracting Society members, settlers on new char land, and women fish driers. The component built on the successful methodologies of the ASPS I aquaculture and livestock activities in the Noakhali and Patuakhali/Barguna areas. Uses made of the participatory learning approach of field schools adapted to integrated homestead production activities in aquaculture and livestock with a variety of technical options. NGOs assisted in capacity building of Union Parishads (UPs) and Community Based Organisations (CBOs), and facilitate micro-credit. UPs be supported to be responsive, accountable and transparent in providing services to the target group. Block grants, with performance based criteria made available to UPs for their support to CBOs. The private sector supported to provide inputs and markets, such as in food processing. Market linkages have been promoted in cooperation with the Rural Roads and Market Access Component The information on target groups and beneficiaries are presented in the Table #.
Table # The information on primary target groups and beneficiaries under farmers’ field school of ASPSII of DANIDA.
Case Study 3: The PRICE Initiative of USAID
PRICE stands for Poverty Reduction by Increasing the Competitiveness of Enterprises. It is a five-year long project funded by the United States Agency for International Development (USAID) with the goal to reduce poverty by increasing the competitiveness of enterprises in the aquaculture, horticulture and leather products sectors in Bangladesh
The USAID-funded PRICE project works with the Government of Bangladesh and with private sector firms to alleviate constraints hindering the competitiveness of the aquaculture, horticulture and leather products sectors. PRICE encourages broad-based economic development throughout these value chains to improve competitiveness, while simultaneously engendering a higher than average rate of growth among low income target groups. As a result of this broad-based sector transformation, the global and domestic competitiveness of Bangladesh’s small and medium farmers and enterprises will be enhanced.
Intervention in horticulture:
1. Interventions to address low ProductivityHorticulture crop producers are mostly poor and their lack of knowledge and inability in access to information regarding best farm practices are among the main reasons behind the low yields. PRICE has taken several interventions to address this issue:Promoting the use of quality seeds: PRICErice is supporting Lal Teer Seeds Limited, Konica Seed Company, Padma Seed Company, GUK Enterprise Development and Potato Seed
Farmers Association to train seed dealers, agents and seed producing farmers on seed technology and the benefits of using high quality seeds of vegetables and potato. Field supervision , as well as technical support at different stages of production and post production was also provided to the seed farmers to ensure seed quality. PRICE partner enterprises also organized demonstration plots and field days to showcase the performance of good seeds and disseminate technical knowhow. Training, demonstrations, field days and meetings on seed technology is extremely useful for improvement of seed quality at the farm level which will eventually contribute to increase productivity. At the same time through these efforts, seed dealers and agents are able to explain to vegetable growing farmers how the use of quality seeds can increase their crop production. Through these training sessions, approximately 1000 seed farmers were exposed to seed production technology and 1,252 dealers and retailers became knowledgeable and are now able to promote the use of quality seeds to an estimated 60,000 farmers. Training on modern farming techniques: PRICE in conjunction with farmers’ associations such as the Murail Rural Development Multipurpose Co-operative Society Ltd, Kansat Mango Farmer Multipurpose Co-operative Society Limited (KMFMCSL), Bhaterchar Krishak Unnyan Bahumukhi Samabai Samity and also with small farmers groups organized by Agricultural Advisory Services and Environment Friendly Agriculture Development Foundation Agro-business is training smallholder farmers on modern farming techniques, specially focusing on proper planting, use of hybrid seeds and high quality planting material, judicial application of balanced fertilizer and compost, water and pest management and following proper harvesting index through which farmers are being benefitted in increasing productivity of potato, egg plant, other high value vegetables and mango substantially.
2. Interventions to address high post harvest lossesPoor post harvest handling, including poor packaging, absence of efficient cool chain management systems, lack of quality control and inadequate transport, leads to large losses within the sector. Post-harvest losses in the horticulture sector are estimated at 25 to 40 percent, depending on the crop. PRICE has taken initiatives to tackle this issue and help farmers increase their incomes by reducing post harvest losses. Working with partner organizations such as ANKUR, Kansat Mango Farmer Multipurpose Co-operative Society Limited (KMFMCSL), Golden Harvest Agro Industries Limited, EFADAF Agro- Business, Bhaterchar Krishak Unnyan Bahumukhi Samabai Samity, and Agricultural Advisory Society (AAS), PRICE is providing hands- on training and demonstrations to the farmers and wholesale agents on proper post harvest handling techniques. PRICE supported 240 farmers of Kansat Mango Farmers’ Multipurpose Cooperative Society Limited (KMFMCSL) on production and post production techniques, which led to minimizing fruit dropping and improving yields. PRICE also facilitated hands-on training for the farmers and association members on simple post harvest technologies like sorting, grading, cleaning, washing, drying, packing and transporting, which was not their usual practice. The outcome was visible as the association received around 20-40 percent per kg higher prices for their mangoes on average. Moreover, recently PRICE helped to organize 8 market outlets in Dhaka for the Kansat Mango Farmers Association of Chapainawabganj, who was extended technical support in post harvest handling to sell chemical free, properly cleaned and graded mangoes. PRICE also facilitated ANKUR - located at Chuadanga - to train 60 farmers in post harvest handling who later opened two sales outlets for their mango farmers, in Chudanga and Jibonnagar. Another PRICE initiative was the first soil testing for mango farmers in Bangladesh. This testing provided the nutrient status of the soil for farmers to apply individualized fertilizers based on the needs of the orchard.
3. Intervention to address inadequate compliancePoor compliance with food safety and quality standards is a huge roadblock to the development of the sector. PRICE is working with its partners to implement initiatives to address these issues. Promoting safe vegetable production: In 2008 the NGO Pathikrit disbursed loans of approximately BDT 375,000 to its members in Khulna to increase vegetable production. In addition to the lack of technical knowledge, information and quality inputs, Pathikrit found that the excessive use of chemical fertilizers and pesticides was creating a potential health hazard to consumers, while also increasing farmers’ costs of farming. In order to address this problem Pathikrit created a separate organization, “Organix”, specifically chartered to help farmers produce and market safe vegetables free from excessive chemicals. Organix signed an MOU with PRICE in September 2009 in order to develop a contract farming model for safe vegetable production, following the basic concepts of Good Agricultural Practices (GAP). PRICE is working with Organix and other partners to develop and provide training to farmers on safe crop protection and integrated pest management (IPM). PRICE is reaching to more than 2000 horticultural farmers by working with Muktir Alo and EFADF Agro Business, Agricultural Advisory Society and Grammen Krishok Unyon Sangstha Enterprise to train farmers and create awareness on following good agricultural practices, adoption of more environment friendly crop husbandry by using compost, clean cultivation approach, use of biological pesticides and bio control agents instead of harmful chemicals. PRICE has been supporting Grammen Krishok Unyon Sangstha Enterprise (GKSSE) of Bogra and Riya Fertilizer of Sirajganj in the promotion of organic fertilizer through training, meeting, organizing field days and strengthening market linkages.
4. Poor Market LinkagesPRICE has helped link the GUK Enterprise Development and Vater Char Farmers’ Development Cooperative Society, in Norsingdi, with Golden Harvest Agro Industries Limited. PRICE has also supported Golden Harvest Agro Industries Limited to attend Gulfood Fair in February 2010, one of the largest food fair of the region, creating opportunity for the company to get access to new market in the Gulf and beyond. Promoting contract farming. Contract farming is a powerful tool to convert the weak and fragmented supply chain into a strong integrated value chain. PRICE is supporting a number of contract farming initiatives in the horticulture sector with the aim to enhance farmers’ access to quality farming inputs, knowledge and information required to practice improved farming techniques, better access to value chain financing, and guaranteed market for their produce. Working alongside partners such as Organix, GUK Enterprise Development, Ankur, Muktir Alo, PRIDE, PRICE is facilitating trainings for small hold farmers to implement good farming practices in order to meet the quality and quantity needs of their large contract farming partners. In Bogra, 1500 potato and high value crop farmers and in Khulna 650 egg plant and other safe vegetable producers and in Chudanga 500 mango farmers were introduced into the contract farming system and are receiving training to learn good farm practices.
Interventions in aquaculture sector
Shrimp Compliance issues: Shrimp and prawn are high-value export commodities that mostly go to Europe and the USA, and have stringent quality specifications as food items. Standard hygiene and food safety is a prime issue for the shrimp subsector. The other important issue for export market access is compliance with local labor laws. Labor Practices. The perception of improper labor practices in Bangladeshi processing plants is a key issue for exporting
shrimp and prawn to the U.S.A. To address the situation PRICE implemented an initiative to audit and validate the compliance initially of 10 processing plants with all aspects of Bangladeshi labor law. After this review and improvement of labor-related procedures, PRICE developed and implemented labor standards compliance courses for workers, managers and owners of shrimp processing plants.
Food Safety and Quality Compliance. The presence of antibiotic residues is one of the main issues hindering the export of shrimps to Europe and the U.S.A. PRICE assisted the Ministry of Fisheries with its Department of Fisheries Inspection and Quality Control (FIQC) Labs, so that consignments can be tested and screened accurately before export. PRICE arranged five training programs for 100 FIQC trainees in compliance with EU food safety requirements. Additionally, PRICE and BFRI completed a year long experiment and found that supplemental feed causes accumulation of nitrofuran metabolites in farmed prawn and the metabolites may be removed from contaminated prawn by withdrawing the contaminated feed for a couple of weeks while under rearing.
Low productivity: Productivity of shrimp farms in Bangladesh is very low. To address the issue PRICE teamed with World Fish Center (WFC) to launch the Greater Harvest and Economic Return from Shrimp (GHERS) initiative. The key objective of this program is to increase the productivity of shrimp farming through strengthening its value chain while following a contract farming scheme. GHERS works with depots to transmit information, knowledge and skills, as well as quality inputs like screened seeds to farmers to facilitate the production of disease-free shrimps. GHERS will work with 23,000 farmers by the end of 2011.
Inadequate farmers’ access to markets: The quantity produced by any individual smallholder farm is quite small and lacks economies of scale, resulting in increased transaction costs and reduced competitive advantages. PRICE assists groups of farmers to organize synchronized harvesting and bulk supply of shrimp to depots. The scale enhances their bargaining strength, price and profitability.
FishThe average production of fish per hectare in pond-based aquaculture was 2.66 metric tons (MT) in 2007-8, which – according to the Department of Fisheries - has the potential to increase to 7 or 8 MT. PRICE has identified key constraints to the development of the finfish sector and is working with farmers, processors and government in order to overcome those, in the following areas:
Improving farm productivity: Working with 25 farmers associations, seven NGO-based farmers groups and two community-based organizations, PRICE will assist more than 30,000 farmers – almost 35 percent of them female – to understand and apply best practices in farm methods and management by the end of 2011. On a cost-share basis PRICE is providing technical assistance and training on improved farming, feed, water & health management, and access to better inputs. PRICE has helped establish demonstration ponds and is encouraging information sharing to build the capacity of association members.
Improving fish farming inputs: PRICE is in partnership with nine hatcheries, two feed mills, one fish seed traders association, and one input seller to ensure quality grade inputs to farmers. In the process hatcheries are getting training and linkages to better quality brood sources to produce quality grade and inbreed-free fish seeds; fish seed traders linking with
farmers to supply quality seeds and carry the fish seeds in a responsible way to reduce mortality and increase yield, feed millers supply quality grade feeds and input sellers supply allowed growth promoters, vitamins, minerals and micronutrients to enhance production.
Hygienic dry fish production and marketing: Dry fish production is an age-old method of fish preservation in Bangladesh. Dry fish is consumed locally as well as exported abroad to cater the demand of the ethnic market. Fish are sundried in the country and often done under unhygienic conditions and traded poorly or without packaging. PRICE has partnered with one dry fish association in Cox’s Bazar and is negotiating with another to train roughly 500 entrepreneurs and 2,500 workers by the end of 2011 to produce hygienic dry fish and marketing those with better packaging.
Improving access to markets: PRICE facilitates trainings on group procurement of inputs and group marketing for better access to markets so that organized farming groups can procure inputs cost-effectively and sell their produce collectively with better prices.
Generating access to finance: Low transaction cost, easy access and reasonable cost of capital are necessary to enhance investment, and thereby productivity and competitiveness. As institutional credits are difficult to access in the fish sector, PRICE initially assisted farmers in getting micro credits from NGOs and so far, 1,327 received microfinance ranging between BDT 3,000 to BDT 120,000.
Chapter 5
Rural organizations and membership aimed at strengthening the innovation system for the rural sector
This section presents case study about rural farmers organizations that aimed at improving farmers capacity, productivity and strengthening the innovation system for the rural sector.
Smallholder Milk Producers Organizations
Smallholder milk producers play a key role in dairy markets in Bangladesh. They supply all the domestic milk for the informal or traditional market and three quarters for the formal or processed market. A more detailed description of the characteristics of smallholder milk producers is given in annex I. Milk Vita and Grameen/CLDDP institutionally practice capacity development and empowerment of smallholder dairy farmers, both men and women, in the value chain and business ownership and management process.
The Milk Vita co-operative dairying model was adapted from the world-renowned Anand pattern model in India. From a modest start in the mid-1970s that involved providing 4,300 very poor, often landless, households in remote rural areas with a complete package of milk production enhancing technologies, village level organizational skills and a milk collection-processing-marketing system, the two-tier Milk Vita dairy cooperative model has grown into a successful commercial dairy enterprise. Today, milk is collected from over 100,000 smallholder members organised into 1,200 primary village co-operatives, then processed and distributed to all the major cities in the country. In 2006, smallholder milk producers sold 75 million litres of milk surplus to their household requirements. They also earned patronage dividends from Milk Vita’s profits. The resultant increase in milking cow numbers and savings generated also serves as a cushion against the devastating effects of severe flooding that regularly afflict the country.
The Milk Vita model creates many jobs, reduces collection and distribution costs and has improved milk quality by cutting delivery times, especially in congested city areas. One off-farm job has been created for each 35 litres of milk collected, processed and marketed. More than half the jobs are in rural areas. Democratically elected milk producer and distributor co-operative members are now in the majority on the Milk Vita Board of Directors. This encouraged the Government to withdraw from day-to-day management enabling the Board to hire professional managers, which led to improved performance and created a platform for further expansion to bring more poor people in to the dairy value chain. Since the late 1990s Milk Vita has invested more than USD10 million in expanding its milk collection, processing and marketing network and now delivers safe and affordable milk and dairy products to some five million low-income urban dwellers.
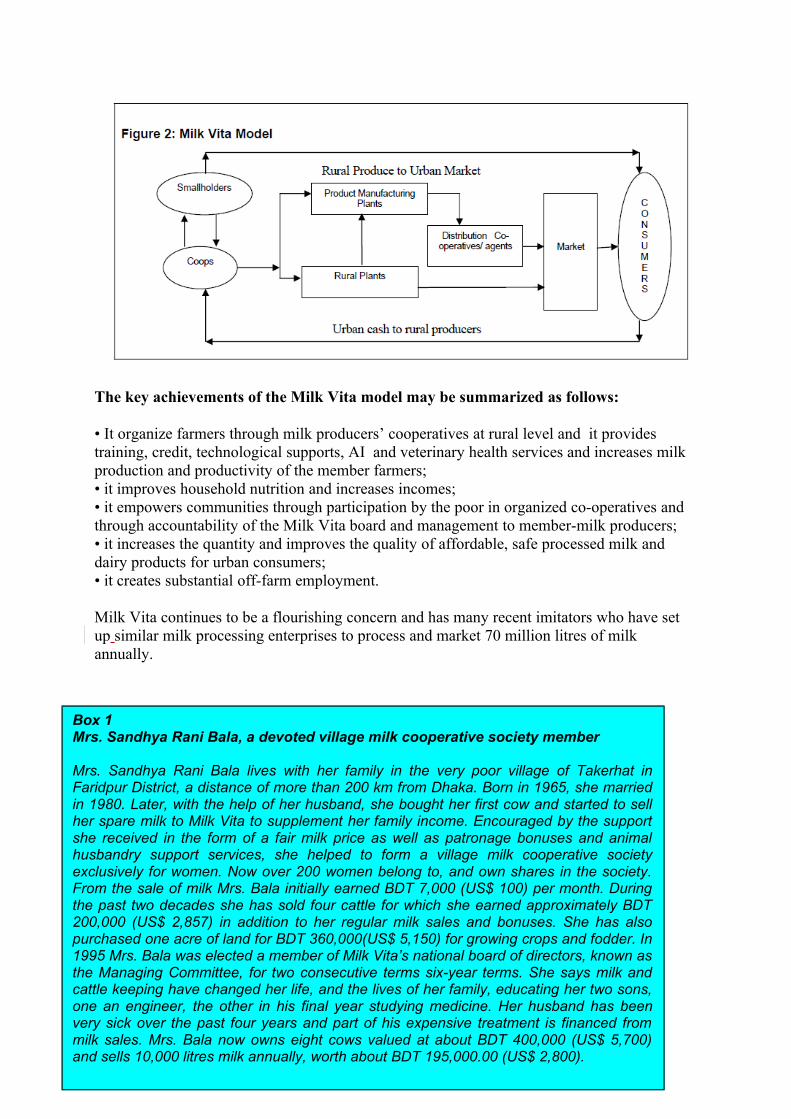
The key achievements of the Milk Vita model may be summarized as follows:
• It organize farmers through milk producers’ cooperatives at rural level and it provides training, credit, technological supports, AI and veterinary health services and increases milk production and productivity of the member farmers;• it improves household nutrition and increases incomes;• it empowers communities through participation by the poor in organized co-operatives and through accountability of the Milk Vita board and management to member-milk producers;• it increases the quantity and improves the quality of affordable, safe processed milk anddairy products for urban consumers;• it creates substantial off-farm employment.
Milk Vita continues to be a flourishing concern and has many recent imitators who have set up similar milk processing enterprises to process and market 70 million litres of milk annually.
Box 1Mrs. Sandhya Rani Bala, a devoted village milk cooperative society member
Mrs. Sandhya Rani Bala lives with her family in the very poor village of Takerhat in Faridpur District, a distance of more than 200 km from Dhaka. Born in 1965, she married in 1980. Later, with the help of her husband, she bought her first cow and started to sell her spare milk to Milk Vita to supplement her family income. Encouraged by the support she received in the form of a fair milk price as well as patronage bonuses and animal husbandry support services, she helped to form a village milk cooperative society exclusively for women. Now over 200 women belong to, and own shares in the society. From the sale of milk Mrs. Bala initially earned BDT 7,000 (US$ 100) per month. During the past two decades she has sold four cattle for which she earned approximately BDT 200,000 (US$ 2,857) in addition to her regular milk sales and bonuses. She has also purchased one acre of land for BDT 360,000(US$ 5,150) for growing crops and fodder. In 1995 Mrs. Bala was elected a member of Milk Vita’s national board of directors, known as the Managing Committee, for two consecutive terms six-year terms. She says milk and cattle keeping have changed her life, and the lives of her family, educating her two sons, one an engineer, the other in his final year studying medicine. Her husband has been very sick over the past four years and part of his expensive treatment is financed from milk sales. Mrs. Bala now owns eight cows valued at about BDT 400,000 (US$ 5,700) and sells 10,000 litres milk annually, worth about BDT 195,000.00 (US$ 2,800).
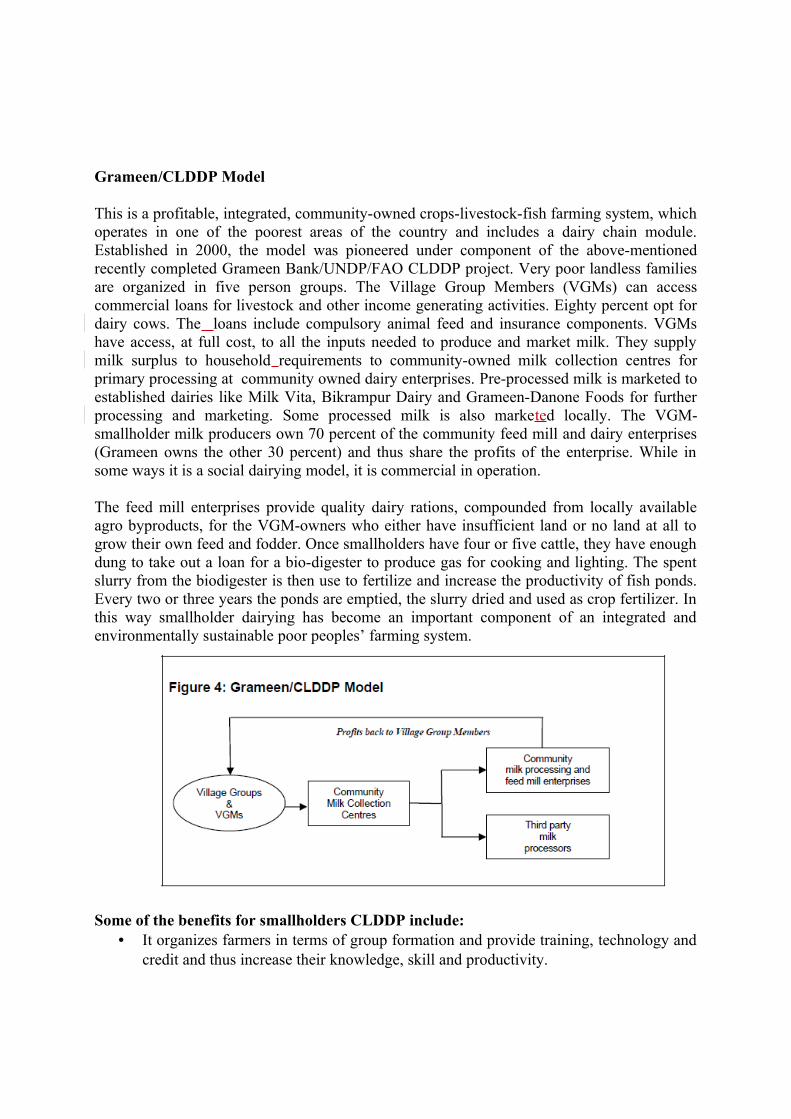
Grameen/CLDDP Model
This is a profitable, integrated, community-owned crops-livestock-fish farming system, which operates in one of the poorest areas of the country and includes a dairy chain module. Established in 2000, the model was pioneered under component of the above-mentioned recently completed Grameen Bank/UNDP/FAO CLDDP project. Very poor landless families are organized in five person groups. The Village Group Members (VGMs) can access commercial loans for livestock and other income generating activities. Eighty percent opt for dairy cows. The loans include compulsory animal feed and insurance components. VGMs have access, at full cost, to all the inputs needed to produce and market milk. They supply milk surplus to household requirements to community-owned milk collection centres for primary processing at community owned dairy enterprises. Pre-processed milk is marketed to established dairies like Milk Vita, Bikrampur Dairy and Grameen-Danone Foods for further processing and marketing. Some processed milk is also marketed locally. The VGM-smallholder milk producers own 70 percent of the community feed mill and dairy enterprises (Grameen owns the other 30 percent) and thus share the profits of the enterprise. While in some ways it is a social dairying model, it is commercial in operation.
The feed mill enterprises provide quality dairy rations, compounded from locally available agro byproducts, for the VGM-owners who either have insufficient land or no land at all to grow their own feed and fodder. Once smallholders have four or five cattle, they have enough dung to take out a loan for a bio-digester to produce gas for cooking and lighting. The spent slurry from the biodigester is then use to fertilize and increase the productivity of fish ponds. Every two or three years the ponds are emptied, the slurry dried and used as crop fertilizer. In this way smallholder dairying has become an important component of an integrated and environmentally sustainable poor peoples’ farming system.
Some of the benefits for smallholders CLDDP include:• It organizes farmers in terms of group formation and provide training, technology and
credit and thus increase their knowledge, skill and productivity.
• Household nutrition: e.g. pre-project no households consumed milk, now all 6,000 households with cows consume up to one litre daily.
• Household earnings: e.g. average daily earnings from fish and milk increased from 19 to 125 US cents, enabling purchase of other essential foods, schooling etc.
Household accumulation of physical assets: up 145 percent and included tube wells for safe water, bio-digesters for clean cooking and lighting, sanitary latrines etc. So far these benefits have resulted in the graduation of over 3,000 smallholder households out of poverty and the model is being scaled up across the country. For example:
• The new Grameen-Danone Foods Bogra Dairy started up in 2007 and produces low cost bio-yoghurts for the poor.
• In five very poor districts in the north-west 10,000 smallholder families will be covered under a BGD 10 crore (USD 15 million) programme up to 2010 funded and managed by NGO PKSF (Palli Karma-Sahayak Foundation).
Box 2 Mrs. Laily Begum: a member of CLDDP
The life of a struggling women of CLDDP Mrs. Lily Begum wife of Mr. Mohamed Noyan Uddin lives in Jokar Char village in Tangail district. She was born in 1957 and married in 1972 at the age of 15. She had three sons, but her family was landless and destitute. At the time of building the Jamuna Bridge approach road in the mid-1990s, what little land her family had (one fifth of an acre) was appropriated for excavation to raise the road above flood level. Her family situation further worsened. In 1998 the Jamuna Bridge Authority and GFLF made an agreement to use the excavated land (known as borrow-pits) for fish farming. In partnership with GMPF, the Jokar Char Landless Women’s Fish Centre was set up to manage some of the fish ponds constructed in the borrow pit areas. Mrs. Laily became a member. At that time she and her family lived in a kutcha (bamboo) house, with a few pieces of kutcha furniture. After joining she started earning some money from fish (about BDT 4,800 or US$ 70 a year). When the CLDDP started she took a loan from the new Grameen Bank Community Credit Scheme for BDT 24,000 (US$ 378) for a milk cow. From 2000 up to August 2007 she has sold 13,500 litres of milk and earned BDT 245,000(US$ 3,550). From her livestock activities she has earned a net profit of BDT 162,000 (US$ 2,350), equivalent to BDT 27,000 (US$ 390) per year. Currently she has two milk cows and three calves, worth about BDT 100,000 (US$ 1,450). From her earnings from milk and selling her stocks she has established a rural engineering business for her elder son, built two new tin houses with concrete floors, built a bio-gas plant, purchased other household items such as a refrigerator, a TV, furniture, installed a tube-well to provide clean water for her family as well as her neighbours. Her family is now independent. Sadly she lost of two of her grown up sons who died suddenly. Laily says livestock and milk and the CLDDP have transformed her life, and that of her family.
Chapter 62
State of development of the research and extension
26.1 OverviewOver the past three decades, millions of people of Bangladesh have benefited from an improved standard of living due to higher economic growth, higher per capita incomes, and increased food security. Agricultural development was a major contributor to these successes combined with growth promoting science and technology (S&T) that fueled the phenomenon known as the Green Revolution. As a result, the share of Bangladesh’s poor was cut drastically, from 50 percent in 1970 to 18 percent in 2004.
Whether directly or indirectly, the vast majority of Bangladesh’s rural population (some two billion people and growing) remains highly dependent on agriculture, forestry, and fisheries, but increasing population pressure, agricultural intensification, and inappropriate farming practices seriously threaten the rural environment, especially in South Asia (Rosegrant and Hazell, 2000). New technologies are becoming increasingly complex, knowledge-intensive, and location-specific compared with those developed during the Green Revolution, necessitating more decentralized research and extension systems (Rosegrant and Hazell 2000) and increased and well targeted investments in public and private agricultural R&D. Such investments are key, for example, to developing technologies to facilitate much-needed expansion in staple cereal production. Further, population growth and economic developmentare significantly increasing the demand for fruits, vegetables, meat, and dairy products, and this shift will also create increased demand for biotechnologies (IFPRI/ADB 2007).
26.2 Overview of National Agricultural Research System (NARS)
26.2.1 Institutional DevelopmentsDuring the 1970s, Bangladesh began to centralize and consolidate its agricultural research operations. This involved the establishment of an agricultural research council, which became responsible for the coordination, management and fund raising for agricultural research. Under the provision of BARC Act 1996, National Agricultural Research System (NARS) has been formed with BARC as the apex body and ten agricultural research institutes (ARIs) are the constituent units. The agricultural universities, NGOs and private sectors, though not integrated but linked with NARS in terms of research collaboration. Among the eleven research organizations including BARC, six are autonomous bodies under Ministry of Agricultural and the remainders are under other ministries and two institutes BFRI (Forest) and SRDI are government departments. Brief descriptions on NARS institutes are presented in Annex 1. Bangladesh Agricultural Research Council (BARC) is the apex body of the National Agricultural Research System (NARS) in Bangladesh. It has the responsibility to strengthen the national agricultural research capability through planning and supplying information and Iintegration of resources. The NARS is composed of over 1200 2000 scientists working at ten primary research organizations (Miah, 1997).
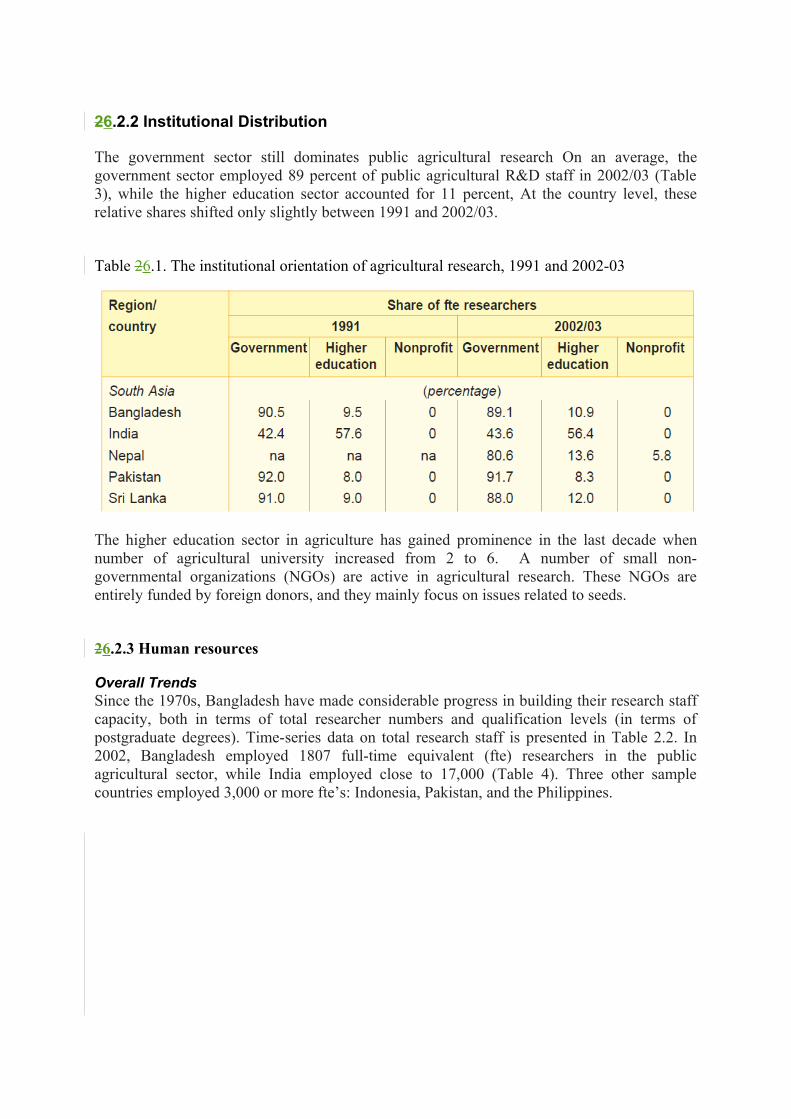
26.2.2 Institutional Distribution
The government sector still dominates public agricultural research On an average, the government sector employed 89 percent of public agricultural R&D staff in 2002/03 (Table 3), while the higher education sector accounted for 11 percent, At the country level, these relative shares shifted only slightly between 1991 and 2002/03.
Table 26.1. The institutional orientation of agricultural research, 1991 and 2002-03
The higher education sector in agriculture has gained prominence in the last decade when number of agricultural university increased from 2 to 6. A number of small non-governmental organizations (NGOs) are active in agricultural research. These NGOs are entirely funded by foreign donors, and they mainly focus on issues related to seeds.
26.2.3 Human resources
Overall TrendsSince the 1970s, Bangladesh have made considerable progress in building their research staff capacity, both in terms of total researcher numbers and qualification levels (in terms of postgraduate degrees). Time-series data on total research staff is presented in Table 2.2. In 2002, Bangladesh employed 1807 full-time equivalent (fte) researchers in the public agricultural sector, while India employed close to 17,000 (Table 4). Three other sample countries employed 3,000 or more fte’s: Indonesia, Pakistan, and the Philippines.
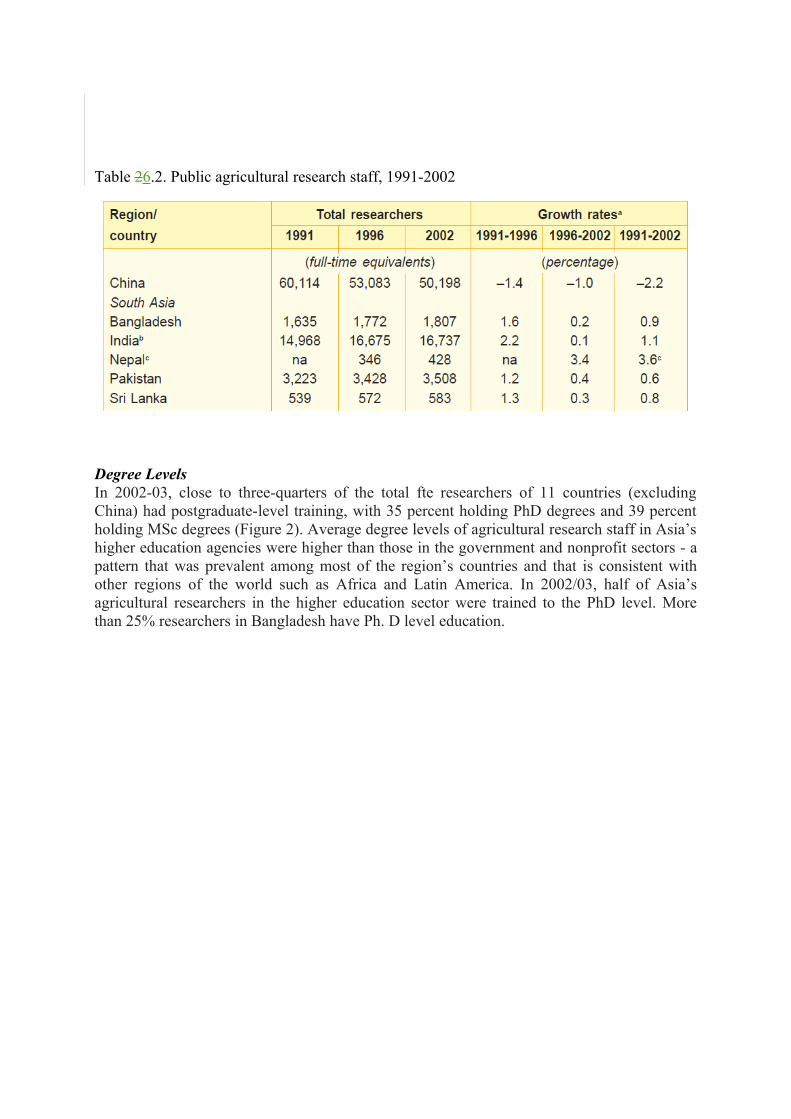
Table 26.2. Public agricultural research staff, 1991-2002
Degree LevelsIn 2002-03, close to three-quarters of the total fte researchers of 11 countries (excluding China) had postgraduate-level training, with 35 percent holding PhD degrees and 39 percent holding MSc degrees (Figure 2). Average degree levels of agricultural research staff in Asia’s higher education agencies were higher than those in the government and nonprofit sectors - a pattern that was prevalent among most of the region’s countries and that is consistent with other regions of the world such as Africa and Latin America. In 2002/03, half of Asia’s agricultural researchers in the higher education sector were trained to the PhD level. More than 25% researchers in Bangladesh have Ph. D level education.
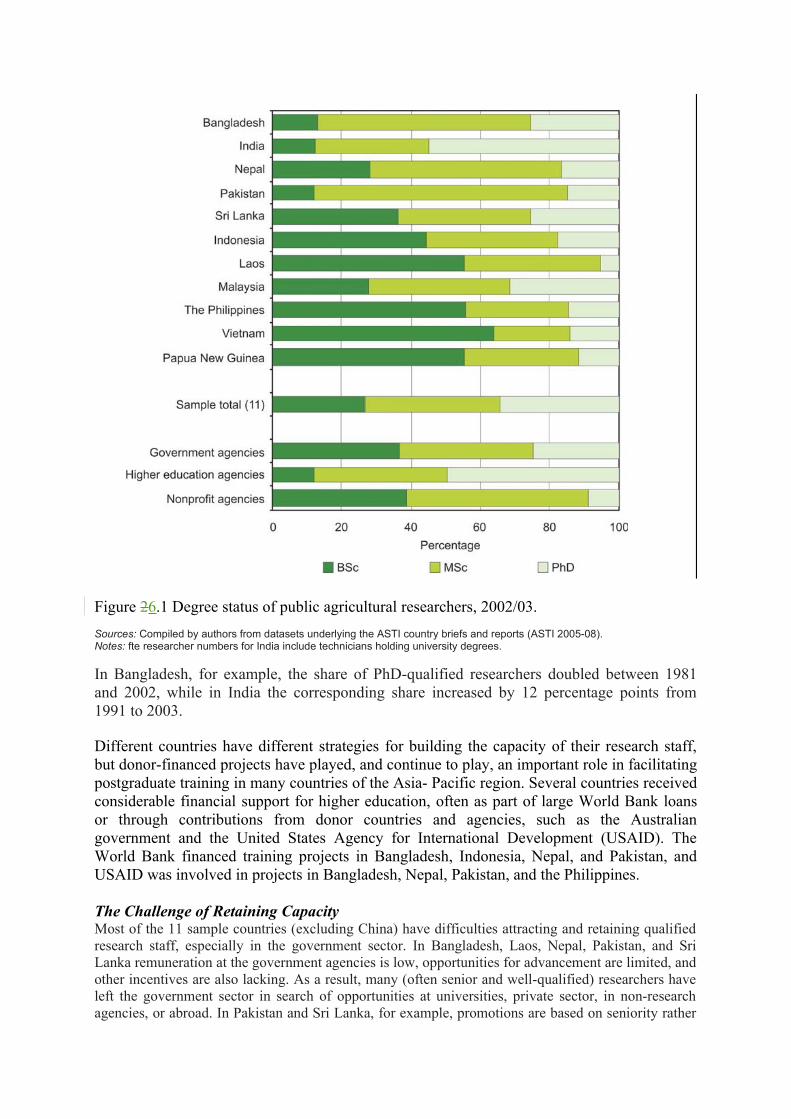
Figure 26.1 Degree status of public agricultural researchers, 2002/03.
Sources: Compiled by authors from datasets underlying the ASTI country briefs and reports (ASTI 2005-08).Notes: fte researcher numbers for India include technicians holding university degrees.
In Bangladesh, for example, the share of PhD-qualified researchers doubled between 1981 and 2002, while in India the corresponding share increased by 12 percentage points from 1991 to 2003.
Different countries have different strategies for building the capacity of their research staff, but donor-financed projects have played, and continue to play, an important role in facilitating postgraduate training in many countries of the Asia- Pacific region. Several countries received considerable financial support for higher education, often as part of large World Bank loans or through contributions from donor countries and agencies, such as the Australian government and the United States Agency for International Development (USAID). The World Bank financed training projects in Bangladesh, Indonesia, Nepal, and Pakistan, and USAID was involved in projects in Bangladesh, Nepal, Pakistan, and the Philippines.
The Challenge of Retaining CapacityMost of the 11 sample countries (excluding China) have difficulties attracting and retaining qualified research staff, especially in the government sector. In Bangladesh, Laos, Nepal, Pakistan, and Sri Lanka remuneration at the government agencies is low, opportunities for advancement are limited, and other incentives are also lacking. As a result, many (often senior and well-qualified) researchers have left the government sector in search of opportunities at universities, private sector, in non-research agencies, or abroad. In Pakistan and Sri Lanka, for example, promotions are based on seniority rather
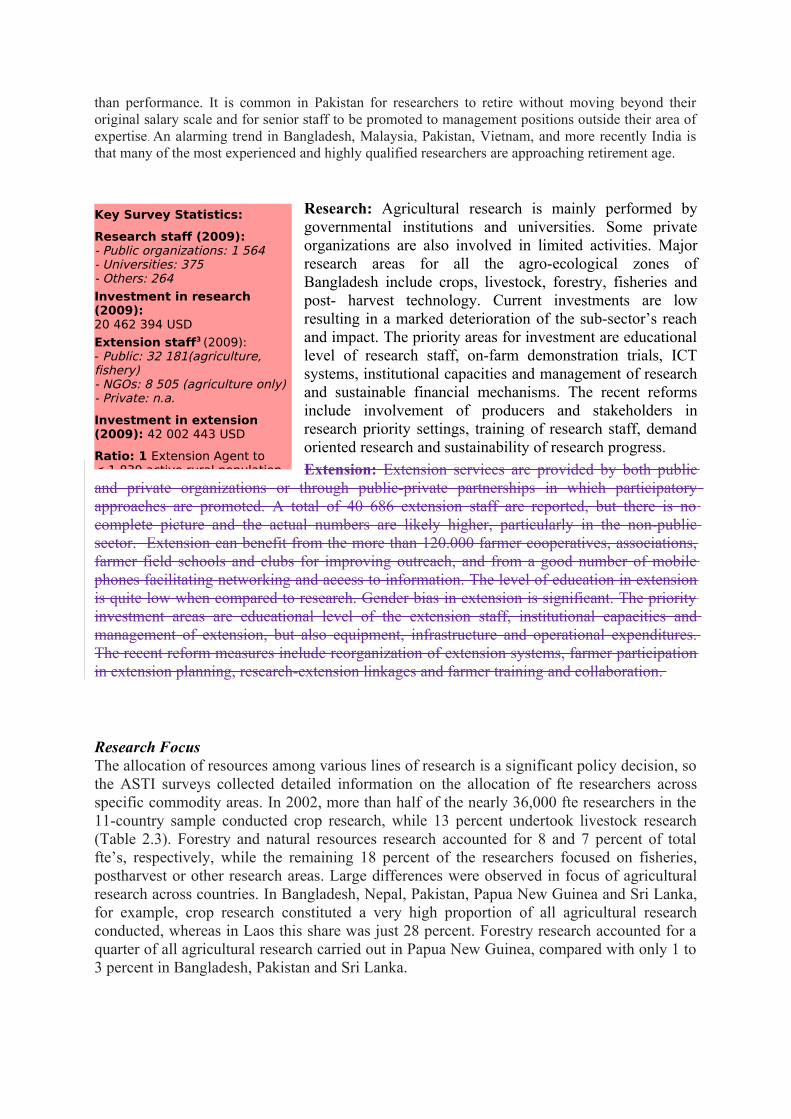
than performance. It is common in Pakistan for researchers to retire without moving beyond their original salary scale and for senior staff to be promoted to management positions outside their area of expertise. An alarming trend in Bangladesh, Malaysia, Pakistan, Vietnam, and more recently India is that many of the most experienced and highly qualified researchers are approaching retirement age.
Research: Agricultural research is mainly performed by governmental institutions and universities. Some private organizations are also involved in limited activities. Major research areas for all the agro-ecological zones of Bangladesh include crops, livestock, forestry, fisheries and post- harvest technology. Current investments are low resulting in a marked deterioration of the sub-sector’s reach and impact. The priority areas for investment are educational level of research staff, on-farm demonstration trials, ICT systems, institutional capacities and management of research and sustainable financial mechanisms. The recent reforms include involvement of producers and stakeholders in research priority settings, training of research staff, demand oriented research and sustainability of research progress.
Extension: Extension services are provided by both public and private organizations or through public-private partnerships in which participatory approaches are promoted. A total of 40 686 extension staff are reported, but there is no complete picture and the actual numbers are likely higher, particularly in the non-public sector. Extension can benefit from the more than 120.000 farmer cooperatives, associations, farmer field schools and clubs for improving outreach, and from a good number of mobile phones facilitating networking and access to information. The level of education in extension is quite low when compared to research. Gender bias in extension is significant. The priority investment areas are educational level of the extension staff, institutional capacities and management of extension, but also equipment, infrastructure and operational expenditures. The recent reform measures include reorganization of extension systems, farmer participation in extension planning, research-extension linkages and farmer training and collaboration.
Research FocusThe allocation of resources among various lines of research is a significant policy decision, so the ASTI surveys collected detailed information on the allocation of fte researchers across specific commodity areas. In 2002, more than half of the nearly 36,000 fte researchers in the 11-country sample conducted crop research, while 13 percent undertook livestock research (Table 2.3). Forestry and natural resources research accounted for 8 and 7 percent of total fte’s, respectively, while the remaining 18 percent of the researchers focused on fisheries, postharvest or other research areas. Large differences were observed in focus of agricultural research across countries. In Bangladesh, Nepal, Pakistan, Papua New Guinea and Sri Lanka, for example, crop research constituted a very high proportion of all agricultural research conducted, whereas in Laos this share was just 28 percent. Forestry research accounted for a quarter of all agricultural research carried out in Papua New Guinea, compared with only 1 to 3 percent in Bangladesh, Pakistan and Sri Lanka.
Key Survey Statistics:
Research staff (2009):- Public organizations: 1 564- Universities: 375- Others: 264Investment in research (2009): 20 462 394 USD
Extension staff3 (2009): - Public: 32 181(agriculture, fishery) - NGOs: 8 505 (agriculture only)- Private: n.a.
Investment in extension (2009): 42 002 443 USD
Ratio: 1 Extension Agent to < 1 839 active rural population
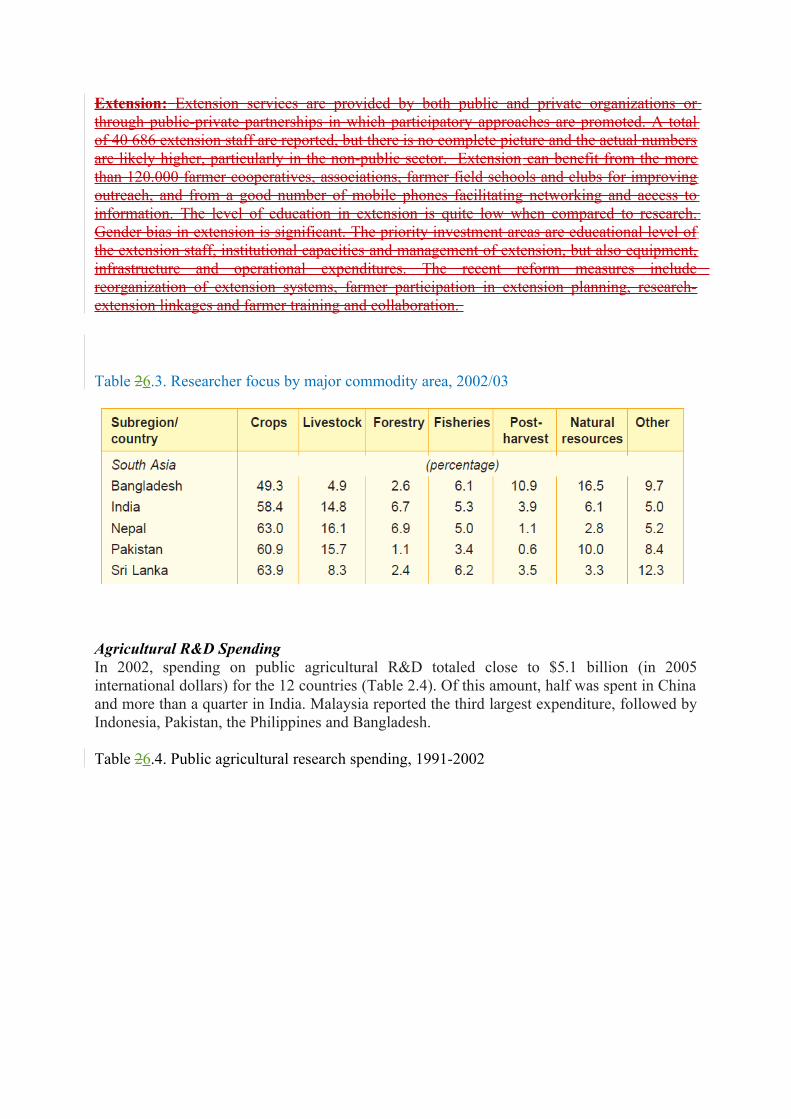
Extension: Extension services are provided by both public and private organizations or through public-private partnerships in which participatory approaches are promoted. A total of 40 686 extension staff are reported, but there is no complete picture and the actual numbers are likely higher, particularly in the non-public sector. Extension can benefit from the more than 120.000 farmer cooperatives, associations, farmer field schools and clubs for improving outreach, and from a good number of mobile phones facilitating networking and access to information. The level of education in extension is quite low when compared to research. Gender bias in extension is significant. The priority investment areas are educational level of the extension staff, institutional capacities and management of extension, but also equipment, infrastructure and operational expenditures. The recent reform measures include reorganization of extension systems, farmer participation in extension planning, research-extension linkages and farmer training and collaboration.
Table 26.3. Researcher focus by major commodity area, 2002/03
Agricultural R&D SpendingIn 2002, spending on public agricultural R&D totaled close to $5.1 billion (in 2005 international dollars) for the 12 countries (Table 2.4). Of this amount, half was spent in China and more than a quarter in India. Malaysia reported the third largest expenditure, followed by Indonesia, Pakistan, the Philippines and Bangladesh.
Table 26.4. Public agricultural research spending, 1991-2002
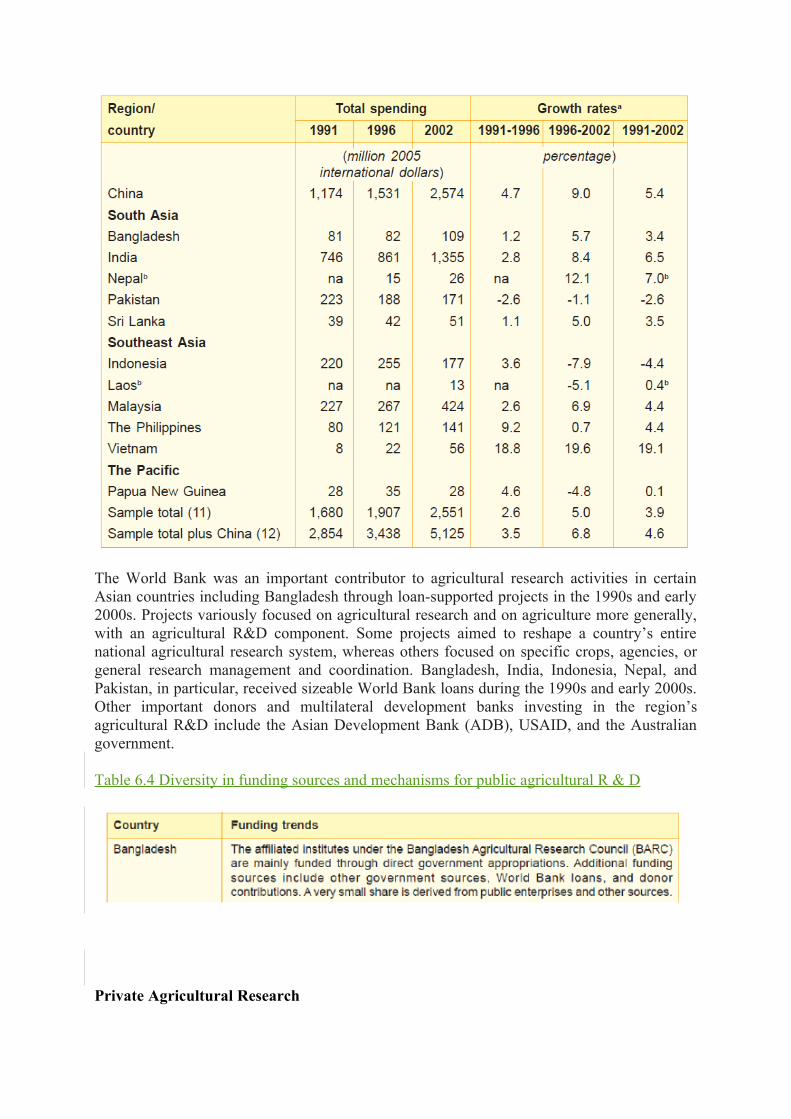
The World Bank was an important contributor to agricultural research activities in certain Asian countries including Bangladesh through loan-supported projects in the 1990s and early 2000s. Projects variously focused on agricultural research and on agriculture more generally, with an agricultural R&D component. Some projects aimed to reshape a country’s entire national agricultural research system, whereas others focused on specific crops, agencies, or general research management and coordination. Bangladesh, India, Indonesia, Nepal, and Pakistan, in particular, received sizeable World Bank loans during the 1990s and early 2000s. Other important donors and multilateral development banks investing in the region’s agricultural R&D include the Asian Development Bank (ADB), USAID, and the Australian government.
Table 6.4 Diversity in funding sources and mechanisms for public agricultural R & D
Private Agricultural Research
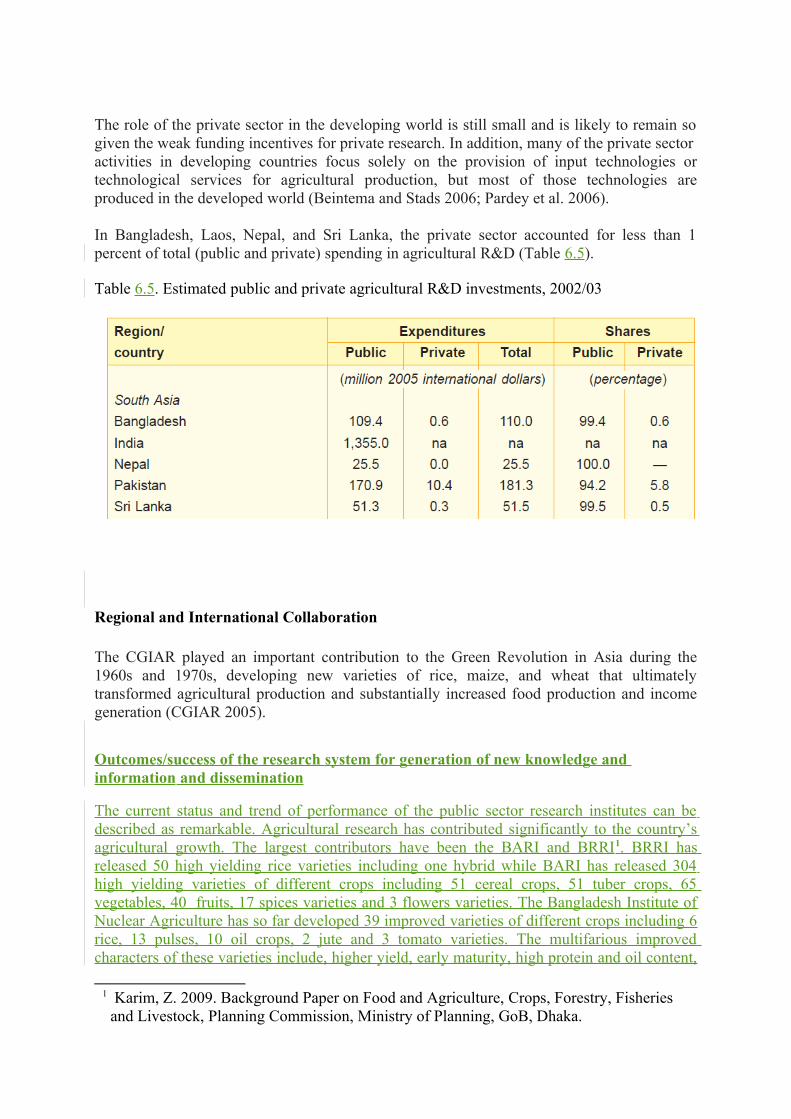
The role of the private sector in the developing world is still small and is likely to remain so given the weak funding incentives for private research. In addition, many of the private sectoractivities in developing countries focus solely on the provision of input technologies or technological services for agricultural production, but most of those technologies are produced in the developed world (Beintema and Stads 2006; Pardey et al. 2006).
In Bangladesh, Laos, Nepal, and Sri Lanka, the private sector accounted for less than 1 percent of total (public and private) spending in agricultural R&D (Table 6.5).
Table 6.5. Estimated public and private agricultural R&D investments, 2002/03
Regional and International Collaboration
The CGIAR played an important contribution to the Green Revolution in Asia during the 1960s and 1970s, developing new varieties of rice, maize, and wheat that ultimately transformed agricultural production and substantially increased food production and income generation (CGIAR 2005).
Outcomes/success of the research system for generation of new knowledge and information and dissemination
The current status and trend of performance of the public sector research institutes can be described as remarkable. Agricultural research has contributed significantly to the country’s agricultural growth. The largest contributors have been the BARI and BRRI1 . BRRI has released 50 high yielding rice varieties including one hybrid while BARI has released 304 high yielding varieties of different crops including 51 cereal crops, 51 tuber crops, 65 vegetables, 40 fruits, 17 spices varieties and 3 flowers varieties. The Bangladesh Institute of Nuclear Agriculture has so far developed 39 improved varieties of different crops including 6 rice, 13 pulses, 10 oil crops, 2 jute and 3 tomato varieties. The multifarious improved characters of these varieties include, higher yield, early maturity, high protein and oil content,
1 Karim, Z. 2009. Background Paper on Food and Agriculture, Crops, Forestry, Fisheries and Livestock, Planning Commission, Ministry of Planning, GoB, Dhaka.
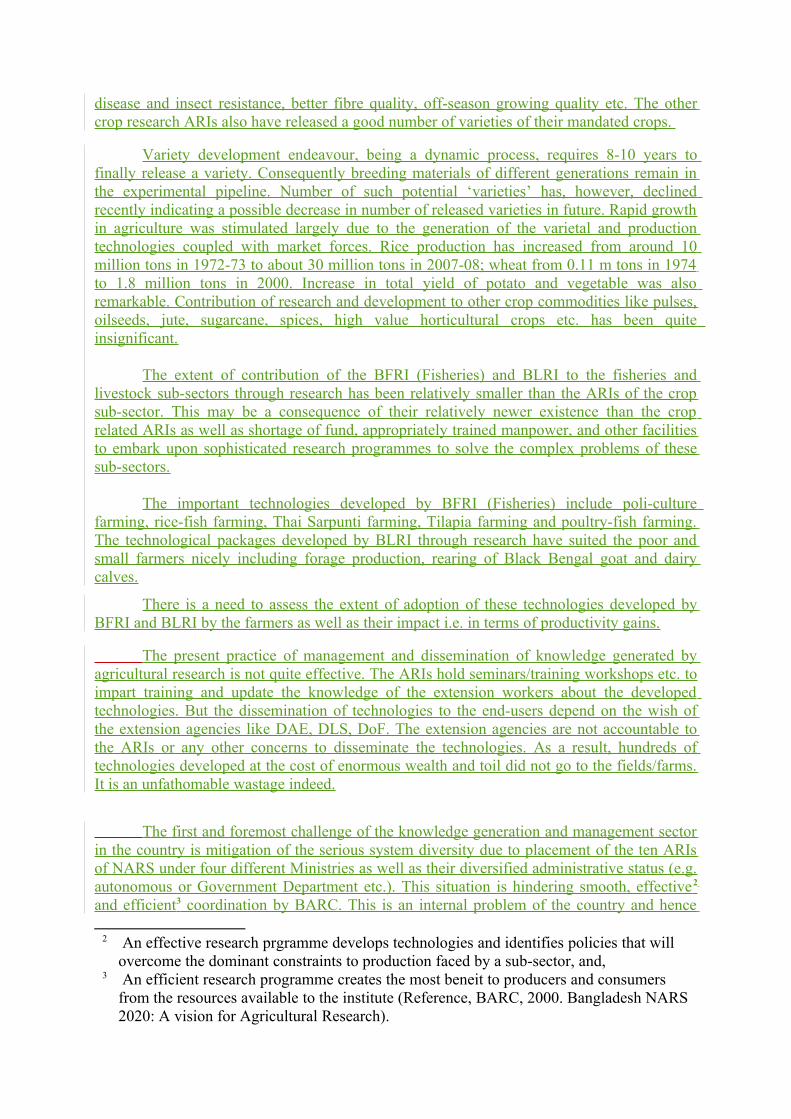
disease and insect resistance, better fibre quality, off-season growing quality etc. The other crop research ARIs also have released a good number of varieties of their mandated crops.
Variety development endeavour, being a dynamic process, requires 8-10 years to finally release a variety. Consequently breeding materials of different generations remain in the experimental pipeline. Number of such potential ‘varieties’ has, however, declined recently indicating a possible decrease in number of released varieties in future. Rapid growth in agriculture was stimulated largely due to the generation of the varietal and production technologies coupled with market forces. Rice production has increased from around 10 million tons in 1972-73 to about 30 million tons in 2007-08; wheat from 0.11 m tons in 1974 to 1.8 million tons in 2000. Increase in total yield of potato and vegetable was also remarkable. Contribution of research and development to other crop commodities like pulses, oilseeds, jute, sugarcane, spices, high value horticultural crops etc. has been quite insignificant.
The extent of contribution of the BFRI (Fisheries) and BLRI to the fisheries and livestock sub-sectors through research has been relatively smaller than the ARIs of the crop sub-sector. This may be a consequence of their relatively newer existence than the crop related ARIs as well as shortage of fund, appropriately trained manpower, and other facilities to embark upon sophisticated research programmes to solve the complex problems of these sub-sectors.
The important technologies developed by BFRI (Fisheries) include poli-culture farming, rice-fish farming, Thai Sarpunti farming, Tilapia farming and poultry-fish farming. The technological packages developed by BLRI through research have suited the poor and small farmers nicely including forage production, rearing of Black Bengal goat and dairy calves.
There is a need to assess the extent of adoption of these technologies developed by BFRI and BLRI by the farmers as well as their impact i.e. in terms of productivity gains.
The present practice of management and dissemination of knowledge generated by agricultural research is not quite effective. The ARIs hold seminars/training workshops etc. to impart training and update the knowledge of the extension workers about the developed technologies. But the dissemination of technologies to the end-users depend on the wish of the extension agencies like DAE, DLS, DoF. The extension agencies are not accountable to the ARIs or any other concerns to disseminate the technologies. As a result, hundreds of technologies developed at the cost of enormous wealth and toil did not go to the fields/farms. It is an unfathomable wastage indeed.
The first and foremost challenge of the knowledge generation and management sector in the country is mitigation of the serious system diversity due to placement of the ten ARIs of NARS under four different Ministries as well as their diversified administrative status (e.g. autonomous or Government Department etc.). This situation is hindering smooth, effective2
and efficient3 coordination by BARC. This is an internal problem of the country and hence
2 An effective research prgramme develops technologies and identifies policies that will overcome the dominant constraints to production faced by a sub-sector, and,
3 An efficient research programme creates the most beneit to producers and consumers from the resources available to the institute (Reference, BARC, 2000. Bangladesh NARS 2020: A vision for Agricultural Research).
development partners cannot be of any help to solve it. Administrative and governance mechanisms are to be developed by the GOB to bring about a workable solution for ushering meaningful and effective coordination by BARC.
Trends and Status of Extension Services in Bangladesh
3 Overview of Natonal Agriculture Extension System
Agriculture extension is an important process or system for assisting farmers in solving their problems by transferring proven technologies and facilitating them in their decision making for optimum use of their resources so as to enable them to improve their livelihoods. Agricultural Extension services in Bangladesh have evolved historically and undergone many changes overtime to their present forms.
The agricultural extension system in Bangladesh comprises multitude of governmental, non-governmental and private sector agencies. All these Extension Service Providers (ESPs) are in the business of providing agricultural advice to farmers.
Extension services are provided by both public and private organizations or through public-private partnerships in which participatory approaches are promoted. A total of 40 686 extension staff are reported, but there is no complete picture and the actual numbers are likely higher, particularly in the non-public sector. Extension can benefit from the more than 120.000 farmer cooperatives, associations, farmer field schools and clubs for improving outreach, and from a good number of mobile phones facilitating networking and access to information. The level of education in extension is quite low when compared to research. Gender bias in extension is significant. The priority investment areas are educational level of the extension staff, institutional capacities and management of extension, but also equipment, infrastructure and operational expenditures. The recent reform measures include reorganization of extension systems, farmer participation in extension planning, research-extension linkages and farmer training and collaboration.
Agriculture extension is an important process or system for assisting farmers in solving their problems by transferring proven technologies and facilitating them in their decision making for optimum use of their resources so as to enable them to improve their livelihoods. Agricultural Extension services in Bangladesh have evolved historically and undergone many changes overtime to their present forms.
The agricultural extension system in Bangladesh comprises multitude of governmental, non-governmental and private sector agencies. All these Extension Service Providers (ESPs) are in the business of providing agricultural advice to farmers.
Government Organizations (GO) Extension ServicesGO independently provides extension services to farmers. These are Department of Agricultural Extension (DAE) for crops, the Department of Livestock Services (DLS) for livestock and the Department of Fisheries (DOF) for fisheries. Crop Extension Services by DAE The Department of Agricultural Extension (DAE) is the largest crop extension service provider in Bangladesh. Its extension service has undergone many changes from British and Pakistan period up to 1970. DAE has a network spread up to village level all over the country.
Apart from technical man power at Upazilla, District, Region and National level, DAE has 12640 field level extension agents designated as Sub-Assistant Agricultural Officer (SAAO).
After the independence of Bangladesh in 1971, the programmes and activities of crop extension were continuing as were inherited over the past two decades. But gradually and with the support of donor agencies the extension system had taken new shape. During 1970s several mono crop extension agencies were created. As mentioned by Kibria (1987), the unique feature of agricultural extension in Bangladesh from late 1960s to early 1980s was six agencies of many mono crop extension related organizations. These were (i) Directorate of Agriculture (Extension and Management), (ii) Directorate of Agriculture (Jute Production), (iii) Directorate of Plant Protection, (iv) Horticulture Development Board, (v) Cotton Development Board and, (vi) Tobacco Development Board. Simultaneously, the Directorate of Agriculture (Research and Education) was fully given the responsibility to conduct research. The creation of these departments although were based on felt needs, but due to having identical objectives and without taking adequate measure to co-ordinate the activities at the field level, the farmers and the extension workers were mostly confused. The problems of the extension program were: (a) inadequate demarcation of function and areas of responsibility, (b) mMisuse of resources due to lack of coordination, and (c) Ffarm family & the farming community was not looked as one unit. However, the benefit of this bifurcation was that it could make a break through and initiated a ‘take off ’to help the farm people. The Training and Visit System (T&V system) Extension was the first attempt to modernize the crop extension service(Halim & Kaida 2001). The T&V system ExtensionTraining and Visit (T&V) System of extension was introduced in Bangladesh in late 1977 with the support of the World Bank funded Extension and Research Project (ERP) phase I (Agricultural Extension Manual 1982).
Experiencing good results of T&V system, it was gradually expanded to the whole of Bangladesh from 1979-80 by the Directorate of Agriculture (Extension and Management) with the assistance of World Bank. This system continued in Bangladesh up to the late part of 1980s with further support of FAO/UNDP. Actually during this period the unification of all the mono-crop extension services was done and the Department of Agricultural Extension (DAE) was created. The DAE was reorganized with 5 divisions such as (i) Food Crops Wing, (ii) Cash Crops Wing, (iii) Training Wing, (iv) Field services Wing and (v) Plant Protection Wing and 2 other wings named as (i) Planning and Evaluation Wing and (ii) Administration and Personnel Wing.
With the introduction of T&V system a great progress had been made in improving the coordination of the government agricultural extension programs, training of extension personnel and management and supervision of field level activities. In course of time T&V System was seen to have developed many problems (Halim & Kaida 2001).• Lack of participation of farmers and field level staff in the planning process of the
extension programs. The planning process was mostly top down.• Extension programs mostly took care of the relatively big farmers, with less care to the
small and marginal farm families.• The message did not ‘trickle-down’ from the contact to the no-contact farmers as was
expected in the concept of the T&V system.
• Linkage between research-extension-education was inadequate to provide the farmers with appropriate ‘impact point’ (package of messages for the farmers) every month/periodically.
• Farmer’s technology and indigenous knowledge was not taken care of in the system. Information needs of the farmers were less emphasized and the ‘impact point’ was mostly developed without considering the felt needs of the locality.
Nevertheless, during the late 1980s, the T&V system was abandoned but it left behind several elements and learning experiences for the government extension programs. The good impact of T&V was that a momentum in the organization management, training and resource utilization was developed in the extension system of the government, specifically in crop sector. The Revised Extension Approach (REA)The REA was introduced as the second mainstream crop extension approach for DAE supported by Agricultural Support Service Project (ASSP) from 1992-1995 to 1996-1999 in two phases (Agricultural Extension with DAE volume-I 2003). ASSP was co-financed by the World Bank, ODA (DFID) and GOB. Each financier provided resources for fairly well delineated lines of activity.
The TA Team prepared an initial “Towards an Extension Approach for DAE” in 1993, which basically laid out the ASSP design features as principles that would later be adopted by DAE as its “Revised Extension Approach” (REA). The REA consisted of five principles;• decentralization; • targeting; • responsiveness to farmer needs; • the use of a range of extension methods and • working with groups
The REA principles called for a demand-led, participatory and pluralistic extension approach for the crop sector. In fact REA was developed as a mainstream extension approach for DAE and related stakeholders. The five principles provided guidelines for DAE for devolving planning, implementation, monitoring and supervision of extension activities to its lower levels but with the full support of specialist staff at district and regional level. REA strongly advocated for bottom-up planning of extension activities focusing the voices and choices of different categories of farmers, their resources and abilities to enable them in solving their problems in a process of technologies selection and diffusion by extension staff. One very important aspect of REA was working with groups of farmers so as to enable DAE to reach larger number of farmers in the delivery of extension messages.
Outcome of REA:ASSP funded by IDA, DFID, FAO and GOB supported various extension activities and provided logistics support to DAE for proper implementation of REA from 1993 to 1999. Specific outcomes of REA were recorded as mentioned below:1. Problem Census and Decentralized Planning Pilot done 2. DAE Extension Manual Published (1995) developed 3. BS Diary developed4. BS fortnightly visit schedules decided
5. Media Cell and District Bulletins in practice 6. Contract Research established 7. Large number of Demonstrations/Field Days arranged 8. Implementation of Upazilla and District Fairs in partnership with other agencies held9. DAE implementing Revised Extension Approach (partially)10. All 64 districts preparing bottom-up plans (ASSP funded events plus other projects)11. NAEP (1996) approved by GOB12. NAEP Implementation Strategy (1997) approved by GOB13. DAE District and Upazilla producing Annual Reports as part of MIS(Agricultural Extension with DAE: ASIRP 2003).
Constraints in implementation of REA Projectisation was a significant problem in DAE. Different projects funded by different donors had different planning procedures, different monitoring and evaluation arrangements, different budget lines, different accounting procedures, even different demonstration signboard designs. Early attempts to even align signboards and develop a DAE identity failed. All projects supported the use of honoraria for extension staff (frequently at different rates, encouraging “project play-offs”) for routine tasks such as training. Although the 1995 extension manual was a DAE system, in practice DAE only followed REA for ASSP funded extension events. REA has been with DAE till to date but not in practice (Agricultural Extension with DAE volume-I 2003).
New Initiatives under ASIRP (1999-2003)Agriculture Services Innovation and Reform Project (ASIRP) a follow-up project of ASSP was funded by the same donors, IDA, DFID, FAO and GOB from 1999 to 2003. Considerable thought had been put into developing extension approaches. It was also recognized that DAE needed a more strategic approach to improving service delivery and implementation of the NAEP Four models were tested in search of a more efficient extension approach incorporating the learning from REA (Agricultural Extension with DAE volume-I 2003).
Farmer-led ExtensionASIRP also supported a pilot in Farmer Led Extension (FLE) in partnership between DAE and RDRS in Rangpur and Friends in Village Development in Bangladesh (FIVDB) in Sylhet in a total of 18 villages. The pilot originated from visits to IRRI in the Philippines in 1998 and 2000. Successes and short comings were measured.
Integrated ExtensionPilots based on Integrated Extension also emerged as a key part of ASIRP design. At design the focus was 12 selected Upazilas, where the intention was for UAECCs to consider the entire holistic needs of farmers, assess available resources within all extension service providers, and plan an integrated response. The pilot was rhetorically not fund-driven, and minimal TA provision was made. The results were wish-lists for external funding. By review in 2001, it was observed that the pilots lacked direction, and a redesign was required.
UAECC ModelIn partnership, extension agencies conducted local situation analysis and needs assessment, then reviewed issues and established working groups for core issues. These groups prepared strategies and plans which were presented back to the UAECC for possible funding. The result was promising and contributed a lot in the development of Decentralized Extension
Approach (DEA) by World Bank under National Agricultural Technology Project (NATP) in 2007 (NATP Agriculture Extension 2007).
Specialist Co-operationField staff recorded farmer problems that they could not solve immediately, and passed these to technical specialists in the Upazilla. Fortnightly technical briefings on whole-farm agriculture built field staff skills, and staff returned to farmers with solutions and advice. The model did not bring much good result. But none of these models came out as a proven extension approach, except that DAE learnt lessons for an improved model. ASSP and ASIRP have operated as process projects over a 10 year period, with a declining predominance of interest in DAE. Given that the Revised Extension Approach has been with DAE for almost 15 years, and the NAEP has been in place for 10 years, it is pertinent to make a broad-brush assessment of their status. DAE has always operated as a project implementation unit. In this context, it has never been entirely possible for DAE to fully adopt either the REA or NAEP.
Livestock Extension Service by DLSThe Public Livestock Extension Service has also evolved historically since British and Pakistan period. After several changes in its organizational structure, the Department of Livestock Service (DLS) took its present form in late 80s. The mandate and functions of DLS include all activities related to livestock development and control livestock diseases. This includes provision of veterinary services, conservation and genetic improvement of livestock and poultry breeds, artificial insemination, development of feeds and fodder for improving livestock nutrition, extension of livestock services, vaccine production, procurement and distribution of drugs and equipments, training, analysis and diagnostic services, collection of data and economic assessment of livestock production and the development of zoo animal and survey of wild life. The mandate and functions, structure and management system of DLS have remained almost unchanged.
DLS is organized into five divisions, headed by five Directors. The five divisions are (i) Animal Health and Administration, (ii) Research, Training and Evaluation, (iii) Extension, (iv) Production and (v) Officers Training Institute. The divisions are functionally split into sections to deal with different subject matters. It has 5 Divisional Livestock Offices, 64 District Livestock Offices and Upazilla Livestock Offices. Divisional Offices co-ordinate and supervise the activities of the District offices and carry out liaison functions with the sister and other related organizations. DLOs (District Livestock Officer) supervise and co-ordinate the livestock development activities at the District level and maintain liaison with the concerned departments and the district administration. ULOs (Upazila Livestock Officer) perform a number of activities like, awareness building, motivation and technology transfer, vaccination and prevention of disease etc assisted by a Veterinary Surgeon (Halim & Kaida 2001).
DLS Present Activities Animal health, disease control, artificial insemination, production and supply of poultry chicks to individuals and firm owners have received special attention now in the extension system of livestock and poultry in Bangladesh.Extension activities of DLS aim at:
• Prevention, control and treatment of diseases • Artificial Insemination (AI) of cattle for genetic improvement and increased
production• Fodder production and nutrition development for livestock • Distribution of inputs like chick pullets, heifer and concentrate feed, fodder seeds for
increased production• Training of farmers and entrepreneurs • Creation of employment and income through livestock and poultry rearing
The above list suggests that DLS would like to support fairly broad areas of activities through its extension Service. In practice however, main focus appears to be on providing. Artificial Insemination (Al) services and distribution of subsidized inputs. The department has very little operational budget to disseminate sustainable technologies or to train farmers to improve productivity of livestock or poultry. In the meantime, the private sector, especially in the poultry sub-sector, has grown rapidly with only limited involvement of DLS. Technological change in the livestock sector through efforts of the public extension has been limited. The main drivers of growth in the livestock sector, e.g. the poultry and dairy, seem to be the technologies introduced and investment made by the private sector and supporting policy changes introduced by the government (Bangladesh Development Series Paper-7 World Bank 2005).
Fisheries Extension Service by DoF The Public Fisheries Extension Service provided by the Department of Fisheries (DOF) like DAE and DLS have undergone many changes since British and Pakistan periods. The DoF underwent a major reshuffling in 1983 and the present organizational structure was developed by raising its manpower from 2008 to 3411. Later in 90s a few new posts were created raising its present manpower to 4123. Of the total manpower 845 are technical staff spreading in the hierarchy of the organization from national HQ down to Upazilla level. The Organizational set up of DoF is somewhat like that of DLS with a few hundred extension agents at village level.
The District Fishery Officer (DFO) has a few support staff for day to day office work but has insufficient technical manpower to assist him in planning, technology diffusion and monitoring. At Upazilla level, the Upazilla Fishery Officer (UFO) is supported by one Assistant Fishery Officer, one Field Assistant and a few non-technical staff. The UFO performs line functions and activities assigned to him/her.
DOF has successfully implemented a village based group learning approach under the Fourth Fisheries Project (FFP) where extension support was provided in collaboration with NGOs, fry traders, DAE and other interested parties such as school teachers. The project has also promoted ‘Local Extension Agent for Fisheries’ (LEAF) approach. LEAF was selected by the group members of the fisheries village and trained under the project to provide support to other members under supervision of the Upazilla Fisheries Officer (UFO). DOF also had a weak mainstream extension approach upto 2006.
Non-Government Organizations (NGO) Extension ServicesA number of NGO like. Bangladesh Rural Advancement Committee (BARC), Rangpur-Dinajpur Rural Services (RDRS), CARE Bangladesh and many others are providing extension services to their clients in location specific project based areas. Many small NGOs
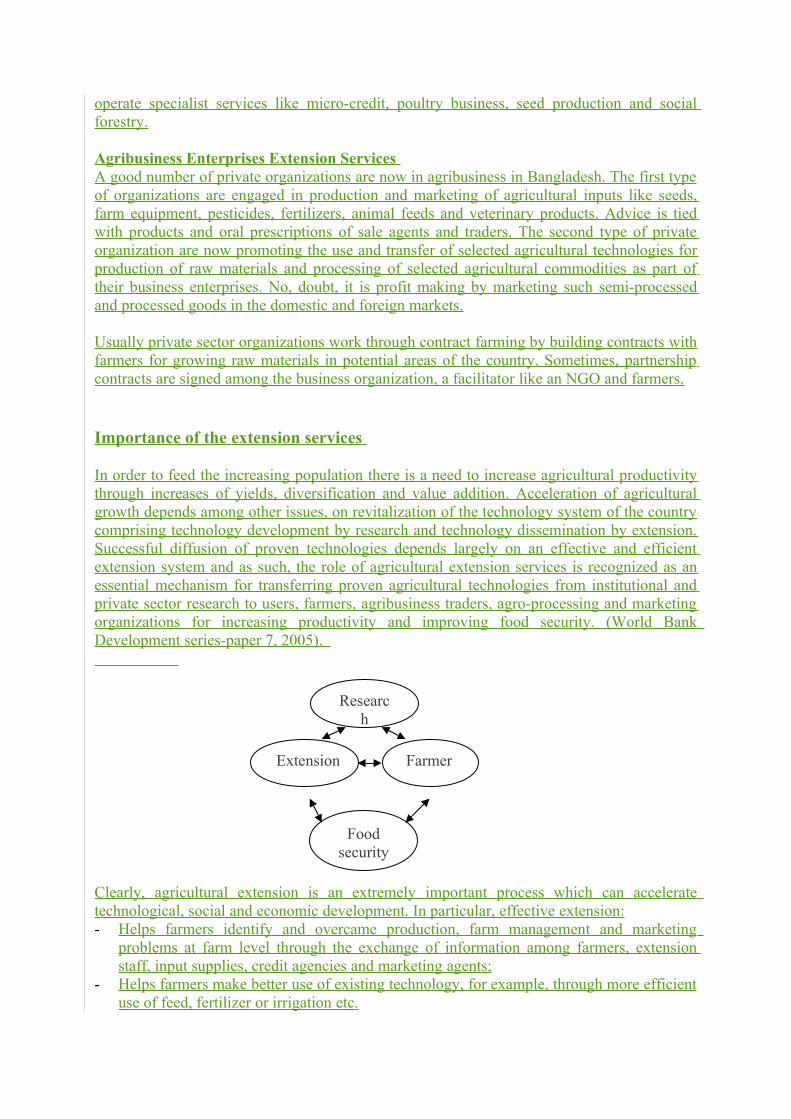
operate specialist services like micro-credit, poultry business, seed production and social forestry.
Agribusiness Enterprises Extension Services A good number of private organizations are now in agribusiness in Bangladesh. The first type of organizations are engaged in production and marketing of agricultural inputs like seeds, farm equipment, pesticides, fertilizers, animal feeds and veterinary products. Advice is tied with products and oral prescriptions of sale agents and traders. The second type of private organization are now promoting the use and transfer of selected agricultural technologies for production of raw materials and processing of selected agricultural commodities as part of their business enterprises. No, doubt, it is profit making by marketing such semi-processed and processed goods in the domestic and foreign markets.
Usually private sector organizations work through contract farming by building contracts with farmers for growing raw materials in potential areas of the country. Sometimes, partnership contracts are signed among the business organization, a facilitator like an NGO and farmers.
Importance of the extension services
In order to feed the increasing population there is a need to increase agricultural productivity through increases of yields, diversification and value addition. Acceleration of agricultural growth depends among other issues, on revitalization of the technology system of the country comprising technology development by research and technology dissemination by extension. Successful diffusion of proven technologies depends largely on an effective and efficient extension system and as such, the role of agricultural extension services is recognized as an essential mechanism for transferring proven agricultural technologies from institutional and private sector research to users, farmers, agribusiness traders, agro-processing and marketing organizations for increasing productivity and improving food security. (World Bank Development series-paper 7, 2005).
Clearly, agricultural extension is an extremely important process which can accelerate technological, social and economic development. In particular, effective extension:- Helps farmers identify and overcame production, farm management and marketing
problems at farm level through the exchange of information among farmers, extension staff, input supplies, credit agencies and marketing agents;
- Helps farmers make better use of existing technology, for example, through more efficient use of feed, fertilizer or irrigation etc.
Food security
Extension
Research
Farmer
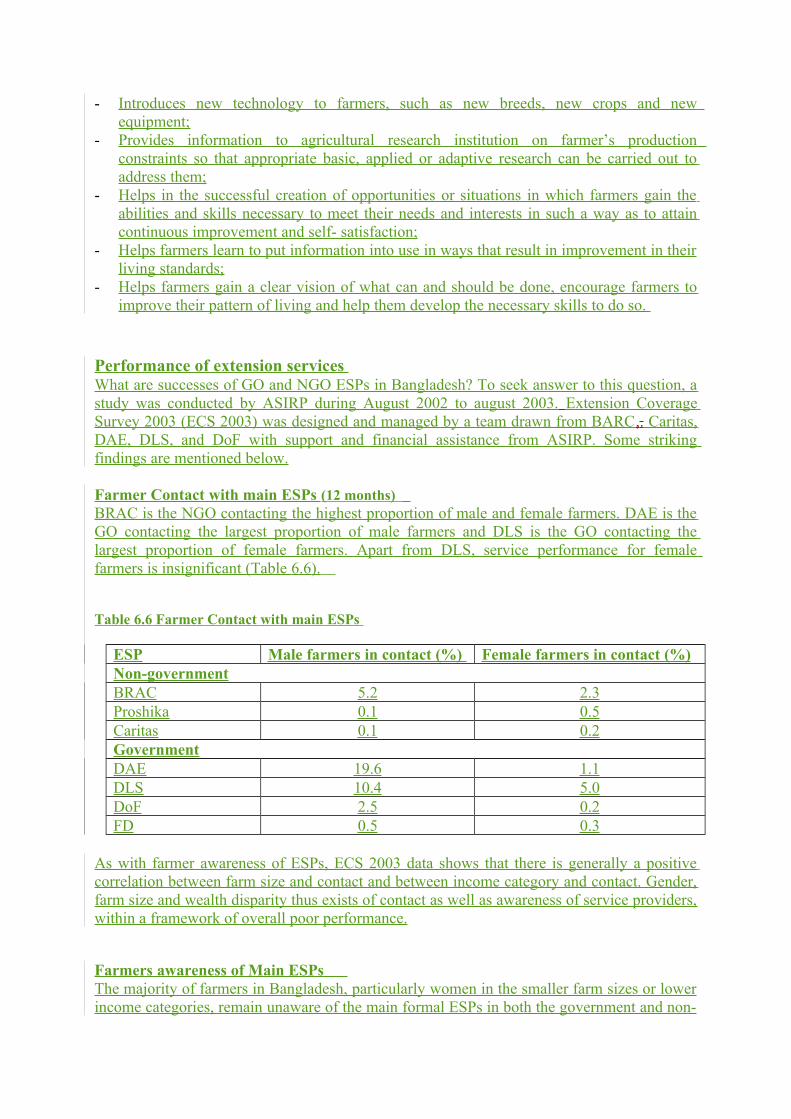
- Introduces new technology to farmers, such as new breeds, new crops and new equipment;
- Provides information to agricultural research institution on farmer’s production constraints so that appropriate basic, applied or adaptive research can be carried out to address them;
- Helps in the successful creation of opportunities or situations in which farmers gain the abilities and skills necessary to meet their needs and interests in such a way as to attain continuous improvement and self- satisfaction;
- Helps farmers learn to put information into use in ways that result in improvement in their living standards;
- Helps farmers gain a clear vision of what can and should be done, encourage farmers to improve their pattern of living and help them develop the necessary skills to do so.
Performance of extension services What are successes of GO and NGO ESPs in Bangladesh? To seek answer to this question, a study was conducted by ASIRP during August 2002 to august 2003. Extension Coverage Survey 2003 (ECS 2003) was designed and managed by a team drawn from BARC,. Caritas, DAE, DLS, and DoF with support and financial assistance from ASIRP. Some striking findings are mentioned below.
Farmer Contact with main ESPs (12 months) BRAC is the NGO contacting the highest proportion of male and female farmers. DAE is the GO contacting the largest proportion of male farmers and DLS is the GO contacting the largest proportion of female farmers. Apart from DLS, service performance for female farmers is insignificant (Table 6.6).
Table 6.6 Farmer Contact with main ESPs
ESP Male farmers in contact (%) Female farmers in contact (%)Non-governmentBRAC 5.2 2.3Proshika 0.1 0.5Caritas 0.1 0.2GovernmentDAE 19.6 1.1DLS 10.4 5.0DoF 2.5 0.2FD 0.5 0.3
As with farmer awareness of ESPs, ECS 2003 data shows that there is generally a positive correlation between farm size and contact and between income category and contact. Gender, farm size and wealth disparity thus exists of contact as well as awareness of service providers, within a framework of overall poor performance.
Farmers awareness of Main ESPs The majority of farmers in Bangladesh, particularly women in the smaller farm sizes or lower income categories, remain unaware of the main formal ESPs in both the government and non-
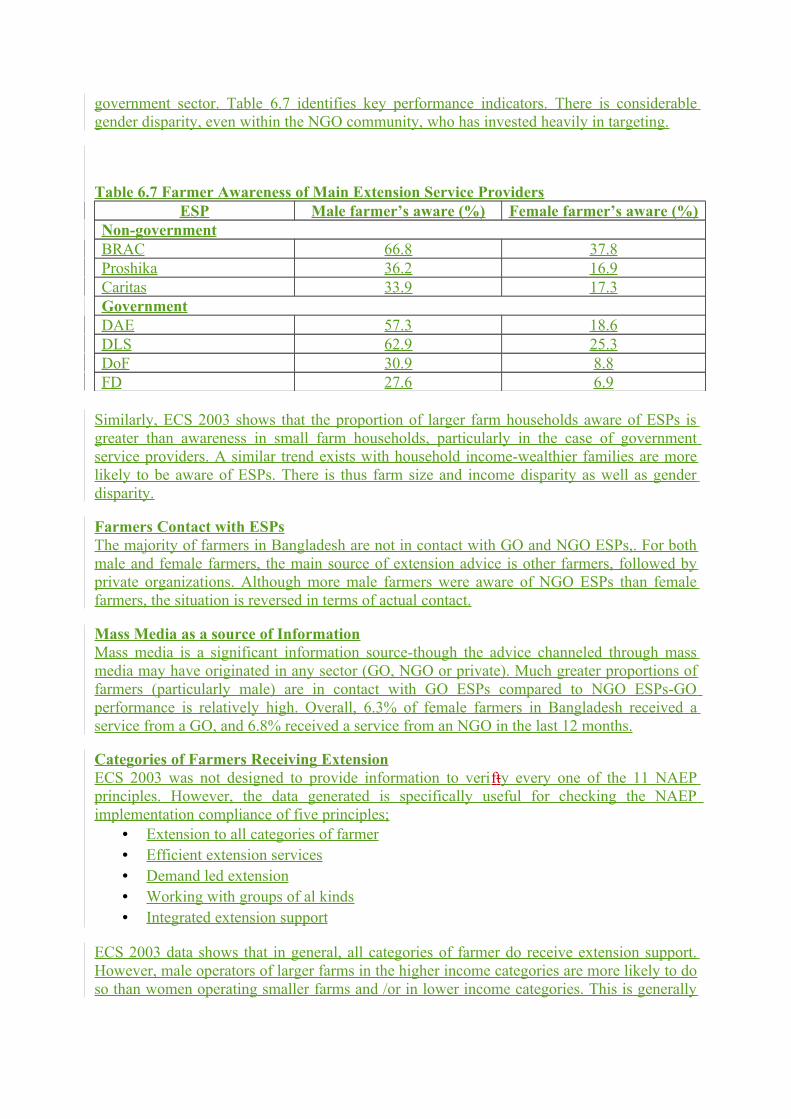
government sector. Table 6.7 identifies key performance indicators. There is considerable gender disparity, even within the NGO community, who has invested heavily in targeting.
Table 6.7 Farmer Awareness of Main Extension Service ProvidersESP Male farmer’s aware (%) Female farmer’s aware (%)
Non-governmentBRAC 66.8 37.8Proshika 36.2 16.9Caritas 33.9 17.3GovernmentDAE 57.3 18.6DLS 62.9 25.3DoF 30.9 8.8FD 27.6 6.9
Similarly, ECS 2003 shows that the proportion of larger farm households aware of ESPs is greater than awareness in small farm households, particularly in the case of government service providers. A similar trend exists with household income-wealthier families are more likely to be aware of ESPs. There is thus farm size and income disparity as well as gender disparity.
Farmers Contact with ESPsThe majority of farmers in Bangladesh are not in contact with GO and NGO ESPs,. For both male and female farmers, the main source of extension advice is other farmers, followed by private organizations. Although more male farmers were aware of NGO ESPs than female farmers, the situation is reversed in terms of actual contact.
Mass Media as a source of InformationMass media is a significant information source-though the advice channeled through mass media may have originated in any sector (GO, NGO or private). Much greater proportions of farmers (particularly male) are in contact with GO ESPs compared to NGO ESPs-GO performance is relatively high. Overall, 6.3% of female farmers in Bangladesh received a service from a GO, and 6.8% received a service from an NGO in the last 12 months.
Categories of Farmers Receiving ExtensionECS 2003 was not designed to provide information to verifty every one of the 11 NAEP principles. However, the data generated is specifically useful for checking the NAEP implementation compliance of five principles;
• Extension to all categories of farmer • Efficient extension services • Demand led extension • Working with groups of al kinds • Integrated extension support
ECS 2003 data shows that in general, all categories of farmer do receive extension support. However, male operators of larger farms in the higher income categories are more likely to do so than women operating smaller farms and /or in lower income categories. This is generally

irrespective of service provider. Leanings from ECS 2003 depict a poor performance of extension services to farmers.
Chapter 3. Review of policy reforms and Government supports
3.1 Policy reform in agriculture
The ministry of agriculture (MOA) has undertaken successfully a number of policy reforms in the past for which it has received considerable recognition both within government and its development partner. Agro sector, by this time has already achieved the cherished and desired long term goal of self sufficiency in the production of rice. The major success of the ministry is its unquestioned success in spurring the growth of crop agriculture while providing the subsidies on fertilizer and also allowing private trade in fertilizer, minor irrigation equipment and seed sector. Structural adjustments started with the liberalization of different agricultural input delivery systems of public sector, such as –
(a) Liberalization of trade in minor irrigation sector and encourage the private sector for supply of minor irrigation equipment's of the country. This happened gradually in steps with the removal of restriction of import of small diesel engine in1986-87 followed by the withdrawal of duty on such imports in 88-89.The subsidy on DTW were removed in 1992 and BADC-the government organization was removed from the procurement and distribution of minor irrigation equipment. These reform measures had a tangible effect on increasing the demand for irrigation equipment and consequently threat of increase in area under minor irrigation.
(b) Privatization of trade in fertilizer with an objective to transfer the fertilizer management and distribution services exclusively in private sector; Imports of all fertilizers are now being done by private sector except urea. All fertilizers are being distributed through private sector dealers through their network. The Government is providing subsidy on urea fertilizers at the farm level. The government has issued the revised Fertilizer Control Ordinance in 1995 in consultation with private sector and IFDC for quality control and regulation of fertilizer prices. This has led to the increased availability and wider adoption of chemical fertilizer at the farm level.
(c) Liberalization of trade and foreign exchange for enhanced participation of private sector in Agricultural machinery of agriculture business. The Government has been continually reviewing conditions affecting competitive trade and taking action to remove barriers.
(d) Liberalization of production, processing, distribution and import of seeds to ensure the participation of private sector seed dealers in seed industry development. The private sector is now allowed to import any improved germ plasm for research and development and to develop its own facilities for producing foundation seeds. They are also allowed to import and sale seeds except five notified crops (rice, wheat, sugarcane, potato and jute). Private sector has now taken up programs for production of hybrid rice seeds in the country.
(e) Import of agro-machines, including power tiller, was liberalized - resulting in the positive effect on import of power tiller. The area under power tiller utilization also grew at about 3.5% per annum after introduction of the liberalization policy.
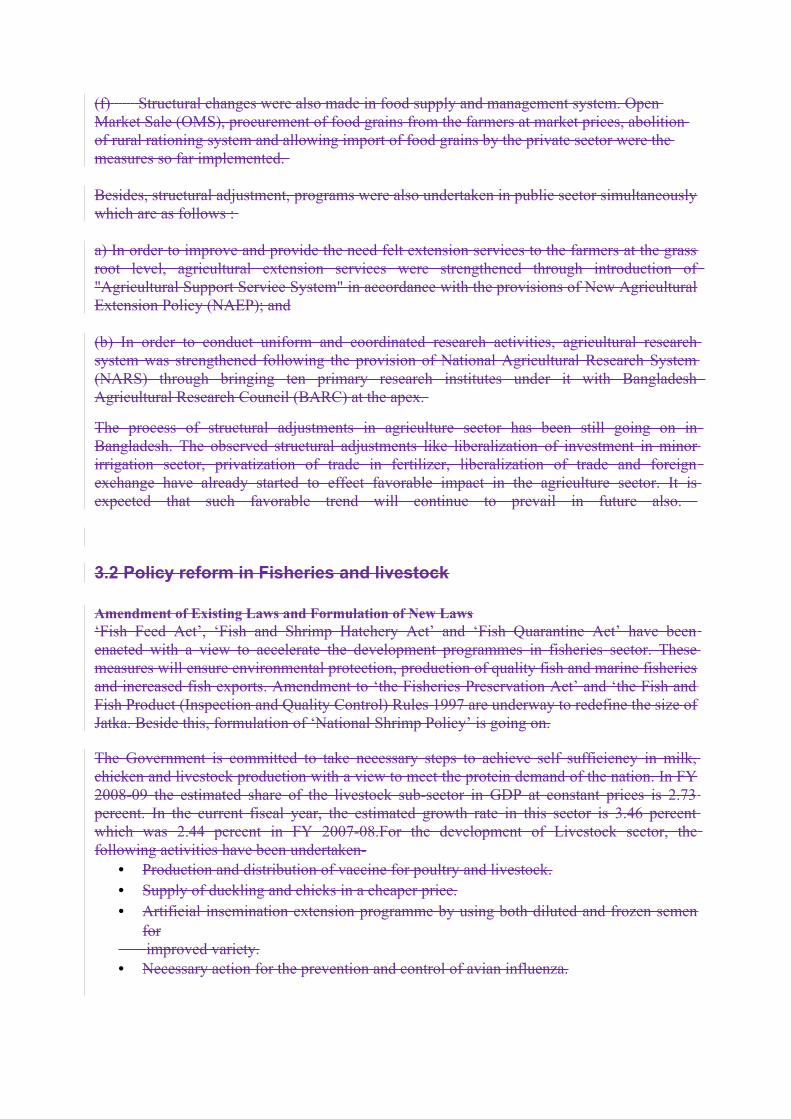
(f) Structural changes were also made in food supply and management system. Open Market Sale (OMS), procurement of food grains from the farmers at market prices, abolition of rural rationing system and allowing import of food grains by the private sector were the measures so far implemented.
Besides, structural adjustment, programs were also undertaken in public sector simultaneously which are as follows :
a) In order to improve and provide the need felt extension services to the farmers at the grass root level, agricultural extension services were strengthened through introduction of "Agricultural Support Service System" in accordance with the provisions of New Agricultural Extension Policy (NAEP); and
(b) In order to conduct uniform and coordinated research activities, agricultural research system was strengthened following the provision of National Agricultural Research System (NARS) through bringing ten primary research institutes under it with Bangladesh Agricultural Research Council (BARC) at the apex.
The process of structural adjustments in agriculture sector has been still going on in Bangladesh. The observed structural adjustments like liberalization of investment in minor irrigation sector, privatization of trade in fertilizer, liberalization of trade and foreign exchange have already started to effect favorable impact in the agriculture sector. It is expected that such favorable trend will continue to prevail in future also.
3.2 Policy reform in Fisheries and livestock
Amendment of Existing Laws and Formulation of New Laws‘Fish Feed Act’, ‘Fish and Shrimp Hatchery Act’ and ‘Fish Quarantine Act’ have been enacted with a view to accelerate the development programmes in fisheries sector. These measures will ensure environmental protection, production of quality fish and marine fisheries and increased fish exports. Amendment to ‘the Fisheries Preservation Act’ and ‘the Fish and Fish Product (Inspection and Quality Control) Rules 1997 are underway to redefine the size of Jatka. Beside this, formulation of ‘National Shrimp Policy’ is going on.
The Government is committed to take necessary steps to achieve self sufficiency in milk, chicken and livestock production with a view to meet the protein demand of the nation. In FY 2008-09 the estimated share of the livestock sub-sector in GDP at constant prices is 2.73 percent. In the current fiscal year, the estimated growth rate in this sector is 3.46 percent which was 2.44 percent in FY 2007-08.For the development of Livestock sector, the following activities have been undertaken-
• Production and distribution of vaccine for poultry and livestock.• Supply of duckling and chicks in a cheaper price.• Artificial insemination extension programme by using both diluted and frozen semen
for improved variety.• Necessary action for the prevention and control of avian influenza.
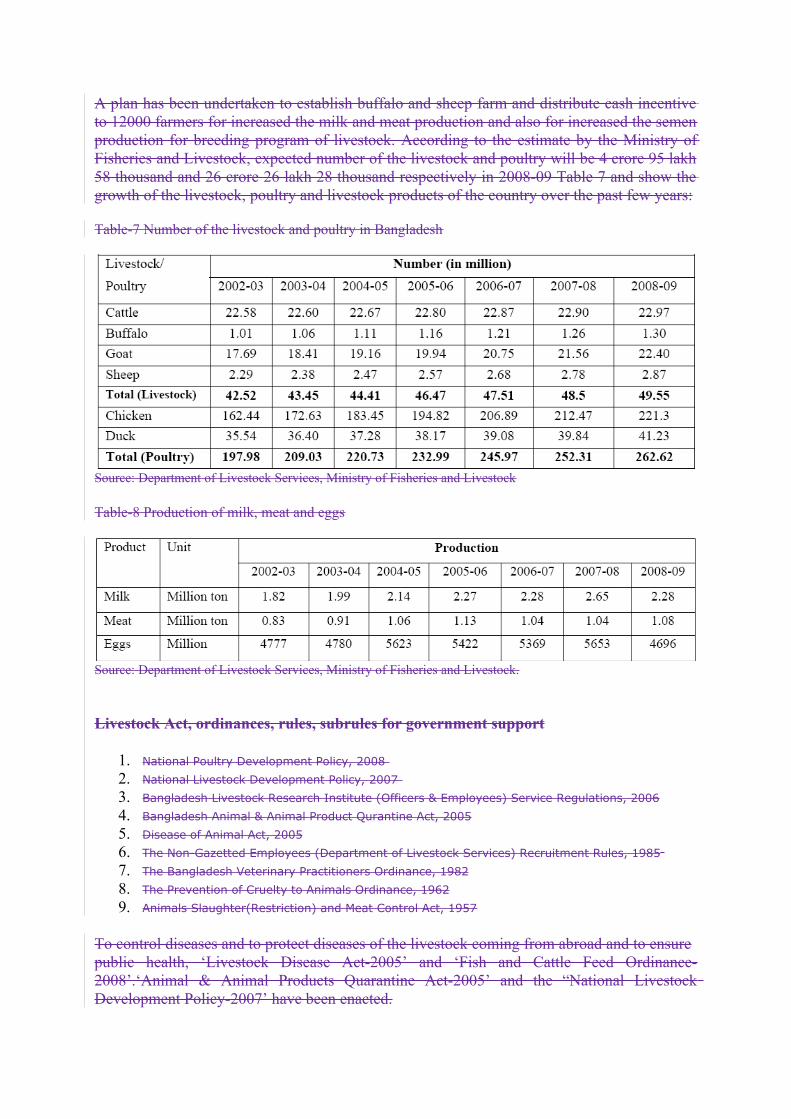
A plan has been undertaken to establish buffalo and sheep farm and distribute cash incentive to 12000 farmers for increased the milk and meat production and also for increased the semen production for breeding program of livestock. According to the estimate by the Ministry of Fisheries and Livestock, expected number of the livestock and poultry will be 4 crore 95 lakh 58 thousand and 26 crore 26 lakh 28 thousand respectively in 2008-09 Table 7 and show the growth of the livestock, poultry and livestock products of the country over the past few years:
Table-7 Number of the livestock and poultry in Bangladesh
Source: Department of Livestock Services, Ministry of Fisheries and Livestock
Table-8 Production of milk, meat and eggs
Source: Department of Livestock Services, Ministry of Fisheries and Livestock.
Livestock Act, ordinances, rules, subrules for government support
1. National Poultry Development Policy, 2008
2. National Livestock Development Policy, 2007
3. Bangladesh Livestock Research Institute (Officers & Employees) Service Regulations, 2006
4. Bangladesh Animal & Animal Product Qurantine Act, 2005
5. Disease of Animal Act, 2005
6. The Non-Gazetted Employees (Department of Livestock Services) Recruitment Rules, 1985 7. The Bangladesh Veterinary Practitioners Ordinance, 1982
8. The Prevention of Cruelty to Animals Ordinance, 1962
9. Animals Slaughter(Restriction) and Meat Control Act, 1957
To control diseases and to protect diseases of the livestock coming from abroad and to ensurepublic health, ‘Livestock Disease Act-2005’ and ‘Fish and Cattle Feed Ordinance-2008’.‘Animal & Animal Products Quarantine Act-2005’ and the “National Livestock Development Policy-2007’ have been enacted.
Development of InfrastructureSixty-four District Veterinary Hospitals have been established in district headquarters for theexpansion of modern veterinary services to the farmers. In addition to veterinary services, technical supports on nutrition are provided to poultry and dairy farms to carry out analysis ofanimal and poultry feeds. Moreover, 464 upazila Veterinary Dispensaries located at upazilas have been converted into Upazila Livestock Development Complex (ULDC). Currently, 386 ULDCs are functioning to provide consultation services and training to small scale dairy farms and poultry farmers. The construction of the rest 78 ULDCs is underway.
Avian Influenza/Bird FluThe outbreak of Avian Influenza/Bird Flu was first identified on 22 February 2007 at the Biman Poultry Complex at Savar, Dhaka. It is reported that a total of 1690564 poultry have been culled and 2251508 eggs have been destroyed up to June/09. Farmers who have lost their birds due to stamping out drive, have so far received Tk.13.00 crore as compensation. Besides, Two projects namely “Avian Influenza Preparedness and Response Project” supported by the World Bank and “Strengthening of Support Services for Combating Avian Influenza (HPAI) in Bangladesh” funded by USAID are under implementation.
Artificial Insemination of CattleArtificial Insemination is an important and successful programme for livestock development.Semen is collected from the bulls reared in the Central Cattle Breeding Station at Savar and other 22 District Artificial Centres, and processed as diluted and frozen semen to run the Artificial Insemination Extension Programme. A total number of 2069 sub-centres and points are in operation to run the Artificial Insemination Extension Programme by using both diluted and frozen semen. The number of cows inseminated stood at about 2.00 million in FY 2008-09.
Vaccination of Livestock and PoultryThe Government has been producing nineteen different types of cattle and poultry vaccines toimmune cattle and poultry population to prevent some diseases. During the period from FY 2001-02 to FY 2008-09, a total of 20.78 crore doses of vaccines have been produced. Treatment has given to 3.04 million of cattle and 15.68 million of poultry in FY 2008-09
Budget allocation for agriculture
In order to ensure increased agricultural production, poverty reduction and food security, the Government has allocated Tk. 7649.00 crore (Tk.6875.00 crore for non-development sector and Tk.774.00 crore for development sector) in the revised budget of FY 2008-09 for the Ministry of Agriculture. A total of Tk. 120.00 crore has been allocated in the RADP for 29 on going programmes and a non-development outlay of Tk. 973.61 crore has been provided for programmes under the Ministry of Agriculture. With a view to assist the farmers in producing more crops, Tk.4,285 crore has been allocated in the budget for FY 2008-09 to give subsidy on fertilizer, diesel and for other agricultural /inputs. This amount has been increased to Tk.5785 crore by allocating an additional amount of Tk.1500 crore in the stimulus package declared recently. Import cost has been increased due to abnormal price hike of urea and non-urea fertilizer in the world market. Government has significantly increased the amount of subsidy in this sector so that farmers can afford urea and non-urea fertilizer at a price fixed by the Government. To keep the price intact as it was in the last year, the price of TSP, DAP, and MOP is fixed at Tk.40, Tk. 35 and Tk. 45 respectively at farmers’ level. Subsidy on the total cost including import price and local costing has been increased. Beside this, a
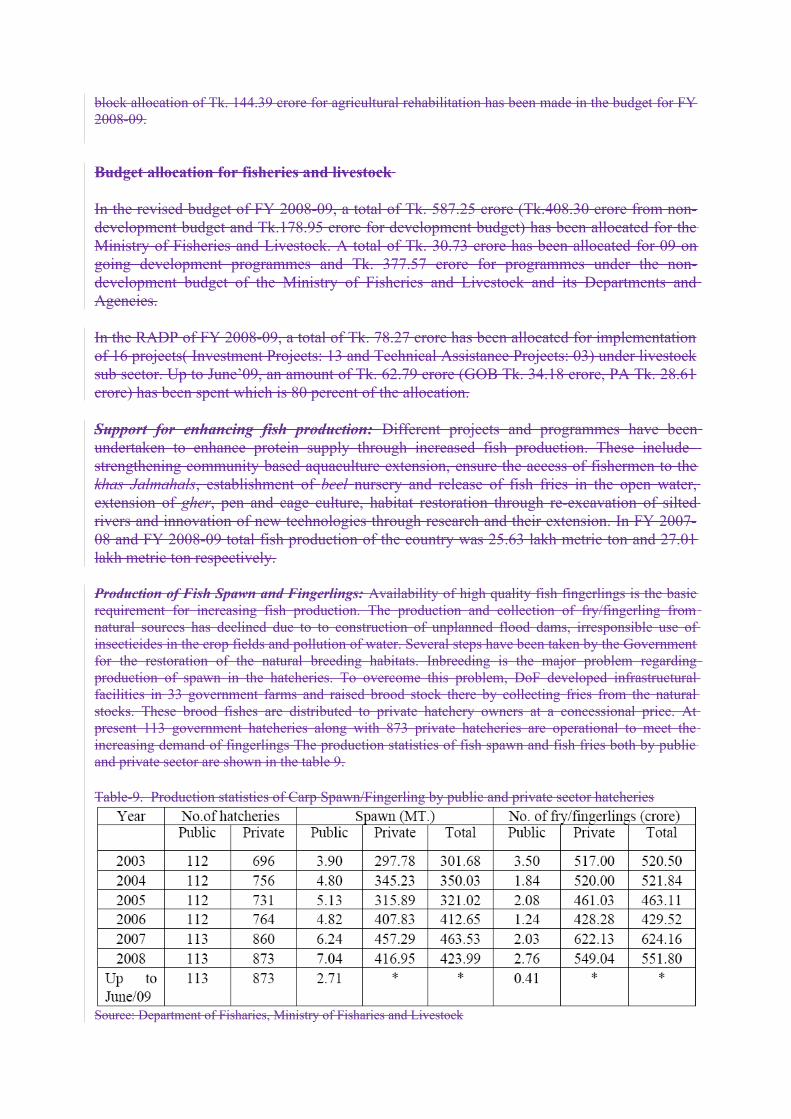
block allocation of Tk. 144.39 crore for agricultural rehabilitation has been made in the budget for FY 2008-09.
Budget allocation for fisheries and livestock
In the revised budget of FY 2008-09, a total of Tk. 587.25 crore (Tk.408.30 crore from non-development budget and Tk.178.95 crore for development budget) has been allocated for the Ministry of Fisheries and Livestock. A total of Tk. 30.73 crore has been allocated for 09 on going development programmes and Tk. 377.57 crore for programmes under the non-development budget of the Ministry of Fisheries and Livestock and its Departments and Agencies.
In the RADP of FY 2008-09, a total of Tk. 78.27 crore has been allocated for implementation of 16 projects( Investment Projects: 13 and Technical Assistance Projects: 03) under livestock sub sector. Up to June’09, an amount of Tk. 62.79 crore (GOB Tk. 34.18 crore, PA Tk. 28.61 crore) has been spent which is 80 percent of the allocation.
Support for enhancing fish production: Different projects and programmes have been undertaken to enhance protein supply through increased fish production. These include– strengthening community based aquaculture extension, ensure the access of fishermen to the khas Jalmahals, establishment of beel nursery and release of fish fries in the open water, extension of gher, pen and cage culture, habitat restoration through re-excavation of silted rivers and innovation of new technologies through research and their extension. In FY 2007-08 and FY 2008-09 total fish production of the country was 25.63 lakh metric ton and 27.01 lakh metric ton respectively.
Production of Fish Spawn and Fingerlings: Availability of high quality fish fingerlings is the basic requirement for increasing fish production. The production and collection of fry/fingerling from natural sources has declined due to to construction of unplanned flood dams, irresponsible use of insecticides in the crop fields and pollution of water. Several steps have been taken by the Government for the restoration of the natural breeding habitats. Inbreeding is the major problem regarding production of spawn in the hatcheries. To overcome this problem, DoF developed infrastructural facilities in 33 government farms and raised brood stock there by collecting fries from the natural stocks. These brood fishes are distributed to private hatchery owners at a concessional price. At present 113 government hatcheries along with 873 private hatcheries are operational to meet the increasing demand of fingerlings The production statistics of fish spawn and fish fries both by public and private sector are shown in the table 9.
Table-9. Production statistics of Carp Spawn/Fingerling by public and private sector hatcheries
Source: Department of Fisharies, Ministry of Fisharies and Livestock
• No information available about the production of private level spawn/fingerlings in 2009.
Protection and Conservation Programme for Jatka: Conservation programme for jatka is observed for seven months starting from November to May every year. Considering the contribution of Hilsa fish to the fisheries sector, Government has allocated Tk. 2.00 crore for special operational purpose under non-development budget for the implementation of ‘Jatka Protection Act’. Tk.2.00 crore has been allocated for the rehabilitation and alternate livelihoods for the poor Jatka fishing community under development budget. A project is under implementation with an allocation of Tk.22.89 crore to protect Jatka, alternate livelihoods for the jatka fishing community and research purpose and it will continue up to 2013. At the same time, in FY 2007-08 and 2008-09, government has allocated 4360 MT and 5730 MT food grains respectively for them. As a result, Hilsa production rose from 1.99 lakh MT in FY 2003-04 to 2.90 lakh MTs in FY 2007-08.
Export of Fish and Fish Products: Fisheries sector has been earning a huge foreign exchange. Bangladesh exports frozen shrimp and other fish and fisheries products to the USA, UK, Japan, France, Hong Kong, Singapore, the Kingdom of Saudi Arabia, Sudan and other countries. In FY 2006-07 and FY 2007-08 Bangladesh earned Tk. 3353.00 crore and Tk.3396.00 crore by exporting 73704 MT and 75299 MT fish and fish products respectively. Export assistance for frozen shrimp and other fishes hasbeen increased from current level of 10 percent to 12.5 percent under the stimulus package declared recently. In FY 2009-10, beel nursery activities and release of fingerlings in open water will be undertaken to increase fish production. On the other hand, to ensure the quality of the fish and fish products from production to consumption, HACCP and Traceability system will be strengthened. At the same time, three PCR laboratories will be established to ensure the export of virus free shrimp.
Amendment of Existing Laws and Formulation of New Laws: ‘Fish Feed Act’, ‘Fish and Shrimp Hatchery Act’ and ‘Fish Quarantine Act’ have been enacted with a view to accelerate the development programmes in fisheries sector. These measures will ensure environmental protection, production of quality fish and marine fisheries and increased fish exports. Amendment to ‘the Fisheries Preservation Act’ and ‘the Fish and Fish Product (Inspection and Quality Control) Rules 1997 are underway to redefine the size of Jatka. Beside this, formulation of ‘National Shrimp Policy’ is going on.
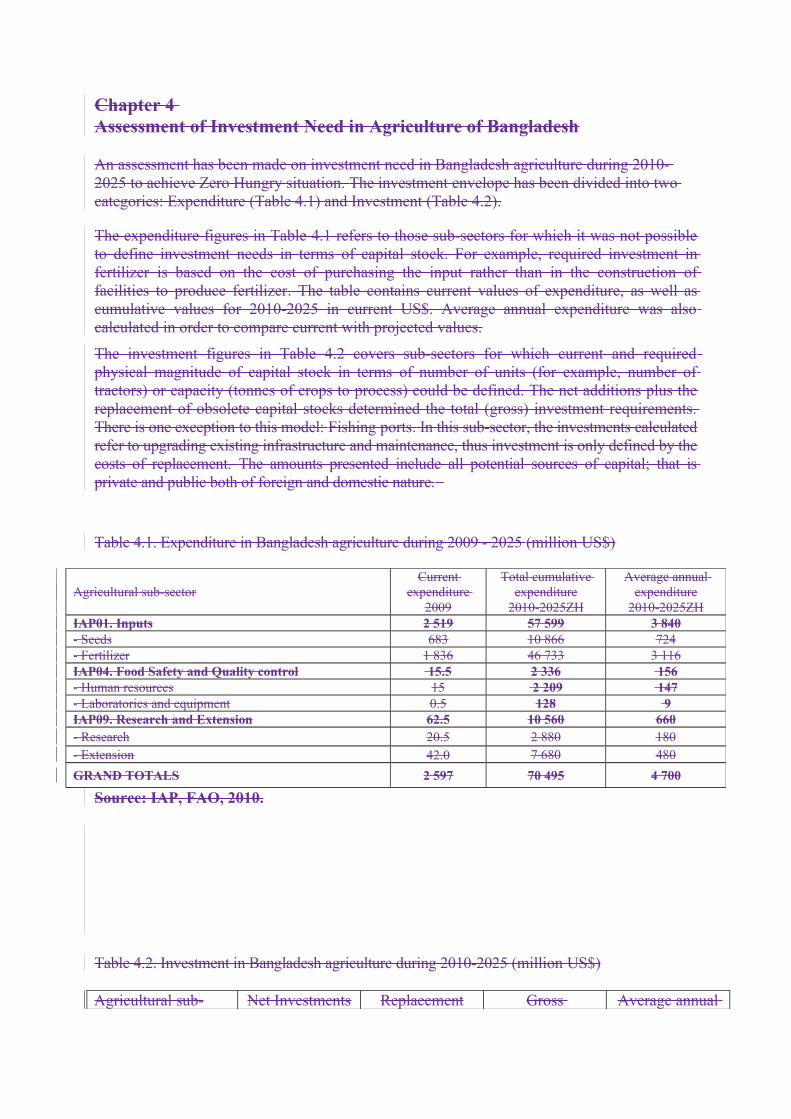
Chapter 4 Assessment of Investment Need in Agriculture of Bangladesh
An assessment has been made on investment need in Bangladesh agriculture during 2010- 2025 to achieve Zero Hungry situation. The investment envelope has been divided into two categories: Expenditure (Table 4.1) and Investment (Table 4.2).
The expenditure figures in Table 4.1 refers to those sub-sectors for which it was not possible to define investment needs in terms of capital stock. For example, required investment in fertilizer is based on the cost of purchasing the input rather than in the construction of facilities to produce fertilizer. The table contains current values of expenditure, as well as cumulative values for 2010-2025 in current US$. Average annual expenditure was also calculated in order to compare current with projected values.
The investment figures in Table 4.2 covers sub-sectors for which current and required physical magnitude of capital stock in terms of number of units (for example, number of tractors) or capacity (tonnes of crops to process) could be defined. The net additions plus the replacement of obsolete capital stocks determined the total (gross) investment requirements. There is one exception to this model: Fishing ports. In this sub-sector, the investments calculated refer to upgrading existing infrastructure and maintenance, thus investment is only defined by the costs of replacement. The amounts presented include all potential sources of capital; that is private and public both of foreign and domestic nature.
Table 4.1. Expenditure in Bangladesh agriculture during 2009 - 2025 (million US$)
Source: IAP, FAO, 2010.
Table 4.2. Investment in Bangladesh agriculture during 2010-2025 (million US$)
Agricultural sub- Net Investments Replacement Gross Average annual
Agricultural sub-sectorCurrent
expenditure 2009
Total cumulative expenditure
2010-2025ZH
Average annual expenditure
2010-2025ZHIAP01. Inputs 2 519 57 599 3 840- Seeds 683 10 866 724- Fertilizer 1 836 46 733 3 116IAP04. Food Safety and Quality control 15.5 2 336 156- Human resources 15 2 209 147- Laboratories and equipment 0.5 128 9IAP09. Research and Extension 62.5 10 560 660- Research 20.5 2 880 180- Extension 42.0 7 680 480
GRAND TOTALS 2 597 70 495 4 700
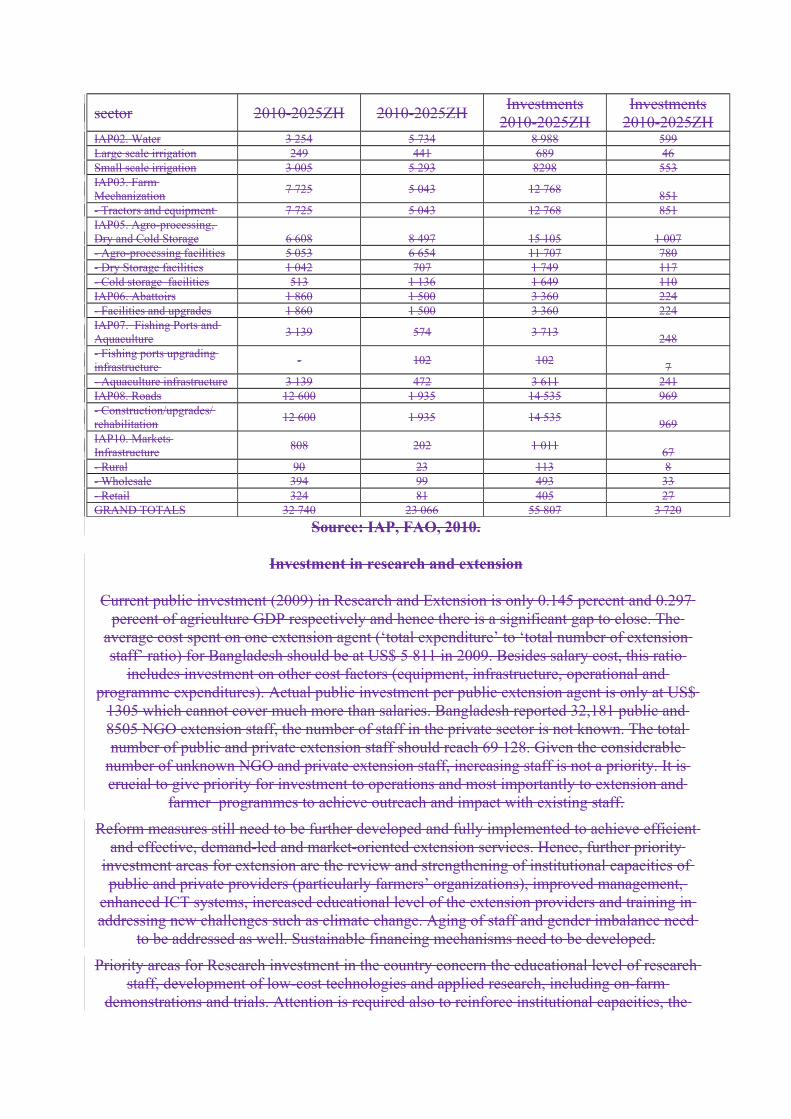
sector 2010-2025ZH 2010-2025ZHInvestments
2010-2025ZHInvestments
2010-2025ZHIAP02. Water 3 254 5 734 8 988 599Large scale irrigation 249 441 689 46Small scale irrigation 3 005 5 293 8298 553IAP03. Farm Mechanization
7 725 5 043 12 768851
- Tractors and equipment 7 725 5 043 12 768 851IAP05. Agro-processing, Dry and Cold Storage 6 608 8 497 15 105 1 007- Agro-processing facilities 5 053 6 654 11 707 780- Dry Storage facilities 1 042 707 1 749 117- Cold storage facilities 513 1 136 1 649 110IAP06. Abattoirs 1 860 1 500 3 360 224- Facilities and upgrades 1 860 1 500 3 360 224IAP07. Fishing Ports and Aquaculture
3 139 574 3 713248
- Fishing ports upgrading infrastructure
- 102 1027
- Aquaculture infrastructure 3 139 472 3 611 241IAP08. Roads 12 600 1 935 14 535 969- Construction/upgrades/ rehabilitation
12 600 1 935 14 535969
IAP10. Markets Infrastructure
808 202 1 01167
- Rural 90 23 113 8- Wholesale 394 99 493 33- Retail 324 81 405 27GRAND TOTALS 32 740 23 066 55 807 3 720
Source: IAP, FAO, 2010.
Investment in research and extension
Current public investment (2009) in Research and Extension is only 0.145 percent and 0.297 percent of agriculture GDP respectively and hence there is a significant gap to close. The
average cost spent on one extension agent (‘total expenditure’ to ‘total number of extension staff’ ratio) for Bangladesh should be at US$ 5 811 in 2009. Besides salary cost, this ratio
includes investment on other cost factors (equipment, infrastructure, operational and programme expenditures). Actual public investment per public extension agent is only at US$
1305 which cannot cover much more than salaries. Bangladesh reported 32,181 public and 8505 NGO extension staff, the number of staff in the private sector is not known. The total number of public and private extension staff should reach 69 128. Given the considerable
number of unknown NGO and private extension staff, increasing staff is not a priority. It is crucial to give priority for investment to operations and most importantly to extension and
farmer programmes to achieve outreach and impact with existing staff.
Reform measures still need to be further developed and fully implemented to achieve efficient and effective, demand-led and market-oriented extension services. Hence, further priority
investment areas for extension are the review and strengthening of institutional capacities of public and private providers (particularly farmers’ organizations), improved management,
enhanced ICT systems, increased educational level of the extension providers and training in addressing new challenges such as climate change. Aging of staff and gender imbalance need
to be addressed as well. Sustainable financing mechanisms need to be developed.
Priority areas for Research investment in the country concern the educational level of research staff, development of low-cost technologies and applied research, including on-farm
demonstrations and trials. Attention is required also to reinforce institutional capacities, the
management of research and provision of necessary research facilities. Better coordination between higher education institutes and the national agricultural research institutes is also needed. A key area of research investment will be the development of new crop varieties through collaborative breeding programmes with regional and international agriculture
research centres as well as the private sector. Imported varieties will need to be rigorously screened and, if necessary, crossed with local varieties to provide the right traits for
production and consumption in Bangladesh. Extension services will have the important role of introducing the new varieties to farmers through demonstrations, trials and media. Finally,
more emphasis should be given to research regarding animal production and fisheries.
Investment on sustainable supply of inputs
Seeds: In an effort to improve current seed production facilities, which are found to be inadequate for both foundation and certified seed production units, the Ministry of
Agriculture has developed and implemented a special action programme for the production and utilization of quality seeds of various major crops including rice, wheat, maize, jute, pulse, oilseed, vegetables and potato. The current involvement of the private sector in
supplying quality seeds to farmers is also encouraging. Field equipment, processing facilities, safe storage facilities, technical assistance/ training are the major areas to improve.
Seeds of adapted improved varieties will be an essential element in improving agriculture production and food security. Improved seed will need to be
used along with improved fertilizer management, better production practices including Integrated Pest Management,
more and improved irrigation systems, and appropriate mechanization.
The expenditure requirement for seed is needed to increase the use of certified seed from the current 16-30 percent up to 50 percent in order to achieve the yields necessary for food security in Bangladesh. In addition to this, it is most likely
that hybrid rice will increase the need for farmers to buy seed every year. This would also imply an increase in certified
seed for cereals, pulses and oilseeds from current estimated 129 000 tonnes (2009) to 231 000 tonnes in the 2025ZH
scenario. Additionally, most seed production facilities will need to be refurbished and much of the equipment replaced by 2025. The investment in seed production is relatively modest compared to the investment required by farmers to purchase
seed before each planting season.
Besides grains, increased production in fruits and vegetables will be required, contributing to the improvements in diets and nutrition. The country may wish to provide specific attention
to the production of planting materials of important food crops such as potatoes, sweet potatoes, bananas and fruit trees. This support must include large scale tissue culture
laboratories capable of producing high quality disease free planting materials and associated facilities. In addition, special attention is needed to increase the capacity for vegetable seed
production and vegetable seed processing facilities that can be used for a range of vegetables. The development of new varieties by research will be essential, particularly for adaptation to
climate change.
Key Statistics:
Total seed use - Major crops (2005-06): 805 376 tonnes
Certified and TLS* – Major crops (2005-06): 149 468 (18.5 % of seed use)
Inorganic (N, P, K) fertilizer use (2008): 1.3 million tonnes
Imported inorganic fertilizer (2008): 39%
*TLS: Truthfully Labelled Seed
Fertilizer: The expansion of irrigation combined with a declining efficiency of existing fertilizer plants has lead to a shortage in domestic fertilizer production, leaving the country dependent upon imported fertilizers. To increase the domestic production, seven investment
projects have been included in the Annual Development Programme (ADP) 2009-10. Additionally, fertilizer prices are distorted by subsidies (particularly Urea). This, along with a
lack of farmer technical knowledge, has led to an unbalanced use of fertilizers.
To feed the growing population in 2025, it is estimated that fertilizer consumption (NPK) has to increase from 1.38 million tonnes in 2008 to 2.86 million tonnes. Achieving production
target by increasing fertilizer use without taking in to account soil health would be derogative to agricultural sustainability and may be irreversible in the long run leading to serious
problems.
Development of indigenous fertilizer production capabilities are limited in Banlgadesh Although most of the nitrogen requirement can be produced in the country, Bangladesh has to depend on import for most of its P and entire amount of K requirements. To meet the growing requirement of fertilizers, serious considerations should be given on the following: (i) Review
of under-performing units and debottlenecking/modernization of these units; (ii) assuring adequate gas supply to the factories for uninterrupted production; (iii) Installing 2 more factories (one each in the north and west zone) with most advance technologies with an
annual capacity of 0.5 million tonnes urea each; (iv) Exploring joint venture opportunities, especially for phosphoric acid and/or finished products of DAP and TSP; (v) Creating
facilities for production of one or two most popular/recommended NPK/NPKS complex fertilizer grades, considering divesting of under-performing plants to private sector and
carrying out comprehensive raw material surveys.
Investment in water management and irrigation
Currently, the irrigation potential is estimated at 6.93 million ha. The total irrigated area represents around 56 percent of the country’s net cultivable area and almost 75 percent of the irrigation potential. Most of the water for irrigation is provided by groundwater (power pumps and tube wells), accounting for 79 percent of the water used. The rest is provided by surface
water (21 percent). During 2006, there were 29 170 Deep tubewells (DTW), 1 202 720 shallow tubewells (STW) and 107 290 low lift pumps (LLP)
In Bangladesh, public sector involvement in irrigation water management (IWM) is shared among three Ministries. Minor irrigation and small-scale surface irrigation schemes lie under the jurisdiction of the Ministry of Agriculture (MoA) and the Ministry of Local Government,
Rural Development and Cooperatives (LG&RD), respectively. Large-scale irrigation schemes, including FCD projects, are under the Ministry of Water Resources (MoWR).
The government’s National Water Plan (1991) set a target of expanding irrigation coverage to its maximum potential limit by the year 2025. This irrigation
expansion would mean an increase in area equipped for irrigation from current 5.17 million ha to 6.93 million ha,
reflected in net investments of around 3.2 billion US$. However, due to its high importance, operation, maintenance
and rehabilitation of irrigation would account for a larger share of the Gross Investment (almost 68 percent) reaching up
to 5.7 billion US$. The implications are clear: water
Key Statistics:
Total area equipped for irrigation (2008): 5 170 000 ha
Irrigation potential (2008): 6 933 000 ha
Source of water: Surface (21%), Groundwater (79%)
Water withdrawals (2002): 3% of TARWR
Dam capacity (2007): 20.30 km3
S
management geared towards higher efficiencies and productivities in existing infrastructure with lower emphasis on new irrigation development.
Projected investment in the water sector acknowledges the importance of atomistic irrigation in the country and as such, small scale irrigation projects would account for around 90 percent of gross investment. However, investment in large-scale water resource infrastructure would
also be required for the purpose of recharging or supplying the rural landscapes with bulk water supply rather than classical large-scale irrigation infrastructure. This type of
infrastructure development may take place in Bangladesh in the form of dykes.
Other water investment activities would include the dredging of the main reservoirs, construction of hydraulic polders, improved irrigation water distribution system as well as drilling of tube wells into the deep aquifers in order to avoid arsenic contaminated water
lifting.
The main source of irrigation water during the last decade has been groundwater. There is a question of risky overdependence of utilizing groundwater due to quality constraints and
some emergent environmental consequences. Thus investment will also include the improvement of surface water systems, especially in the North, by digging canals, excavating
and dredging rivers, which have lost their water-holding and water flowing capacity. Other activities would include the expansion of tubewell irrigation through Force Mode Tubewells (FMTWs); surface water conservation and rainwater harvesting using Rubber dams in small and medium rivers; new low-cost major irrigation schemes (gravity flow system); and larger
floating pumps, particularly in the south-eastern part of the country.
Investment on Farm Mechanization
Farm mechanization remains at relatively low development levels with hand and animal powered equipment still representing a large component. In
terms of mechanization, currently 2-wheel tractors, threshers, maize shellers and seeders are most common, whereas the
high cost of 4-wheel tractors (> 80hp) or powered combines has curtailed their availability. From 2006 the increase of 2-
wheel tractors and power tillers has been rapid and it is expected to continue further in future years.
The private sector is responsible for providing the majority of farm implements as it imports modern equipment yearly
according to demand. A small domestic manufacturing effort of equipment is also underway, mostly related to
complementary field equipment in the form of ploughs, harrows, trailers and manual threshers. The necessity for new
investments in farm mechanization have been recognized in the country’s Actionable Policy Brief, Country investment plan and future agricultural development programmes are expected
to benefit this sub-sector.
For Bangladesh to meet food targets to a desired ZH situation by 2025 it has been estimated that two wheel tractor population would have to increase at least three fold, from current 350 000 units to at least 1 000 000 units. The same applies to four wheel tractors (25-80 hp) for
which population would need to increase from 21 000 to around 57 000 units. Fulfilling these farm mechanization needs calls for a gross investment of 12 768 million US$ in tractors and
Key Survey Statistics:
Number of machinery and equipment used (2008)3:
- Two wheel tractors: 350 000
- Four wheel tractors (25-80 hp):
21 000
- Four wheel tractors (>80 hp): 0
Plans of imports 2-wheel tractors (2010): 7 901
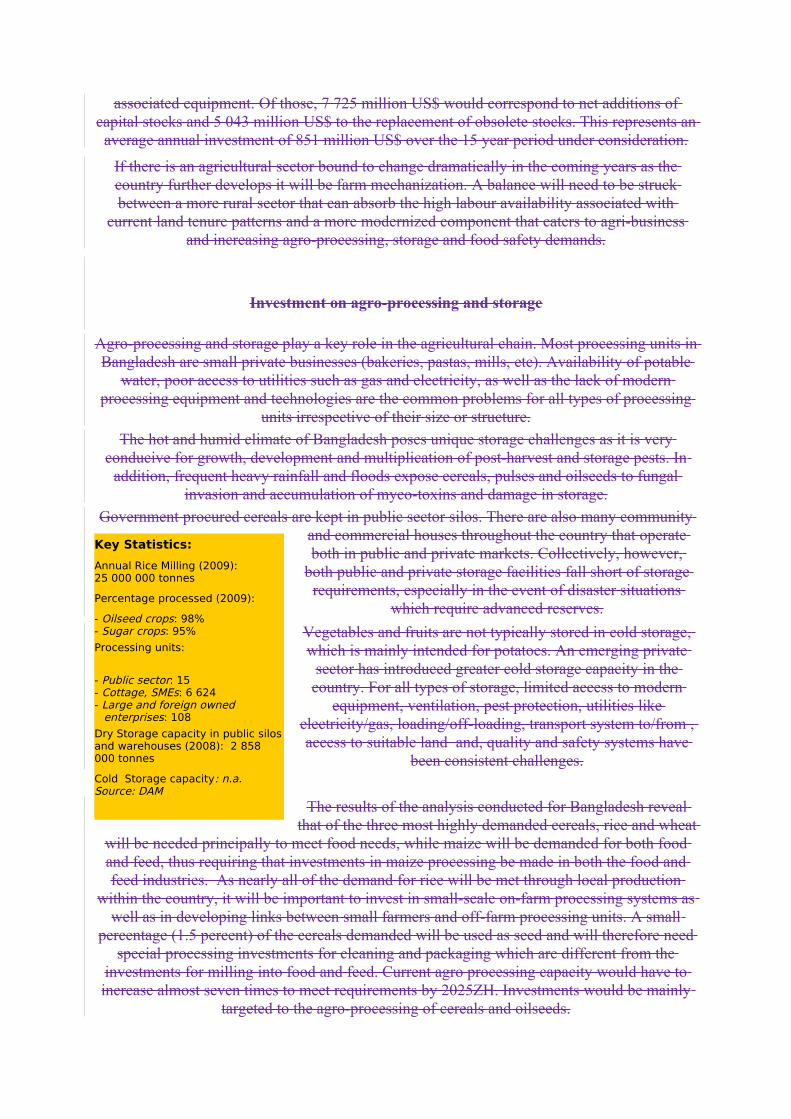
associated equipment. Of those, 7 725 million US$ would correspond to net additions of capital stocks and 5 043 million US$ to the replacement of obsolete stocks. This represents an average annual investment of 851 million US$ over the 15 year period under consideration.
If there is an agricultural sector bound to change dramatically in the coming years as the country further develops it will be farm mechanization. A balance will need to be struck between a more rural sector that can absorb the high labour availability associated with
current land tenure patterns and a more modernized component that caters to agri-business and increasing agro-processing, storage and food safety demands.
Investment on agro-processing and storage
Agro-processing and storage play a key role in the agricultural chain. Most processing units in Bangladesh are small private businesses (bakeries, pastas, mills, etc). Availability of potable
water, poor access to utilities such as gas and electricity, as well as the lack of modern processing equipment and technologies are the common problems for all types of processing
units irrespective of their size or structure.
The hot and humid climate of Bangladesh poses unique storage challenges as it is very conducive for growth, development and multiplication of post-harvest and storage pests. In
addition, frequent heavy rainfall and floods expose cereals, pulses and oilseeds to fungal invasion and accumulation of myco-toxins and damage in storage.
Government procured cereals are kept in public sector silos. There are also many community and commercial houses throughout the country that operate both in public and private markets. Collectively, however,
both public and private storage facilities fall short of storage requirements, especially in the event of disaster situations
which require advanced reserves.
Vegetables and fruits are not typically stored in cold storage, which is mainly intended for potatoes. An emerging private
sector has introduced greater cold storage capacity in the country. For all types of storage, limited access to modern
equipment, ventilation, pest protection, utilities like electricity/gas, loading/off-loading, transport system to/from , access to suitable land and, quality and safety systems have
been consistent challenges.
The results of the analysis conducted for Bangladesh reveal that of the three most highly demanded cereals, rice and wheat
will be needed principally to meet food needs, while maize will be demanded for both food and feed, thus requiring that investments in maize processing be made in both the food and feed industries. As nearly all of the demand for rice will be met through local production
within the country, it will be important to invest in small-scale on-farm processing systems as well as in developing links between small farmers and off-farm processing units. A small
percentage (1.5 percent) of the cereals demanded will be used as seed and will therefore need special processing investments for cleaning and packaging which are different from the
investments for milling into food and feed. Current agro processing capacity would have to increase almost seven times to meet requirements by 2025ZH. Investments would be mainly
targeted to the agro-processing of cereals and oilseeds.
Key Statistics:
Annual Rice Milling (2009):25 000 000 tonnes
Percentage processed (2009):
- Oilseed crops: 98%- Sugar crops: 95%
Processing units:
- Public sector: 15- Cottage, SMEs: 6 624- Large and foreign owned
enterprises: 108
Dry Storage capacity in public silos and warehouses (2008): 2 858 000 tonnes
Cold Storage capacity: n.a.Source: DAM

About 99 percent of maize demand and 62 percent of wheat demand in 2025ZH will be met through imports. This will necessitate putting into place appropriate storage facilities to
receive these grains at seaports and logistics systems for moving the grain subsequently to processing sites. Both dry and cold storage capacity would have to increase four times
between 2010 and 2025. to meet needs.
Banglasdesh’s current situation in relation to agro-processing and storage portraits a left behind sub-sector far from being able to cope with basic needs. To reach the required 2025ZH conditions it is necessary to pursue an all out effort to significantly revamp present facilities
through both proper upgrading and new construction. Fortunately there are already indications that the private sector is beginning to move in to fill in gaps. Government policies should be designed to encourage this private investment. In the long run, only very basic and perhaps
strategic components of food agro-processing should be kept under the watch of the government.
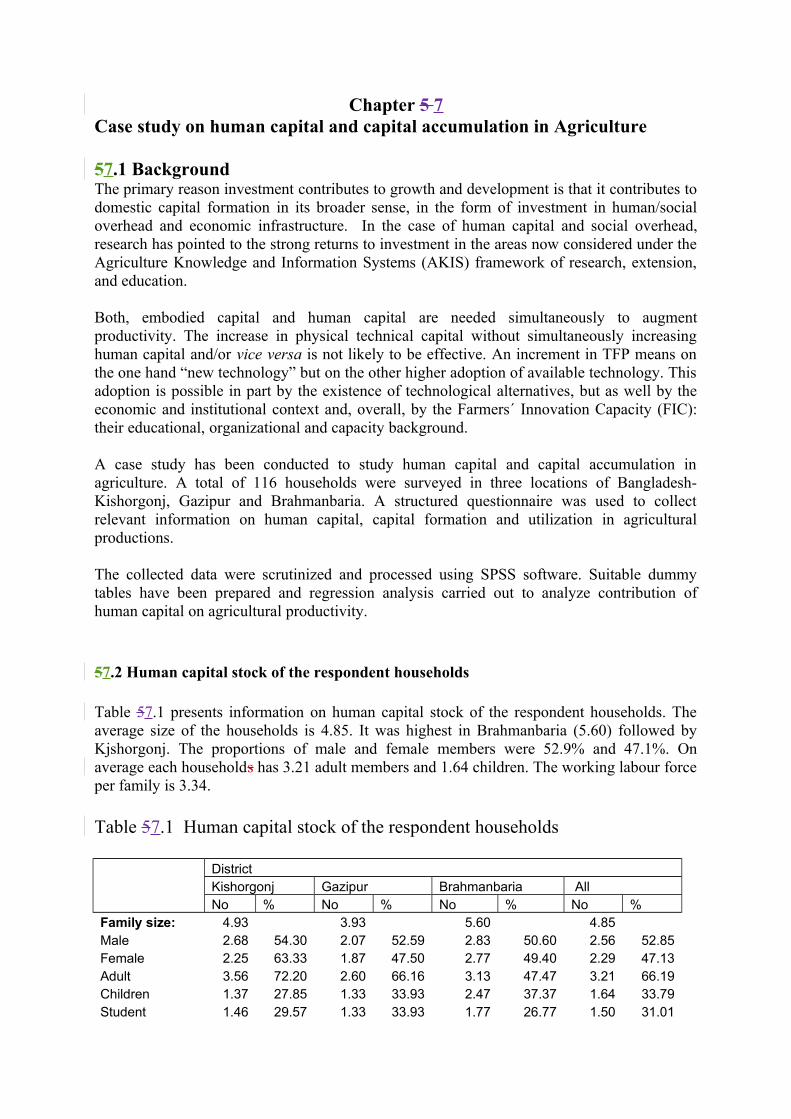
Chapter 5 7Case study on human capital and capital accumulation in Agriculture
57.1 BackgroundThe primary reason investment contributes to growth and development is that it contributes to domestic capital formation in its broader sense, in the form of investment in human/social overhead and economic infrastructure. In the case of human capital and social overhead, research has pointed to the strong returns to investment in the areas now considered under the Agriculture Knowledge and Information Systems (AKIS) framework of research, extension, and education.
Both, embodied capital and human capital are needed simultaneously to augment productivity. The increase in physical technical capital without simultaneously increasing human capital and/or vice versa is not likely to be effective. An increment in TFP means on the one hand “new technology” but on the other higher adoption of available technology. This adoption is possible in part by the existence of technological alternatives, but as well by the economic and institutional context and, overall, by the Farmers´ Innovation Capacity (FIC): their educational, organizational and capacity background.
A case study has been conducted to study human capital and capital accumulation in agriculture. A total of 116 households were surveyed in three locations of Bangladesh- Kishorgonj, Gazipur and Brahmanbaria. A structured questionnaire was used to collect relevant information on human capital, capital formation and utilization in agricultural productions.
The collected data were scrutinized and processed using SPSS software. Suitable dummy tables have been prepared and regression analysis carried out to analyze contribution of human capital on agricultural productivity.
57.2 Human capital stock of the respondent households
Table 57.1 presents information on human capital stock of the respondent households. The average size of the households is 4.85. It was highest in Brahmanbaria (5.60) followed by Kjshorgonj. The proportions of male and female members were 52.9% and 47.1%. On average each households has 3.21 adult members and 1.64 children. The working labour force per family is 3.34.
Table 57.1 Human capital stock of the respondent households
District Kishorgonj Gazipur Brahmanbaria AllNo % No % No % No %
Family size: 4.93 3.93 5.60 4.85 Male 2.68 54.30 2.07 52.59 2.83 50.60 2.56 52.85Female 2.25 63.33 1.87 47.50 2.77 49.40 2.29 47.13Adult 3.56 72.20 2.60 66.16 3.13 47.47 3.21 66.19Children 1.37 27.85 1.33 33.93 2.47 37.37 1.64 33.79Student 1.46 29.57 1.33 33.93 1.77 26.77 1.50 31.01
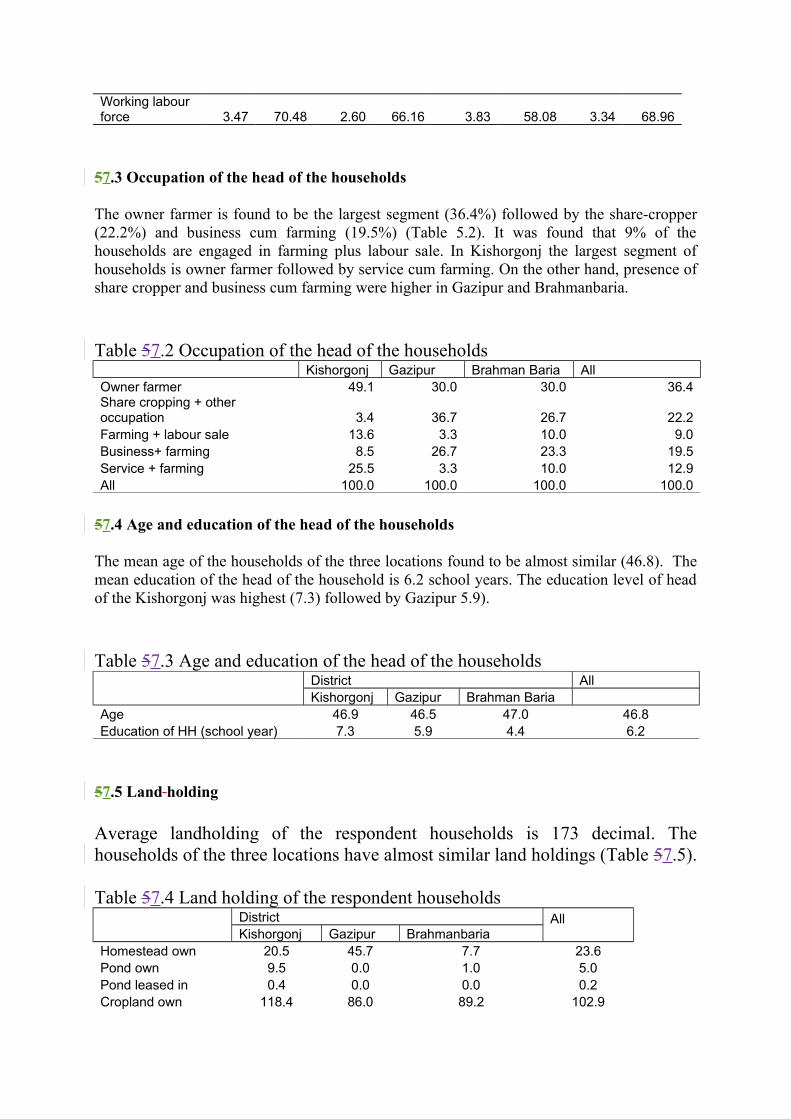
Working labour force 3.47 70.48 2.60 66.16 3.83 58.08 3.34 68.96
57.3 Occupation of the head of the households
The owner farmer is found to be the largest segment (36.4%) followed by the share-cropper (22.2%) and business cum farming (19.5%) (Table 5.2). It was found that 9% of the households are engaged in farming plus labour sale. In Kishorgonj the largest segment of households is owner farmer followed by service cum farming. On the other hand, presence of share cropper and business cum farming were higher in Gazipur and Brahmanbaria.
Table 57.2 Occupation of the head of the households Kishorgonj Gazipur Brahman Baria AllOwner farmer 49.1 30.0 30.0 36.4Share cropping + other occupation 3.4 36.7 26.7 22.2Farming + labour sale 13.6 3.3 10.0 9.0Business+ farming 8.5 26.7 23.3 19.5Service + farming 25.5 3.3 10.0 12.9All 100.0 100.0 100.0 100.0
57.4 Age and education of the head of the households
The mean age of the households of the three locations found to be almost similar (46.8). The mean education of the head of the household is 6.2 school years. The education level of head of the Kishorgonj was highest (7.3) followed by Gazipur 5.9).
Table 57.3 Age and education of the head of the households
District AllKishorgonj Gazipur Brahman Baria
Age 46.9 46.5 47.0 46.8Education of HH (school year) 7.3 5.9 4.4 6.2
57.5 Land holding
Average landholding of the respondent households is 173 decimal. The households of the three locations have almost similar land holdings (Table 57.5).
Table 57.4 Land holding of the respondent households
District All
Kishorgonj Gazipur BrahmanbariaHomestead own 20.5 45.7 7.7 23.6Pond own 9.5 0.0 1.0 5.0Pond leased in 0.4 0.0 0.0 0.2Cropland own 118.4 86.0 89.2 102.9
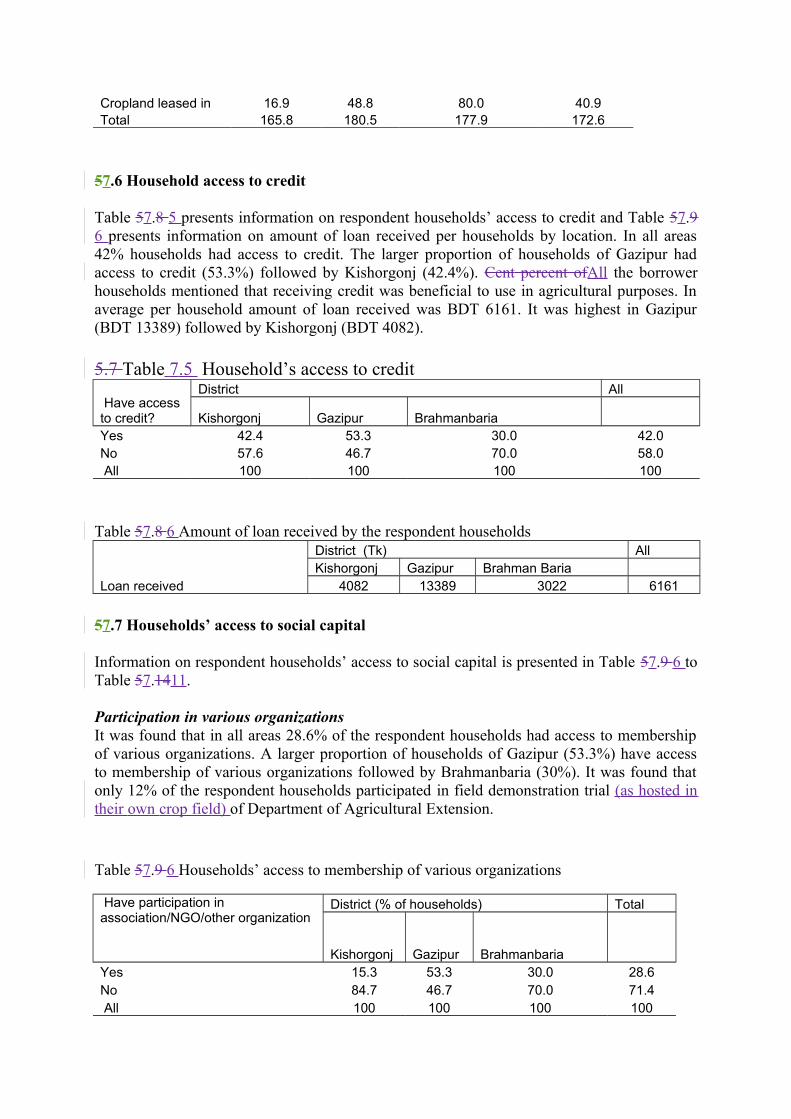
Cropland leased in 16.9 48.8 80.0 40.9Total 165.8 180.5 177.9 172.6
57.6 Household access to credit
Table 57.8 5 presents information on respondent households’ access to credit and Table 57.9 6 presents information on amount of loan received per households by location. In all areas 42% households had access to credit. The larger proportion of households of Gazipur had access to credit (53.3%) followed by Kishorgonj (42.4%). Cent percent ofAll the borrower households mentioned that receiving credit was beneficial to use in agricultural purposes. In average per household amount of loan received was BDT 6161. It was highest in Gazipur (BDT 13389) followed by Kishorgonj (BDT 4082).
5.7 Table 7.5 Household’s access to credit Have access to credit?
District All
Kishorgonj Gazipur Brahmanbaria Yes 42.4 53.3 30.0 42.0No 57.6 46.7 70.0 58.0 All 100 100 100 100
Table 57.8 6 Amount of loan received by the respondent households
District (Tk) AllKishorgonj Gazipur Brahman Baria
Loan received 4082 13389 3022 6161
57.7 Households’ access to social capital
Information on respondent households’ access to social capital is presented in Table 57.9 6 to Table 57.1411.
Participation in various organizationsIt was found that in all areas 28.6% of the respondent households had access to membership of various organizations. A larger proportion of households of Gazipur (53.3%) have access to membership of various organizations followed by Brahmanbaria (30%). It was found that only 12% of the respondent households participated in field demonstration trial (as hosted in their own crop field) of Department of Agricultural Extension.
Table 57.9 6 Households’ access to membership of various organizations
Have participation in association/NGO/other organization
District (% of households) Total
Kishorgonj Gazipur Brahmanbaria Yes 15.3 53.3 30.0 28.6No 84.7 46.7 70.0 71.4 All 100 100 100 100
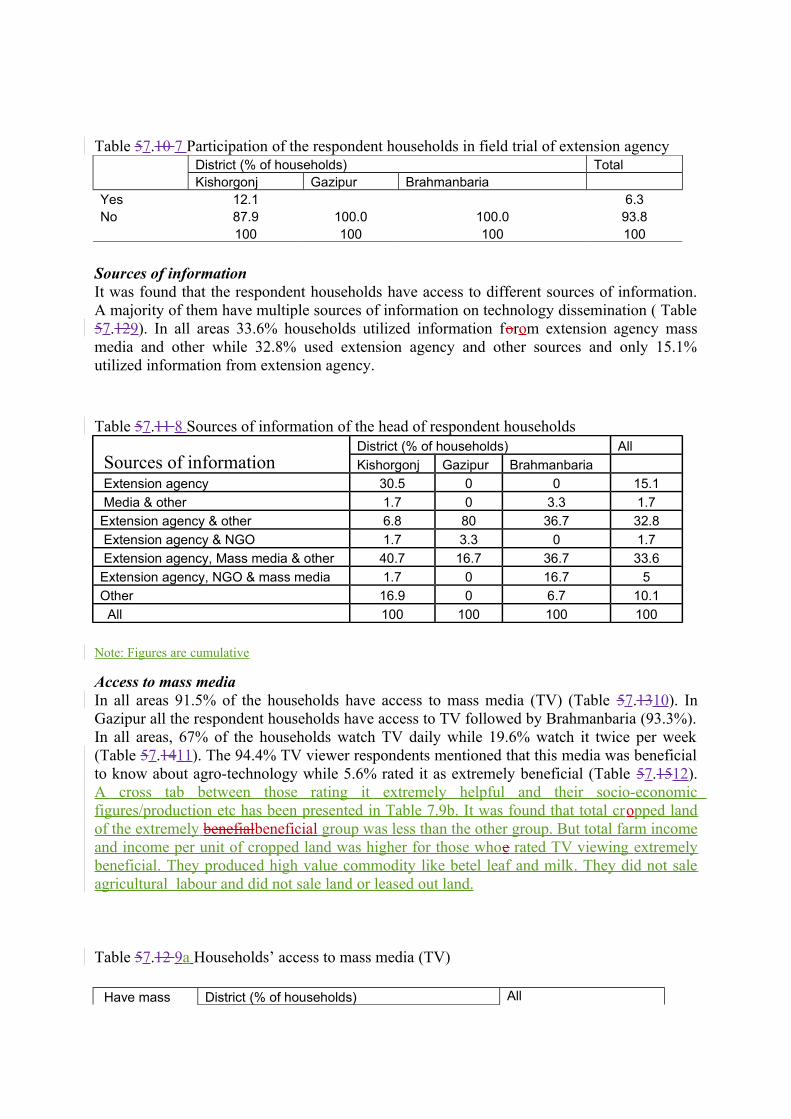
Table 57.10 7 Participation of the respondent households in field trial of extension agency
District (% of households) TotalKishorgonj Gazipur Brahmanbaria
Yes 12.1 6.3No 87.9 100.0 100.0 93.8 100 100 100 100
Sources of informationIt was found that the respondent households have access to different sources of information. A majority of them have multiple sources of information on technology dissemination ( Table 57.129). In all areas 33.6% households utilized information forom extension agency mass media and other while 32.8% used extension agency and other sources and only 15.1% utilized information from extension agency.
Table 57.11 8 Sources of information of the head of respondent households
Sources of informationDistrict (% of households) All
Kishorgonj Gazipur Brahmanbaria
Extension agency 30.5 0 0 15.1
Media & other 1.7 0 3.3 1.7
Extension agency & other 6.8 80 36.7 32.8
Extension agency & NGO 1.7 3.3 0 1.7
Extension agency, Mass media & other 40.7 16.7 36.7 33.6
Extension agency, NGO & mass media 1.7 0 16.7 5
Other 16.9 0 6.7 10.1
All 100 100 100 100
Note: Figures are cumulative
Access to mass mediaIn all areas 91.5% of the households have access to mass media (TV) (Table 57.1310). In Gazipur all the respondent households have access to TV followed by Brahmanbaria (93.3%). In all areas, 67% of the households watch TV daily while 19.6% watch it twice per week (Table 57.1411). The 94.4% TV viewer respondents mentioned that this media was beneficial to know about agro-technology while 5.6% rated it as extremely beneficial (Table 57.1512). A cross tab between those rating it extremely helpful and their socio-economic figures/production etc has been presented in Table 7.9b. It was found that total cropped land of the extremely benefialbeneficial group was less than the other group. But total farm income and income per unit of cropped land was higher for those whoe rated TV viewing extremely beneficial. They produced high value commodity like betel leaf and milk. They did not sale agricultural labour and did not sale land or leased out land.
Table 57.12 9a Households’ access to mass media (TV)
Have mass District (% of households) All
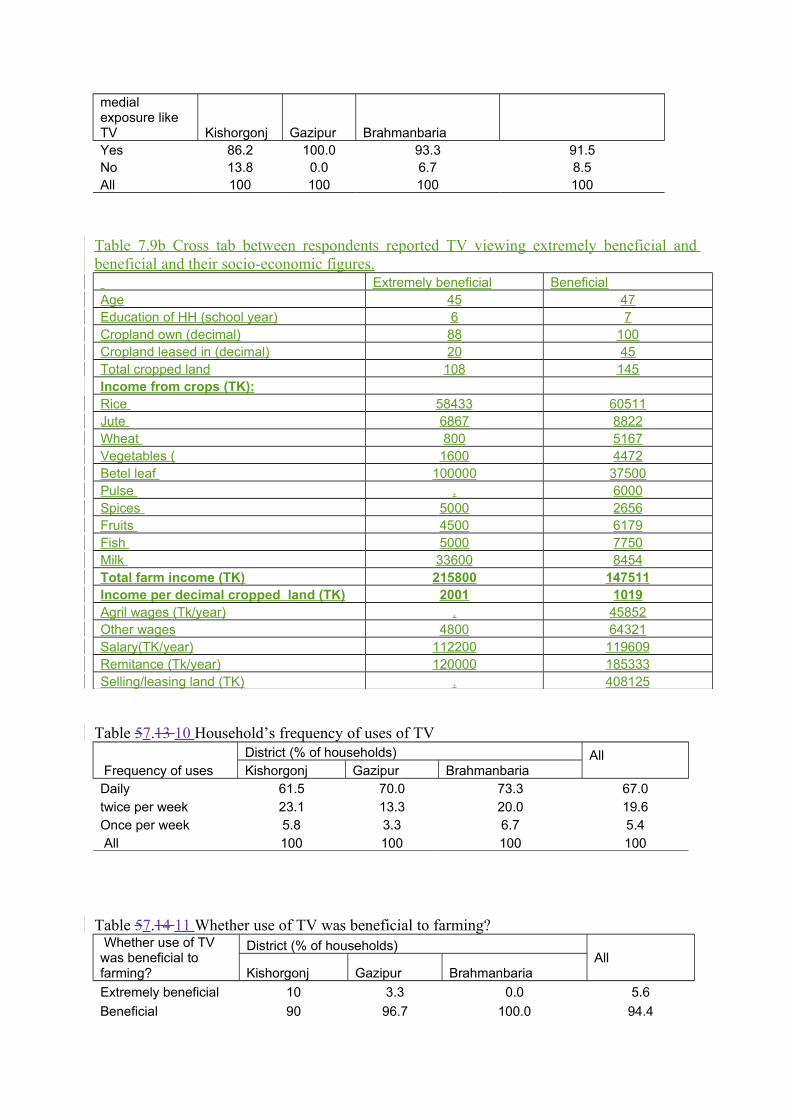
medial exposure like TV Kishorgonj Gazipur BrahmanbariaYes 86.2 100.0 93.3 91.5No 13.8 0.0 6.7 8.5All 100 100 100 100
Table 7.9b Cross tab between respondents reported TV viewing extremely beneficial and beneficial and their socio-economic figures. Extremely beneficial BeneficialAge 45 47Education of HH (school year) 6 7Cropland own (decimal) 88 100Cropland leased in (decimal) 20 45Total cropped land 108 145Income from crops (TK):Rice 58433 60511Jute 6867 8822Wheat 800 5167Vegetables ( 1600 4472Betel leaf 100000 37500Pulse . 6000Spices 5000 2656Fruits 4500 6179Fish 5000 7750Milk 33600 8454Total farm income (TK) 215800 147511Income per decimal cropped land (TK) 2001 1019Agril wages (Tk/year) . 45852Other wages 4800 64321Salary(TK/year) 112200 119609Remitance (Tk/year) 120000 185333Selling/leasing land (TK) . 408125
Table 57.13 10 Household’s frequency of uses of TV
Frequency of usesDistrict (% of households) All
Kishorgonj Gazipur BrahmanbariaDaily 61.5 70.0 73.3 67.0twice per week 23.1 13.3 20.0 19.6Once per week 5.8 3.3 6.7 5.4 All 100 100 100 100
Table 57.14 11 Whether use of TV was beneficial to farming? Whether use of TV was beneficial to farming?
District (% of households)All Kishorgonj Gazipur Brahmanbaria
Extremely beneficial 10 3.3 0.0 5.6
Beneficial 90 96.7 100.0 94.4
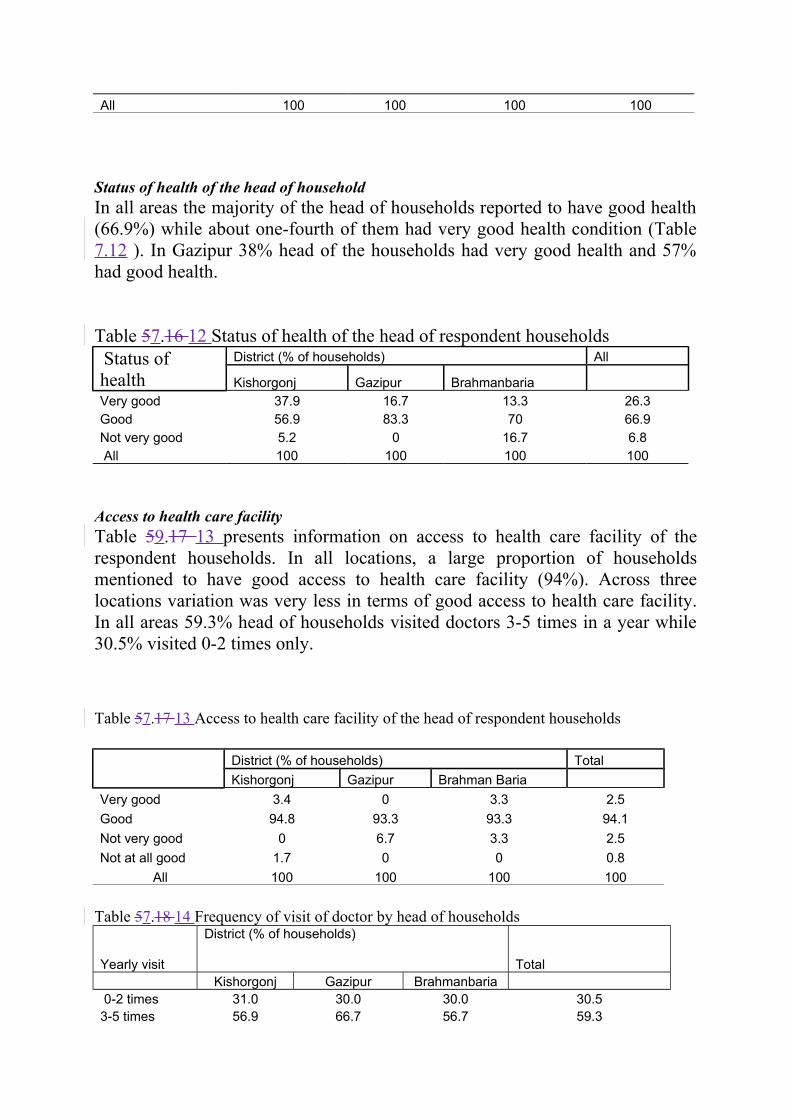
All 100 100 100 100
Status of health of the head of householdIn all areas the majority of the head of households reported to have good health (66.9%) while about one-fourth of them had very good health condition (Table 7.12 ). In Gazipur 38% head of the households had very good health and 57% had good health.
Table 57.16 12 Status of health of the head of respondent households Status of health
District (% of households) All
Kishorgonj Gazipur Brahmanbaria Very good 37.9 16.7 13.3 26.3Good 56.9 83.3 70 66.9Not very good 5.2 0 16.7 6.8 All 100 100 100 100
Access to health care facilityTable 59.17 13 presents information on access to health care facility of the respondent households. In all locations, a large proportion of households mentioned to have good access to health care facility (94%). Across three locations variation was very less in terms of good access to health care facility. In all areas 59.3% head of households visited doctors 3-5 times in a year while 30.5% visited 0-2 times only.
Table 57.17 13 Access to health care facility of the head of respondent households
District (% of households) Total
Kishorgonj Gazipur Brahman Baria
Very good 3.4 0 3.3 2.5
Good 94.8 93.3 93.3 94.1
Not very good 0 6.7 3.3 2.5
Not at all good 1.7 0 0 0.8
All 100 100 100 100
Table 57.18 14 Frequency of visit of doctor by head of households
Yearly visit
District (% of households) Total
Kishorgonj Gazipur Brahmanbaria 0-2 times 31.0 30.0 30.0 30.53-5 times 56.9 66.7 56.7 59.3
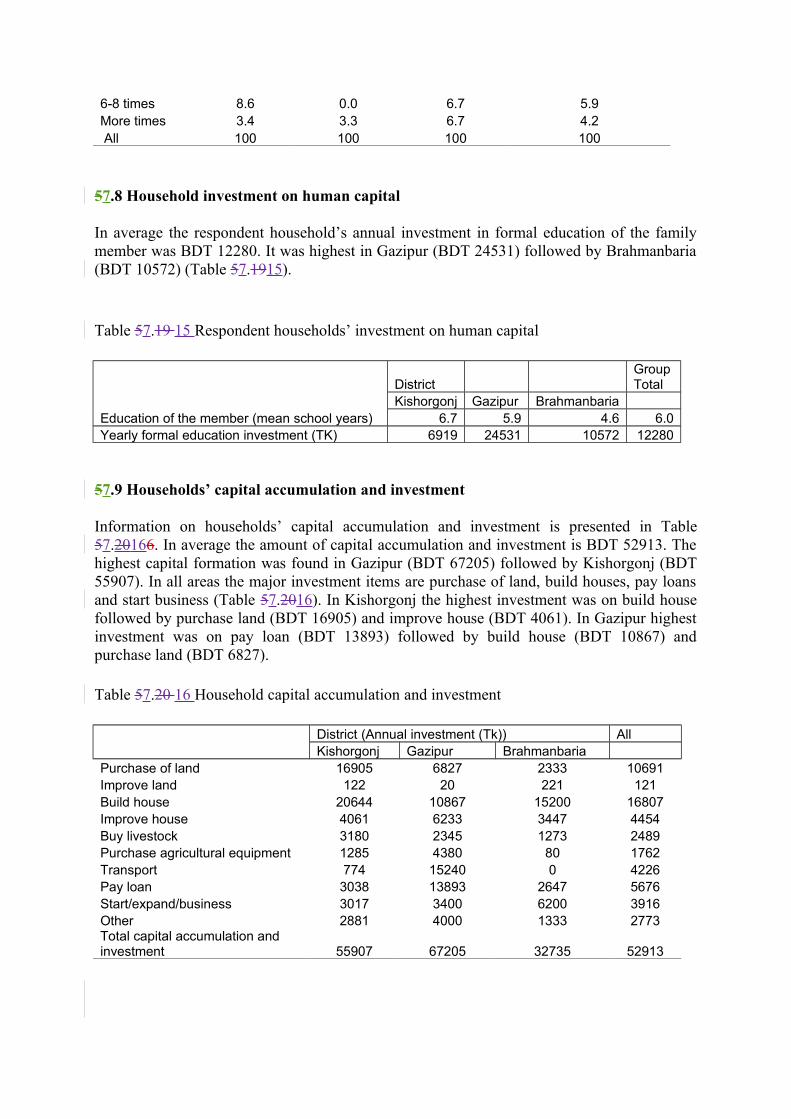
6-8 times 8.6 0.0 6.7 5.9More times 3.4 3.3 6.7 4.2 All 100 100 100 100
57.8 Household investment on human capital
In average the respondent household’s annual investment in formal education of the family member was BDT 12280. It was highest in Gazipur (BDT 24531) followed by Brahmanbaria (BDT 10572) (Table 57.1915).
Table 57.19 15 Respondent households’ investment on human capital
District
Group Total
Kishorgonj Gazipur Brahmanbaria Education of the member (mean school years) 6.7 5.9 4.6 6.0Yearly formal education investment (TK) 6919 24531 10572 12280
57.9 Households’ capital accumulation and investment
Information on households’ capital accumulation and investment is presented in Table 57.20166. In average the amount of capital accumulation and investment is BDT 52913. The highest capital formation was found in Gazipur (BDT 67205) followed by Kishorgonj (BDT 55907). In all areas the major investment items are purchase of land, build houses, pay loans and start business (Table 57.2016). In Kishorgonj the highest investment was on build house followed by purchase land (BDT 16905) and improve house (BDT 4061). In Gazipur highest investment was on pay loan (BDT 13893) followed by build house (BDT 10867) and purchase land (BDT 6827).
Table 57.20 16 Household capital accumulation and investment
District (Annual investment (Tk)) AllKishorgonj Gazipur Brahmanbaria
Purchase of land 16905 6827 2333 10691Improve land 122 20 221 121Build house 20644 10867 15200 16807Improve house 4061 6233 3447 4454Buy livestock 3180 2345 1273 2489Purchase agricultural equipment 1285 4380 80 1762Transport 774 15240 0 4226Pay loan 3038 13893 2647 5676Start/expand/business 3017 3400 6200 3916Other 2881 4000 1333 2773Total capital accumulation and investment 55907 67205 32735 52913
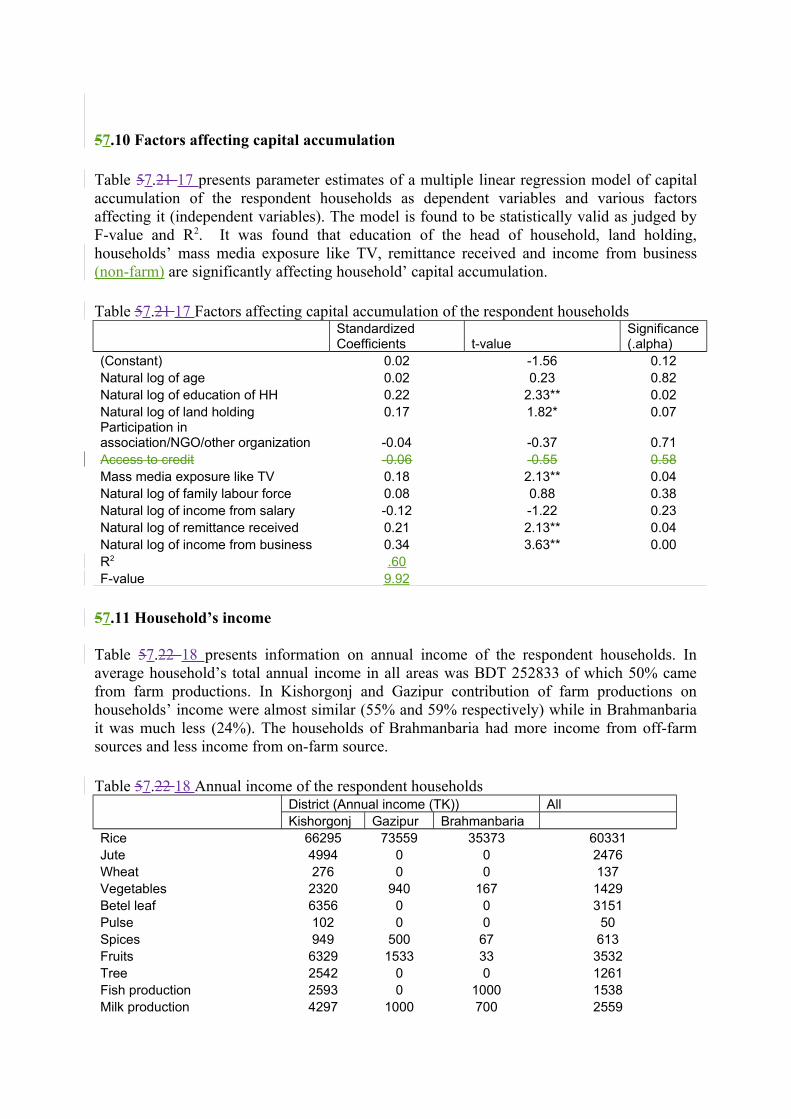
57.10 Factors affecting capital accumulation
Table 57.21 17 presents parameter estimates of a multiple linear regression model of capital accumulation of the respondent households as dependent variables and various factors affecting it (independent variables). The model is found to be statistically valid as judged by F-value and R2. It was found that education of the head of household, land holding, households’ mass media exposure like TV, remittance received and income from business
(non-farm) are significantly affecting household’ capital accumulation.
Table 57.21 17 Factors affecting capital accumulation of the respondent householdsStandardized Coefficients t-value
Significance (.alpha)
(Constant) 0.02 -1.56 0.12Natural log of age 0.02 0.23 0.82Natural log of education of HH 0.22 2.33** 0.02Natural log of land holding 0.17 1.82* 0.07Participation in association/NGO/other organization -0.04 -0.37 0.71Access to credit -0.06 -0.55 0.58Mass media exposure like TV 0.18 2.13** 0.04Natural log of family labour force 0.08 0.88 0.38Natural log of income from salary -0.12 -1.22 0.23Natural log of remittance received 0.21 2.13** 0.04Natural log of income from business 0.34 3.63** 0.00R2 .60F-value 9.92
57.11 Household’s income
Table 57.22 18 presents information on annual income of the respondent households. In average household’s total annual income in all areas was BDT 252833 of which 50% came from farm productions. In Kishorgonj and Gazipur contribution of farm productions on households’ income were almost similar (55% and 59% respectively) while in Brahmanbaria it was much less (24%). The households of Brahmanbaria had more income from off-farm sources and less income from on-farm source.
Table 57.22 18 Annual income of the respondent households
District (Annual income (TK)) AllKishorgonj Gazipur Brahmanbaria
Rice 66295 73559 35373 60331Jute 4994 0 0 2476Wheat 276 0 0 137Vegetables 2320 940 167 1429Betel leaf 6356 0 0 3151Pulse 102 0 0 50Spices 949 500 67 613Fruits 6329 1533 33 3532Tree 2542 0 0 1261Fish production 2593 0 1000 1538Milk production 4297 1000 700 2559
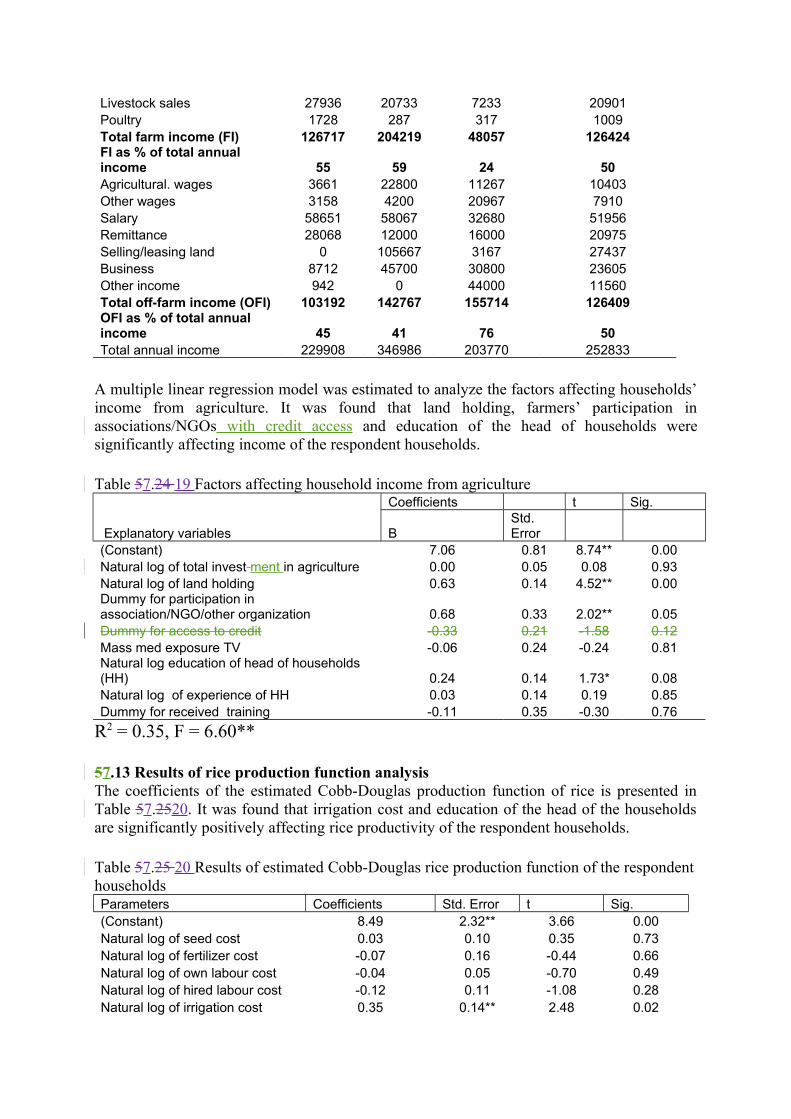
Livestock sales 27936 20733 7233 20901Poultry 1728 287 317 1009Total farm income (FI) 126717 204219 48057 126424FI as % of total annual income 55 59 24 50Agricultural. wages 3661 22800 11267 10403Other wages 3158 4200 20967 7910Salary 58651 58067 32680 51956Remittance 28068 12000 16000 20975Selling/leasing land 0 105667 3167 27437Business 8712 45700 30800 23605Other income 942 0 44000 11560Total off-farm income (OFI) 103192 142767 155714 126409OFI as % of total annual income 45 41 76 50Total annual income 229908 346986 203770 252833
A multiple linear regression model was estimated to analyze the factors affecting households’ income from agriculture. It was found that land holding, farmers’ participation in associations/NGOs with credit access and education of the head of households were significantly affecting income of the respondent households.
Table 57.24 19 Factors affecting household income from agriculture
Explanatory variables
Coefficients t Sig.
BStd. Error
(Constant) 7.06 0.81 8.74** 0.00Natural log of total invest ment in agriculture 0.00 0.05 0.08 0.93Natural log of land holding 0.63 0.14 4.52** 0.00Dummy for participation in association/NGO/other organization 0.68 0.33 2.02** 0.05Dummy for access to credit -0.33 0.21 -1.58 0.12Mass med exposure TV -0.06 0.24 -0.24 0.81Natural log education of head of households (HH) 0.24 0.14 1.73* 0.08Natural log of experience of HH 0.03 0.14 0.19 0.85Dummy for received training -0.11 0.35 -0.30 0.76
R2 = 0.35, F = 6.60** 57.13 Results of rice production function analysisThe coefficients of the estimated Cobb-Douglas production function of rice is presented in Table 57.2520. It was found that irrigation cost and education of the head of the households are significantly positively affecting rice productivity of the respondent households.
Table 57.25 20 Results of estimated Cobb-Douglas rice production function of the respondent householdsParameters Coefficients Std. Error t Sig.(Constant) 8.49 2.32** 3.66 0.00Natural log of seed cost 0.03 0.10 0.35 0.73Natural log of fertilizer cost -0.07 0.16 -0.44 0.66Natural log of own labour cost -0.04 0.05 -0.70 0.49Natural log of hired labour cost -0.12 0.11 -1.08 0.28Natural log of irrigation cost 0.35 0.14** 2.48 0.02

Natural log of age of head o household -0.27 0.17 -1.61 0.11Natural log of land holding 0.10 0.07 1.38 0.17Natural log of education of head of households 0.24 0.07** 3.64 0.00Natural log of family labour working in agriculture 0.15 0.15 1.02 0.31Natural log of total investment in agriculture 0.00 0.03 -0.17 0.87R2 .59
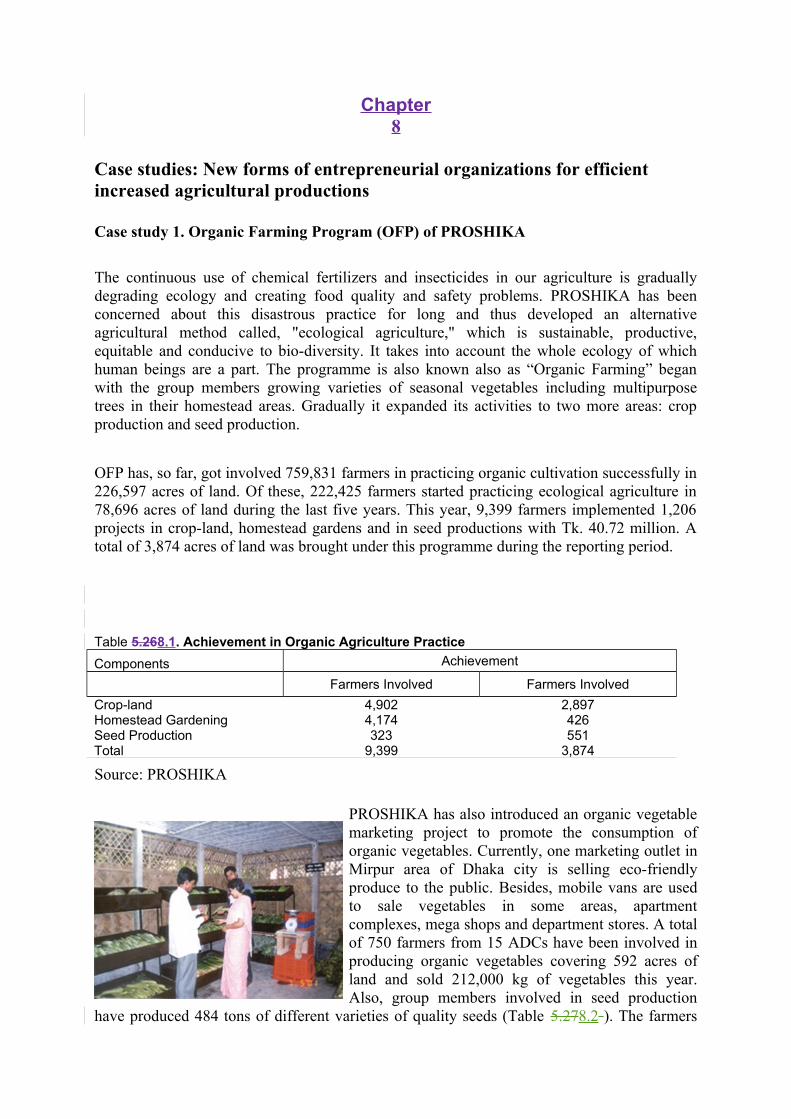
Chapter8
Case studies: New forms of entrepreneurial organizations for efficient increased agricultural productions
Case study 1. Organic Farming Program (OFP) of PROSHIKA
The continuous use of chemical fertilizers and insecticides in our agriculture is gradually degrading ecology and creating food quality and safety problems. PROSHIKA has been concerned about this disastrous practice for long and thus developed an alternative agricultural method called, "ecological agriculture," which is sustainable, productive, equitable and conducive to bio-diversity. It takes into account the whole ecology of which human beings are a part. The programme is also known also as “Organic Farming” began with the group members growing varieties of seasonal vegetables including multipurpose trees in their homestead areas. Gradually it expanded its activities to two more areas: crop production and seed production.
OFP has, so far, got involved 759,831 farmers in practicing organic cultivation successfully in 226,597 acres of land. Of these, 222,425 farmers started practicing ecological agriculture in 78,696 acres of land during the last five years. This year, 9,399 farmers implemented 1,206 projects in crop-land, homestead gardens and in seed productions with Tk. 40.72 million. A total of 3,874 acres of land was brought under this programme during the reporting period.
Table 5.268.1. Achievement in Organic Agriculture Practice
Components Achievement
Farmers Involved Farmers Involved
Crop-land 4,902 2,897Homestead Gardening 4,174 426Seed Production 323 551Total 9,399 3,874
Source: PROSHIKA
PROSHIKA has also introduced an organic vegetable marketing project to promote the consumption of organic vegetables. Currently, one marketing outlet in Mirpur area of Dhaka city is selling eco-friendly produce to the public. Besides, mobile vans are used to sale vegetables in some areas, apartment complexes, mega shops and department stores. A total of 750 farmers from 15 ADCs have been involved in producing organic vegetables covering 592 acres of land and sold 212,000 kg of vegetables this year. Also, group members involved in seed production
have produced 484 tons of different varieties of quality seeds (Table 5.278.2 ). The farmers
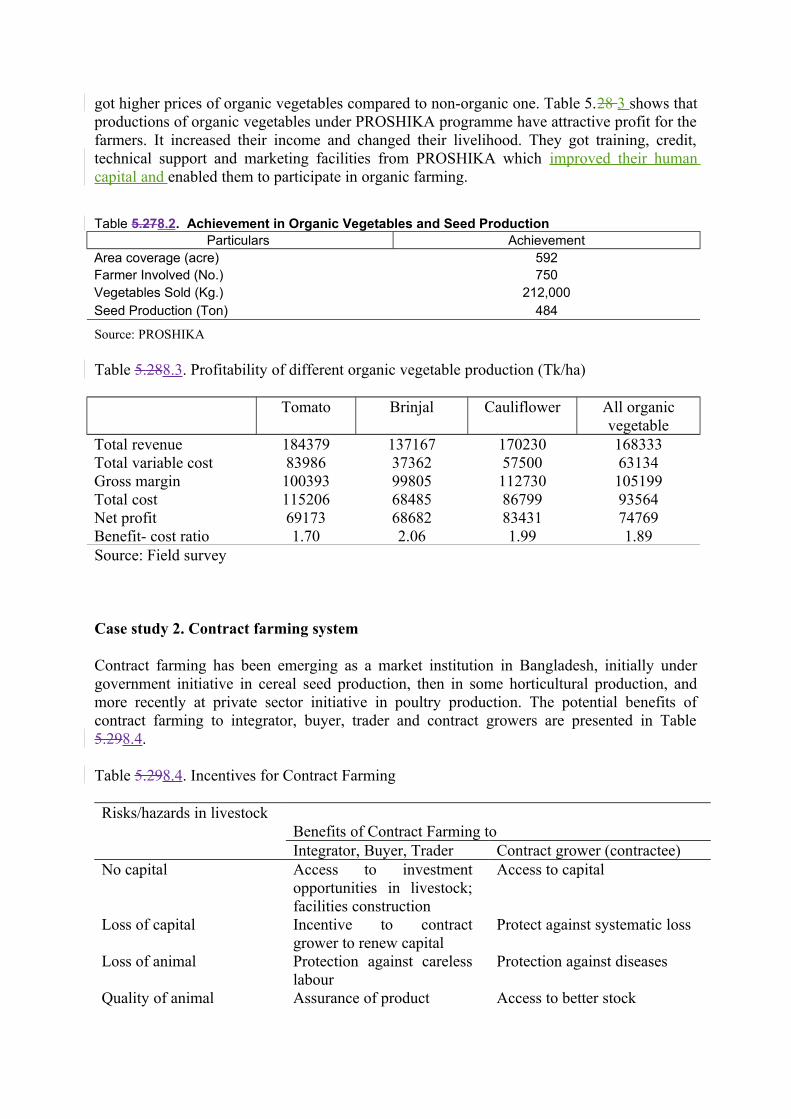
got higher prices of organic vegetables compared to non-organic one. Table 5.28 3 shows that productions of organic vegetables under PROSHIKA programme have attractive profit for the farmers. It increased their income and changed their livelihood. They got training, credit, technical support and marketing facilities from PROSHIKA which improved their human capital and enabled them to participate in organic farming.
Table 5.278.2. Achievement in Organic Vegetables and Seed ProductionParticulars Achievement
Area coverage (acre) 592Farmer Involved (No.) 750Vegetables Sold (Kg.) 212,000Seed Production (Ton) 484
Source: PROSHIKA
Table 5.288.3. Profitability of different organic vegetable production (Tk/ha)
Tomato Brinjal Cauliflower All organic vegetable
Total revenue 184379 137167 170230 168333Total variable cost 83986 37362 57500 63134Gross margin 100393 99805 112730 105199Total cost 115206 68485 86799 93564Net profit 69173 68682 83431 74769Benefit- cost ratio 1.70 2.06 1.99 1.89Source: Field survey
Case study 2. Contract farming system
Contract farming has been emerging as a market institution in Bangladesh, initially under government initiative in cereal seed production, then in some horticultural production, and more recently at private sector initiative in poultry production. The potential benefits of contract farming to integrator, buyer, trader and contract growers are presented in Table 5.298.4.
Table 5.298.4. Incentives for Contract Farming
Risks/hazards in livestockBenefits of Contract Farming toIntegrator, Buyer, Trader Contract grower (contractee)
No capital Access to investment opportunities in livestock; facilities construction
Access to capital
Loss of capital Incentive to contract grower to renew capital
Protect against systematic loss
Loss of animal Protection against careless labour
Protection against diseases
Quality of animal Assurance of product Access to better stock
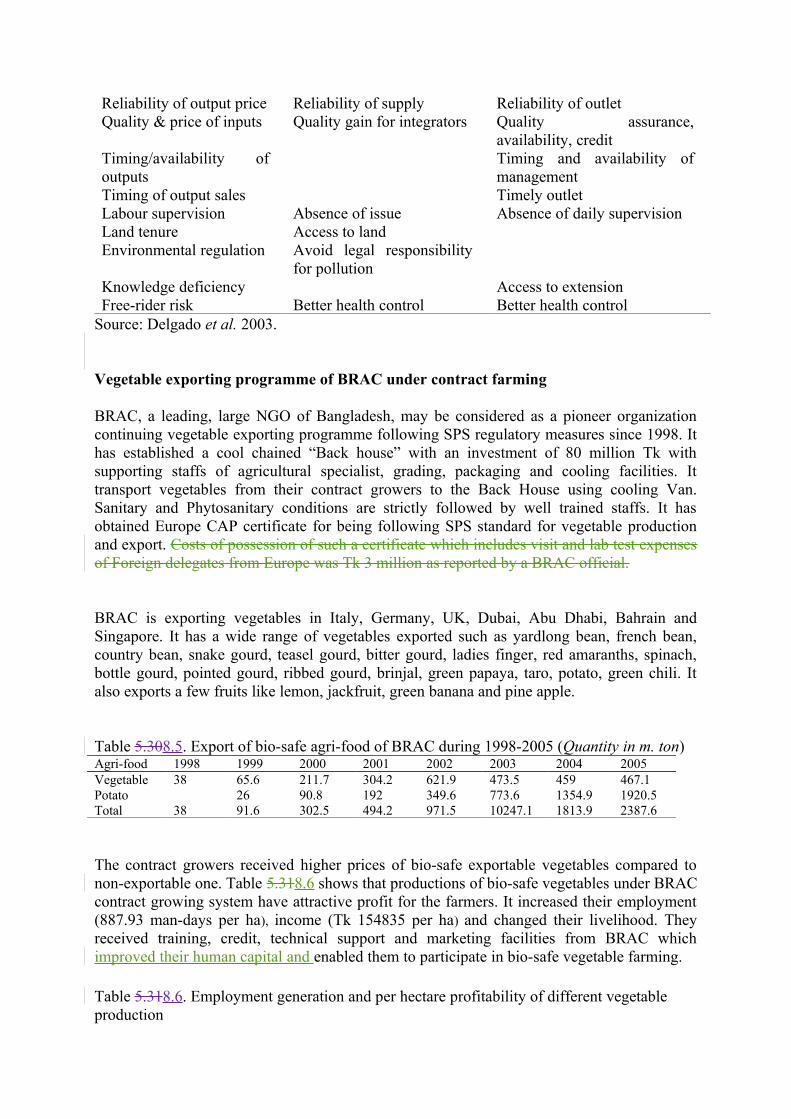
Reliability of output price Reliability of supply Reliability of outletQuality & price of inputs Quality gain for integrators Quality assurance,
availability, creditTiming/availability of outputs
Timing and availability of management
Timing of output sales Timely outletLabour supervision Absence of issue Absence of daily supervisionLand tenure Access to landEnvironmental regulation Avoid legal responsibility
for pollutionKnowledge deficiency Access to extensionFree-rider risk Better health control Better health control
Source: Delgado et al. 2003.
Vegetable exporting programme of BRAC under contract farming
BRAC, a leading, large NGO of Bangladesh, may be considered as a pioneer organization continuing vegetable exporting programme following SPS regulatory measures since 1998. It has established a cool chained “Back house” with an investment of 80 million Tk with supporting staffs of agricultural specialist, grading, packaging and cooling facilities. It transport vegetables from their contract growers to the Back House using cooling Van. Sanitary and Phytosanitary conditions are strictly followed by well trained staffs. It has obtained Europe CAP certificate for being following SPS standard for vegetable production and export. Costs of possession of such a certificate which includes visit and lab test expenses of Foreign delegates from Europe was Tk 3 million as reported by a BRAC official.
BRAC is exporting vegetables in Italy, Germany, UK, Dubai, Abu Dhabi, Bahrain and Singapore. It has a wide range of vegetables exported such as yardlong bean, french bean, country bean, snake gourd, teasel gourd, bitter gourd, ladies finger, red amaranths, spinach, bottle gourd, pointed gourd, ribbed gourd, brinjal, green papaya, taro, potato, green chili. It also exports a few fruits like lemon, jackfruit, green banana and pine apple.
Table 5.308.5. Export of bio-safe agri-food of BRAC during 1998-2005 (Quantity in m. ton)Agri-food 1998 1999 2000 2001 2002 2003 2004 2005Vegetable 38 65.6 211.7 304.2 621.9 473.5 459 467.1Potato 26 90.8 192 349.6 773.6 1354.9 1920.5Total 38 91.6 302.5 494.2 971.5 10247.1 1813.9 2387.6
The contract growers received higher prices of bio-safe exportable vegetables compared to non-exportable one. Table 5.318.6 shows that productions of bio-safe vegetables under BRAC contract growing system have attractive profit for the farmers. It increased their employment (887.93 man-days per ha), income (Tk 154835 per ha) and changed their livelihood. They received training, credit, technical support and marketing facilities from BRAC which improved their human capital and enabled them to participate in bio-safe vegetable farming.
Table 5.318.6. Employment generation and per hectare profitability of different vegetable production
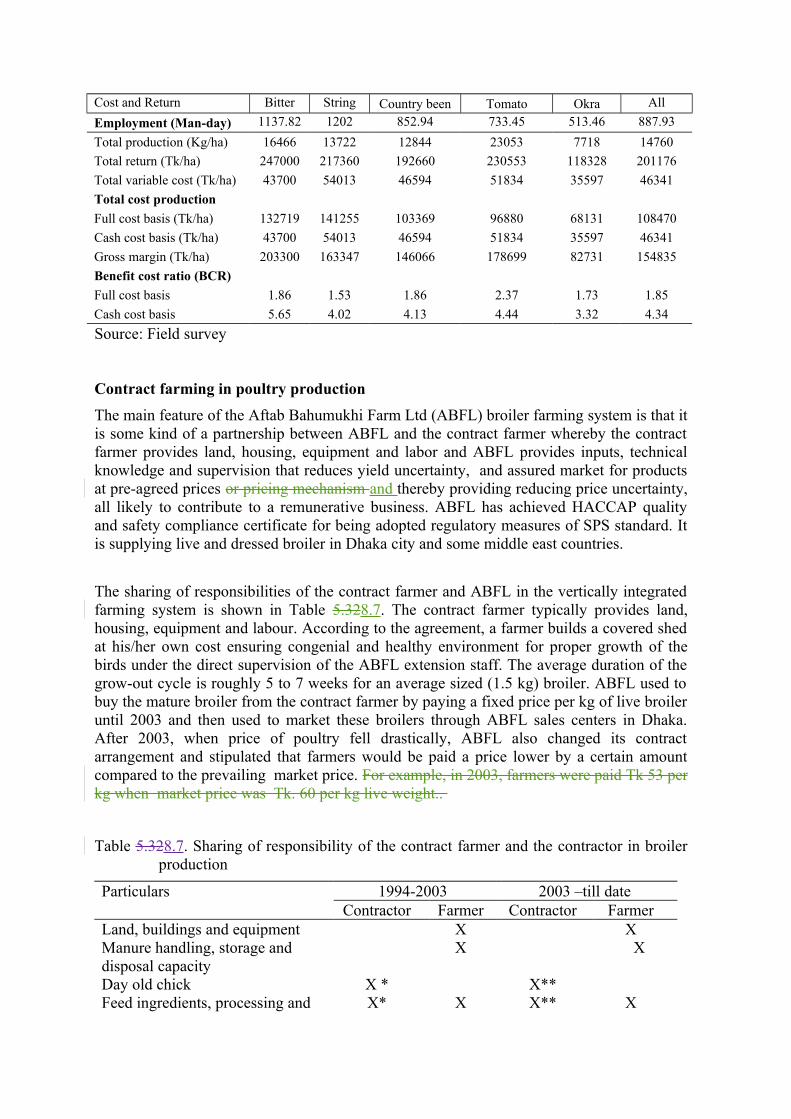
Cost and Return Bitter
gourd
String
been
Country been Tomato Okra All
vegetablesEmployment (Man-day) 1137.82 1202 852.94 733.45 513.46 887.93
Total production (Kg/ha) 16466 13722 12844 23053 7718 14760
Total return (Tk/ha) 247000 217360 192660 230553 118328 201176
Total variable cost (Tk/ha) 43700 54013 46594 51834 35597 46341
Total cost production
Full cost basis (Tk/ha) 132719 141255 103369 96880 68131 108470
Cash cost basis (Tk/ha) 43700 54013 46594 51834 35597 46341
Gross margin (Tk/ha) 203300 163347 146066 178699 82731 154835
Benefit cost ratio (BCR)
Full cost basis 1.86 1.53 1.86 2.37 1.73 1.85
Cash cost basis 5.65 4.02 4.13 4.44 3.32 4.34
Source: Field survey
Contract farming in poultry production
The main feature of the Aftab Bahumukhi Farm Ltd (ABFL) broiler farming system is that it is some kind of a partnership between ABFL and the contract farmer whereby the contract farmer provides land, housing, equipment and labor and ABFL provides inputs, technical knowledge and supervision that reduces yield uncertainty, and assured market for products at pre-agreed prices or pricing mechanism and thereby providing reducing price uncertainty, all likely to contribute to a remunerative business. ABFL has achieved HACCAP quality and safety compliance certificate for being adopted regulatory measures of SPS standard. It is supplying live and dressed broiler in Dhaka city and some middle east countries.
The sharing of responsibilities of the contract farmer and ABFL in the vertically integrated farming system is shown in Table 5.328.7. The contract farmer typically provides land, housing, equipment and labour. According to the agreement, a farmer builds a covered shed at his/her own cost ensuring congenial and healthy environment for proper growth of the birds under the direct supervision of the ABFL extension staff. The average duration of the grow-out cycle is roughly 5 to 7 weeks for an average sized (1.5 kg) broiler. ABFL used to buy the mature broiler from the contract farmer by paying a fixed price per kg of live broiler until 2003 and then used to market these broilers through ABFL sales centers in Dhaka. After 2003, when price of poultry fell drastically, ABFL also changed its contract arrangement and stipulated that farmers would be paid a price lower by a certain amount compared to the prevailing market price. For example, in 2003, farmers were paid Tk 53 per kg when market price was Tk. 60 per kg live weight..
Table 5.328.7. Sharing of responsibility of the contract farmer and the contractor in broiler production
Particulars 1994-2003 2003 –till dateContractor Farmer Contractor Farmer
Land, buildings and equipment X XManure handling, storage and disposal capacity
X X
Day old chick X * X**Feed ingredients, processing and X* X X** X
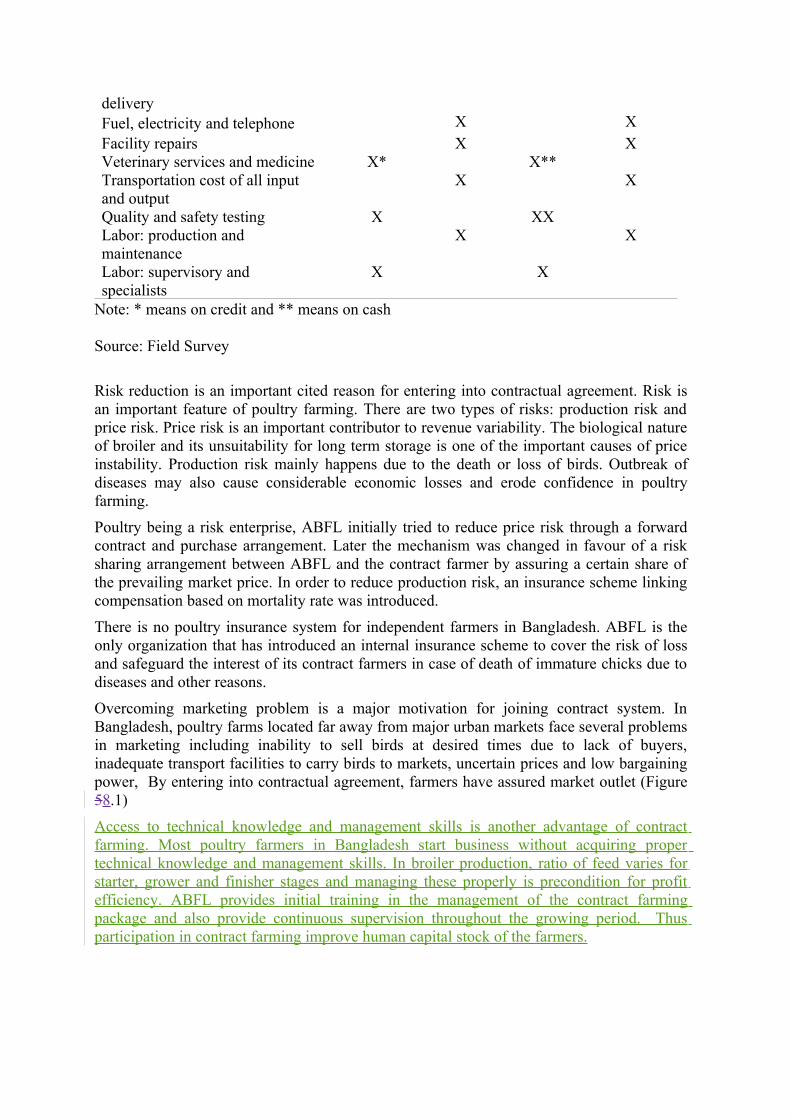
deliveryFuel, electricity and telephone X XFacility repairs X XVeterinary services and medicine X* X**Transportation cost of all input and output
X X
Quality and safety testing X XXLabor: production and maintenance
X X
Labor: supervisory and specialists
X X
Note: * means on credit and ** means on cash
Source: Field Survey
Risk reduction is an important cited reason for entering into contractual agreement. Risk is an important feature of poultry farming. There are two types of risks: production risk and price risk. Price risk is an important contributor to revenue variability. The biological nature of broiler and its unsuitability for long term storage is one of the important causes of price instability. Production risk mainly happens due to the death or loss of birds. Outbreak of diseases may also cause considerable economic losses and erode confidence in poultry farming.
Poultry being a risk enterprise, ABFL initially tried to reduce price risk through a forward contract and purchase arrangement. Later the mechanism was changed in favour of a risk sharing arrangement between ABFL and the contract farmer by assuring a certain share of the prevailing market price. In order to reduce production risk, an insurance scheme linking compensation based on mortality rate was introduced.
There is no poultry insurance system for independent farmers in Bangladesh. ABFL is the only organization that has introduced an internal insurance scheme to cover the risk of loss and safeguard the interest of its contract farmers in case of death of immature chicks due to diseases and other reasons.
Overcoming marketing problem is a major motivation for joining contract system. In Bangladesh, poultry farms located far away from major urban markets face several problems in marketing including inability to sell birds at desired times due to lack of buyers, inadequate transport facilities to carry birds to markets, uncertain prices and low bargaining power, By entering into contractual agreement, farmers have assured market outlet (Figure 58.1)
Access to technical knowledge and management skills is another advantage of contract farming. Most poultry farmers in Bangladesh start business without acquiring proper technical knowledge and management skills. In broiler production, ratio of feed varies for starter, grower and finisher stages and managing these properly is precondition for profit efficiency. ABFL provides initial training in the management of the contract farming package and also provide continuous supervision throughout the growing period. Thus participation in contract farming improve human capital stock of the farmers.
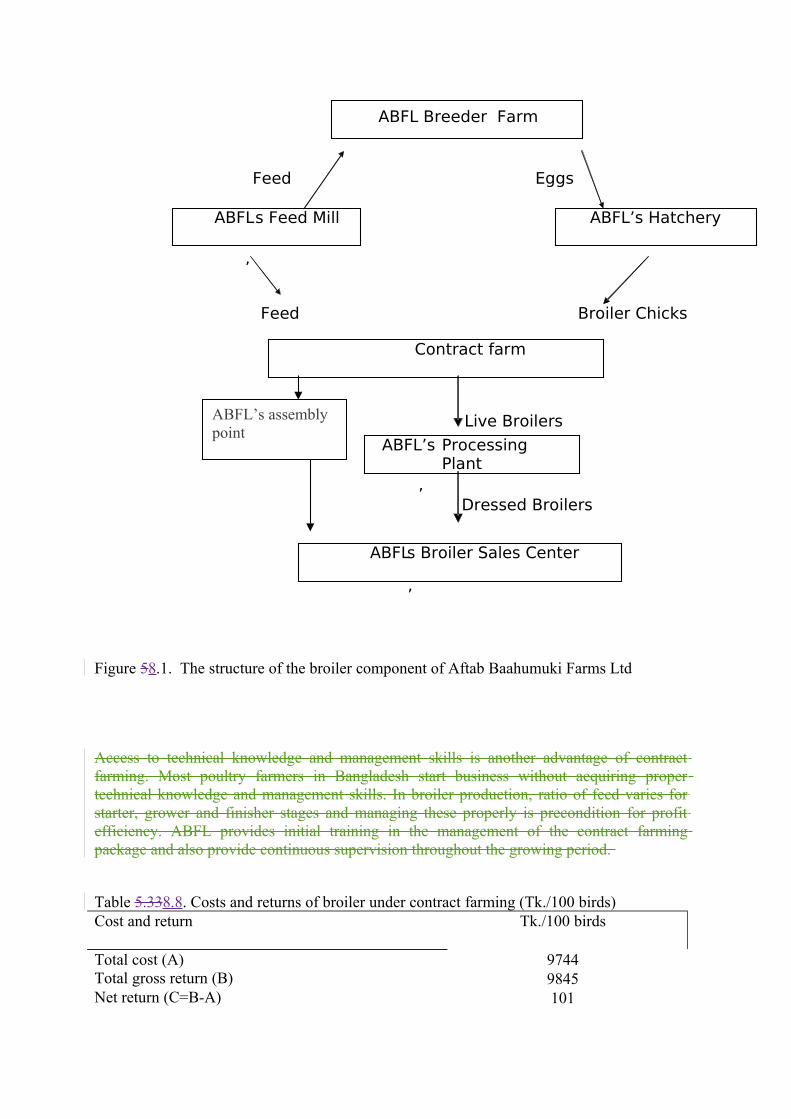
Figure 58.1. The structure of the broiler component of Aftab Baahumuki Farms Ltd
Access to technical knowledge and management skills is another advantage of contract farming. Most poultry farmers in Bangladesh start business without acquiring proper technical knowledge and management skills. In broiler production, ratio of feed varies for starter, grower and finisher stages and managing these properly is precondition for profit efficiency. ABFL provides initial training in the management of the contract farming package and also provide continuous supervision throughout the growing period.
Table 5.338.8. Costs and returns of broiler under contract farming (Tk./100 birds)Cost and return Tk./100 birds
Total cost (A) 9744Total gross return (B) 9845Net return (C=B-A) 101
Feed Eggs
Feed
Broiler Chicks
Live Broilers
Dressed Broilers
ABFL’s
’
Processing Plant
Contract farm
ABFL
’
s Feed Mill
ABFL’s Hatchery
ABFL Breeder Farm
ABFL
’
s Broiler Sales Center
ABFL’s assembly point
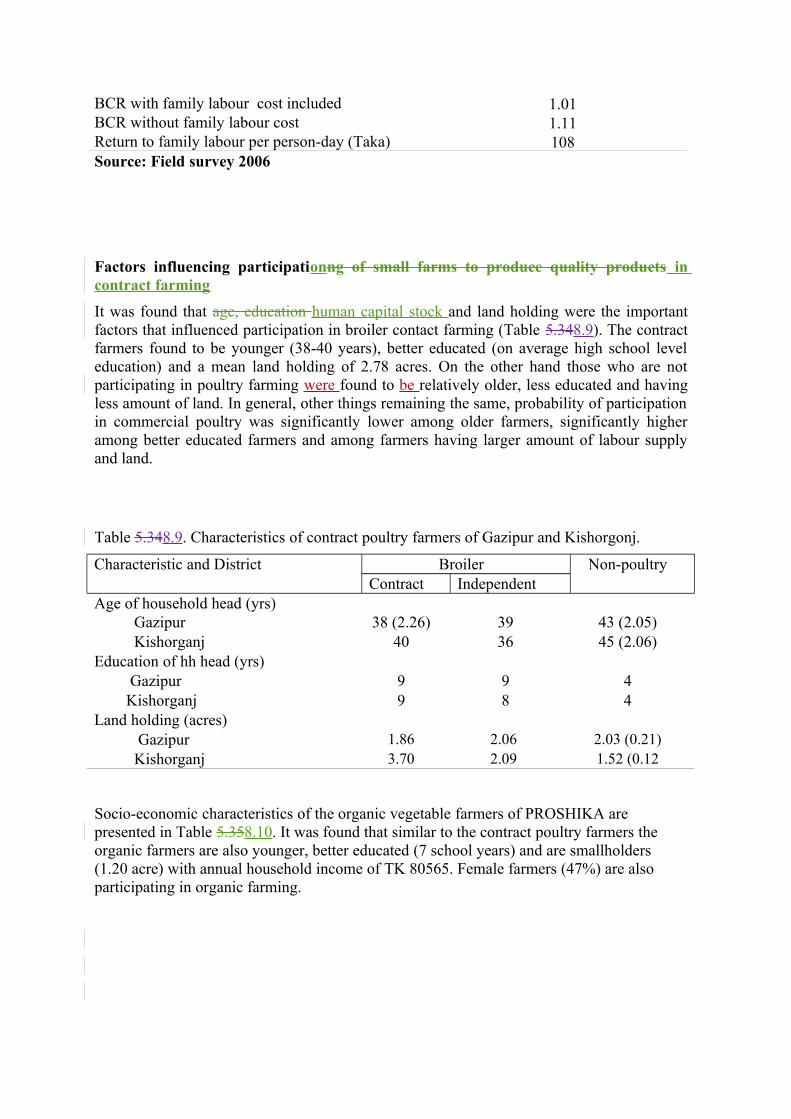
BCR with family labour cost included 1.01BCR without family labour cost 1.11Return to family labour per person-day (Taka) 108Source: Field survey 2006
Factors influencing participationng of small farms to produce quality products in contract farming
It was found that age, education human capital stock and land holding were the important factors that influenced participation in broiler contact farming (Table 5.348.9). The contract farmers found to be younger (38-40 years), better educated (on average high school level education) and a mean land holding of 2.78 acres. On the other hand those who are not participating in poultry farming were found to be relatively older, less educated and having less amount of land. In general, other things remaining the same, probability of participation in commercial poultry was significantly lower among older farmers, significantly higher among better educated farmers and among farmers having larger amount of labour supply and land.
Table 5.348.9. Characteristics of contract poultry farmers of Gazipur and Kishorgonj.
Characteristic and District Broiler Non-poultryContract Independent
Age of household head (yrs) Gazipur 38 (2.26) 39
(1.8543 (2.05)
Kishorganj 40(1.33)
36(1.62)
45 (2.06)Education of hh head (yrs) Gazipur 9
(0.61)9
(0.67)4
(1.05) Kishorganj 9(0.52)
8(0.46)
4(0.56)Land holding (acres)
Gazipur 1.86 (0.29)
2.06 (0.26)
2.03 (0.21) Kishorganj 3.70
(0.64)2.09 (0.53)
1.52 (0.12
Socio-economic characteristics of the organic vegetable farmers of PROSHIKA are presented in Table 5.358.10. It was found that similar to the contract poultry farmers the organic farmers are also younger, better educated (7 school years) and are smallholders (1.20 acre) with annual household income of TK 80565. Female farmers (47%) are also participating in organic farming.
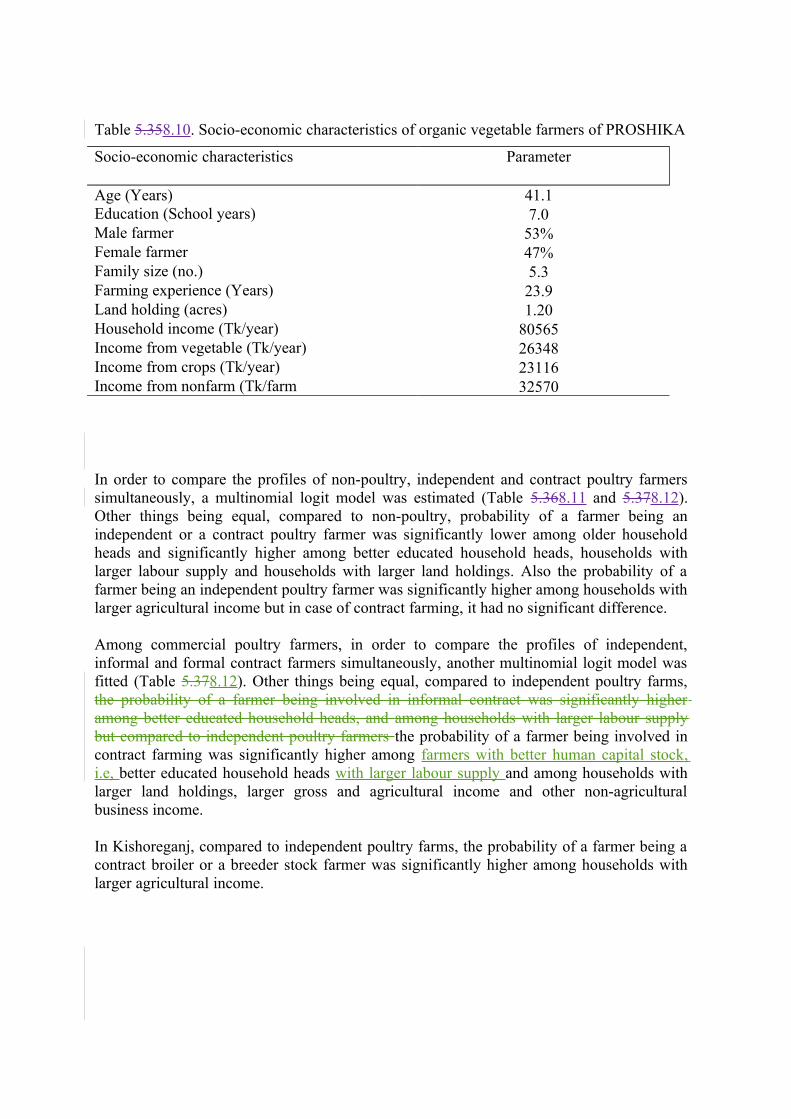
Table 5.358.10. Socio-economic characteristics of organic vegetable farmers of PROSHIKA
Socio-economic characteristics Parameter
Age (Years) 41.1Education (School years) 7.0Male farmer 53%Female farmer 47%Family size (no.) 5.3Farming experience (Years) 23.9Land holding (acres) 1.20Household income (Tk/year) 80565Income from vegetable (Tk/year) 26348Income from crops (Tk/year) 23116Income from nonfarm (Tk/farm 32570
In order to compare the profiles of non-poultry, independent and contract poultry farmers simultaneously, a multinomial logit model was estimated (Table 5.368.11 and 5.378.12). Other things being equal, compared to non-poultry, probability of a farmer being an independent or a contract poultry farmer was significantly lower among older household heads and significantly higher among better educated household heads, households with larger labour supply and households with larger land holdings. Also the probability of a farmer being an independent poultry farmer was significantly higher among households with larger agricultural income but in case of contract farming, it had no significant difference.
Among commercial poultry farmers, in order to compare the profiles of independent, informal and formal contract farmers simultaneously, another multinomial logit model was fitted (Table 5.378.12). Other things being equal, compared to independent poultry farms, the probability of a farmer being involved in informal contract was significantly higher among better educated household heads, and among households with larger labour supply but compared to independent poultry farmers the probability of a farmer being involved in contract farming was significantly higher among farmers with better human capital stock, i.e, better educated household heads with larger labour supply and among households with larger land holdings, larger gross and agricultural income and other non-agricultural business income.
In Kishoreganj, compared to independent poultry farms, the probability of a farmer being a contract broiler or a breeder stock farmer was significantly higher among households with larger agricultural income.
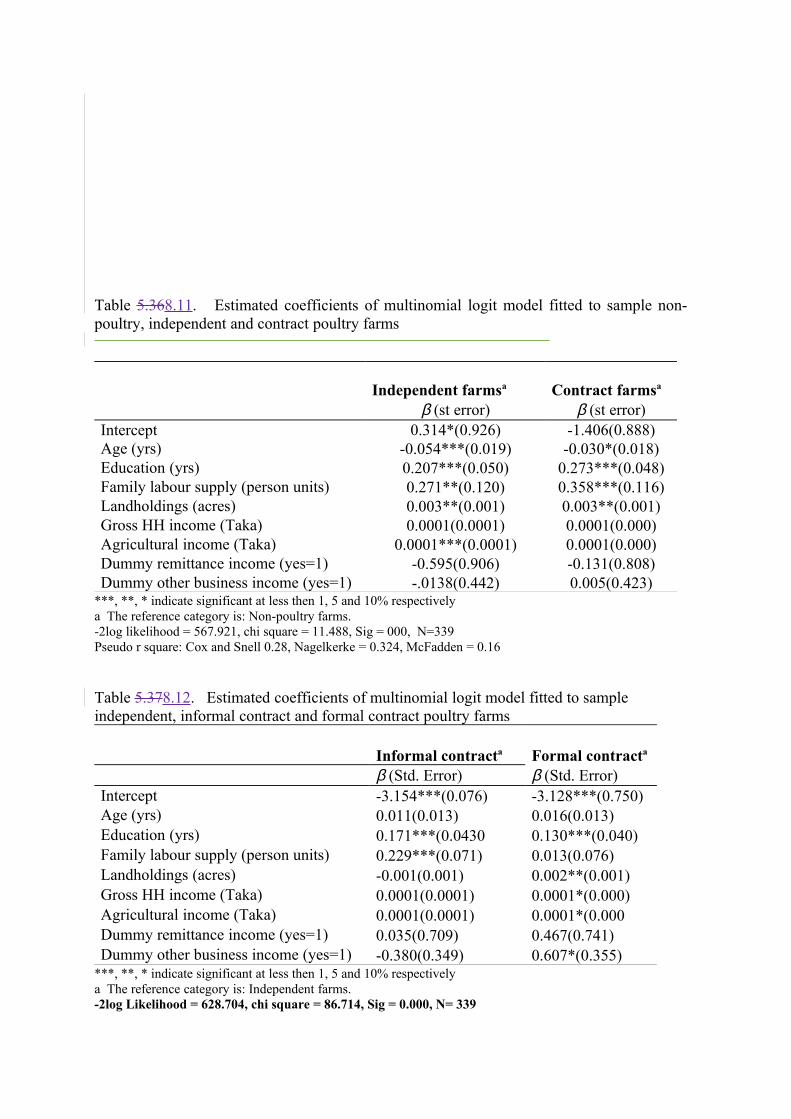
Table 5.368.11. Estimated coefficients of multinomial logit model fitted to sample non-poultry, independent and contract poultry farms
Independent farmsa Contract farmsa
β (st error) β (st error)Intercept 0.314*(0.926) -1.406(0.888)Age (yrs) -0.054***(0.019) -0.030*(0.018)Education (yrs) 0.207***(0.050) 0.273***(0.048)Family labour supply (person units) 0.271**(0.120) 0.358***(0.116)Landholdings (acres) 0.003**(0.001) 0.003**(0.001)Gross HH income (Taka) 0.0001(0.0001) 0.0001(0.000)Agricultural income (Taka) 0.0001***(0.0001) 0.0001(0.000)Dummy remittance income (yes=1) -0.595(0.906) -0.131(0.808)Dummy other business income (yes=1) -.0138(0.442) 0.005(0.423)
***, **, * indicate significant at less then 1, 5 and 10% respectivelya The reference category is: Non-poultry farms.-2log likelihood = 567.921, chi square = 11.488, Sig = 000, N=339Pseudo r square: Cox and Snell 0.28, Nagelkerke = 0.324, McFadden = 0.16
Table 5.378.12. Estimated coefficients of multinomial logit model fitted to sample independent, informal contract and formal contract poultry farms
Informal contracta Formal contracta
β (Std. Error) β (Std. Error)Intercept -3.154***(0.076) -3.128***(0.750)Age (yrs) 0.011(0.013) 0.016(0.013)Education (yrs) 0.171***(0.0430 0.130***(0.040)Family labour supply (person units) 0.229***(0.071) 0.013(0.076)Landholdings (acres) -0.001(0.001) 0.002**(0.001)Gross HH income (Taka) 0.0001(0.0001) 0.0001*(0.000)Agricultural income (Taka) 0.0001(0.0001) 0.0001*(0.000Dummy remittance income (yes=1) 0.035(0.709) 0.467(0.741)Dummy other business income (yes=1) -0.380(0.349) 0.607*(0.355)
***, **, * indicate significant at less then 1, 5 and 10% respectivelya The reference category is: Independent farms.-2log Likelihood = 628.704, chi square = 86.714, Sig = 0.000, N= 339

Pseudo r square: Cox and Snell 0.23, Nagelkerke = 0.26, McFadden = 0.12
A SUMMARY CHAPTER FOR THE PUBLICATION, QUICKLY RAISING CONCLUSIONS AND RECOMMENDATIONS PER CHAPTER AS IT RELATES TO THE FIVE AREAS OF THE STUDY AS CALLED FOR IN THE TORS PLUS ANYTHING ADDITIONAL
Annex: A brief description of NARS institutes
Bangladesh Agricultural Research Institute
As the largest multi-crop research organizations, BARI is mandated to carry out research on a wide variety of crops such as: wheat, tubers, pulses, oilseeds, spices, horticultural crops, etc. Besides crop variety development, the major areas of research are soil and water management, development of farm machineries, cultural management, disease and insect management, vertebrate pest management etc. BARI is organized with three wings, namely, Research, Support Service, and Training and Communications.
BARI headquarter spread over 176 hectares of land of which 126 hectares are experimental fields. Six Regional Stations are located at Ishurdi, Jamalpur, Jessore, Hathazari, Rahmatpur, and Akbarpur. Its 28 Sub-stations are spread all over the country, which includes three Hill Research Stations. Out of 7 Research Centres, 4 are within the HQ campus- Tuber Crops Research Centre, Oilseed Research Centre, Plant Genetic Resource Centre and Horticulture Research Centre and the other three are Wheat Research Centre, located at Dinajpur, Pulse Research Centre at Ishurdi and Spices Research Centre at Bogra. Besides, BARI has number of multi-location trial sites spread over different agro-ecological zones of the country. BARI also collects, conserves and evaluates germplasm of crops. The institute employs about 600 scientists working in different fields.
Bangladesh Rice Research Institute
BRRI conducts research on all aspects of rice in order to develop modern varieties of rice with high yield potential for different ecosystems, develop component technologies for improving productivity of rice-based cropping systems, and transfer rice production technologies through training, workshop, seminar, and publication. Research on development of varieties and production technologies is conducted at the BRRI headquarters at Gazipur and at nine regional stations situated in Comilla, Habiganj, Sonagazi, Bhanga, Barisal, Rajshahi, Rangpur, Kushtia and Satkhira. BRRI employs about 228 scientists. It has been awarded with several national prizes for its outstanding contribution towards rice development.
Bangladesh Jute Research Institute
BJRI conducts research to develop short duration high yielding varieties of jute, kenaf and mesta; develop agronomic and crop protection technologies and processes and equipment for manufacturing new jute products and organize the production, testing and supply of improved pedigree jute seeds and multiplication, procurement and their distribution to various organizations and selected growers.
Research is organized in two divisions, namely Technology and Agriculture. The Central
Research Station is located at Manikgonj. Four regional stations are situated at Faridpur, Rangpur, Kishoregonj and Chandina. The two sub-stations are located at Monirampur (Jessore) and Tarabo (Narayangonj). Besides these stations, BJRI maintains four Farming System Research Sites and eight sub-centres in jute growing areas. The institute employs about 100 scientists.
Bangladesh Institute of Nuclear Agriculture
BINA conducts research adopting nuclear techniques for the purpose of ensuring a stable and productive agriculture through evolution of new varieties of crops, scientific management of land and water, development of appropriate technology to improve crop production and development of methods for disease and insect management. BINA has five sub-stations and an annex farm for testing the wide adaptability/location for specific performance of advanced mutant lines of different crops and other technologies generated by the scientists. The sub-stations are located at Ishurdi, Rangpur, Comilla, Magura and Satkhira and the annex farm at Jamalpur. It employs about 80 scientists.
Bangladesh Sugarcane Research Institute
BSRI conducts research to develop high yielding, high sugar, and disease and pest resistant sugarcane varieties. Its functions are to develop and maintain a germplasm bank through collection of sugarcane varieties, prepare production programmes of sugar, gur and syrup producing carbohydrate enriched crops/plants; conduct research on sugarcane based farming and to identify its economic advantages; and take measures for utilization of technologies regarding sugar, gur and syrup producing crops/plants. BSRI has a Regional Research Station and a Quarantine Station located at Gazipur, a North Regional Station at Thakurgaon, and three sub-stations at Chuadanga, Jamalpur and Rajshahi. The institute employs about 80 scientists.
Soil Resources Development Institute
The objectives of SRDI are to make inventory soil and land resources and to investigate soil-related problems for agricultural research and development. The functions of SRDI include reconnaissance soil survey of the country on the basis of aerial photo interpretation and field and laboratory investigation of soils; detailed and semi-detailed soil surveys of development project areas and research farms for various beneficiary agencies; soil surveys for locating areas of problem soils; soil moisture, characterization of soil tracts of the country; and preparation of various maps and reports based on the surveys. The institute employs about 150 scientists and technologists.
Bangladesh Fisheries Research Institute
BFRI conducts research to enhance the growth of fisheries production through optimal utilization of inland, brackish and marine water bodies and to develop scientific policies relating to development of technology and management of fish culture and fish capture. The Institute has five research stations namely, the Freshwater Station at Mymensingh, Riverine
Station at Chandpur, Brackish water Station at Paikgacha, Khulna, Marine Fisheries Technology Station at Cox's Bazar and Shrimp Research Station at Bagerhat and also there are four sub-stations: Freshwater Sub-stations, Faridpur and Jessore; Riverine Sub-stations, Rangamati and Patuakhali, Floodplain Sub-stations, Bogra and Khepupara. The institute employs about 70 scientists.
Bangladesh Livestock Research Institute
BLRI is entrusted to generate and adopt technologies to solve livestock problems at the national and farm levels and also to train-up scientists in the appropriate field of research. The mandate is to take care of the livestock problems of small holders through multi and inter-disciplinary and inter-institutional research. The institute conducts research to solve basic problems affecting livestock and poultry production, both at national and farm level, develop techniques and knowledge pertinent to livestock and poultry production and strengthen research-extension-NGO linkage and expedite quick dissemination of the locally developed and introduced techniques to the end users. The institute has two sub-stations, one at Naikhangchari, Bandarban and other at Baghabari, Sirajganj. The institute employs about 50 scientists.
Bangladesh Forest Research Institute
BFRI conducts research to develop management practices to increase productivity of national forests and village groves and to convert wastelands and marginal lands to forestry and agroforestry uses; develop technologies for rational utilization of forest products; generate technologies to conserve or restore environment balances through increases stocking densities of both rural and urban forests; transfer technology through extension services and other agencies to end users.
BFRI has 22 research stations and sub-stations under five field divisions covering different forest types that spread over eight dendro-ecological regions. All divisions of the Institute except the divisional offices of Plantation Trial Unit and Mangrove Stations are located at headquarters. The two exceptions are at Barisal and Khulna. The institute employs about 110 scientists.
Bangladesh Tea Research Institute
BTRI conducts research to increase yields and quality of tea by developing improved production technologies and high yielding tea clones. The Institute has nine divisions in its headquarter and three sub-stations (Kaliti, Moulvibazar, Sylhet town and Fatikchheri, Chittagong).
Bangladesh Sericulture Research and Training Institute
BSRTI conducts research to develop disease, drought and water logging resistant high yielding and nutritionally rich mulberry varieties for rearing of silkworms. Develop

appropriate technology for quality silkworm egg and silk production through low cost innovative technologies for overall improvement of socio-economic conditions of rural poor and women. Imparting training to the extension staff to systematize silk production processes. The Institute has a Regional Sericulture Research Centre at Chandraghona, Rangamati and a Germplasm Maintenance Centre at Sakoa, Panchagarh. The institute employs 14 scientists.