Embed Size (px)
Citation preview
GLOBALIZATION AND HUMAN CAPITAL FORMATION: EMPIRICAL
EVIDENCE FROM EASTERN EUROPEAN AND CIS COUNTRIES
by
Vitaliy Oryshchenko
A thesis submitted in partial fulfillment of the requirements for the degree of
Master of Arts in Economics
National University "Kyiv-Mohyla Academy" Economics Education and Research Consortium
Master's Program in Economics
2005
Approved by ___________________________________________________ Ms.Svitlana Budagovska (Head of the State Examination Committee)
__________________________________________________
__________________________________________________
__________________________________________________
Program Authorized Master's Program in Economics, NaUKMA to Offer Degree _________________________________________________
Date __________________________________________________________
National University "Kyiv-Mohyla Academy"
Abstract
GLOBALIZATION AND HUMAN CAPITAL FORMATION:
EMPIRICAL EVIDENCE FROM EASTERN EUROPEAN AND CIS
COUNTRIES
by Vitaliy Oryshchenko
Head of the State Examination Committee: Ms.Svitlana Budago vska, Economist, World Bank of Ukraine
This paper examines the effects of economic globalization on the human capital development in the transition countries using recent data from the Business Environment and Enterprise Performance Survey II which contains an up-to-date and extensive set of variables. Concentrating on the activities of multinational corporations as one of the central phenomena of globalization process, the paper evaluates the effect of foreign ownership on the probability of personnel training separating the effect for five categories of employees. The analysis is performed in the context of the model of enterprise training employing a conventional set of variables as the determinants of training. A binomial probit is used to estimate the model. Obtained results are consistent both with economic intuition and findings of earlier studies and generally support theorized correlations. The model is able to capture the effects of such factors as competition, firm performance and innovativeness, and labor force characteristics, which are shown to be important determinants of training. The main finding of the paper is that the foreign-owned firms are indeed more likely to provide training to their personnel facilitating human capital accumulation in the recipient countries.
TABLE OF CONTENTS
Page Number
LIST OF TABLES ii
LIST OF FIGURES iii
ACKNOWLEDGMENTS iv
ABBREVIATIONS v
CHAPTER 1. INTRODUCTION 1
CHAPTER 2. LITERATURE REVIEW 4
CHAPTER 3. MODEL CONSTRUCTION AND DATA 18
CHAPTER 4. ESTIMATION RESULTS 26
CHAPTER 5. DISCUSSION AND CONCLUSIONS 38
BIBLIOGRAPHY 41
APPENDICES a
Appendix 1. Selected questionnaire items aAppendix 2. Distribution of respondents by country eAppendix 3. Distribution of firms by their legal organization fAppendix 4. Definitions of variables gAppendix 5. A note on endogeneity in binary choice models jAppendix 6. Probit estimates kAppendix 7. Amemiya Generalized Least Squares probit estimates mAppendix 8. Probit estimates with the Huber/White/sandwich estimator of variance oAppendix 9. Estimated marginal effects for probit models q
ii
LIST OF TABLES
Number Page
Table 1. Key determinants of training 18
Table 2. Ownership type of respondent firms 19
Table 3. Average distribution of the workforce education levels at sampled firms
21
Table 4. Domestic-export distribution of firms' sales 22
Table 5. Scalar measures of fit for probit models 28
Table 6. Estimated effects of foreign ownership on the probability of enterprise training
30
Table 7. Estimated effects of competition on the probability of enterprise training
33
Table 8. Estimated effects of innovativeness on the probability of enterprise training
34
Table 9. Estimated effects of the quality of the labor force on the probability of enterprise training
35
Table 10. Estimated effects of the foreign ownership on the probability of enterprise training for two ideal types of firm
37
iii
LIST OF FIGURES
Number Page
Figure 1. The equilibrium outcome of the model 13
Figure 2. Kernel density plot of percentages of foreign-owned shares of respondent firms
20
Figure 3. Effect of foreign ownership on the probability of enterprise training
31
Figure 4. Effect of performance (change in sales) on the probability of training
32
Figure 5. Effect of personnel (university) education on the probability of enterprise training
36

iv
ACKNOWLEDGMENTS
The author wishes to express his sincere gratitude to his advisor, Dr. Axel
Dreher, for his encouragement and guidance. The author also wants to thank
EERC research workshop faculty, and especially Dr. Tom Coupé, for their
invaluable comments.
v
ABBREVIATIONS
BEEPS The Business Environment and Enterprise Performance Survey
CIS Commonwealth of Independent States
FDI Foreign direct investment
HRM Human resource management
MLE Maximum likelihood estimator
MNC Multinational corporation
R&D Research and development
SME Small and medium enterprises
TNC Transnational corporation
C h a p t e r 1
INTRODUCTION
Among the features of contemporary world economy the one of particular
importance is the existence and activities of multinational corporations (MNCs).
In a comparatively short period after their emergence MNCs have become widely
recognized as powerful world-scale players. "In international competition MNCs
with annual turnover of more than hundred billion dollars play the decisive role."
(Dergachev, 2002). At the same time, as Stiglitz (2002) stresses, "when foreign
businesses come in they often destroy local competitors, quashing the ambitions
of the small businessmen who had hoped to develop homegrown industry."
Ultimately, country’s policymakers should be aware of the true impact of
transnationalization on economic development.
An important and widely discussed issue in the context of
transnationalization (and globalization) is technology transfer by MNCs from
their homes to foreign affiliates in the host countries. The activities of MNCs
could have radically different effects on host countries ranging from substituting
domestic investment and eroding technology to providing hosts with modern
technologies and skills they do not yet possess. As it is usually argued, when firms
create their foreign affiliates and become multinational, they bring with them
some amount of proprietary technology to compete successfully with local
enterprises. They also force local firms to protect their market shares, which in
turn generates various types of spillovers (or external effects) that lead to
productivity increases in local firms (Blomström and Kokko, 1998). Even if a
MNC exits the local economy, its activities could have resulted in benefits since
technology has some characteristics of a public good.
2
Furthermore, there is a quite interesting way of technology transfer from
MNCs to their affiliates, namely through the training of the affiliates' local
employees. As recent evidence shows, multinationals provide various types of
training for their employees in host countries especially in the presence of low
quality public education in the developing countries (which among others
become hosts for multinationals). These may be on-the-job training, seminars or
even overseas education; and the range of employees may include all kind of
levels from simple operatives to top managers. Eventually, those skills and
knowledge obtained while working for a MNC affiliate may be of use when the
employees move to other firms, or set their own businesses. Consequently,
employees' training in the MNCs may spill over to local enterprises.
Anticipating the possibility of spillover effect from personnel training I
concentrate on the determinants of the firms' decisions to train their employees.
While considering a broad range of factors influencing training decisions my main
interest is, naturally, in the effect of foreign ownership. Under a broad definition,
a firm with shares owned by foreign company/organization may be considered as
an affiliate of the multinational corporation. Furthermore, as foreign direct
investment is a primary feature of the (economic) globalization process; foreign
ownership could be used to investigate the effects of transnationalization on host
countries' welfare.
It must be stressed here that although widely discussed, the determinants of
training are not well defined and the process of training within the enterprise
remains relatively unexplored (Smith and Hayton, 1999). One important
observation here is that the only data sources which allow investigating training
incidence and determinants are ad hoc surveys and/or case studies. This limits
the scope of research introducing several methodological problems including
reliability of survey data. Furthermore, the particulars of the survey determine the
3
set of factors available to researchers leading to problems of model specification.
Nevertheless, existing empirical literature employing a 'conventional' set of
variables finds fairly robust relationships between training and firm-specific,
industry-specific, labor force, and other factors. Finally, to the best of my
knowledge there is little research concerning enterprise training in the Ukraine.
This allows opportunities for further investigation in this sphere.
As discussed below, there are some reasons to expect that foreign-owned
firms will engage in more training activities than domestic-owned. Furthermore, it
can be hypothesized that MNCs personnel training in host countries has a
positive effect on performance of indigenous enterprises due to spillovers of
technical and management skills, diffusion of know-how, and so on. In the final
analysis, the existence of the effect of foreign ownership on firms' training
decisions could be consequently referred to as supporting the significance of the
impact of globalization on human capital in transition countries.
The paper proceeds as follows: in the second chapter I provide a survey of
the recent literature concerning determinants, incidents, and effects of enterprise
training linking it to the possibility of spillover effects. The third chapter of the
paper proceeds with a description of the survey data used in the present study
and with a discussion of the variables. The construction of the model
dependencies follows naturally in this chapter as well. Results of fitting a binary
response models to the data are presented in the fourth chapter. Finally, in the
fifth chapter I present general empirical and theoretical conclusions and provide
policy recommendations.
4
C h a p t e r 2
LITERATURE REVIEW
"Today it is global finance and corporate capital, rather than states, which exercise decisive influence over the organization, location and distribution of economic power and wealth." ( Held and McGrew, 1999)
The above hyperglobalists' view exaggerating the power of global markets,
though questioned by skeptics, introduces an important and widely discussed
problem in the context of global economic development. Nowadays, the
operations of multinational corporations integrate national and local economies
into global and regional production networks. As Held and McGrew (1999) aptly
note "the boundaries between domestic matters and global affairs become
increasingly fluid." While a huge range of studies in economics of globalization
looked for the future prospects of the worldwide integration processes auguring
either failure or success, there is an extensive literature discussing implications of
globalization for welfare of involved states. In my present study I join the latter
debates accenting the impact of foreign direct investment associated with
activities of multinational corporations on the human capital accumulation in
recipient countries. The following literature overview comes up with
determinants of enterprise training and the way they are affected by the activities
of foreign companies.
Even a glance at the recent literature reveals that the questions of existence
and future development of multinational (transnational1) corporations (MNCs)
1 There is some, though not systematic, distinction in using terms transnational and multinational in current
research. I will use those terms synonymously while abbreviating usually as MNC rather then TNC.
5
are being raised rather systematically. There are thorough theoretical articles
dealing with multinationals, their emergence, evolution and perspectives in the
context of the global economy. Among authors to mention here are, for example,
John Dunning who analyzes globalization issues and the phenomena of MNCs,
Diecken (1994) who evaluates the place of MNC in the global economy, Ernst
and Ozawa (2002) who analyze features of triumvirate world economy where
transnational economy is being considered together with national and world
economies.
Among the studies done in Ukraine Yakubovsky (2002) analyses the
concept of international production and the theory of transnational corporations,
and investigates mostly foreign direct investment (FDI) in different regions
(South America, Asia, Central and Eastern Europe, and former USSR). He
provides an analysis of legislative base and historical review of FDI structure and
dynamics in selected countries. In his recent work concerning MNCs Plotnikov
(2004) deals with financial management in MNC.
The multinational corporations are usually argued to operate in a different
environment than national firms. This stratified economy is believed to have
specific characteristics and, thus, should be studied separately. In their recent
study Ernst and Ozawa (2002) state that "the world economy needs to be
conceived as a triumvirate interactive system composed of the national sovereign
economy, the global market economy, and the transnational corporate economy."
This classification introduces a powerful framework of the analysis of MNCs’
activities. Another useful concept for the purpose of my analysis is the dual
economy framework in which MNCs and national firms are considered as two
distinct constituents of the economy. For instance, Kapler (1999) empirically
depicts the US as a dual economy given the results of his analysis based on firm-
6
level panel data. The empirical evidence provides support for the view that
MNCs form the dominant group of firms within a dual economy.
Most studies that deal with transnationalization and multinationals address
the issue of foreign direct investment flows across countries. Ultimately, it is the
only comprehensive variable available. A few studies also analyze mergers and
acquisitions, and firm-level data. Thus, in their review Blomström and Kokko
(1996) come to the conclusion that foreign direct investment "may promote
economic development by contributing to productivity growth and exports in
their host countries. However, the exact nature of the relation between foreign
multinationals and their host economies seems to vary between industries and
countries." Therefore, the benefits of accepting FDI are not as straightforward as
it might be tempting to argue. For example, empirical analysis of Yakubovsky
(2002) shows a negative influence of an increase in FDI on Ukraine's trade
balance. The author concludes that "FDI inward flows into the country decrease
Ukraine's international competitiveness due to their negative impact on trade,
services and income from foreign investment balance."
There are several papers analyzing the impact of FDI in countries of the
Commonwealth of Independent States (CIS) including Ukraine. Summarizing the
policy recommendation of most domestic studies it becomes clear that CIS and
Ukrainian economists recommend the government to implement measures aimed
on further FDI attraction. A few examples to be mentioned are as follows.
Yelizavetin (2003) examines the reasons of retardation of foreign direct
investment inflows into Russia by analyzing their structure and dynamics. He
consecutively suggests how to accelerate FDI inflows. Osetsky (2003) shows the
results of econometric modeling which reveal interrelations between institutional
investment and GDP growth. The results of his model are considered as
confirming the necessity of government intervention with special emphasis on
7
establishing favorable conditions for institutional investment. Zgryvets (2002)
analyses advantages and disadvantages of accepting foreign direct investment into
the host country and proposes governmental measures to stimulate FDI inflows.
Within this study I am interested in activities of multinational corporations
to the extent they are able to produce external effects or spillovers. There are a lot
of studies explaining various types of spillovers due to foreign direct investment
and technology transfer from multinational corporations to their affiliates in host
countries through machinery, equipment, patent rights and so on (a good review
of those studies is given in Blomström and Kokko, 1996). Empirical research
revealed significant spillover effect from FDI in Ukraine. Particularly, Talavera
(2001) looks for spillovers of FDI inflows into Ukraine. He found statistical
evidence that the level of FDI in a certain region-industry increases non–FDI
firms’ performance measured by labor productivity and volumes of export. The
results of Konchenko (2003) revealed that the effect of FDI on the performance
of Ukrainian milk enterprises is significantly positive. Furthermore, Sobko (2004)
presents a good analysis of technology transfer via the production linkages
between firms and reports a strong relationship between the level of technology
transfer and firms' production linkages. In his study Alston (2002) addresses the
issue of spillovers from public agricultural research investment to the agricultural
sector and concludes that internalization of spillovers contributes significantly to
total agricultural productivity growth. Hu (2004) presents empirical evidence of
positive productivity spillovers from the activities of MNCs in Singapore via the
demonstration effect. Based on the analysis of patent citation data, Singh (2004)
presents empirical evidence on significant bi-directional knowledge flows
between multinationals and their host countries.
In the presence of such a huge variety of (empirical) studies concerning
spillovers from MNCs activities, it is not surprising that research based on
8
existing papers has been done. Thus, in their meta-study Gorg and Strobl (2001)
analyze collected information from a sample of papers on productivity spillovers.
They conclude that the empirical results are quite mixed, though in most studies
addressed, a positive effect of the presence of MNCs on productivity spillovers to
local firms was found. In my own analysis, I will rely on the evidence of the
significant positive spillover effects from MNCs activities while deducing welfare
implications of training in foreign-owned companies.
An important prediction related to my hypothesis is that under several
natural assumptions domestic- and foreign-owned firms will choose different
optimal behavior with respect to personnel training. As Parker and Coleman
(1999) conclude based on a simple model with profit-maximizing firms, if both
domestic- and foreign-owned firms have the same training intensity, the latter will
optimally choose higher quality training. This, in turn, implies that foreign owned
firms are likely to accumulate higher quality human capital suggesting possibility
of higher positive spillovers to host country.
In the studies investigating spillovers from employees training, several
approaches were used, among them the analysis of detailed career data of
manufacturing firm managers, MNCs' incidence of undertaking training and their
training expenditures, mobility of R&D personnel and effects on the host
country's technological capability, and other methods (see Blomström and
Kokko, 1998, for a review of those studies).
Naturally, most empirical studies were based on the data obtained from ad
hoc surveys. For instance, Monteiro et al. (2004) addressed the question why
some subsidiaries are isolated from the knowledge transfer activities within the
MNC. Although not directly related to my topic, this study might be interesting
for its methodology. Data collection for the study consisted of three phases.
Firstly, a qualitative pilot study of transfers of best practices in the European
9
operations of US based MNCs was conducted. Secondly, they put together a
draft questionnaire that was presented, discussed, and tested at the MNCs. At the
third phase of the research they approached six large MNCs to take part in the
research. The main survey consisted of two parts. The first was sent to subsidiary
managers of the participating firms (about 204 marketing subsidiaries of the six
participating MNCs). In addition, corporate managers in the MNCs answered a
separate questionnaire. As survey data might often be suspicious it is important to
compare several studies used survey methodology in the analyzed sphere, and so
do I considering the above paper.
Unlike spillovers, the problem of personnel training by multinationals along
with that by national firms has been raised more systematically in the economics
literature. Though the evidence is mixed, several studies have found a positive
relationship between foreign ownership and training arrangements. For instance,
Yadapadithaya (2001) evaluated corporate training and development programs in
Indian private, public, and multinational enterprises via an ad hoc survey covering
252 firms including 26 multinationals. Data were collected using a written
questionnaire mailed to the respondents. The evidence shows that MNCs in India
provide much more intensive training for their employees than local firms. Thus,
the percentage of employees trained in MNCs per year increased from 27% in
1990 to 69% in 1999, average training hours per employee increased from 3.5 to
6 hours during the period, and the percentage of payroll spent on training
increased from 0.6% to 1.6%. Of course, this evidence does not imply the
presence of external effects from personnel training, but at the same time, this
gives us some reasons to expect possible knowledge spillovers. Ultimately, I
introduce a similar hypothesis in this paper, namely, that firms with foreign
ownership provide more intensive training to their employees than do
domestically-owned ones.
10
The studies on human resource management (HRM) in MNCs often
present material closely related to our discussion on spillovers. For example, the
primary aim of the paper by Walsh (2001) is to examine large-scale survey
evidence on the human resource policies and practices of multinational
companies operating in Australia drawing on data from the Australian Workplace
Industrial Relations Survey (AWIRS). The central finding of this study is that
foreign-owned establishments in Australia were associated with a higher take-up
of human resource policy and practice than their domestic counterparts. Another
study by Bangert and Poor (1993) provides some evidence on employees training
in Hungarian affiliates of MNCs. Identifying the determinants of training, the
authors notice that training needs arose from the introduction of the parent
company's management system in the field of marketing, controlling, operations,
finance, computer utilization or HRM. Often the need is satisfied by in-company
training.
The effect of training is also of great importance as it stimulates (or
discourages) companies to undertake training expenditures. At the same time,
company performance should naturally depend on training as it is basically the
goal of investing in the development of company's human capital. Thus, Aragon-
Sanchez et al. (2003) present empirical evidence of a positive relationship
between employees training by firms and performance of those firms. This study
is also interesting because of its methodology. The authors used data obtained
from a questionnaire sent to 6000 small and medium enterprises (SME) in some
countries of the EU. They included both training and result variables which are
described in the paper. The former set of variables includes training methods,
training characteristics, training activities and other variables. Although the
authors faced a very low response rate (less than 9%), they still collected about
500 valid questionnaires for the dataset. Therefore, I will introduce a firm's
11
performance as a factor influencing training decisions expecting positive effect in
accordance with both presented evidence and common sense.
Along with empirical studies, several theoretical models have been
proposed to explain the basic relationship among the categories of interest. It is
interesting to note here that Campbell and Vousden (2003) addressed the issue of
technology transfer from MNCs to developing economies via training of local
workers by the MNCs. They developed a simple theoretical two-period model
describing the behavior of a MNC in allocating its production between a high-
wage home country and a low-wage host country in order to be able to sell its
product to an export market (in a third country). The crucial result of the model
is that for the workers in the host country to be able to produce the good, the
MNC has to train them.
Furthermore, several theoretical predictions were developed concerning
factors that determine the probability of spillover effects from enterprise training.
Analyzing a model with endogenous technological spillovers in the human-capital
markets Gersbach and Schmutzler (2003) present conditions at which spillovers
will occur. The general conclusion is that spillovers are more likely when they
increase total industry profits. Furthermore, several different setups are analyzed;
for instance, it was shown that if under Bertrand competition only one firm is
successful, spillovers will not occur, but if both firms are successful, asymmetric
spillovers will take place.
Most interesting for my discussion is, however, the model developed by
Fosfuri et al. (2001) who present a theoretical framework which rationalize the
importance of spillovers from personnel training by MNCs uncovered in
numerous empirical studies. The basic idea behind the model is that a particular
MNC possess a certain advantageous technology or other relevant information
and uses it to produce goods and services. The MNC sells its product in the
12
foreign market and therefore decides on whether to export or to establish an
affiliate in the local country via FDI. If chosen, FDI requires the MNC to transfer
its technology to the host country subsidiary, which is done through oral
communication or on-the-job training. Consequently, the MNC hires a local
worker and trains her either at the subsidiary, or at the parent company. The
trained worker then participates in the MNC production during the first period
(the MNC writes a one-period contract with the worker). In period two both the
MNC and a local enterprise (which could sell the product if it knew the
technology) compete for the hiring of the trained worker. If the MNC will hire
the worker, it will continue to earn monopoly profit; otherwise, it will earn
duopoly profit in the second period. Eventually, if the MNC hires the worker and
pays her higher wage, a pecuniary spillover emerges; if the worker moves to a
local firm, a technological spillover occurs.
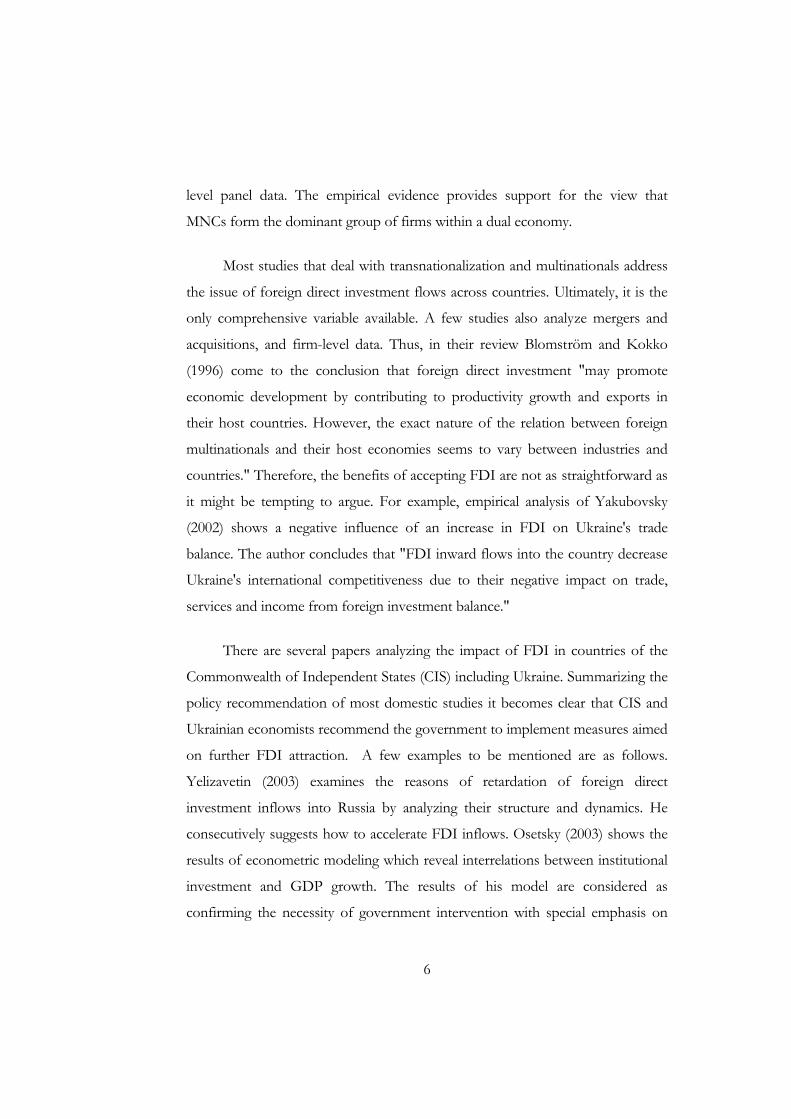
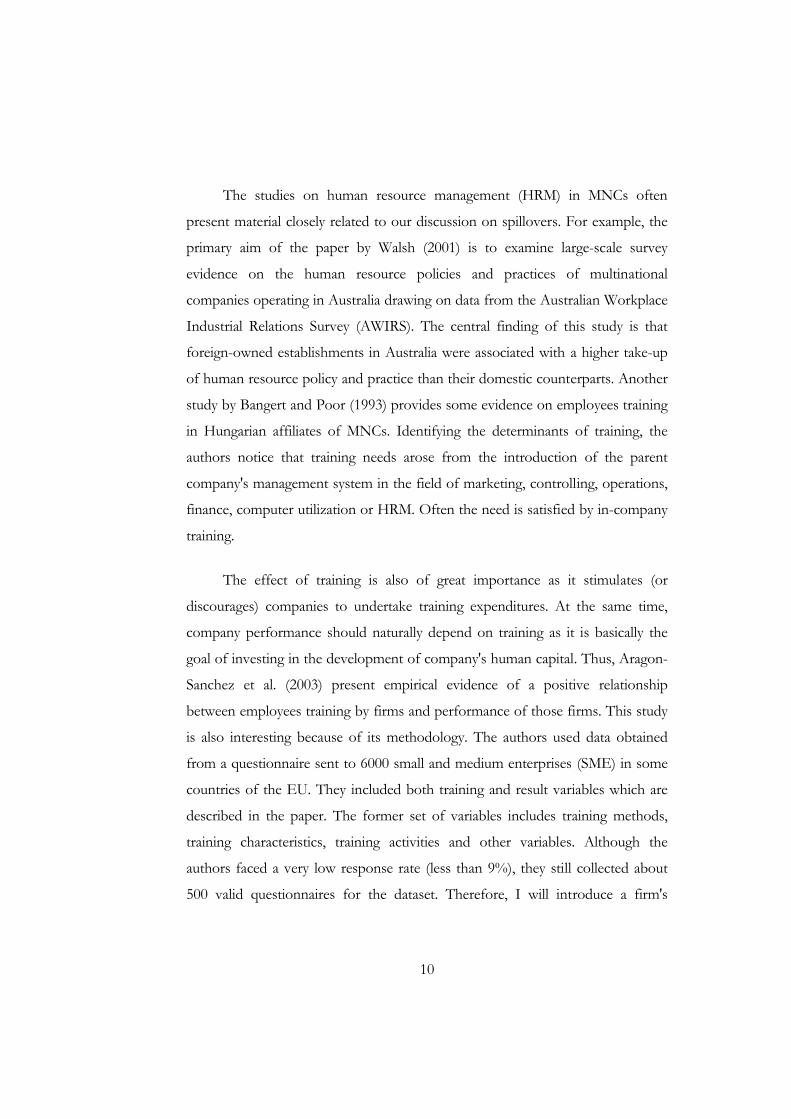
In a very simplified manner the basic outcomes of the model can be
summarized as at figure 1. So, the possibility of technological spillovers increases
if the MNC and the indigenous firm are not direct competitors. If competition is
low and technology could be easily transferred, knowledge spillovers are likely to
occur. If competition is high, the local firm would get low profits from hiring the
trained worker and the MNC would retain the worker by paying a small
additional wage. Thus, pecuniary spillovers would occur. Finally, there is a region
where it is more efficient for the MNC to export rather then to do FDI in order
not to dissipate its technology.
13
Even though the authors do not test their model empirically, several
important predictions could be inferred as to the determinants of the training
decisions. The most obvious one is that the necessity of training is determined by
the low quality of the workforce in the host countries. Hence, the lower is the
perceived quality of workers in the country the more training should be provided
by the foreign firm to match skills of its employees to requirements of existing
technology. At the same time, Blomström and Kokko (2003), stressing the
importance of labor force quality in the host country as a determinant of training
provided by the company, notice that if local workers are highly qualified it is less
costly to train them further so that the employer will benefit from providing
training more than if its employees are unskilled. Yet another study by Frazis et al.
(2000) provides empirical support for the fact that education is positively related
to the receipt and intensity of formal training. However, this may not be as
high competition
low competition
0
1
k technology transferability costs
FDI and Pecuniary Spillovers
Exports + FDI
FDI and Knowledge Spilloversco
mpe
titiv
enes
s
FIGURE 1. THE EQUILIBRIUM OUTCOME OF THE MODEL Source: Fosfuri et al. (2001), p. 213
14
contradictory as it seems if one distinguishes between the general quality of the
workforce in the country and the quality of employees at a particular enterprise.
While the former should be negatively related with training, the latter is likely to
influence receipt of training positively. Arguably, formal qualifications (education)
which proxy cognitive skills and ability should signal the possibility of higher
return of training at lower costs since training and general education are
considered to be complementary activities (Harris, 1999).
Furthermore, competition is nothing less than the most important factor
driving enterprise training. Firms in the competitive market must maintain their
positions by advancing the production process, particularly, by developing
productive skills of their personnel. On the contrary, firms that are protected
from competition are less likely to engage in training which is costly. It is also
important to note that domestic and international competitions are likely to affect
firms' decisions via different channels suggesting another determinant of training
– export/domestic marketing orientation of the firm. Export-oriented firms are
more likely to be affected by international competitors, non-export-oriented ones
− by domestic competitors. In short, the more competitive the market is the
more a firm has to train its employees in order to survive.
Presenting a theory of training Acemoglu and Pischke (1997) argue that a
firm's interest in personnel training is driven by the possibility to extract a part of
an increased marginal product of trained workers. Distinguishing between general
and firm-specific training the authors show that firms should pay not only for the
latter but also for the former form of training. As the study suggests, "in order to
explain firms' investments in general skills, some labor market imperfections must
exist so that the mobility of workers is restricted and that employers can earn
rents on trained workers". Finally, it is natural to suggest that labor market
conditions in general should influence enterprise training arrangements. As
15
Blomström and Kokko (2003) summarize, the amount of training provided to
MNCs' employees "vary depending on industry, mode of entry, size and time
horizon of investment, type of operations, and local conditions."
To conclude this review I look as a matter of course at empirical studies
investigating determinants of enterprise training. Most of the evidence comes
from survey data which is often not specifically constructed in a way that best
suits the desirable model specification. Therefore, researchers are forced to
operate with available data which often determines the choice of variables. As it
works out, there is a set of 'conventional' factors which is used to specify a model.
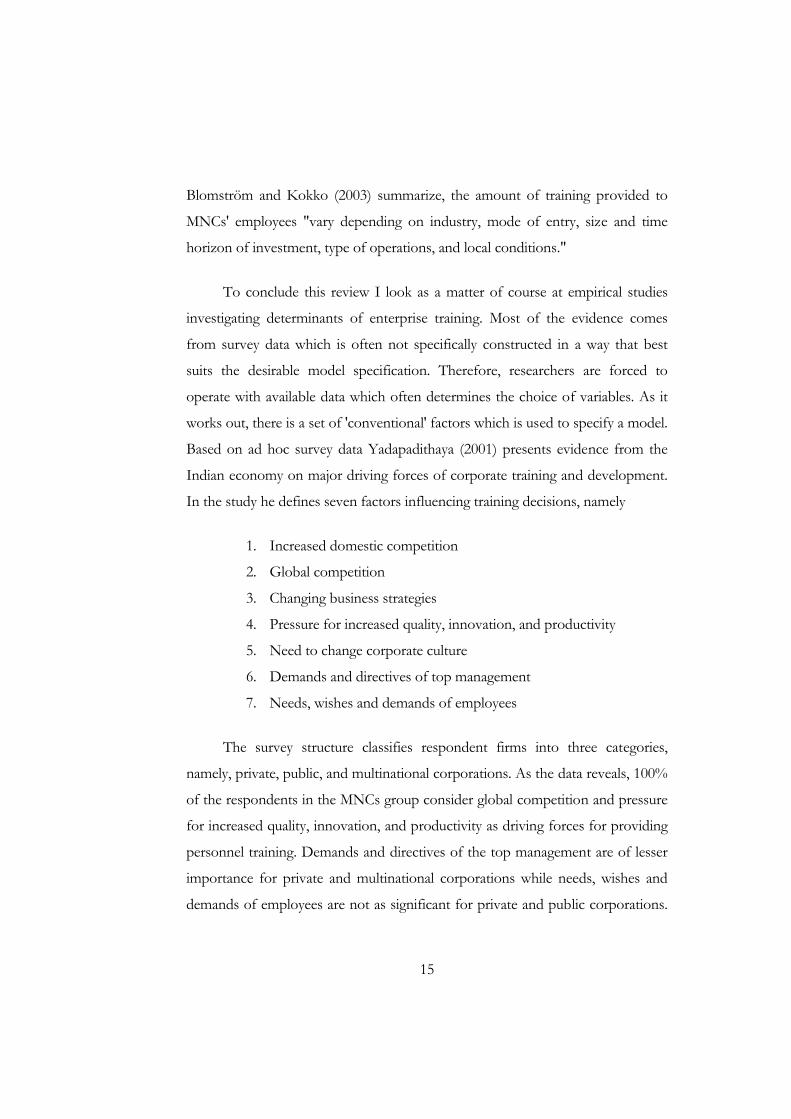
Based on ad hoc survey data Yadapadithaya (2001) presents evidence from the
Indian economy on major driving forces of corporate training and development.
In the study he defines seven factors influencing training decisions, namely
1. Increased domestic competition
2. Global competition
3. Changing business strategies
4. Pressure for increased quality, innovation, and productivity
5. Need to change corporate culture
6. Demands and directives of top management
7. Needs, wishes and demands of employees
The survey structure classifies respondent firms into three categories,
namely, private, public, and multinational corporations. As the data reveals, 100%
of the respondents in the MNCs group consider global competition and pressure
for increased quality, innovation, and productivity as driving forces for providing
personnel training. Demands and directives of the top management are of lesser
importance for private and multinational corporations while needs, wishes and
demands of employees are not as significant for private and public corporations.
16
Ultimately, above factors are marked as important by a reasonable number of
respondents in each category.
Characteristics of the workplace were used as determinants of training in an
empirical study by Sutherland (2004) analyzing the 1998 Workplace and Employee
Relations Survey (US). The results confirm that, among others, such factors as age,
educational qualifications, occupation, and the size of the workplace are
important determinants of the probability that an individual receives training.
In literature, the size of the firm is usually positively associated with
training. A possible reason is that training implies economies of scales; and early
empirical studies had found relatively little training in small firms with less than
50 employees (Frazis et al., 2000). Also, as Harris (1999) notices, "large employers
actually take a different approach to small employers with regard to the riskiness
of investing in their employees," so that large firms tend to provide more training.
Smith and Hayton (1999) developed, probably, the best grounding for their
survey concerning enterprise training in Australia. Based on case-studies of forty-
two individual enterprises in five industry sectors and covering local, national, and
multinational firms the authors defined a set of factors that were perceived as
important for firms when making decisions on personnel training. Based on these
preliminary results they constructed a survey of Australian enterprises covering all
industries in the private sector. They found, for instance, that the size of the
organization and industry sector have a strong positive relationship with training,
investments in new products or technology influences training positively but to a
smaller extent while enterprise ownership (Australian versus multinational
enterprise) turns out to have no significant effect.
Having identified the determinants of enterprise training I further proceed
with the empirical part of my study which tests the effects of foreign ownership

17
on the probability of training, thus analyzing the possibility of human capital
spillovers as a result of economic globalization process.
18
C h a p t e r 3
MODEL CONSTRUCTION AND DATA
"Available data on job training suffer from poverty amidst plenty" (Frazis et al., 2000)
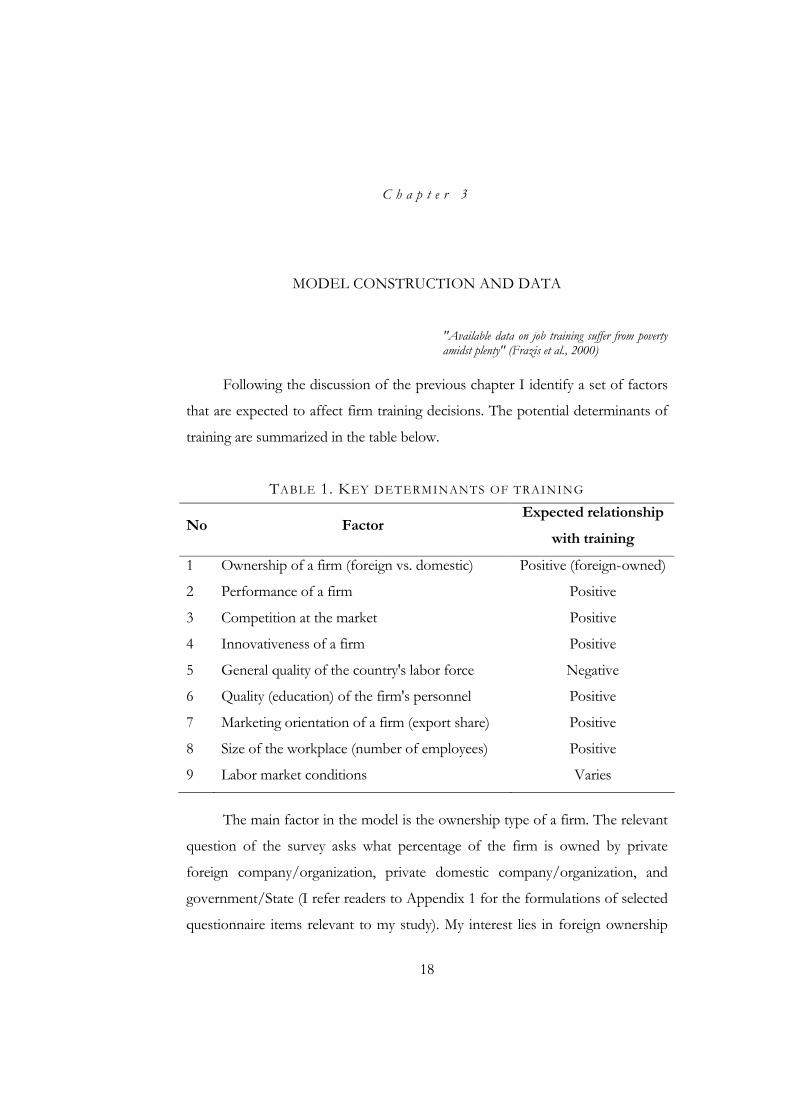
Following the discussion of the previous chapter I identify a set of factors
that are expected to affect firm training decisions. The potential determinants of
training are summarized in the table below.
TABLE 1. KEY DETERMINANTS OF TRAINING
No Factor Expected relationship
with training
1 Ownership of a firm (foreign vs. domestic) Positive (foreign-owned)
2 Performance of a firm Positive
3 Competition at the market Positive
4 Innovativeness of a firm Positive
5 General quality of the country's labor force Negative
6 Quality (education) of the firm's personnel Positive
7 Marketing orientation of a firm (export share) Positive
8 Size of the workplace (number of employees) Positive
9 Labor market conditions Varies
The main factor in the model is the ownership type of a firm. The relevant
question of the survey asks what percentage of the firm is owned by private
foreign company/organization, private domestic company/organization, and
government/State (I refer readers to Appendix 1 for the formulations of selected
questionnaire items relevant to my study). My interest lies in foreign ownership
19
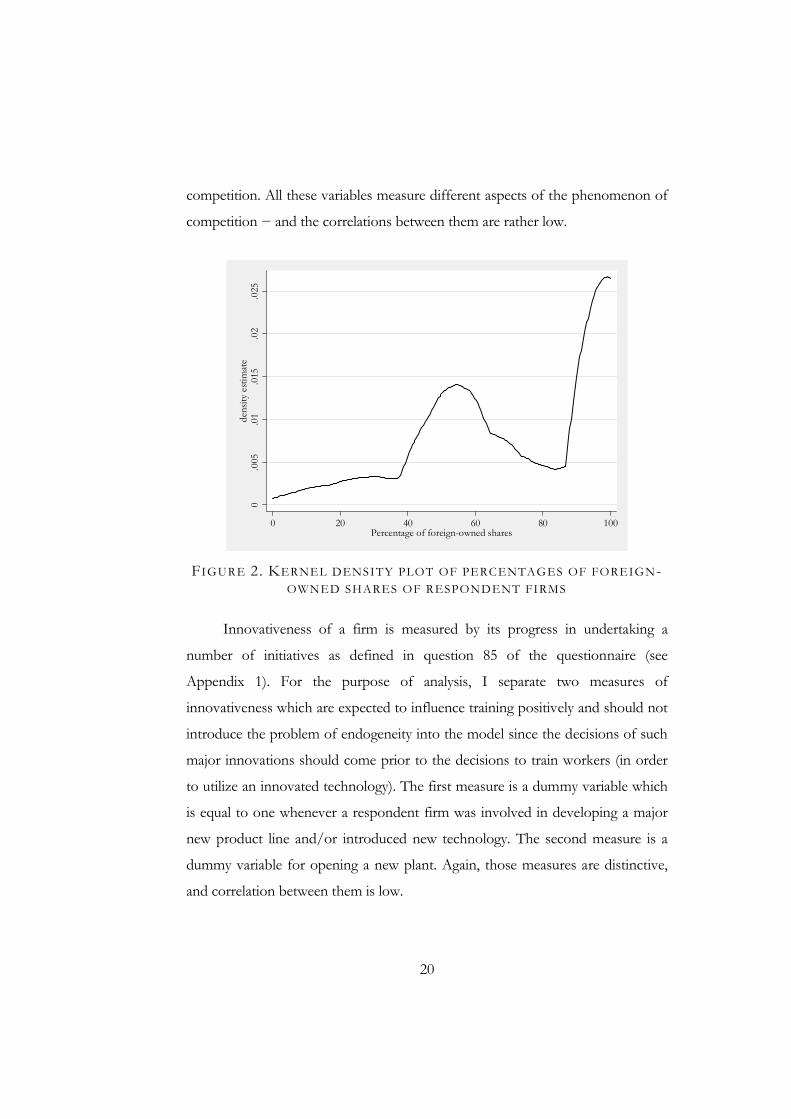
which I expect to influence the probability of providing personnel training by the
firm positively. The summary of the distribution of respondents by type of
ownership is presented in table 2. As can be seen, there are 1077 firms that have
their shares owned by a foreign company/organization. The percentage of
foreign-owned shares varies from 0 to 100% with mean value of 13%. The
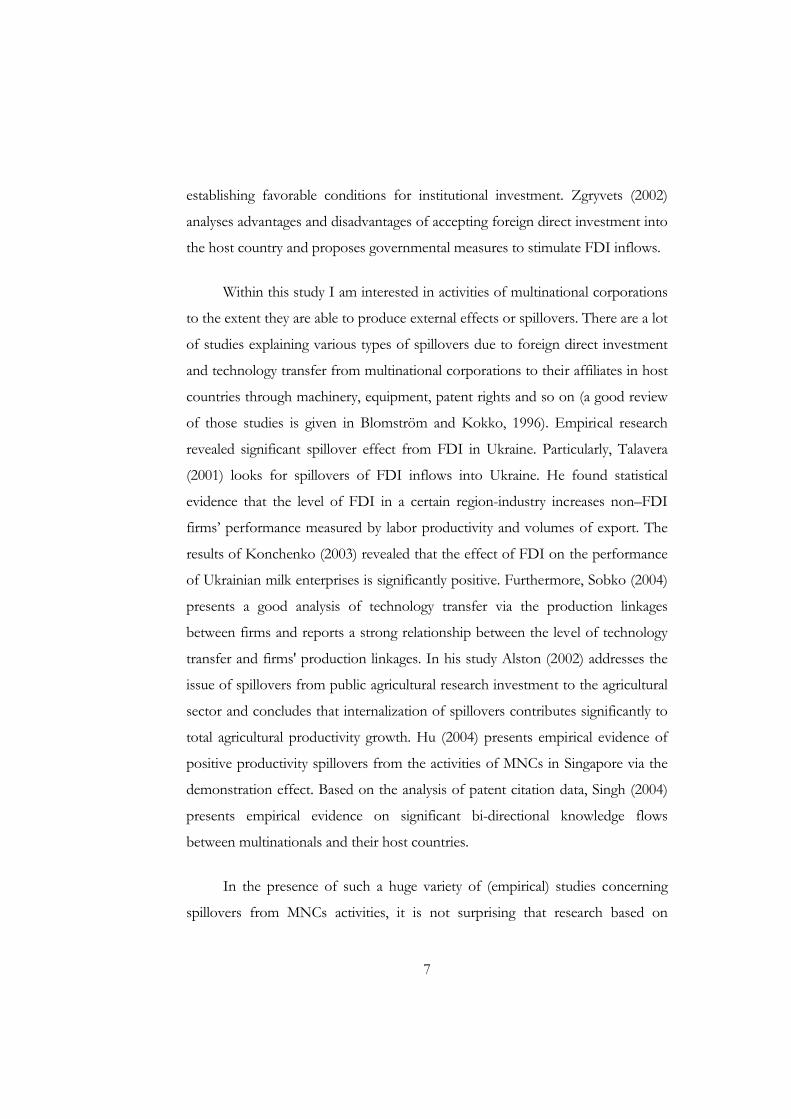
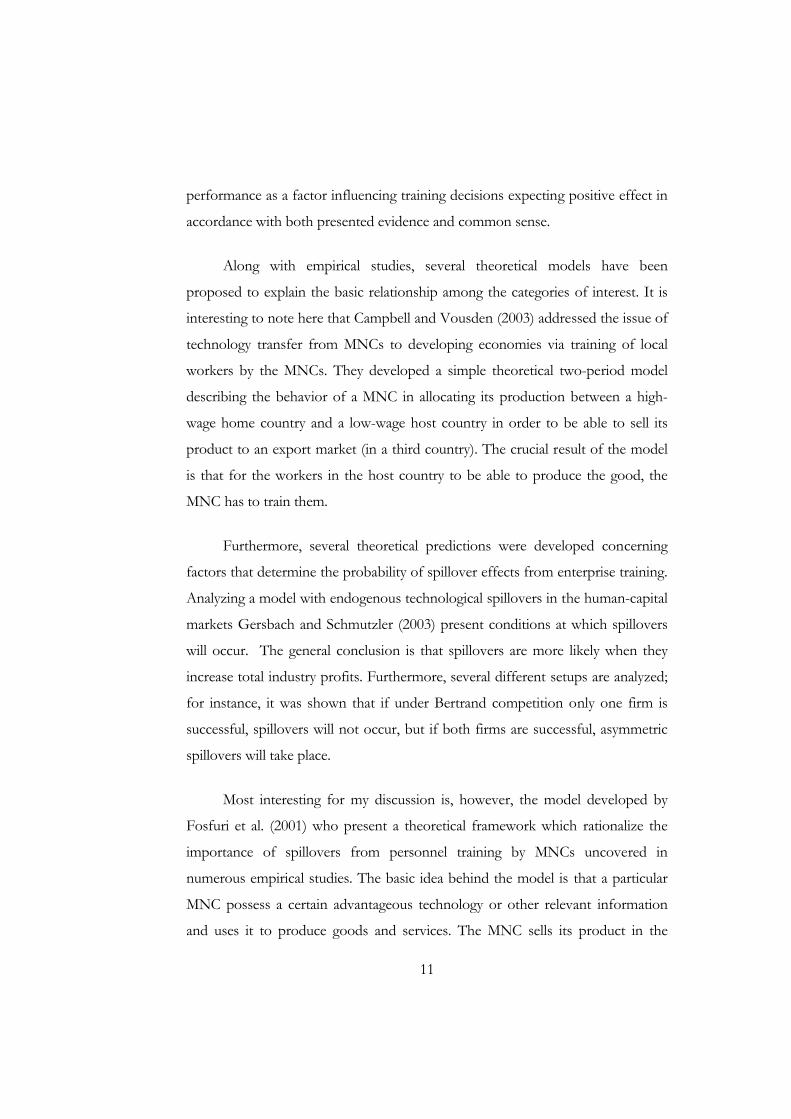
coefficient of variation is 2.34. As illustrated in figure 2, the data exhibit the usual
pattern for survey responses – a large mass is concentrated near round numbers
like 50 and 100% (kernel density estimate is presented for non-zero observations;
estimates of bounds are biased but are of little interest for the purpose of this
discussion). Therefore, the percentage of foreign-owned shares has enough
variability across the sample, making it a reliable independent variable in the
model.
TABLE 2. OWNERSHIP TYPE OF RESPONDENT FIRMS.
The number of firms that has shares owned by: # obs % (out of
6667)
Private foreign company/organization 1077 16.2
Private domestic company/organization 4860 72.9
Government/State 1133 17.0
To measure competition, I use three distinct variables. First of all, I
introduce a dummy variable capturing a monopolistic/oligopolistic position of
the firm and taking the value one whenever a firm faces either none or 1-3
competitors in the major product line. Furthermore, I use subjective
characteristics of the firm's technology − comparable to that of the main
competitor − to proxy for the competitive position of a firm's technology on the
market. Finally, I introduce the importance of competition from imports in the
market for a firm's main product line or main line of services in the domestic
market. This variable aims to distinguish between global and domestic
20
competition. All these variables measure different aspects of the phenomenon of
competition − and the correlations between them are rather low.
0.0
05.0
1.0
15.0
2.0
25de
nsity
esti
mat
e
0 20 40 60 80 100Percentage of foreign-owned shares
FIGURE 2. KERNEL DENSITY PLOT OF PERCENTAGES OF FOREIGN-
OWNED SHARES OF RESPONDENT FIRMS
Innovativeness of a firm is measured by its progress in undertaking a
number of initiatives as defined in question 85 of the questionnaire (see
Appendix 1). For the purpose of analysis, I separate two measures of
innovativeness which are expected to influence training positively and should not
introduce the problem of endogeneity into the model since the decisions of such
major innovations should come prior to the decisions to train workers (in order
to utilize an innovated technology). The first measure is a dummy variable which
is equal to one whenever a respondent firm was involved in developing a major
new product line and/or introduced new technology. The second measure is a
dummy variable for opening a new plant. Again, those measures are distinctive,
and correlation between them is low.
21
The general quality of a country's labor force is proxied by the subjective
measure of skills and education of available workers. Respondents were asked to
rank the importance of this factor for the operation and growth of the business
on the "no obstacle − major obstacle" scale. If respondent consider skills and
education of available workers as a moderate or major obstacle, the dummy for
low general labor force quality takes the value of one.
Furthermore, education of the existing workers is an important factor that
is likely to influence training activities of firms. It proxies for the quality of
employees at a particular enterprise.
The summary of the dataset with respect to workers' education is presented
in table 3. Under the proposed classification, about half of the workers at an
average firm have secondary school diploma at most; those with university degree
or higher constitute a top quartile of the distribution.
TABLE 3. AVERAGE DISTRIBUTION OF THE WORKFORCE EDUCATION LEVELS AT SAMPLED FIRMS
Education level %
Did not complete primary school 0.5
Primary schooling 6.0
Some secondary school 10.9
Secondary school diploma 50.2
Some university 7.2
University degree or higher 25.2
The effect of the average education level on training activities of the firm,
however, may not be that simple as it might be tempting to suggest. The low level
of personnel education may correspond to the technological process where non-
qualified work is required. Therefore, the analysis has to control for the industry
22
effect and the relative importance of education for the firm. These control
variables are discussed later.
The next factor that is of interest in my model is the firm's orientation in
trade (domestically-oriented versus export-oriented). The relevant survey question
asks about the distribution of firms' sales across domestic selling and exporting.
The relevant statistics are presented in table 4. I expect that the bigger is the share
of a firm's sales that is exported, the more training is provided.
TABLE 4. DOMESTIC-EXPORT DISTRIBUTION OF FIRMS' SALES
The route # obs % (out of
6667)
Sold domestically 6513 97.7
Exported directly 1614 24.2
Exported indirectly through a distributor 400 6.0
The size variable which is used as a factor in my model measures the
number of full-time and part-time employees. There are two corresponding
questions in the survey which defines workplace size using the following sub-
classification (with respect to full-time workers): 2-49 workers, 50-250, and more
than 250 workers. A similar sub-classification is used to determine the number of
part-time employees. I introduce dummy variables to capture the size effect with
small-size enterprises considered as reference group.
General labor market conditions are mostly used to control for effects not
captured by the factors previously discussed; however, they are paid special
attention as the suggested relationship could have important policy implications
per se. I introduce a subjective measure of labor market obstacles as a factor
indicating general labor market conditions. This is measured by a relative ranking
attached to labor regulations as an obstacle for the operation and growth of the
23
business. Respondents were asked to choose an appropriate level at the scale
ranging from no obstacle to major obstacle.
The factor which is paid special attention here is the performance of a firm.
It is tempting to argue that high-performance firms will devote more resources
for R&D and, thus, will be involved in more personnel training. There is,
however, an obvious endogeneity problem arising with the performance variable
included in the model. As a firm trains its employees more, it is likely to improve
on its performance (otherwise, there should have been no reason to spend on
training at all). The endogeneity issue should, therefore, be tackled with an
appropriate econometrics technique, and I use two-stage estimation as discussed
in the next chapter. To proxy for firm performance I use the percentage change
in sales (in real terms) over the period 1998 - 2001.
Eventually, the dependent variable is personnel training in the firm. The
relevant question from the survey asks whether the firm offers formal training to
its employees in each category, where categories are defined as 'Managers',
'Professionals', 'Skilled workers', 'Unskilled workers', and 'Support workers'. (See
appendix 1 for a detailed description of selected survey questions). This variable
could readily be recoded as a binary response variable omitting the "Don't know"
category as irrelevant (it might be problematic to find a set of factors influencing
respondents' awareness of the issue). Thus, an appropriate model for a binary
outcome dependent variable may be fitted, and the obvious one is a simple logit
or probit model.
Summarizing the above discussion, I can formally represent the model as
follows.
( ) ( )γβα ⋅+⋅+== CXFY 1Pr ,
24
with F( ) being the cumulative probability density function (I use normal
for the reasons discussed later);
X being the matrix of factors as specified in table 1 and discussed above,
and
C being the matrix of control variables as defined below.
There is a familiar set of control variables included into the model, which in
turn can be subdivided into several groups as follows:
Country
Legal organization of a firm
Industry
Characteristics of firm's personnel
The legal organization of the sample companies is summarized in
Appendix 3. For the purpose of the analysis I am interested in whether an
enterprise is privately owned or state owned. There is no direct variable that
defines the industry in which a firm operates, but this can well be measured by
the variable that gives a firm's sales structure across several sectors. The proposed
classification defines the following sectors of the economy:
Mining and quarrying
Construction
Manufacturing
Transport storage and communication
Wholesale, retail, repairs
Real estate, renting and business services
Hotels and restaurants
Other
25
Characteristics of a firm's personnel include the structure of permanent
workforce across the different categories of employment (namely, managers,
professionals, skilled workers, unskilled workers, and support workers). This
classification corresponds to the classification of training and each group uses,
therefore, its own control variables.
To close the discussion in this chapter I provide a summary of the dataset
used in this study. The data are taken from The Business Environment and Enterprise
Performance Survey (BEEPS) II jointly conducted by the European Bank for
Reconstruction and Development (EBRD) and the World Bank. It is a survey
among managers and owners of firms. The second round of the survey (BEEPS
II) was conducted in 2002 and I use the results of this second round here. There
are 6667 observations available in total. Selected questionnaire items are
presented in Appendix 1.
The geography of data covers countries of Eastern Europe, the former
Soviet Union, and Turkey (27 countries in total). The distribution of observations
across countries is given in Appendix 2. There are 463 observations for Ukraine,
which constitutes 6.94% of all observations. Availability of the country's
attributes in the data allows me to control for the country-specific effects in the
model.
26
C h a p t e r 4
ESTIMATION RESULTS
To estimate the specified models, I use a normal probability model for
binary choice dependent variables (probit). It must be stressed here that the
choice of normal distribution versus logistic or, say, Weibull distribution nests in
the fact that in terms of predictions those models are essentially the same (I do
not consider a linear probability model for it is knowingly unreliable (Green,
2000). Even though the logit and probit models make different assumptions
about the variance of the residuals, these differences are absorbed in the relative
magnitudes of the coefficients. As Long and Freese (2003) notice, "in terms of
predictions there is little reason to prefer either logit or probit. If your substantive
findings turn on whether you used logit or probit, we would not place much
confidence in either result". Therefore, I have compared estimates from both
logit and probit models, and found them similar enough to consider only one of
them.
An important issue to be discussed here is the above mentioned potential
endogeneity in the relationship between training and firm performance. To deal
with this problem, I use a two-stage testing and estimation procedures formally
discussed in Appendix 5. To instrument firm performance, I use the set of
variables which include measures of firm size and a subjective measure of
optimality of employment (see Appendix 4 for description of variables). As a
result of the testing procedure, the hypothesis of no endogeneity was rejected at
the 5% level of significance for two out of five regressions, namely, for managers
and professionals training models. In the models for training of skilled, unskilled,
and support workers the hypothesis of no endogeneity was not rejected at the 5%
27
level. This is quite intuitive. So I proceed further with estimating constructed
models instrumenting for endogeneity in the models for managers and
professionals training. For comparison Appendix 7 presents an Amemiya
Generalized Least Squares (AGLS) estimators for probit with endogenous
regressors (the endogenous regressors are treated as linear functions of the
instruments and the other exogenous variables). There is, obviously, some though
not very big difference between above estimators but the main properties are
consistent across two methods.
The results of the probit models are presented in Appendix 6. In order to
proceed with presentation of estimation results I will discuss several measures of
goodness of fit statistic and robustness tests. At this point it is important to
notice that measures of goodness of fit for binary response models are often
flawed and, as Green (2000) stresses, "the important element to bear in mind is
that the coefficients of the estimated model are not chosen so as to maximize this
[predictive ability of the model versus naïve predictor] (or any other) fit measure,
as they are in the linear regression model". Furthermore, "there is no convincing
evidence that selecting a model that maximizes the value of a given measure of fit
results in a model that is optimal in any sense other than the model's having a
larger value of that measure" (Long and Freese, 2003).
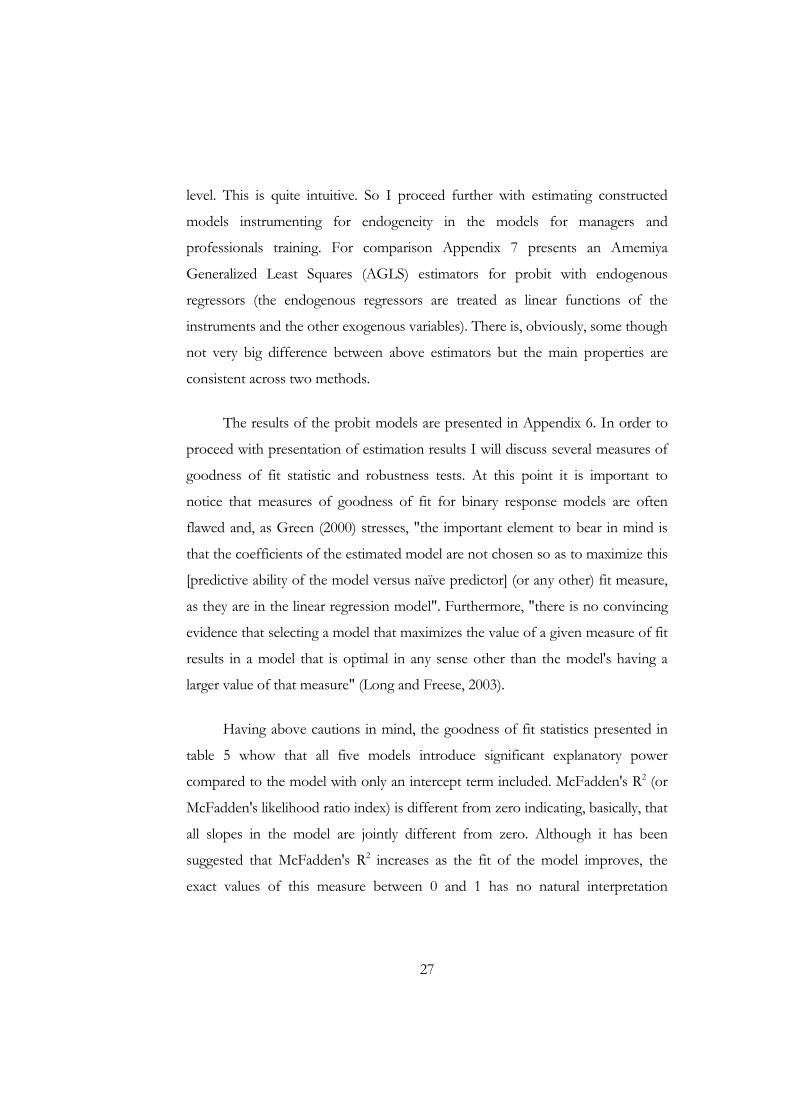
Having above cautions in mind, the goodness of fit statistics presented in
table 5 whow that all five models introduce significant explanatory power
compared to the model with only an intercept term included. McFadden's R2 (or
McFadden's likelihood ratio index) is different from zero indicating, basically, that
all slopes in the model are jointly different from zero. Although it has been
suggested that McFadden's R2 increases as the fit of the model improves, the
exact values of this measure between 0 and 1 has no natural interpretation
28
(Green, 2000). Some of the other measures of fit presented here2 are Cragg and
Uhler's R2 (which is an alternative relative index to maximum likelihood R2),
McKelvey and Zavoina's R2 which is an attempt to measure model fit as the
proportion of variance accounted for, Efron's R2 (yet another model fit index
based on the proportion of variance accounted for), Count R2 which is the
proportion of correctly classified observations, and Adjusted Count R2 which is
the proportion of correct guesses beyond that by guessing the largest marginal
(and thus an improvement to Count R2 which can often be misleading).
TABLE 5. SCALAR MEASURES OF FIT FOR PROBIT MODELS Dependent variable – training for defined categories of
employees Measure Managers Profess. Skilled Unskilled Support
Log-Lik Intercept Only
-2795.760 -2921.191 -2926.238 -1326.677 -1516.204
Log-Lik Full Model -2286.358 -2345.762 -2444.444 -1108.950 -1213.852LR(51) 1018.805 1150.858 963.588 435.454 604.705Prob > LR 0.000 0.000 0.000 0.000 0.000McFadden's R2 0.182 0.197 0.165 0.164 0.199McFadden's Adjusted R2 0.164 0.179 0.147 0.125 0.165
Craig & Uhler's R2 0.200 0.227 0.190 0.109 0.145
McKelvey and Zavoina's R2
0.328 0.373 0.309 0.273 0.321
Efron's R2 0.210 0.235 0.196 0.142 0.186Count R2 0.752 0.731 0.726 0.892 0.874Adjusted Count R2 0.177 0.259 0.189 0.040 0.060
Apart from the conclusion of the models' significance, what can be inferred
is that the model for professionals training has the best fit and the model for
managers training is approximately as good in the sense of fit as the one for
professionals. At the same time, one must be cautious when attempting to argue
2 See http://www.gseis.ucla.edu/courses/ed231c/notes3/fit.html for an overview of those measures
29
that the other three models fit worse. Ultimately, there is some support (neither
weak nor strong) for significance of all five models considered.
Finally, a special emphasis should be made on possible heteroscedasticity
problems in the residuals of the model. Even though for the simple least square
estimators heteroscedasticity results in inefficiency while the estimators remain
unbiased and consistent, for probit (and logit) models the drawbacks are much
more severe. If the disturbances in the underlying regression are heteroscedastic,
the ML estimators are inconsistent (Green, 2000). To test for heteroscedasticity
in the models, I implement a likelihood ratio test as discussed in Green (2000).
Fortunately, for reasonable assumptions of possible heteroscedasticity the tests
fail to reject the null hypothesis of homoscedastic disturbances at conventional
confidence levels.
To conclude with the analysis of regressions properties, I present ML
estimates with robust variance estimator (i.e. the Huber/White/sandwich
estimator of variance) for the reason of correcting for arguable misspecification
problems as discussed in Sribney (1998). The estimates are presented in Appendix
8. There is really little difference between standard errors of coefficients estimated
with the robust variance estimator and the usual ML variance estimator.
Now let me proceed with a discussion of the results. The coefficients of
the probit model do not show the change in the probability of the dependent
variable being equal to one due to a unit change in the relevant explanatory
variable. This probability is given by the marginal effect of the explanatory
variable3. The estimated marginal effects for the probit models are reported in
Appendix 9. One should note, however, that in case when an explanatory variable
is postulated to change by an amount that is not infinitesimal, the marginal effect
3 Which is the partial derivative of the expression for prob(y=1) with respect to the factor.
30
computed in a conventional way may be misleading. Relevant changes should be
calculated as a difference in the estimated probabilities.
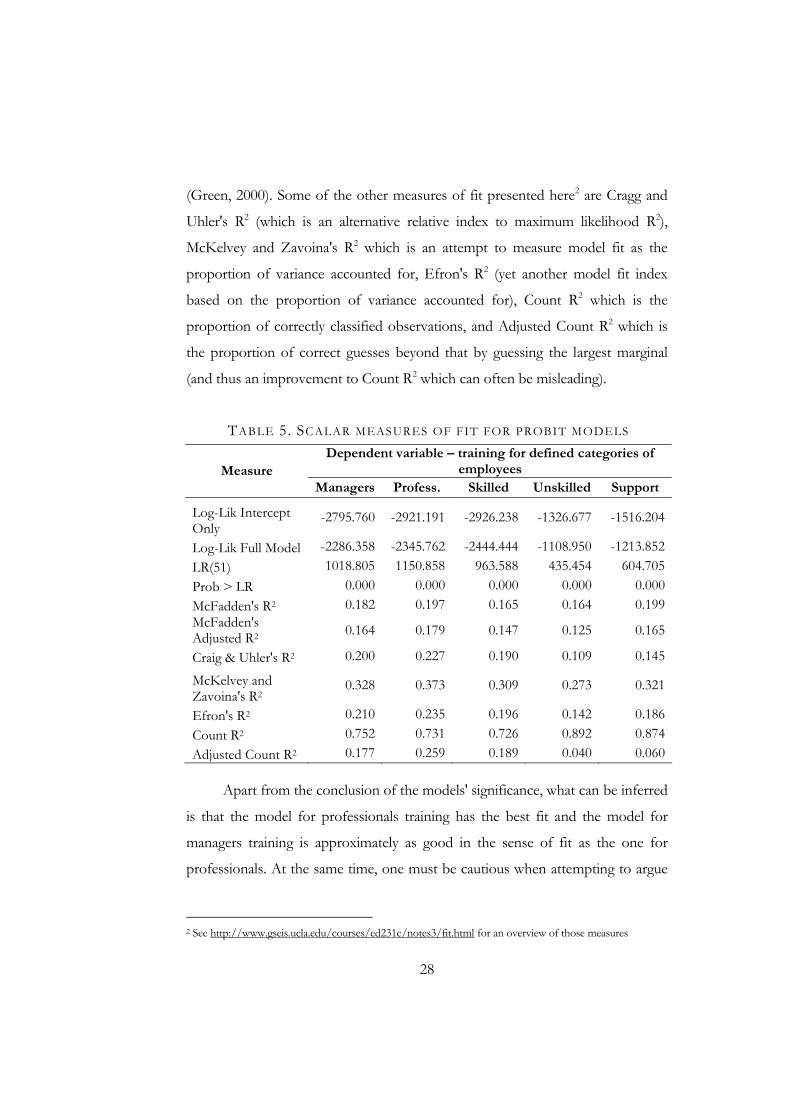
The main question of interest in this study is to estimate whether foreign
ownership matters for the probability of enterprise training incidence. The
relevant statistics are presented in table 6. At conventional confidence level s, the
effects of foreign ownership are significant for all but unskilled workers' training.
This supports my expectations based on the previous discussion.
TABLE 6. ESTIMATED EFFECTS OF FOREIGN OWNERSHIP ON THE PROBABILITY OF ENTERPRISE TRAINING
Changes in predicted probabilities of training incidence as percentages of
firms' shares owned by foreign company/organization increase from
0% to
Dependent variable: training
provided to a certain group of
employees
Marginal effect
25% 50% 75% 100% Managers 0.0015268*** 0.0382 0.0790 0.1219 0.1666Professionals 0.0009338*** 0.0234 0.0473 0.0718 0.0968Skilled workers 0.0005688** 0.0142 0.0287 0.0435 0.0585Unskilled workers 0.0001892 0.0048 0.0097 0.0149 0.0203Support workers 0.0004881*** 0.0122 0.0257 0.0404 0.0566
legend: * p<.1; ** p<.05; *** p<.01
Keeping in mind that marginal effects are computed at the means of all
explanatory variables (although there is a possibility to compute it at some
specific values, this is of little importance for the current purpose), they may not
represent the true change of probability, when a factor changes substantially.
Therefore, I also present changes in the predicted probabilities of training
incidence evaluated as the explanatory variable changes from 0 to 25, 50, 75, and
100 percent. The interpretation is as follows: as the percentage of firm's shares
owned by a foreign company/organization increases from 0% to, say, 50%, the
probability that a firm will provide training to its managers increases by 7.9%, and
so on. It is important to note that the highest effect of foreign ownership is on
31
the probability of managers training. Completely foreign-owned firms are 16.7%
more likely to train their managers than do domestically-owned ones. The effect
of foreign ownership on professionals training is somewhat smaller though still
substantial. Foreign-owned firms have a 9.7% higher probability of training their
professional workers than their domestically-owned counterparts. The effect on
training skilled and support workers is smaller and the corresponding probability
increase constitutes 5.9% and 5.7% respectively.
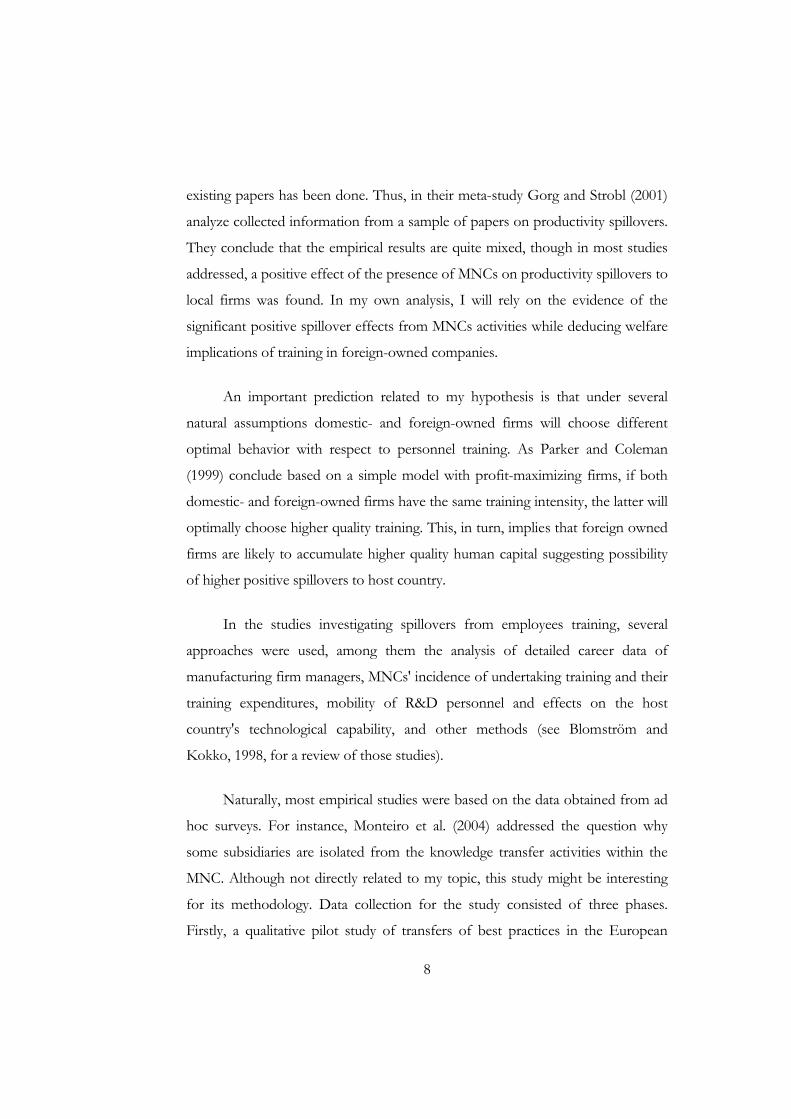
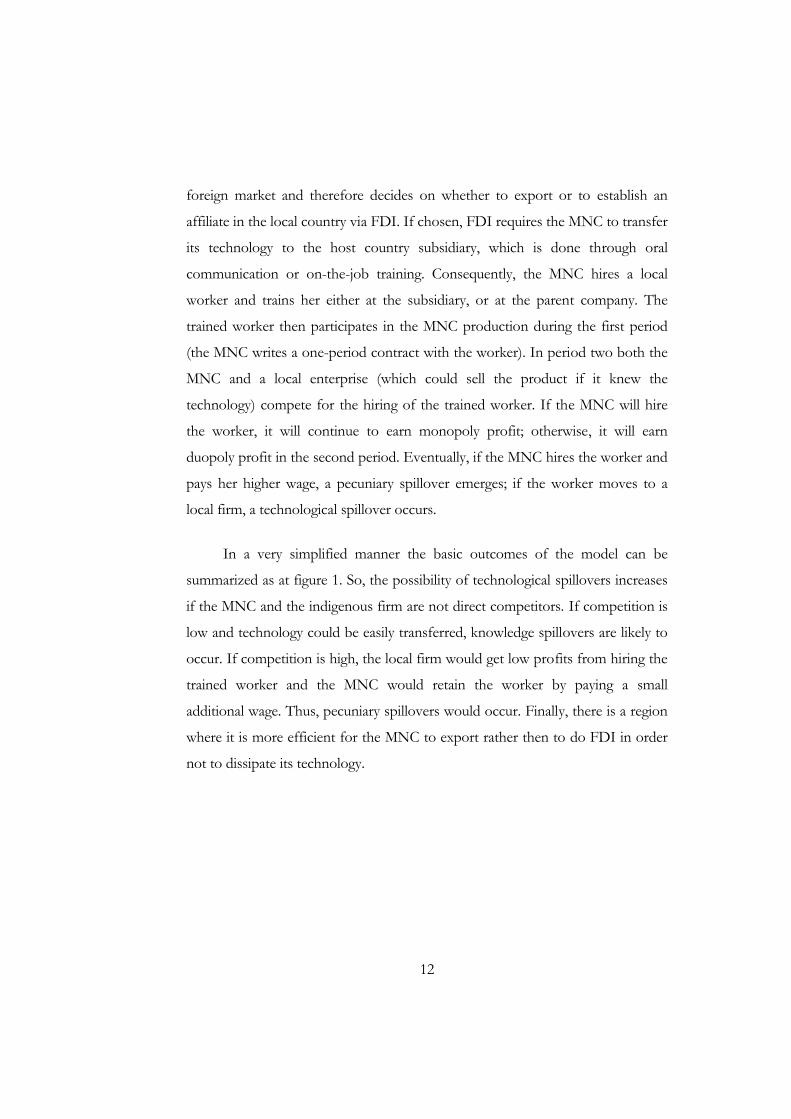
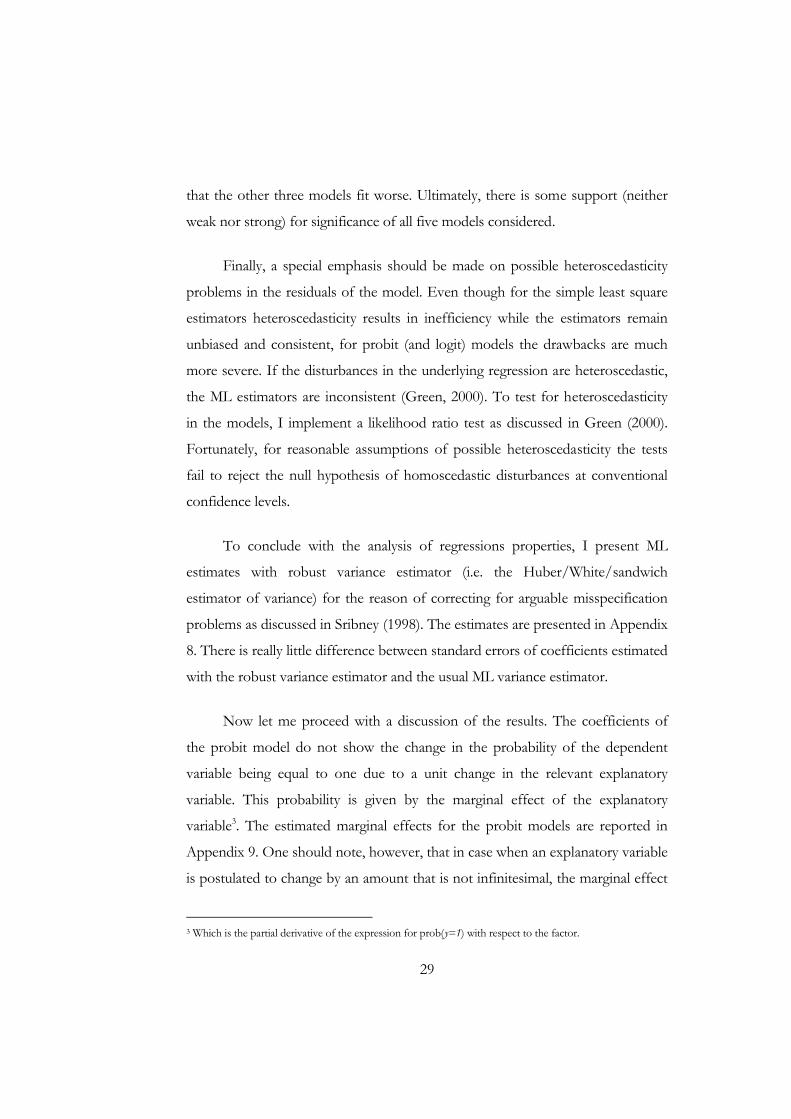
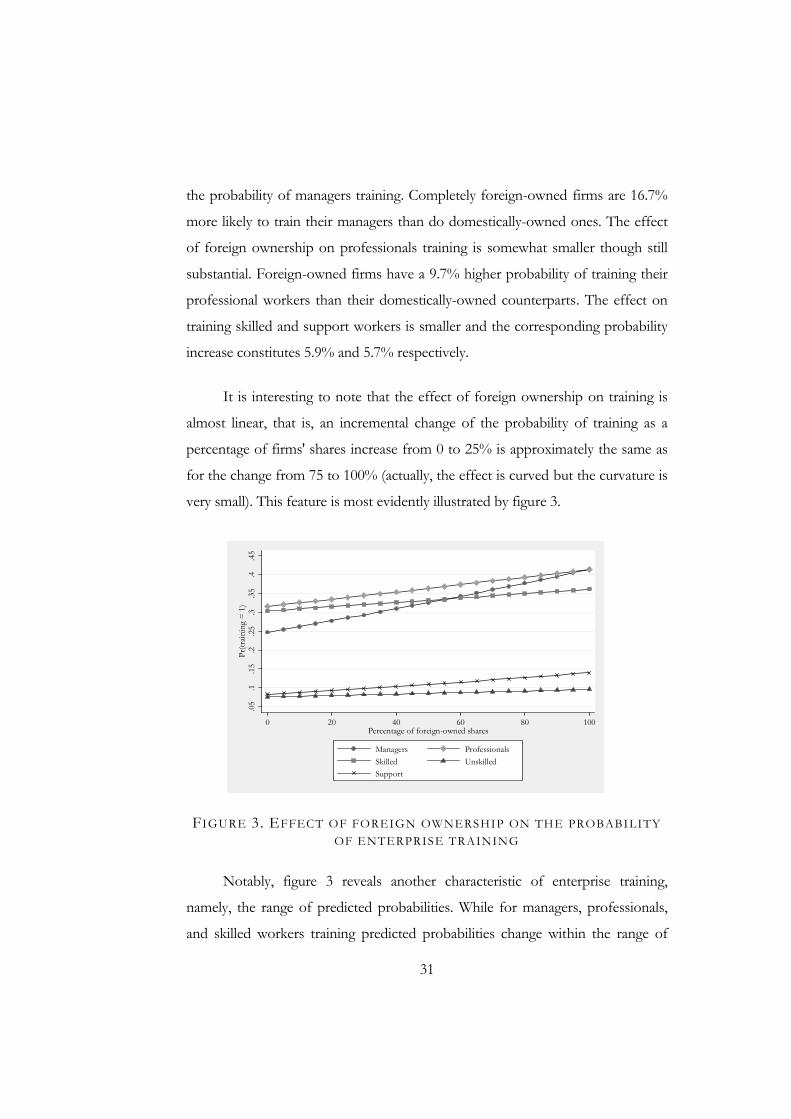
It is interesting to note that the effect of foreign ownership on training is
almost linear, that is, an incremental change of the probability of training as a
percentage of firms' shares increase from 0 to 25% is approximately the same as
for the change from 75 to 100% (actually, the effect is curved but the curvature is
very small). This feature is most evidently illustrated by figure 3.
.05
.1.1
5.2
.25
.3.3
5.4
.45
Pr(tr
ainin
g =
1)
0 20 40 60 80 100Percentage of foreign-owned shares
Managers ProfessionalsSkilled UnskilledSupport
FIGURE 3. EFFECT OF FOREIGN OWNERSHIP ON THE PROBABILITY OF ENTERPRISE TRAINING
Notably, figure 3 reveals another characteristic of enterprise training,
namely, the range of predicted probabilities. While for managers, professionals,
and skilled workers training predicted probabilities change within the range of
32
approximately 25-43%, the predicted probabilities of training support and
unskilled workers are extremely low – less than 15%. Ultimately, this observation
is consistent with economic intuition behind the phenomenon of training.
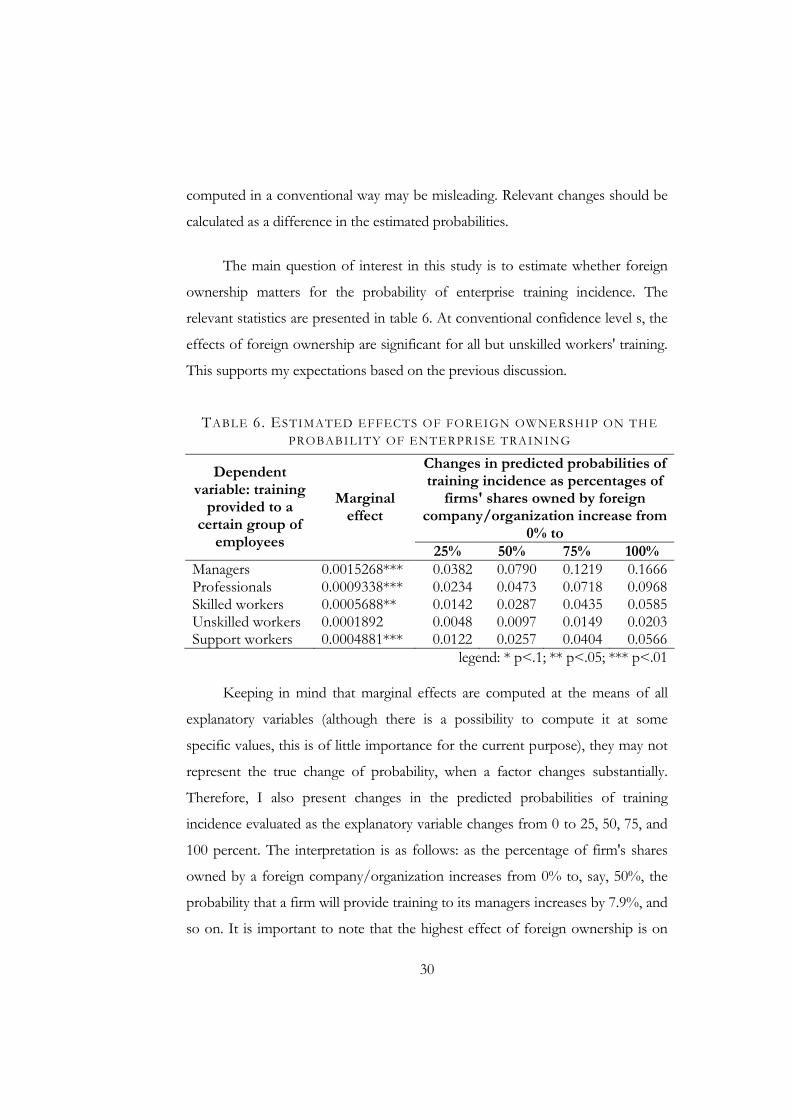
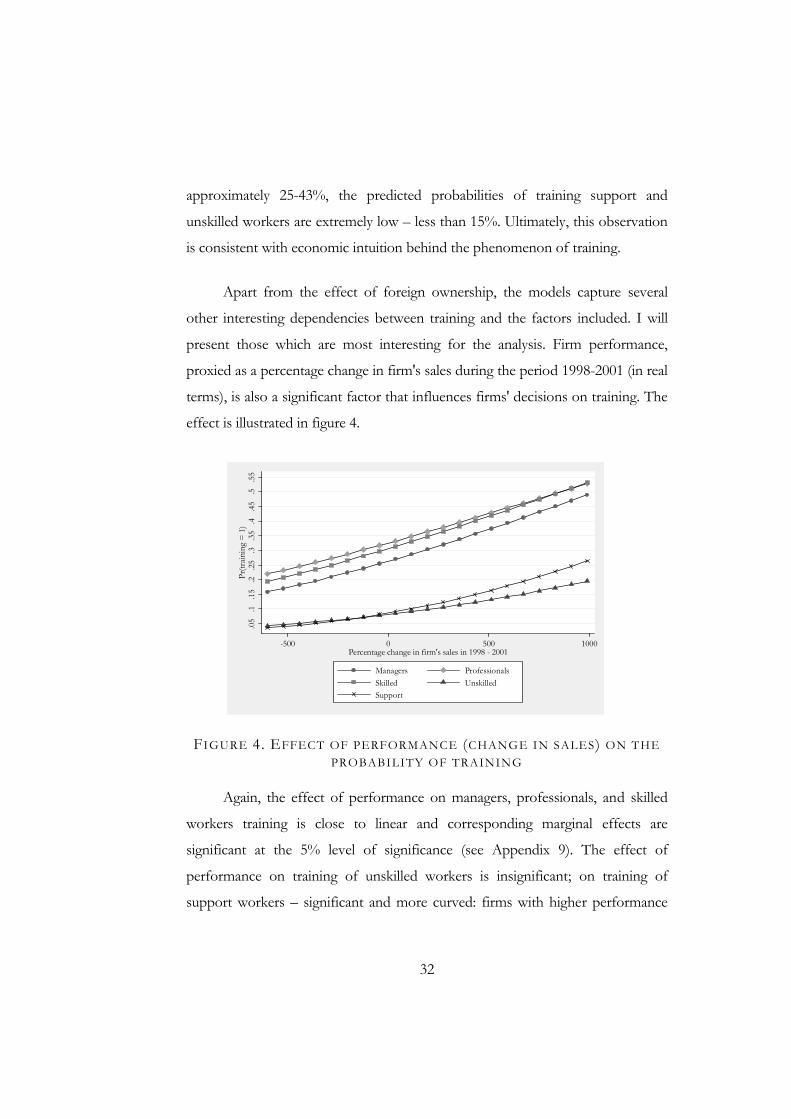
Apart from the effect of foreign ownership, the models capture several
other interesting dependencies between training and the factors included. I will
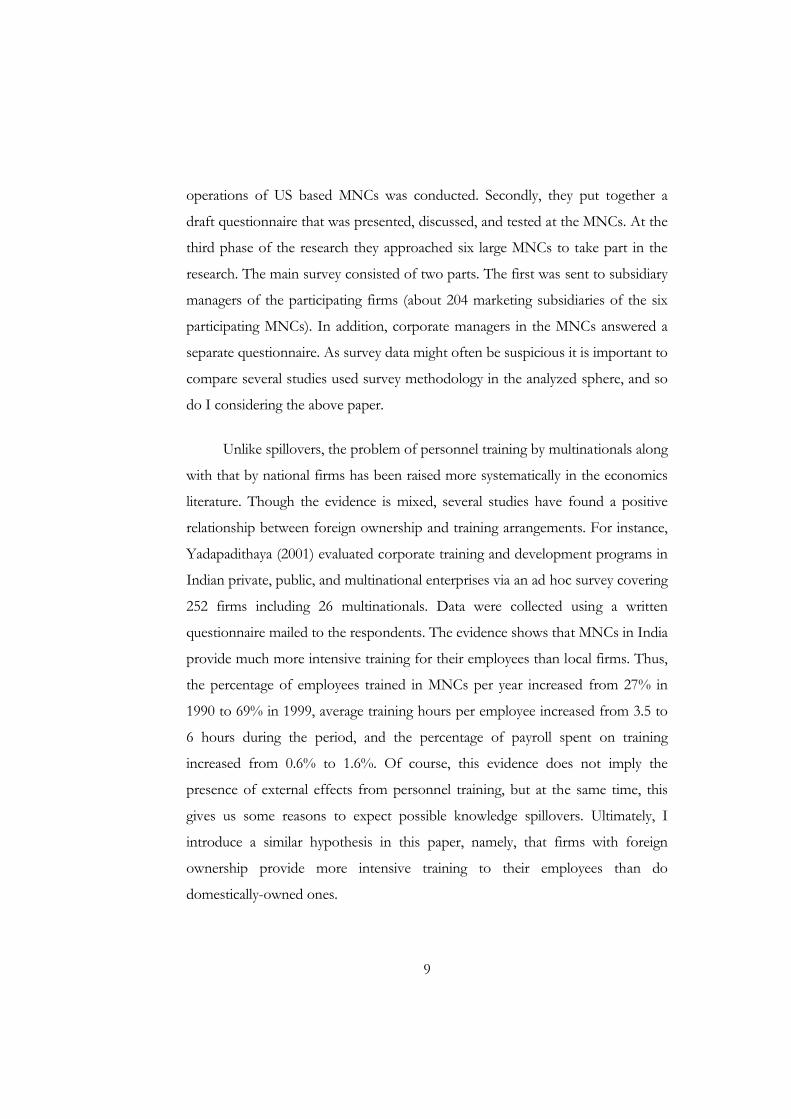
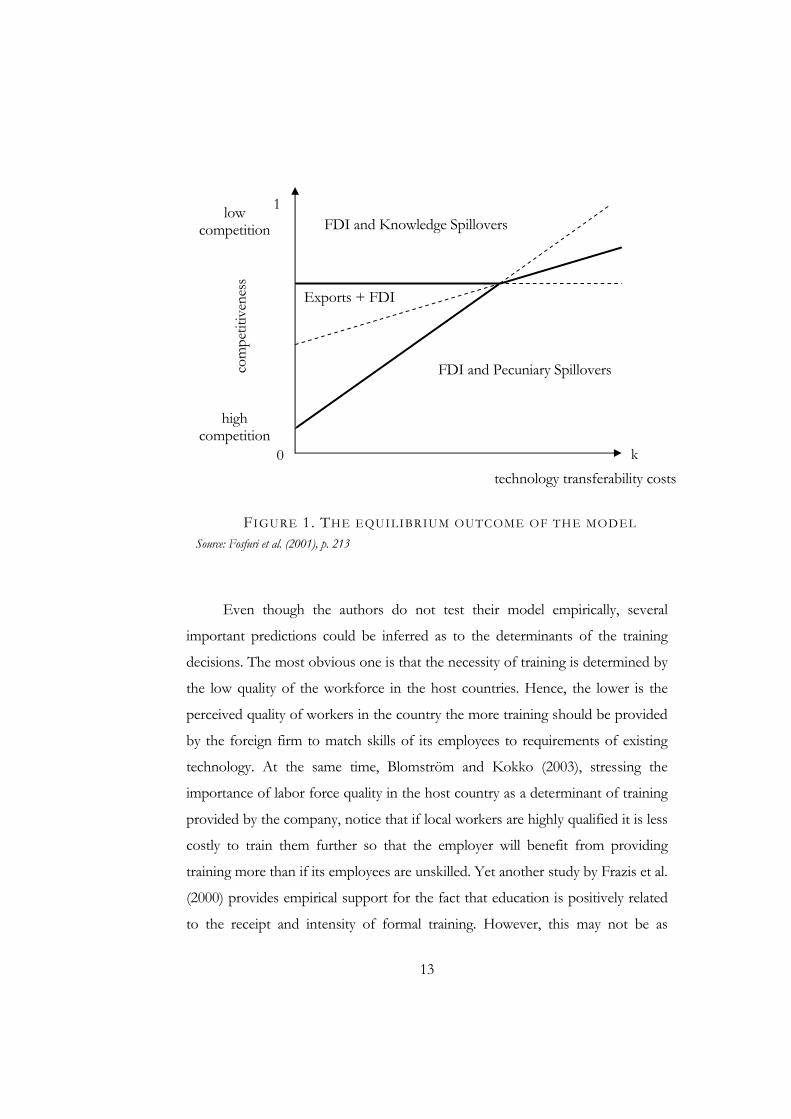
present those which are most interesting for the analysis. Firm performance,
proxied as a percentage change in firm's sales during the period 1998-2001 (in real
terms), is also a significant factor that influences firms' decisions on training. The
effect is illustrated in figure 4.
.05
.1.1
5.2
.25
.3.3
5.4
.45
.5.5
5Pr
(trai
ning
= 1
)
-500 0 500 1000Percentage change in firm's sales in 1998 - 2001
Managers ProfessionalsSkilled UnskilledSupport
FIGURE 4. EFFECT OF PERFORMANCE (CHANGE IN SALES) ON THE PROBABILITY OF TRAINING
Again, the effect of performance on managers, professionals, and skilled
workers training is close to linear and corresponding marginal effects are
significant at the 5% level of significance (see Appendix 9). The effect of
performance on training of unskilled workers is insignificant; on training of
support workers – significant and more curved: firms with higher performance
33
increase their training incidence to a greater extent as their performance improves
further.
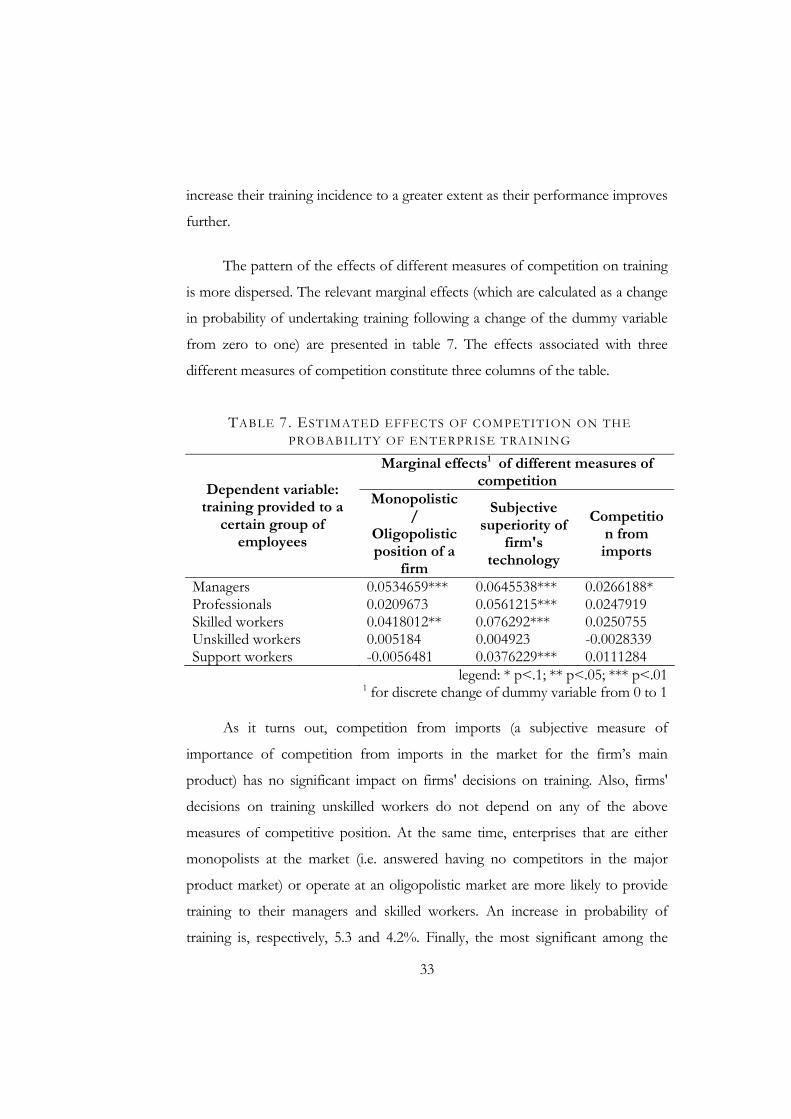
The pattern of the effects of different measures of competition on training
is more dispersed. The relevant marginal effects (which are calculated as a change
in probability of undertaking training following a change of the dummy variable
from zero to one) are presented in table 7. The effects associated with three
different measures of competition constitute three columns of the table.
TABLE 7. ESTIMATED EFFECTS OF COMPETITION ON THE PROBABILITY OF ENTERPRISE TRAINING
Marginal effects1 of different measures of competition
Dependent variable: training provided to a
certain group of employees
Monopolistic/
Oligopolistic position of a
firm
Subjective superiority of
firm's technology
Competition from imports
Managers 0.0534659*** 0.0645538*** 0.0266188* Professionals 0.0209673 0.0561215*** 0.0247919 Skilled workers 0.0418012** 0.076292*** 0.0250755 Unskilled workers 0.005184 0.004923 -0.0028339 Support workers -0.0056481 0.0376229*** 0.0111284
legend: * p<.1; ** p<.05; *** p<.01 1 for discrete change of dummy variable from 0 to 1
As it turns out, competition from imports (a subjective measure of
importance of competition from imports in the market for the firm’s main
product) has no significant impact on firms' decisions on training. Also, firms'
decisions on training unskilled workers do not depend on any of the above
measures of competitive position. At the same time, enterprises that are either
monopolists at the market (i.e. answered having no competitors in the major
product market) or operate at an oligopolistic market are more likely to provide
training to their managers and skilled workers. An increase in probability of
training is, respectively, 5.3 and 4.2%. Finally, the most significant among the
34
three measures is a perceived superiority of firm's technology compared to the
technology of the main competitor. Therefore, if firm's relative competitive
position in technology is high, the probability of this firm providing training to its
managers increases by 6.5%, to professionals – by 5.6%, to skilled workers – by
7.6%, and to support workers – by 3.8%.
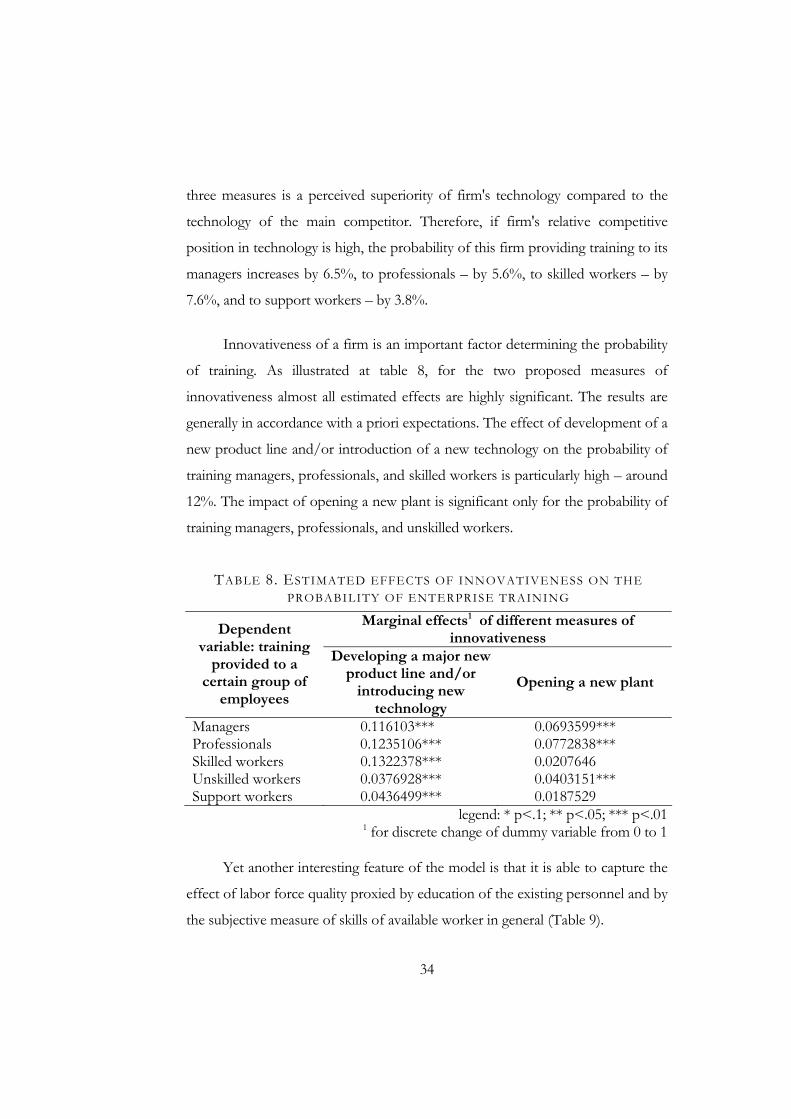
Innovativeness of a firm is an important factor determining the probability
of training. As illustrated at table 8, for the two proposed measures of
innovativeness almost all estimated effects are highly significant. The results are
generally in accordance with a priori expectations. The effect of development of a
new product line and/or introduction of a new technology on the probability of
training managers, professionals, and skilled workers is particularly high – around
12%. The impact of opening a new plant is significant only for the probability of
training managers, professionals, and unskilled workers.
TABLE 8. ESTIMATED EFFECTS OF INNOVATIVENESS ON THE PROBABILITY OF ENTERPRISE TRAINING
Marginal effects1 of different measures of innovativeness
Dependent variable: training
provided to a certain group of
employees
Developing a major new product line and/or
introducing new technology
Opening a new plant
Managers 0.116103*** 0.0693599*** Professionals 0.1235106*** 0.0772838*** Skilled workers 0.1322378*** 0.0207646 Unskilled workers 0.0376928*** 0.0403151*** Support workers 0.0436499*** 0.0187529
legend: * p<.1; ** p<.05; *** p<.01 1 for discrete change of dummy variable from 0 to 1
Yet another interesting feature of the model is that it is able to capture the
effect of labor force quality proxied by education of the existing personnel and by
the subjective measure of skills of available worker in general (Table 9).
35
TABLE 9. ESTIMATED EFFECTS OF THE QUALITY OF THE LABOR FORCE ON THE PROBABILITY OF ENTERPRISE TRAINING
Marginal effects Education of the firm
personnel2, % with
Dependent variable: training
provided to a certain group of
employees
Skills of available workers being an
obstacle for business1
secondary schooling
university education
Managers 0.0308446* 0.0001021 0.0031093***Professionals 0.0392711** 0.0009094 0.0030499***Skilled workers 0.0562408*** 0.0009374* 0.0017835***Unskilled workers 0.010353 -0.0001835 0.0002549 Support workers -0.0003588 -0.0002114 0.0007516**
legend: * p<.1; ** p<.05; *** p<.01 1 For discrete change of dummy variable from 0 to 1
2 Reference group: primary schooling or less
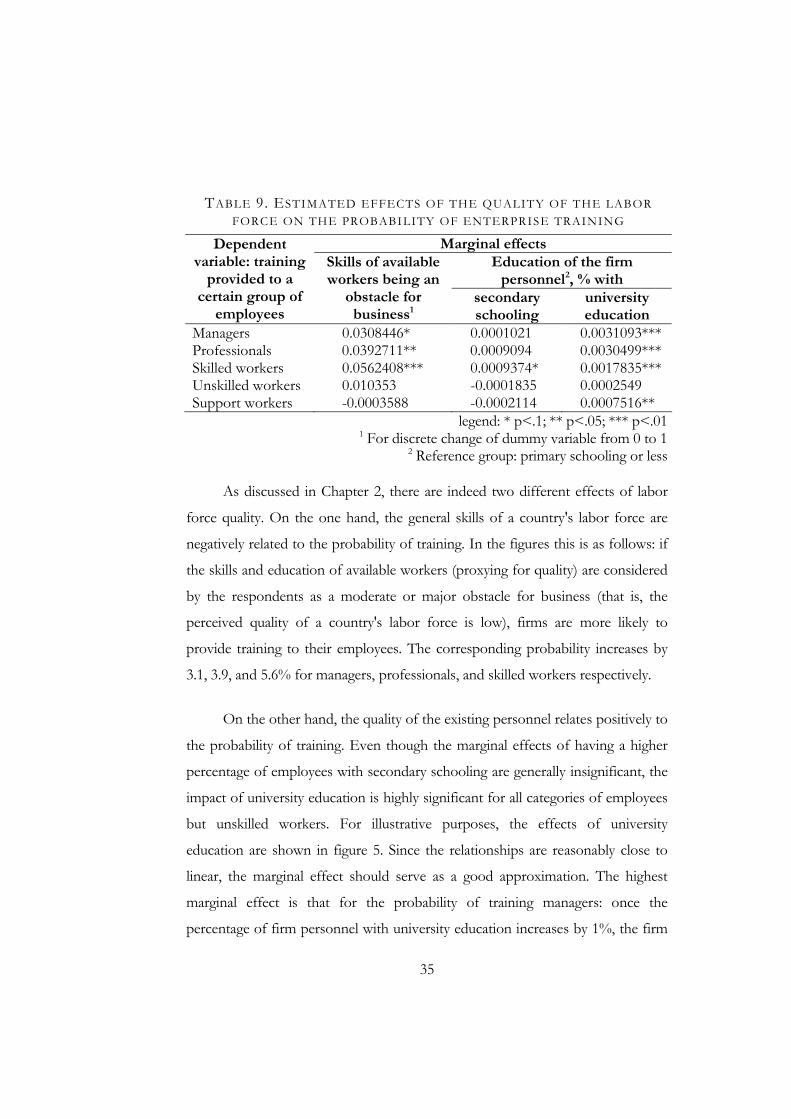
As discussed in Chapter 2, there are indeed two different effects of labor
force quality. On the one hand, the general skills of a country's labor force are
negatively related to the probability of training. In the figures this is as follows: if
the skills and education of available workers (proxying for quality) are considered
by the respondents as a moderate or major obstacle for business (that is, the
perceived quality of a country's labor force is low), firms are more likely to
provide training to their employees. The corresponding probability increases by
3.1, 3.9, and 5.6% for managers, professionals, and skilled workers respectively.
On the other hand, the quality of the existing personnel relates positively to
the probability of training. Even though the marginal effects of having a higher
percentage of employees with secondary schooling are generally insignificant, the
impact of university education is highly significant for all categories of employees
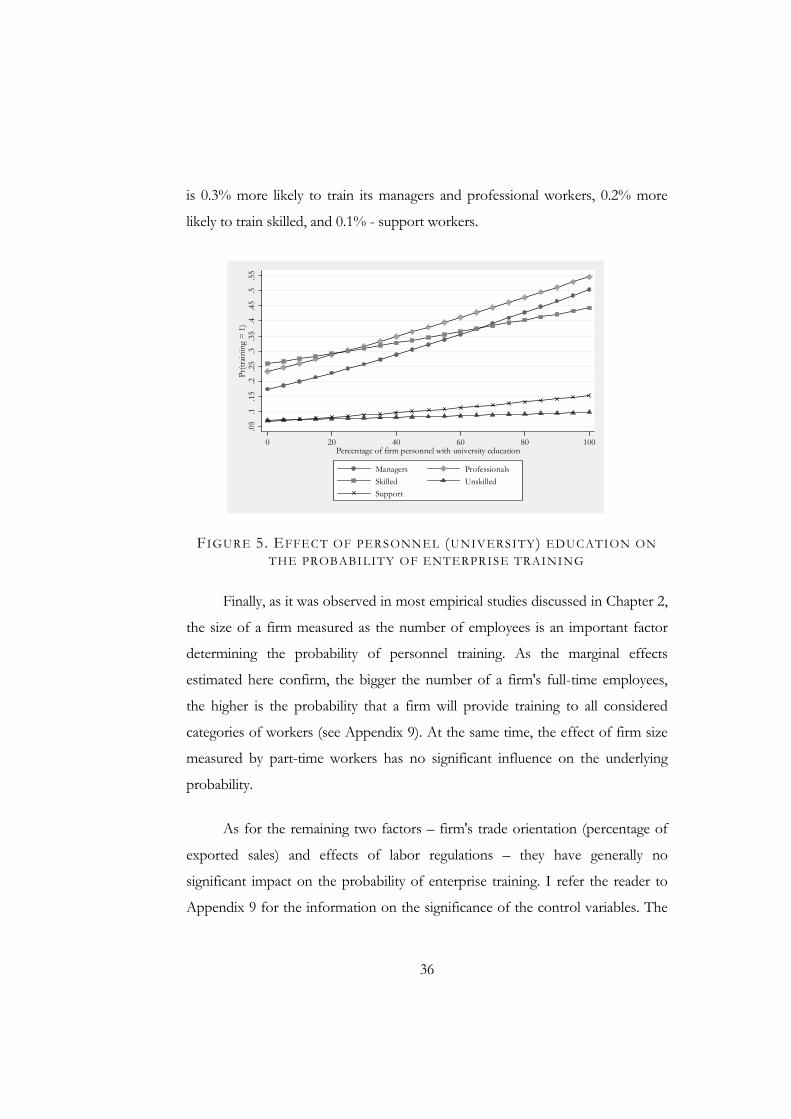
but unskilled workers. For illustrative purposes, the effects of university
education are shown in figure 5. Since the relationships are reasonably close to
linear, the marginal effect should serve as a good approximation. The highest
marginal effect is that for the probability of training managers: once the
percentage of firm personnel with university education increases by 1%, the firm
36
is 0.3% more likely to train its managers and professional workers, 0.2% more
likely to train skilled, and 0.1% - support workers.
.05
.1.1
5.2
.25
.3.3
5.4
.45
.5.5
5Pr
(train
ing
= 1)
0 20 40 60 80 100Percentage of firm personnel with university education
Managers ProfessionalsSkilled UnskilledSupport
FIGURE 5. EFFECT OF PERSONNEL (UNIVERSITY) EDUCATION ON THE PROBABILITY OF ENTERPRISE TRAINING
Finally, as it was observed in most empirical studies discussed in Chapter 2,
the size of a firm measured as the number of employees is an important factor
determining the probability of personnel training. As the marginal effects
estimated here confirm, the bigger the number of a firm's full-time employees,
the higher is the probability that a firm will provide training to all considered
categories of workers (see Appendix 9). At the same time, the effect of firm size
measured by part-time workers has no significant influence on the underlying
probability.
As for the remaining two factors – firm's trade orientation (percentage of
exported sales) and effects of labor regulations – they have generally no
significant impact on the probability of enterprise training. I refer the reader to
Appendix 9 for the information on the significance of the control variables. The
37
pattern is varying, but broadly speaking, the major part of the country dummies is
significant while the industry control variables are rarely significant.
Ending this presentation of estimation results, it is interesting to look at
some ideal types of firms comparing their probabilities of employees training. As
can be seen in Appendix 9, the coefficients for the dummy variable that controls
for Ukraine-specific effects are highly significant and negative, thus indicating a
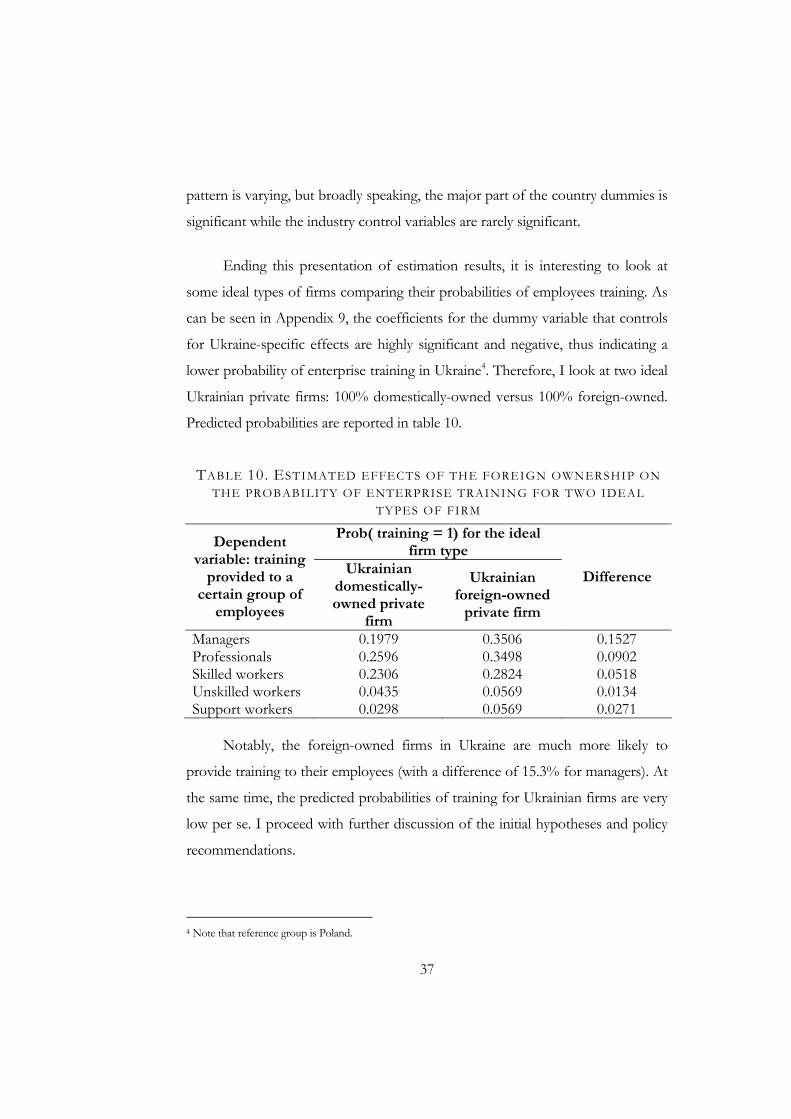
lower probability of enterprise training in Ukraine4. Therefore, I look at two ideal
Ukrainian private firms: 100% domestically-owned versus 100% foreign-owned.
Predicted probabilities are reported in table 10.
TABLE 10. ESTIMATED EFFECTS OF THE FOREIGN OWNERSHIP ON THE PROBABILITY OF ENTERPRISE TRAINING FOR TWO IDEAL
TYPES OF FIRM Prob( training = 1) for the ideal
firm type Dependent
variable: training provided to a
certain group of employees
Ukrainian domestically-owned private
firm
Ukrainian foreign-owned
private firm
Difference
Managers 0.1979 0.3506 0.1527 Professionals 0.2596 0.3498 0.0902 Skilled workers 0.2306 0.2824 0.0518 Unskilled workers 0.0435 0.0569 0.0134 Support workers 0.0298 0.0569 0.0271
Notably, the foreign-owned firms in Ukraine are much more likely to
provide training to their employees (with a difference of 15.3% for managers). At
the same time, the predicted probabilities of training for Ukrainian firms are very
low per se. I proceed with further discussion of the initial hypotheses and policy
recommendations.
4 Note that reference group is Poland.
38
C h a p t e r 5
DISCUSSION AND CONCLUSIONS
Using the recent data of the Business Environment and Enterprise Performance
Survey, I have tested the hypothesis that enterprises which have their shares
owned by foreign companies/organizations have a larger probability of providing
training to their employees than domestically-owned firms. As a binomial probit
model reveals, the hypothesis is supported with a reasonably high confidence
level for all but one category of enterprise employees. That is, the data suggest
that foreign-owned firms are more likely to train their managers, professional,
skilled and support workers than are domestic firms in the countries of the CIS
and Eastern Europe. This very finding could have important implications per se.
First of all, this to some extent supports the duality framework in that foreign-
owned firms have indeed distinct operational characteristics from national
enterprises. Moreover, it is worth recalling the theoretical prediction that foreign-
owned firms choosing higher quantity of personnel training are likely to choose
also higher quality of training. Based on the assumption that foreign-owned
establishments in the recipient countries do usually possess more advanced
technology as indigenous producers do, this prediction could be regarded as
credible. Ultimately, the study supports the idea that foreign-owned firms tend to
invest significantly more resources in accumulation and development of human
capital.
It is important to mention that the model of enterprise training developed
here is able to capture several other interesting effects. The results generally agree
with the findings of earlier studies on enterprise training. For example, the study
supports that such factors as competition, firm performance, innovativeness of a
39
firm, and size of the workplace are important determinants of firms training
decisions. This is consistent with previous empirical studies and theoretical
predictions concerning enterprise training, thus suggesting reliability of the
estimated model.
Coming back to the effect of foreign ownership, a range of further linkages
can be identified. First of all, as the central phenomenon of globalization is the
multinational corporation, it is often tempting to measure the very process of
economic globalization by the volume and spatial allocation of a foreign direct
investment emanating trough the operations of multinationals outside their home
countries. While the nation states remain their economic sovereignty they care
about their welfare being affected by the intensive FDI flows transferring
technology and modern knowledge which spill over to recipient industries.
Associating foreign-owned firms with subsidiaries of MNCs in the host countries
(which is true under a broad definition of multinationals), it becomes arguable
that foreign ownership in the national economy is a reflection of economic
globalization thought of as a process of intensification of worldwide
interconnectedness. Taking into account the empirical evidence in support of
positive spillovers from cross-national capital flows, the effects of foreign firms
operations in the host countries are perceived as beneficial for the welfare of the
recipients.
The findings of this paper support the hypothesis that globalization reflects
in increasing human capital accumulation in the developing countries hosting
foreign-owned companies. Policy recommendations, however, are not directly
deducible and might be questioned from different points of view. It might be
tempting to argue, hastily, that nation states should pursue an open-door policy
with respect to global capital flows hoping for positive spillover effects. But it is
imperative that the ability of the recipient economy to internalize externalities
40
generated by the operations of foreign-owned enterprises depends crucially on
the local capability and competition alongside at least technological and human
capital transferability. Furthermore, issues of national economic security and
sovereignty may become yet other concerns of state policy towards economic
integration bringing political motives into the decision making process. In the
final analysis, it is the state economic doctrine which should encompass the
number of prerequisites necessary for the deduction of policy implications from
the findings of this paper.
Alerting the reader against frantic conclusions and taking into account the
recent changes in Ukraine's external policy and military doctrine, I suggest the
Ukrainian government to facilitate foreign companies coming into Ukraine as
they were shown to improve on human capital accumulation within the state.
Finally, this is the area that merits further investigation using data that more
directly approaches the issues of spillovers from employees training by MNCs in
host countries. This constitutes a research agenda for economists investigating
transition countries and foretells my unfolding study.
41
BIBLIOGRAPHY
Acemoglu, Daron and Pischke, Jörn-Steffen (1997); Why do firms train? Theory and evidence. MIT, Working Paper, available at http://econ-www.mit.edu/ faculty/download_pdf.php?id=620
Alston, Julian M. (2002); Spillovers. The Australian Journal of Agricultural and Resource Economics, 46:3, pp. 315 - 346.
Aragon-Sanchez, Antonio, and Barba-Aragon, Isabel, and Sanz-Valle, Raquel (2003); Effects of training on business results. Int. J. of Human Resource Management 14:6, September 2003, pp. 956 - 980.
Bangert, David and Poor, Jozsef (1993); Foreign involvement in the Hungarian economy: its impact on human resource management. The International Journal of Human Resource Management 4:4, pp. 817 – 840.
Blomström, Magnus and Kokko, Ari (1996); The Impact of Foreign Investment on Host Countries: A Review of the Empirical Evidence, Stockholm School of Economics, Working Paper, December 1996.
---------- (1998); Multinational Corporations and spillovers. Journal of Economic Surveys Vol. 12, No. 2.
---------- (2003); Human capital and inward FDI, Stockholm School of Economics, Working Paper 167.
Campbell, Neil and Vousden, Neil (2003); Training and technology transfer; Australian Economic Papers, March 2003, pp. 35 – 49.
Chambers, R. L. and Skinner, C. J. (2004); Analysis of survey data, (Wiley series in survey methodology); Wiley, UK.
Dergachev, Vladislav A. (2002); Geoeconomics (modern geopolitics); Kyiv, VIRA-R, (in Russian).
Diecken, Peter. (1994); The Roepke Lecture in Economic Geography Global-Local Tensions: Firms and States in the Global Space-Economy. Economic Geography, Vol.70, No. 2, Global-Local Relations (Apr., 1994), pp. 101 – 128.
EBRD-World Bank Business Environment and Enterprise Performance Survey (BEEPS) II; The European Bank for Reconstruction and Development and The World Bank, 2002
Ernst, Dieter and Ozawa, Terutomo (2002); National Sovereign Economy, Global Market Economy, and Transnational Corporate Economy; Journal of Economic Issues, Vol. XXXVI No.2 June 2002.
Fosfuri, Andrea, and Motta, Massimo, and Rønde, Thomas (2001); Foreign direct investment and spillovers through workers' mobility; Journal of International Economics 53, pp. 205 – 222.
42
Frazis, Harley, Gittleman, Maury, and Joyce, Mary (2000); Correlates of training: an analysis using both employer and employee characteristics; Industrial and Labor Relations Review, Vol. 53, No. 3 (April 2000), pp. 443 – 462.
Gersbach, Hans and Schmutzler, Armin (2003); Endogenous technological spillovers: causes and consequences. Journal of Economics & Management Strategy, Volume 12, Number 2, Summer 2003, pp. 179–205.
Gorg, Holger and Strobl, Eric (2001); Multinational companies and productivity spillovers: a meta-analysis; The Economic Journal, 111 (November), F723 - F739.
Green, William H. (2000); Econometric Analysis; Prentice-Hall, 4th edition.
Harris, Richard I. D. (1999); The determinants of work-related training in Britain in 1995 and the implications of employer size; Applied Economics, 1999, No. 31, pp. 451 – 463.
Held, David and McGrew, Anthony (1999); Globalization; Entry for Oxford Companion to Politics, available at www.polity.co.uk/ global/globocp.htm
Hu, Albert Guangzhou (2004); Multinational corporations, patenting, and knowledge flow: the case of Singapore; Economic Development and Cultural Change, 2004, pp. 781 – 800.
Kapler, J. K. (1999); The role of transnational corporations: theory and evidence. Competition &
Change, 10245294, Jul 1999, Vol. 4, Issue 1.
Kathuria, Vinish (1998); Technology transfer and spillovers for Indian manufacturing firms. Development Policy Review Vol. 16, pp. 73 – 91.
Konchenko, Iryna (2003); The effects of foreign direct investment on the efficiency of Ukrainian milk enterprises. MA thesis, EERC.
Long, J. Scott and Freese, Jeremy (2003); Regression models for categorical dependent variables using Stata; Stata Press, USA.
Monteiro, L. Felipe, Arvidsson, Niklas, and Birkinshaw, Julian (2004); Knowledge flows within multinational corporations: why are some subsidiaries isolated? Academy of Management Proceedings: Academy of Management Best Conference Paper 2004 IM: B1.
Osetsky, V. L. (2003); Investitive model of boosting the economy; Finance of Ukraine #1, pp. 21 − 27. (in Ukrainian).
Parker, Simon C. and Coleman, James (1999); Training in the UK: does national ownership matter? International Journal of Training and Development 3:4, pp. 278 – 291.
Plotnikov, O. V. (2004); Financial management in transnational corporations; Kyiv: Condor, 252 pp. (in Ukrainian).
Sin, Chor-Yiu and Leung Wing-Fai (2001); Impacts of FDI liberalization on investment inflows. Applied Economics Letters, 2001, 8, pp. 253 – 256.
Singh, Jasjit (2004); Multinational firms and knowledge diffusion:
43
evidence using patent citation data; Academy of Management Proceedings, Academy of Management Best Conference Paper 2004 BPS: D1.
Smith, Andrew and Hayton, Geoff (1999); What drives enterprise training? Evidence from Australia; The International Journal of Human Resource Management, 10:2, April 1999, pp. 251 – 272.
Sobko, Yulia (2004); Technology transfer in transition. MA thesis, EERC.
Sribney, Bill (1998); Advantages of the robust variance estimator. StataCorp, available at http://www.stata.com/support/faqs/stat/robust_var.html
Stiglitz, Joseph E. (2002); Globalization and its discontents. W. W. Norton & Company Inc., New York and London.
Sutherland, John (2004); The determinants of training; Economic Issues, March 2004, Vol. 9 Issue 1, pp. 23 – 39.
Talavera, Oleksandr (2001); The effect of foreign direct investment on firm performance in Ukraine. MA thesis, EERC.
Walkenhorst, Peter (2004); Economic Transition and the Sectoral
Patterns of Foreign Direct Investment. Emerging Markets Finance and Trade, vol. 40, no. 2, March–April 2004, pp. 5–26.
Walsh, Janet (2001); Human resource management in foreign-owned workplaces: evidence from Australia, Int. J. of Human Resource Management 12:3, pp. 425-444.
Yadapadithaya, P. S. (2001); Evaluating corporate training and development: an Indian experience. International Journal of Training and Development 5:4, pp. 261 – 274.
Yakubovsky, Sergiy O. (2002); Investment activities of transnational corporations and their influence on competitiveness of national economies. Monograph, Odesa: ORIDU UADU, 394 pp. (in Ukrainian).
Yelizavetin, Mikhail (2003); Foreign investment in Russia: to the question on structure; Investment in Russia #12, pp. 19 − 23. (in Ukrainian).
Zgryvets, L. F. (2002); Regulating the activity of foreign investors; Finance of Ukraine #12, pp. 90 − 94. (in Ukrainian).
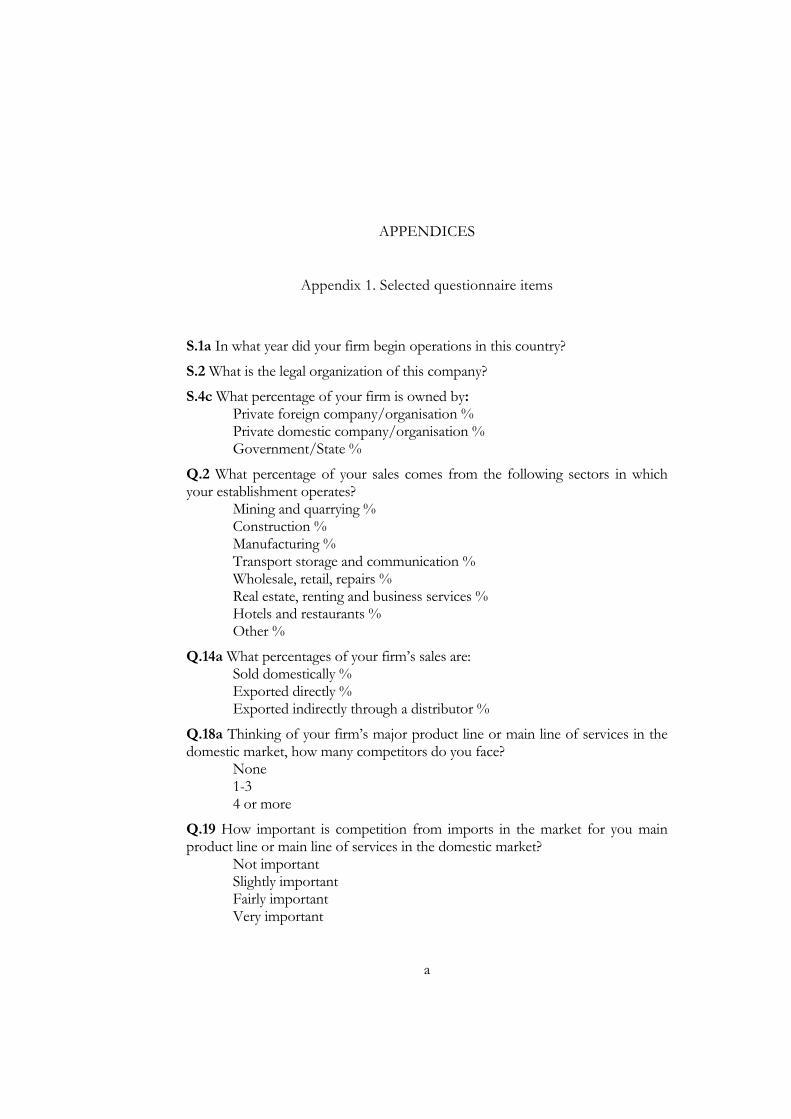
a
APPENDICES
Appendix 1. Selected questionnaire items
S.1a In what year did your firm begin operations in this country?
S.2 What is the legal organization of this company?
S.4c What percentage of your firm is owned by: Private foreign company/organisation % Private domestic company/organisation % Government/State %
Q.2 What percentage of your sales comes from the following sectors in which your establishment operates?
Mining and quarrying % Construction % Manufacturing % Transport storage and communication % Wholesale, retail, repairs % Real estate, renting and business services % Hotels and restaurants % Other %
Q.14a What percentages of your firm’s sales are: Sold domestically % Exported directly % Exported indirectly through a distributor %
Q.18a Thinking of your firm’s major product line or main line of services in the domestic market, how many competitors do you face?
None 1-3 4 or more
Q.19 How important is competition from imports in the market for you main product line or main line of services in the domestic market?
Not important Slightly important Fairly important Very important
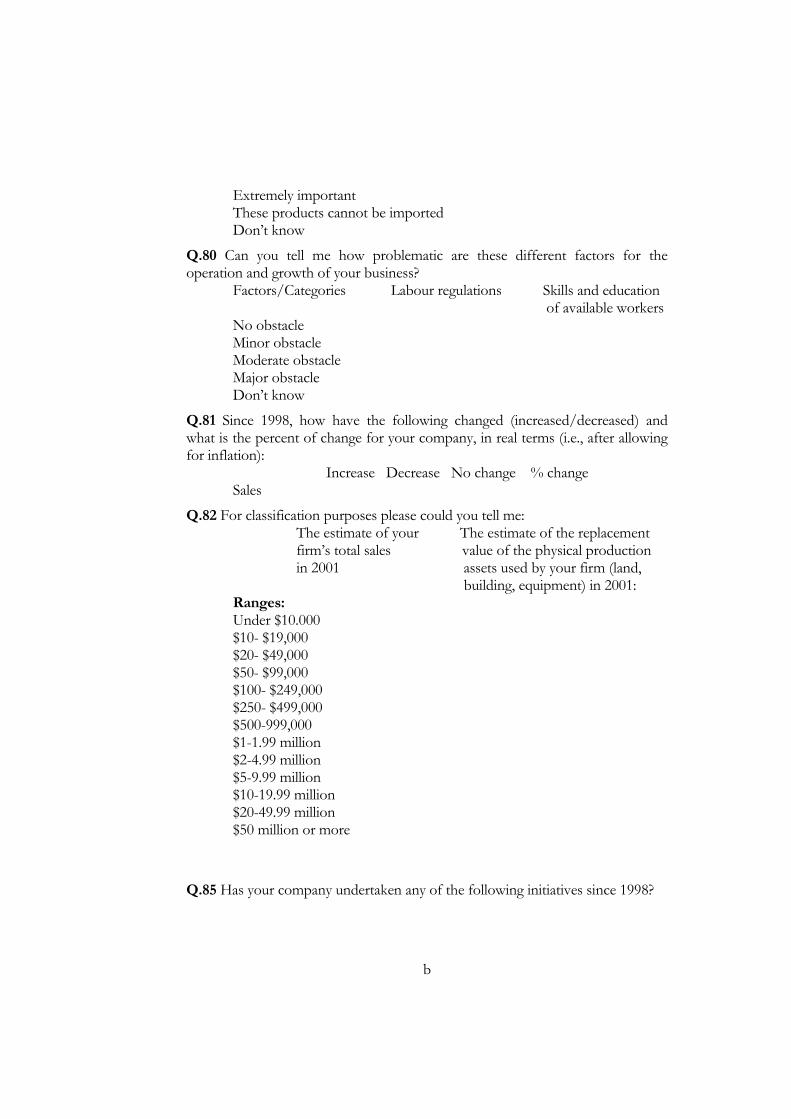
b
Extremely important These products cannot be imported Don’t know
Q.80 Can you tell me how problematic are these different factors for the operation and growth of your business?
Factors/Categories Labour regulations Skills and education of available workers
No obstacle Minor obstacle Moderate obstacle Major obstacle Don’t know
Q.81 Since 1998, how have the following changed (increased/decreased) and what is the percent of change for your company, in real terms (i.e., after allowing for inflation):
Increase Decrease No change % change Sales
Q.82 For classification purposes please could you tell me: The estimate of your The estimate of the replacement firm’s total sales value of the physical production in 2001 assets used by your firm (land,
building, equipment) in 2001: Ranges: Under $10.000 $10- $19,000 $20- $49,000 $50- $99,000 $100- $249,000 $250- $499,000 $500-999,000 $1-1.99 million $2-4.99 million $5-9.99 million $10-19.99 million $20-49.99 million $50 million or more
Q.85 Has your company undertaken any of the following initiatives since 1998?
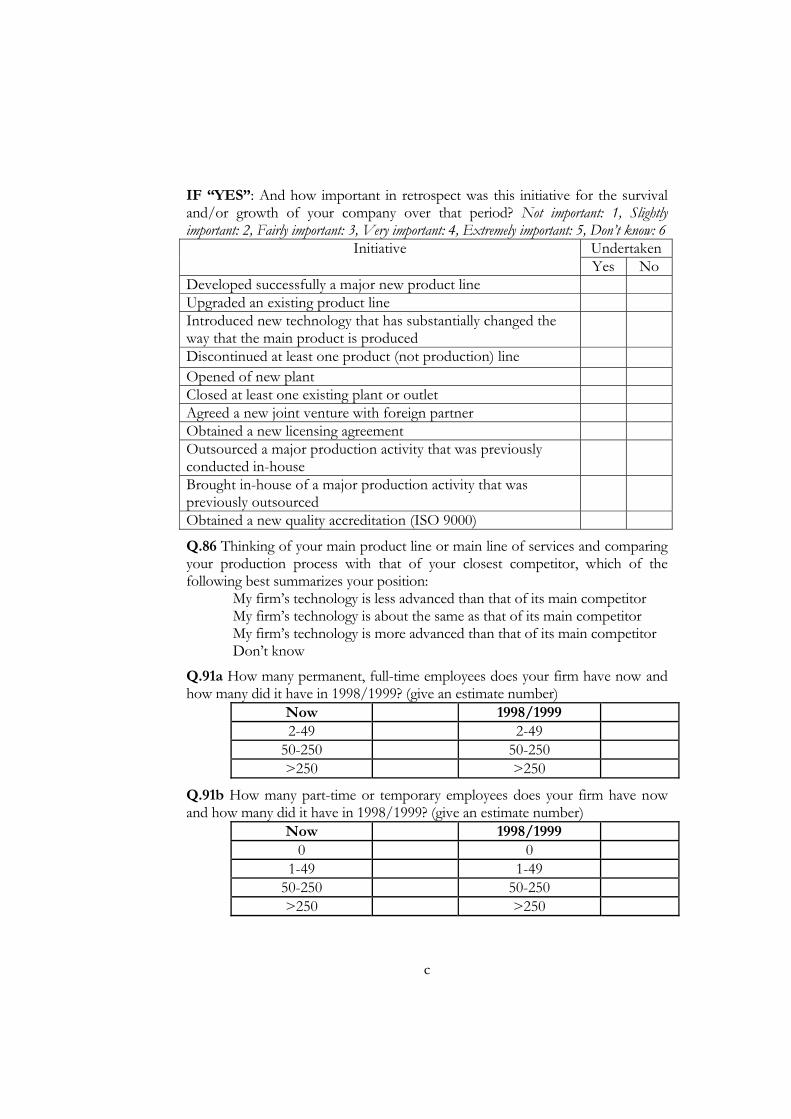
c
IF “YES”: And how important in retrospect was this initiative for the survival and/or growth of your company over that period? Not important: 1, Slightly important: 2, Fairly important: 3, Very important: 4, Extremely important: 5, Don’t know: 6
UndertakenInitiative Yes No
Developed successfully a major new product line Upgraded an existing product line Introduced new technology that has substantially changed the way that the main product is produced
Discontinued at least one product (not production) line Opened of new plant Closed at least one existing plant or outlet Agreed a new joint venture with foreign partner Obtained a new licensing agreement Outsourced a major production activity that was previously conducted in-house
Brought in-house of a major production activity that was previously outsourced
Obtained a new quality accreditation (ISO 9000)
Q.86 Thinking of your main product line or main line of services and comparing your production process with that of your closest competitor, which of the following best summarizes your position:
My firm’s technology is less advanced than that of its main competitor My firm’s technology is about the same as that of its main competitor My firm’s technology is more advanced than that of its main competitor Don’t know
Q.91a How many permanent, full-time employees does your firm have now and how many did it have in 1998/1999? (give an estimate number)
Now 1998/1999 2-49 2-49
50-250 50-250 >250 >250
Q.91b How many part-time or temporary employees does your firm have now and how many did it have in 1998/1999? (give an estimate number)
Now 1998/1999 0 0
1-49 1-49 50-250 50-250 >250 >250

d
Q.92 What per cent of your current permanent, full-time workers are: Managers (excluding those involve in shop floor supervision) % Professionals (e.g., accountants, engineers, scientists) % Skilled workers % Unskilled workers % Support workers (e.g., administration, sales) %
Q.94 What percent of the workforce at your firm have the following education levels:
Did not complete primary school % Primary schooling % Some secondary school % Secondary school diploma % Some university % University degree or higher %
Q.96 Do you offer formal training to your employees? If yes, what percent of employees in each category received training in 2001? Yes No Don’t know If YES, % Trained Managers Professional? Skilled workers Unskilled workers Support workers
Q.98 Now, I would like to ask you a hypothetical question. If you could change the number of regular full-time workers you currently employ without any restrictions (i.e. without seeking permission, making severance payments etc.), what would be your optimal level of employment as a percent of your existing workforce? (e.g. 90% implies you would reduce your workforce by 10%, 110% means you want to expand by 10%) %,
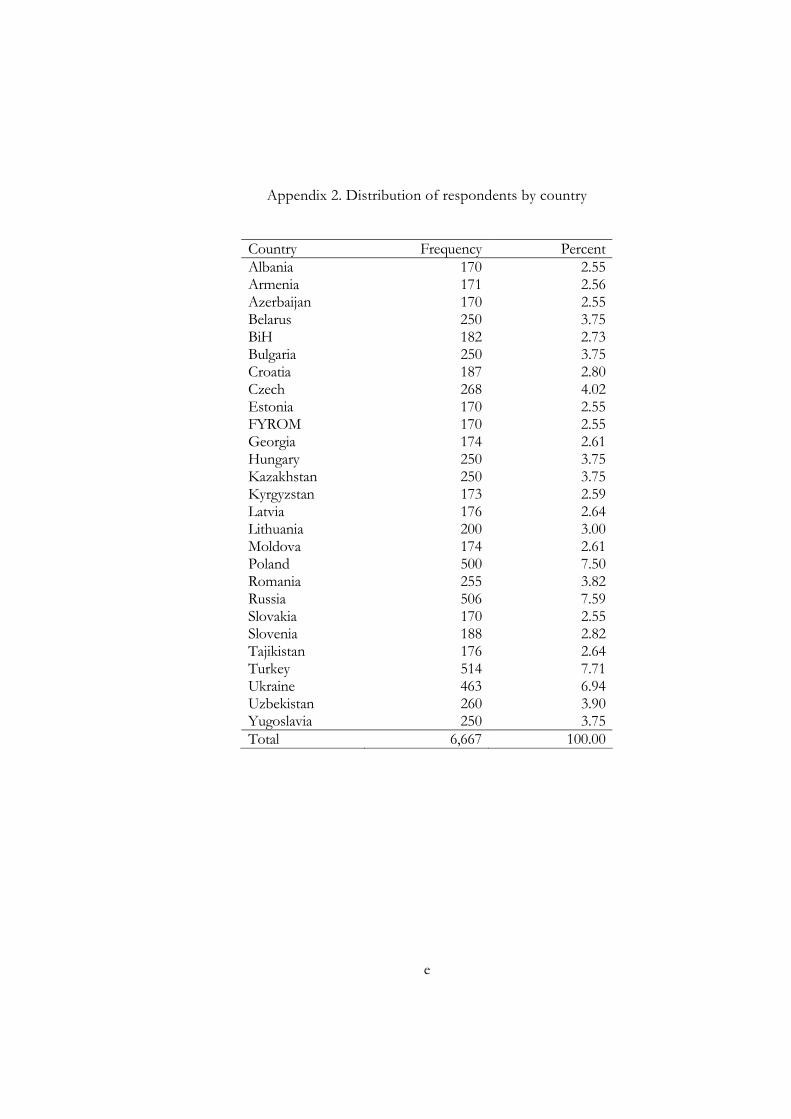
e
Appendix 2. Distribution of respondents by country
Country Frequency Percent Albania 170 2.55 Armenia 171 2.56 Azerbaijan 170 2.55 Belarus 250 3.75 BiH 182 2.73 Bulgaria 250 3.75 Croatia 187 2.80 Czech 268 4.02 Estonia 170 2.55 FYROM 170 2.55 Georgia 174 2.61 Hungary 250 3.75 Kazakhstan 250 3.75 Kyrgyzstan 173 2.59 Latvia 176 2.64 Lithuania 200 3.00 Moldova 174 2.61 Poland 500 7.50 Romania 255 3.82 Russia 506 7.59 Slovakia 170 2.55 Slovenia 188 2.82 Tajikistan 176 2.64 Turkey 514 7.71 Ukraine 463 6.94 Uzbekistan 260 3.90 Yugoslavia 250 3.75 Total 6,667 100.00
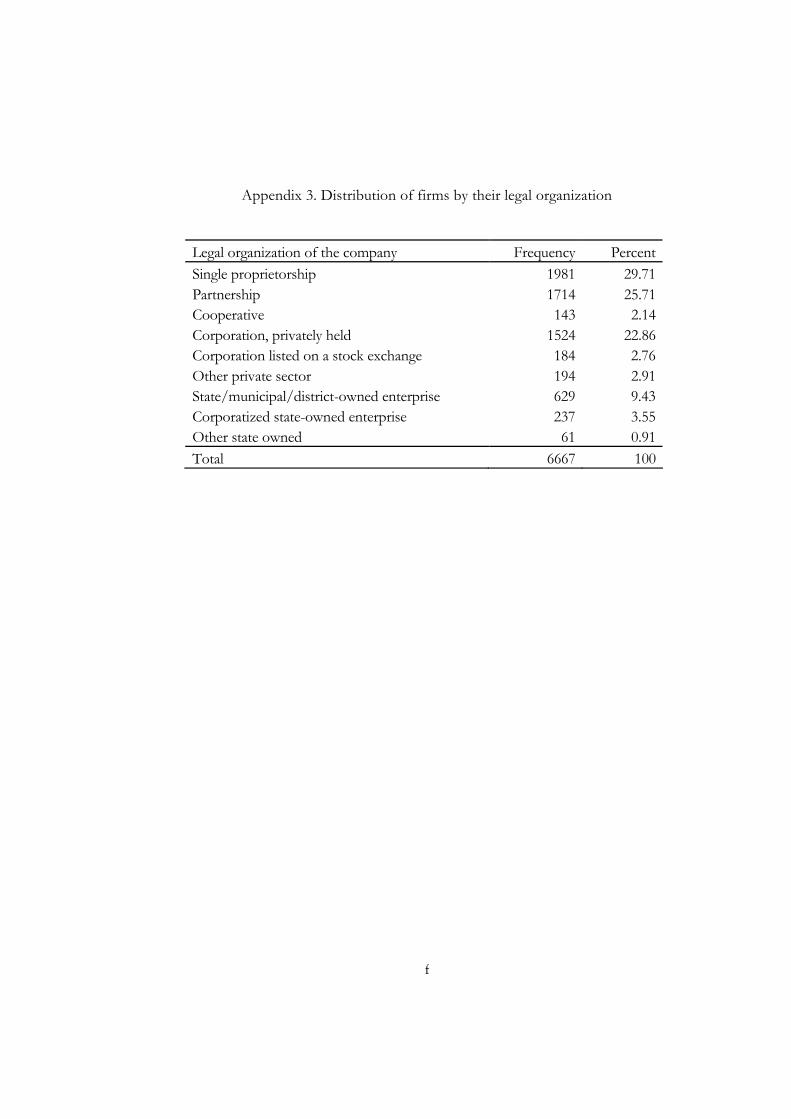
f
Appendix 3. Distribution of firms by their legal organization
Legal organization of the company Frequency PercentSingle proprietorship 1981 29.71Partnership 1714 25.71Cooperative 143 2.14Corporation, privately held 1524 22.86Corporation listed on a stock exchange 184 2.76Other private sector 194 2.91State/municipal/district-owned enterprise 629 9.43Corporatized state-owned enterprise 237 3.55Other state owned 61 0.91Total 6667 100
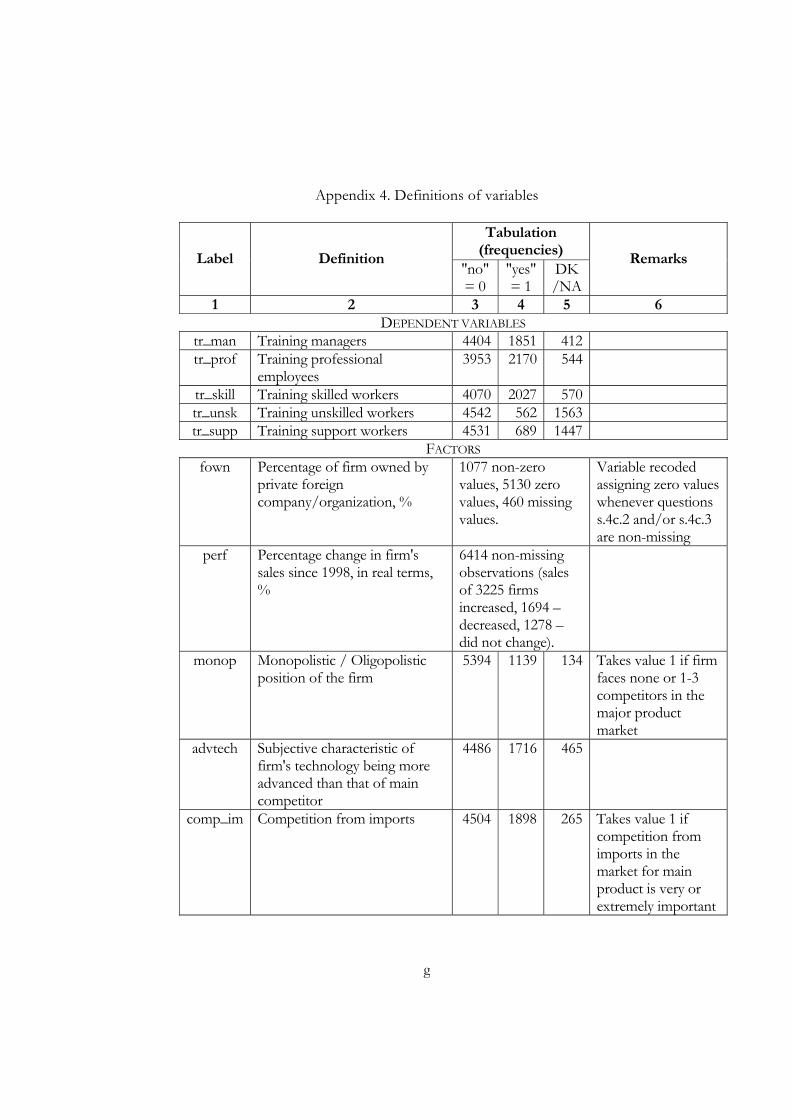
g
Appendix 4. Definitions of variables
Tabulation (frequencies)
Label Definition "no" = 0
"yes" = 1
DK /NA
Remarks
1 2 3 4 5 6 DEPENDENT VARIABLES
tr_man Training managers 4404 1851 412 tr_prof Training professional
employees 3953 2170 544
tr_skill Training skilled workers 4070 2027 570 tr_unsk Training unskilled workers 4542 562 1563 tr_supp Training support workers 4531 689 1447
FACTORS fown Percentage of firm owned by
private foreign company/organization, %
1077 non-zero values, 5130 zero values, 460 missing values.
Variable recoded assigning zero values whenever questions s.4c.2 and/or s.4c.3 are non-missing
perf Percentage change in firm's sales since 1998, in real terms, %
6414 non-missing observations (sales of 3225 firms increased, 1694 – decreased, 1278 – did not change).
monop Monopolistic / Oligopolistic position of the firm
5394 1139 134 Takes value 1 if firm faces none or 1-3 competitors in the major product market
advtech Subjective characteristic of firm's technology being more advanced than that of main competitor
4486 1716 465
comp_im Competition from imports 4504 1898 265 Takes value 1 if competition from imports in the market for main product is very or extremely important
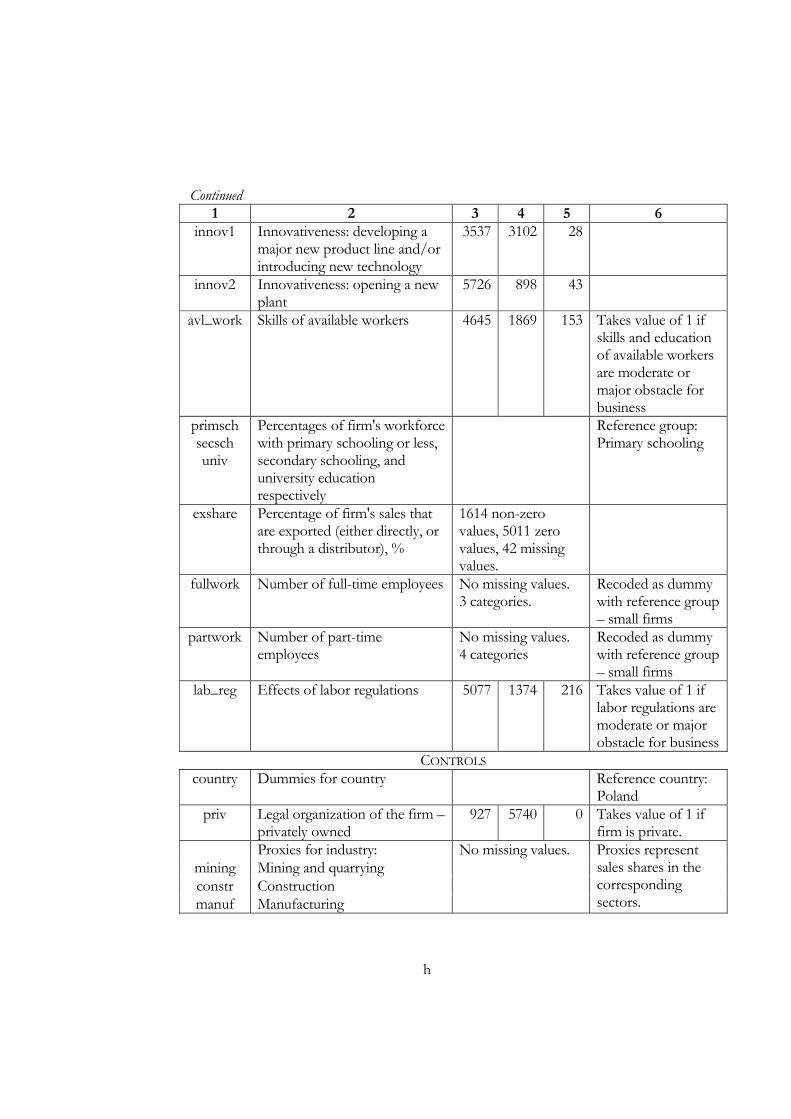
h
Continued 1 2 3 4 5 6
innov1 Innovativeness: developing a major new product line and/or introducing new technology
3537 3102 28
innov2 Innovativeness: opening a new plant
5726 898 43
avl_work Skills of available workers 4645 1869 153 Takes value of 1 if skills and education of available workers are moderate or major obstacle for business
primsch secsch univ
Percentages of firm's workforce with primary schooling or less, secondary schooling, and university education respectively
Reference group: Primary schooling
exshare Percentage of firm's sales that are exported (either directly, or through a distributor), %
1614 non-zero values, 5011 zero values, 42 missing values.
fullwork Number of full-time employees No missing values. 3 categories.
Recoded as dummy with reference group – small firms
partwork Number of part-time employees
No missing values. 4 categories
Recoded as dummy with reference group – small firms
lab_reg Effects of labor regulations 5077 1374 216 Takes value of 1 if labor regulations are moderate or major obstacle for business
CONTROLS country Dummies for country Reference country:
Poland priv Legal organization of the firm –
privately owned 927 5740 0 Takes value of 1 if
firm is private. Proxies for industry:
mining Mining and quarrying constr Construction manuf Manufacturing
No missing values. Proxies represent sales shares in the corresponding sectors.
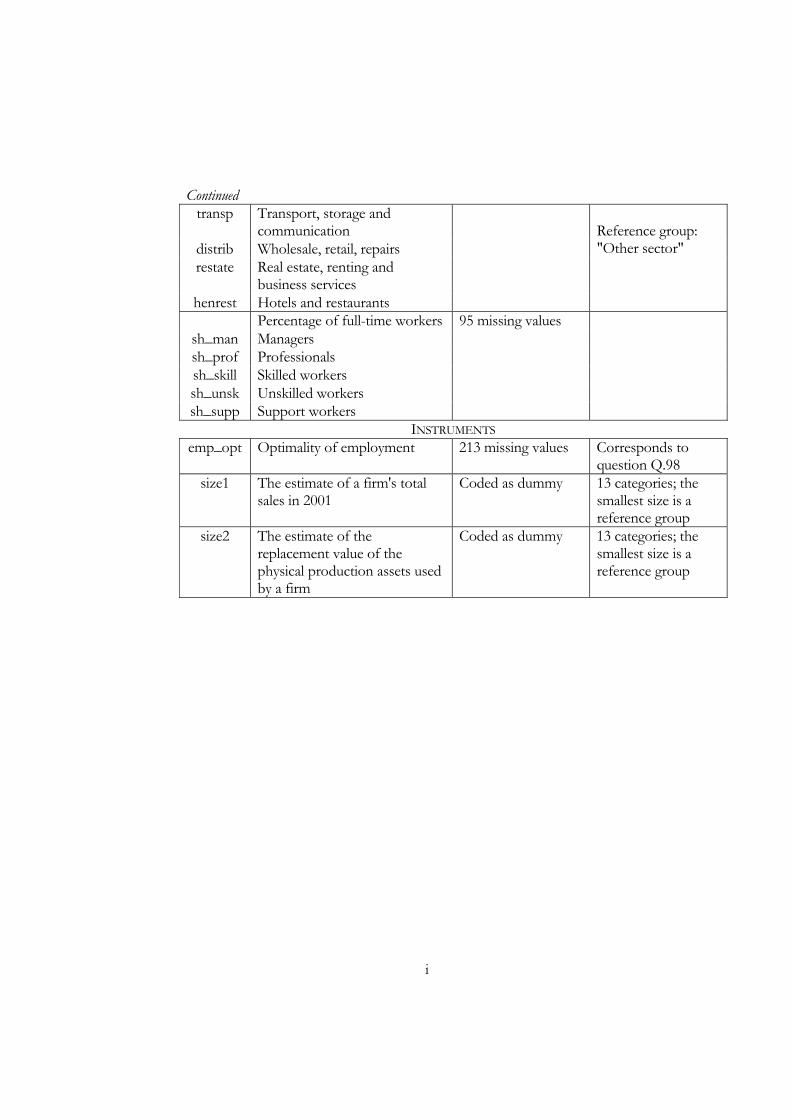
i
Continued transp Transport, storage and
communication distrib Wholesale, retail, repairs restate Real estate, renting and
business services henrest Hotels and restaurants
Reference group: "Other sector"
Percentage of full-time workerssh_man Managers sh_prof Professionals sh_skill Skilled workers sh_unsk Unskilled workers sh_supp Support workers
95 missing values
INSTRUMENTS emp_opt Optimality of employment 213 missing values Corresponds to
question Q.98 size1 The estimate of a firm's total
sales in 2001 Coded as dummy 13 categories; the
smallest size is a reference group
size2 The estimate of the replacement value of the physical production assets used by a firm
Coded as dummy 13 categories; the smallest size is a reference group

j
Appendix 5. A note on endogeneity in binary choice models
This note discusses testing for and estimating in the presence of
endogenous explanatory variables in binary response models. I use the simple
technique of two-stage estimation.
1. Testing
Let 1211*1 uyzy ++= γδ , where y2 is a (continuous) endogenous variable.
We assume that a reduced form for y2 exists: 2222112 vzcvczczy +=++= ,
where [ ]21 , zzz = ; u1 and v2 are correlated.
Let further write 1211 evu +=θ ; then ( )( )2
211 var
,covvvu
=θ .
( )121211*1 evyzy +++= θγδ , where var(e1)=var(u1) − corr(u1,v2)2.
Now we can set up the test as follows.
(1) Run OLS on the reduced form of y2
22 ˆˆ vczy +=
and obtain the residuals series, 2v
(2) Run probit/logit of y1 on z1, y2, and 2v
121211*1 ˆ evyzy +++= θγδ .
Test H0: θ1 = 0 (implying corr(u1,v2) = 0).
2. Estimation
Estimation proceed in a similar fashion as above 2-stage procedure while
only 2v is included together with z1 as explanatory variables in probit/logit model
for y1; y2 (or 2y ) is not used.
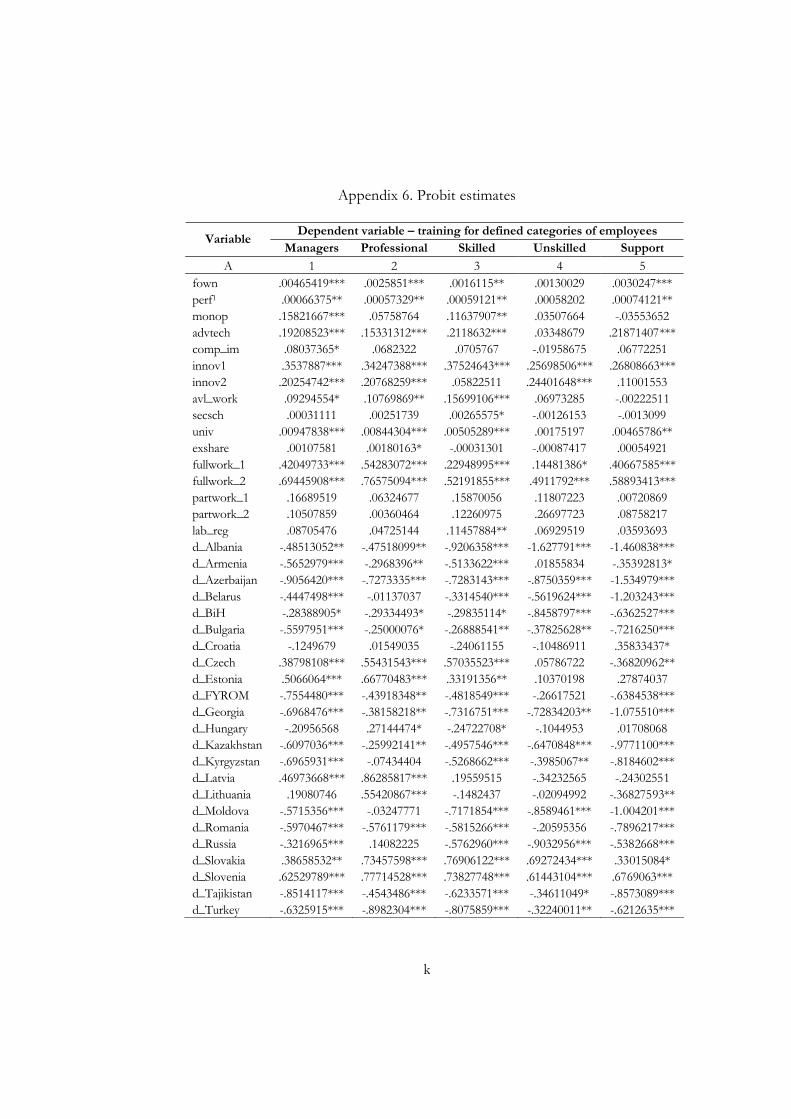
k
Appendix 6. Probit estimates
Dependent variable – training for defined categories of employees Variable
Managers Professional Skilled Unskilled Support
A 1 2 3 4 5 fown .00465419*** .0025851*** .0016115** .00130029 .0030247*** perf1 .00066375** .00057329** .00059121** .00058202 .00074121** monop .15821667*** .05758764 .11637907** .03507664 -.03553652 advtech .19208523*** .15331312*** .2118632*** .03348679 .21871407***comp_im .08037365* .0682322 .0705767 -.01958675 .06772251 innov1 .3537887*** .34247388*** .37524643*** .25698506*** .26808663***innov2 .20254742*** .20768259*** .05822511 .24401648*** .11001553 avl_work .09294554* .10769869** .15699106*** .06973285 -.00222511 secsch .00031111 .00251739 .00265575* -.00126153 -.0013099 univ .00947838*** .00844304*** .00505289*** .00175197 .00465786** exshare .00107581 .00180163* -.00031301 -.00087417 .00054921 fullwork_1 .42049733*** .54283072*** .22948995*** .14481386* .40667585***fullwork_2 .69445908*** .76575094*** .52191855*** .4911792*** .58893413***partwork_1 .16689519 .06324677 .15870056 .11807223 .00720869 partwork_2 .10507859 .00360464 .12260975 .26697723 .08758217 lab_reg .08705476 .04725144 .11457884** .06929519 .03593693 d_Albania -.48513052** -.47518099** -.9206358*** -1.627791*** -1.460838*** d_Armenia -.5652979*** -.2968396** -.5133622*** .01855834 -.35392813* d_Azerbaijan -.9056420*** -.7273335*** -.7283143*** -.8750359*** -1.534979*** d_Belarus -.4447498*** -.01137037 -.3314540*** -.5619624*** -1.203243*** d_BiH -.28388905* -.29334493* -.29835114* -.8458797*** -.6362527*** d_Bulgaria -.5597951*** -.25000076* -.26888541** -.37825628** -.7216250*** d_Croatia -.1249679 .01549035 -.24061155 -.10486911 .35833437* d_Czech .38798108*** .55431543*** .57035523*** .05786722 -.36820962** d_Estonia .5066064*** .66770483*** .33191356** .10370198 .27874037 d_FYROM -.7554480*** -.43918348** -.4818549*** -.26617521 -.6384538*** d_Georgia -.6968476*** -.38158218** -.7316751*** -.72834203** -1.075510*** d_Hungary -.20956568 .27144474* -.24722708* -.1044953 .01708068 d_Kazakhstan -.6097036*** -.25992141** -.4957546*** -.6470848*** -.9771100*** d_Kyrgyzstan -.6965931*** -.07434404 -.5268662*** -.3985067** -.8184602*** d_Latvia .46973668*** .86285817*** .19559515 -.34232565 -.24302551 d_Lithuania .19080746 .55420867*** -.1482437 -.02094992 -.36827593** d_Moldova -.5715356*** -.03247771 -.7171854*** -.8589461*** -1.004201*** d_Romania -.5970467*** -.5761179*** -.5815266*** -.20595356 -.7896217*** d_Russia -.3216965*** .14082225 -.5762960*** -.9032956*** -.5382668*** d_Slovakia .38658532** .73457598*** .76906122*** .69272434*** .33015084* d_Slovenia .62529789*** .77714528*** .73827748*** .61443104*** .6769063*** d_Tajikistan -.8514117*** -.4543486*** -.6233571*** -.34611049* -.8573089*** d_Turkey -.6325915*** -.8982304*** -.8075859*** -.32240011** -.6212635***
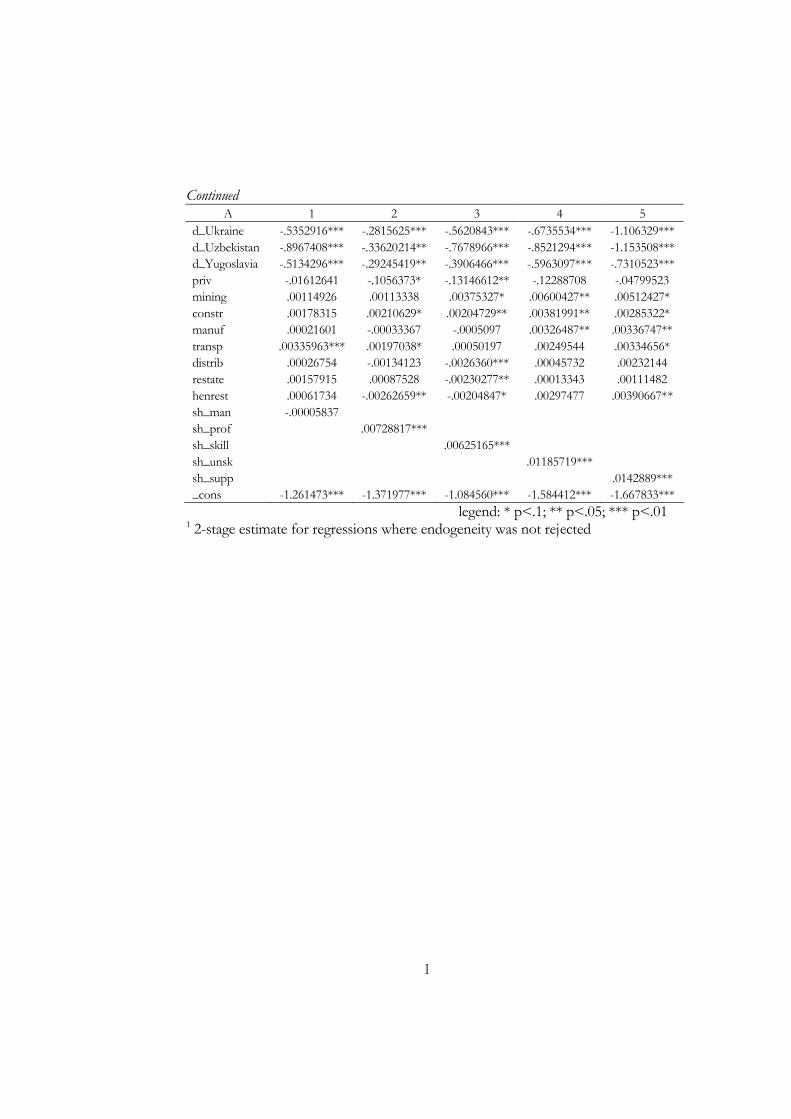
l
Continued A 1 2 3 4 5
d_Ukraine -.5352916*** -.2815625*** -.5620843*** -.6735534*** -1.106329*** d_Uzbekistan -.8967408*** -.33620214** -.7678966*** -.8521294*** -1.153508*** d_Yugoslavia -.5134296*** -.29245419** -.3906466*** -.5963097*** -.7310523*** priv -.01612641 -.1056373* -.13146612** -.12288708 -.04799523 mining .00114926 .00113338 .00375327* .00600427** .00512427* constr .00178315 .00210629* .00204729** .00381991** .00285322* manuf .00021601 -.00033367 -.0005097 .00326487** .00336747** transp .00335963*** .00197038* .00050197 .00249544 .00334656* distrib .00026754 -.00134123 -.0026360*** .00045732 .00232144 restate .00157915 .00087528 -.00230277** .00013343 .00111482 henrest .00061734 -.00262659** -.00204847* .00297477 .00390667** sh_man -.00005837 sh_prof .00728817*** sh_skill .00625165*** sh_unsk .01185719*** sh_supp .0142889*** _cons -1.261473*** -1.371977*** -1.084560*** -1.584412*** -1.667833***
legend: * p<.1; ** p<.05; *** p<.01 1 2-stage estimate for regressions where endogeneity was not rejected
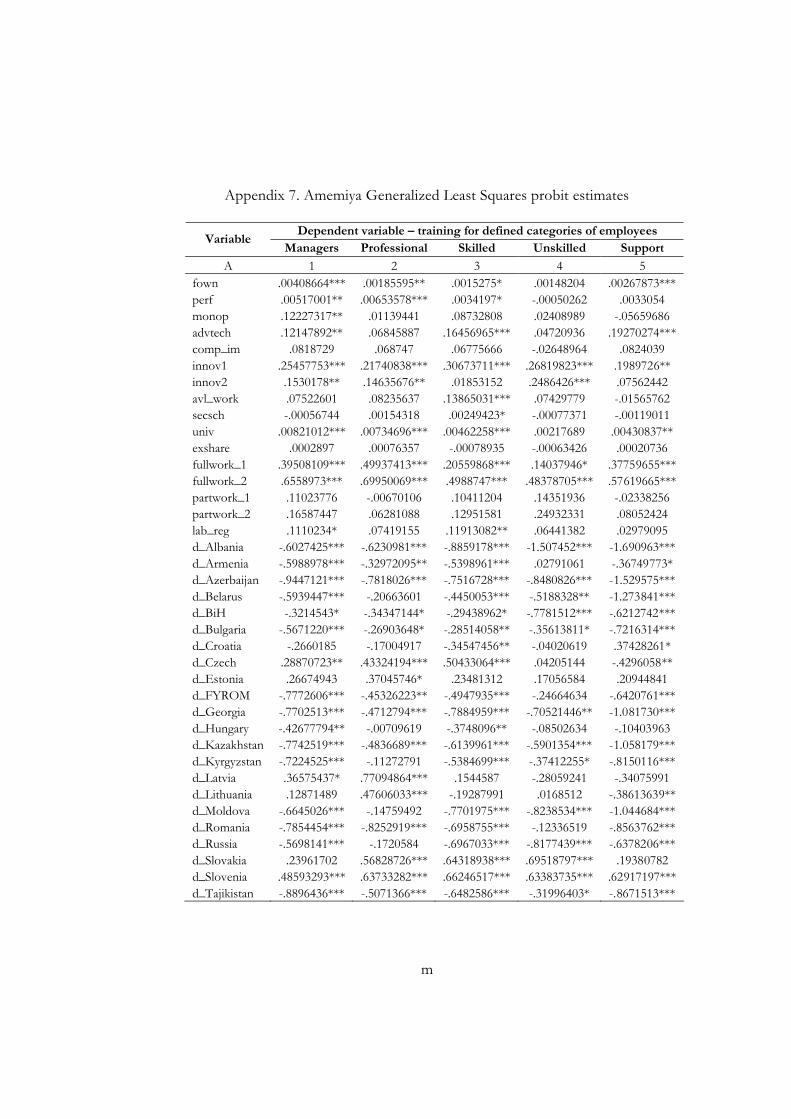
m
Appendix 7. Amemiya Generalized Least Squares probit estimates
Dependent variable – training for defined categories of employees Variable
Managers Professional Skilled Unskilled Support
A 1 2 3 4 5 fown .00408664*** .00185595** .0015275* .00148204 .00267873***perf .00517001** .00653578*** .0034197* -.00050262 .0033054 monop .12227317** .01139441 .08732808 .02408989 -.05659686 advtech .12147892** .06845887 .16456965*** .04720936 .19270274***comp_im .0818729 .068747 .06775666 -.02648964 .0824039 innov1 .25457753*** .21740838*** .30673711*** .26819823*** .1989726** innov2 .1530178** .14635676** .01853152 .2486426*** .07562442 avl_work .07522601 .08235637 .13865031*** .07429779 -.01565762 secsch -.00056744 .00154318 .00249423* -.00077371 -.00119011 univ .00821012*** .00734696*** .00462258*** .00217689 .00430837** exshare .0002897 .00076357 -.00078935 -.00063426 .00020736 fullwork_1 .39508109*** .49937413*** .20559868*** .14037946* .37759655***fullwork_2 .6558973*** .69950069*** .4988747*** .48378705*** .57619665***partwork_1 .11023776 -.00670106 .10411204 .14351936 -.02338256 partwork_2 .16587447 .06281088 .12951581 .24932331 .08052424 lab_reg .1110234* .07419155 .11913082** .06441382 .02979095 d_Albania -.6027425*** -.6230981*** -.8859178*** -1.507452*** -1.690963***d_Armenia -.5988978*** -.32972095** -.5398961*** .02791061 -.36749773* d_Azerbaijan -.9447121*** -.7818026*** -.7516728*** -.8480826*** -1.529575***d_Belarus -.5939447*** -.20663601 -.4450053*** -.5188328** -1.273841***d_BiH -.3214543* -.34347144* -.29438962* -.7781512*** -.6212742***d_Bulgaria -.5671220*** -.26903648* -.28514058** -.35613811* -.7216314***d_Croatia -.2660185 -.17004917 -.34547456** -.04020619 .37428261* d_Czech .28870723** .43324194*** .50433064*** .04205144 -.4296058** d_Estonia .26674943 .37045746* .23481312 .17056584 .20944841 d_FYROM -.7772606*** -.45326223** -.4947935*** -.24664634 -.6420761***d_Georgia -.7702513*** -.4712794*** -.7884959*** -.70521446** -1.081730***d_Hungary -.42677794** -.00709619 -.3748096** -.08502634 -.10403963 d_Kazakhstan -.7742519*** -.4836689*** -.6139961*** -.5901354*** -1.058179***d_Kyrgyzstan -.7224525*** -.11272791 -.5384699*** -.37412255* -.8150116***d_Latvia .36575437* .77094864*** .1544587 -.28059241 -.34075991 d_Lithuania .12871489 .47606033*** -.19287991 .0168512 -.38613639**d_Moldova -.6645026*** -.14759492 -.7701975*** -.8238534*** -1.044684***d_Romania -.7854454*** -.8252919*** -.6958755*** -.12336519 -.8563762***d_Russia -.5698141*** -.1720584 -.6967033*** -.8177439*** -.6378206***d_Slovakia .23961702 .56828726*** .64318938*** .69518797*** .19380782 d_Slovenia .48593293*** .63733282*** .66246517*** .63383735*** .62917197***d_Tajikistan -.8896436*** -.5071366*** -.6482586*** -.31996403* -.8671513***
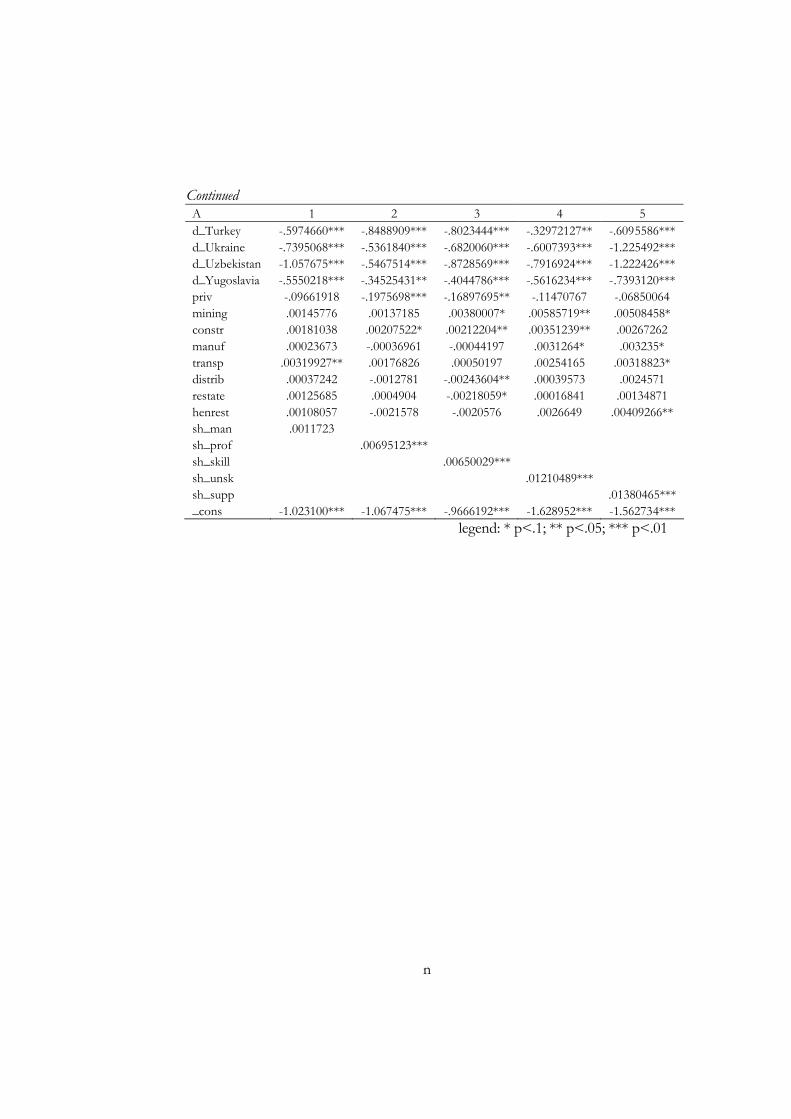
n
Continued A 1 2 3 4 5 d_Turkey -.5974660*** -.8488909*** -.8023444*** -.32972127** -.6095586***d_Ukraine -.7395068*** -.5361840*** -.6820060*** -.6007393*** -1.225492***d_Uzbekistan -1.057675*** -.5467514*** -.8728569*** -.7916924*** -1.222426***d_Yugoslavia -.5550218*** -.34525431** -.4044786*** -.5616234*** -.7393120***priv -.09661918 -.1975698*** -.16897695** -.11470767 -.06850064 mining .00145776 .00137185 .00380007* .00585719** .00508458* constr .00181038 .00207522* .00212204** .00351239** .00267262 manuf .00023673 -.00036961 -.00044197 .0031264* .003235* transp .00319927** .00176826 .00050197 .00254165 .00318823* distrib .00037242 -.0012781 -.00243604** .00039573 .0024571 restate .00125685 .0004904 -.00218059* .00016841 .00134871 henrest .00108057 -.0021578 -.0020576 .0026649 .00409266** sh_man .0011723 sh_prof .00695123*** sh_skill .00650029*** sh_unsk .01210489*** sh_supp .01380465***_cons -1.023100*** -1.067475*** -.9666192*** -1.628952*** -1.562734***
legend: * p<.1; ** p<.05; *** p<.01
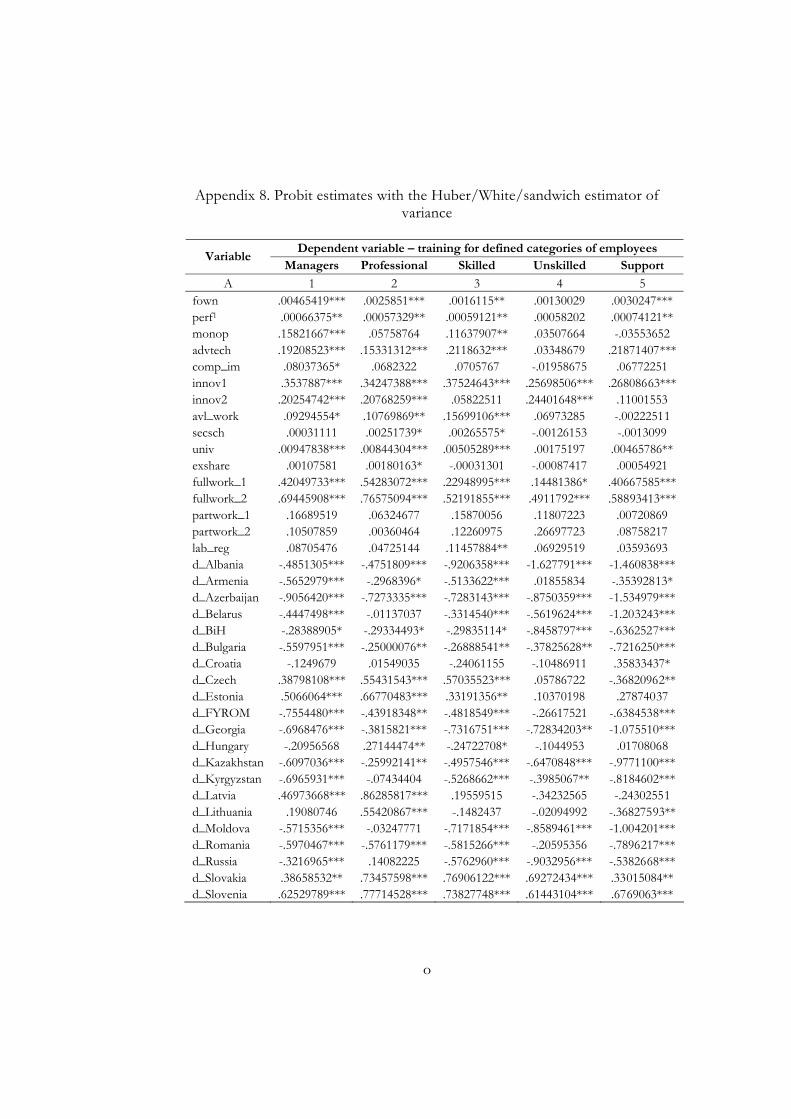
o
Appendix 8. Probit estimates with the Huber/White/sandwich estimator of variance
Dependent variable – training for defined categories of employees Variable
Managers Professional Skilled Unskilled Support
A 1 2 3 4 5 fown .00465419*** .0025851*** .0016115** .00130029 .0030247*** perf1 .00066375** .00057329** .00059121** .00058202 .00074121** monop .15821667*** .05758764 .11637907** .03507664 -.03553652 advtech .19208523*** .15331312*** .2118632*** .03348679 .21871407***comp_im .08037365* .0682322 .0705767 -.01958675 .06772251 innov1 .3537887*** .34247388*** .37524643*** .25698506*** .26808663***innov2 .20254742*** .20768259*** .05822511 .24401648*** .11001553 avl_work .09294554* .10769869** .15699106*** .06973285 -.00222511 secsch .00031111 .00251739* .00265575* -.00126153 -.0013099 univ .00947838*** .00844304*** .00505289*** .00175197 .00465786** exshare .00107581 .00180163* -.00031301 -.00087417 .00054921 fullwork_1 .42049733*** .54283072*** .22948995*** .14481386* .40667585***fullwork_2 .69445908*** .76575094*** .52191855*** .4911792*** .58893413***partwork_1 .16689519 .06324677 .15870056 .11807223 .00720869 partwork_2 .10507859 .00360464 .12260975 .26697723 .08758217 lab_reg .08705476 .04725144 .11457884** .06929519 .03593693 d_Albania -.4851305*** -.4751809*** -.9206358*** -1.627791*** -1.460838***d_Armenia -.5652979*** -.2968396* -.5133622*** .01855834 -.35392813* d_Azerbaijan -.9056420*** -.7273335*** -.7283143*** -.8750359*** -1.534979***d_Belarus -.4447498*** -.01137037 -.3314540*** -.5619624*** -1.203243***d_BiH -.28388905* -.29334493* -.29835114* -.8458797*** -.6362527***d_Bulgaria -.5597951*** -.25000076** -.26888541** -.37825628** -.7216250***d_Croatia -.1249679 .01549035 -.24061155 -.10486911 .35833437* d_Czech .38798108*** .55431543*** .57035523*** .05786722 -.36820962**d_Estonia .5066064*** .66770483*** .33191356** .10370198 .27874037 d_FYROM -.7554480*** -.43918348** -.4818549*** -.26617521 -.6384538***d_Georgia -.6968476*** -.3815821*** -.7316751*** -.72834203** -1.075510***d_Hungary -.20956568 .27144474** -.24722708* -.1044953 .01708068 d_Kazakhstan -.6097036*** -.25992141** -.4957546*** -.6470848*** -.9771100***d_Kyrgyzstan -.6965931*** -.07434404 -.5268662*** -.3985067** -.8184602***d_Latvia .46973668*** .86285817*** .19559515 -.34232565 -.24302551 d_Lithuania .19080746 .55420867*** -.1482437 -.02094992 -.36827593**d_Moldova -.5715356*** -.03247771 -.7171854*** -.8589461*** -1.004201***d_Romania -.5970467*** -.5761179*** -.5815266*** -.20595356 -.7896217***d_Russia -.3216965*** .14082225 -.5762960*** -.9032956*** -.5382668***d_Slovakia .38658532** .73457598*** .76906122*** .69272434*** .33015084** d_Slovenia .62529789*** .77714528*** .73827748*** .61443104*** .6769063***
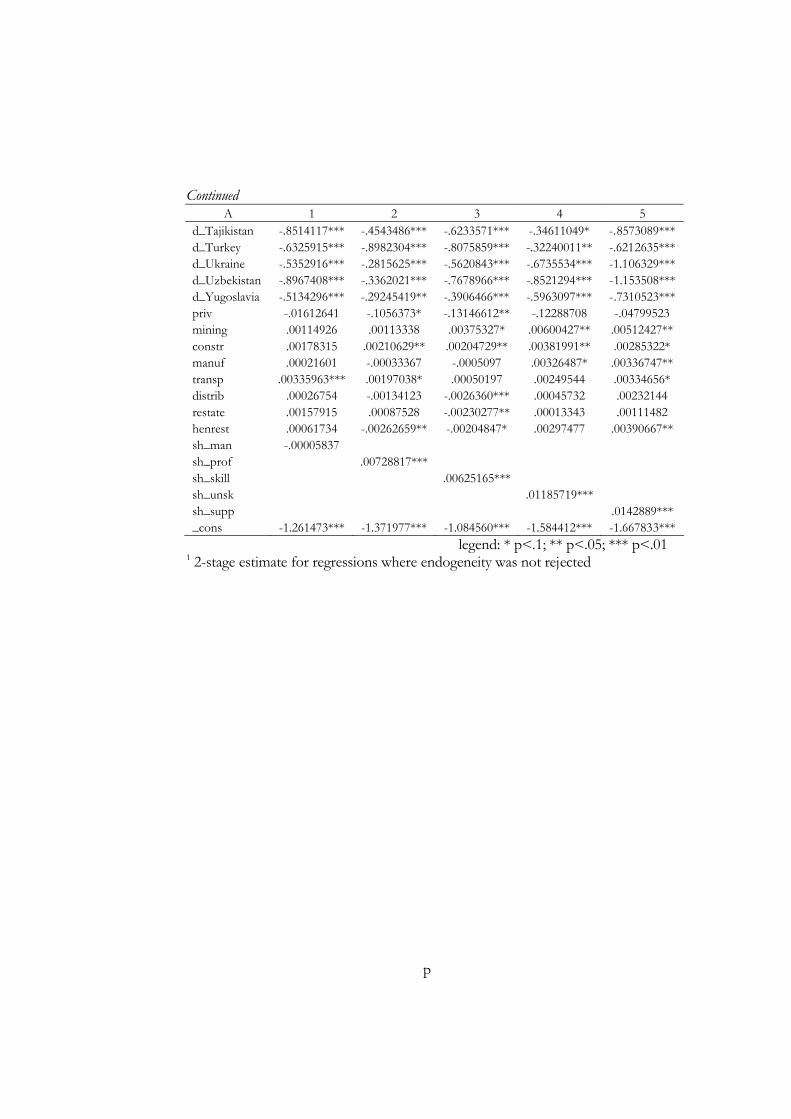
p
Continued A 1 2 3 4 5
d_Tajikistan -.8514117*** -.4543486*** -.6233571*** -.34611049* -.8573089***d_Turkey -.6325915*** -.8982304*** -.8075859*** -.32240011** -.6212635***d_Ukraine -.5352916*** -.2815625*** -.5620843*** -.6735534*** -1.106329***d_Uzbekistan -.8967408*** -.3362021*** -.7678966*** -.8521294*** -1.153508***d_Yugoslavia -.5134296*** -.29245419** -.3906466*** -.5963097*** -.7310523***priv -.01612641 -.1056373* -.13146612** -.12288708 -.04799523 mining .00114926 .00113338 .00375327* .00600427** .00512427** constr .00178315 .00210629** .00204729** .00381991** .00285322* manuf .00021601 -.00033367 -.0005097 .00326487* .00336747** transp .00335963*** .00197038* .00050197 .00249544 .00334656* distrib .00026754 -.00134123 -.0026360*** .00045732 .00232144 restate .00157915 .00087528 -.00230277** .00013343 .00111482 henrest .00061734 -.00262659** -.00204847* .00297477 .00390667** sh_man -.00005837 sh_prof .00728817*** sh_skill .00625165*** sh_unsk .01185719*** sh_supp .0142889*** _cons -1.261473*** -1.371977*** -1.084560*** -1.584412*** -1.667833***
legend: * p<.1; ** p<.05; *** p<.01 1 2-stage estimate for regressions where endogeneity was not rejected
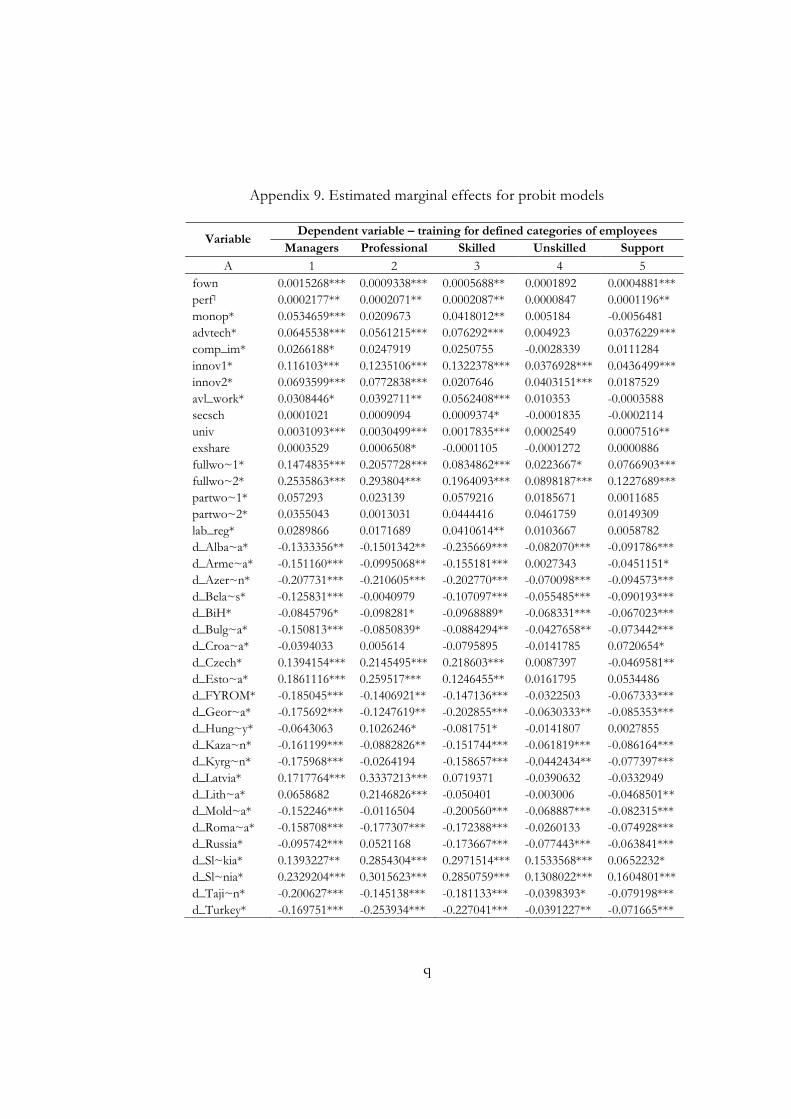
q
Appendix 9. Estimated marginal effects for probit models
Dependent variable – training for defined categories of employees Variable
Managers Professional Skilled Unskilled Support
A 1 2 3 4 5 fown 0.0015268*** 0.0009338*** 0.0005688** 0.0001892 0.0004881***perf1 0.0002177** 0.0002071** 0.0002087** 0.0000847 0.0001196** monop* 0.0534659*** 0.0209673 0.0418012** 0.005184 -0.0056481 advtech* 0.0645538*** 0.0561215*** 0.076292*** 0.004923 0.0376229***comp_im* 0.0266188* 0.0247919 0.0250755 -0.0028339 0.0111284 innov1* 0.116103*** 0.1235106*** 0.1322378*** 0.0376928*** 0.0436499***innov2* 0.0693599*** 0.0772838*** 0.0207646 0.0403151*** 0.0187529 avl_work* 0.0308446* 0.0392711** 0.0562408*** 0.010353 -0.0003588 secsch 0.0001021 0.0009094 0.0009374* -0.0001835 -0.0002114 univ 0.0031093*** 0.0030499*** 0.0017835*** 0.0002549 0.0007516** exshare 0.0003529 0.0006508* -0.0001105 -0.0001272 0.0000886 fullwo~1* 0.1474835*** 0.2057728*** 0.0834862*** 0.0223667* 0.0766903***fullwo~2* 0.2535863*** 0.293804*** 0.1964093*** 0.0898187*** 0.1227689***partwo~1* 0.057293 0.023139 0.0579216 0.0185671 0.0011685 partwo~2* 0.0355043 0.0013031 0.0444416 0.0461759 0.0149309 lab_reg* 0.0289866 0.0171689 0.0410614** 0.0103667 0.0058782 d_Alba~a* -0.1333356** -0.1501342** -0.235669*** -0.082070*** -0.091786*** d_Arme~a* -0.151160*** -0.0995068** -0.155181*** 0.0027343 -0.0451151* d_Azer~n* -0.207731*** -0.210605*** -0.202770*** -0.070098*** -0.094573*** d_Bela~s* -0.125831*** -0.0040979 -0.107097*** -0.055485*** -0.090193*** d_BiH* -0.0845796* -0.098281* -0.0968889* -0.068331*** -0.067023*** d_Bulg~a* -0.150813*** -0.0850839* -0.0884294** -0.0427658** -0.073442*** d_Croa~a* -0.0394033 0.005614 -0.0795895 -0.0141785 0.0720654* d_Czech* 0.1394154*** 0.2145495*** 0.218603*** 0.0087397 -0.0469581** d_Esto~a* 0.1861116*** 0.259517*** 0.1246455** 0.0161795 0.0534486 d_FYROM* -0.185045*** -0.1406921** -0.147136*** -0.0322503 -0.067333*** d_Geor~a* -0.175692*** -0.1247619** -0.202855*** -0.0630333** -0.085353*** d_Hung~y* -0.0643063 0.1026246* -0.081751* -0.0141807 0.0027855 d_Kaza~n* -0.161199*** -0.0882826** -0.151744*** -0.061819*** -0.086164*** d_Kyrg~n* -0.175968*** -0.0264194 -0.158657*** -0.0442434** -0.077397*** d_Latvia* 0.1717764*** 0.3337213*** 0.0719371 -0.0390632 -0.0332949 d_Lith~a* 0.0658682 0.2146826*** -0.050401 -0.003006 -0.0468501** d_Mold~a* -0.152246*** -0.0116504 -0.200560*** -0.068887*** -0.082315*** d_Roma~a* -0.158708*** -0.177307*** -0.172388*** -0.0260133 -0.074928*** d_Russia* -0.095742*** 0.0521168 -0.173667*** -0.077443*** -0.063841*** d_Sl~kia* 0.1393227** 0.2854304*** 0.2971514*** 0.1533568*** 0.0652232* d_Sl~nia* 0.2329204*** 0.3015623*** 0.2850759*** 0.1308022*** 0.1604801***d_Taji~n* -0.200627*** -0.145138*** -0.181133*** -0.0398393* -0.079198*** d_Turkey* -0.169751*** -0.253934*** -0.227041*** -0.0391227** -0.071665***
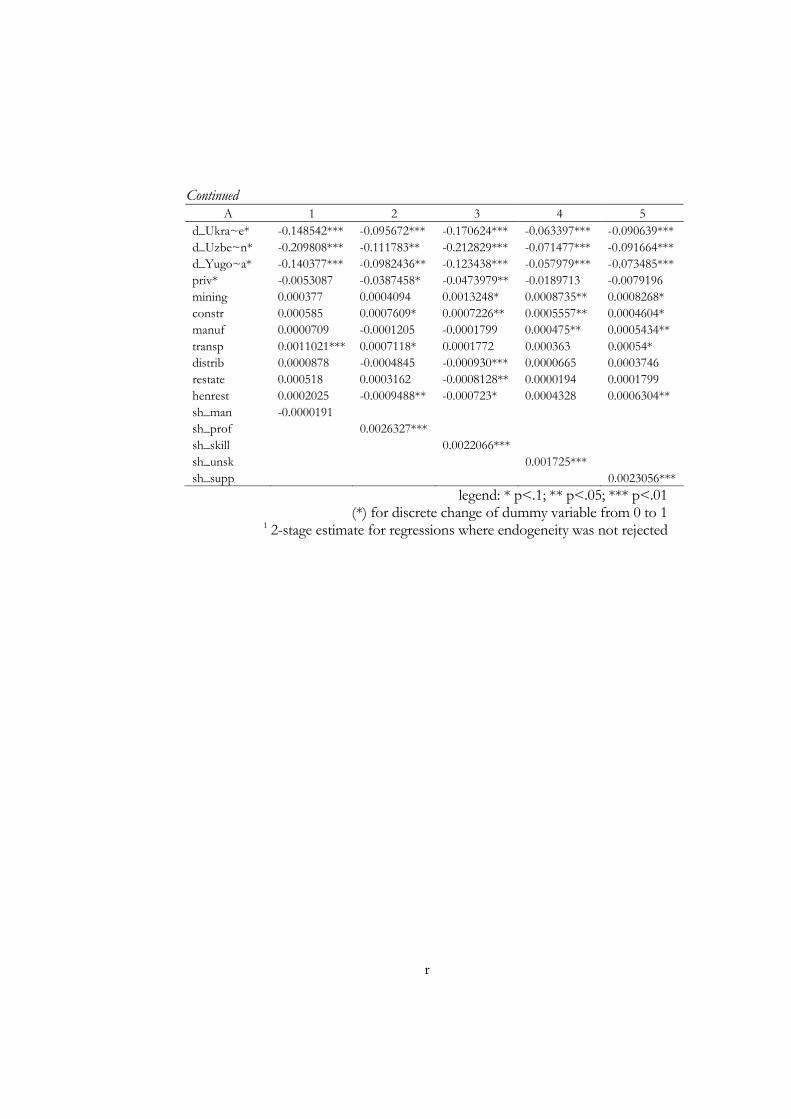
r
Continued A 1 2 3 4 5
d_Ukra~e* -0.148542*** -0.095672*** -0.170624*** -0.063397*** -0.090639*** d_Uzbe~n* -0.209808*** -0.111783** -0.212829*** -0.071477*** -0.091664*** d_Yugo~a* -0.140377*** -0.0982436** -0.123438*** -0.057979*** -0.073485*** priv* -0.0053087 -0.0387458* -0.0473979** -0.0189713 -0.0079196 mining 0.000377 0.0004094 0.0013248* 0.0008735** 0.0008268* constr 0.000585 0.0007609* 0.0007226** 0.0005557** 0.0004604* manuf 0.0000709 -0.0001205 -0.0001799 0.000475** 0.0005434** transp 0.0011021*** 0.0007118* 0.0001772 0.000363 0.00054* distrib 0.0000878 -0.0004845 -0.000930*** 0.0000665 0.0003746 restate 0.000518 0.0003162 -0.0008128** 0.0000194 0.0001799 henrest 0.0002025 -0.0009488** -0.000723* 0.0004328 0.0006304** sh_man -0.0000191 sh_prof 0.0026327*** sh_skill 0.0022066*** sh_unsk 0.001725*** sh_supp 0.0023056***
legend: * p<.1; ** p<.05; *** p<.01 (*) for discrete change of dummy variable from 0 to 1
1 2-stage estimate for regressions where endogeneity was not rejected