Embed Size (px)
Citation preview
THE ROLE OF CROSS-BORDER MERGERS ANDACQUISITIONS IN ASIAN RESTRUCTURING
Ashoka Mody and Shoko Negishi 1
August 3, 2000
1 The authors are, respectively, Lead Specialist and Economist in the Development Prospects Group, theWorld Bank. They are grateful to Richard Newfarmer and others at the Foreign Investment AdvisoryService/Poverty Reduction and Economic Management (PREM) Network seminar series. The researchwas partially funded by the Growth Thematic Group of the PREM network. The views expressed here arethose of the authors and not necessarily those of the World Bank.
ABSTRACT
Asset purchases by international firms in developing countries (cross-border mergers andacquisitions or M&A), involving more than a 50 percent stake, rose sharply in value from$19 billion in 1996 to $43 billion and $47 billion in 1997 and 1998, and fell slightly in1999. The rise was fuelled in part by the purchase of distressed assets in the East Asiancrisis countries (especially in Korea and Thailand). East Asian M&A deals jumped from$2 billion in 1996 to $7 billion in 1997, and further up to $10 billion in 1998. LatinAmerica M&A deals also increased rapidly but, in contrast to East Asia, were the resultof asset acquisition by foreigners under privatization programs. The increased capitalflows through M&A deals were welcome as capital market inflows fell sharply andforeign direct investment in new projects remained stable, or even declined.
Though on the rise, cross-border M&A in developing countries form less than 20 percentof global cross-border M&A activity. International mega-mergers, which are integratingactivities across borders to exploit technological and marketing synergies and are thuspotentially transforming several major industrial sectors, are yet to have a significantinfluence on developing countries. Recent developing country M&A may becharacterized as a first step in the integration process. That first step entails arestructuring of production and marketing activities to bring the developing countrypartner in line with the best operating procedures. In principle, cross-border M&A canfacilitate corporate and financial restructuring by improving the efficiency of operationsas well as by reducing excess capacity. The new management and financial resourcesmade available through international M&As can be especially useful following asystemic crisis that affects a large number of firms and banks, as in East Asia.
Following an overview of trends in cross-border M&A, we focus in this paper on therecent East Asian experience. As troubled firms continue to negotiate debt reschedulingand forgiveness, either directly with their creditors or under government-led programs,severely distressed firms, particularly in the non-tradable sectors, have been compelled toseek buyers for their assets. At the same time, the Korean and Thai governments haveintroduced a series of policy reforms to attract foreign investment and promote domesticand cross-border mergers and acquisitions to facilitate asset reallocation. However, thisstudy finds that cross-border mergers and acquisitions have not made an immediatecontribution to restructuring of the troubled economies. The most significant role forcross-border M&As lies in longer-term processes such as operational restructuring andreallocation of assets. After discussing several policy measures to increase the quantumof M&A deals, the paper notes the obvious importance of concomitant enhancements incompetition policy and corporate governance.
1
1. Introduction
This paper is motivated by four principal objectives:
• To describe recent trends in cross-border mergers and acquisition (M&A) activity in
developing countries (Section 2).
• To review the literature on the role that M&A can play in enhancing economic
efficiency (Section 3).
• To provide an empirical assessment of the role played thus far by cross-border M&A
in the restructuring of corporate sector in East Asia following the recent crisis
(Sections 4 and 5).
• And, finally, to draw policy lessons on mechanisms that facilitate M&A and hence
permit their efficient execution while also recognizing the need for complementary
measures to enhance competition and improve corporate governance (Section 6).
Cross-border M&A activity has been on the rise worldwide, driving the upsurge
in foreign direct investment (FDI) over the past decade, and especially over the past few
years. While industrialized countries account for a dominating 90 percent share of the
value of world cross-border M&As, Latin America and East Asia developing countries
have, is significant and the value of cross-border M&As in these countries is on the rise.
The benefits of such M&A activity remain controversial. By enhancing the competition
for corporate control, mergers can improve efficiency. Some studies show that
acquisitions can be especially useful in restructuring underperforming firms.
Before-and-after comparisons of cash flow returns of acquired firms conclude that
acquisitions bring higher wealth gains for insolvent firms than those under independent
work-out, and that those gains are higher in cross-border transactions than domestic
2
M&As. At the same time, mergers can also destroy value where the projected synergies
do not materialize and/or the corporate cultures clash (see Ghemawat and Ghadar 2000,
Economist 2000)
In this context, cross-border mergers in the East Asian crisis countries are of special
interest.2 Though financial reengineering of debt owed by troubled firms, including under
government-sponsored voluntary work-out schemes, has made progress, severely
distressed firms, particularly in the non-tradable sectors, have been compelled to seek
buyers for their assets. The Korean and Thai governments, in particular, have introduced
a series of policy reforms to create a better environment for foreign investment as well as
domestic and cross-border mergers and acquisitions to enhance asset reallocation.
This paper empirically examines the sectoral patterns of cross-border merger and
acquisition activity and their relationship to recovery in East Asia. The main findings
are:
• Cross-border M&A activity has occurred primarily in the most distressed sectors,
such as non-tradable sectors. On the other hand, the sectors that are performing
relatively well have less M&A activity.
• There is insufficient evidence to suggest so-called “fire-sales” of distressed assets.
• But, equally, we found little sign of immediate contributions of cross-border M&As
to the restructuring of the troubled economies. Our evidence is, however, tentative
since we use industry averages rather than firm-level data. However, the lack of an
impact is not implausible. Given the gravity of problems, especially in the non-
3
tradable sectors, it is not surprising that the restructuring effects of cross-border
M&As have not yet materialized. The most significant role for cross-border M&As,
therefore, lies ahead in the longer-term processes such as operational restructuring
and reallocation of assets.
• Government policies to enhance domestic mergers and acquisitions, greater
competition, and improved corporate governance will reinforce the beneficial effects
of foreign mergers and acquisitions.
2. Cross-Border M&A: Trends, Motives, and Impacts
This section reports on cross-border M&A trends and, in particular, compares them with
trends in FDI. In doing so, however, one important caveat needs to be noted. M&A is a
form of FDI. However, the balance of payments data does not distinguish between M&A
and “greenfield” FDI (new projects). Hence the comparison has to be made on reported
values of cross-border M&As; these reported values, unfortunately, include amounts that
are not components of the balance of payments reporting of FDI data. As such, the two
series cannot be directly compared. The amount recorded as FDI refers to funds
channeled through the capital account of a country in relation to both M&A and new
projects; these transferred amounts can either be equity, reinvested earnings, or inter-
company debt (i.e., debt issued by the parent to the subsidiary company). In contrast,
cross-border M&A data refer to transaction values. If, for example, the foreign acquiring
company raises debt within the domestic market to purchase the target company, that
2 All the statistical references to cross-border mergers and acquisitions in this paper involve acquisitions ofmore than a 50 percent equity stake by foreign investors unless otherwise noted.
4
amount is also included in the reported values. In practice, such amounts are not likely to
be large. Additionally, and perhaps more importantly, the acquiring company may
borrow internationally to finance the purchase of the target company. Unlike domestic
debt, such international debt financing does represent a transfer of resources to the
recipient country. However, the comparison with FDI flows breaks down since, as noted,
those flows include only inter-company debt. In practice, it is difficult to judge how
important even this difference is. For FDI also it is possible that the international firm
may borrow internationally and then on-lend on its own account to its foreign subsidiary.
Cross-border M&As have increased significantly in industrialized as well as
developing countries over the past decade. Although developing countries share of cross-
border M&As is still small relative to industrialized countries, transactions in Latin
America (primarily through privatization) and East Asia (post-crisis asset sales) have led
an upsurge among developing countries. In East Asia, Korea and Thailand in particular
have attracted large volumes of M&A activity since 1997. In analyzing these flows, it is
helpful to distinguish between two different motives for the M&A activity: creating
opportunities for the future (strategic partnering) and resolving past problems (corporate
restructuring). Most M&A activity occurring in developed countries is in the industries
under competitive pressure as a result of deregulation, technological renovation, or large
R&D expenditures, and is thus intended for strategic repositioning. In developing
countries, cross-border M&As can immediately provide liquidity and prevent asset
losses, and enhance resource allocation. In the long-term, M&As potentially introduce
new management and operation systems, thereby improving efficiency and
competitiveness.
5
2.1 Trends and principal sectoral characteristics
According to data assembled by the United Nations Conference on Trade and
Development (UNCTAD), global cross-border acquisitions (in which a foreign purchaser
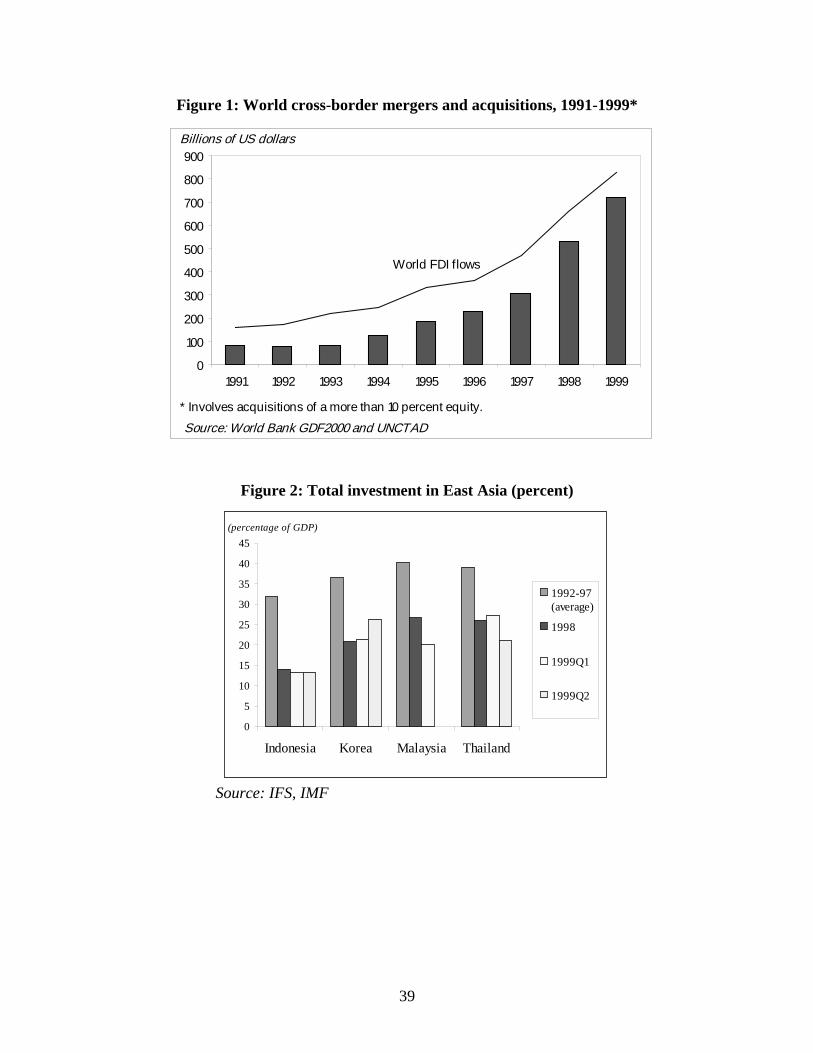
acquired more than a 10 percent stake) reached $720 billion in 1999, up by 35 percent
from $532 billion in 1998, whereas the majority cross-border M&A value was $411
billion.3 Despite the rise in dollar values, developing country M&A declined from $81
billion (15 percent of total M&A) in 1998 to $63 billion (9 percent) in 1999. Cross-border
M&As in developing countries grew at an annual average rate of 81 percent during the
period of 1991-1999, compared with 26 percent annual average growth of FDI flows in
developing countries. These decade averages, however, mask the sharp jump in recent
years, such as 132 percent from 1996 to 1997.
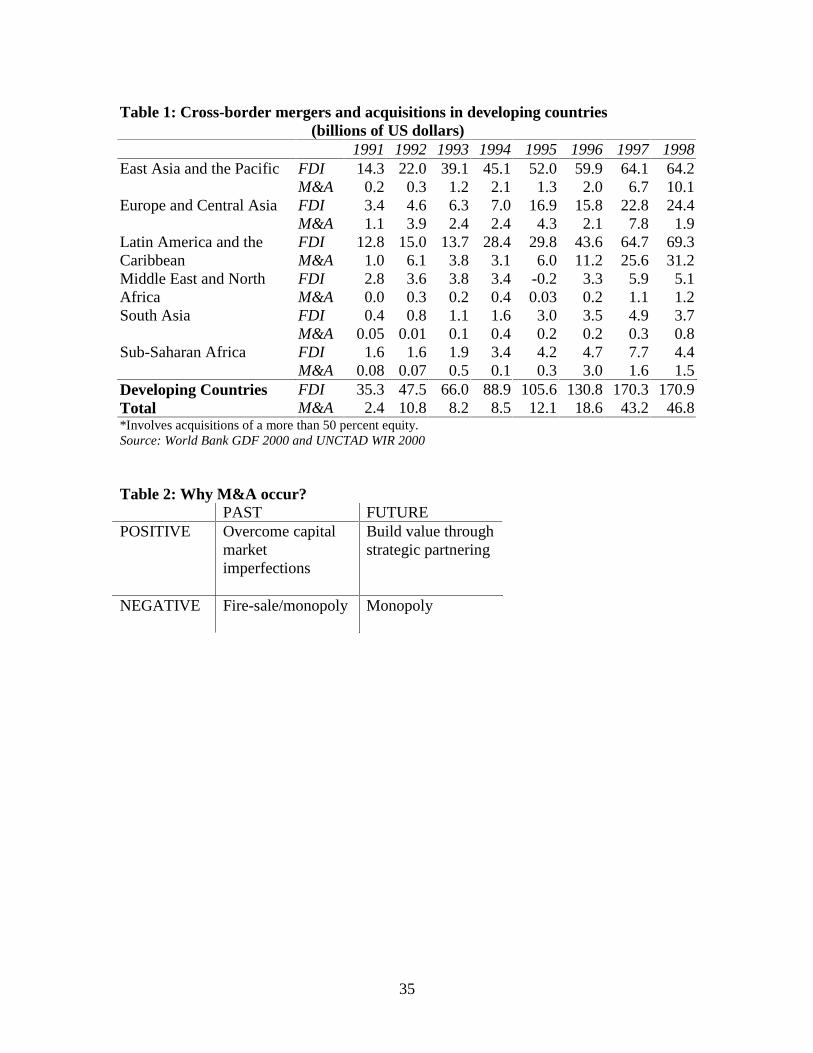
Within developing countries, Latin America has been the largest target region of
cross-border M&As, most of which have been through privatization programs (figure 1).
Though smaller in M&A size, East Asia has been the fastest growing target region,
growing at an annual average rate of 106 percent (table 1), again with the big absolute
jump occurring after the 1997 crisis. Unlike in Latin America, cross-border M&A activity
in East Asia has been largely through sales of private firms.
The recent cross-border M&As in industrialized countries and, to a lesser extent,
in developing countries are characterized by large-scale transactions (Ghemawat and
Ghadar 2000 and Economist 2000). The mega deals in industrialized economies in 1999
3 UNCTAD introduced a new statistics of acquisitions of a more than 10 percent stake, which is morecomparable to FDI statistics. We do not have information of 1999 according to this definition, and hence nocomparison is made to the rest of the statistics based on the majority acquisitions of a more than 50 percentstake.
6
include acquisitions of AirTouch Communications of the United States by Vodafone
Group PLC in the United Kingdom for $65.9 billion and Atlantic Richfield Co. of the
U.S. by BP Amoco PLC in the UK for $33.7 billion. Mega transactions in developing
countries, notably in Latin America, have been closely related to privatization projects,
such as the sale of Brazil’s Telebras for $19 billion in 1998 and Argentina’s petroleum
company YPF SA for $19 billion in 1999.
2.2 What drives M&A?
M&A activity create competition for corporate control, motivated by both private and
regulatory incentives. Private incentives include imperfections and asymmetries in
domestic product and capital markets (Kindleberger 1969, Caves 1971, Hymer 1976, and
Froot and Stein 1991), competitive environment of the market, differences in tax systems
(Scholes and Wolfson 1990). The imperfections and costs motivate firms to pursue
mergers and acquisitions to capitalize on monopoly rents or internalize operations.
Regulatory incentives include variations in corporate governance (Jensen 1986), and
policy frameworks towards foreign investment.4 Management that acts in its own interest
may cause financial losses to shareholders, which provides a potential for other firms to
intervene. Liberalization of foreign entry and ownership will open up more opportunities
for cross-border M&A activity.
Though the distinction is not always clear-cut, M&A activity can be broadly
classified into two categories (table 2). The first type of M&As is mainly motivated by
past problems and attempts to create value through restructuring. The second type is
4 A comprehensive summary of the literature is also provided in Kang (1993).
7
forward looking, seeking to create value through creative partnerships. Negative features
of M&A arise if the first type is driven by “fire-sales” of distressed firms, and the second
type of M&As is triggered by firms seeking for market monopoly. In both cases,
mismanagement may destroy shareholder value.
The upsurge of M&As in the United States in the 1980s reflected the need to
revitalize domestic firms to a new reality of increased global competition. Acquisitions
by foreign firms were significant. During the 1985-1989 period, foreign acquisitions of
U.S. firms amounted for over $170 billion, 17 percent of total U.S. takeover activity
(Harris and Ravenscraft 1991). Japan was one of the major investors, with a $13 billion
outlay in 1988 for acquisitions of 132 U.S. firms (Kang 1993). Motivated largely by the
value of restructuring the acquired firms, these early U.S. M&A were similar to the M&A
in post-crisis East Asia. In the U.S. M&As of the 1980s, the firms were under
competitive pressure to rationalize and raise profitability, whereas East Asian firms have
been struggling to recover from severe financial distress and also improve their long-term
competitiveness.
In contrast, the recent mega mergers have been largely driven by incentives for
strategic partnerships to share costs of the innovation process and extend product variety.
Strategic partnering through M&As can lead to new forms of oligopolistic competition
based on knowledge networks. Strategic M&A activity can increase the operational
flexibility of firms to meet new demands that are constantly generated under the
continuous process of innovation (UNCTAD 1999). The sectoral examples of M&A
demonstrate the pressures for consolidation and rationalization of assets. The
telecommunication and banking industries, having gone through a series of deregulatory
8
measures, are dealing with a complex mix of greater competition arising from
technological change and the need to supply a worldwide market. The oil and chemical
industries are similarly facing the challenge of technological renovation. Firms in the
pharmaceutical industry, a major target of M&As in industrialized countries, rely heavily
on R&D, which makes strategic mergers advantageous. As these examples show,
globalization heightens competition, which forces firms to rationalize internal resources
and increase access to wider markets as well as to achieve economies of scale through
M&As. Meanwhile, internationalization of operation, management and financial assets
can make firms more resistant to external shocks and volatility as a result of rapid
globalization in developing countries.
In developing countries also, deregulation and liberalization of trade and services
has opened up more opportunities for foreign investors. However, this first stage of
M&A is being driven either by privatizations of state-owned enterprises, which need
significant upgrading, or by M&As of troubled private firms.
The increased M&A activity in the crisis-afflicted economies has been driven by
exchange rate depreciations and lower domestic asset prices, which provided foreign
investors with greater scope for acquiring assets. Meanwhile policy frameworks towards
foreign entry have been liberalized in those economies. On the other hand, domestic
firms are faced with large debt repayments in rising interest rates and thereby forced into
restructuring. This has particularly been the case for those firms in the non-tradable
sectors that could barely benefit from the export growth as a result of currency
depreciation. For some financially troubled firms the only alternative to bankruptcy has
been to sell their assets. This has let to a concern in East Asia that the current wave of
9
cross-border M&As represents “fire-sales” of domestic assets, which will result in
substantial transfer of domestic wealth to foreigners, thereby involving little prospect of
restructuring the troubled sectors.
2.3 Benefits of M&A
We focus here on two questions. First, are cross-border M&A different from domestic
M&As? Second, do M&As play a special role in restructuring?
Cross-border M&A Whether cross-border M&As bring benefits to host countries has not
yet been empirically clarified. Consolidation and rationalization of resources as a result
of M&Asdomestic or cross-bordercan resolve over-capacity and improve efficiency.
Nevertheless the immediate impact of M&A activity may be negative as consolidation
and rationalization result in reduced employment and, possibly, reduced competition.
Cross-border M&A activity can be beneficial to a host country when it prevents
potentially profitable assets from being wiped out, which is specifically applicable to
M&As involving either privatization of state-owned enterprises in transition economies
or sales of financially distressed firms in developing countries. Highly indebted, loss-
making companiesstate-owned or privateoften have no option but to go insolvent
unless they can be sufficiently financed by external resources, most probably coming
from foreign investors given domestic financial constraints. Various examples from the
transition economies in Central and Eastern Europe suggest that privatization-related
cross-border M&As have played a key role in restructuring domestic firms. A study of
the Czech Republic, Poland, and Hungary during the 1992-95 period indicates that
10
foreign investment enterprises had a higher propensity to invest, were more export-
oriented, and also were faster in restructuring, than domestic firms (Hunya 1997).
Other evidence suggests that in Hungary’s banking sector, where the major
privatization program has been completed, foreign investors have provided technical
expertise as well as financial support, and have demonstrated greater independence from
domestic political influence than domestic firms. Moreover the new entry of foreign
investors into the retail market of the banking sector has increased competition, thereby
promoting the development of innovative services as well as improving personnel
training and marketing (World Bank 1999a).
Empirical analyses of mergers and acquisitions and corporate restructuring are,
however, limited because of the lack of availability of financial information of acquired
firms. Financial information of firms whose majority stake is acquired by other operating
firms will be replaced by the consolidated information of the acquirers shortly after the
transactions are completed. Therefore very few studies examine the long-term impact of
M&A activity on restructuring. Some analyses of U.S. firms suggest that cross-border
M&As bring larger wealth gains than domestic transactions, by comparing short-term
stock returns (a few days before and after the announcement of mergers) of acquired
firms. A comparative study of 1273 U.S. firms acquired during the period 1970-1987 by
foreign and domestic firms shows that wealth gains for target firms observed 1-4 days
after the announcement of mergers (approximated by cumulative abnormal stock returns)
are significantly higher in cross-border transactions than in domestic acquisitions by
around 10 percentage points (Harris and Ravenscraft 1991). Similarly, a study of
Japanese merger and acquisition activity in the United States during the 1975-1988
11
period concluded that the sale of a majority stake to Japanese firms leads to significantly
higher target returns than the sale of a majority interest to U.S. firms (Kang 1993).
Role in restructuring Some evidence suggests that M&As can facilitate efficient
redeployment of assets of insolvent firms in the longer-term. Hotchkiss and Mooradian
(1998) focused on 55 post-merger performance of insolvent firms that were acquired by
other operating firms, in comparison to matching non-bankrupt transactions. The study
found that post-merger cash flow returns of acquired insolvent firms improved in the first
and second years by around 6 percent each, whereas post-merger cash flow returns of
non-bankrupt firms showed no statistically significant improvements. They also
suggested that potential sources of operating gains for the acquisitions of insolvent firms
were reductions in operating expenses.5
In the long-term, however, not only can M&As induce new investment, domestic
or foreign, by the acquirers and their suppliers, but they can also introduce new
managerial, production and marketing resources to target firms, thereby improving
efficiency and productivity (UNCTAD 1999). Eventual integration with the corporate
networks of the acquirers can further expand opportunities. Moreover, cross-border
M&As bring foreign exchange and help the developing host countries fill the gaps in
their current accounts.
5 There is a study of 344 cross-border and domestic M&A transactions of U.S. firms during the 1980-1990period, which showed that significantly high cumulative abnormal returns in cross-border acquisitions wasalso observed in domestic transactions (Blumberg and Owers 1996).
12
3. East Asian Financial Distress and Recovery
More than two years since the onset of the East Asian crisis a strong cyclical recovery is
ongoing but large parts of the corporate and financial sectors in the crisis economies
remain in distress. In late 1999, non-performing loans (NPLs) in their banking systems,
though lower in some countries than their historical peaks, were still at considerably high
levels. In Indonesia, the Republic of Korea, Malaysia and Thailand respectively, NPLs
were 25 percent, 18 percent, 45 percent, 41 percent of gross domestic product (GDP), and
an estimated 50 percent, 15 percent, 21 percent and 39 percent of total loans.6 Recovery
has been strongest in Korea, which along with Malaysia, has benefited especially from
the strong international demand for electronics products. And while such a recovery is
likely to continue, the aftereffects of the financial shock will persist, and continued
restructuring is essential both to reinforce that recovery and to reduce future
vulnerabilities.
3.1 Summary of events
The East Asian crisis has exposed financially weak firms in the corporate sector that have
operated on thin margins, and their subsequent inability to pay interest has aggravated
their debt burden. Since their ability and incentives to invest are limitedand since such
firms constitute a significant portion of the crisis economiesthey will continue to act as
a drag on investment and growth until the financial claims are resolved, and either their
operations return to adequate profitability or their assets are redeployed. Meanwhile the
13
distressed banking sector itself requires further recapitalization or consolidation to avoid
continued systemic risks and growing fiscal liabilities for governments.
The East Asian crisis has driven many marginal firms into illiquidity, and resulted
in a high level of accumulated debt and associated interest payments. Consequently,
many firms that have recently emerged from the worst effects of the crisis are still in a
precarious situation and are vulnerable to further shocks. Furthermore, non-performing
loans by banks and non-bank financial companies have remained exceptionally high.
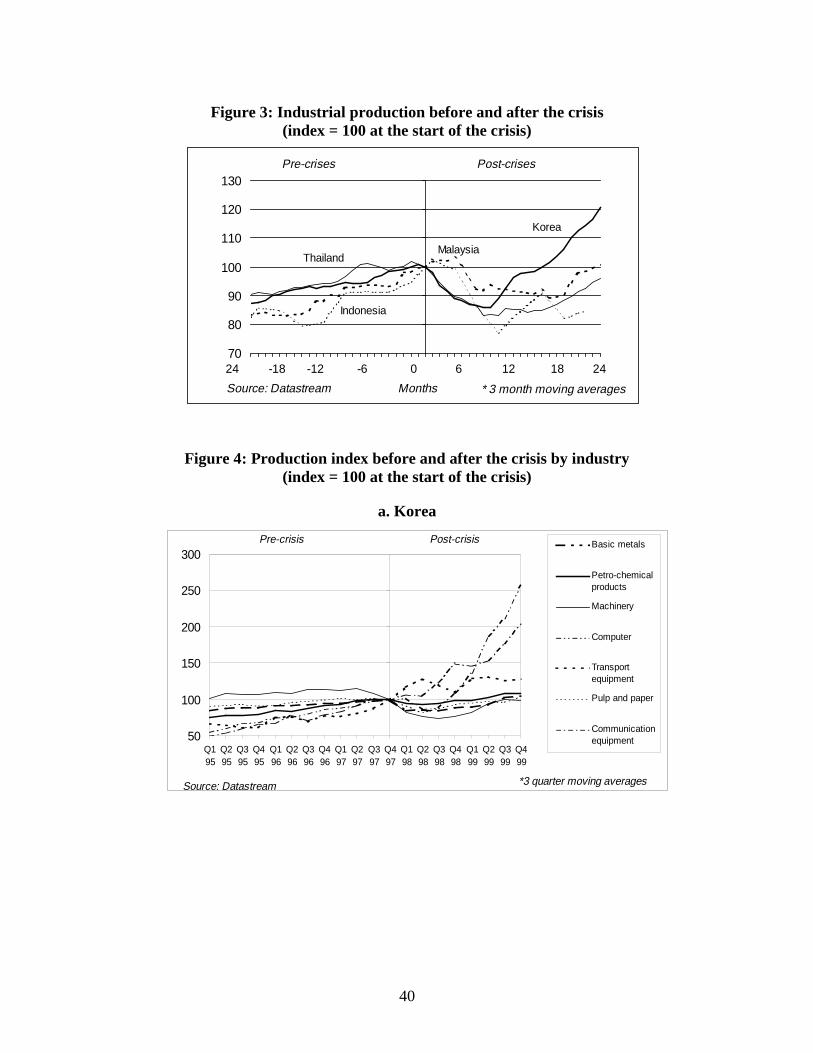
• Investment rates have fallen sharply since the onset of the crisis (figure 2). Relative to
the average of 1992-97, the investment rates in the second quarter of 1999 were down
by about 57 percent in Indonesia, 40 percent in Thailand, and by 30 percent in Korea.
• The government has borne the brunt of bank restructuring. Bank recapitalization
costs are significantly large in relation to existing public debt; estimated at 48
percent, 4 percent, 8 percent, and 8 percent of GDP in Indonesia, Korea, Malaysia,
and Thailand respectively (World Bank 1999b). Without the ability to collect on non-
performing loans, debt levels will show a higher than reported increase.
• In corporate restructuring in contrast, the proper role for governments is to facilitate
resolution of financial claims and foster the reallocation and mobility of assets.
In the absence of effective bankruptcy regimes, governments in all the crisis
countries have instituted out-of-court mechanisms to speed up financial settlements. At
the same time, bankruptcy procedures, where needed, have been reformed, which may
also help resolution of financial claims in the short run and may provide a sounder basis
for improved corporate governance in the long run. Once financial property rights have
6 These numbers include non-performing loans purchased by asset management companies.
14
been clarified, the market system and the private sector should be in a position to
undertake the required reallocations of productive assets, but governments can play an
important role in permitting greater asset mobility. Reforms following the crisis also
included short-term tax regime changes to facilitate asset transactions and, more
importantly from a long term perspective, better accounting standards, which should
contribute to improved corporate governance through better evaluation of financial assets
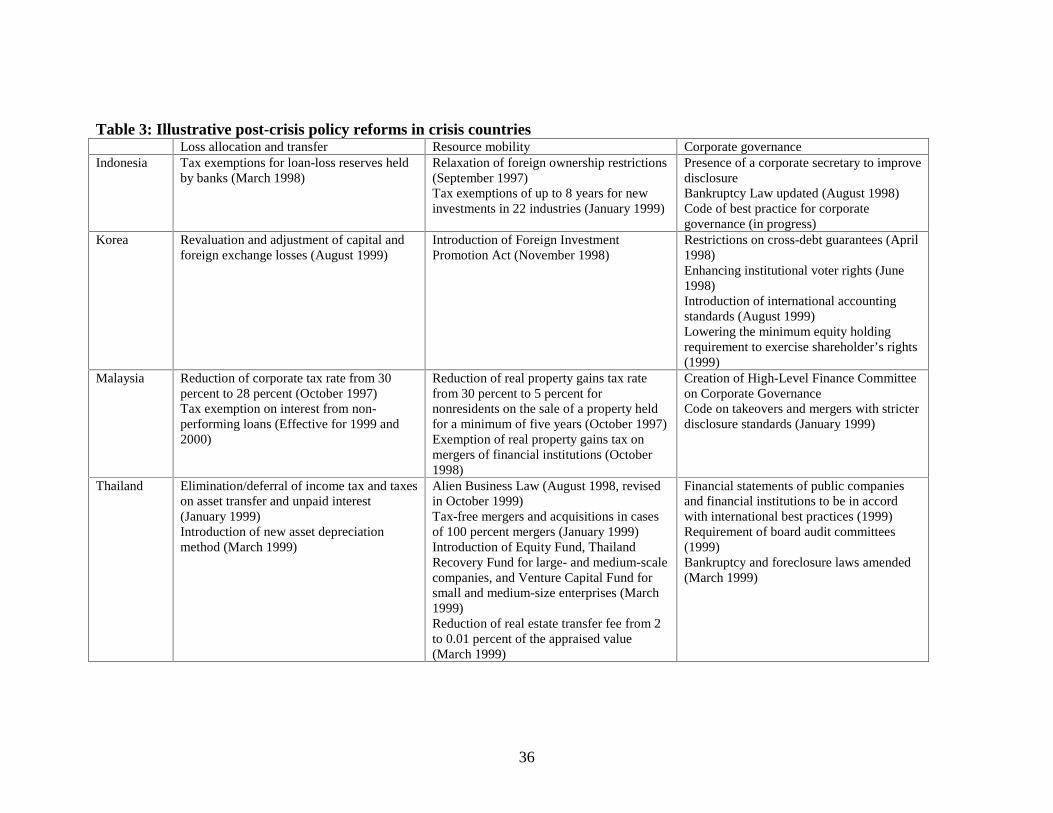
and liabilities (table 3).
3.2 Sectoral Distress and Recovery
The crisis had a disproportionate impact on firms with pre-existing structural weaknesses,
and this has also consequently resulted in uneven recovery. Signs of distress and
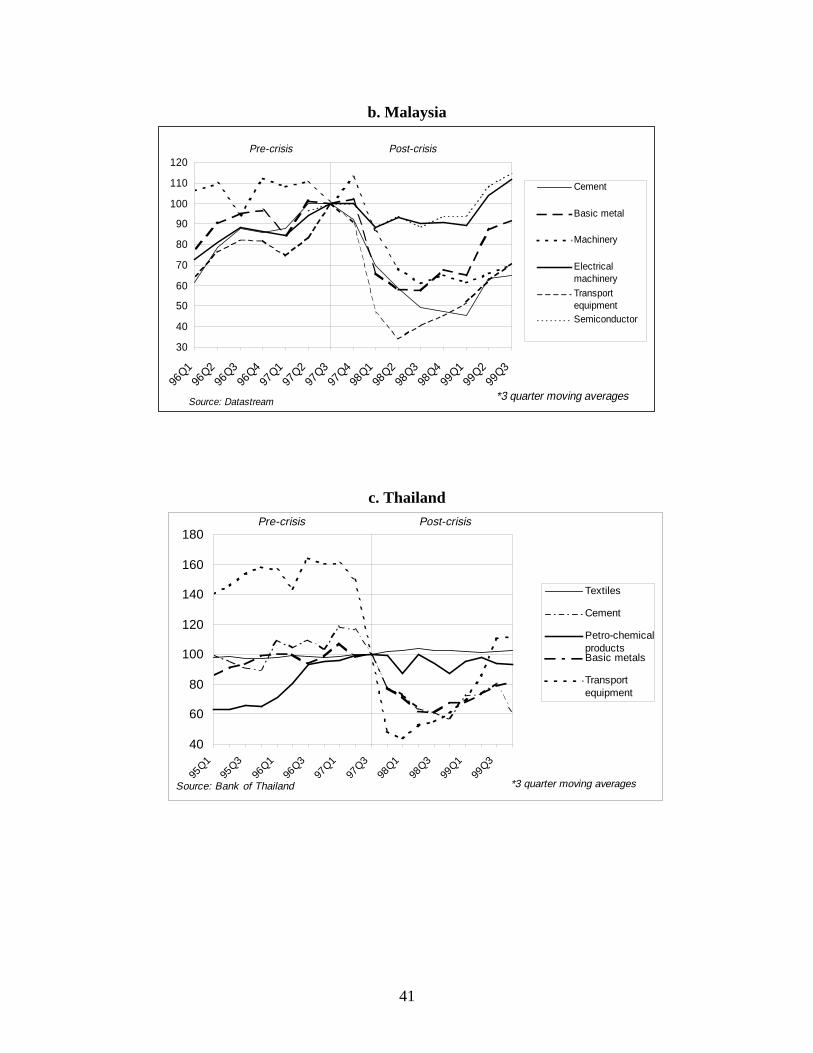
recovery become apparent through the examination of various indicators. Industrial
production in manufacturing has shown significant recovery in Korea and, to a lesser
extent, also in Malaysia (figure 3). This faster recovery reflects in part their greater
strengths in sectors such as electronics, computers, and telecommunication equipment.
Korean firms have also shown resilience in the transport equipment sector (figure 4a).
Similarly Thai firms in the transport equipment sector have made a strong bounce back
after a sharp decline in output, whereas Malaysian firms are still on the way to returning
to the pre-crisis level (figure 4b, 4c). In Korea, Malaysia and Thailand traditional
manufacturing sectors such as chemical products, cement products, metals, and
machinery have only shown a limited recovery, but in some cases a decline significantly
predated the crisis.
15
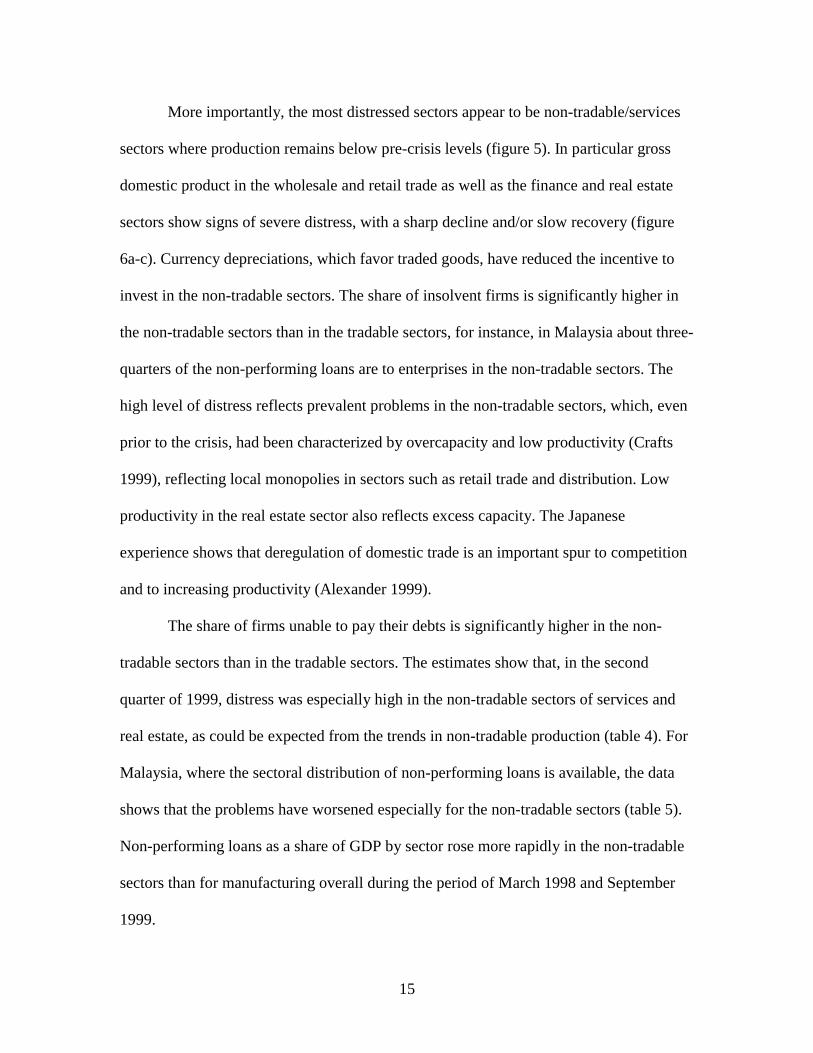
More importantly, the most distressed sectors appear to be non-tradable/services
sectors where production remains below pre-crisis levels (figure 5). In particular gross
domestic product in the wholesale and retail trade as well as the finance and real estate
sectors show signs of severe distress, with a sharp decline and/or slow recovery (figure
6a-c). Currency depreciations, which favor traded goods, have reduced the incentive to
invest in the non-tradable sectors. The share of insolvent firms is significantly higher in
the non-tradable sectors than in the tradable sectors, for instance, in Malaysia about three-
quarters of the non-performing loans are to enterprises in the non-tradable sectors. The
high level of distress reflects prevalent problems in the non-tradable sectors, which, even
prior to the crisis, had been characterized by overcapacity and low productivity (Crafts
1999), reflecting local monopolies in sectors such as retail trade and distribution. Low
productivity in the real estate sector also reflects excess capacity. The Japanese
experience shows that deregulation of domestic trade is an important spur to competition
and to increasing productivity (Alexander 1999).
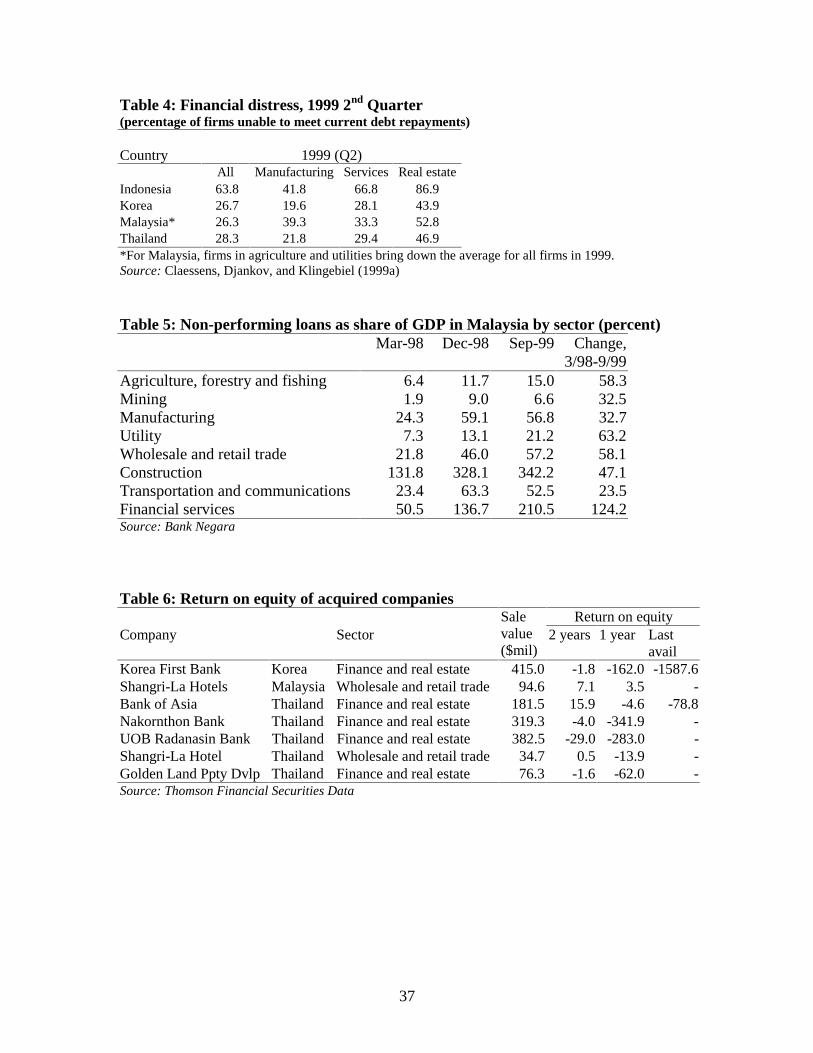
The share of firms unable to pay their debts is significantly higher in the non-
tradable sectors than in the tradable sectors. The estimates show that, in the second
quarter of 1999, distress was especially high in the non-tradable sectors of services and
real estate, as could be expected from the trends in non-tradable production (table 4). For
Malaysia, where the sectoral distribution of non-performing loans is available, the data
shows that the problems have worsened especially for the non-tradable sectors (table 5).
Non-performing loans as a share of GDP by sector rose more rapidly in the non-tradable
sectors than for manufacturing overall during the period of March 1998 and September
1999.
16
4. Cross-Border M&As in East Asian Restructuring
As noted, cross-border mergers and acquisitions (M&As) can be a usefuland, unlike
most other initiatives, a private-sector drivenrestructuring tool for host economies
when distressed firms have limited alternatives for their survival. However, a concern
with respect to the possibility of “fire-sales” has been prominent in the policy
discussions. “Fire-sales” of domestic assets can result in substantial transfer of domestic
wealth to foreigners. Nevertheless whether they do so depends on how “fire-sales” are
defined (Krugman 1998). If pre-crisis asset values had been inflated by implicit
guarantees that ultimately fail, and the crisis returns the values to their appropriate level,
purchases by foreigners may reflect their greater liquidity or their superior management
skills, but properties are sold at equilibrium prices and there is no transfer of wealth.
Alternatively, if an excessive exchange rate depreciation, perhaps the result of contagion
in international markets, forces domestic firms to liquidate to pay off short-term debt,
foreign firms that are not liquidity-constrained can purchase these domestic firms or
projects, which will generate a stream of profit above the liquidation value once the
exchange rate recovers. The domestic economy will lose because of the wealth transfer,
more so if foreigners are less efficient at running domestic investment projects than local
firms (see Krugman 1998). Though the evidence is not clear-cut, we do not find “fire-
sales” to be a significant phenomenon. However, neither do we find obvious evidence for
the positive effects of restructuring.
17
4.1 FDI and Cross-Border M&As
Majority-owned cross-border M&A sales in the crisis countries reached $7.3 billion in
1998, compared with $3.6 billion in 1997, largely due to significant increases in M&A
activity in Korea and Thailand. In 1999, the cross-border M&A value (including both
majority and minority acquisitions) in East Asia’s crisis four countries were $20 billion,
up from $17 billion in 1998, with $12 billion in Korea and $3 billion in Thailand
(compared to $9 billion and $5 billion in 1998 respectively) (figure 7). Malaysia received
a high level of cross-border M&A deals prior to the crisis, but levels did not rise after the
crisis. M&As in Indonesia, traditionally at the miniscule level, doubled in 1999 to $2.7
billion from 1998.
Figure 8 shows the sectoral distribution of cross-border M&As in the crisis
countries during the period of 1997-1999. Indonesia had half the number of transactions
in light manufacturing (mainly food products), and petro-chemicals (mainly oil refining).
In Korea and Malaysia, the wholesale and retail trade sector had the largest number of
transactions, 24 percent and 30 percent of their respective totals. Korea also had a large
share of sales in the petro-chemicals industry. Other sectors that sold a large number of
assets in Malaysia are the finance and real estate and the light manufacturing sectors
(comprising the paper and pulp, textiles, and cement industries). In Thailand, the
transactions have taken place mostly in the finance and real estate and the wholesale and
retail trade sectors, accounting for more than 50 percent of total sales.
4.2 Cross-Border M&As and Financial Distress
18
Though it is early to judge the impact of M&As in East Asia, certain conclusions can be
drawn. The existing literature on U.S. firms, as noted earlier, compares pre-merger cash
flow performance of target firms with post-merger performance of acquirer firms. In
cross-border M&A transactions in East Asian countries, on the other hand, the size of the
acquired firms is not significant relative to foreign firms to affect the performance of
acquirer firms after the mergers, which means that the post-merger performance of
acquired firms will not be measured by the performance of surviving entities, unlike the
studies of the U.S. cases. We focus, therefore, on industry aggregates, recognizing that
this reduces the confidence in the findings since those aggregates may mask individual
firm performance.
Some descriptive pictures are presented in figure 9, comparing the average
recovery rate in production since the crisis with the number of cross-border M&A sales
by sector. Cross-border M&A sales tend to take place in larger numbers in the sectors
showing deeper distress and slow recovery. In Thailand, 30 percent of mergers and
acquisitions occurred in finance and real estate, where GDP has declined most sharply
with the slowest recovery, followed by the wholesale and retail trade sector. The petro-
chemicals industry has also stagnated, as seen in figure 4-c, whereas foreign investors
have shown considerable interest in acquiring assets among the manufacturing sectors.
On the other hand, the transport equipment sector required less asset sell-offs due to its
strong upturn (figure 4-c). In Malaysia, foreign investors have bought majority stakes
largely in the wholesale and retail trade and the finance and real estate sectors, those that
have suffered most from fallen production and sluggish recovery. The average rate of
growth in production in the finance and real estate sector still remains negative. There has
19
been a relatively small number of cross-border M&A sales in the utility (electricity, gas,
and water) sector which has shown the fastest recovery among the non-tradables. The
ratio of the average post-crisis growth rate of production (where there has been a positive
growth) to the pre-crisis rate is 0.09 for the wholesale and retail trade sector, whereas for
the utility, food, and basic metal sectors, the ratios are 1.53, 2.21 and 2.31, respectively.
In comparison, Korea’s picture is somewhat ambiguous partly because production
has not only declined by a smaller magnitude, but also it has recovered more rapidly than
the other crisis economies. Nevertheless, the wholesale and retail trade sector, with the
severest fall in production in the economy, has had by far the largest number of asset
sales. As also observed for Thailand, in the transport equipment sector, which shows
resilience and recovery, there has been a relatively small number of asset sales. In
Korea’s petro-chemicals industry, 10 out of 17 cases have taken place with major
chemical and allied products companies in Europe, which appears to be part of increased
global oligopolistic competition in the industry since 1998. Meanwhile, overall demand
growth prospects for petroleum products in the region augment the high volume of asset
acquisitions by foreign investors.
Inferences on production efficiency can also be tentatively drawn from inventory
trends in Korea, where such data is available (figure 10). The patterns in inventory appear
to be somewhat associated with cross-border M&A activity: The industries with low
inventory level--textile, metal, and transport equipment--show the least M&A activity,
whereas machinery and petro-chemical industries have the largest numbers of M&A
among the tradable sector.
20
Table 6 shows selected companies in the wholesale and retail trade and the finance and
real estate sectors, whose majority stakes were sold to foreign acquirers during 1998-
1999. The last three columns indicate return on equity (a ratio of net income to
shareholder’s equity) of the companies; two years, one year, and at the most recent date
available, prior to the announcement of sales. The return on equity in acquired companies
had sharply deteriorated prior to the transactions in all cases. Among the wholesale and
retail trade sector in Thailand, the hotel industry is considered to have a stronger potential
to recover through the involvement of foreign capital. Investors from Europe, the United
States and Asia’s newly industrialized economies have been attracted by long-term
growth prospects in the industry, as well as to assets made available in the market at
lower prices as the new bankruptcy law forces the highly indebted owners to sell them
off.
Besides the urgent need of distressed firms for liquidity, coupled with overall
policy measures to encourage cross-border M&As, the large number of asset sales in the
finance and real estate sector has been partly driven by the recent efforts of the East
Asian governments to recover assets of the nationalized banking institutions. Since,
through their direct takeovers and recapitalization initiatives, governments of the crisis
countries have become substantial owners of the banking systems, the reprivatization of
these institutions has remained a priority that will influence the long-term structure and
performance of the financial sectors. So far, efforts at privatization have been partially
successful, particularly in Korea and Thailand, albeit with problems partly as a result of
the continued growth of non-performing loans, which new acquirers have difficulty in
valuing.
21
The sale of a 51 percent stake in Korea First Bank, one of the country’s largest
commercial banks, to a US investment fund, Newbridge Capital, was finally settled in
September 1999 after nine months of negotiations. The protracted negotiations centered
around the valuation of non-performing loans that had not been carved out or revealed
and on the extent of continued government obligations to assume non-performing loans
following the privatization. The issues were particularly serious since Korea First Bank
was a principal creditor to the second largest chaebol, Daewoo where a creditor-led
restructuring is ongoing as a result of the continued increase in debt. The final terms of
agreement require the government to be responsible for any loans that are non-
performing over the next two years. There have been a number of smaller-scale
acquisitions of Korean banks by foreign investors, including a 17 percent stake in
Kookmin Bank by a Goldman Sachs-led investment fund, and a 31 percent stake in
Korea Exchange Bank by Commerzbank of Germany (EIU 1999).
In Thailand, continued concerns over the scale of the non-performing loans and of
asset quality, has delayed sales of the nationalized banks to foreign investors, although
the slow but steady progress in the asset resolution process appears to some regaining of
foreign investor confidence. ABN-Amro Bank of the Netherlands acquired a 75 percent
stake in Bank of Asia, while the Development Bank of Singapore bought 51 percent of
Thai Danu Bank in 1998. Nakornthon Bank (NTB) followed when Britain’s Standard
Chartered bought a 75 percent stake for $319 million in September 1999 after two years
of negotiations. The government is expected to reimburse Standard Chartered for any loss
of interest revenue resulting from the bank’s non-performing loans. Numerous minority
22
acquisitions include a 15 percent stake in Thai Farmers Bank to the Government of
Singapore Investment Corporation for $258 million.
As discussed previously, some argue that the post-crisis asset acquisitions in East
Asia by foreign investors are often based on “fire-sale” pricing, although evidence has
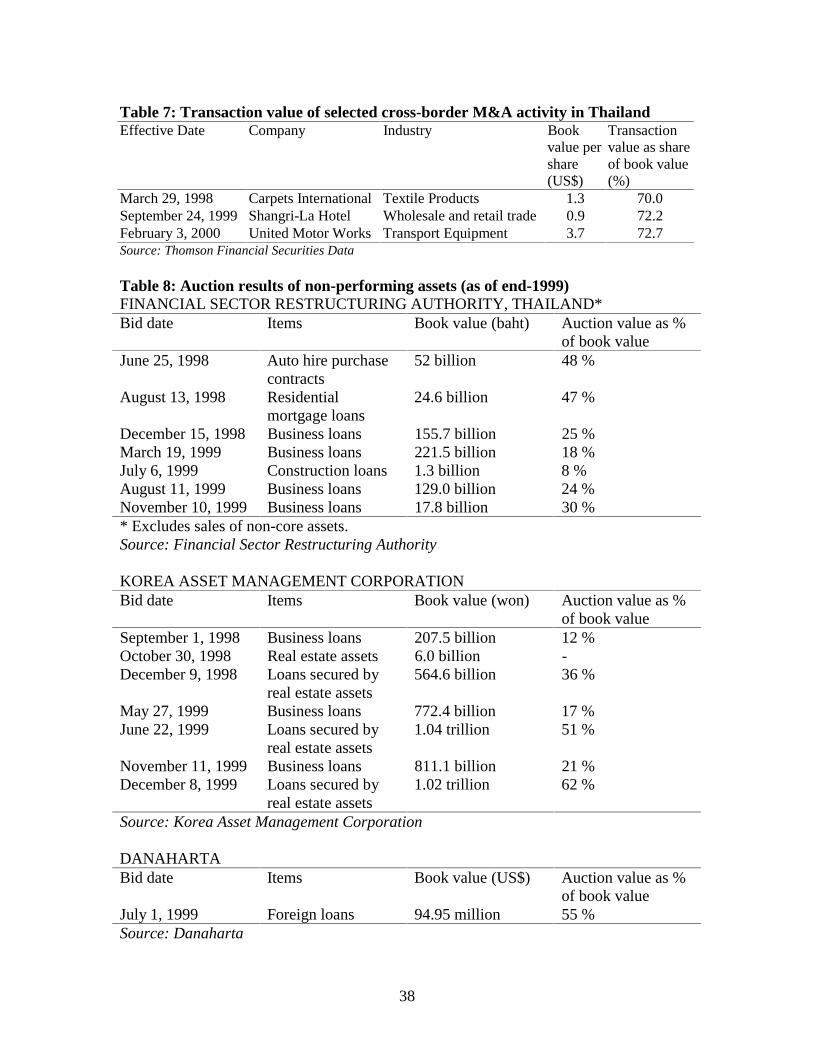
been insufficient to support this argument. Limited information of cross-border M&A
transactions in Thailand suggests that prices paid by acquirers per share have been around
70 percent of book value per share (table 7). In contrast, non-performing assets in
Thailand have been auctioned at values that are considerably lower than the acquisition
values of local firms. The average auction price of non-performing assets in Thailand has
been 25 percent of the book value (table 8). The case of Korea also indicates that foreign
acquisitions of assets have not been “fire-sales”. Korea suffered least from domestic
liquidity constraint among the crisis-hit countries. Nevertheless total cross-border M&A
transactions shot up to $9 billion in 1999, five times higher than the level in 1998. M&A
activity in Korea continued to rise by 32 percent in 1999 despite the considerable
appreciation of the won by 15 percent from 1998. This suggests, therefore, that foreign
acquisitions of assets have been driven by not only their greater liquidity from foreign
exchange depreciation, but also new opportunities as a result of improved policy
environment towards M&As.
In summary, financial and corporate restructuring is not a short process, and clear
outcomes have largely yet to materialize. East Asia’s financially distressed firms have so
far made major progress in the rescheduling of debt as a short-term agenda item of
restructuring. Once the troubled firms stabilize their liquidity position, further steps
23
would be needed towards longer-term restructuring measures—such as re-organization,
changes in management, and reductions in excess capacitywhich often require new
investments.7 Successful firms in market economies restructure continuously in order to
reposition their businesses and thus remain competitive to survive in the long term.
Restructuring occurs when a firm shifts its product mix and cost structure and positions
itself dynamically to remain competitive in response to changes in technology and public
policies. Alongside those measures of so-called operational restructuring, the firms’
assets need also to be rationalized. Reallocation of assets requires effective methods for
asset pricing, which in turn requires credible bankruptcy procedures and a market for
mergers and acquisitions, including liberal foreign investment rules.
5. Policy implications
Cross-border M&A activity can bring most benefit to the host country when facilitated by
certain policy frameworks. After a crisis, once the first step of loss allocation and transfer
is complete, liberalization of foreign investment and ownership as well as tax incentives
can amplify resource mobility. Introduction of institutional bankruptcy laws and
accounting standards, alongside reinforcement of shareholders' rights will improve
corporate governance. Meanwhile, the potential downside of M&A activity, such as
higher market concentration and immediate unemployment effects, can be avoided by
removing bureaucratic barriers to competition and increasing the flexibility of labor
market.
7 Claessens, et. al. (1999b) indicate that concentration of ownership as well as extensive links betweenfinancial institutions and corporations are likely to delay restructuring in East Asian crisis economies.
24
Loss allocation and transfer East Asian governments have taken several steps to
achieve above agenda, as summarized in Table 3. To facilitate debt restructuring,
corporate tax rates have been reduced and tax exempted on interest from non-performing
assets in Indonesia and Malaysia. Korea and Thailand adopted new methods of capital
valuation as well as asset depreciation towards the same goal.
Resource mobilization The second step of resource mobilization includes
measures that are directly related with M&A activity, both international and domestic,
such as liberalization of foreign investment and ownership as well as tax reduction and
exemption on real estate transfer. Success of mergers and acquisitions depends heavily on
procedural simplicity and clarity.
Since their crises in 1997, both Korea and Thailand have introduced various
measures to encourage business consolidation involving mergers and acquisitions, which
have led to the rapid rise in cross-border mergers and acquisitions in these two countries.
Korea has been providing tax exemption and deferral on capital gains from so-called “big
deals,” that is, exchange of businesses through the transfer of shares. The Korean
government also released a new legislative framework in July 1999 to reduce transaction-
related taxes incurred in corporate mergers, acquisitions, and divisions. Thailand
approved a set of new measures in January 1999, including provisions for tax-free
mergers and noncash acquisition of assets in cases of 100 percent mergers, and for the
elimination of all taxes on asset transfers from debtors to creditors. Moreover new
bankruptcy procedures introduced in March 1999 allow creditors to force business
restructuring on insolvent firms. As a result, firms with high liabilities have no other
choice but to sell their assets as banks push them to repay their debts.
25
In addition to these measures, Korea and Thailand have also taken effective steps
to deregulate and liberalize their foreign investment policies since late 1997. Korea has
opened several sectors to foreign investors since April 1998, including various property
businesses, securities dealings, and other financing businesses. The ceiling on foreign
stock investment was abolished as of May 1998, granting foreign investors the right to
purchase all the shares of a domestic firm. Meanwhile, the Foreign Investment Promotion
Act of November 1998 affords protection for foreign direct investment through national
treatment, the reduction and exemption of certain corporate taxes, the provision of
financial support for local governments to attract foreign direct investment, and the
establishment of foreign investment zones. In Thailand, the Board of Investment has
eased its regulations to promote foreign participation in the economy. The twenty-year
old Alien Business Law was replaced in August 1998 (and has since been revised again
in October 1999) to incorporate sectoral liberalization measures. Under the August 1998
provisions, foreign firms are allowed to hold up to 100 percent equity in banks and in
finance companies for up to ten years, and 39 sectors have been opened up to increased
foreign participation, including transportation and pharmaceuticals production. Policy
liberalization includes a temporary measure introduced in November 1998 (expiring in
December 1999) allowing foreign firms to own a majority stake in joint ventures that
received favorable policy treatment, and authorizing them to distribute their products
domestically. In the meantime, the proposed cutback of import tariffs is expected to help
reduce production costs for both domestic and foreign firms dependent on imported raw
materials and intermediate products.
26
Unlike in Korea and Thailand where cross-border mergers have shot up, in
Malaysia, cross-border mergers and acquisitions have been low compared to its own
historical performance. Malaysia has, however, had high levels of domestic mergers and
acquisitions.8 Malaysia’s Promotion of Investment Act 1986 and other measures provide
various tax incentives, including investment tax allowances in the services sector. The
high level of domestic merger and acquisitions activity in Malaysia suggests that the
regime is basically a friendly one. However, cross-border activity could remain low, on
account of restrictions on the repatriation of earnings. More recently, Malaysia has
endorsed an extensive merger program of the banking system, in which all the banking
institutions have submitted their merger proposals by end-January 2000. In contrast, the
Indonesian system appears not to favor mergers and acquisitions. Gains from transfers of
assets in corporate reorganizations are taxable, and companies cannot transfer tax losses
in a liquidation process, merger, or acquisition (Asia Law 1998). Certain exceptions
apply only to banks, financial institutions, and companies going public. The sales of
banking institutions have been deterred, due also to difficulties in valuation of non-
performing loans as in the other crisis countries. Overall merger and acquisition activity
has remained at extremely low levels.
Corporate governance Finally, the third step of enhancing corporate governance
can also be highly effective in encouraging market-driven M&As. Some studies of
ownership structures in East Asian firms suggest large family control disadvantaging
shareholders (Claessens, Djankov, Fan, and Lang 1999 and Claessens, Djankov, and
Lang 1999). Good corporate governance can improve distribution of control.
27
Improvement of enterprise monitoring, disclosure of information, accounting practices,
and equity issuance processes are essential to strengthen corporate governance
frameworks. Korea and Thailand have taken steps to enhance institutional voter rights
and increase the number of shareholders to exercise their rights. The amendment to the
bankruptcy code in Thailand, which came into effect in March 1999, is an example of an
effective measure to encourage mergers and acquisitions through market forces. In
Thailand, as previously discussed, financially distressed sectors such as the hotel industry
have been attracting a high level of foreign interest for its long-term growth prospects
since the bankruptcy laws have been amended. The new codes allow creditors to enforce
resolution of assets on debtors for repayments. Meanwhile, Korea’s movement towards
international accounting standards has been welcomed by foreign investors whose
concerns over the acquisition of Korean assets were centered around the valuation of
non-performing loans. Korea also introduced new requirements for domestic companies
to increase the involvement of non-insiders on their boards On the other hand, efforts to
improve corporate governance in all crisis countries. Those measures have been
important to increase transparency and accountability, though further progress has yet to
be made.
Competition policy and labor mobility Certain policy measures should be taken to avoid
any potential downsides and induce utmost benefit of cross-border M&As. Consolidation
and rationalization through M&As may lead to a higher degree of concentration as well
as employment reduction in the host market, which particularly will apply to sectors with
8 The total number of domestic mergers and acquisitions has been about 50 to 70 per quarter in Malaysia in
28
excess capacity. To maintain the right balance between competition and cooperation has
been an important concern for East Asian policy makers (Stiglitz 1996 and Mody 1999).
In so doing, market-oriented measures need to be taken by reducing bureaucratic
restraints to competition and monitoring market shares. Moreover, domestic firms could
be provided with incentives to invest in research and development and to form strategic
alliances with advanced companies, which will increase competitiveness through
continuous technological renovation. Meanwhile social security systems could be
improved, e.g. by tentatively extending the coverage of unemployment insurance, to
support the laid-off due to M&A activity, whereas vocational training could be provided
to enhance flexibility of the labor market.
Lessons from M&A activity in Japan The Japanese case also gives a good example
where improved regulations governing mergers and acquisitions have contributed to the
restructuring process. According to Alexander (1999) and UNCTAD (1999), mergers and
acquisitions are occurring in numbers unprecedented for Japan, though their importance
to the economy is still a small fraction of that in the United Kingdom or the United
States. The value of foreign takeovers in Japan rose from US$1.1 billion in 1997 to
US$6.9 billion in 1998, and then shot up to US$24.2 billion in 1999, accounting for 32
percent of the country’s total M&A activity. Major transactions include sales of a
majority stake in Yamaichi Securities to Merrill Lynch (the United States) in 1998, and in
Japan Leasing to General Electric for $6.6 billion, as well as a 37 percent stake of Nissan
Motors to Renault (France) for $5.4 billion. Similarly, domestic mergers and acquisitions
1997-99, while it remained low (in the range of 4 to 10) in the other countries (see Securities Data
29
have also risen briskly as M&As are becoming acceptable business transactions among
Japanese firms, a fundamental change from the previously held view that M&As are
predatory actions.
The rise in Japanese M&A is partly explained by the elimination of cross-
shareholdings, as the returns on these equity holdings have been persistently low or
negative. At the same time, many regulatory constraints on business activities are being
removed, and specific measures to facilitate mergers and acquisitions are being instituted.
For instance, a 1997 amendment of the Commercial Code by the Japanese Diet reduces
the number of shareholder meetings required to approve mergers. The Holding Company
Law of 1997 removes constraints on carving out subsidiaries for sale and allows buyers
more freedom in structuring their acquisitions. The securities transaction tax formerly
required when an acquisition involved share purchases was discarded in April 1999. In
addition, the moves to implement international accounting principles and, in particular,
consolidated reporting, are bringing more transparency to the operation of subsidiaries.
6. Conclusion
Foreign investors, who see opportunities in corporate distress, lower asset prices, and
more liberal policies towards M&As and FDI in general, have been attracted to the post-
crisis East Asia. Cross-border M&A activity in the crisis- countries has largely
concentrated in the most troubled sectors of the crisis countries. Some non-tradable
sectors as well as traditional manufacturing sectors suffer from excess capacity as a
consequence of over-investment since the early 1990s, and thereby from lower capacity
Company 1999).
30
utilization and reduced production. Moreover a large number of firms carry large debt
repayments due to rising interest rates, whereas other domestic companies are also
financially constrained. East Asian governments have taken several steps to encourage
mergers and acquisitions, whereas, albeit to varying degrees, foreign investment has been
liberalized.
However, cross-border M&A activity is still in its early phase in East Asia’s
financially distressed economies, and remains small, relative to the stage of development
and the size of their economies.9 The recent upsurge in M&A activity in East Asia,
particularly in Korea, are largely attributed to changes in policy environment that used to
work against foreign acquisitions of local assets. Liberalization of foreign entry and
ownership restrictions alongside introduction of international accounting standards and
shareholding systems has exponentially increased access for foreign investors to the local
market and acquire assets.
The immediate role of cross-border M&As has been to provide sufficient funds
and to preserve the existing assets that would otherwise have been wiped out. In the long-
term, M&As can bring in more FDI by the acquirers and their suppliers and new
resources in management and production to host countries. Eventual integration with the
corporate networks of the acquirers will expand their opportunities for higher industry
diversification. Though M&A has been most prominent in distressed sectors, at this stage
there is little evidence to suggest that cross-border mergers and acquisitions activity have
made immediate contributions to restructuring of the troubled sectors. We should,
however, highlight that the sectoral aggregates may not reflect the full effect of M&As on
31
recovery of the distressed sectors. It will require some firm-level analysis to draw more
robust conclusions.
Given the gravity of problems in some sectors such as the non-tradables, the
restructuring effects of cross-border M&As may not materialize in such a short time span.
The most significant role for cross-border M&As lies in longer-term restructuring
processes such as operational restructuring and reallocation of assets. Foreign
participation through M&As could also be more effective in achieving improved
efficiency and competitiveness as well as better corporate governance. Under the
circumstances, foreign direct investment, in the form of cross-border mergers and
acquisitions, has a significant role to play in restructuring and development of financially
distressed economies.
“Fire-sales” are also not evident. For the few transactions for which we can
compare sale prices to book value, the receipts have been surprisingly high. Moreover,
Korea has had the highest level of M&A despite the least liquidity constraint. Also, the
levels of M&A activity have continued to remain high despite appreciation of exchange
rates from their lower levels, especially but not only in Korea.
9 Cross-border M&As account for 0.6 percent of GDP in East Asia in 1998, significantly lower than 1.5percent of GDP in Latin America.
32
Bibliography
Alexander, Arthur. 1999. “Japan Confronts Corporate Restructuring.” Background paperfor Global Economic Prospects and the Developing Countries 2000, World Bank.Washington D.C.
Asia Law 1998. Cross-border M&A: A guide to global strategic direct investment forAsian companies. Asia Law & Practice, Ltd., Euromoney Publications.
Blumberg, Aryeh and James E. Owers. 1996. “The Convergence of Foreign DirectInvestment and Restructuring: Evidence from Cross-border Divestitures.” GlobalFinance Journal 7(1): 67-87.
Caves, Richard E. 1971. “International Corporations: The Industrial Economics ofForeign Investment.” Economica 38: 1-27.
Claessens, Stijn, Simeon Djankov, and Daniela Klingebiel. 1999a. “Bank and CorporateRestructuring in East Asia: Opportunities for Further Reform.” Financial SectorDiscussion Paper 3, World Bank. Washington D.C.
Claessens, Stijn, Simeon Djankov, and Daniela Klingebiel. 1999b. “How to AccelerateCorporate and Financial Sector Restructuring in East Asia.” Viewpoint 200, World Bank.Washington D.C.
Claessens, Stijn, Simeon Djankov, Joseph P. H. Fan, and Larry H. P. Lang. 1999.“Expropriation of Minority Shareholders: Evidence from East Asia.” Policy ResearchWorking Paper 2088, World Bank. Washington D.C.
Claessens, Stijn, Simeon Djankov, and Larry H. P. Lang. 1999. “Who Controls EastAsian Corporations?” Policy Research Working Paper 2054, World Bank. WashingtonD.C.
Crafts, Nicholas. 1999. “East Asian Growth Before and After the Crisis.” IMF StaffPapers 46(2): 139-66.
Economist. 2000. “Merger Brief: The Digital Dilemma.” July 22.
Economist Intelligence Unit. 1999. Business Asia. September 1999.
Froot, Kenneth R. and Jeremy C. Stein, 1991. “Exchange Rates and Foreign DirectInvestment: An Imperfect Capital Market Approach.” Quarterly Journal of Economics106: 1191-1217.
Ghemawat, Pankaj and Fariborz Ghadar. 2000. “The Dubious Logic of GlobalMegamergers.” Harvard Business Review July/August.
33
Harris, Robert S. and David Ravenscraft. 1991. “The Role of Acquisitions in ForeignDirect Investment: Evidence from the U.S. Stock Market.” Journal of Finance 46(3):825-844.
Hotchkiss, Edith S. and Robert M. Mooradian. 1998. “Acquisitions as a Means ofRestructuring Firms in Chapter 11.” Journal of Financial Intermediation 7: 240-262.
Hunya, Gabor. 1997. Foreign Direct Investment and its Effects in the Czech Republic,Hungary, and Poland. The Vienna Institute for Comparative Economic Studies (WIIW).No. 186.
Hymer, Stephen H. 1976. The International Operations of National Firms: A Study ofDirect Foreign Investment. MIT Press, Cambridge, Massachusetts.
International Monetary Fund. Various issues. International Financial Statistics.Washington D.C.
International Monetary Fund. 1998. World Economic Outlook 1998. Washington D.C.
International Monetary Fund. 1999. Financial Sector Crisis and Restructuring—LessonsFrom Asia. August 12, 1999.
Jensen, Michael C. 1986. “Agency Costs of Free Cash Flows, Corporate Finance, andTakeovers.” American Economic Review 76: 323-329.
Kang, Jun-Koo. 1993. “The International Market for Corporate Control: Mergers andAcquisitions of U.S. Firms by Japanese Firms.” Journal of Financial Economics 34: 345-371.
Kindleberger, Charles P. 1969. American Business Abroad: Six Lectures on DirectInvestment. Yale University Press. New Haven, Connecticut.
Krugman, Paul R. 1998. “Fire-sale FDI.” (http: / / web.mit.edu / krugman / www /FIRESALE.htm)
Mody, Ashoka. 1999. “Industrial Policy after the East Asian Crisis: From “OutwardOrientation” to New Internal Capabilities? ” Policy Research Working Paper 2112,World Bank. Washington D.C.
Scholes, Myron S. and Mark A. Wolfson. 1990. “The Effects of Changes in Tax Laws onCorporate Reorganization Activity.” Journal Business 63: 141-164.
Stiglitz, Joseph. 1996. “Some Lessons from the East Asian Miracle. ” The World BankEconomic Observer 11(2): 151-177.
34
Thomson Financial Securities Data. 1999-2000. SDC Platinum 2.1 - Mergers &acquisitions database.
United Nations Conference on Trade and Development. 1998. World Investment Report1998: Trends and Determinants. Geneva.
United Nations Conference on Trade and Development. 1999. World Investment Report1999: Foreign Direct Investment and the Challenge of Development. Geneva.
World Bank. 1999a. Global Development Finance. World Bank, Washington D.C.
World Bank. 1999b. Global Economic Prospects and the Developing Countries. WorldBank, Washington D.C.
Xie, Andy. 1999. “Korea: Another Financial Crisis?” http://www.msdw.com.
35
Table 1: Cross-border mergers and acquisitions in developing countries(billions of US dollars)
1991 1992 1993 1994 1995 1996 1997 1998East Asia and the Pacific FDI 14.3 22.0 39.1 45.1 52.0 59.9 64.1 64.2
M&A 0.2 0.3 1.2 2.1 1.3 2.0 6.7 10.1Europe and Central Asia FDI 3.4 4.6 6.3 7.0 16.9 15.8 22.8 24.4
M&A 1.1 3.9 2.4 2.4 4.3 2.1 7.8 1.9FDI 12.8 15.0 13.7 28.4 29.8 43.6 64.7 69.3Latin America and the
Caribbean M&A 1.0 6.1 3.8 3.1 6.0 11.2 25.6 31.2FDI 2.8 3.6 3.8 3.4 -0.2 3.3 5.9 5.1Middle East and North
Africa M&A 0.0 0.3 0.2 0.4 0.03 0.2 1.1 1.2South Asia FDI 0.4 0.8 1.1 1.6 3.0 3.5 4.9 3.7
M&A 0.05 0.01 0.1 0.4 0.2 0.2 0.3 0.8Sub-Saharan Africa FDI 1.6 1.6 1.9 3.4 4.2 4.7 7.7 4.4
M&A 0.08 0.07 0.5 0.1 0.3 3.0 1.6 1.5FDI 35.3 47.5 66.0 88.9 105.6 130.8 170.3 170.9Developing Countries
Total M&A 2.4 10.8 8.2 8.5 12.1 18.6 43.2 46.8*Involves acquisitions of a more than 50 percent equity.Source: World Bank GDF 2000 and UNCTAD WIR 2000
Table 2: Why M&A occur?PAST FUTURE
POSITIVE Overcome capitalmarketimperfections
Build value throughstrategic partnering
NEGATIVE Fire-sale/monopoly Monopoly
36
Table 3: Illustrative post-crisis policy reforms in crisis countriesLoss allocation and transfer Resource mobility Corporate governance
Indonesia Tax exemptions for loan-loss reserves heldby banks (March 1998)
Relaxation of foreign ownership restrictions(September 1997)Tax exemptions of up to 8 years for newinvestments in 22 industries (January 1999)
Presence of a corporate secretary to improvedisclosureBankruptcy Law updated (August 1998)Code of best practice for corporategovernance (in progress)
Korea Revaluation and adjustment of capital andforeign exchange losses (August 1999)
Introduction of Foreign InvestmentPromotion Act (November 1998)
Restrictions on cross-debt guarantees (April1998)Enhancing institutional voter rights (June1998)Introduction of international accountingstandards (August 1999)Lowering the minimum equity holdingrequirement to exercise shareholder’s rights(1999)
Malaysia Reduction of corporate tax rate from 30percent to 28 percent (October 1997)Tax exemption on interest from non-performing loans (Effective for 1999 and2000)
Reduction of real property gains tax ratefrom 30 percent to 5 percent fornonresidents on the sale of a property heldfor a minimum of five years (October 1997)Exemption of real property gains tax onmergers of financial institutions (October1998)
Creation of High-Level Finance Committeeon Corporate GovernanceCode on takeovers and mergers with stricterdisclosure standards (January 1999)
Thailand Elimination/deferral of income tax and taxeson asset transfer and unpaid interest(January 1999)Introduction of new asset depreciationmethod (March 1999)
Alien Business Law (August 1998, revisedin October 1999)Tax-free mergers and acquisitions in casesof 100 percent mergers (January 1999)Introduction of Equity Fund, ThailandRecovery Fund for large- and medium-scalecompanies, and Venture Capital Fund forsmall and medium-size enterprises (March1999)Reduction of real estate transfer fee from 2to 0.01 percent of the appraised value(March 1999)
Financial statements of public companiesand financial institutions to be in accordwith international best practices (1999)Requirement of board audit committees(1999)Bankruptcy and foreclosure laws amended(March 1999)
37
Table 4: Financial distress, 1999 2nd Quarter(percentage of firms unable to meet current debt repayments)
Country 1999 (Q2)All Manufacturing Services Real estate
Indonesia 63.8 41.8 66.8 86.9Korea 26.7 19.6 28.1 43.9Malaysia* 26.3 39.3 33.3 52.8Thailand 28.3 21.8 29.4 46.9*For Malaysia, firms in agriculture and utilities bring down the average for all firms in 1999.Source: Claessens, Djankov, and Klingebiel (1999a)
Table 5: Non-performing loans as share of GDP in Malaysia by sector (percent)Mar-98 Dec-98 Sep-99 Change,
3/98-9/99Agriculture, forestry and fishing 6.4 11.7 15.0 58.3Mining 1.9 9.0 6.6 32.5Manufacturing 24.3 59.1 56.8 32.7Utility 7.3 13.1 21.2 63.2Wholesale and retail trade 21.8 46.0 57.2 58.1Construction 131.8 328.1 342.2 47.1Transportation and communications 23.4 63.3 52.5 23.5Financial services 50.5 136.7 210.5 124.2Source: Bank Negara
Table 6: Return on equity of acquired companiesReturn on equity
Company SectorSalevalue($mil)
2 years 1 year Lastavail
Korea First Bank Korea Finance and real estate 415.0 -1.8 -162.0 -1587.6Shangri-La Hotels Malaysia Wholesale and retail trade 94.6 7.1 3.5 -Bank of Asia Thailand Finance and real estate 181.5 15.9 -4.6 -78.8Nakornthon Bank Thailand Finance and real estate 319.3 -4.0 -341.9 -UOB Radanasin Bank Thailand Finance and real estate 382.5 -29.0 -283.0 -Shangri-La Hotel Thailand Wholesale and retail trade 34.7 0.5 -13.9 -Golden Land Ppty Dvlp Thailand Finance and real estate 76.3 -1.6 -62.0 -Source: Thomson Financial Securities Data
38
Table 7: Transaction value of selected cross-border M&A activity in ThailandEffective Date Company Industry Book
value pershare(US$)
Transactionvalue as shareof book value(%)
March 29, 1998 Carpets International Textile Products 1.3 70.0September 24, 1999 Shangri-La Hotel Wholesale and retail trade 0.9 72.2February 3, 2000 United Motor Works Transport Equipment 3.7 72.7Source: Thomson Financial Securities Data
Table 8: Auction results of non-performing assets (as of end-1999)FINANCIAL SECTOR RESTRUCTURING AUTHORITY, THAILAND*Bid date Items Book value (baht) Auction value as %
of book valueJune 25, 1998 Auto hire purchase
contracts52 billion 48 %
August 13, 1998 Residentialmortgage loans
24.6 billion 47 %
December 15, 1998 Business loans 155.7 billion 25 %March 19, 1999 Business loans 221.5 billion 18 %July 6, 1999 Construction loans 1.3 billion 8 %August 11, 1999 Business loans 129.0 billion 24 %November 10, 1999 Business loans 17.8 billion 30 %* Excludes sales of non-core assets.Source: Financial Sector Restructuring Authority
KOREA ASSET MANAGEMENT CORPORATIONBid date Items Book value (won) Auction value as %
of book valueSeptember 1, 1998 Business loans 207.5 billion 12 %October 30, 1998 Real estate assets 6.0 billion -December 9, 1998 Loans secured by
real estate assets564.6 billion 36 %
May 27, 1999 Business loans 772.4 billion 17 %June 22, 1999 Loans secured by
real estate assets1.04 trillion 51 %
November 11, 1999 Business loans 811.1 billion 21 %December 8, 1999 Loans secured by
real estate assets1.02 trillion 62 %
Source: Korea Asset Management Corporation
DANAHARTABid date Items Book value (US$) Auction value as %
of book valueJuly 1, 1999 Foreign loans 94.95 million 55 %Source: Danaharta
39
Figure 1: World cross-border mergers and acquisitions, 1991-1999*
Figure 2: Total investment in East Asia (percent)
Source: IFS, IMF
0
5
10
15
20
25
30
35
40
45
Indonesia Korea Malaysia Thailand
1992-97(average)
1998
1999Q1
1999Q2
(percentage of GDP)
0
100
200
300
400
500
600
700
800
900
1991 1992 1993 1994 1995 1996 1997 1998 1999
World FDI flows
S ource: World Bank GDF2000 and UNCT AD
* Involves acquis itions of a more than 10 percent equity.
Billions of US dollars
40
Figure 3: Industrial production before and after the crisis(index = 100 at the start of the crisis)
Figure 4: Production index before and after the crisis by industry(index = 100 at the start of the crisis)
a. Korea
70
80
90
100
110
120
130
24 24
Malaysia
Indonesia
Korea
Thailand
0 12-12 6-6 18-18
Months
Pre-crises Post-crises
Source: Datastream * 3 month moving averages
50
100
150
200
250
300
Q195
Q295
Q395
Q495
Q196
Q296
Q396
Q496
Q197
Q297
Q397
Q497
Q198
Q298
Q398
Q498
Q199
Q299
Q399
Q499
Basic metals
Petro-chemicalproducts
Machinery
Computer
Transportequipment
Pulp and paper
Communicationequipment
Pre-crisis Post-crisis
Source: Datastream *3 quarter moving averages
41
b. Malaysia
c. Thailand
30
40
50
60
70
80
90
100
110
120
96Q1
96Q2
96Q3
96Q4
97Q1
97Q2
97Q3
97Q4
98Q1
98Q2
98Q3
98Q4
99Q1
99Q2
99Q3
Cement
Basic metal
Machinery
Electricalmachinery
TransportequipmentSemiconductor
Source: Datastream
Pre-crisis Post-crisis
*3 quarter moving averages
40
60
80
100
120
140
160
180
95Q1
95Q3
96Q1
96Q3
97Q1
97Q3
98Q1
98Q3
99Q1
99Q3
Textiles
Cement
Petro-chemicalproductsBasic metals
Transportequipment
Pre-crisis Post-crisis
Source: Bank of Thailand *3 quarter moving averages
42
Figure 5: Non-tradable production before and after the crisis(index = 100 at the start of crisis)
Figure 5: Non-tradable production before and after the crisis by industry(index = 100 at the start of crisis)
a. Korea
75
80
85
90
95
100
105
-7 -6 -5 -4 -3 -2 -1 0 1 2 3 4 5 6 7
Korea
Malaysia
Pre-crises Post-crises
Quarters
Source: Datastream * three -quarter moving averages
Thailand
70
80
90
100
110
95Q1
95Q3
96Q1
96Q3
97Q1
97Q3
98Q1
98Q3
99Q1
99Q3
Transportation andcommunication
Wholesale andretail trade
Finance & realestate
Utility
Source: Bank of Korea
Pre-crisis Post-crisis
*3 quarter moving averages
43
b. Malaysia
c. Thailand
70
80
90
100
110
96Q1
96Q2
96Q3
96Q4
97Q1
97Q2
97Q3
97Q4
98Q1
98Q2
98Q3
98Q4
99Q1
99Q2
99Q3
Transportation andcommunicationWholesale andretail tradeFinance & realestateUtility
Source: Datastream
Pre-crisis Post-crisis
*3 quarter moving averages
50
60
70
80
90
100
110
120
95Q1
95Q3
96Q1
96Q3
97Q1
97Q3
98Q1
98Q3
99Q1
99Q3
Transportation&communicationWholesale &retail trade
Finance & realestate
Utility
Source: Bank of Thailand
Pre-crisis Post-crisis
*3 quarter moving averages
44
Figure 7: Cross-border mergers and acquisitions in crisis countries,1997-1999*
Figure 8: Cross-border mergers and acquisitions in crisis countries by sector1997-1999 (number)
0
5
10
15
20
25
30
Indonesia Korea Malaysia Thailand
Light manufacturing
Petro & chemicals
Metal & machinery
Electronic & electrical equip
Wholesale & retail trade
Finance & real estate
Transportation & communication
Utility
Source: Thomson Financial Securities Data
0
2000
4000
6000
8000
10000
12000
14000
1995 1996 1997 1998 1999
0
5
10
15
20
25
Indonesia
Korea
Malaysia
Thailand
Source: Thomson Financial Securities Data
Millions of US dollars Billions of US dollars
Total transactions
* Includes both majority and minority ownership.
45
Figure 9: Cross-border mergers and acquisitions and recovery in productionby sector, 1997-1999 (number)
a. Korea
b. Malaysia
-2
-1
0
1
2
3
4
0 5 10 15 20 25 30
Wholesale & retail trade
Finance & real estate
Machinery
Petro-chemicalsFood
Utility
Transportation & communication
Metals
Paper
Textiles
Transport equipment
Electronics
Rubber & plastic
Recovery rate (Percent)
Number of M&A sales
Note: Recovery rate is the average quarterly change in production between the crisis period and end-1999. The X axis crosses at the average number of M&A.
Source: Thomson Financial Securities Data
-1.0
-0.5
0.0
0.5
1.0
1.5
0 5 10 15 20 25
Food
Textiles
Paper
Petro-chemicals
Metals
Machinery
Transportation & communication
Wholesale & retail trade
Finance &real estate
Utility
Recovery rate (Percent)
Number of M&A salesSource: Thomson Financial Securities Data
Note: Recovery rate is the average quarterly change in production between the crisis period and end-1999. The X axis crosses at the average number of M&A.
46
c. Thailand
Figure 10: Inventory index by industry in Korea(three-month moving average)
-6
-4
-2
0
2
4
6
0 5 10 15 20
TextilesPetro-chemicals
Metals
Transport equipment
Wholesale & retail trade
Finance &real estate
Utility
Transportation & communication
Number of M&A sales
Recovery rate (Percent)
Source: Thomson Financial Securities Data
Note: Recovery rate is the average quarterly change in production between the crisis period and end-1999. The X axis crosses at the average number of M&A.
0
20
40
60
80
100
120
140
160
Jan-
96
Apr
-96
Jul-9
6
Oct
-96
Jan-
97
Apr
-97
Jul-9
7
Oct
-97
Jan-
98
Apr
-98
Jul-9
8
Oct
-98
Jan-
99
Apr
-99
Jul-9
9
Oct
-99
Jan-
00
FOOD &BEVERAGES
T EXT ILES
PULP & PAPERPRODUCT SRUBBER & PLAS T ICPRODUCT S
CHEMICALPRODUCT S
MET AL PRODUCT S
MACHINERY
T RANS PORTEQUIPMENT
ELECT RICALMACHINERY
Index (1995=100, seasonally adjusted)
Source: Datastream