Embed Size (px)
Citation preview
Determinants of Cross-Border Mergers and Acquisitions
Isil Erel Ohio State University
Rose C. Liao
Rutgers University
Michael S. Weisbach Ohio State University and NBER
March 15, 2011
Abstract
Despite the fact that one-third of worldwide mergers involve firms from different countries, the vast majority of the academic literature on mergers studies domestic mergers. What little has been written about cross-border mergers has focused on public firms, usually from the United States. Yet, the vast majority of cross-border mergers involve private firms that are not from the United States. We provide an analysis of a sample of 56,978 cross-border mergers occurring between 1990 and 2007. In addition to the factors that motivate domestic mergers, national borders are associated with additional factors that also affect the likelihood that two firms choose to merge. Specifically, geography, the quality of accounting disclosure, and bilateral trade increase the likelihood of mergers between two countries. In addition, valuation appears to play a role in motivating mergers; firms in countries whose stock market has increased in value, whose currency has recently appreciated, and who have a relatively high market to book value tend to be purchasers, and firms from weaker-performing economies tend to be targets.
* Contact information: Isil Erel, Department of Finance, Fisher College of Business, Ohio State University, Columbus, OH 43210: email: [email protected]; Rose C. Liao, Department of Finance and Economics, Rutgers Business School at Newark and New Brunswick, Room 1152, 1 Washington Park, Newark, NJ, 07102: email: [email protected]; Michael S. Weisbach, Department of Finance, Fisher College of Business, Ohio State University, Columbus, OH 43210, email: [email protected]. We would like to thank Anup Agrawal, Malcolm Baker, Phil Davies, Mara Faccio, Charlie Hadlock, Campbell Harvey, Jim Hines, Andrew Karolyi, Simi Kedia, Sandy Klasa, Tanakorn Makaew, Pedro Matos, Taylor
Nadauld, John Sedunov, Léa Stern, René Stulz, Jérôme Taillard, two referees, and seminar participants at Chinese University
of Hong Kong, HKUST, IDC, Lingnan University, Michigan State University, Ohio State University, Ohio University, Rutgers University, Seton Hall University, University of Alabama, University of Maryland, and Washington University for very helpful suggestions.
1
1. Introduction.
The volume of cross-border acquisitions has been growing worldwide, from 23 percent of the total merger
volume in 1998 to 45 percent in 2007. Conceptually, cross-border mergers occur for the same reasons as domestic
ones: two firms will merge when combining them increases the value (or utility) from the perception of the
acquiring firm’s managers. However, national borders add an extra element to the calculus of domestic mergers,
because they are associated with an additional set of frictions that can impede or facilitate mergers. For example,
cultural or geographic differences can increase the costs of combining two firms. Governance-related differences
across countries can motivate a merger if the combined firm has better protection for target-firm shareholders
because of higher governance standards in the country of the acquiring one. Finally, and perhaps most
importantly, imperfect integration of capital markets across countries can lead to a merger, in which a higher-
valued acquirer purchases a relatively inexpensive target following changes in exchange rates or stock market
valuations in local currency.
This paper evaluates the extent to which these international factors influence the decision of firms to
merge. Using a sample of 56,978 cross-border mergers occurring between 1990 and 2007, it estimates the factors
that affect the likelihood that firms from any pair of countries merge in a particular year. The analysis focuses on
factors that potentially affect cross-border mergers but are not present to the same extent in domestic mergers,
such as cultural differences, geographic differences, country-level governance differences, and international tax
effects. Of particular interest are differences in valuation, which can vary substantially over time for any pair of
countries through fluctuations in exchange rates, stock market movements and macroeconomic changes.
In contrast to most of the prior literature that focuses on mergers of public firms, usually involving U.S.
acquirers or targets, our sample better reflects the universe of cross-border mergers, the majority of which involve
private firms from outside the U.S. In our sample, 80% of completed cross-border deals between 1990 and 2007
targeted a non-US firm, while 75% of the acquirers are from outside the U.S. Furthermore, the vast majority of
cross-border mergers involve private firms as either bidder or target: 96% of the deals involve a private target,
26% involve a private acquirer, and 97% have either private acquirers or targets. Hence, the inclusion of private
2
firms in our analysis is important, especially since most other studies use samples of publicly-traded firms or
lump private acquisitions in with other investments as foreign direct investment (FDI).
We first document the manner in which international factors affect the cross-sectional pattern of mergers.
Geography clearly matters; holding other things constant, the shorter the distance between two countries, the more
likely there are acquisitions between the two countries. In addition, mergers are likely to occur between firms of
countries that trade more commonly with one another, since they are more likely to have synergies and also a
common cultural background. Purchasers are usually but not always from developed countries and they tend to
purchase firms in countries with lower accounting standards. These findings are consistent with the governance
arguments, because development and accounting standards are likely to be correlated with better corporate
governance. Finally, taxes appear to affect cross-border merger decisions, since acquirers are more likely to be
from countries with higher corporate income tax rates than the countries where targets are located.
Over time, firms’ values change because of both firm-specific and country-specific factors, and these
valuation changes are a potential source of mergers. To evaluate this idea, we first utilize country-level measures
of valuation, since the vast majority of mergers involve at least one private firm for which firm-specific measures
are unavailable. We compare the changes in the exchange rate between acquirer and target country’s currency
prior to the merger, changes in their countries’ stock market valuations, as well as the difference in a measure of
their country’s market-to-book ratio. In univariate comparisons of pre-merger performance between bidders and
targets, acquirers outperform targets by all measures. The exchange rate of the acquirer tends to appreciate
relative to that of the target by, 1.12%, 2.13% and 3.43% in the 12, 24 and 36 months before the deal, respectively.
Similarly, the country-level stock return of the acquirer in local currency is 0.3% higher during the 12 months,
0.92% during the 24 months, and 2.12% during the 36 months before the deal occurs. Given this pattern of stock-
price movements, not surprisingly, the market-to-book ratio of the acquirers’ countries is 9.93% higher at the time
of the deal.
When we restrict the sample to public acquirers and targets to compare firm-level returns, we again find
that acquirers outperform targets prior to the acquisitions. The difference in firm-level stock returns in local
currency is 10.38%, 19.34%, and 23.36% for 12, 24 and 36 months prior to the acquisition, respectively. In
3
addition, the average market-to-book ratio is higher for acquirers than for targets, mirroring prior findings for
domestic mergers (see Rhodes-Kropf, Robinson, and Viswanathan (2005)).
We estimate multivariate models predicting the number of cross-border deals for particular pairs of
countries. Our results suggest that differences in exchange rate returns as well as country-level stock returns in
local currency predict the volume of mergers between particular country pairs. In addition, differences in country-
level market-to-book ratios affect cross-border merger volume as well. We also examine factors that affect the
relation between the intensity of cross-border mergers and valuation differences. One possibility is that these
mergers represent a pure financial arbitrage, in which case the incremental effect of valuation on merger
likelihoods should be approximately the same regardless of countries involved. Alternatively, changes in
valuation could lead to mergers by incrementally changing the calculus of a merger decision for a potential
pairing of firms that makes sense for other reasons.
Our results suggest that there is a strong pattern in the country-pairs that are affected by valuation, and
that in each case changes in valuation has the largest impact on country pairs for which mergers are more likely
for other reasons. Consequently, they are consistent with the view that changes in valuation affect mergers by
making otherwise economically-sensible mergers more attractive, and that cross-border mergers should not be
thought of as a pure financial arbitrage. For example, we find that currency movements are important factors
affecting mergers, especially between firms in countries that are geographically close to each other or when the
acquiring firm’s country is wealthier than the target firm’s country. We also find that the relation between
differences in country-level stock market performance and mergers is strongest when the acquiring country is
wealthier than the target, consistent with the view that firms in wealthier countries purchase foreign firms
following a decline in the poorer country’s stock market.
There are two potential (not mutually exclusive) explanations for the preacquisition stock return
differences between acquirer and targets. First, returns can affect the relative wealth of the two countries, leading
firms in the wealthier countries to purchase firms in the poorer countries. This pattern could occur either because
the increase in wealth lowers the potential acquirer’s cost of capital (Froot and Stein (1991)), or because imperfect
integration of capital markets means that firms in the poorer country are inexpensive relative to other potential
4
investments for the acquiring firm. Alternatively, as suggested by Shleifer and Vishny (2003), either overpricing
of the acquiring firm or underpricing of the target firm could lead to a potentially profitable investment for the
acquiring firm. Baker, Foley, and Wurgler (2009) suggest a test to distinguish between the two explanations
based on the implication that subsequent to acquisitions occurring due to mispricing, valuations will tend to revert
to their true values. We perform a similar test to that in Baker, Foley, and Wurgler (2009), and find that the
wealth explanation better explains the relation between valuation differences and cross-border mergers than the
mispricing explanation.
We then examine at the deal level whether valuation differences affect the likelihood of cross-border
M&As. We find that differences in firm-level stock returns (in a common currency) are associated with higher
likelihood of cross-border deals compared to domestic deals. We further decompose valuation differences
between acquiring and target firms into three components: the difference in returns of the two countries’
currencies, the differences in local stock market or industry indices, and the differences in firm-level excess
returns relative to the market or industry indices. All three of these factors lead to a higher likelihood of a
particular merger being cross-border than domestic, although statistical significance varies depending on the
specification used. These firm-level results confirm the country-level ones, and are consistent with the view that
valuation is an important factor that determines merger likelihoods.
2. Cross-Border Mergers and Acquisitions
Despite the fact that a large proportion of worldwide merger activity involves firms from different
countries, the voluminous literature on mergers has focused primarily on domestic deals between publicly-traded
firms in the United States. While this literature is also relevant to understanding international mergers, it does not
address a number of factors related to country-based differences between firms, such as cultural or geographic
variables, or factors associated with the firm’s home country’s economy. In addition, public U.S. firms are
unrepresentative of mergers more generally, since the majority of worldwide mergers involve non-U.S. firms,
many of which are private.1
1 One recent study using a much more representative sample of mergers than is typical in merger studies is Netter, Stegemoller, and Wintoki (2009), whose primary focus, unlike ours, is on domestic mergers. These authors present evidence
5
2.1. Factors that Potentially Affect Cross-Border Merger Likelihoods
National boundaries are likely to be associated with many frictions that determine firm boundaries. In
general, mergers occur when the managers of the acquiring firms perceive that the value of the combined firms is
greater than the sum of the values of the separate firms.2 This change in value can occur for any of a number of
reasons. Contracting costs can be lower within than across firms, creating production efficiencies to combining
them. Mergers can create market power since it is legal for post-merger combined firms to charge profit-
maximizing prices themselves but not for pre-merger separate firms to collude to do so collectively. Mergers can
lower the combined tax liability of the two firms if they allow one firm to utilize tax shields another firm
possesses but cannot use. Finally, agency considerations can lead managers to make value-decreasing acquisitions
that nonetheless increase managers’ individual utilities. All of these factors are relevant both domestically and
internationally.
National borders are associated with a set of factors that are likely to affect the costs and benefits of a
merger. First of all, countries have their own cultural identities. People in different countries often speak
different languages, have different religions, and sometimes have longstanding feuds, all of which increase the
contracting costs associated with combining two firms across borders (see Ahearn, Daminelli, and Fracassi
(2010)). Second, similar to the “gravity” literature in international trade, physical distance can increase the costs
of combining two firms (see Rose 2000). Both cultural differences and geographic distance should decrease the
likelihood that, holding other factors constant, two firms in different countries choose to merge.
Corporate governance considerations can also affect cross-border mergers. If merging can increase the
legal protection of the minority shareholders in target firms by providing them some of the rights of acquiring
firm’s shareholders, then value can be created through the acquisition. In general, corporate governance
arguments predict that firms in countries that promote governance through better legal or accounting standards
suggesting that filters that researchers commonly use in obtaining M&A data lead to samples containing a small subset of the entire mergers universe, usually oversampling larger transactions by publicly-held companies. 2 See Jensen and Ruback (1983), Jarrell, Brickley, and Netter (1988) and Andrade, Mitchell, and Stafford (2001) for surveys of the enormous literature on mergers.
6
will tend to acquire firms in countries with lower-quality governance.3 The level of development of the markets is
another factor that could affect cross-border mergers. In particular, developed-market acquirers are likely to
benefit more from weaker contracting environments in emerging markets.4
A potentially important factor in international mergers is valuation. Given that markets in different
countries are not perfectly integrated, valuation differences across markets can help to motivate cross-border
mergers. Suppose, for example, that a firm’s currency rises for some exogenous reason unrelated to the firm’s
profitability. This firm would find potential targets in other countries relatively inexpensive, leading some
potential acquisitions to be profitable that would not have been profitable at the old exchange rates. Therefore, we
expect to observe more firms from this country to engage in acquisitions, since they will be paying for these
acquisitions in an inflated currency.5
The logic by which valuation differences can lead to cross-border mergers depends on whether
participants believe these movements are temporary or permanent. If the valuation differences are temporary,
then cross-border mergers effectively arbitrage these differences, leading to expected profits for the acquirers.
Shleifer and Vishny (2003) develop a behavioral model in which firm values deviate from their fundamentals.
Managers of an overvalued acquirer consequently have incentives to issue shares at inflated prices to buy assets of
an undervalued or at least a less overvalued target. This transaction transfers value to the shareholders of the
acquiring firm by arbitraging the price difference between the firms’ stock prices. The key component of this
model is that the source of the valuation difference is private information owned by managers. 6 While it is
implausible that one particular firm’s managers have superior information about the valuation of the overall
market or any particular currency, Baker, Foley, and Wurgler (2009) argue that cross-border mergers could
similarly occur because of mispricing of securities from fluctuations in risk-aversion by local investors or
3 Rossi and Volpin (2004), Bris and Cabolis (2008), and Bris, Brisley, and Cabolis (2008) all provide support for this argument using samples of publicly-traded firms. 4 See Chari, Ouimet, and Tesar (2009) for more discussion and evidence on this point. 5 A recent example of this phenomenon occurred when the Japanese yen appreciated relative to other major currencies in the summer of 2010, leading Japanese firms to increase their number of cross-border acquisitions substantially (see The
Economist, August 5, 2010 or The New York Times, September 15, 2010, p. B1). 6A similar argument in which a firm’s managers have superior information about rational stock movements than other market
participants has been proposed by Rhodes-Kropf and Viswanathan (2004). Using a sample of U.S. domestic mergers, Rhodes-Kropf, Robinson, and Viswanathan (2005) provide empirical support for this argument.
7
irrational expectations about a market’s value (each accompanied by limited arbitrage), implying that managers of
target company would be willing to accept payment in a temporarily depreciated currency or overvalued stock.
If the valuation differences are permanent, the attractiveness of mergers, especially the ones that involve
targets with cash flows in local currency, would be unaffected by the valuation movement. However, there are a
number of channels through which even permanent valuation differences can affect merger propensities. As
Kindleberger (1969) originally observed, cross-border mergers can occur because under foreign control, either
expected earnings are higher or that the cost of capital is lower. For example, if domestic firms produce goods for
sale overseas or compete in their domestic market with overseas competitors, then the profits of domestic firms
potentially increase following permanent currency depreciations, making the firms attractive to potential foreign
acquirers. Alternatively, when a foreign firm’s value increases relative to that of a domestic one, for example
through unhedged exchange rate changes or stock-market fluctuations, its cost of capital declines relative to that
of a domestic firm because of a reduction in the magnitude of the information problems it faces in raising capital
(see Froot and Stein 1991). This argument implies that permanent changes in valuation can lead to cross-border
mergers because the value changes lead to a lower cost of capital under foreign control, allowing potential foreign
acquirer to bid more aggressively for domestic assets than domestic rival bidders. Because this explanation for a
relation between currency movements and cross-border mergers is based on asymmetric information, it is likely to
be particularly relevant in the case of private targets, for which asymmetric information tends to be high relative
to otherwise similar public targets. Overall, we expect to observe cross-border mergers following changes in the
relative valuation in two countries, regardless of whether they occur through either currency or stock-price
movements, or whether they are temporary or permanent.
2.2. FDI
A parallel literature to that on cross-border mergers concerns Foreign Direct Investment (FDI). FDI
includes cross-border mergers plus other investments in a particular country including “green field” investments,
and also retained earnings by foreign subsidiaries and loans from parent companies to their foreign subsidiaries.
An alternative to using merger data would be to utilize data on FDI, which includes mergers. Indeed, in related
8
work, Klein and Rosengren (1994), Dewenter (1995) and Klein, Peek, and Rosengren (2002) use FDI inflows and
outflows from the United States to examine whether FDI increases following exchange rate movements.
The reason why our empirical work focuses solely on M&A rather than all foreign direct investment is
the quality of data. FDI contains components other than investment such as inter-company loans and retained
earnings. In addition, the non-merger component of FDI is measured differently across countries, thus making
cross-country comparisons problematic. To compile data on FDI, a number of countries use “administrative” data
from exchange-control or investment-control authorities’ approvals of investment. However, there are often
substantial time lags between approval and actual investment, and sometimes an approved investment never
actually occurs. In addition, countries differ in their definition of foreign investment capital or income. For
example, some use an all-inclusive concept to measure earnings while others do not include any realized or
unrealized capital gains or losses as well as exchange rate gains or losses. Finally, the geographic breakdowns of
the inward and outward FDI flows are not comprehensive. A number of countries do not report a detailed
breakdown of the FDI flows, limiting the extent to which one can measure bilateral FDI flows.7
Krugman (1998) introduces the notion of “Fire-Sale FDI”, in which during a financial crisis, firms from
crisis countries are sold to firms from more developed economies at prices lower than fundamental values.
Aguiar and Ginopath (2005), Acharya, Shin, and Yorulmazer (2010) and Alquist, Mukherjee, and Tesar (2010) all
consider the issue of FDI in the 1997-1998 East Asian Financial Crisis, and document large foreign purchases of
East Asian firms during this Crisis. Makaew (2010) argues that this type of purchasing relatively cheap assets
from countries not performing well is not typical of most cross-border mergers, and that most cross-border
mergers in fact occur when both the acquirer and target are in booming economies. Our paper considers the issue
more generally, looking to what extent currency and market movements affect the magnitude of cross-border
merger activity.8
7 The discussions on measurement issues of FDI are based on the 2001 International Monetary Fund (IMF) report “Foreign Direct Investment Statistics” and the IMF Balance of Payments Manual, 5th Edition. 8 Other related work on cross-border mergers and acquisitions includes Ferreira, Massa and Matos (2009), who find that foreign institutional ownership is positively associated with the intensity of cross-border M&A activity worldwide. This relation could occur for a number of reasons, including foreign ownership facilitating the transfer, foreign ownership being correlated with more professionally managed companies, or foreign owners being more likely to sell to foreign buyers than
9
3. Data
Our merger sample is taken from Security Data Corporation’s (SDC) Mergers and Corporate Transactions
database announced between 1990 and 2007 and completed by the end of 2007. We exclude LBOs, spin-offs,
recapitalizations, self-tender offers, exchange offers, repurchases, partial equity-stake purchases, acquisitions of
remaining interest, and privatizations, as well as deals in which the target or the acquirer is a government agency,
or in the financial or utilities industry. We then drop deals from countries with incomplete stock market data
between 1990 and 2007.9 After excluding these deals, we end up with a sample of 187,841 mergers covering 48
countries, with the total transaction value of $7.54 trillion, 56,978 of which are cross-border mergers, having a
total transaction value of $2.21 trillion.
We collect a number of data items from SDC, including the announcement date, the completion date, the
target’s name, its public status, its primary industry measured by the four-digit Standard Industrial Classification
code, country of domicile, the name of the acquirer and its ultimate parents, its public status as well as its primary
industry and country of domicile. We collect the deal value in dollar terms when available, the fraction of the
target firms owned by the acquirer after the acquisition, as well as other deal characteristics, such as the method of
payment made by the acquirer.
We acquire monthly firm-level and country-level stock returns both in local currency and in U.S. dollars
from Datastream. We also obtain the national exchange rates from WM/Reuters (WMR) through Datastream,
whose quotes are based on 4:00pm Greenwich Mean Time. We then calculate nominal exchange rate returns by
taking the first difference of the monthly natural logarithm of the national exchange rates. To calculate real stock
market returns and real exchange rate returns, we obtain from Datastream the monthly Consumer Price Index
(CPI) for each country in each month and convert all nominal returns to the 1990 price level.10 When calculating
real exchange rate returns for the Economic and Monetary Union (EMU) countries, we use the Euro and the
local owners. Finally, Coeurdacier, DeSantis and Aviat (2009) use a database on bilateral cross-border M&As at the sector level (in manufacturing and services) over the period 1985-2004, and find that institutional and financial developments, especially the European Integration process, promote cross-border mergers and acquisitions. 9 This filter on dropping deals from countries without stock market returns excluded 4,061 deals worth cumulatively $145 billion, or 2% of the original sample count. 10 For Australia and New Zealand, we only have quarterly prices. When extrapolating to monthly prices, we assume that
prices are as of the end of month/quarter.
10
corresponding CPI for EMU countries after 1999. This approach implies that all EMU countries have the same
exchange rate movements in our database after 1999.
We obtain ratings on the quality of accounting disclosure from the 1990 annual report of the Center for
International Financial Analysis and Research as well as a newly assembled anti-self dealing index from Djankov,
La Porta, Lopez-de-Silanes, and Shleifer (DLLS, 2008). Our culture variables, language (English, Spanish or
Others) and religion (Protestant, Catholic, Muslim, Buddhist or Others), are from Stulz and Williamson (2003).
We obtain the latitude and longitude of capital cities of each country from mapsofworld.com and calculate the
Great Circle Distance between a country pair.11 The data on the average corporate income-tax rates are from
OECD. We obtain annual Gross National Product (in U.S. dollars) normalized by population and annual real
growth rate of the Gross Domestic Product from the World Development Indicator report. To control for the
quantity of business done between a country pair, we include bilateral trade flows, calculated as the maximum of
bilateral imports and exports between the two countries. Bilateral imports (exports) is calculated as the value of
imports (exports) by target country from (to) acquirer country as a percentage of total imports (exports) by target
country, all of which are from the United Nation Commodity Trade Statistics database (see Ferreira, Massa, and
Matos (2009)). Following Bekaert, Harvey and Lundblad (2005) and Bekaert, Harvey, Lundblad and Siegel
(2007), we construct an index of the quality of a country’s institutions based on the sum of the International
Country Risk Guide (ICRG) political risk subcomponents: Corruption, Law and Order, and Bureaucratic Quality.
We also use the investment profile subcategory in the ICRG political risk ratings as a measure of the state of
investment environment in a country.
For the public firms in our M&A sample, we obtain accounting and ownership information from
Worldscope/Datastream. In particular, we use firm size (book value of total assets), book leverage (long-term debt
divided by total assets), cash ratio (cash holdings divided by total assets), the two-year geometric average of sales
growth, and return on equity as well as the market-to-book ratio of equity. To calculate country-level market-to-
11 The standard formula to calculate great circle distance is: 3963.0 * arcos [sin(lat1) * sin(lat2) + cos (lat1) * cos (lat2) *
cos (lon2 - lon1)], where lon and lat are the longitudes and latitudes of the acquirer and the target country locations, respectively.
11
book ratio, we follow Fama and French (1998) and sum the market value of all equity for all public firms in a
country and divide it by the sum of their book values. The details on the definitions of these variables can be
found in Table A1.
4. Results
4.1. Stylized Facts about Cross-Border Mergers
Mergers involving acquirers and targets from different countries are substantial, in terms of both absolute
number, and as a fraction of worldwide M&A activity. Figure 1 plots both the number (Panel A) and dollar value
(Panel B) of cross-border deals over our sample period. Both figures show similar patterns. The volume of cross-
border mergers increases throughout the 1990s peaking in 2000, declines after the stock market crash of 2000, and
increases again from 2002 until 2007. As a fraction of the total value of worldwide mergers, cross-border mergers
typically amount to between 20 and 40 percent. The fraction of cross-border deals follows the overall level of the
stock market; the fraction drops in the early 1990s, increases in the later 1990s to a peak in 2000, and then
increases again with the stock market between 2004 and 2007.
Table 1 characterizes the pattern of cross-country acquisitions during our sample period. The columns
represent the countries of the acquiring companies while the rows represent those of the target companies. The
diagonal entries of the matrix are therefore the number of domestic mergers for a particular country and the off-
diagonal entries are the number of deals involving firms from a particular pair of countries. The totals reported in
the bottom row and the right column exclude domestic mergers. Hence, these totals represent the number of cross-
border mergers to and from a particular country. The country with the largest number of acquisitions is the U.S.;
U.S. firms were acquirers in 15,034 cross-border mergers and were targets in 11,886 cross-border mergers. These
numbers are substantial but do not represent the majority of the 56,978 cross-border mergers.
A casual glance at Table 1 indicates that geography clearly matters. For every country, domestic mergers
outnumber deals with any other country. Of the cross-border mergers, there is a large tendency to purchase
companies in nearby countries. For example, of the 226 cross-border acquisitions by New Zealand companies,
about two-thirds, 145, were of Australian companies. By far the largest target of Hong Kong based companies
12
were Chinese companies (214 of 633 cross-border acquisitions of Hong Kong companies), and aside from the
U.S., the vast majority of German cross-border acquisitions were from other European companies.
4.2. Cross-Sectional Determinants of Cross-Border Mergers
To analyze the cross-sectional patterns among acquirers and targets formally, we use a multivariate
regression framework. Our goal is to measure the factors affecting the propensity of firms of one country to
acquire firms of another country. Our dependent variable measures the typical proportion of cross-border mergers
for a particular country pair over the entire sample period. For each ordered country pair, the fraction is
determined by a numerator equal to the number of cross-border acquisitions of firms in a target country by firms
in an acquirer country, normalized by the sum of the number of domestic acquisitions in the target country and the
numerator, so that the fraction is bounded above by one. Including domestic deals in the denominator allows us to
implicitly control for factors that will influence the volume of both domestic deals and cross-border deals.12
We estimate equations explaining this variable as a function of the characteristics of the countries. Since
each observation is a “country pair” and we have 37 countries, the total number of potential observations is 1332
(37×36).13 In addition, we impose the requirement that a country pair has at least one deal during the sample
period, which reduces the total number of observations to 1036.14 We then break down the full sample into four
subsamples based on whether the target and acquirer are private or publicly-traded. We include the average
twelve-month stock return difference of the country indices measured in local currency over the sample period for
each country pair (Average Market R12), as well as the average real exchange rate return between the two
countries’ currencies over the sample period (Average Currency R12) because, as we have argued above, changes
in relative valuation likely lead to acquisitions. We also include average market-to-book ratio at the country level
over our sample period (Average MTB). Because regulatory and legal differences between countries are factors
that potentially affect cross-border acquisitions (Rossi and Volpin (2004)), we include as independent variables
12 This approach follows Rossi and Volpin (2004) and Ferreira, Massa, and Matos (2009). Note that the pairs are ordered, so that, for example, there would be a U.S.-Canada dummy variable as well as a Canada-U.S. dummy variable in each equation. 13 The number of countries decreases to 37 when we eliminate countries with incomplete data on Gross Domestic Product or bilateral trade. 14 We also estimate our equations without this requirement and also by imposing stricter requirements that each country-pair must have at least 5 or 10 cross-border deals during the sample period. The results from these alternative specifications are qualitatively similar to those presented here.
13
the difference in the index on the quality of their disclosure of accounting information (Disclosure Quality), as
well as the difference in a newly assembled anti-self dealing index (Legal) taken from Djankov et al. (2008). To
capture the regional effect discussed above, the equation also includes Great Circle Distance between the capital
cities of two countries (Geographic Proximity), as defined in Table A.1.
Since a common culture potentially makes mergers more likely, we include a dummy variable set equal to
one if the target and acquirer share a primary religion (Same Religion), and a second dummy variable set equal to
one if they share a primary language (Same Language). Because of the possibility that international tax
differences could motivate cross-border mergers, we include in the specification the average difference in
corporate income tax rates between acquirer and target countries in 1990 (Income Tax)j-i.
To control for the quantity of business done between the two countries, we use a measure of the bilateral
trade flows, the maximum of bilateral imports and exports, between these countries (Max (Import, Export)). The
value of bilateral imports is calculated as the value of imports by the target firm’s country from the acquirer firm’s
country as a fraction of total imports by the target firm’s country, and the value of bilateral exports is defined
similarly. To control for changes in macroeconomic conditions over our sample period, each equation also
contains the difference between the countries’ log of gross national product in 1990 U.S. dollars normalized by
population, as well as the average annual real growth rate of the gross domestic product from 1990 to 2007.
Finally, each regression includes acquirer-country fixed effects.15
Table 2 contains estimates of this equation. Columns 1-6 include all deals, and Columns 7-10 restrict the
sample to four subsamples based on whether the target and the acquirer are private or public firms. These
estimates indicate that there are a number of patterns characterizing the identity of acquirers and targets. First,
there is a currency effect; firms from countries whose currencies appreciated over the sample period are more
likely to be purchasers of firms whose currency depreciated. This effect holds in all subsamples except when a
private firm is acquiring a public firm, where the coefficient is positive but not significant. The coefficient on the
15 To control for the possible effect of country-specific histories and relationships on merger decisions, we also have estimated specifications using a variable constructed by Guiso, Sapienza, and Zingales (2009) that measures the average level of trust that citizens from each country have toward citizens of country pair (see also Ahearn, Daminelli, and Fracassi (2010)). The results including this variable are similar to those reported below and not reported since trust variable is available only for a small subset of our countries.
14
average stock market return difference is negative and significant but this effect seems to be driven only by
private target-private acquirer pairs. However, the average country-level market-to-book ratio has a significantly
positive coefficient. Second, consistent with Rossi and Volpin (2004), having a higher quality of accounting
disclosure system increases the likelihood that firms from a country will be purchasers of firms from another
country. This effect appears to be driven by deals with public acquirers, which are most affected by disclosure
requirements (see Columns 7-10).16 Third, the regional effect discussed above is evident; holding other things
constant, the shorter the distance between two countries, the more likely there are acquisitions between firms in
these countries.17 Finally, larger differences in corporate-income-tax rates attract foreign investment. There is no
evidence that sharing a common language or religion has any impact on merger propensities once other factors are
controlled for. [See Ahearn, Daminelli, and Fracassi (2010) for more analysis of this issue.]
4.3. Differences in Valuation Using Country-Level Panel Data: Univariate Evidence
To understand the role of valuation differences in motivating cross-border mergers, we present data on
measures of valuation of acquirer and target firms. As measures of valuation, we focus on differences in real
exchange rate returns, differences in real stock returns in local currency, and differences in market-to-book ratios
prior to the acquisition. Because only a small minority of the deals in our sample contains both acquirers and
targets that are publicly-traded, we present these measures both at the country and firm levels.
We first calculate these return differences for the entire sample of cross-border mergers.18 For both the
recent change in valuation (local stock market returns and exchange rate appreciation) and the level of valuation
(market-to-book ratio), acquirers are more highly valued than targets. The exchange rate of acquiring companies
appreciates relative to that of the target companies, by 1.12% in the year prior to the acquisition, by 2.13% in the
two-year period and by 3.43% in the three-year period prior to the acquisition. In addition, the average local stock
16 A potential concern with the quality of accounting disclosure effect is that it might be up an “emerging markets” effect in that disclosure quality could proxy for the level of economic development. To address this possibility, we examine whether the accounting disclosure effect exists within subsamples of developed and emerging country targets (see Table A.2). The results suggest that disclosure quality matters in each subsample, though with a larger magnitude when the target is from an emerging market. 17 This result parallels those from a growing literature on the effect of geography in domestic acquisitions. For example, Kedia, Panchapagesan, and Uysal (2009) find that in domestic acquisitions, acquirers experience higher returns when they are geographically closer to targets, potentially due to better information sharing between firms that are closer to one another. 18 We present detailed statistics on the valuation differences between targets and acquirers in Table A.3.
15
market returns are higher for acquiring firm countries than target firm countries, by 0.3% in the year prior to the
merger, by 0.92% in the two-year period prior to the merger and by 2.12% in the three-year period prior to the
merger. Finally, the market-to-book ratio averages almost 10% higher for acquiring countries than for target
countries. All of these results are consistent with the view that firms purchase firms when they are relatively
highly valued.
For the subsample of mergers for which the acquirers and targets are each publicly traded and hence have
firm-level stock returns, acquirers substantially outperform targets prior to the acquisitions. The differences are
much larger than the country-level differences, about 10% in the year prior to the acquisition, 19% in the two-year
period prior to the acquisition and 23% in the three-year period prior to the acquisition. This relation is again
consistent with the valuation arguments and is similar to what others have found for domestic acquisitions (see
Rhodes-Kropf, Robinson, and Viswanathan (2005), Dong, Hirshleifer, Richardson, and Teoh (2006), and Harford
(2005)).
This pattern can be clearly seen in Panel A of Figure 2. Prior to the month of the acquisition, differences
in both the local currency stock returns and exchange rate returns are positive, meaning that the stock market of
the acquirer’s country outperformed that of the target country and that the acquirer’s currency appreciated relative
to the target’s during the three years prior to the acquisition. Subsequent to the acquisition, however, the stock
return difference disappears, implying that the target country’s stock market outperforms the acquirer’s during the
three years subsequent to the acquisition. However, the acquirer’s currency continues to appreciate, leaving the
common-currency returns in the two countries’ stock markets approximately the same following the acquisitions.
The post-acquisition appreciation of the acquirer’s currency relative to the target’s probably reflects the
composition of acquirers and targets; acquirers are more likely than targets to be from developed economies and
over the sample period, developed economies’ currencies tended to appreciate relative to those of developing
countries. This pattern emphasizes the importance of controlling for country-pair effects econometrically when
estimating the determinants of cross-border merger propensities (as we do below).
We also break down the sample by whether the acquirer and target are from developing or developed
countries, using the World Bank definition of “high income” economies. The pre-acquisition local return
16
differences are positive for each category, although they are substantially larger when a developed acquirer buys a
developing target (12.79% difference in pre-acquisition returns) than when a developing acquirer buys a
developed target (9.54% difference). However the currency movements prior to the deal go in opposite directions
for these two categories. When a developing acquirer buys a developed target the acquirer’s currency actually
depreciates prior to the acquisition (-23.32% pre-acquisition exchange rate difference). On the other hand, when a
developed acquirer buys a developing target, it generally follows a period of strong relative appreciation (34.22%
difference). This pattern, which can be seen in Panel B of Figure 2, could reflect a general appreciation of
currencies in developed countries relative to developing ones over our sample period and emphasizes the
importance of controlling for these effects econometrically.
4.4. Differences in Valuation Using Country-Level Panel Data: Multivariate Evidence
To evaluate the hypothesis that relative valuation can affect merger propensities formally, we rely on a
multivariate framework that controls for other potentially relevant factors. It is not obvious, however, what the
most natural approach is to address this question. One possibility is to use deal-level data on the acquirer and
target’s market valuations. This approach has the advantage of utilizing the most accurate measure of firm values
in the comparison. However, it has the disadvantage of only being usable for the subsample of public acquirers
and public targets. As discussed above, the vast majority of cross-border acquisitions have either private acquirers
or targets (or both), so using deal-level data necessitates discarding the vast majority of the sample. An alternative
approach relies on country-level data. This approach has the disadvantage of ignoring firm-level information
(where available) but has the advantage of being able to utilize the entire sample of deals. In addition, a number of
hypotheses of interest, in particular those concerning currency movements and country-level stock market
movements, are testable using country-level data. Since each approach has both advantages and disadvantages, we
use both: We first estimate equations using the entire sample of deals using country-level data on market indices,
valuation levels, and exchange rates. We then estimate equations with deal-level data on the smaller sample of
deals involving public acquirers and targets.
We estimate a specification in which the dependent variable is the number of deals between an ordered
particular country pair, normalized by the sum of the total number of domestic deals in the target country and the
17
number of cross-border deals between these countries in a given year. Our sample consists of country pairs with
one observation per year for each pair, for a total of 14,200 observations. To control for the cross-sectional factors
discussed above as well as long-term trends in currency movements that affect merger propensities (Table 2), we
include country-pair fixed effects. This specification allows us to exploit time-series variation in relative
valuations while controlling for cross-country differences.
We report these estimates in Table 3. The currency and stock return differences are measured over the 12
months prior to the year in question, so that “(Currency R12)j-i” is the difference in the past 12-month real
exchange rate return between the acquirer country (indexed by j) and the target country (indexed by i), “(Market
R12)j-i” is the difference in the past 12-month real stock-market return in the local currency between acquirer and
target countries, and “(Market MTB)j-i” is the difference in the country-level value-weighted market-to-book ratios
between acquirer and target countries.19 All equations also include the quantity of bilateral trade between the two
countries, defined as the maximum of imports and exports, the differences in the ICRG measures of quality of
institutions and investment profiles, the difference in the log of GDP, the difference in GDP growth rates between
the two countries, as well as year and country-pair dummies. In all equations, standard errors are calculated
correcting for clustering of observations at the country-pair level.
Columns 1 and 2 present estimates including all deals while Columns 3-10 report estimates for
subsamples based on whether deals involve a private or public acquirer and target.20 The coefficients on currency
return differences are positive and statistically significantly different from zero in each equation except those
estimated on the public target-private acquirer subsample. Similarly, the stock return differences have a positive
and statistically significant coefficient in all equations except for those estimated on public targets. Finally, the
coefficients on the market to book differences are also positive and statistically significantly different from zero in
all equations except the one estimated on the public target – public acquirer subsample. These positive
19 We have also estimated these equations using 24-month and 36-month stock and currency returns prior to the acquisition with similar results. In addition, we have estimated these equations on U.S. and non-U.S. subsamples, again with results similar to those reported in Table 3. 20 In each equation, we restrict the sample to those country-pairs with at least one merger for the sample used to estimate that equation at some point during the sample period. We have estimated these equations using samples including all country pairs, as well as only those country pairs with at least 10 mergers over the entire sample. In each case the results are similar to those reported in Table 3.
18
coefficients on the valuation differences imply that when valuations are higher in one country than another, the
expected number of acquisitions by the first country’s firms of the second country’s firms increases. The larger
effect for private targets than for public ones is consistent with the Froot and Stein (1991) arguments, since
asymmetric information about the target’s true value is likely to be higher when the target is private.
4.4.1. For Which Country Pairs is the Valuation Effect Larger?
Given the relation between valuation differences and merger likelihoods, an important issue is the extent
to which this pattern varies across country-pairs. If these mergers represent a pure financial arbitrage, the
incremental effect of valuation should be approximately the same regardless of countries involved. Alternatively,
changes in valuation could incrementally change the desirability of a merger for a potential pair of firms that have
other reasons to merge. In this case, we expect changes in valuation to have the largest impact for country pairs in
which we observe substantial numbers of mergers.
To consider these explanations for the relation between valuation and merger activity, we reestimate the
equations from Table 3 for subsamples of country-pairs that are more or less likely to be associated with mergers.
In particular, we consider whether the relation between valuation differences and merger likelihoods is stronger in
country-pairs where acquiring countries are wealthier than the targets and the countries are relatively close to each
other. We also consider whether capital account openness affects the importance of valuation in merger decisions,
since shareholders cannot invest in the target country directly when capital account constraints exist.
We present these estimates in Table 4. The estimates reported in Columns 1-2 indicate that both the stock
and currency return differences have a larger impact on country pairs in which the acquiring country is wealthier
than the target country. In addition, the estimates in Columns 3-4 of Table 4 indicate that the currency effect is
larger for country pairs for which the distance between them is closer than the sample median. Finally, the results
reported in Columns 5-6 of Table 4 imply that the effect of the valuation differences in country-level stock returns
is strongest when the target country’s capital account openness and hence financial liberalization is low. These
results suggest that there is a strong pattern in the country-pairs that are affected by valuation, and that in each
case changes in valuation has the largest impact on country pairs for which mergers are more likely for other
reasons. Consequently, they are consistent with the view that changes in valuation affect mergers by making
19
otherwise economically-sensible mergers more attractive and they should not be thought of as a pure financial
arbitrage.
4.4.2. How Large is the Effect of Valuation on Merger Propensities?
The estimated coefficients reported in Column 1 of Table 3 imply that a one standard-deviation increase
in the real exchange rate change for a given country pair (17%) is associated with an increase of 12% in the
expected number of cross-border acquisitions of firms in countries with relatively depreciated currency. 21
Similarly, a one standard deviation change in the country-level stock return difference for a given country pair
(27%) is expected to lead to an increase of 6.4% in the number of acquisitions by the better-performing country’s
firms of the worse performing country’s firms.22 Finally, the estimates imply that a one standard deviation
increase in the market-to-book difference for a given country pair (0.72) is associated with an increase of 6.4% in
the expected volume of cross-border mergers.
However, the quantitative importance of the impact of valuation on merger propensities implied from the
estimates presented in Table 3 varies substantially depending on the characteristics of the country pair. For a pair
of counties in which the acquiring country is wealthier than the target country and which are located closer to the
median distance to one another, a one standard-deviation movement in the exchange rate (17%) leads to a 36%
increase in the expected ratio of cross-border mergers to domestic mergers between the two countries. In contrast,
for a country pair for which the acquirer country is poorer than the target country and the countries are located
relatively far away, the effect is much smaller. A one standard deviation movement in the exchange rate (17%)
only leads to a 5.9% increase in the expected ratio of cross-border mergers to domestic mergers between the two
countries. These calculations indicate that valuation differences can be important drivers of mergers in situations
where there are other reasons for firms to merge, but are not as important in situations for which the valuation
differences is the only reason for the merger.
21 The average ratio of cross-border merger to domestic mergers for a given country-pair in a given year is 0.0461. Given the coefficient of the country-level 12-month real exchange rate return difference between the target and the acquirer country from Column (1) of Table 3 (0.032), the percentage change in the ratio for an average country pair for a one standard deviation change in exchange rate returns equals (0.032*17%)/0.0461=12%. 22 The average ratio of cross-border merger to domestic mergers for a given country-pair in a given year is 0.0461. Given the coefficient of the country-level 12 month real stock return difference in Column (1) of Table 3 (0.011), the percentage change in the ratio for a one standard deviation change in stock return differences equals (0.011*27%)/0.0461=6.4%.
20
Another way to evaluate the importance of valuation on merger propensities is to reestimate the equations
in Table 3 for the subsample of country pairs for which there are large currency movements in the sample. If
currency movements do indeed drive cross-border mergers, we should observe these types of mergers
predominately for country pairs in which there are substantial currency movements. To examine this idea, we
reestimate Table 3 on subsamples of country pairs based on the average exchange rate movement between these
countries. Table A.4 presents these results, first using the subsample for which the exchange rate return
differential is in the top three quartiles of the sample, followed by the top two quartiles, the top quartile, the top 90
percentile, and finally top 95 percentile. The coefficient on exchange rate returns in this table increases
substantially from 0.03 for those country pairs whose exchange rate differential is in the top three quartiles to
0.593 for those country pairs in the top 95 percentile. For the country-pairs whose exchange rate differential is in
the top 90 percentile, the estimates imply that a one standard-deviation movement in the exchange rate (16%)
leads to a 64% increase in the expected ratio of cross-border mergers to domestic mergers between the two
countries. These results strongly suggest that the magnitude of the currency effect varies substantially across
country pairs and is economically important for country pairs for which mergers tend to occur even in the absence
of currency motives, and also in those pairs of countries that tend to experience the largest currency movements.
4.5. Differences in Valuation Using Country-Level Panel Data: Alternative Specifications
To perform the analyses presented above, we had to make a number of choices about the sample and
specification. Table 5 contains estimates of equations similar to those reported in Tables 3 and 4 to examine the
robustness of the results to alternative specifications.
The sample used to estimate the equations in Tables 3 includes only the deals that lead to majority (larger
than 50%) ownership by the acquiring firm. An important issue is the extent to which they hold in cases where an
acquirer purchases a large minority stake (5-49%), and whether they are different for majority but incomplete (50-
99%) acquisitions from 100% acquisitions. In Columns 1, 2 and 3 of Table 5, we provide estimates of the
equation reported in Table 3 for deals that lead to minority-block ownership (5-49%), for majority but not
complete acquisitions (50-99%) and for 100% acquisitions. The coefficient on the currency return difference
between the acquirer and the target countries is positive in all three columns and is statistically significant at the
21
1% level while the coefficient on country-level stock return difference is statistically significant in Columns 2 and
3. These results suggest that the valuation effect appears to be robust regardless of the fraction of stock purchased
by the acquirer.
If valuation is a motive for cross-border mergers, then one might expect those mergers that are motivated
by valuation to be more commonly financed with stock rather than cash. In Columns 4 and 5, we evaluate this
argument by reestimating the equation separately for cash-financed and stock-financed deals. In these equations
the difference in currency return between the target and the acquiring countries is positive and statistically
significant both for cash-only and stock-only deals. The coefficients on the stock return are positive but not
statistically significantly different from zero. However, information on the method of payment is missing for more
than half the observations in the SDC sample. Therefore, we also perform our tests for the subsample where the
method of payment is missing or is a mix of cash and stock (82% of all deals in our sample). As shown in Column
6, our main results hold for this subsample, suggesting that missing data on the method of payment prevents one
from making sharp inferences about the way the valuation effect depends on the method of payment.
In Column 7 of Table 5, we reestimate our equation using the value instead of the number of mergers in a
particular country-pair to construct our dependent variable. Using this specification, both the coefficient on
currency returns as well as on stock market returns are small and insignificantly different from zero. This finding
suggests that the valuation effects are more important for smaller firms that do not have a large impact on value-
weighted dependent variables. In addition, there are a substantial number of observations for which the value of
the deal is missing (59% of the entire sample, 70% of private targets have missing deal values on SDC). These
missing values are more likely to be associated with smaller, private firms. To explore the reasons why the value-
weighted results are different from the equally-weighted results, we reestimate our tests on the subsample of
mergers without deal value information (Column 8) and for the subsample with deal value information (Column
9). The coefficient on the country-level stock return difference is highly significant for the mergers with missing
deal values in SDC but it loses significance when we focus on the mergers with information on deal values. The
coefficient on the currency return difference is statistically significant in both subsamples but larger in magnitude
for the mergers with missing deal values. These results suggest that the valuation effect is most important among
22
smaller private firms, which are more likely to be missing in the value-weighted specification and are
deemphasized by value-weighting, even when their deal values are available.
The remaining columns of Table 5 document the extent to which our currency and stock market valuation
effects hold under a number of alternative specifications. Column 10 includes deals that were proposed but were
ultimately not completed in the calculation of the dependent variable. Column 11 excludes country-pairs for
which the currencies of the target and acquirer are pegged, so that, for example, mergers between EU countries
after the adoption of the Euro in January 1999 are excluded. Column 12 estimates a “gravity” model similar to
Rose (2000). In this specification the distance between countries is entered as an independent variable, which
prevents this specification from including country-pair fixed effects. Finally, the final two columns of Table 6
include exchange rate volatility (Column 13) and the difference in deposit rates between the acquirer and the
target countries (Column 14). In each of these specifications, the coefficients on currency movements and stock
market movements are positive and are statistically significantly different from zero, suggesting that the relation
between valuation and merger propensities is robust to alternative specifications.
4.6. Interpreting the Relation between Valuation and Merger Propensities
In Section 2, we discussed some possible explanations for the relation between valuation and merger
propensities. Increases in relative valuation, either through stock price increases or currency appreciation, could
reflect real increases in wealth, enhancing firms’ abilities to finance acquisitions (e.g., Froot and Stein (1991)).
Alternatively, the changes in relative valuation could reflect errors in valuation, in which case firms should
rationally take advantage of this misvaluation to purchase relatively cheap assets, i.e., firms in another country
that are not as overvalued (Shleifer and Vishny (2003)). The overvaluation argument applies mainly to public
acquirers who can either issue equity or make stock acquisitions to take advantage of the high valuation, but as
Baker, Foley, and Wurgler (2009) argue, it would potentially apply to private acquirers as well if the overvalued
equity market lowers the cost of capital in a country for private firms.
A prediction of the incorrect relative valuation argument is that subsequent to acquisitions by relatively
overvalued firms, there should be a price reversal and acquirers should underperform relative to targets. In
particular, the overvaluation argument implies that if an acquirer purchases a target to arbitrage differences in the
23
price levels across countries, these differences should narrow subsequent to the acquisition. To evaluate this
possibility, we reestimate our equation from Table 3, including future return differences. The results are presented
in Column 1 of Table 6 for all mergers and in Columns 3, 5, 7, and 9 for the subsamples based on whether the
acquirer and the target are public or private firms. The results are somewhat ambiguous, but indicate that, the
difference in currency returns tends to persist following the acquisition. This pattern is inconsistent with the
notion that overvaluation explains the impact of valuation on merger decisions, although it is possible that the
future returns tests are not particularly powerful, since they only make use of the component of overvaluation that
can be explained by future returns over a pre-specified interval.
To test this hypothesis formally, we follow an approach introduced by Baker, Foley, and Wurgler (2009).
These authors argue that the market-to-book ratio can be broken into two components: the component due to real
expected wealth and the component due to over or under reaction by the market to news. To estimate the
magnitude of each component, Baker, Foley, and Wurgler (2009) estimate equations where the market-to-book
ratio is a function of future stock returns. To the extent that the market-to-book ratio reflects overvaluation at the
time of acquisitions, periods of high acquisitions should be followed by periods of poor returns. The “fitted”
component of market-to-book should represent that component arising from overvaluation while the “residual”
component comes from real wealth effects.
In the first-stage equation, in which country-level market-to-book ratios are regressed on future returns,
the coefficients on future returns are negative. This finding is consistent with the literature that there is a negative
relation between country-level market-to-book ratios and future stock returns in that country. However, when we
break down the market-to-book differences between countries into “fitted” and “residual” components (see
Columns 2, 4, 6, 8, and 10 of Table 6), for most specifications, only the residual is positively related to the ratio of
cross-border mergers, as predicted by the wealth-effect hypothesis. Only in the sample of acquisitions of private
firms by private acquirers, for which stock market misvaluation is least likely to affect acquisitions, is the
difference of the fitted values statistically significant. This finding suggests that the valuation effect occurs
because of the wealth effect described by Froot and Stein (1991) rather than the mispricing effect discussed by
Shleifer and Vishny (2003).
24
4.7. Differences in Valuation Using Deal-Level Panel Data
We have documented that valuation appears to play an important role in determining which firms are
likely to merge. Acquirers tend to be valued relatively highly compared to targets, using prior returns or market-
to-book ratios as measures of valuation. The difference in valuation between acquirers and targets appears to
occur due to both stock market and currency effects. Yet, the results presented so far utilize country-level data.
Consequently, they do not control for firm-level factors that potentially affect the decision to merge, including the
firm’s own valuation.
To control for firm-level factors, we consider the subsample of firms for which we have public data on
both acquirers and targets. Unfortunately, this subsample is both relatively small and unrepresentative of the
overall sample of mergers, because firms in this subsample are much more likely to be from developed rather than
developing countries. Of the 56,978 cross-border mergers in our sample, only 1,178 have both public acquirers
and targets, and also have data available on firm-level variables that we use to control for other factors that
potentially affect mergers. Of these 1,178 mergers, 877 have acquirers from developed countries and 780 have
targets from developed countries. While these mergers are interesting in their own right, they are nonetheless not
representative of cross-border mergers in general.
To estimate the factors that affect the likelihood of a merger, one would ideally like to consider every
possible pair of firms that could conceivably merge and estimate the likelihood that any two of them actually do
merge. Unfortunately, this approach would be infeasible as the number of possible combinations would be
extremely large relative to the number of actual mergers. Instead, we adopt two alternative approaches, each of
which allows us to draw inferences about the factors leading one firm to buy another.
4.7.1. Cross-Border vs. Domestic Mergers
We first consider the sample of all mergers of publicly traded firms (including domestic ones), and
estimate the characteristics of the firms involved with the merger that lead a particular merger to be either cross-
border or domestic. We estimate logit models that predict whether an observed merger is domestic or cross-border
as a function of deal characteristics. Intuitively, this approach presumes that domestic mergers can provide a
benchmark for understanding the nature of cross-border mergers.
25
We present marginal effects of these logit models in Table 7. The first two columns include the difference
in the acquirer and target firm-level returns, converted to U.S. dollars, ((Firm USR12)j-i) as an explanatory
variable. Both coefficients are positive and in the second column, which controls for whether the two firms are in
a related industry and the sizes of the targets and acquirers, the coefficient is statistically significantly different
from zero. The positive coefficient indicates that cross-border acquisitions tend to have larger return differences
between acquirers and targets. All regressions include country-specific dummy variables and standard errors are
corrected for clustering of observations at the country level.
In Columns 3 and 4 we break up the return differences into three components, the difference in returns of
the two countries’ currencies ((Currency R12)j-i), the differences in local stock market indices ((Market R12)j-i),
and the differences in firm-level excess returns relative to the market ((Firm USR12 - Currency R12 – Market
R12)j-i).23 The coefficients on all three variables are positive, but often statistically insignificantly different from
zero. We then use a finer measure of local stock market index: industry index in local currency, which will not
suffer from composition bias, where industry representation varies in different stock market indices. In Columns
5 and 6, we include difference in industry returns ((Industry R12)j-i), as well as differences in returns of the two
countries’ currencies ((Currency R12)j-i) and the differences in firm-level excess returns relative to the industry
((Firm USR12 - Currency R12 – Industry R12)j-i). We find that the coefficient on the industry return is positive
and statistically significant, suggesting that, in cross-border acquisitions, acquirers are from industries that
outperform those of targets.
4.7.2. Identity of the Target and the Acquirer
Another approach to evaluating the reasons for cross-border mergers is to consider the differences in the
characteristics of targets and acquirers. If the underlying reason for the merger is to take advantage of valuation
differences, then one ought to be able to predict which firms will be acquirers or targets using measures of
valuation. Consequently, we consider the sample consisting of all firms involved in a public-to-public cross-
border merger and estimate equations predicting whether a particular firm is a target or acquirer. Because the
dependent variable is dichotomous, we estimate the equations by a logit model and present the marginal effects in
23 For the domestic deals, the differences in the local market returns and the currency returns equal zero by construction.
26
Table A.5. We estimate these equations for both domestic and cross-border mergers; the domestic mergers are in
Columns 1-4 while the cross-border ones are in Columns 5-10. As in Table 7, we first break up the firm return
differences into three components, the difference in returns of the two countries’ currencies, the differences in
local stock market indices, and the differences in firm-level excess returns relative to the market (Columns 7 and
8). We then use a finer measure of stock market index to decompose firm-level stock returns into the difference in
industry-level index return in local currency, the difference in currency returns, and the residual (Columns 3, 4, 9
and 10). All regressions include country dummies and standard errors are corrected for clustering of observations
at the country level.
The results in Table A.5 indicate that for both domestic and cross-border mergers, acquirers outperform
targets prior to the acquisition. This finding is consistent with prior literature on domestic mergers suggesting that
acquirers typically have higher valuations than targets. In Columns 7 and 8, we break down each return for the
cross-border sample into three components, reflecting the local stock market index (in local currency), the
currency return (relative to U.S. dollars), and the firm-specific residual in local currency. The results indicate that
only the firm-specific component of returns is related to whether a firm is an acquirer or a target, not the local
stock-market return or the currency return. When we use industry index in local currency to decompose firm-level
returns, we find that in cross-border sample, acquirers are more likely from industries that outperform those of
targets (Columns 9 and 10). We also find that there is no significant difference in currency returns between the
target’s countries and the acquirer’s countries.
These results are consistent with what we found at the country level using only public firms sample and
similar to the deal-level regressions in Table 7 using the domestic/cross-border specification. The difference
between the public firm subsample and the overall sample consisting mostly of private firms is consistent with the
relative wealth story suggested by Froot and Stein (1991). The underlying cause of frictions in the Froot and Stein
model is asymmentric information, which is likely to be higher in private firms than in public ones. Consequently,
if this channel leads to wealth effects in mergers, then it should be stronger in mergers involving private firms
than in mergers of public firms, consistent with the findings reported in Table A.5.
27
5. Conclusion
About one-third of worldwide mergers combine firms from two different countries. As the world’s
economy becomes increasingly integrated, cross-border mergers are likely to become even more important in the
future. Yet, in the voluminous academic literature on mergers, the vast majority of research has studied domestic
deals. Moreover, what little work that has been done on cross-border mergers has focused on public and/or U.S.
based firms. Understanding the patterns and motivations for cross-border mergers is consequently an important
and understudied research topic.
In contrast to the presumptions of the academic literature, most cross-border mergers do not involve U.S.
firms and do involve privately-held firms. In our sample of 56,978 cross-border mergers that occurred between
1990 and 2007, 97% involved a private firm as either acquirer or target, while 53% did not involve a U.S. firm.
Geography matters; the odds of acquiring a firm in a nearby country are substantially higher than the odds of
acquiring a firm in a country far away. In addition, higher economic development, and better accounting quality
are all associated with the likelihood of being an acquirer rather than a target.
A major factor determining the pattern of cross-border mergers is currency movements. Over the entire
sample period, countries whose currencies have appreciated are more likely to have acquiring firms while
countries whose currencies have depreciated are more likely to have targeted firms. Controlling for these overall
time trends econometrically, short-term movements between two countries’ currencies increase the likelihood that
firms in the country with the appreciating currency purchase firms in the country with the depreciating currency.
In addition, the relative stock market performance between two countries affects the propensity of firms
in these countries to merge. Our estimates indicate that the greater the difference in stock market performance
between the countries, the more likely that firms in the superior-performing country purchase firms in the worse-
performing country.
The impacts of currency movements and of stock market performance on merger propensities are likely to
be symptomatic of a more general valuation effect, in which more highly valued firms tend to purchase lower-
valued firms. This effect has been documented for domestic acquisitions of U.S. firms in a number of studies, and
has been generally attributed to misvaluation arguments (Shleifer and Vishny (2003), Rhodes-Kropf and
28
Viswanathan (2004)). Yet in an international context, there is an additional reason why higher-valued firms would
purchase lower-valued firms; firms from wealthier countries will have a tendency to purchase firms from poorer
countries because of a wealth effect due to a lower cost of capital (Froot and Stein (1991)). We evaluate both the
mispricing and wealth explanations econometrically and find support for the wealth explanation rather than the
mispricing explanation.
With the increasing integration of the world economy, it is likely that more mergers will involve firms
from different countries. We have provided a preliminary analysis of the patterns and reasons for cross-border
mergers. These mergers undoubtedly occur for the same synergistic reasons as domestic mergers. However
country-level factors, such as currency appreciation and macroeconomic performance, appear to be making these
mergers significantly more attractive for the acquiring firms. The extent to which each type of factor affects the
likelihood of firms to purchase one another is an important topic for future research.
29
References
Acharya, Viral, Hyun Song Shin, and Tanju Yorulmazer, 2010, Fire-sale FDI, NYU Working Paper. Aguiar, Mark and Gita Gopinath (2005), Fire-sale FDI and liquidity crises, The Review of Economics and
Statistics, 87(3): 439-542. Ahern, Kenneth, Daniele Daminelli, and Cesare Fracassi, 2010, Lost in translation? The effect of cultural values
on mergers around the world, University of Michigan Working Paper.
Alquist, Ron, Rahul Mukherjee, and Linda Tesar (2010) “Fire sale FDI or business-as-usual,” University of
Michigan Working Paper.
Andrade, Gregor, Mark Mitchell, and Erik Stafford, 2001, New evidence and perspectives on mergers, The
Journal of Economic Perspectives 15, 103-120.
Baker, Malcolm, C. F. Foley, and Jeffrey Wurgler, 2009, Multinationals as abitrageurs: The effect of stock market valuations on foreign direct investment, Review of Financial Studies 22, 337-369.
Bekaert, Geert, Campbell Harvey, and Christian Lundblad, 2005, Does Financial Liberalization Spur Economic Growth, Journal of Financial Economics 77, 3-55.
Bekaert, Geert, Campbell Harvey, Christian Lundblad and Stephan Siegel, 2007, Growth Opportunities and Market Integration, Journal of Finance, 62, 1081-1138.
Bris, Arturo, Neil Brisley, and Christos Cabolis, 2008, Adopting better corporate governance: Evidence from cross-border mergers, Journal of Corporate Finance 14, 224-240.
Bris, Arturo, and Christos Cabolis, 2008, The value of investor protection: Evidence from cross-border mergers, Review of Financial Studies 21, 605-648.
Chari, Anusha , Paige Ouimet, and Linda Tesar, 2009, The value of control in emerging markets, Review of
Financial Studies23, 1741-1770 .
Coeurdacier, Nicolas , Roberto A. DeSantis, and Antonin Aviat, 2009, Cross-border mergers and acquisitions and european integration, Economic Policy January, 55-106.
Cushman, David O., 1987, The effect of real wages and labor productivity on foreign direct investment, Southern
Economic Journal July, 174-185.
Demirgüç-Kunt, A., and R. Levine, 2001. Financial structure and economic growth (MIT press).
Desai, Mihir, C. Fritz Foley and James R. Hines Jr., 2001, Repatriation Taxes and Dividend Distortions, National
Tax Journal 54, 829-851.
Dewenter, Kathryn L., 1995, Do exchange rate changes drive foreign direct investment?, The Journal of Business 68, 405-433.
Djankov, S., R. La Porta, F. Lopez-de-Silanes, and A. Shleifer (DLLS), 2008. The Law and Economics of Self-Dealing. Journal of Financial Economics 88, 430-465.
30
Dong, Ming, David Hirshleifer, Scott Richardson, and Siew Hong Teoh, 2006, Does investor misvaluation drive the takeover market?, The Journal of Finance 61, 725-762.
Fama, E. , and K. French, 1998, Value versus growth: The international evidence, Journal of Finance 53, 1975-99.
Fan, Joseph P.H., Randall Morck, Lixin Colin Xu, and Bernard Yeung, 2009, Does ‘good government’ draw foreign capital? Explaining china’s exceptional fdi inflow., World Development (Special Issue on Law,
Finance and Economic Growth in China) forthcoming.
Ferreira, Miguel A., Massimo Massa, and Pedro Matos, 2009, Shareholders at the gate? Institutional investors and cross-border mergers and acquisitions, Review of Financial Studies 23, 601-644.
Froot, K. A., and J. C. Stein, 1991, Exchange rates and foreign direct-investment - an imperfect capital-markets approach, Quarterly Journal of Economics 106, 1191-1217.
Graham, Edward M., and Paul R. Krugman, 1995. Foreign direct investment in the united states (Institute for International Economics, Washington, D.C.).
Guiso, L., P. Sapienza, and L. Zingales, 2009. Cultural Biases in Economic Exchange. Quarterly Journal of
Economics. 124, 1095-1131.
Harford, Jarrad, 2005, What drives merger waves?, Journal of Financial Economics 77, 529-560.
Jarrell, Gregg A., James A. Brickley, and Jeffry M. Netter, 1988, The market for corporate control: The empirical evidence since 1980, Journal of Economic Perspectives 2, 49-68.
Jensen, Michael, and Richard S. Ruback, 1983, The market for corporate control: The scientific evidence Journal
of Financial Economics 11, 5-50.
Kaufmann, Daniel, Aart Kraay, and Massimo Mastruzzi, 2009, Governance matters viii: Governance indicators for 1996-2008, World Bank Policy Research June.
Kedia, Simi, Venkatesh Panchapagesan, and Vahap Uysal, 2009, Geography and acquirer returns, Journal of
Financial Intermediation, forthcoming.
Kindleberger, C.P., 1969, American Business Abroad, (Yale University Press, New Haven).
Klein, Michael W., and Eric S. Rosengren, 1994, The real exchange rate and foreign direct investment in the united states: Relative wealth vs. Relative wage effects, Journal of International Economics 36, 373-90.
Klein, Michael W., Joe Peek, and Eric S. Rosengren, 2002, Troubled banks, impaired foreign direct investment: The role of relative access to credit, The American Economic Review 92, 664-682.
Krugman, Paul, 1998, Fire sale FDI, available at http://web.mit.edu/krugman/www/FIRESALE.htm .
Kumar, Praveen, and Latha Ramchand, 2008, Takeovers, market monitoring, and international corporate governance, The RAND Journal of Economics 39, 850-874.
Makaew, Tanakorn (2010) “The dynamics of international mergers and acquisitions,” University of Maryland
Working Paper.
31
Neary, J. Peter, 2009, Trade costs and foreign direct investment, International Review of Economics & Finance 18, 207-218.
Netter, Jeffry M., Mike Stegemoller, and Babajide M. Wintoki, 2009, Are Small Mergers Important?: A study of
over 250,000 (or less) mergers and acquisitions from 1992-2009, University of Georgia Working Paper
Rose, Andrew K., 2000, One money, one market: estimating the effect of common currencies on trade, Economic
Policy 30, 7–45 Rhodes-Kropf, Matthew, David T. Robinson, and S. Viswanathan, 2005, Valuation waves and merger activity:
The empirical evidence, Journal of Financial Economics 77, 561-603.
Rhodes-Kropf, Matthew, and S. Viswanathan, 2004, Market valuation and merger waves, Journal of Finance 59, 2685-2718.
Rossi, Stefano, and Paolo F. Volpin, 2004, Cross-country determinants of mergers and acquisitions, Journal of
Financial Economics 74, 277-304.
Sarno, Lucio, Taylor, Mark P., and Jeffrey A. Frankel, 2003, The economics of Exchange Rates, (Cambridge University Press).
Shleifer, A., and R. W. Vishny, 2003, Stock market driven acquisitions, Journal of Financial Economics 70, 295-311.
Stulz, René M., and Rohan Williamson, 2003, Culture, openness, and finance, Journal of Financial Economics 70, 313-349.
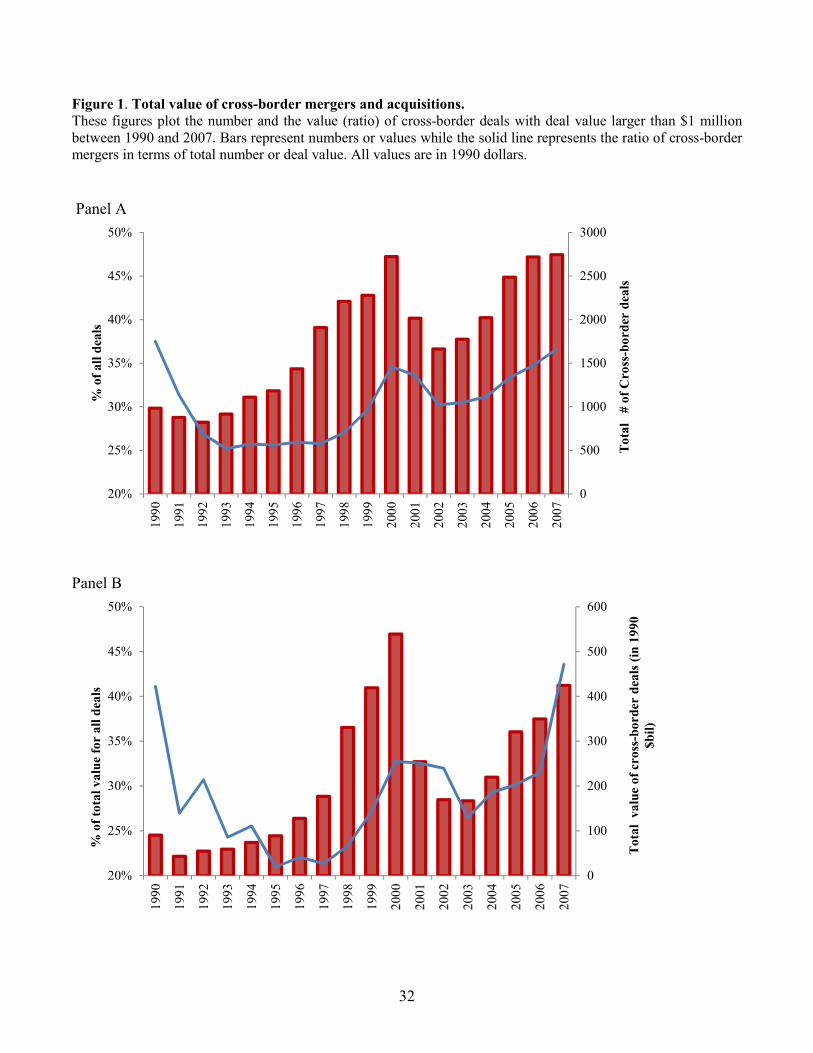
32
Figure 1. Total value of cross-border mergers and acquisitions. These figures plot the number and the value (ratio) of cross-border deals with deal value larger than $1 million between 1990 and 2007. Bars represent numbers or values while the solid line represents the ratio of cross-border mergers in terms of total number or deal value. All values are in 1990 dollars.
Panel A
Panel B
0
500
1000
1500
2000
2500
3000
20%
25%
30%
35%
40%
45%
50%
199
0
199
1
199
2
199
3
199
4
199
5
199
6
199
7
199
8
199
9
200
0
200
1
200
2
200
3
200
4
200
5
200
6
200
7
Total # of Cross-bord
er deals
% of all deals
0
100
200
300
400
500
600
20%
25%
30%
35%
40%
45%
50%
199
0
199
1
199
2
199
3
199
4
199
5
199
6
199
7
199
8
199
9
200
0
200
1
200
2
200
3
200
4
200
5
200
6
200
7
Total value of cross-border deals (in 1990
$bil)
% of total value for all deals
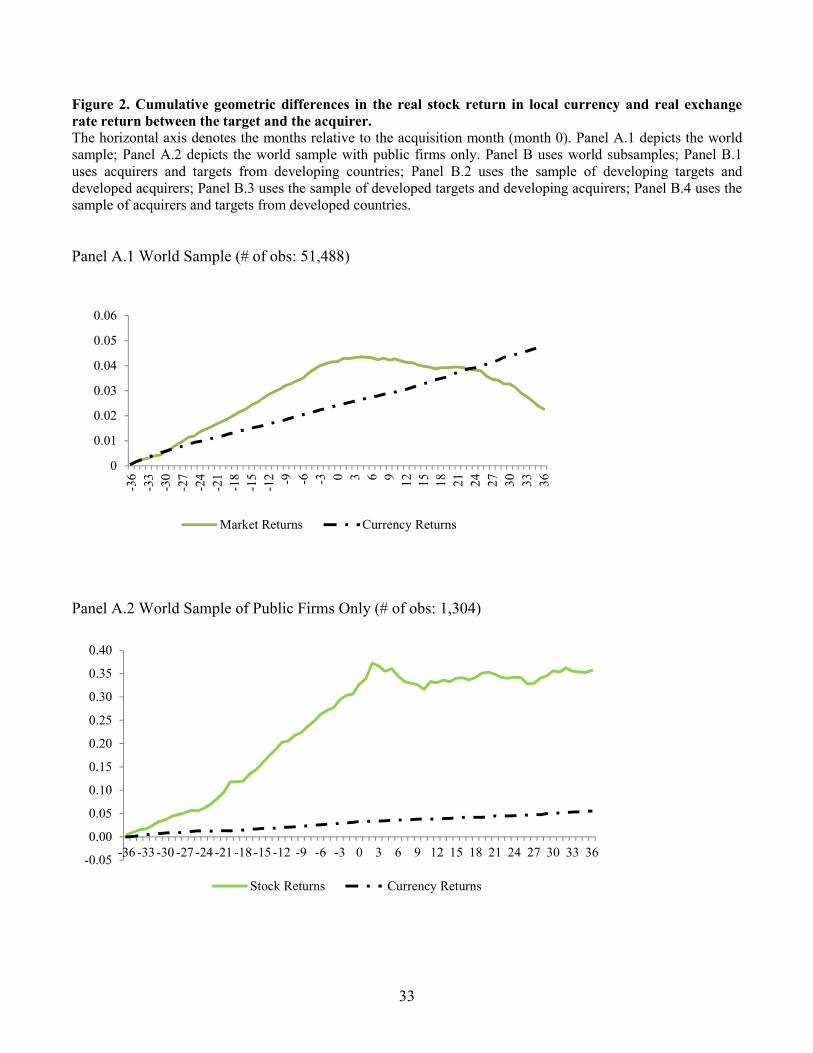
33
Figure 2. Cumulative geometric differences in the real stock return in local currency and real exchange
rate return between the target and the acquirer.
The horizontal axis denotes the months relative to the acquisition month (month 0). Panel A.1 depicts the world sample; Panel A.2 depicts the world sample with public firms only. Panel B uses world subsamples; Panel B.1 uses acquirers and targets from developing countries; Panel B.2 uses the sample of developing targets and developed acquirers; Panel B.3 uses the sample of developed targets and developing acquirers; Panel B.4 uses the sample of acquirers and targets from developed countries.
Panel A.1 World Sample (# of obs: 51,488)
Panel A.2 World Sample of Public Firms Only (# of obs: 1,304)
0
0.01
0.02
0.03
0.04
0.05
0.06
-36
-33
-30
-27
-24
-21
-18
-15
-12 -9 -6 -3 0 3 6 9
12
15
18
21
24
27
30
33
36
Market Returns Currency Returns
-0.05
0.00
0.05
0.10
0.15
0.20
0.25
0.30
0.35
0.40
-36 -33 -30 -27 -24 -21 -18 -15 -12 -9 -6 -3 0 3 6 9 12 15 18 21 24 27 30 33 36
Stock Returns Currency Returns
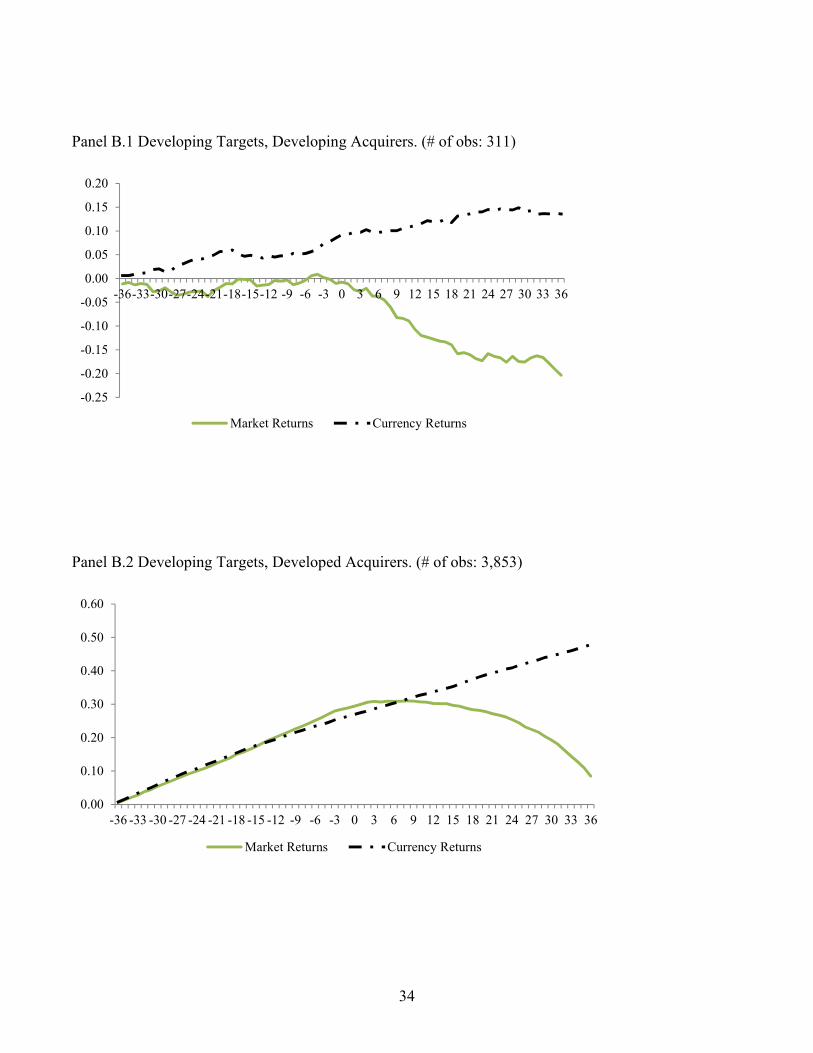
34
Panel B.1 Developing Targets, Developing Acquirers. (# of obs: 311)
Panel B.2 Developing Targets, Developed Acquirers. (# of obs: 3,853)
-0.25
-0.20
-0.15
-0.10
-0.05
0.00
0.05
0.10
0.15
0.20
-36-33-30-27-24-21-18-15-12 -9 -6 -3 0 3 6 9 12 15 18 21 24 27 30 33 36
Market Returns Currency Returns
0.00
0.10
0.20
0.30
0.40
0.50
0.60
-36 -33 -30 -27 -24 -21 -18 -15 -12 -9 -6 -3 0 3 6 9 12 15 18 21 24 27 30 33 36
Market Returns Currency Returns
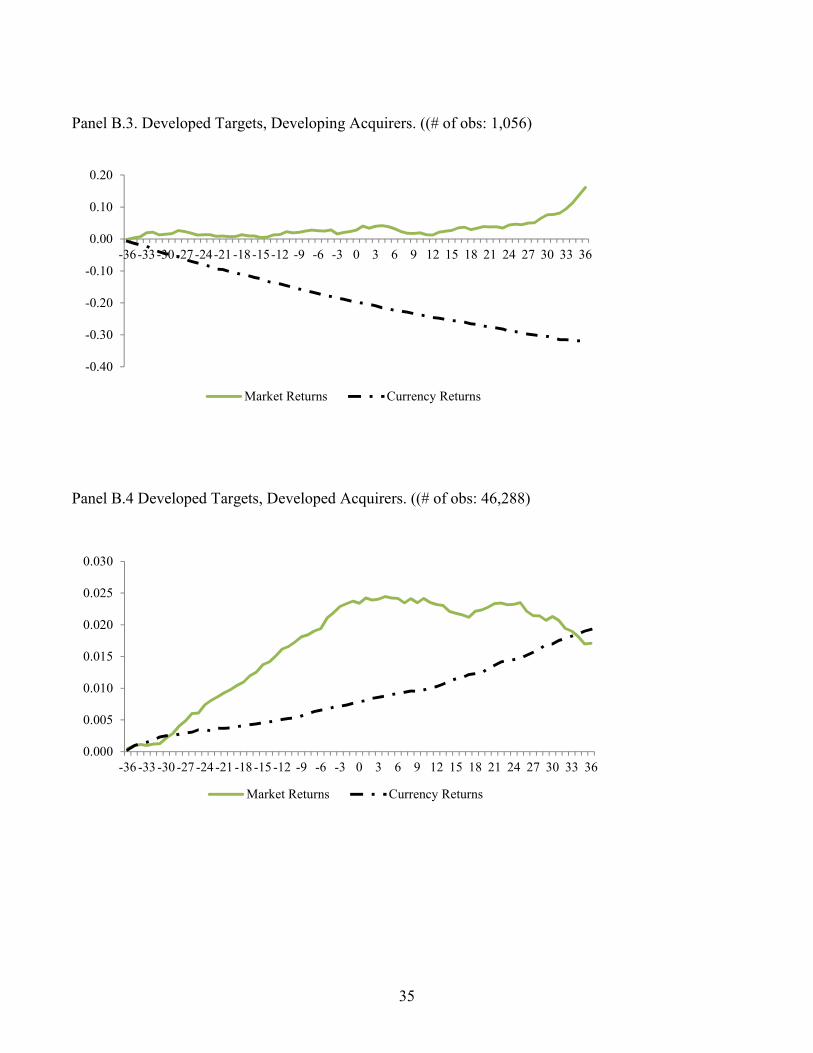
35
Panel B.3. Developed Targets, Developing Acquirers. ((# of obs: 1,056)
Panel B.4 Developed Targets, Developed Acquirers. ((# of obs: 46,288)
-0.40
-0.30
-0.20
-0.10
0.00
0.10
0.20
-36-33-30-27-24-21-18-15-12 -9 -6 -3 0 3 6 9 12 15 18 21 24 27 30 33 36
Market Returns Currency Returns
0.000
0.005
0.010
0.015
0.020
0.025
0.030
-36 -33 -30 -27 -24 -21 -18 -15 -12 -9 -6 -3 0 3 6 9 12 15 18 21 24 27 30 33 36
Market Returns Currency Returns
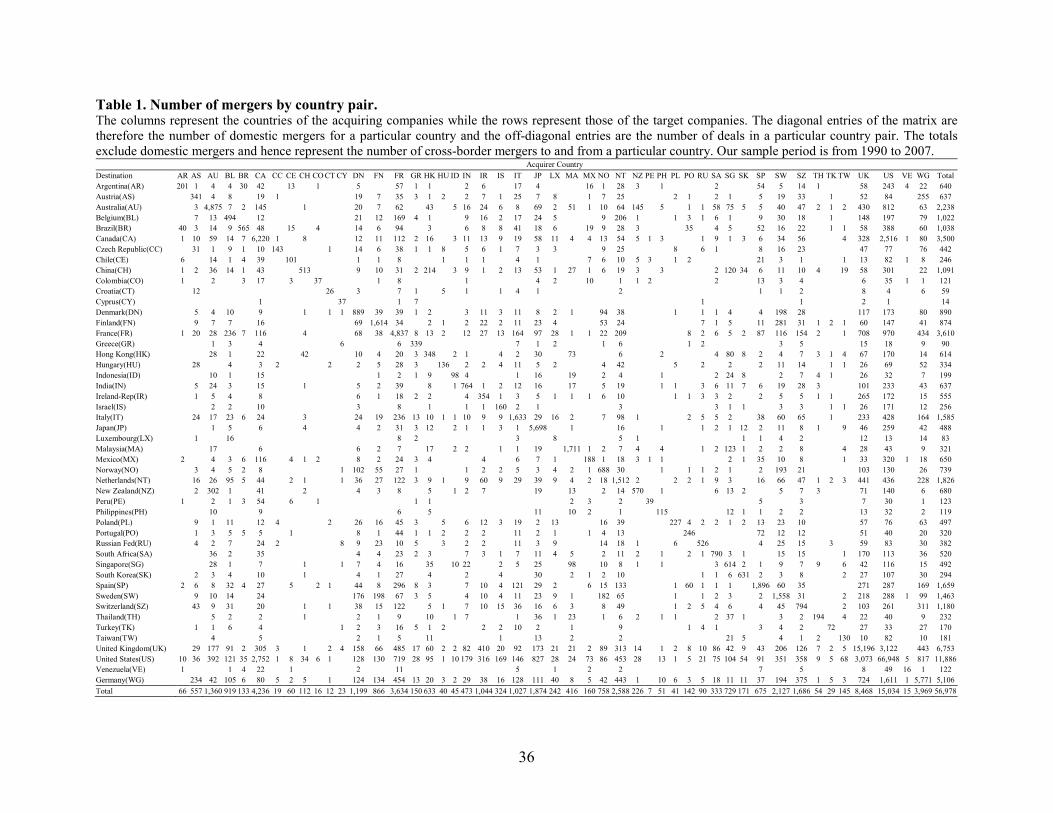
36
Table 1. Number of mergers by country pair. The columns represent the countries of the acquiring companies while the rows represent those of the target companies. The diagonal entries of the matrix are therefore the number of domestic mergers for a particular country and the off-diagonal entries are the number of deals in a particular country pair. The totals exclude domestic mergers and hence represent the number of cross-border mergers to and from a particular country. Our sample period is from 1990 to 2007. Acquirer Country
Destination AR AS AU BL BR CA CC CE CH CO CT CY DN FN FR GR HK HU ID IN IR IS IT JP LX MA MX NO NT NZ PE PH PL PO RU SA SG SK SP SW SZ TH TK TW UK US VE WG Total
Argentina(AR) 201 1 4 4 30 42 13 1 5 57 1 1 2 6 17 4 16 1 28 3 1 2 54 5 14 1 58 243 4 22 640
Austria(AS) 341 4 8 19 1 19 7 35 3 1 2 2 7 1 25 7 8 1 7 25 2 1 2 1 5 19 33 1 52 84 255 637
Australia(AU) 3 4,875 7 2 145 1 20 7 62 43 5 16 24 6 8 69 2 51 1 10 64 145 5 1 1 58 75 5 5 40 47 2 1 2 430 812 63 2,238
Belgium(BL) 7 13 494 12 21 12 169 4 1 9 16 2 17 24 5 9 206 1 1 3 1 6 1 9 30 18 1 148 197 79 1,022
Brazil(BR) 40 3 14 9 565 48 15 4 14 6 94 3 6 8 8 41 18 6 19 9 28 3 35 4 5 52 16 22 1 1 58 388 60 1,038
Canada(CA) 1 10 59 14 7 6,220 1 8 12 11 112 2 16 3 11 13 9 19 58 11 4 4 13 54 5 1 3 1 9 1 3 6 34 56 4 328 2,516 1 80 3,500
Czech Republic(CC) 31 1 9 1 10 143 1 14 6 38 1 1 8 5 6 1 7 3 3 9 25 8 6 1 8 16 23 47 77 76 442
Chile(CE) 6 14 1 4 39 101 1 1 8 1 1 1 4 1 7 6 10 5 3 1 2 21 3 1 1 13 82 1 8 246
China(CH) 1 2 36 14 1 43 513 9 10 31 2 214 3 9 1 2 13 53 1 27 1 6 19 3 3 2 120 34 6 11 10 4 19 58 301 22 1,091
Colombia(CO) 1 2 3 17 3 37 1 8 1 4 2 10 1 1 2 2 13 3 4 6 35 1 1 121
Croatia(CT) 12 26 3 7 1 5 1 1 4 1 2 1 1 2 8 4 6 59
Cyprus(CY) 1 37 1 7 1 1 2 1 14
Denmark(DN) 5 4 10 9 1 1 1 889 39 39 1 2 3 11 3 11 8 2 1 94 38 1 1 1 4 4 198 28 117 173 80 890
Finland(FN) 9 7 7 16 69 1,614 34 2 1 2 22 2 11 23 4 53 24 7 1 5 11 281 31 1 2 1 60 147 41 874
France(FR) 1 20 28 236 7 116 4 68 38 4,837 8 13 2 12 27 13 164 97 28 1 1 22 209 8 2 6 5 2 87 116 154 2 1 708 970 434 3,610
Greece(GR) 1 3 4 6 6 339 7 1 2 1 6 1 2 3 5 15 18 9 90
Hong Kong(HK) 28 1 22 42 10 4 20 3 348 2 1 4 2 30 73 6 2 4 80 8 2 4 7 3 1 4 67 170 14 614
Hungary(HU) 28 4 3 2 2 2 5 28 3 136 2 2 4 11 5 2 4 42 5 2 2 2 11 14 1 1 26 69 52 334
Indonesia(ID) 10 1 15 1 2 1 9 98 4 1 16 19 2 4 1 2 24 8 2 7 4 1 26 32 7 199
India(IN) 5 24 3 15 1 5 2 39 8 1 764 1 2 12 16 17 5 19 1 1 3 6 11 7 6 19 28 3 101 233 43 637
Ireland-Rep(IR) 1 5 4 8 6 1 18 2 2 4 354 1 3 5 1 1 1 6 10 1 1 3 3 2 2 5 5 1 1 265 172 15 555
Israel(IS) 2 2 10 3 8 1 1 1 160 2 1 3 3 1 1 3 3 1 1 26 171 12 256
Italy(IT) 24 17 23 6 24 3 24 19 236 13 10 1 1 10 9 9 1,633 29 16 2 7 98 1 2 5 5 2 38 60 65 1 233 428 164 1,585
Japan(JP) 1 5 6 4 4 2 31 3 12 2 1 1 3 1 5,698 1 16 1 1 2 1 12 2 11 8 1 9 46 259 42 488
Luxembourg(LX) 1 16 8 2 3 8 5 1 1 1 4 2 12 13 14 83
Malaysia(MA) 17 6 6 2 7 17 2 2 1 1 19 1,711 1 2 7 4 4 1 2 123 1 2 2 8 4 28 43 9 321
Mexico(MX) 2 4 3 6 116 4 1 2 8 2 24 3 4 4 6 7 1 188 1 18 3 1 1 2 1 35 10 8 1 33 320 1 18 650
Norway(NO) 3 4 5 2 8 1 102 55 27 1 1 2 2 5 3 4 2 1 688 30 1 1 1 2 1 2 193 21 103 130 26 739
Netherlands(NT) 16 26 95 5 44 2 1 1 36 27 122 3 9 1 9 60 9 29 39 9 4 2 18 1,512 2 2 2 1 9 3 16 66 47 1 2 3 441 436 228 1,826
New Zealand(NZ) 2 302 1 41 2 4 3 8 5 1 2 7 19 13 2 14 570 1 6 13 2 5 7 3 71 140 6 680
Peru(PE) 1 2 1 3 54 6 1 1 1 2 3 2 39 5 3 7 30 1 123
Philippines(PH) 10 9 6 5 11 10 2 1 115 12 1 1 2 2 13 32 2 119
Poland(PL) 9 1 11 12 4 2 26 16 45 3 5 6 12 3 19 2 13 16 39 227 4 2 2 1 2 13 23 10 57 76 63 497
Portugal(PO) 1 3 5 5 5 1 8 1 44 1 1 2 2 2 11 2 1 1 4 13 246 72 12 12 51 40 20 320
Russian Fed(RU) 4 2 7 24 2 8 9 23 10 5 3 2 2 11 3 9 14 18 1 6 526 4 25 15 3 59 83 30 382
South Africa(SA) 36 2 35 4 4 23 2 3 7 3 1 7 11 4 5 2 11 2 1 2 1 790 3 1 15 15 1 170 113 36 520
Singapore(SG) 28 1 7 1 1 7 4 16 35 10 22 2 5 25 98 10 8 1 1 3 614 2 1 9 7 9 6 42 116 15 492
South Korea(SK) 2 3 4 10 1 4 1 27 4 2 4 30 2 1 2 10 1 1 6 631 2 3 8 2 27 107 30 294
Spain(SP) 2 6 8 32 4 27 5 2 1 44 8 296 8 3 7 10 4 121 29 2 6 15 133 1 60 1 1 1 1,896 60 35 271 287 169 1,659
Sweden(SW) 9 10 14 24 176 198 67 3 5 4 10 4 11 23 9 1 182 65 1 1 2 3 2 1,558 31 2 218 288 1 99 1,463
Switzerland(SZ) 43 9 31 20 1 1 38 15 122 5 1 7 10 15 36 16 6 3 8 49 1 2 5 4 6 4 45 794 2 103 261 311 1,180
Thailand(TH) 5 2 2 1 2 1 9 10 1 7 1 36 1 23 1 6 2 1 1 2 37 1 3 2 194 4 22 40 9 232
Turkey(TK) 1 1 6 4 1 2 3 16 5 1 2 2 2 10 2 1 9 1 4 1 3 4 2 72 27 33 27 170
Taiwan(TW) 4 5 2 1 5 11 1 13 2 2 21 5 4 1 2 130 10 82 10 181
United Kingdom(UK) 29 177 91 2 305 3 1 2 4 158 66 485 17 60 2 2 82 410 20 92 173 21 21 2 89 313 14 1 2 8 10 86 42 9 43 206 126 7 2 5 15,196 3,122 443 6,753
United States(US) 10 36 392 121 35 2,752 1 8 34 6 1 128 130 719 28 95 1 10 179 316 169 146 827 28 24 73 86 453 28 13 1 5 21 75 104 54 91 351 358 9 5 68 3,073 66,948 5 817 11,886
Venezuela(VE) 1 1 4 22 1 2 11 5 1 2 2 7 5 8 49 16 1 122
Germany(WG) 234 42 105 6 80 5 2 5 1 124 134 454 13 20 3 2 29 38 16 128 111 40 8 5 42 443 1 10 6 3 5 18 11 11 37 194 375 1 5 3 724 1,611 1 5,771 5,106
Total 66 557 1,360 919 133 4,236 19 60 112 16 12 23 1,199 866 3,634 150 633 40 45 473 1,044 324 1,027 1,874 242 416 160 758 2,588 226 7 51 41 142 90 333 729 171 675 2,127 1,686 54 29 145 8,468 15,034 15 3,969 56,978
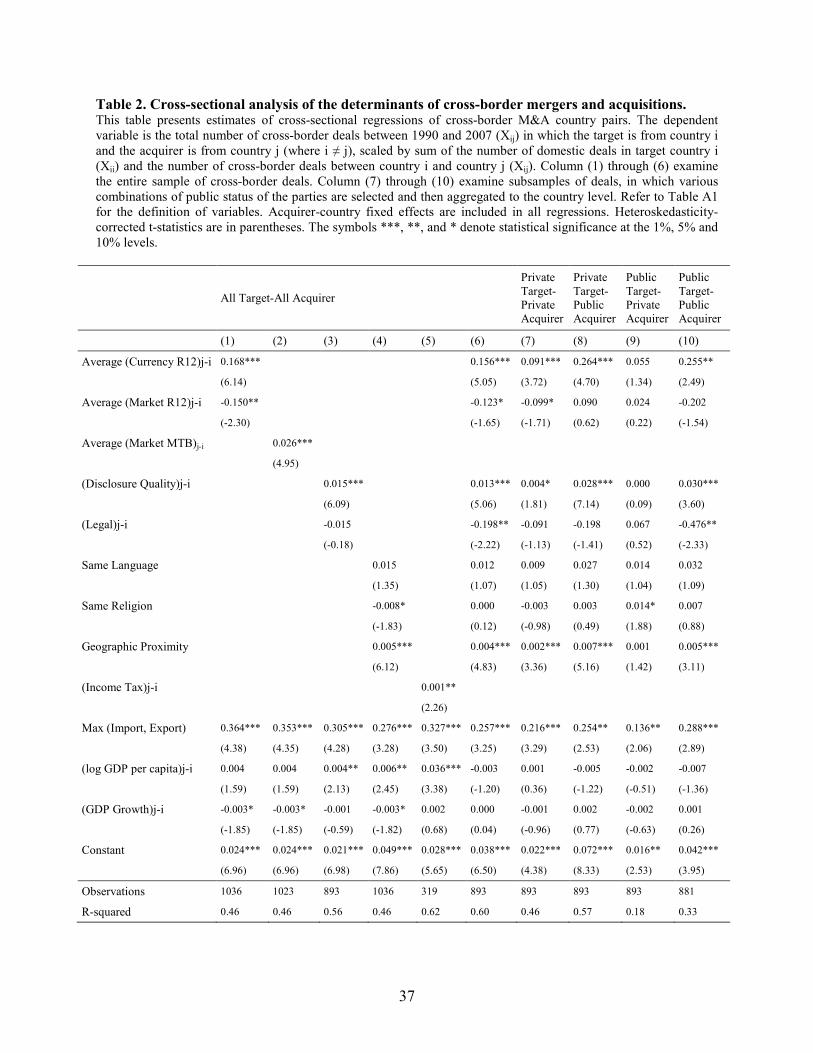
37
Table 2. Cross-sectional analysis of the determinants of cross-border mergers and acquisitions. This table presents estimates of cross-sectional regressions of cross-border M&A country pairs. The dependent variable is the total number of cross-border deals between 1990 and 2007 (Xij) in which the target is from country i and the acquirer is from country j (where i ≠ j), scaled by sum of the number of domestic deals in target country i (Xii) and the number of cross-border deals between country i and country j (Xij). Column (1) through (6) examine the entire sample of cross-border deals. Column (7) through (10) examine subsamples of deals, in which various combinations of public status of the parties are selected and then aggregated to the country level. Refer to Table A1 for the definition of variables. Acquirer-country fixed effects are included in all regressions. Heteroskedasticity-corrected t-statistics are in parentheses. The symbols ***, **, and * denote statistical significance at the 1%, 5% and 10% levels.
All Target-All Acquirer
Private Target-Private Acquirer
Private Target-Public Acquirer
Public Target-Private Acquirer
Public Target-Public Acquirer
(1) (2) (3) (4) (5) (6) (7) (8) (9) (10)
Average (Currency R12)j-i 0.168*** 0.156*** 0.091*** 0.264*** 0.055 0.255**
(6.14) (5.05) (3.72) (4.70) (1.34) (2.49)
Average (Market R12)j-i -0.150** -0.123* -0.099* 0.090 0.024 -0.202
(-2.30) (-1.65) (-1.71) (0.62) (0.22) (-1.54)
Average (Market MTB)j-i 0.026***
(4.95)
(Disclosure Quality)j-i 0.015*** 0.013*** 0.004* 0.028*** 0.000 0.030***
(6.09) (5.06) (1.81) (7.14) (0.09) (3.60)
(Legal)j-i -0.015 -0.198** -0.091 -0.198 0.067 -0.476**
(-0.18) (-2.22) (-1.13) (-1.41) (0.52) (-2.33)
Same Language 0.015 0.012 0.009 0.027 0.014 0.032
(1.35) (1.07) (1.05) (1.30) (1.04) (1.09)
Same Religion -0.008* 0.000 -0.003 0.003 0.014* 0.007
(-1.83) (0.12) (-0.98) (0.49) (1.88) (0.88)
Geographic Proximity 0.005*** 0.004*** 0.002*** 0.007*** 0.001 0.005***
(6.12) (4.83) (3.36) (5.16) (1.42) (3.11)
(Income Tax)j-i 0.001**
(2.26)
Max (Import, Export) 0.364*** 0.353*** 0.305*** 0.276*** 0.327*** 0.257*** 0.216*** 0.254** 0.136** 0.288***
(4.38) (4.35) (4.28) (3.28) (3.50) (3.25) (3.29) (2.53) (2.06) (2.89)
(log GDP per capita)j-i 0.004 0.004 0.004** 0.006** 0.036*** -0.003 0.001 -0.005 -0.002 -0.007
(1.59) (1.59) (2.13) (2.45) (3.38) (-1.20) (0.36) (-1.22) (-0.51) (-1.36)
(GDP Growth)j-i -0.003* -0.003* -0.001 -0.003* 0.002 0.000 -0.001 0.002 -0.002 0.001
(-1.85) (-1.85) (-0.59) (-1.82) (0.68) (0.04) (-0.96) (0.77) (-0.63) (0.26)
Constant 0.024*** 0.024*** 0.021*** 0.049*** 0.028*** 0.038*** 0.022*** 0.072*** 0.016** 0.042***
(6.96) (6.96) (6.98) (7.86) (5.65) (6.50) (4.38) (8.33) (2.53) (3.95)
Observations 1036 1023 893 1036 319 893 893 893 893 881
R-squared 0.46 0.46 0.56 0.46 0.62 0.60 0.46 0.57 0.18 0.33
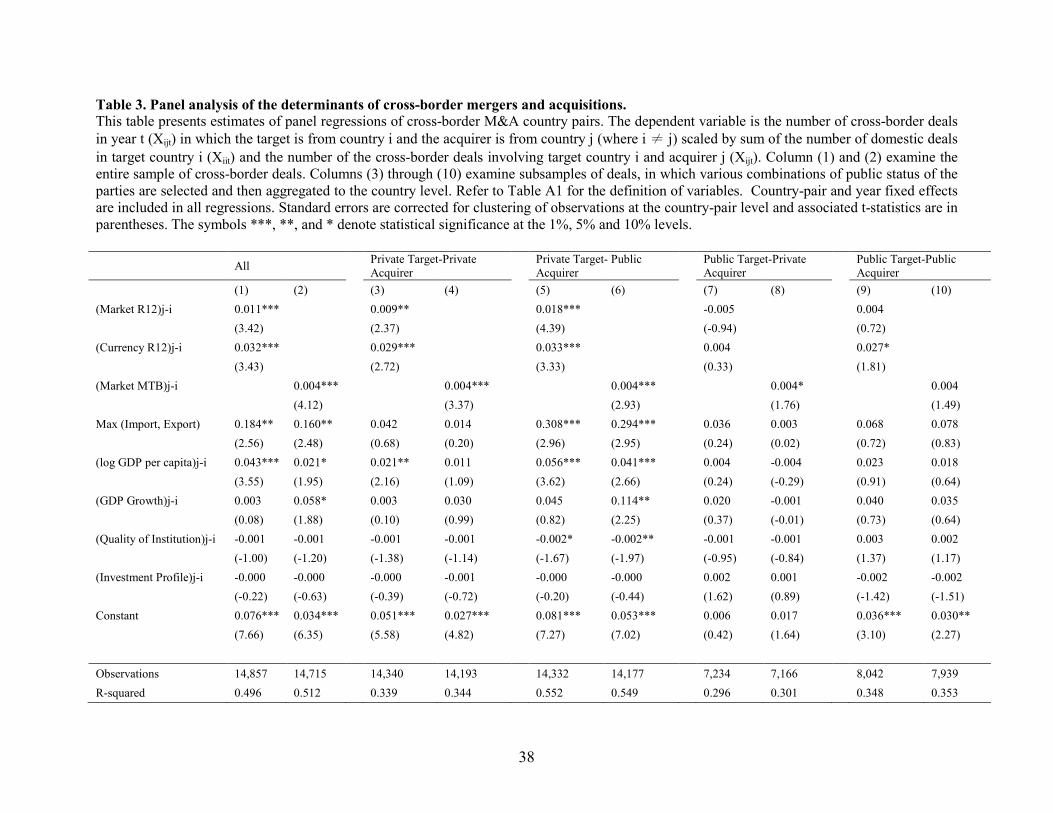
38
Table 3. Panel analysis of the determinants of cross-border mergers and acquisitions.
This table presents estimates of panel regressions of cross-border M&A country pairs. The dependent variable is the number of cross-border deals
in year t (Xijt) in which the target is from country i and the acquirer is from country j (where i ≠ j) scaled by sum of the number of domestic deals
in target country i (Xiit) and the number of the cross-border deals involving target country i and acquirer j (Xijt). Column (1) and (2) examine the entire sample of cross-border deals. Columns (3) through (10) examine subsamples of deals, in which various combinations of public status of the parties are selected and then aggregated to the country level. Refer to Table A1 for the definition of variables. Country-pair and year fixed effects are included in all regressions. Standard errors are corrected for clustering of observations at the country-pair level and associated t-statistics are in parentheses. The symbols ***, **, and * denote statistical significance at the 1%, 5% and 10% levels.
All
Private Target-Private Acquirer
Private Target- Public Acquirer
Public Target-Private Acquirer
Public Target-Public Acquirer
(1) (2) (3) (4) (5) (6) (7) (8) (9) (10)
(Market R12)j-i 0.011*** 0.009** 0.018*** -0.005 0.004
(3.42) (2.37) (4.39) (-0.94) (0.72)
(Currency R12)j-i 0.032*** 0.029*** 0.033*** 0.004 0.027*
(3.43) (2.72) (3.33) (0.33) (1.81)
(Market MTB)j-i 0.004*** 0.004*** 0.004*** 0.004* 0.004
(4.12) (3.37) (2.93) (1.76) (1.49)
Max (Import, Export) 0.184** 0.160** 0.042 0.014 0.308*** 0.294*** 0.036 0.003 0.068 0.078
(2.56) (2.48) (0.68) (0.20) (2.96) (2.95) (0.24) (0.02) (0.72) (0.83)
(log GDP per capita)j-i 0.043*** 0.021* 0.021** 0.011 0.056*** 0.041*** 0.004 -0.004 0.023 0.018
(3.55) (1.95) (2.16) (1.09) (3.62) (2.66) (0.24) (-0.29) (0.91) (0.64)
(GDP Growth)j-i 0.003 0.058* 0.003 0.030 0.045 0.114** 0.020 -0.001 0.040 0.035
(0.08) (1.88) (0.10) (0.99) (0.82) (2.25) (0.37) (-0.01) (0.73) (0.64)
(Quality of Institution)j-i -0.001 -0.001 -0.001 -0.001 -0.002* -0.002** -0.001 -0.001 0.003 0.002
(-1.00) (-1.20) (-1.38) (-1.14) (-1.67) (-1.97) (-0.95) (-0.84) (1.37) (1.17)
(Investment Profile)j-i -0.000 -0.000 -0.000 -0.001 -0.000 -0.000 0.002 0.001 -0.002 -0.002
(-0.22) (-0.63) (-0.39) (-0.72) (-0.20) (-0.44) (1.62) (0.89) (-1.42) (-1.51)
Constant 0.076*** 0.034*** 0.051*** 0.027*** 0.081*** 0.053*** 0.006 0.017 0.036*** 0.030**
(7.66) (6.35) (5.58) (4.82) (7.27) (7.02) (0.42) (1.64) (3.10) (2.27)
Observations 14,857 14,715 14,340 14,193 14,332 14,177 7,234 7,166 8,042 7,939
R-squared 0.496 0.512 0.339 0.344 0.552 0.549 0.296 0.301 0.348 0.353
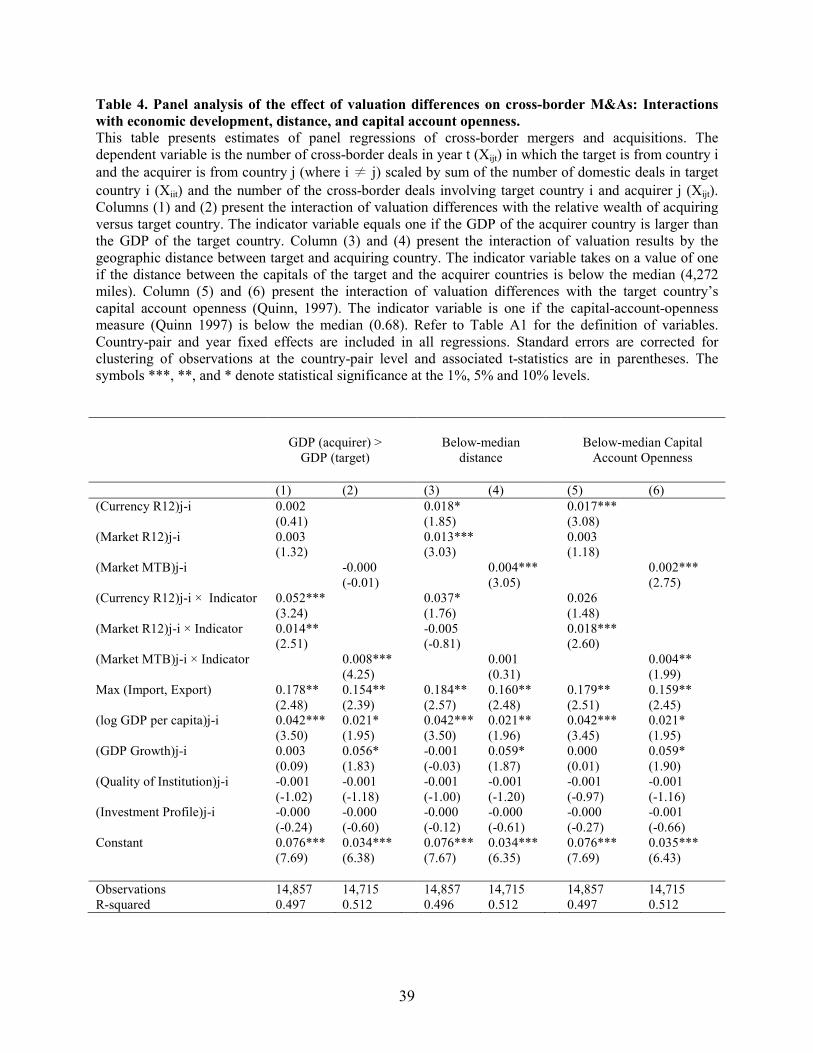
39
Table 4. Panel analysis of the effect of valuation differences on cross-border M&As: Interactions
with economic development, distance, and capital account openness.
This table presents estimates of panel regressions of cross-border mergers and acquisitions. The dependent variable is the number of cross-border deals in year t (Xijt) in which the target is from country i
and the acquirer is from country j (where i ≠ j) scaled by sum of the number of domestic deals in target
country i (Xiit) and the number of the cross-border deals involving target country i and acquirer j (Xijt). Columns (1) and (2) present the interaction of valuation differences with the relative wealth of acquiring versus target country. The indicator variable equals one if the GDP of the acquirer country is larger than the GDP of the target country. Column (3) and (4) present the interaction of valuation results by the geographic distance between target and acquiring country. The indicator variable takes on a value of one if the distance between the capitals of the target and the acquirer countries is below the median (4,272 miles). Column (5) and (6) present the interaction of valuation differences with the target country’s capital account openness (Quinn, 1997). The indicator variable is one if the capital-account-openness measure (Quinn 1997) is below the median (0.68). Refer to Table A1 for the definition of variables. Country-pair and year fixed effects are included in all regressions. Standard errors are corrected for clustering of observations at the country-pair level and associated t-statistics are in parentheses. The symbols ***, **, and * denote statistical significance at the 1%, 5% and 10% levels.
GDP (acquirer) >
GDP (target)
Below-median distance
Below-median Capital
Account Openness
(1) (2) (3) (4) (5) (6)
(Currency R12)j-i 0.002 0.018* 0.017*** (0.41) (1.85) (3.08) (Market R12)j-i 0.003 0.013*** 0.003 (1.32) (3.03) (1.18) (Market MTB)j-i -0.000 0.004*** 0.002*** (-0.01) (3.05) (2.75) (Currency R12)j-i × Indicator 0.052*** 0.037* 0.026 (3.24) (1.76) (1.48) (Market R12)j-i × Indicator 0.014** -0.005 0.018*** (2.51) (-0.81) (2.60) (Market MTB)j-i × Indicator 0.008*** 0.001 0.004** (4.25) (0.31) (1.99) Max (Import, Export) 0.178** 0.154** 0.184** 0.160** 0.179** 0.159** (2.48) (2.39) (2.57) (2.48) (2.51) (2.45) (log GDP per capita)j-i 0.042*** 0.021* 0.042*** 0.021** 0.042*** 0.021* (3.50) (1.95) (3.50) (1.96) (3.45) (1.95) (GDP Growth)j-i 0.003 0.056* -0.001 0.059* 0.000 0.059* (0.09) (1.83) (-0.03) (1.87) (0.01) (1.90) (Quality of Institution)j-i -0.001 -0.001 -0.001 -0.001 -0.001 -0.001 (-1.02) (-1.18) (-1.00) (-1.20) (-0.97) (-1.16) (Investment Profile)j-i -0.000 -0.000 -0.000 -0.000 -0.000 -0.001 (-0.24) (-0.60) (-0.12) (-0.61) (-0.27) (-0.66) Constant 0.076*** 0.034*** 0.076*** 0.034*** 0.076*** 0.035*** (7.69) (6.38) (7.67) (6.35) (7.69) (6.43)
Observations 14,857 14,715 14,857 14,715 14,857 14,715 R-squared 0.497 0.512 0.496 0.512 0.497 0.512
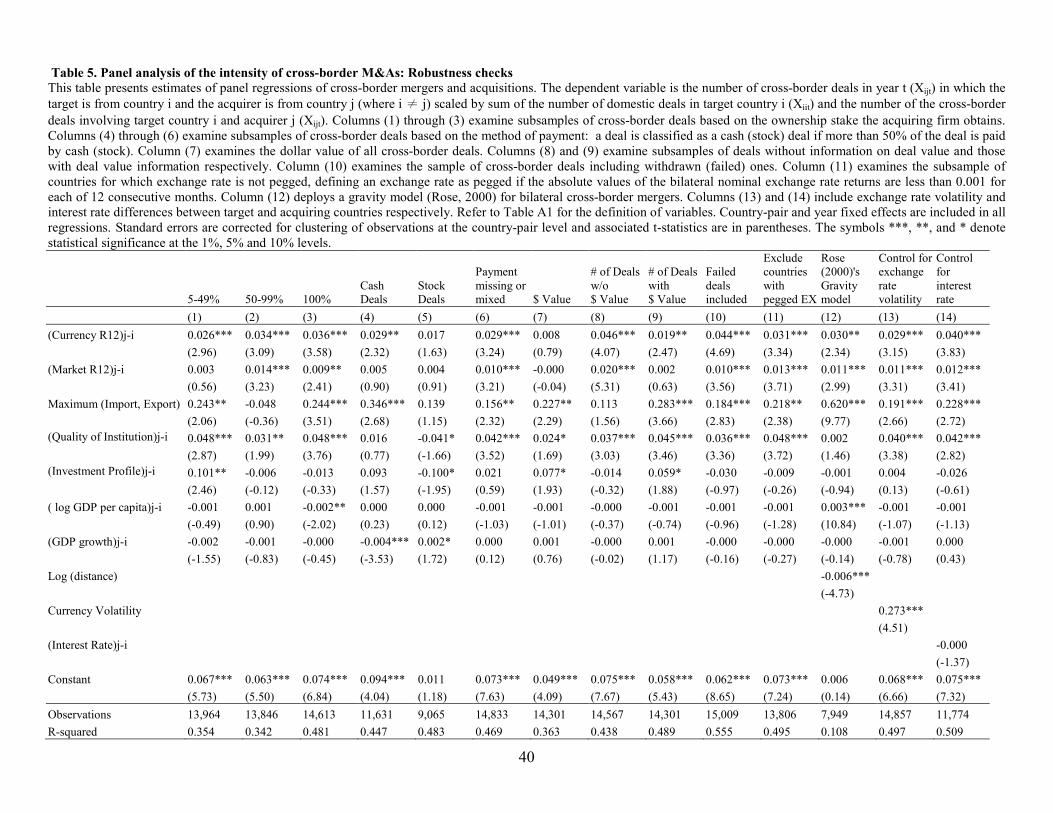
40
Table 5. Panel analysis of the intensity of cross-border M&As: Robustness checks
This table presents estimates of panel regressions of cross-border mergers and acquisitions. The dependent variable is the number of cross-border deals in year t (Xijt) in which the
target is from country i and the acquirer is from country j (where i ≠ j) scaled by sum of the number of domestic deals in target country i (Xiit) and the number of the cross-border
deals involving target country i and acquirer j (Xijt). Columns (1) through (3) examine subsamples of cross-border deals based on the ownership stake the acquiring firm obtains. Columns (4) through (6) examine subsamples of cross-border deals based on the method of payment: a deal is classified as a cash (stock) deal if more than 50% of the deal is paid by cash (stock). Column (7) examines the dollar value of all cross-border deals. Columns (8) and (9) examine subsamples of deals without information on deal value and those with deal value information respectively. Column (10) examines the sample of cross-border deals including withdrawn (failed) ones. Column (11) examines the subsample of countries for which exchange rate is not pegged, defining an exchange rate as pegged if the absolute values of the bilateral nominal exchange rate returns are less than 0.001 for each of 12 consecutive months. Column (12) deploys a gravity model (Rose, 2000) for bilateral cross-border mergers. Columns (13) and (14) include exchange rate volatility and interest rate differences between target and acquiring countries respectively. Refer to Table A1 for the definition of variables. Country-pair and year fixed effects are included in all regressions. Standard errors are corrected for clustering of observations at the country-pair level and associated t-statistics are in parentheses. The symbols ***, **, and * denote statistical significance at the 1%, 5% and 10% levels.
5-49% 50-99% 100% Cash Deals
Stock Deals
Payment missing or mixed $ Value
# of Deals w/o $ Value
# of Deals with $ Value
Failed deals included
Exclude countries with pegged EX
Rose (2000)'s Gravity model
Control for exchange rate volatility
Control for interest rate
(1) (2) (3) (4) (5) (6) (7) (8) (9) (10) (11) (12) (13) (14)
(Currency R12)j-i 0.026*** 0.034*** 0.036*** 0.029** 0.017 0.029*** 0.008 0.046*** 0.019** 0.044*** 0.031*** 0.030** 0.029*** 0.040***
(2.96) (3.09) (3.58) (2.32) (1.63) (3.24) (0.79) (4.07) (2.47) (4.69) (3.34) (2.34) (3.15) (3.83)
(Market R12)j-i 0.003 0.014*** 0.009** 0.005 0.004 0.010*** -0.000 0.020*** 0.002 0.010*** 0.013*** 0.011*** 0.011*** 0.012***
(0.56) (3.23) (2.41) (0.90) (0.91) (3.21) (-0.04) (5.31) (0.63) (3.56) (3.71) (2.99) (3.31) (3.41)
Maximum (Import, Export) 0.243** -0.048 0.244*** 0.346*** 0.139 0.156** 0.227** 0.113 0.283*** 0.184*** 0.218** 0.620*** 0.191*** 0.228***
(2.06) (-0.36) (3.51) (2.68) (1.15) (2.32) (2.29) (1.56) (3.66) (2.83) (2.38) (9.77) (2.66) (2.72)
(Quality of Institution)j-i 0.048*** 0.031** 0.048*** 0.016 -0.041* 0.042*** 0.024* 0.037*** 0.045*** 0.036*** 0.048*** 0.002 0.040*** 0.042***
(2.87) (1.99) (3.76) (0.77) (-1.66) (3.52) (1.69) (3.03) (3.46) (3.36) (3.72) (1.46) (3.38) (2.82)
(Investment Profile)j-i 0.101** -0.006 -0.013 0.093 -0.100* 0.021 0.077* -0.014 0.059* -0.030 -0.009 -0.001 0.004 -0.026
(2.46) (-0.12) (-0.33) (1.57) (-1.95) (0.59) (1.93) (-0.32) (1.88) (-0.97) (-0.26) (-0.94) (0.13) (-0.61)
( log GDP per capita)j-i -0.001 0.001 -0.002** 0.000 0.000 -0.001 -0.001 -0.000 -0.001 -0.001 -0.001 0.003*** -0.001 -0.001
(-0.49) (0.90) (-2.02) (0.23) (0.12) (-1.03) (-1.01) (-0.37) (-0.74) (-0.96) (-1.28) (10.84) (-1.07) (-1.13)
(GDP growth)j-i -0.002 -0.001 -0.000 -0.004*** 0.002* 0.000 0.001 -0.000 0.001 -0.000 -0.000 -0.000 -0.001 0.000
(-1.55) (-0.83) (-0.45) (-3.53) (1.72) (0.12) (0.76) (-0.02) (1.17) (-0.16) (-0.27) (-0.14) (-0.78) (0.43)
Log (distance) -0.006***
(-4.73)
Currency Volatility 0.273***
(4.51)
(Interest Rate)j-i -0.000
(-1.37)
Constant 0.067*** 0.063*** 0.074*** 0.094*** 0.011 0.073*** 0.049*** 0.075*** 0.058*** 0.062*** 0.073*** 0.006 0.068*** 0.075***
(5.73) (5.50) (6.84) (4.04) (1.18) (7.63) (4.09) (7.67) (5.43) (8.65) (7.24) (0.14) (6.66) (7.32)
Observations 13,964 13,846 14,613 11,631 9,065 14,833 14,301 14,567 14,301 15,009 13,806 7,949 14,857 11,774
R-squared 0.354 0.342 0.481 0.447 0.483 0.469 0.363 0.438 0.489 0.555 0.495 0.108 0.497 0.509
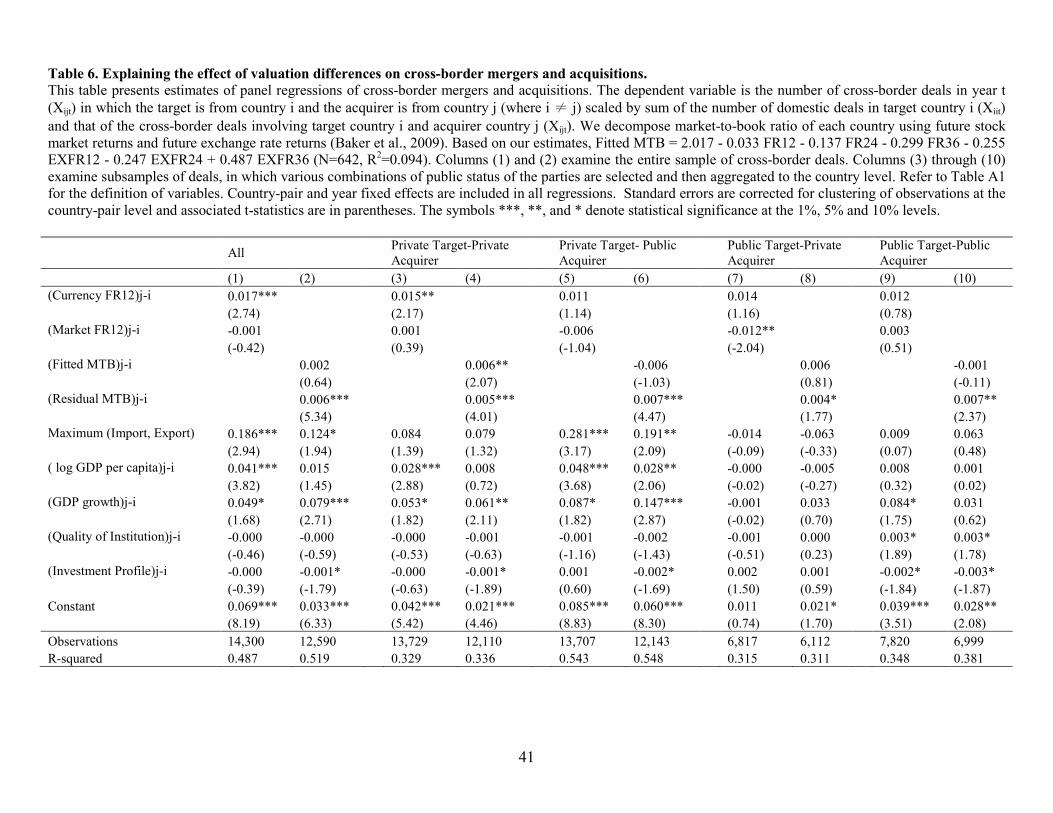
41
Table 6. Explaining the effect of valuation differences on cross-border mergers and acquisitions.
This table presents estimates of panel regressions of cross-border mergers and acquisitions. The dependent variable is the number of cross-border deals in year t
(Xijt) in which the target is from country i and the acquirer is from country j (where i ≠ j) scaled by sum of the number of domestic deals in target country i (Xiit)
and that of the cross-border deals involving target country i and acquirer country j (Xijt). We decompose market-to-book ratio of each country using future stock market returns and future exchange rate returns (Baker et al., 2009). Based on our estimates, Fitted MTB = 2.017 - 0.033 FR12 - 0.137 FR24 - 0.299 FR36 - 0.255 EXFR12 - 0.247 EXFR24 + 0.487 EXFR36 (N=642, R2=0.094). Columns (1) and (2) examine the entire sample of cross-border deals. Columns (3) through (10) examine subsamples of deals, in which various combinations of public status of the parties are selected and then aggregated to the country level. Refer to Table A1 for the definition of variables. Country-pair and year fixed effects are included in all regressions. Standard errors are corrected for clustering of observations at the country-pair level and associated t-statistics are in parentheses. The symbols ***, **, and * denote statistical significance at the 1%, 5% and 10% levels.
All
Private Target-Private Acquirer
Private Target- Public Acquirer
Public Target-Private Acquirer
Public Target-Public Acquirer
(1) (2) (3) (4) (5) (6) (7) (8) (9) (10)
(Currency FR12)j-i 0.017*** 0.015** 0.011 0.014 0.012
(2.74) (2.17) (1.14) (1.16) (0.78)
(Market FR12)j-i -0.001 0.001 -0.006 -0.012** 0.003
(-0.42) (0.39) (-1.04) (-2.04) (0.51)
(Fitted MTB)j-i 0.002 0.006** -0.006 0.006 -0.001
(0.64) (2.07) (-1.03) (0.81) (-0.11)
(Residual MTB)j-i 0.006*** 0.005*** 0.007*** 0.004* 0.007**
(5.34) (4.01) (4.47) (1.77) (2.37)
Maximum (Import, Export) 0.186*** 0.124* 0.084 0.079 0.281*** 0.191** -0.014 -0.063 0.009 0.063
(2.94) (1.94) (1.39) (1.32) (3.17) (2.09) (-0.09) (-0.33) (0.07) (0.48)
( log GDP per capita)j-i 0.041*** 0.015 0.028*** 0.008 0.048*** 0.028** -0.000 -0.005 0.008 0.001
(3.82) (1.45) (2.88) (0.72) (3.68) (2.06) (-0.02) (-0.27) (0.32) (0.02)
(GDP growth)j-i 0.049* 0.079*** 0.053* 0.061** 0.087* 0.147*** -0.001 0.033 0.084* 0.031
(1.68) (2.71) (1.82) (2.11) (1.82) (2.87) (-0.02) (0.70) (1.75) (0.62)
(Quality of Institution)j-i -0.000 -0.000 -0.000 -0.001 -0.001 -0.002 -0.001 0.000 0.003* 0.003*
(-0.46) (-0.59) (-0.53) (-0.63) (-1.16) (-1.43) (-0.51) (0.23) (1.89) (1.78)
(Investment Profile)j-i -0.000 -0.001* -0.000 -0.001* 0.001 -0.002* 0.002 0.001 -0.002* -0.003*
(-0.39) (-1.79) (-0.63) (-1.89) (0.60) (-1.69) (1.50) (0.59) (-1.84) (-1.87)
Constant 0.069*** 0.033*** 0.042*** 0.021*** 0.085*** 0.060*** 0.011 0.021* 0.039*** 0.028**
(8.19) (6.33) (5.42) (4.46) (8.83) (8.30) (0.74) (1.70) (3.51) (2.08)
Observations 14,300 12,590 13,729 12,110 13,707 12,143 6,817 6,112 7,820 6,999
R-squared 0.487 0.519 0.329 0.336 0.543 0.548 0.315 0.311 0.348 0.381
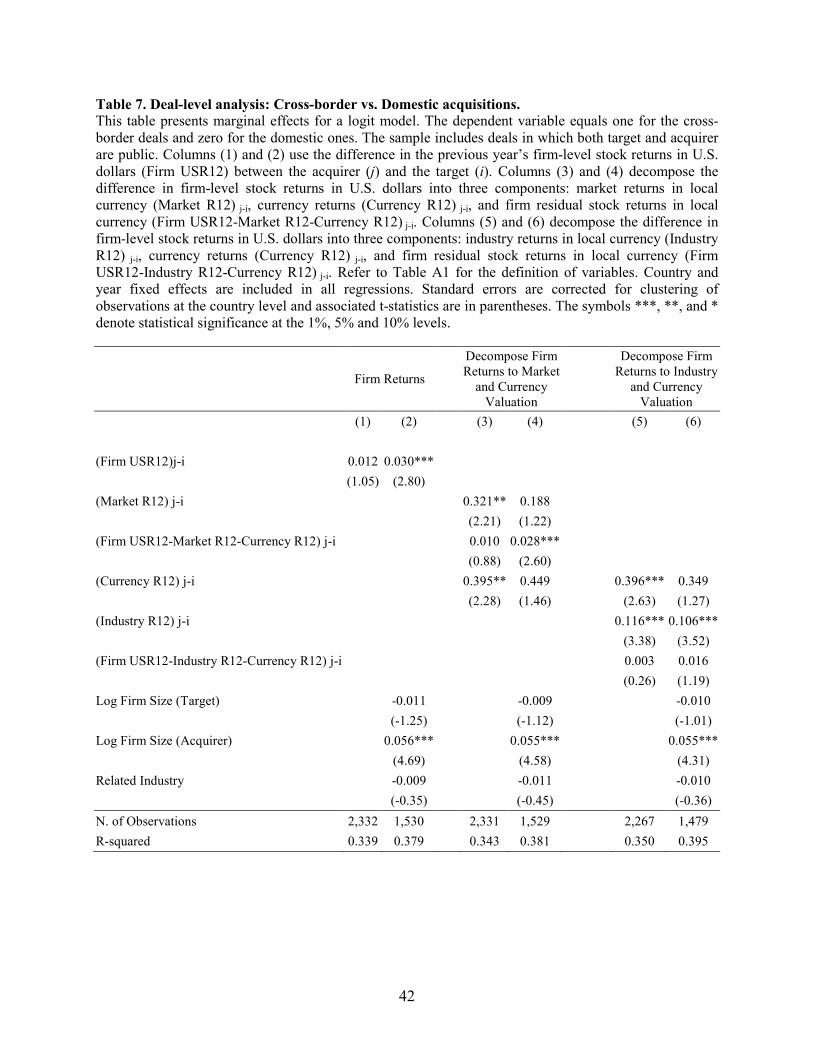
42
Table 7. Deal-level analysis: Cross-border vs. Domestic acquisitions.
This table presents marginal effects for a logit model. The dependent variable equals one for the cross-border deals and zero for the domestic ones. The sample includes deals in which both target and acquirer are public. Columns (1) and (2) use the difference in the previous year’s firm-level stock returns in U.S. dollars (Firm USR12) between the acquirer (j) and the target (i). Columns (3) and (4) decompose the difference in firm-level stock returns in U.S. dollars into three components: market returns in local currency (Market R12) j-i, currency returns (Currency R12) j-i, and firm residual stock returns in local currency (Firm USR12-Market R12-Currency R12) j-i. Columns (5) and (6) decompose the difference in firm-level stock returns in U.S. dollars into three components: industry returns in local currency (Industry R12) j-i, currency returns (Currency R12) j-i, and firm residual stock returns in local currency (Firm USR12-Industry R12-Currency R12) j-i. Refer to Table A1 for the definition of variables. Country and year fixed effects are included in all regressions. Standard errors are corrected for clustering of observations at the country level and associated t-statistics are in parentheses. The symbols ***, **, and * denote statistical significance at the 1%, 5% and 10% levels.
Firm Returns
Decompose Firm Returns to Market
and Currency Valuation
Decompose Firm Returns to Industry
and Currency Valuation
(1) (2) (3) (4) (5) (6)
(Firm USR12)j-i 0.012 0.030***
(1.05) (2.80)
(Market R12) j-i 0.321** 0.188
(2.21) (1.22)
(Firm USR12-Market R12-Currency R12) j-i 0.010 0.028***
(0.88) (2.60)
(Currency R12) j-i 0.395** 0.449 0.396*** 0.349
(2.28) (1.46) (2.63) (1.27)
(Industry R12) j-i 0.116*** 0.106***
(3.38) (3.52)
(Firm USR12-Industry R12-Currency R12) j-i 0.003 0.016
(0.26) (1.19)
Log Firm Size (Target) -0.011 -0.009 -0.010
(-1.25) (-1.12) (-1.01)
Log Firm Size (Acquirer) 0.056*** 0.055*** 0.055***
(4.69) (4.58) (4.31)
Related Industry -0.009 -0.011 -0.010
(-0.35) (-0.45) (-0.36)
N. of Observations 2,332 1,530 2,331 1,529 2,267 1,479
R-squared 0.339 0.379 0.343 0.381 0.350 0.395
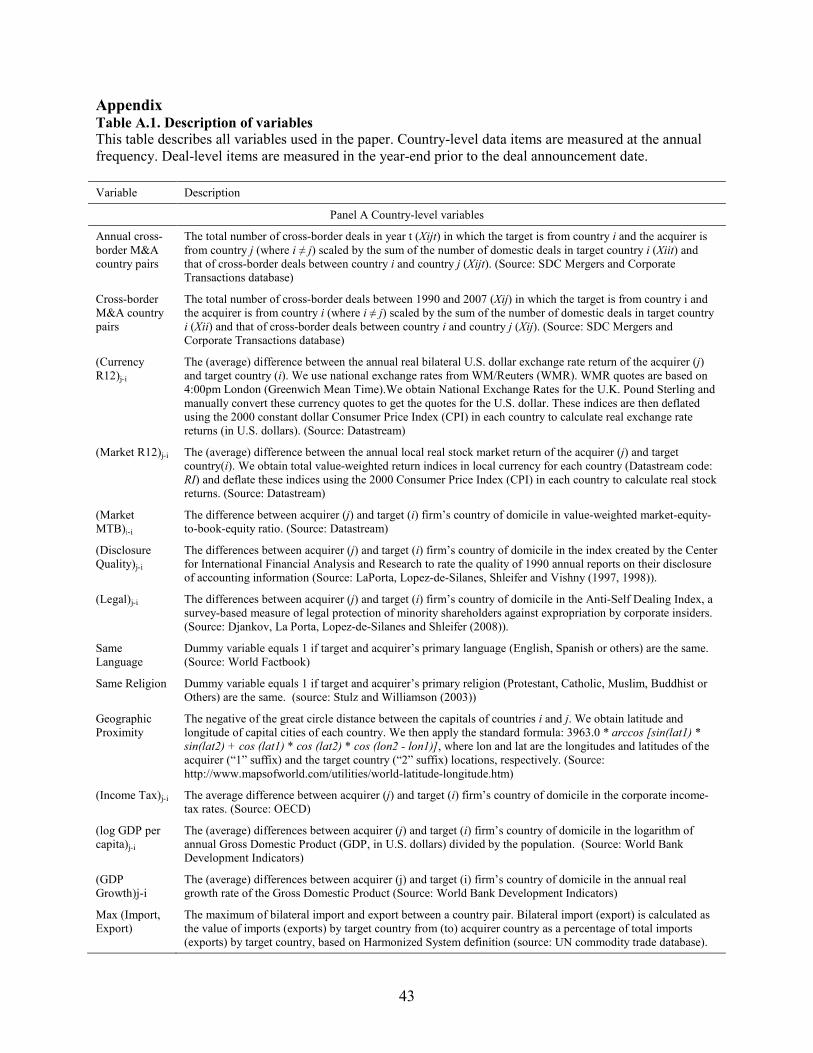
43
Appendix Table A.1. Description of variables
This table describes all variables used in the paper. Country-level data items are measured at the annual frequency. Deal-level items are measured in the year-end prior to the deal announcement date.
Variable Description
Panel A Country-level variables
Annual cross-border M&A country pairs
The total number of cross-border deals in year t (Xijt) in which the target is from country i and the acquirer is from country j (where i ≠ j) scaled by the sum of the number of domestic deals in target country i (Xiit) and that of cross-border deals between country i and country j (Xijt). (Source: SDC Mergers and Corporate Transactions database)
Cross-border M&A country pairs
The total number of cross-border deals between 1990 and 2007 (Xij) in which the target is from country i and the acquirer is from country i (where i ≠ j) scaled by the sum of the number of domestic deals in target country i (Xii) and that of cross-border deals between country i and country j (Xij). (Source: SDC Mergers and Corporate Transactions database)
(Currency R12)j-i
The (average) difference between the annual real bilateral U.S. dollar exchange rate return of the acquirer (j) and target country (i). We use national exchange rates from WM/Reuters (WMR). WMR quotes are based on 4:00pm London (Greenwich Mean Time).We obtain National Exchange Rates for the U.K. Pound Sterling and manually convert these currency quotes to get the quotes for the U.S. dollar. These indices are then deflated using the 2000 constant dollar Consumer Price Index (CPI) in each country to calculate real exchange rate returns (in U.S. dollars). (Source: Datastream)
(Market R12)j-i The (average) difference between the annual local real stock market return of the acquirer (j) and target country(i). We obtain total value-weighted return indices in local currency for each country (Datastream code: RI) and deflate these indices using the 2000 Consumer Price Index (CPI) in each country to calculate real stock returns. (Source: Datastream)
(Market MTB)j-i
The difference between acquirer (j) and target (i) firm’s country of domicile in value-weighted market-equity-to-book-equity ratio. (Source: Datastream)
(Disclosure Quality)j-i
The differences between acquirer (j) and target (i) firm’s country of domicile in the index created by the Center for International Financial Analysis and Research to rate the quality of 1990 annual reports on their disclosure of accounting information (Source: LaPorta, Lopez-de-Silanes, Shleifer and Vishny (1997, 1998)).
(Legal)j-i The differences between acquirer (j) and target (i) firm’s country of domicile in the Anti-Self Dealing Index, a survey-based measure of legal protection of minority shareholders against expropriation by corporate insiders. (Source: Djankov, La Porta, Lopez-de-Silanes and Shleifer (2008)).
Same Language
Dummy variable equals 1 if target and acquirer’s primary language (English, Spanish or others) are the same. (Source: World Factbook)
Same Religion Dummy variable equals 1 if target and acquirer’s primary religion (Protestant, Catholic, Muslim, Buddhist or Others) are the same. (source: Stulz and Williamson (2003))
Geographic Proximity
The negative of the great circle distance between the capitals of countries i and j. We obtain latitude and longitude of capital cities of each country. We then apply the standard formula: 3963.0 * arccos [sin(lat1) *
sin(lat2) + cos (lat1) * cos (lat2) * cos (lon2 - lon1)], where lon and lat are the longitudes and latitudes of the acquirer (“1” suffix) and the target country (“2” suffix) locations, respectively. (Source: http://www.mapsofworld.com/utilities/world-latitude-longitude.htm)
(Income Tax)j-i The average difference between acquirer (j) and target (i) firm’s country of domicile in the corporate income-tax rates. (Source: OECD)
(log GDP per capita)j-i
The (average) differences between acquirer (j) and target (i) firm’s country of domicile in the logarithm of annual Gross Domestic Product (GDP, in U.S. dollars) divided by the population. (Source: World Bank Development Indicators)
(GDP Growth)j-i
The (average) differences between acquirer (j) and target (i) firm’s country of domicile in the annual real growth rate of the Gross Domestic Product (Source: World Bank Development Indicators)
Max (Import, Export)
The maximum of bilateral import and export between a country pair. Bilateral import (export) is calculated as the value of imports (exports) by target country from (to) acquirer country as a percentage of total imports (exports) by target country, based on Harmonized System definition (source: UN commodity trade database).
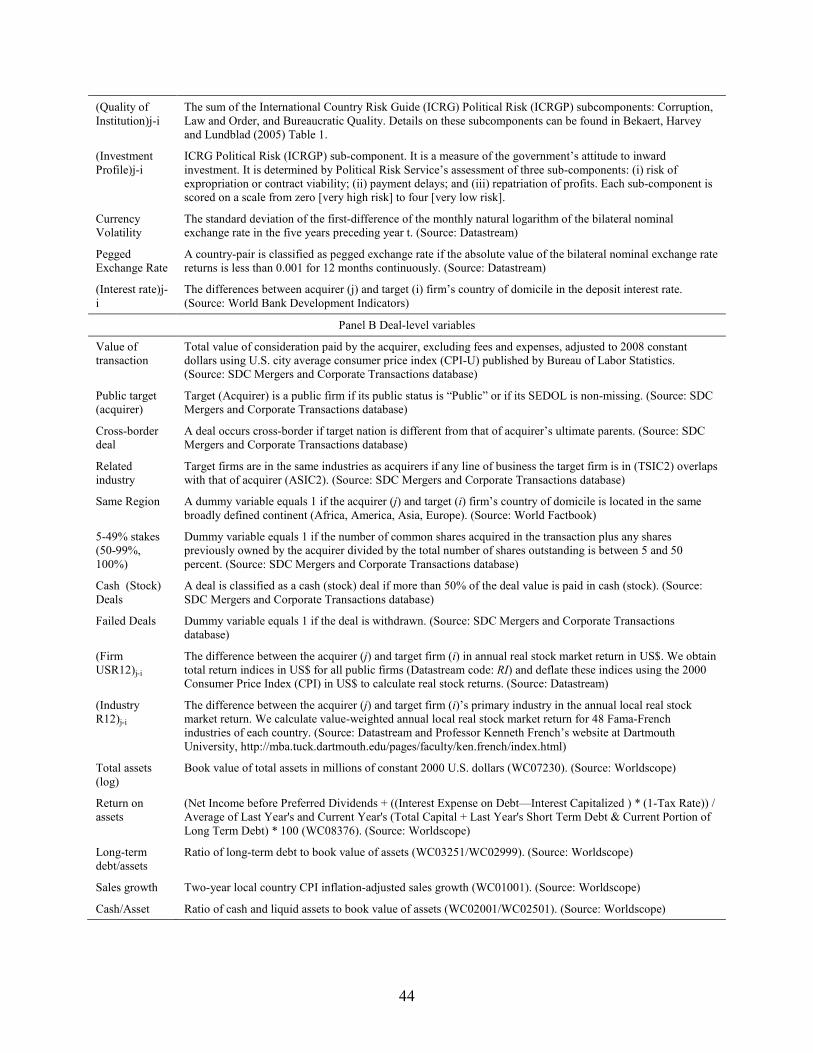
44
(Quality of Institution)j-i
The sum of the International Country Risk Guide (ICRG) Political Risk (ICRGP) subcomponents: Corruption, Law and Order, and Bureaucratic Quality. Details on these subcomponents can be found in Bekaert, Harvey and Lundblad (2005) Table 1.
(Investment Profile)j-i
ICRG Political Risk (ICRGP) sub-component. It is a measure of the government’s attitude to inward investment. It is determined by Political Risk Service’s assessment of three sub-components: (i) risk of expropriation or contract viability; (ii) payment delays; and (iii) repatriation of profits. Each sub-component is scored on a scale from zero [very high risk] to four [very low risk].
Currency Volatility
The standard deviation of the first-difference of the monthly natural logarithm of the bilateral nominal exchange rate in the five years preceding year t. (Source: Datastream)
Pegged Exchange Rate
A country-pair is classified as pegged exchange rate if the absolute value of the bilateral nominal exchange rate returns is less than 0.001 for 12 months continuously. (Source: Datastream)
(Interest rate)j-i
The differences between acquirer (j) and target (i) firm’s country of domicile in the deposit interest rate. (Source: World Bank Development Indicators)
Panel B Deal-level variables
Value of transaction
Total value of consideration paid by the acquirer, excluding fees and expenses, adjusted to 2008 constant dollars using U.S. city average consumer price index (CPI-U) published by Bureau of Labor Statistics. (Source: SDC Mergers and Corporate Transactions database)
Public target (acquirer)
Target (Acquirer) is a public firm if its public status is “Public” or if its SEDOL is non-missing. (Source: SDC Mergers and Corporate Transactions database)
Cross-border deal
A deal occurs cross-border if target nation is different from that of acquirer’s ultimate parents. (Source: SDC Mergers and Corporate Transactions database)
Related industry
Target firms are in the same industries as acquirers if any line of business the target firm is in (TSIC2) overlaps with that of acquirer (ASIC2). (Source: SDC Mergers and Corporate Transactions database)
Same Region A dummy variable equals 1 if the acquirer (j) and target (i) firm’s country of domicile is located in the same broadly defined continent (Africa, America, Asia, Europe). (Source: World Factbook)
5-49% stakes (50-99%, 100%)
Dummy variable equals 1 if the number of common shares acquired in the transaction plus any shares previously owned by the acquirer divided by the total number of shares outstanding is between 5 and 50 percent. (Source: SDC Mergers and Corporate Transactions database)
Cash (Stock) Deals
A deal is classified as a cash (stock) deal if more than 50% of the deal value is paid in cash (stock). (Source: SDC Mergers and Corporate Transactions database)
Failed Deals Dummy variable equals 1 if the deal is withdrawn. (Source: SDC Mergers and Corporate Transactions database)
(Firm USR12)j-i
The difference between the acquirer (j) and target firm (i) in annual real stock market return in US$. We obtain total return indices in US$ for all public firms (Datastream code: RI) and deflate these indices using the 2000 Consumer Price Index (CPI) in US$ to calculate real stock returns. (Source: Datastream)
(Industry R12)j-i
The difference between the acquirer (j) and target firm (i)’s primary industry in the annual local real stock market return. We calculate value-weighted annual local real stock market return for 48 Fama-French industries of each country. (Source: Datastream and Professor Kenneth French’s website at Dartmouth University, http://mba.tuck.dartmouth.edu/pages/faculty/ken.french/index.html)
Total assets (log)
Book value of total assets in millions of constant 2000 U.S. dollars (WC07230). (Source: Worldscope)
Return on assets
(Net Income before Preferred Dividends + ((Interest Expense on Debt—Interest Capitalized ) * (1-Tax Rate)) / Average of Last Year's and Current Year's (Total Capital + Last Year's Short Term Debt & Current Portion of Long Term Debt) * 100 (WC08376). (Source: Worldscope)
Long-term debt/assets
Ratio of long-term debt to book value of assets (WC03251/WC02999). (Source: Worldscope)
Sales growth Two-year local country CPI inflation-adjusted sales growth (WC01001). (Source: Worldscope)
Cash/Asset Ratio of cash and liquid assets to book value of assets (WC02001/WC02501). (Source: Worldscope)
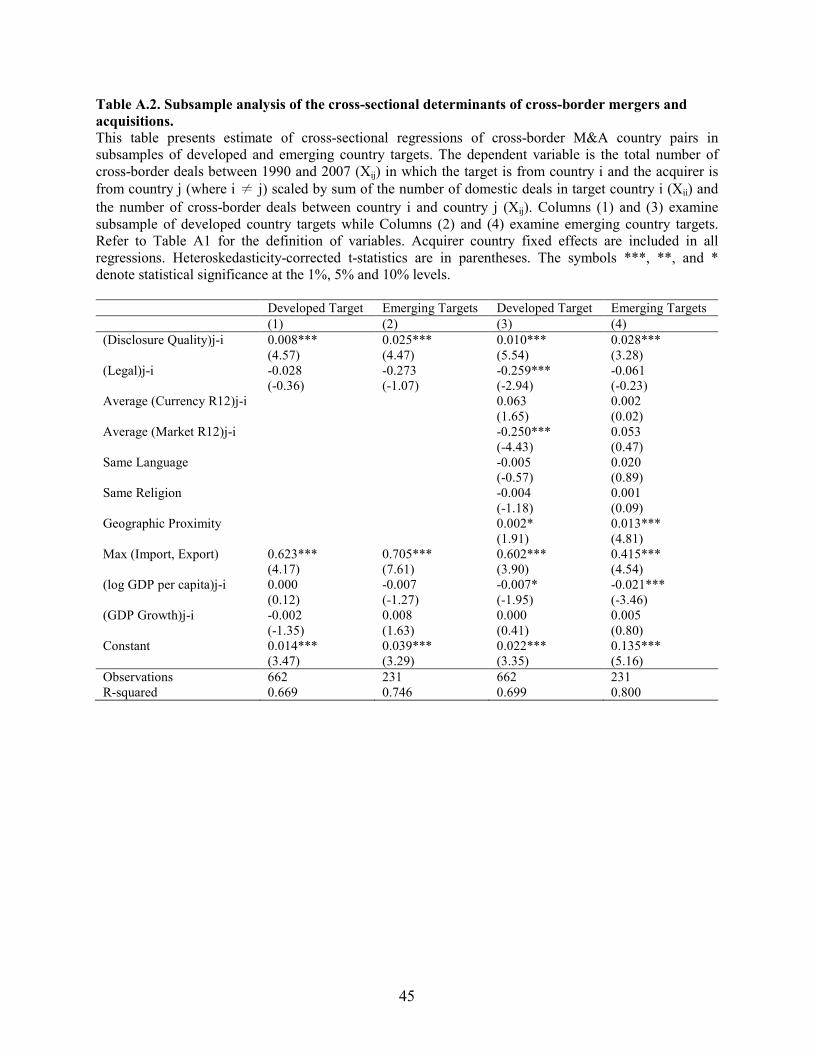
45
Table A.2. Subsample analysis of the cross-sectional determinants of cross-border mergers and
acquisitions.
This table presents estimate of cross-sectional regressions of cross-border M&A country pairs in subsamples of developed and emerging country targets. The dependent variable is the total number of cross-border deals between 1990 and 2007 (Xij) in which the target is from country i and the acquirer is
from country j (where i ≠ j) scaled by sum of the number of domestic deals in target country i (Xii) and
the number of cross-border deals between country i and country j (Xij). Columns (1) and (3) examine subsample of developed country targets while Columns (2) and (4) examine emerging country targets. Refer to Table A1 for the definition of variables. Acquirer country fixed effects are included in all regressions. Heteroskedasticity-corrected t-statistics are in parentheses. The symbols ***, **, and * denote statistical significance at the 1%, 5% and 10% levels.
Developed Target Emerging Targets Developed Target Emerging Targets
(1) (2) (3) (4)
(Disclosure Quality)j-i 0.008*** 0.025*** 0.010*** 0.028*** (4.57) (4.47) (5.54) (3.28) (Legal)j-i -0.028 -0.273 -0.259*** -0.061 (-0.36) (-1.07) (-2.94) (-0.23) Average (Currency R12)j-i 0.063 0.002 (1.65) (0.02) Average (Market R12)j-i -0.250*** 0.053 (-4.43) (0.47) Same Language -0.005 0.020 (-0.57) (0.89) Same Religion -0.004 0.001 (-1.18) (0.09) Geographic Proximity 0.002* 0.013*** (1.91) (4.81) Max (Import, Export) 0.623*** 0.705*** 0.602*** 0.415*** (4.17) (7.61) (3.90) (4.54) (log GDP per capita)j-i 0.000 -0.007 -0.007* -0.021*** (0.12) (-1.27) (-1.95) (-3.46) (GDP Growth)j-i -0.002 0.008 0.000 0.005 (-1.35) (1.63) (0.41) (0.80) Constant 0.014*** 0.039*** 0.022*** 0.135*** (3.47) (3.29) (3.35) (5.16)
Observations 662 231 662 231 R-squared 0.669 0.746 0.699 0.800
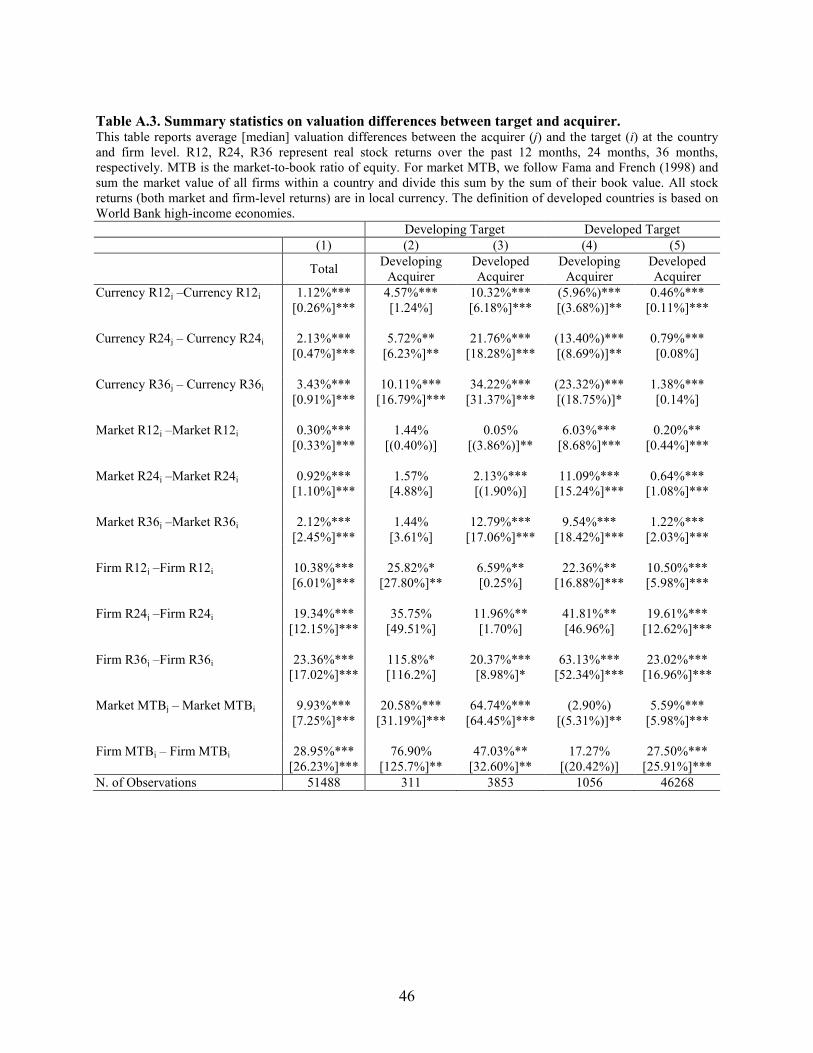
46
Table A.3. Summary statistics on valuation differences between target and acquirer. This table reports average [median] valuation differences between the acquirer (j) and the target (i) at the country and firm level. R12, R24, R36 represent real stock returns over the past 12 months, 24 months, 36 months, respectively. MTB is the market-to-book ratio of equity. For market MTB, we follow Fama and French (1998) and sum the market value of all firms within a country and divide this sum by the sum of their book value. All stock returns (both market and firm-level returns) are in local currency. The definition of developed countries is based on World Bank high-income economies.
Developing Target Developed Target
(1) (2) (3) (4) (5)
Total Developing
Acquirer Developed Acquirer
Developing Acquirer
Developed Acquirer
Currency R12j –Currency R12i 1.12%*** 4.57%*** 10.32%*** (5.96%)*** 0.46%*** [0.26%]*** [1.24%] [6.18%]*** [(3.68%)]** [0.11%]*** Currency R24j – Currency R24i 2.13%*** 5.72%** 21.76%*** (13.40%)*** 0.79%*** [0.47%]*** [6.23%]** [18.28%]*** [(8.69%)]** [0.08%] Currency R36j – Currency R36i 3.43%*** 10.11%*** 34.22%*** (23.32%)*** 1.38%*** [0.91%]*** [16.79%]*** [31.37%]*** [(18.75%)]* [0.14%] Market R12j –Market R12i 0.30%*** 1.44% 0.05% 6.03%*** 0.20%** [0.33%]*** [(0.40%)] [(3.86%)]** [8.68%]*** [0.44%]*** Market R24j –Market R24i 0.92%*** 1.57% 2.13%*** 11.09%*** 0.64%*** [1.10%]*** [4.88%] [(1.90%)] [15.24%]*** [1.08%]*** Market R36j –Market R36i 2.12%*** 1.44% 12.79%*** 9.54%*** 1.22%*** [2.45%]*** [3.61%] [17.06%]*** [18.42%]*** [2.03%]*** Firm R12j –Firm R12i 10.38%*** 25.82%* 6.59%** 22.36%** 10.50%*** [6.01%]*** [27.80%]** [0.25%] [16.88%]*** [5.98%]*** Firm R24j –Firm R24i 19.34%*** 35.75% 11.96%** 41.81%** 19.61%*** [12.15%]*** [49.51%] [1.70%] [46.96%] [12.62%]*** Firm R36j –Firm R36i 23.36%*** 115.8%* 20.37%*** 63.13%*** 23.02%*** [17.02%]*** [116.2%] [8.98%]* [52.34%]*** [16.96%]*** Market MTBj – Market MTBi 9.93%*** 20.58%*** 64.74%*** (2.90%) 5.59%*** [7.25%]*** [31.19%]*** [64.45%]*** [(5.31%)]** [5.98%]*** Firm MTBj – Firm MTBi 28.95%*** 76.90% 47.03%** 17.27% 27.50%*** [26.23%]*** [125.7%]** [32.60%]** [(20.42%)] [25.91%]***
N. of Observations 51488 311 3853 1056 46268
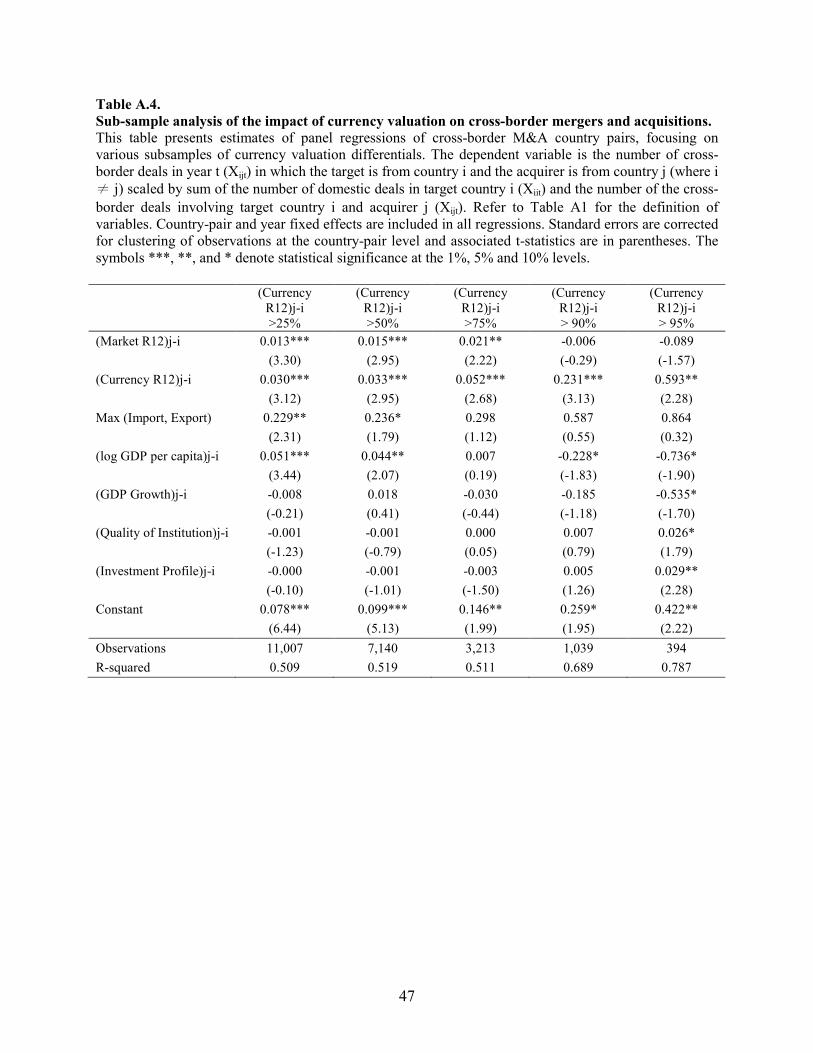
47
Table A.4.
Sub-sample analysis of the impact of currency valuation on cross-border mergers and acquisitions.
This table presents estimates of panel regressions of cross-border M&A country pairs, focusing on various subsamples of currency valuation differentials. The dependent variable is the number of cross-border deals in year t (Xijt) in which the target is from country i and the acquirer is from country j (where i
≠ j) scaled by sum of the number of domestic deals in target country i (Xiit) and the number of the cross-
border deals involving target country i and acquirer j (Xijt). Refer to Table A1 for the definition of variables. Country-pair and year fixed effects are included in all regressions. Standard errors are corrected for clustering of observations at the country-pair level and associated t-statistics are in parentheses. The symbols ***, **, and * denote statistical significance at the 1%, 5% and 10% levels.
(Currency R12)j-i >25%
(Currency R12)j-i >50%
(Currency R12)j-i >75%
(Currency R12)j-i > 90%
(Currency R12)j-i > 95%
(Market R12)j-i 0.013*** 0.015*** 0.021** -0.006 -0.089
(3.30) (2.95) (2.22) (-0.29) (-1.57)
(Currency R12)j-i 0.030*** 0.033*** 0.052*** 0.231*** 0.593**
(3.12) (2.95) (2.68) (3.13) (2.28)
Max (Import, Export) 0.229** 0.236* 0.298 0.587 0.864
(2.31) (1.79) (1.12) (0.55) (0.32)
(log GDP per capita)j-i 0.051*** 0.044** 0.007 -0.228* -0.736*
(3.44) (2.07) (0.19) (-1.83) (-1.90)
(GDP Growth)j-i -0.008 0.018 -0.030 -0.185 -0.535*
(-0.21) (0.41) (-0.44) (-1.18) (-1.70)
(Quality of Institution)j-i -0.001 -0.001 0.000 0.007 0.026*
(-1.23) (-0.79) (0.05) (0.79) (1.79)
(Investment Profile)j-i -0.000 -0.001 -0.003 0.005 0.029**
(-0.10) (-1.01) (-1.50) (1.26) (2.28)
Constant 0.078*** 0.099*** 0.146** 0.259* 0.422**
(6.44) (5.13) (1.99) (1.95) (2.22)
Observations 11,007 7,140 3,213 1,039 394
R-squared 0.509 0.519 0.511 0.689 0.787
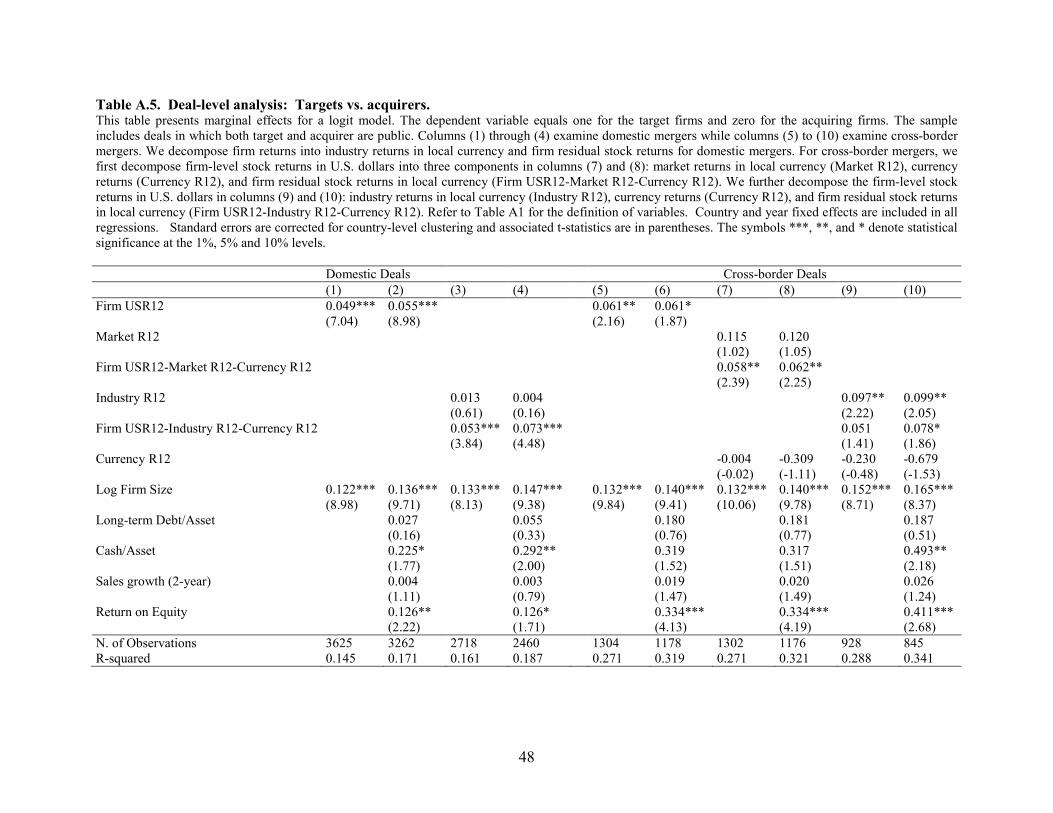
48
Table A.5. Deal-level analysis: Targets vs. acquirers. This table presents marginal effects for a logit model. The dependent variable equals one for the target firms and zero for the acquiring firms. The sample includes deals in which both target and acquirer are public. Columns (1) through (4) examine domestic mergers while columns (5) to (10) examine cross-border mergers. We decompose firm returns into industry returns in local currency and firm residual stock returns for domestic mergers. For cross-border mergers, we first decompose firm-level stock returns in U.S. dollars into three components in columns (7) and (8): market returns in local currency (Market R12), currency returns (Currency R12), and firm residual stock returns in local currency (Firm USR12-Market R12-Currency R12). We further decompose the firm-level stock returns in U.S. dollars in columns (9) and (10): industry returns in local currency (Industry R12), currency returns (Currency R12), and firm residual stock returns in local currency (Firm USR12-Industry R12-Currency R12). Refer to Table A1 for the definition of variables. Country and year fixed effects are included in all regressions. Standard errors are corrected for country-level clustering and associated t-statistics are in parentheses. The symbols ***, **, and * denote statistical significance at the 1%, 5% and 10% levels.
Domestic Deals Cross-border Deals
(1) (2) (3) (4) (5) (6) (7) (8) (9) (10)
Firm USR12 0.049*** 0.055*** 0.061** 0.061* (7.04) (8.98) (2.16) (1.87) Market R12 0.115 0.120 (1.02) (1.05) Firm USR12-Market R12-Currency R12 0.058** 0.062** (2.39) (2.25) Industry R12 0.013 0.004 0.097** 0.099** (0.61) (0.16) (2.22) (2.05) Firm USR12-Industry R12-Currency R12 0.053*** 0.073*** 0.051 0.078* (3.84) (4.48) (1.41) (1.86) Currency R12 -0.004 -0.309 -0.230 -0.679 (-0.02) (-1.11) (-0.48) (-1.53) Log Firm Size 0.122*** 0.136*** 0.133*** 0.147*** 0.132*** 0.140*** 0.132*** 0.140*** 0.152*** 0.165*** (8.98) (9.71) (8.13) (9.38) (9.84) (9.41) (10.06) (9.78) (8.71) (8.37) Long-term Debt/Asset 0.027 0.055 0.180 0.181 0.187 (0.16) (0.33) (0.76) (0.77) (0.51) Cash/Asset 0.225* 0.292** 0.319 0.317 0.493** (1.77) (2.00) (1.52) (1.51) (2.18) Sales growth (2-year) 0.004 0.003 0.019 0.020 0.026 (1.11) (0.79) (1.47) (1.49) (1.24) Return on Equity 0.126** 0.126* 0.334*** 0.334*** 0.411*** (2.22) (1.71) (4.13) (4.19) (2.68)
N. of Observations 3625 3262 2718 2460 1304 1178 1302 1176 928 845 R-squared 0.145 0.171 0.161 0.187 0.271 0.319 0.271 0.321 0.288 0.341