Embed Size (px)
Citation preview
Cross-border mergers and acquisitions:does the exchange rate matter? Someevidence for Canada
George J. Georgopoulos Economics, Atkinson Faculty ofLiberal and Professional Studies,York University
Abstract. Theoretical and empirical studies investigating the relationship between the ex-change rate and FDI have generated mixed results. Using bilateral Canadian-U.S. industrylevel count data on cross-border mergers and acquisitions (M&As) and conditioning onindustry tariff rates, value added share of industries, industry M&A trend activity, andthe number of establishments, we find evidence that a real dollar depreciation of the homecurrency leads to an increase in the probability of foreign M&As but only in high R&Dindustries. These empirical results are consistent with Blonigen’s asset acquisition hypoth-esis. Results on European M&As of Canadian firms also lean towards this result. JELclassification: F21, F41
Fusions et acquisitions trans-frontalieres: est-ce que le taux de change a de l’importance?Quelques resultats pour le Canada. Les etudes theoriques et empiriques de la relationentre taux de change et investissement direct a l’etranger donnent des resultats mixtes. Al’aide de donnees bilaterales canado-americaines au niveau de l’industrie, pour les fusionset acquisitions (F&A) transfrontalieres, et de certaines conditions imposees aux tarifsdouaniers au niveau industriel, a la part de la valeur ajoutee des industries, a la tendance desF&A au niveau industriel, et au nombre des etablissements, on montre qu’une depreciationde la devise nationale en termes de dollars reels entraıne un accroissement de la probabilitede F&A etrangeres mais seulement dans les industries a forte intensite de R&D. Cesresultats empiriques sont compatibles avec l’hypothese d’acquisition d’actifs de Blonigen.Les resultats quant aux F&A europeennes de firmes canadiennes tendent a supporter ceresultat.
I am grateful to Bruce Blonigen, Bernardo Blum, John D. Daniels, and Walid Hejazi for usefulcomments. Of course, all remaining errors are mine. Email: [email protected]
Canadian Journal of Economics / Revue canadienne d’Economique, Vol. 41, No. 2May / mai 2008. Printed in Canada / Imprime au Canada
0008-4085 / 08 / 450–474 / C© Canadian Economics Association
Cross-border mergers and acquisitions 451
1. Introduction
The decline in the value of the Canadian dollar relative to the U.S. dollar overthe late 1980s and 1990s raised concerns that Canadian firms were vulnerablefor takeover by U.S. firms at ‘fire sale’ prices. Descriptive data on the numberof U.S. mergers and acquisitions (hereafter M&As) in Canada lend support tothis claim. While the value of the Canadian dollar declined over 1994–2000, thenumber of U.S. M&As increased from 168 in 1994 to 300 in 2000, with associatedreal transaction values of CDN $5.3 billion and CDN $24.1 billion, respectively(Investment Review, Statistics Canada).
Theories on a link between exchange rates and cross-border M&As provideambiguous predictions. One view is that there is no link. While a Canadian dol-lar depreciation relative to the U.S. dollar reduces the cost for U.S. firms ofacquiring Canadian assets, the revenues from these assets operating in Canadaare denominated in Canadian dollars. Upon repatriating the revenues, conver-sion into U.S. dollars at the lower rate of exchange of U.S. dollars for Canadiandollars offsets the cost reduction of the purchase. Thus there is no net impact ofa Canadian dollar depreciation on cross-border takeovers. This view treats theasset as financial in nature, whereby costs and revenues are generated in only onecurrency.
A second view identifies the asset as a factor input that is transferable, suchas technology, whereby it can generate revenues in another currency. Blonigen(1997) proposes such a theory, where the target firm has an innovation or a firmspecific asset. This ‘asset acquisition’ theory relies on the assumption of marketsegmentation or imperfect markets for goods. Blonigen applied this theory tothe case of Japanese M&As of U.S. firms, partly motivated by the fact that theJapanese market was relatively insulated from foreign penetration. The level ofimports from the U.S. and the number of U.S. multinationals in Japan over the1980s were relatively low. Blonigen’s assumption of market segmentation wouldthus well apply to the U.S.-Japan case.
This paper tests Blonigen’s asset acquisition hypothesis by assessing the em-pirical connection between the exchange rate and cross-border M&As, focusingon Canadian inward and outward M&A data. No other similar study has usedCanadian data. In using Canadian data, this study will look at whether Blonigen’stheory holds generally, or holds exclusively only in the case of pronounced mar-ket segmentation, as in the U.S.-Japan case. While in the U.S.-Japan case market,imperfect markets were mainly in the form of import restrictions and restrictionson foreign multinational presence, there are other forms of market segmentationsuch as established distributional or marketing networks in the acquiring firm’scountry or agglomeration advantages that the acquiring firm has in its country.These other forms of market segmentation yield greater profitable opportunitiesfor the acquiring firm in its country relative to a foreign firm. Any such form ofmarket segmentation will produce the Blonigen effect. We thus test whether theBlonigen result holds more broadly by using Canadian M&A data. Furthermore,
452 G.J. Georgopoulos
whereas Blonigen uses Japanese M&As in the U.S., this study looks at bilateralCanada-U.S. M&A data, along with European M&As in Canada in testing theasset acquisition hypothesis.
Random and fixed-effects negative binomial approaches are employed tomodel Canada-U.S. bilateral M&A count data. Explanatory variables includethe industry-specific real exchange rate, along with traditional determinants ofM&As. To further lend support to the acquisition hypothesis, we also look at therole of the exchange rate on European M&As of Canadian firms. As a robustnesscheck, we investigate whether the exchange rate has a similar role on greenfieldinvestments.
The following results emerge. There is support for Blonigen’s asset acquisitionhypothesis, as results from Canadian-U.S. bilateral data show that a home countrycurrency deprecation will increase the probability of a foreign M&A only inhigh R&D intensity industries. Results from greenfield investments show thatthe exchange rate does not play a role for high R&D industries.
The organization of the paper is as follows. Section 2 reviews the literatureon the theoretical link between exchange rates and foreign direct investment(hereafter FDI). Section 3 presents data trends on Canadian and U.S. M&A andgreenfield counts. Section 4 outlines the econometric methodology and presentsthe determinants of cross-border M&As and the data used. Section 5 providesthe empirical results. Section 6 concludes.
2. Exchange rate - FDI link and related literature
Motives for FDI are organized around a framework that outlines the advantagesand conditions under which FDI will occur in light of the inherent disadvantagesand higher costs of foreign production. Early conceptualization of this frameworkincludes Dunning’s development of the ownership-location-internationalization(OLI) framework (1988, 2001). Models that formalize these motives includeMarkusen (1984; developing a horizontal model of FDI) and Helpman (1984;model of vertical FDI). Markusen, Venables, and Zhang (1996) and Markusen(1997) developed a ‘knowledge-capital’ model, which provides a framework thatintegrates vertical and horizontal motives for FDI; Carr, Markusen, and Maskus(2001) provide the first empirical investigation of the predictions from this model.The models mentioned above attempt the difficult task of deriving general equi-librium models of FDI behaviour.1
In this paper we employ a partial equilibrium framework in empirically mod-elling FDI, focusing on the role of the exchange rate. Furthermore we focus onone form of FDI, that being cross-border M&As. Cross-border M&As offer twomain advantages over start-up or greenfield investments. One advantage is greaterspeed in gaining market presence. A second advantage is access to proprietary as-sets. The target firm may have an asset that is not tangible or licensable, such as a
1 See Blonigen, Davies and Head (2003) on issues concerning the empirical model of Carr et al.(2001).
Cross-border mergers and acquisitions 453
scientific technology, a management or organizational skill and/or marketing ex-pertise. This asset acquisition motivation underlies the exchange rate cross-borderM&A link.
Explanations for exchange rate effects on FDI typically divide into two cate-gories, relative wage effects (Caves 1989) and relative wealth effects (asymmetricinformation in capital markets: Froot and Stein 1989; stock market performances:Klein and Rosengreen 1994 and Dewenter 1995). Both sets of theories predictthat a currency depreciation will lead to increased inward FDI.
A shortcoming of the relative wage and wealth explanations is their inherentassumption that only the price of the asset matters in locating abroad, whereas therelevant factor is the rate of return. Blonigen (1997) overcomes this issue, provid-ing both theoretical and empirical evidence in support of an inverse relationshipbetween a domestic country’s currency value and the amount of foreign acquisi-tions of domestic firms. His theory assumes that FDI is motivated by acquiringfirm-specific assets that are transferable. Blonigen’s theory relies on the assump-tion of imperfect goods markets, where the domestic firm has limited access tothe foreign market to sell its product. For example, suppose a U.S. firm and aCanadian firm have equal opportunity to purchase a Canadian firm possessing atransferable technology. A depreciation of the Canadian dollar will increase thepresent discounted profits of the U.S. firm as the cost of acquiring the Canadianfirm decreases. The present discounted value of profits for the Canadian acquir-ing firm does not change or changes marginally because it has no or limitedaccess to the U.S. market as a result of imperfect goods markets. This may be dueto superior or established networks of the U.S. firm in the U.S. in the form ofbuyer and seller relationships and distributional networks (Greaney 2003; Rauchand Watson 2005; Helliwell 2002; Head, Ries, and Spencer 2002). It may also bethat only the U.S. firm is part of a cluster or an agglomeration, where the U.S.firm’s potential profitability from the acquired Canadian firm is higher, owingto knowledge spillovers from localized related industries and research centres. Ingeneral, a U.S. firm is more familiar with the workings of the U.S. market relativeto a Canadian firm and will have more profitable opportunities. Therefore, thepotential Canadian target firm will be more valuable to the U.S. firm than tothe Canadian firm following a Canadian dollar depreciation. Using count dataon the number of Japanese M&As of U.S. firms over 1975–92, Blonigen findsthat a U.S. dollar depreciation increases the likelihood of Japanese M&As in U.S.industries, particularly in those that are R&D intensive.
The acquisition hypothesis presumes that the technology is transferred to theU.S. after the Canadian firm is acquired. This seems intuitive and is supported byMcFetridge (1987), Caves (1996), and Van Pottelsberghe and Lichtenberg (2001)who show that technology is quickly transferred back to the parent company’smarket.
The literature concerning Canadian studies is sparse. Schembri (2002) andAba and Mintz (2002) plot the net annual value of acquisition flows (value offoreign acquisitions of Canadian assets less value of Canadian acquisition offoreign assets) over 1975–2000. The data show no overwhelming evidence of a
454 G.J. Georgopoulos
positive trend over the 1990s. Neither study, however, investigates the role of theCanada-U.S. exchange rate to U.S. cross-border M&As while conditioning onother determinants; that is, neither employs a formal econometric model.2
Lafrance and Tessier (2001) employ Vector Autoregression (VAR) analysis,where the VAR contains Canadian inward FDI flows, the real exchange rate, anda measure of exchange rate volatility. Using the sample period 1970:1-2000:1,they find that the level of the real exchange rate Granger causes inward FDI,although the result was not robust to the introduction of the ratio of undistributedcorporate profits to GNP. A shortcoming of the Granger technique is that it doesnot provide an estimate of the direction or magnitude of the exchange rate-FDIrelationship. Furthermore their paper does not distinguish between M&A andgreenfield investments.
An extensive study on the role of the exchange rate on cross-border M&As ininvolving Canada has not been done. This paper fills this void. Using bilateralcount data on the number of cross-border M&As between Canada and the U.S.,along with European M&As of Canadian firms, Blonigen’s asset acquisitionhypothesis is tested. Robustness checks are also conducted by looking at the roleof the exchange rate on greenfield acquisitions.
3. Merger and acquisition trends in Canada
According to the World Investment Report (UNCTAD 2000), cross-borderM&As were the major driving force in the substantial increase in FDI over thelate 1990s. During the span of 1999, cross-border M&As increased by 3%, rep-resenting over one-third of total FDI for that year. Of all M&A transactions,approximately 3% were in the form of mergers and 97% were in the form of ac-quisitions. Among developed countries, approximately 85% of total FDI is in theform of cross-border M&As.
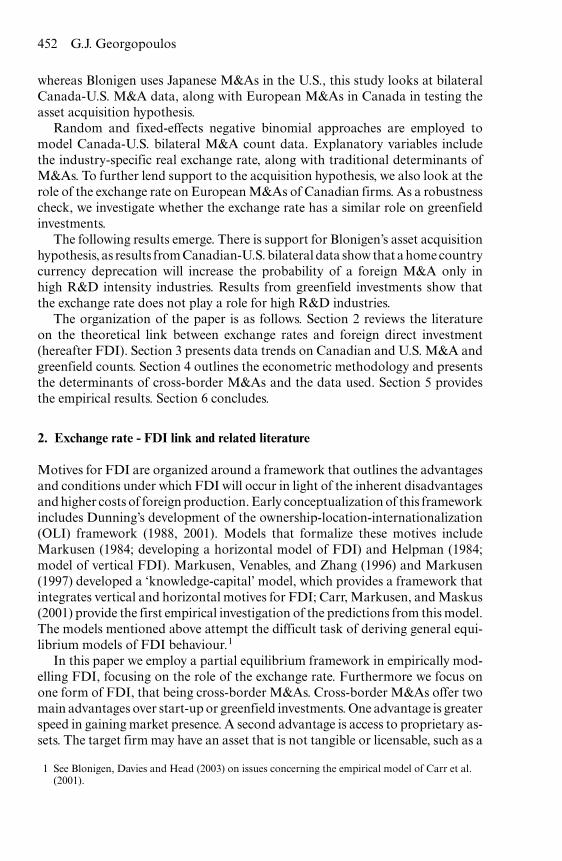
Table 1 presents bilateral data of U.S. and Canadian FDI, by M&As andgreenfield investments, where it shows FDI data in all industries, high R&Dmanufacturing and low R&D manufacturing.3 A few patterns emerge from thedata. First, there are considerably more M&A investments than greenfield invest-ments by both countries. Second, acquisitions fluctuate more from year to yearthan the start-up of new establishments. Third, there are more transactions in low
2 Moreover, Aba and Mintz (2002) do not consider the possibility that Canadian acquisitions offoreign firms may have resulted from a Canadian dollar appreciation relative to the associatedcountries. For example, the Canadian dollar generally appreciated relative to the English Pound,the German Mark and the French Franc and Japanese Yen over the latter part of the 1990s, thuspotentially explaining Canadian M&As in these countries. Also, in using values of transactions,this may lead to one or two large value transactions dominating the total value of transactions,which would then misrepresent net M&A activity between the two countries. This issue isavoided when looking at the number of transactions (count data).
3 In this study all data on M&As and greenfields exclude governmental service industries. Highand Low R&D manufacturing groupings are defined in Section 5.
Cross-border mergers and acquisitions 455
456 G.J. Georgopoulos
R&D manufacturing industries than high R&D industries, partly because thereare more industries in the former group. This analysis will determine whether theexchange rate has differential effects between these two groups.
The table also shows that the Canadian dollar depreciated significantly from1991 to 1992 and continued to do so over the latter part of the 1990s up to 2001.The data roughly suggest an association between the value of the Canadian dol-lar and the number of U.S. M&As, as the number of M&As generally increasedover the periods of depreciations. U.S. greenfield investments seem less respon-sive, generally showing a slight decline over the 1990s relative to the 1980s. Thisindicates possible differential responses of M&As and greenfields to exchangerate changes. Both forms of Canadian FDI seem more stable relative to the U.S.numbers, although Canadian greenfields have declined noticeably since the late1990s.
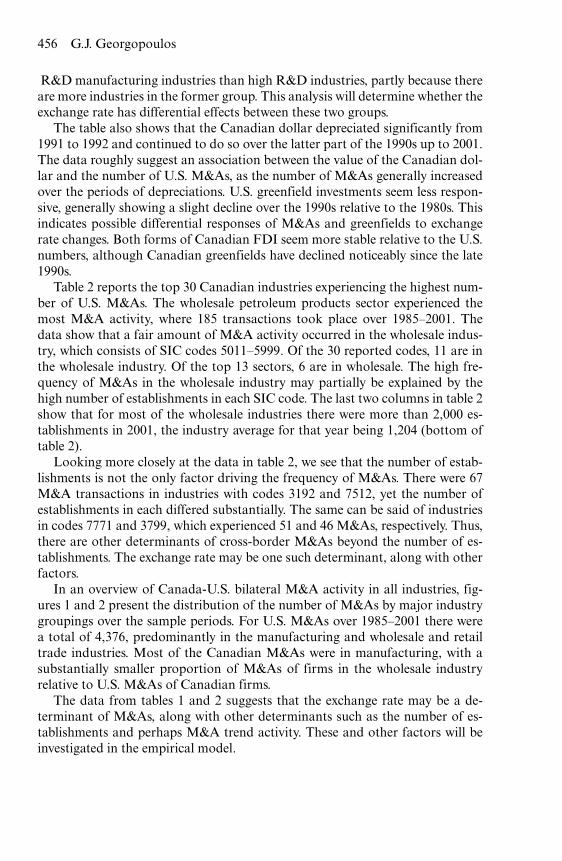
Table 2 reports the top 30 Canadian industries experiencing the highest num-ber of U.S. M&As. The wholesale petroleum products sector experienced themost M&A activity, where 185 transactions took place over 1985–2001. Thedata show that a fair amount of M&A activity occurred in the wholesale indus-try, which consists of SIC codes 5011–5999. Of the 30 reported codes, 11 are inthe wholesale industry. Of the top 13 sectors, 6 are in wholesale. The high fre-quency of M&As in the wholesale industry may partially be explained by thehigh number of establishments in each SIC code. The last two columns in table 2show that for most of the wholesale industries there were more than 2,000 es-tablishments in 2001, the industry average for that year being 1,204 (bottom oftable 2).
Looking more closely at the data in table 2, we see that the number of estab-lishments is not the only factor driving the frequency of M&As. There were 67M&A transactions in industries with codes 3192 and 7512, yet the number ofestablishments in each differed substantially. The same can be said of industriesin codes 7771 and 3799, which experienced 51 and 46 M&As, respectively. Thus,there are other determinants of cross-border M&As beyond the number of es-tablishments. The exchange rate may be one such determinant, along with otherfactors.
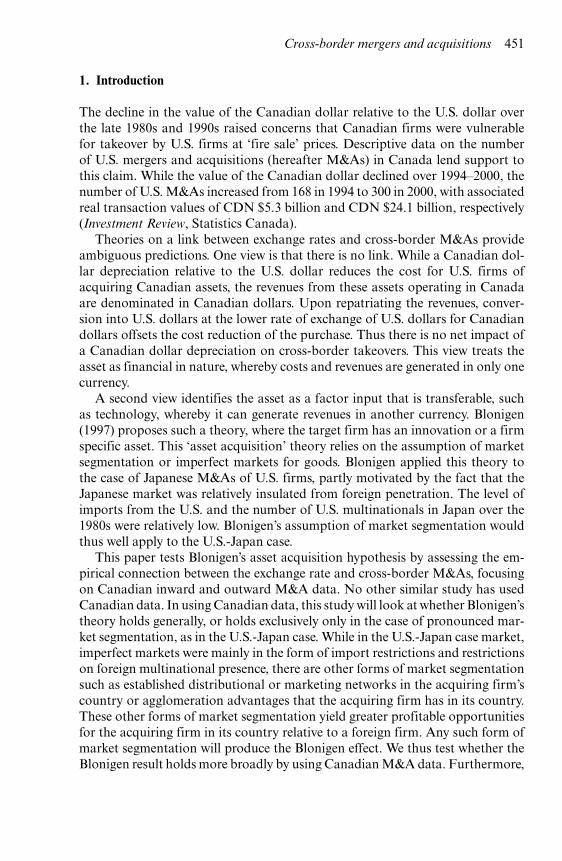
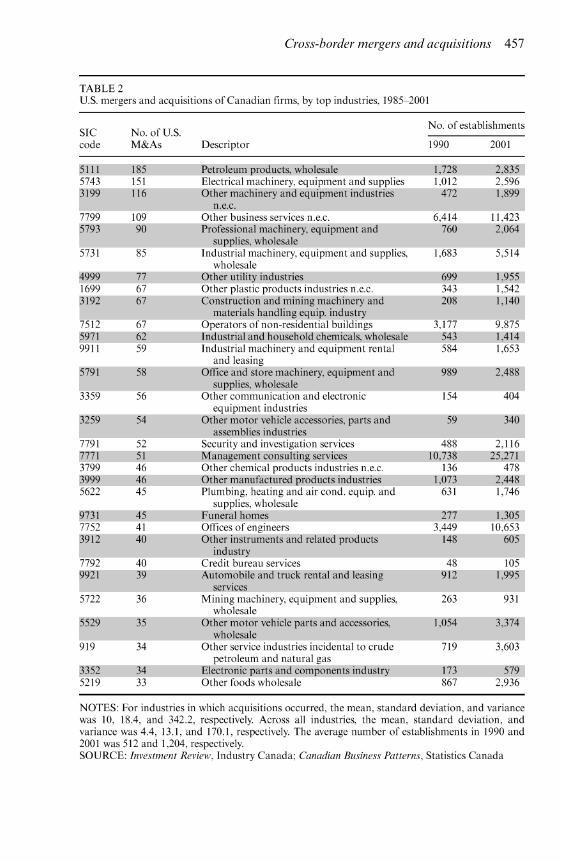
In an overview of Canada-U.S. bilateral M&A activity in all industries, fig-ures 1 and 2 present the distribution of the number of M&As by major industrygroupings over the sample periods. For U.S. M&As over 1985–2001 there werea total of 4,376, predominantly in the manufacturing and wholesale and retailtrade industries. Most of the Canadian M&As were in manufacturing, with asubstantially smaller proportion of M&As of firms in the wholesale industryrelative to U.S. M&As of Canadian firms.
The data from tables 1 and 2 suggests that the exchange rate may be a de-terminant of M&As, along with other determinants such as the number of es-tablishments and perhaps M&A trend activity. These and other factors will beinvestigated in the empirical model.
Cross-border mergers and acquisitions 457
458 G.J. Georgopoulos
FIGURE 1 Number of U.S. acquisitions of Canadian firms by major industry, groupings, 1985–2001 (total number: 4,376)
FIGURE 2 Number of Canadian acquisitions of U.S. firms by major industry, groupings, 1987–2001 (total number: 939)
4. Empirical model and data
The random effects negative binomial (hereafter RENegbin) model proposed byHausman, Hall, and Griliches (1984) is employed to model the determinantsof the number of cross-border M&As. As opposed to the Poisson model, theRENegbin model allows for the conditional expected value and the varianceof the number of M&As to differ, that is, allowing for overdispersion. Giventhe panel nature of the data used here, the RENegbin model allows dispersionto vary randomly across industries. Hausman tests are presented to determinewhether the fixed effects negative binomial model is more appropriate than therandom effects model.4 Appendix 1 discusses the RENegbin model in moredetail.
We begin with U.S. M&As of Canadian firms. The dependent variable is thenumber of U.S. M&As of Canadian firms at the 4-digit SIC level, excludinggovernment services industries. There are 400 balanced panels of industry clas-sifications.5 See appendix B for details about the collection of these and otherdata.
4 Hausman, et al. (1984) state that the RENegbin model yields asymptotically more efficientestimators than their fixed effects model. For these results to be consistent, the industry-specificeffects need to be uncorrelated with the regressors.
5 The number of panels used was constrained by the fixed effects estimation methodology. Thismethodology removes the fixed effects by conditioning on the number of positive outcomeswithin each panel. Therefore if all the outcomes for the dependent variable are zero (or alloutcomes of the dependent variable are the same) for a particular panel, then that panel doesnot contribute to the likelihood function and it is dropped from the sample set. For direct
Cross-border mergers and acquisitions 459
The regressors chosen generally follow Blonigen (1997). The industry-specificreal exchange rate is constructed using the nominal Canadian dollars per U.S.dollar exchange rate, and 2-digit SIC price indexes for the U.S. and Canada.Concordance tables from Statistics Canada were used to match Canadian 1980SIC codes with U.S. 1987 SIC codes. An increase in the industry-specific realexchange rate reflects a real Canadian dollar depreciation. According to the assetacquisition hypothesis, such a depreciation should be positively correlated withthe dependent variable.
Cross-border M&As may result from foreign firms avoiding tariffs and otherrestrictions that nations impose on imports. Thus, cross-border M&As are alter-native strategies to penetrate a domestic market. This strategy effect is capturedby including effective Canadian tariff rates on imports from the U.S. at the 4-digitSIC level. A positive correlation between this variable and the dependent variableis expected.
To account for factors affecting U.S. demand for Canadian firms, the growthrate of U.S. real GDP and the share of value added output to total GDPof U.S. industry i at the 2-digit SIC level were employed. Concordance ta-bles were used for the latter variable. These demand factors may reflect hor-izontal mergers as firms seek to achieve greater market presence and power.The demand variables should positively affect the number of U.S. M&As inCanada.
For supply variables, as is illustrated in table 2, the larger the sector size mea-sured by the number of establishments, the higher the probability of a U.S. ac-quisition, ceteris paribus. Thus, we include the total number of Canadian es-tablishments at the 4-digit SIC level. To capture the overall climate of M&Aactivity in Canada, the number of M&As of Canadian firms by Canadian firmsat the 4-digit SIC level is included. A positive climate of M&A opportunitiesin Canada should be reflected by a high amount of M&As by Canadian firms.A positive climate should also increase the probability of an acquisition by aU.S. firm. Thus, there should be a positive correlation between the number ofCanadian M&As and U.S. M&As. This supply variable should be positively cor-related with the dependent variable.6 Finally, to capture wealth effects from thestock market, we include Morgan Stanley’s growth in market capitalization forthe U.S.
comparison, we use the same fixed effects sample set as for the random effects estimation.Although not reported here, the random effects results from the unrestricted (larger) sample setare similar to the random effects results from the restricted sample set reported in Tables 3-5; theresults are robust. The results from the unrestricted random effects model are available uponrequest.
6 As does this paper, Blonigen (1997) uses a similar real exchange rate, along with the two demandvariables and the number of domestic M&As. A notable difference is that Blonigen’s acquisitiondata are at the 3 digit level, whereas the U.S. acquisition of Canadian firms used in this study areat the 4 digit level.
460 G.J. Georgopoulos
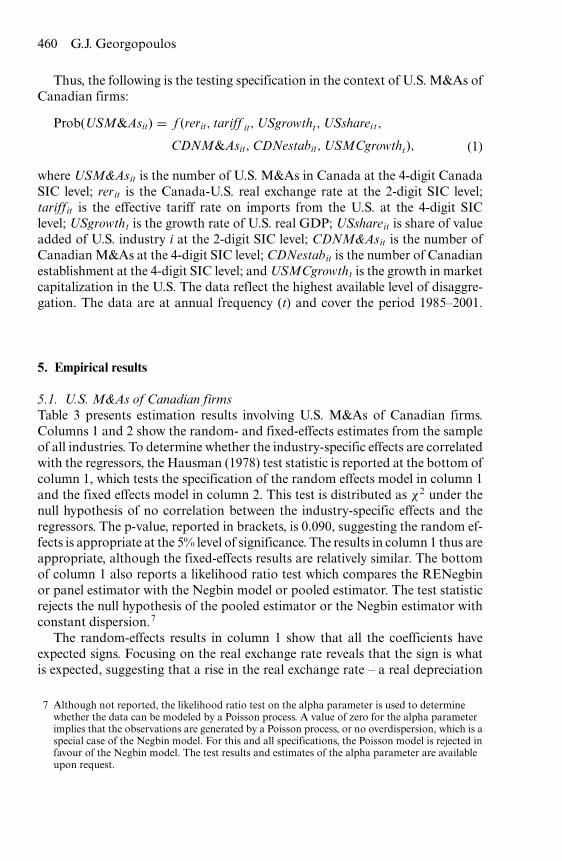
Thus, the following is the testing specification in the context of U.S. M&As ofCanadian firms:
Prob(USM&Asit) = f (rerit, tariff it, USgrowtht, USshareit,
CDNM&Asit, CDNestabit, USMCgrowtht), (1)
where USM&Asit is the number of U.S. M&As in Canada at the 4-digit CanadaSIC level; rerit is the Canada-U.S. real exchange rate at the 2-digit SIC level;tariffit is the effective tariff rate on imports from the U.S. at the 4-digit SIClevel; USgrowtht is the growth rate of U.S. real GDP; USshareit is share of valueadded of U.S. industry i at the 2-digit SIC level; CDNM&Asit is the number ofCanadian M&As at the 4-digit SIC level; CDNestabit is the number of Canadianestablishment at the 4-digit SIC level; and USMCgrowtht is the growth in marketcapitalization in the U.S. The data reflect the highest available level of disaggre-gation. The data are at annual frequency (t) and cover the period 1985–2001.
5. Empirical results
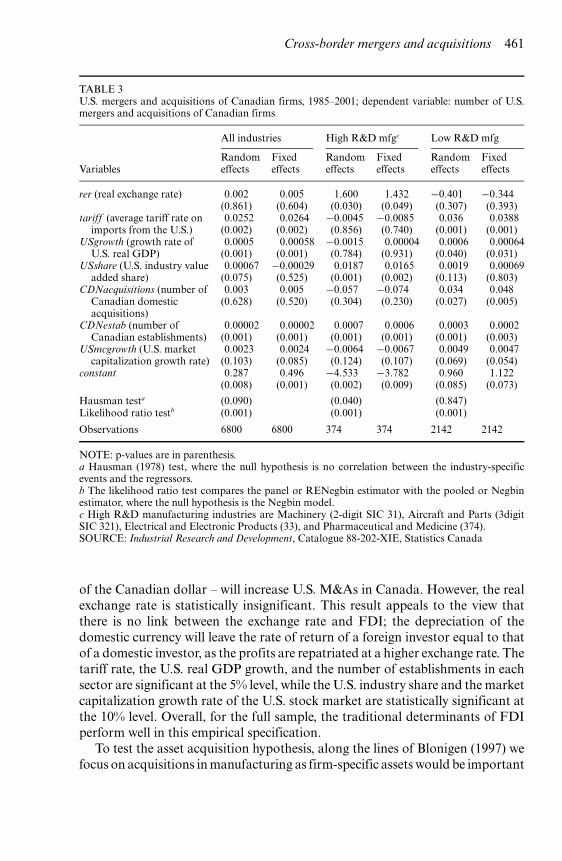
5.1. U.S. M&As of Canadian firmsTable 3 presents estimation results involving U.S. M&As of Canadian firms.Columns 1 and 2 show the random- and fixed-effects estimates from the sampleof all industries. To determine whether the industry-specific effects are correlatedwith the regressors, the Hausman (1978) test statistic is reported at the bottom ofcolumn 1, which tests the specification of the random effects model in column 1and the fixed effects model in column 2. This test is distributed as χ2 under thenull hypothesis of no correlation between the industry-specific effects and theregressors. The p-value, reported in brackets, is 0.090, suggesting the random ef-fects is appropriate at the 5% level of significance. The results in column 1 thus areappropriate, although the fixed-effects results are relatively similar. The bottomof column 1 also reports a likelihood ratio test which compares the RENegbinor panel estimator with the Negbin model or pooled estimator. The test statisticrejects the null hypothesis of the pooled estimator or the Negbin estimator withconstant dispersion.7
The random-effects results in column 1 show that all the coefficients haveexpected signs. Focusing on the real exchange rate reveals that the sign is whatis expected, suggesting that a rise in the real exchange rate – a real depreciation
7 Although not reported, the likelihood ratio test on the alpha parameter is used to determinewhether the data can be modeled by a Poisson process. A value of zero for the alpha parameterimplies that the observations are generated by a Poisson process, or no overdispersion, which is aspecial case of the Negbin model. For this and all specifications, the Poisson model is rejected infavour of the Negbin model. The test results and estimates of the alpha parameter are availableupon request.
Cross-border mergers and acquisitions 461
TABLE 3U.S. mergers and acquisitions of Canadian firms, 1985–2001; dependent variable: number of U.S.mergers and acquisitions of Canadian firms
All industries High R&D mfgc Low R&D mfg
Random Fixed Random Fixed Random FixedVariables effects effects effects effects effects effects
rer (real exchange rate) 0.002 0.005 1.600 1.432 −0.401 −0.344(0.861) (0.604) (0.030) (0.049) (0.307) (0.393)
tariff (average tariff rate onimports from the U.S.)
0.0252 0.0264 −0.0045 −0.0085 0.036 0.0388(0.002) (0.002) (0.856) (0.740) (0.001) (0.001)
USgrowth (growth rate ofU.S. real GDP)
0.0005 0.00058 −0.0015 0.00004 0.0006 0.00064(0.001) (0.001) (0.784) (0.931) (0.040) (0.031)
USshare (U.S. industry valueadded share)
0.00067 −0.00029 0.0187 0.0165 0.0019 0.00069(0.075) (0.525) (0.001) (0.002) (0.113) (0.803)
CDNacquisitions (number ofCanadian domesticacquisitions)
0.003 0.005 −0.057 −0.074 0.034 0.048(0.628) (0.520) (0.304) (0.230) (0.027) (0.005)
CDNestab (number ofCanadian establishments)
0.00002 0.00002 0.0007 0.0006 0.0003 0.0002(0.001) (0.001) (0.001) (0.001) (0.001) (0.003)
USmcgrowth (U.S. marketcapitalization growth rate)
0.0023 0.0024 −0.0064 −0.0067 0.0049 0.0047(0.103) (0.085) (0.124) (0.107) (0.069) (0.054)
constant 0.287 0.496 −4.533 −3.782 0.960 1.122(0.008) (0.001) (0.002) (0.009) (0.085) (0.073)
Hausman testa (0.090) (0.040) (0.847)Likelihood ratio testb (0.001) (0.001) (0.001)
Observations 6800 6800 374 374 2142 2142
NOTE: p-values are in parenthesis.a Hausman (1978) test, where the null hypothesis is no correlation between the industry-specificevents and the regressors.b The likelihood ratio test compares the panel or RENegbin estimator with the pooled or Negbinestimator, where the null hypothesis is the Negbin model.c High R&D manufacturing industries are Machinery (2-digit SIC 31), Aircraft and Parts (3digitSIC 321), Electrical and Electronic Products (33), and Pharmaceutical and Medicine (374).SOURCE: Industrial Research and Development, Catalogue 88-202-XIE, Statistics Canada
of the Canadian dollar – will increase U.S. M&As in Canada. However, the realexchange rate is statistically insignificant. This result appeals to the view thatthere is no link between the exchange rate and FDI; the depreciation of thedomestic currency will leave the rate of return of a foreign investor equal to thatof a domestic investor, as the profits are repatriated at a higher exchange rate. Thetariff rate, the U.S. real GDP growth, and the number of establishments in eachsector are significant at the 5% level, while the U.S. industry share and the marketcapitalization growth rate of the U.S. stock market are statistically significant atthe 10% level. Overall, for the full sample, the traditional determinants of FDIperform well in this empirical specification.
To test the asset acquisition hypothesis, along the lines of Blonigen (1997) wefocus on acquisitions in manufacturing as firm-specific assets would be important
462 G.J. Georgopoulos
for this industry. We examine whether manufacturing firms with high R&D in-tensities are more likely to be acquired after a domestic currency depreciationrelative to low R&D intensity firms. High R&D industries are more likely tohave technology-related firm-specific assets. According to the asset acquisitionhypothesis proposed by Blonigen (1997) these industries are expected to ex-perience a higher number of cross-border M&A activity in the presence of adomestic currency depreciation, as domestic firm-specific assets that are trans-ferable become less costly to acquire. We split manufacturing into high R&Dindustries and low R&D industries, where high R&D industries are classifiedas those having ratios of R&D expenditures to sales above the manufactur-ing average. The industries with ratios consistently greater than the averageare reported at the bottom of table 3. Most are the traditional R&D indus-tries such as machinery, electrical products, and pharmaceutical and medicineindustries.8
Columns 3 and 4 present the results from high R&D manufacturing. At thebottom of column 3 the Hausman test shows that the fixed-effects model is thecorrect empirical model, although again the random effects results are similar.In column 4, of importance is that the real exchange rate is now statisticallysignificant. Furthermore, the value of the coefficient is considerably larger thanin column 1. These results lend support to Blonigen’s (1997) asset acquisitionhypothesis.
In addition the tariff rate went from being significant in the full sample caseto insignificant. This result is intuitively appealing, as a tariff barrier is not aprimary factor for a foreign firm whose primary motive is to acquire transferableassets. Industry share is still significant and has the expected sign, along with thenumber of establishments.
Columns 5 and 6 show the results from the low R&D manufacturing industries.The Hausman test accepts the null hypothesis of no correlation between industryspecific effects and the regressors. Thus, in column 5, of importance is that the realexchange rate is now statistically insignificant. For those firms having a relativelylow level of technology intensities, there is little if any M&A activity in theirassociated industries for the purpose of asset acquisition; thus, the exchange ratedoes not matter. Note that the tariff rate is now significant. With respect to theseindustries, the suggested motive for cross-border M&As is to gain access to anew market or exploit economies of scale, where this mode of entry substitutesfor trade in the presence of tariffs. Industry share is not significant, whereas theremaining variables have expected signs and are statistically significant. Theseresults also hold for the fixed-effects estimates.
The results show that the exchange rate is a statistically significant factor onlyfor cross-border M&As of firms with high R&D intensities. Tariff rates are not
8 R&D expenditures relative to sales data at the 2 and 3 digit SIC level were provided by theIndustrial Research and Development Department, Catalogue 88-202-XIE, Statistics Canada.
Cross-border mergers and acquisitions 463
statistically significant for high R&D firms. This is expected when the primarymotive for an M&A is to acquire a firm-specific asset that is transferable. Theexchange rate does not play a role for cross-border M&As for industries with lowlevels of R&D intensity, whereas tariff rates do.
5.2. Canadian M&As of U.S. firmsFurther evidence that would support the asset acquisition hypothesis would be tofind a reduction in the probability of Canadian M&As of U.S. high R&D firmsafter a Canadian dollar real depreciation. We investigate this using count dataon the number of Canadian M&As of U.S. firms. These data were provided bythe Bureau of Economic Analysis, where it was available only at the 3-digit U.S.SIC level beginning in 1987.
Table 4 presents the results, where again similar explanatory variables wereused but in the context of determinants of Canadian M&As of U.S. firms. For datasources on these variables see appendix B. For the full sample case, the Hausmantest shows that the fixed-effects estimation results in column 2 are appropriate.The estimated coefficient on the real exchange rate is statistically significant, buthas an unexpected sign, although the coefficient is relatively small in magnitude.The growth rate of Canadian real GDP is statistically significant and positivelyaffects the probability of a Canadian M&A in the U.S. A questionable resultis the statistically significant negative effect of the market capitalization rate inCanada.
The estimation was again taken for the high and low R&D manufacturingindustries, where R&D shares were provided by the U.S. National Science Foun-dation. The high R&D U.S. industries are reported at the bottom of table 4.
For high R&D firms, the fixed effect results of column 4 show evidence sup-porting the asset acquisition hypothesis. Specifically, the real exchange rate nowhas a negative affect, which is consistent with the asset acquisition theory; areal depreciation of the Canadian dollar decreases the probability of a Canadianfirm acquiring a U.S. firm, although this effect is statistically significant at the10% level. The random-effects model provides similar evidence, where the realexchange rate is significant at the 1% level. U.S. domestic M&A activity has apositive effect and is significant at the 10% level. The result on tariffs is unclear,as the coefficient is negative and significant.
For low R&D industries, the exchange rate results from the random effectsmodel differ from the high R&D in that the sign has changed and is statisticallyinsignificant, further supporting the asset acquisition hypothesis. U.S. domesticM&A activity and the number of establishments in an industry are the mainfactors driving Canadian M&As of low R&D U.S. firms.
The results from tables 3 and 4 show support of the asset acquisition effectholding bilaterally. Given a Canadian dollar depreciation, the probability of U.S.M&As of Canadian high R&D firms increases, while the probability of CanadianM&As of U.S. high R&D firms decreases.
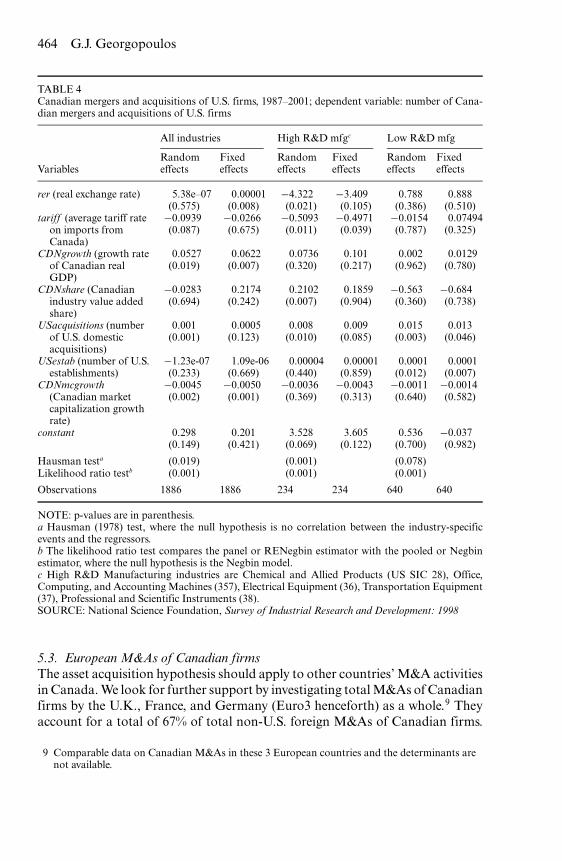
464 G.J. Georgopoulos
TABLE 4Canadian mergers and acquisitions of U.S. firms, 1987–2001; dependent variable: number of Cana-dian mergers and acquisitions of U.S. firms
All industries High R&D mfgc Low R&D mfg
Random Fixed Random Fixed Random FixedVariables effects effects effects effects effects effects
rer (real exchange rate) 5.38e–07 0.00001 −4.322 −3.409 0.788 0.888(0.575) (0.008) (0.021) (0.105) (0.386) (0.510)
tariff (average tariff rateon imports fromCanada)
−0.0939 −0.0266 −0.5093 −0.4971 −0.0154 0.07494(0.087) (0.675) (0.011) (0.039) (0.787) (0.325)
CDNgrowth (growth rateof Canadian realGDP)
0.0527 0.0622 0.0736 0.101 0.002 0.0129(0.019) (0.007) (0.320) (0.217) (0.962) (0.780)
CDNshare (Canadianindustry value addedshare)
−0.0283 0.2174 0.2102 0.1859 −0.563 −0.684(0.694) (0.242) (0.007) (0.904) (0.360) (0.738)
USacquisitions (numberof U.S. domesticacquisitions)
0.001 0.0005 0.008 0.009 0.015 0.013(0.001) (0.123) (0.010) (0.085) (0.003) (0.046)
USestab (number of U.S.establishments)
−1.23e-07 1.09e-06 0.00004 0.00001 0.0001 0.0001(0.233) (0.669) (0.440) (0.859) (0.012) (0.007)
CDNmcgrowth(Canadian marketcapitalization growthrate)
−0.0045 −0.0050 −0.0036 −0.0043 −0.0011 −0.0014(0.002) (0.001) (0.369) (0.313) (0.640) (0.582)
constant 0.298 0.201 3.528 3.605 0.536 −0.037(0.149) (0.421) (0.069) (0.122) (0.700) (0.982)
Hausman testa (0.019) (0.001) (0.078)Likelihood ratio testb (0.001) (0.001) (0.001)
Observations 1886 1886 234 234 640 640
NOTE: p-values are in parenthesis.a Hausman (1978) test, where the null hypothesis is no correlation between the industry-specificevents and the regressors.b The likelihood ratio test compares the panel or RENegbin estimator with the pooled or Negbinestimator, where the null hypothesis is the Negbin model.c High R&D Manufacturing industries are Chemical and Allied Products (US SIC 28), Office,Computing, and Accounting Machines (357), Electrical Equipment (36), Transportation Equipment(37), Professional and Scientific Instruments (38).SOURCE: National Science Foundation, Survey of Industrial Research and Development: 1998
5.3. European M&As of Canadian firmsThe asset acquisition hypothesis should apply to other countries’ M&A activitiesin Canada. We look for further support by investigating total M&As of Canadianfirms by the U.K., France, and Germany (Euro3 henceforth) as a whole.9 Theyaccount for a total of 67% of total non-U.S. foreign M&As of Canadian firms.
9 Comparable data on Canadian M&As in these 3 European countries and the determinants arenot available.
Cross-border mergers and acquisitions 465
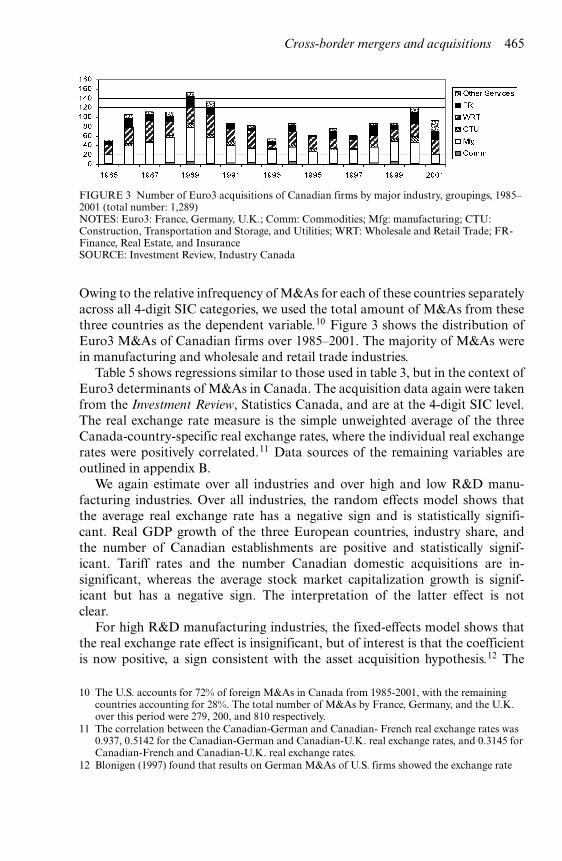
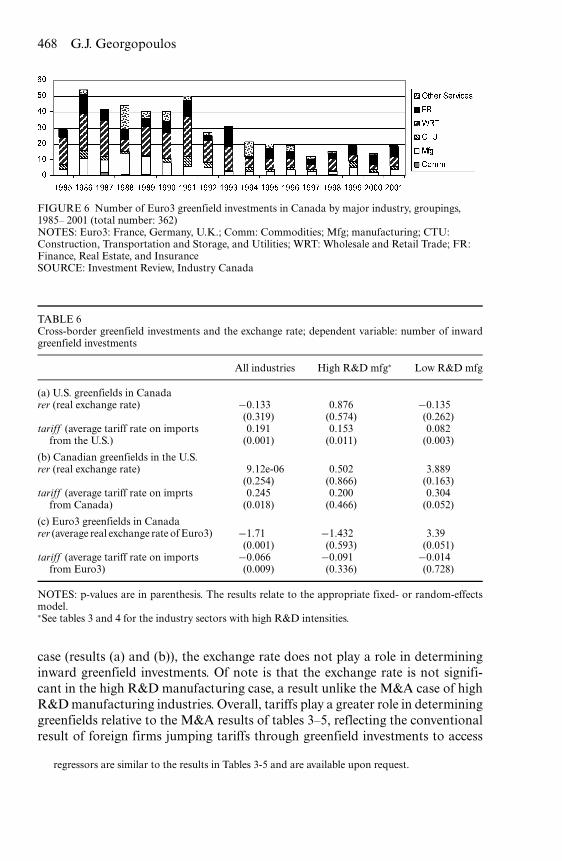
FIGURE 3 Number of Euro3 acquisitions of Canadian firms by major industry, groupings, 1985–2001 (total number: 1,289)NOTES: Euro3: France, Germany, U.K.; Comm: Commodities; Mfg: manufacturing; CTU:Construction, Transportation and Storage, and Utilities; WRT: Wholesale and Retail Trade; FR-Finance, Real Estate, and InsuranceSOURCE: Investment Review, Industry Canada
Owing to the relative infrequency of M&As for each of these countries separatelyacross all 4-digit SIC categories, we used the total amount of M&As from thesethree countries as the dependent variable.10 Figure 3 shows the distribution ofEuro3 M&As of Canadian firms over 1985–2001. The majority of M&As werein manufacturing and wholesale and retail trade industries.
Table 5 shows regressions similar to those used in table 3, but in the context ofEuro3 determinants of M&As in Canada. The acquisition data again were takenfrom the Investment Review, Statistics Canada, and are at the 4-digit SIC level.The real exchange rate measure is the simple unweighted average of the threeCanada-country-specific real exchange rates, where the individual real exchangerates were positively correlated.11 Data sources of the remaining variables areoutlined in appendix B.
We again estimate over all industries and over high and low R&D manu-facturing industries. Over all industries, the random effects model shows thatthe average real exchange rate has a negative sign and is statistically signifi-cant. Real GDP growth of the three European countries, industry share, andthe number of Canadian establishments are positive and statistically signif-icant. Tariff rates and the number Canadian domestic acquisitions are in-significant, whereas the average stock market capitalization growth is signif-icant but has a negative sign. The interpretation of the latter effect is notclear.
For high R&D manufacturing industries, the fixed-effects model shows thatthe real exchange rate effect is insignificant, but of interest is that the coefficientis now positive, a sign consistent with the asset acquisition hypothesis.12 The
10 The U.S. accounts for 72% of foreign M&As in Canada from 1985-2001, with the remainingcountries accounting for 28%. The total number of M&As by France, Germany, and the U.K.over this period were 279, 200, and 810 respectively.
11 The correlation between the Canadian-German and Canadian- French real exchange rates was0.937, 0.5142 for the Canadian-German and Canadian-U.K. real exchange rates, and 0.3145 forCanadian-French and Canadian-U.K. real exchange rates.
12 Blonigen (1997) found that results on German M&As of U.S. firms showed the exchange rate
466 G.J. Georgopoulos
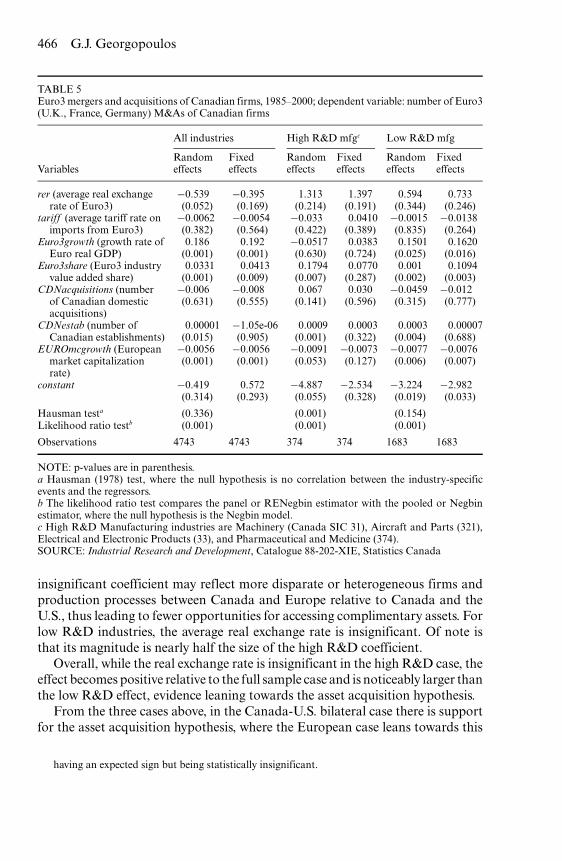
TABLE 5Euro3 mergers and acquisitions of Canadian firms, 1985–2000; dependent variable: number of Euro3(U.K., France, Germany) M&As of Canadian firms
All industries High R&D mfgc Low R&D mfg
Random Fixed Random Fixed Random FixedVariables effects effects effects effects effects effects
rer (average real exchangerate of Euro3)
−0.539 −0.395 1.313 1.397 0.594 0.733(0.052) (0.169) (0.214) (0.191) (0.344) (0.246)
tariff (average tariff rate onimports from Euro3)
−0.0062 −0.0054 −0.033 0.0410 −0.0015 −0.0138(0.382) (0.564) (0.422) (0.389) (0.835) (0.264)
Euro3growth (growth rate ofEuro real GDP)
0.186 0.192 −0.0517 0.0383 0.1501 0.1620(0.001) (0.001) (0.630) (0.724) (0.025) (0.016)
Euro3share (Euro3 industryvalue added share)
0.0331 0.0413 0.1794 0.0770 0.001 0.1094(0.001) (0.009) (0.007) (0.287) (0.002) (0.003)
CDNacquisitions (numberof Canadian domesticacquisitions)
−0.006 −0.008 0.067 0.030 −0.0459 −0.012(0.631) (0.555) (0.141) (0.596) (0.315) (0.777)
CDNestab (number ofCanadian establishments)
0.00001 −1.05e-06 0.0009 0.0003 0.0003 0.00007(0.015) (0.905) (0.001) (0.322) (0.004) (0.688)
EUROmcgrowth (Europeanmarket capitalizationrate)
−0.0056 −0.0056 −0.0091 −0.0073 −0.0077 −0.0076(0.001) (0.001) (0.053) (0.127) (0.006) (0.007)
constant −0.419 0.572 −4.887 −2.534 −3.224 −2.982(0.314) (0.293) (0.055) (0.328) (0.019) (0.033)
Hausman testa (0.336) (0.001) (0.154)Likelihood ratio testb (0.001) (0.001) (0.001)
Observations 4743 4743 374 374 1683 1683
NOTE: p-values are in parenthesis.a Hausman (1978) test, where the null hypothesis is no correlation between the industry-specificevents and the regressors.b The likelihood ratio test compares the panel or RENegbin estimator with the pooled or Negbinestimator, where the null hypothesis is the Negbin model.c High R&D Manufacturing industries are Machinery (Canada SIC 31), Aircraft and Parts (321),Electrical and Electronic Products (33), and Pharmaceutical and Medicine (374).SOURCE: Industrial Research and Development, Catalogue 88-202-XIE, Statistics Canada
insignificant coefficient may reflect more disparate or heterogeneous firms andproduction processes between Canada and Europe relative to Canada and theU.S., thus leading to fewer opportunities for accessing complimentary assets. Forlow R&D industries, the average real exchange rate is insignificant. Of note isthat its magnitude is nearly half the size of the high R&D coefficient.
Overall, while the real exchange rate is insignificant in the high R&D case, theeffect becomes positive relative to the full sample case and is noticeably larger thanthe low R&D effect, evidence leaning towards the asset acquisition hypothesis.
From the three cases above, in the Canada-U.S. bilateral case there is supportfor the asset acquisition hypothesis, where the European case leans towards this
having an expected sign but being statistically insignificant.
Cross-border mergers and acquisitions 467
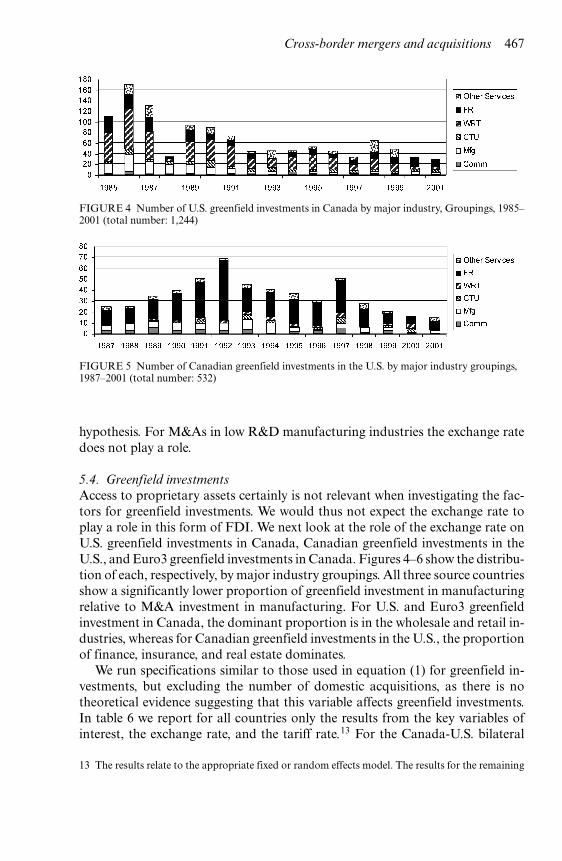
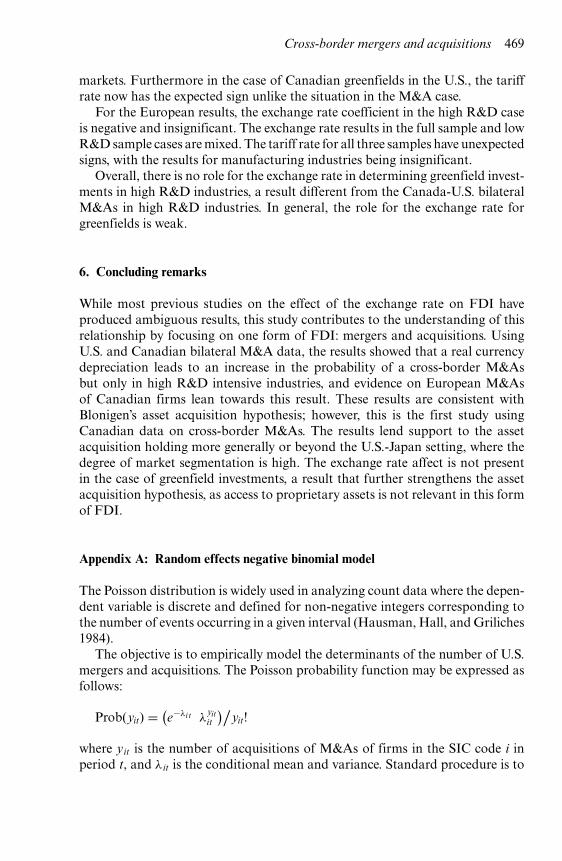
FIGURE 4 Number of U.S. greenfield investments in Canada by major industry, Groupings, 1985–2001 (total number: 1,244)
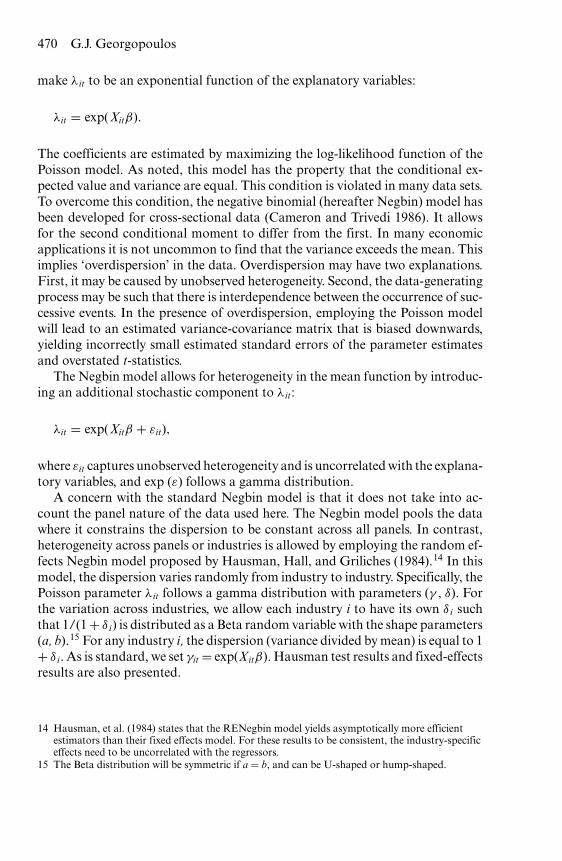
FIGURE 5 Number of Canadian greenfield investments in the U.S. by major industry groupings,1987–2001 (total number: 532)
hypothesis. For M&As in low R&D manufacturing industries the exchange ratedoes not play a role.
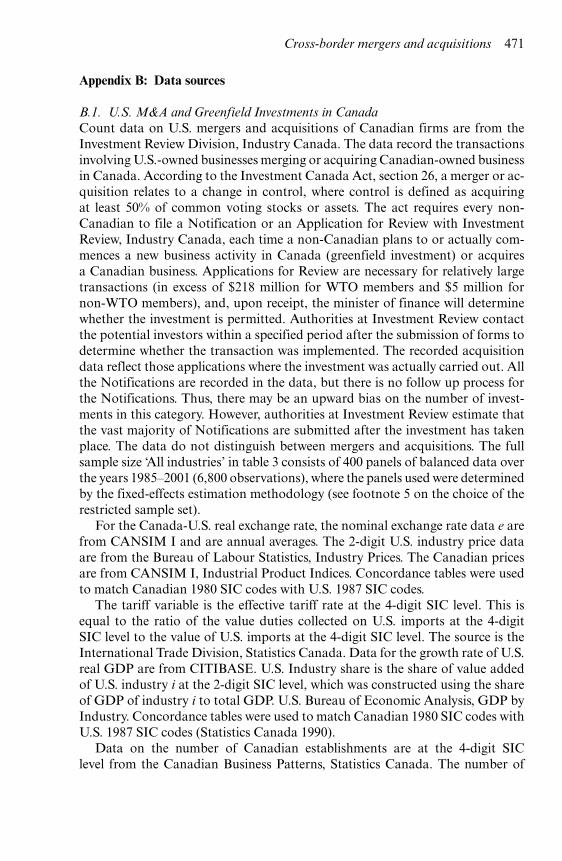
5.4. Greenfield investmentsAccess to proprietary assets certainly is not relevant when investigating the fac-tors for greenfield investments. We would thus not expect the exchange rate toplay a role in this form of FDI. We next look at the role of the exchange rate onU.S. greenfield investments in Canada, Canadian greenfield investments in theU.S., and Euro3 greenfield investments in Canada. Figures 4–6 show the distribu-tion of each, respectively, by major industry groupings. All three source countriesshow a significantly lower proportion of greenfield investment in manufacturingrelative to M&A investment in manufacturing. For U.S. and Euro3 greenfieldinvestment in Canada, the dominant proportion is in the wholesale and retail in-dustries, whereas for Canadian greenfield investments in the U.S., the proportionof finance, insurance, and real estate dominates.
We run specifications similar to those used in equation (1) for greenfield in-vestments, but excluding the number of domestic acquisitions, as there is notheoretical evidence suggesting that this variable affects greenfield investments.In table 6 we report for all countries only the results from the key variables ofinterest, the exchange rate, and the tariff rate.13 For the Canada-U.S. bilateral
13 The results relate to the appropriate fixed or random effects model. The results for the remaining
468 G.J. Georgopoulos
FIGURE 6 Number of Euro3 greenfield investments in Canada by major industry, groupings,1985– 2001 (total number: 362)NOTES: Euro3: France, Germany, U.K.; Comm: Commodities; Mfg; manufacturing; CTU:Construction, Transportation and Storage, and Utilities; WRT: Wholesale and Retail Trade; FR:Finance, Real Estate, and InsuranceSOURCE: Investment Review, Industry Canada
TABLE 6Cross-border greenfield investments and the exchange rate; dependent variable: number of inwardgreenfield investments
All industries High R&D mfg∗ Low R&D mfg
(a) U.S. greenfields in Canadarer (real exchange rate) −0.133 0.876 −0.135
(0.319) (0.574) (0.262)tariff (average tariff rate on imports
from the U.S.)0.191 0.153 0.082
(0.001) (0.011) (0.003)
(b) Canadian greenfields in the U.S.rer (real exchange rate) 9.12e-06 0.502 3.889
(0.254) (0.866) (0.163)tariff (average tariff rate on imprts
from Canada)0.245 0.200 0.304
(0.018) (0.466) (0.052)
(c) Euro3 greenfields in Canadarer (average real exchange rate of Euro3) −1.71 −1.432 3.39
(0.001) (0.593) (0.051)tariff (average tariff rate on imports
from Euro3)−0.066 −0.091 −0.014(0.009) (0.336) (0.728)
NOTES: p-values are in parenthesis. The results relate to the appropriate fixed- or random-effectsmodel.∗See tables 3 and 4 for the industry sectors with high R&D intensities.
case (results (a) and (b)), the exchange rate does not play a role in determininginward greenfield investments. Of note is that the exchange rate is not signifi-cant in the high R&D manufacturing case, a result unlike the M&A case of highR&D manufacturing industries. Overall, tariffs play a greater role in determininggreenfields relative to the M&A results of tables 3–5, reflecting the conventionalresult of foreign firms jumping tariffs through greenfield investments to access
regressors are similar to the results in Tables 3-5 and are available upon request.
Cross-border mergers and acquisitions 469
markets. Furthermore in the case of Canadian greenfields in the U.S., the tariffrate now has the expected sign unlike the situation in the M&A case.
For the European results, the exchange rate coefficient in the high R&D caseis negative and insignificant. The exchange rate results in the full sample and lowR&D sample cases are mixed. The tariff rate for all three samples have unexpectedsigns, with the results for manufacturing industries being insignificant.
Overall, there is no role for the exchange rate in determining greenfield invest-ments in high R&D industries, a result different from the Canada-U.S. bilateralM&As in high R&D industries. In general, the role for the exchange rate forgreenfields is weak.
6. Concluding remarks
While most previous studies on the effect of the exchange rate on FDI haveproduced ambiguous results, this study contributes to the understanding of thisrelationship by focusing on one form of FDI: mergers and acquisitions. UsingU.S. and Canadian bilateral M&A data, the results showed that a real currencydepreciation leads to an increase in the probability of a cross-border M&Asbut only in high R&D intensive industries, and evidence on European M&Asof Canadian firms lean towards this result. These results are consistent withBlonigen’s asset acquisition hypothesis; however, this is the first study usingCanadian data on cross-border M&As. The results lend support to the assetacquisition holding more generally or beyond the U.S.-Japan setting, where thedegree of market segmentation is high. The exchange rate affect is not presentin the case of greenfield investments, a result that further strengthens the assetacquisition hypothesis, as access to proprietary assets is not relevant in this formof FDI.
Appendix A: Random effects negative binomial model
The Poisson distribution is widely used in analyzing count data where the depen-dent variable is discrete and defined for non-negative integers corresponding tothe number of events occurring in a given interval (Hausman, Hall, and Griliches1984).
The objective is to empirically model the determinants of the number of U.S.mergers and acquisitions. The Poisson probability function may be expressed asfollows:
Prob(yit) = (e−λi t λ
yitit
)/yit!
where yit is the number of acquisitions of M&As of firms in the SIC code i inperiod t, and λit is the conditional mean and variance. Standard procedure is to
470 G.J. Georgopoulos
make λit to be an exponential function of the explanatory variables:
λit = exp(Xitβ).
The coefficients are estimated by maximizing the log-likelihood function of thePoisson model. As noted, this model has the property that the conditional ex-pected value and variance are equal. This condition is violated in many data sets.To overcome this condition, the negative binomial (hereafter Negbin) model hasbeen developed for cross-sectional data (Cameron and Trivedi 1986). It allowsfor the second conditional moment to differ from the first. In many economicapplications it is not uncommon to find that the variance exceeds the mean. Thisimplies ‘overdispersion’ in the data. Overdispersion may have two explanations.First, it may be caused by unobserved heterogeneity. Second, the data-generatingprocess may be such that there is interdependence between the occurrence of suc-cessive events. In the presence of overdispersion, employing the Poisson modelwill lead to an estimated variance-covariance matrix that is biased downwards,yielding incorrectly small estimated standard errors of the parameter estimatesand overstated t-statistics.
The Negbin model allows for heterogeneity in the mean function by introduc-ing an additional stochastic component to λit:
λit = exp(Xitβ + εit),
where εit captures unobserved heterogeneity and is uncorrelated with the explana-tory variables, and exp (ε) follows a gamma distribution.
A concern with the standard Negbin model is that it does not take into ac-count the panel nature of the data used here. The Negbin model pools the datawhere it constrains the dispersion to be constant across all panels. In contrast,heterogeneity across panels or industries is allowed by employing the random ef-fects Negbin model proposed by Hausman, Hall, and Griliches (1984).14 In thismodel, the dispersion varies randomly from industry to industry. Specifically, thePoisson parameter λit follows a gamma distribution with parameters (γ , δ). Forthe variation across industries, we allow each industry i to have its own δ i suchthat 1/(1 + δ i) is distributed as a Beta random variable with the shape parameters(a, b).15 For any industry i, the dispersion (variance divided by mean) is equal to 1+ δ i. As is standard, we set γit = exp(Xitβ). Hausman test results and fixed-effectsresults are also presented.
14 Hausman, et al. (1984) states that the RENegbin model yields asymptotically more efficientestimators than their fixed effects model. For these results to be consistent, the industry-specificeffects need to be uncorrelated with the regressors.
15 The Beta distribution will be symmetric if a = b, and can be U-shaped or hump-shaped.
Cross-border mergers and acquisitions 471
Appendix B: Data sources
B.1. U.S. M&A and Greenfield Investments in CanadaCount data on U.S. mergers and acquisitions of Canadian firms are from theInvestment Review Division, Industry Canada. The data record the transactionsinvolving U.S.-owned businesses merging or acquiring Canadian-owned businessin Canada. According to the Investment Canada Act, section 26, a merger or ac-quisition relates to a change in control, where control is defined as acquiringat least 50% of common voting stocks or assets. The act requires every non-Canadian to file a Notification or an Application for Review with InvestmentReview, Industry Canada, each time a non-Canadian plans to or actually com-mences a new business activity in Canada (greenfield investment) or acquiresa Canadian business. Applications for Review are necessary for relatively largetransactions (in excess of $218 million for WTO members and $5 million fornon-WTO members), and, upon receipt, the minister of finance will determinewhether the investment is permitted. Authorities at Investment Review contactthe potential investors within a specified period after the submission of forms todetermine whether the transaction was implemented. The recorded acquisitiondata reflect those applications where the investment was actually carried out. Allthe Notifications are recorded in the data, but there is no follow up process forthe Notifications. Thus, there may be an upward bias on the number of invest-ments in this category. However, authorities at Investment Review estimate thatthe vast majority of Notifications are submitted after the investment has takenplace. The data do not distinguish between mergers and acquisitions. The fullsample size ‘All industries’ in table 3 consists of 400 panels of balanced data overthe years 1985–2001 (6,800 observations), where the panels used were determinedby the fixed-effects estimation methodology (see footnote 5 on the choice of therestricted sample set).
For the Canada-U.S. real exchange rate, the nominal exchange rate data e arefrom CANSIM I and are annual averages. The 2-digit U.S. industry price dataare from the Bureau of Labour Statistics, Industry Prices. The Canadian pricesare from CANSIM I, Industrial Product Indices. Concordance tables were usedto match Canadian 1980 SIC codes with U.S. 1987 SIC codes.
The tariff variable is the effective tariff rate at the 4-digit SIC level. This isequal to the ratio of the value duties collected on U.S. imports at the 4-digitSIC level to the value of U.S. imports at the 4-digit SIC level. The source is theInternational Trade Division, Statistics Canada. Data for the growth rate of U.S.real GDP are from CITIBASE. U.S. Industry share is the share of value addedof U.S. industry i at the 2-digit SIC level, which was constructed using the shareof GDP of industry i to total GDP. U.S. Bureau of Economic Analysis, GDP byIndustry. Concordance tables were used to match Canadian 1980 SIC codes withU.S. 1987 SIC codes (Statistics Canada 1990).
Data on the number of Canadian establishments are at the 4-digit SIClevel from the Canadian Business Patterns, Statistics Canada. The number of
472 G.J. Georgopoulos
Canadian mergers and acquisitions of Canadian firms are from the ThomsonFinancial Securities Data Company (SDC Platinum Database). These data con-form to the Investment Review definition of control (50% plus one of controlover common voting shares or assets). Unlike the Investment Review data, thedata are based on published sources recording announced investments. Giventhat press coverage focuses only on large transactions, the data may not captureall of these acquisitions.
B.2. Canadian M&A and greenfield investments in the U.S.Count data on the number of Canadian M&As of U.S. firms and Canadiangreenfield investments in the U.S. were provided by the Bureau of EconomicAnalysis, where this data are available only at the 3-digit U.S. SIC level beginningin 1987. The full sample set in table 4 consists of 137 panels of unbalanced data.
Data on the value of Canadian imports and duties collected on Canadianimports are from Feenstra (1996) and Feenstra, Romalis, and Schott (2002),from which U.S. average tariff rates on Canadian imports at the 3-digit U.S. SIClevel were constructed. Canadian GDP data from Statistics Canada were used toconstruct annual total real GDP growth rates, along with industry share of totalGDP at the 2-digit SIC level, where Canada-US SIC concordance tables wereused. The number of U.S. domestic M&As at the 3-digit US SIC level is fromthe SDC Thomson Financial Database. The number of U.S. establishments atthe 3-digit SIC level is rom the U.S. Census Bureau. Finally the growth in marketcapitalization in Canada is from Morgan Stanley Capital International.
B.3. Euro3 M&A, and greenfield investments in CanadaThe acquisition data were again from the Investment Review, Statistics Canada,and are at the 4-digit SIC level. The full sample set in table 5 consists of 279panels of balanced data. The real exchange rate measure is the simple unweightedaverage of the three Canada-country-specific real exchange rates. The price datawere at six commodity classifications and were sourced from the OECD. Thesum of the three countries’ real GDP was used to calculate the growth of realGDP. Tariff data are from the International Trade Division, Statistics Canada.Industry GDP data were available across six industrial sectors, where the shareof each sector was the ratio of the sum of each countries’ sector GDP to the sumof each countries’ total GDP.16 Data on Canadian domestic acquisitions andthe number of establishments are the same as those in table 3. Morgan Stanley’sMarket Capitalization International for Europe is used to capture stock marketwealth.
16 The six sector and SIC groupings are agriculture, hunting, forestry and fishing (2-digit sectors1-5), energy and manufacturing (5-39), construction (40-49), transportation, wholesale andretail (50-69), finance, real estate, and business activities (70-77), and other services (90-99).
Cross-border mergers and acquisitions 473
References
Aba, S. and J. Mintz (2002) ‘Preserving control: Canada and the international mar-ket for corporate acquisitions,’ Backgrounder, No. 62, September, C.D. HoweInstitute
Blonigen, A. (1997) ‘Firm specific assets and the link between exchange rates and foreigndirect investment,’ American Economic Review 87, 447–65
Blonigen, B., R. Davies, and K. Head (2003) ‘Estimating the knowledge-capital modelof the multinational enterprise: comment,’ American Economic Review 93, 980–94
Carr, D., J. Markusen, and K. Maskus (2001) ‘Estimating the knowledge-capital modelof the multinational enterprise,’ American Economic Review 91, 693–708
Caves, D. (1989) ‘Exchange-rate movements and foreign direct investment in the UnitedStates,’ in Internalization of U.S. Markets, ed. D.B. Audretsch and M.P. Claudon (NewYork: New York University Press)
— (1996) Multinational Enterprise and Economic Analysis, 2nd ed. Cambridge Surveys ofEconomics Literature (Cambridge: Cambridge University Press)
Dewenter, K. (1995) ‘Do exchange rate changes drive foreign direct investment?’ Journalof Business 68, 405–33
Dunning, J. (1988) ‘Location and the multinational enterprise: a neglected factor?’ Journalof International Business Studies 29, 45–66
— (2001) ‘The eclectic (OLI) paradigm of international production: past, present andfuture,’ International Journal of Economics and Business 8, 173–90
Feenstra, R. (1996) ‘U.S. Imports, 1972–1994: data and concordances,’ National Bureauof Economic Research Working Paper No. 5515.
Feenstra, R., J. Romalis, and P. Schott (2002) ‘U.S. imports, exports, and tariff data,1989–2001,’ National Bureau of Economic Research Working Paper No. 9387
Froot, K., and J. Stein (1991) ‘Exchange rates and foreign direct investment: an imperfectcapital markets approach,’ Quarterly Journal of Economics 106, 190–207
Greaney, T. (2003) ‘Reverse importing and asymmetric trade and FDI: a networks expla-nation,’ Journal of International Economics, December, 61(2), 453–65
Hausman, J.A. (1978) ‘Specification tests in econometrics,’ Econometrica 46, 1251–71Hausman, J., B. Hall, and Z. Griliches (1984) ‘Econometric models for count data with
an application to the patents R&D relationship,’ Econometrica 52, 909–38Head, K., J. Ries, and B. Spencer (2002) ‘Vertical networks and US auto parts exports: is
Japan different?’ NBER Working Paper No. 9162Helliwell, J. (2002) ‘Measuring the width of national borders,’ Review of International
Economics 10, 517–24Helpman, E. (1984) ‘A simple theory of international trade with multinational corpora-
tions,’ Journal of Political Economy 92, 451–71Klein, M., and E. Rosengren (1994) ‘The real exchange rate and foreign direct investment
in the United States: relative wealth vs. relative wage effects,’ Journal of InternationalEconomics 36, 373–89
Lafrance, R., and D. Tessier (2001) ‘Exchange rate variability and investment in Canada,’in Revisiting the Case for Flexible Exchange Rates, Proceedings of a conference held atthe Bank of Canada, November 2000
Markusen, J. (1984) ‘Multinationals, multi-plant economies, and the gains from trade,’Journal of International Economics 16, 205–26
— (1997) ‘Trade versus investment liberalization,’ NBER Working Paper No. 6231Markusen, J., D. Venables, and K. Zhang (1996) ‘A unified treatment of horizontal direct
investment, vertical direct investment and the pattern of trade in goods and services,’NBER Working Paper No. 5696.

474 G.J. Georgopoulos
McFetridge, D.G. (1987) ‘The timing, mode and terms of technology transfer: some recentfindings,’ in Government, Mulitnationals, and International Technology Transfer, ed. A.Safarian and G. Y. Bertin (New York: St Martin’s Press)
National Science Foundation. ‘Total industrial R&D funds as a percent of net sales inR&D-performing companies, by industry and by size of company: 1988–98,’ IndustrialResearch and Development Information System
Rauch, J., and J. Watson (2005) ‘Network intermediaries in international trade,’ Journalof Economics and Management Strategy 13, 69–93
Schembri, L. (2002) ‘Foreign takeovers and the Canadian dollar: evidence and implica-tions,’ Bank of Canada Review Spring
Statistics Canada, Industrial Research and Development, Catalogue 88-202-XIB, variousissues
Van Pottelsberghe de la Potterie, B., and F. Lichtenberg (2001) ‘Does foreign direct in-vestment transfer technology across borders?’ Review of Economics and Statistics 83,490–97
World Investment Report (2000) Cross-border Mergers and Acquisitions and Development(New York and Geneva: United Nations)