Embed Size (px)
Citation preview
by Nicolas Coeurdacier,Roberto A. De Santisand Antonin Aviat
Cross-Border Mergers and aCquisitions
FinanCial and institutional ForCes
Work ing PaPer ser i e sno 1018 / MarCh 2009
WORKING PAPER SER IESNO 1018 / MARCH 2009
http://www.ecb.europa.eu or from the Social Science Research Networkelectronic library at http://ssrn.com/abstract_id=1336488.
In 2009 all ECB publications
feature a motif taken from the
€200 banknote.
CROSS-BORDER MERGERS
AND ACQUISITIONS
FINANCIAL AND
INSTITUTIONAL FORCES1
by Nicolas Coeurdacier 2, Roberto A. De Santis 3
and Antonin Aviat 4
1 This paper was presented at the 47th Panel Meeting of Economic Policy in Ljubljana, April 2008. We thank Jan van Ours, the editor in charge,
the discussants Gianmarco Ottaviano and Morten Ravn, four referees as well as the panel members and other participants of the Ljubljana
meeting for useful comments. We also thank Jean Imbs, Dennis Novy and Daria Taglioni for useful discussions. Moreover
we thank A. Gasteuil and R. Pereira for research assistantship. The views expressed in this paper are solely the
responsibility of the authors and should not be inter-preted as reflecting the views of the
European Central Bank, London Business School and CEPR.
2 London Business School, Regent’s Park, London NW1 4SA, UK. Phone: +34 20 7000 8433; email: [email protected]
3 European Central Bank, Kaiserstrasse 29, D-60311 Frankfurt am Main, Germany; Phone: +49 691344 6611;
4 Paris School of Economics, Pse--Ens, 48 bd Jourdan, F-75014 Paris, France;
e-mail: [email protected]
Phone: +331 4313 6326; e-mail: [email protected]
This paper can be downloaded without charge from
© European Central Bank, 2009
Address Kaiserstrasse 29 60311 Frankfurt am Main, Germany
Postal address Postfach 16 03 19 60066 Frankfurt am Main, Germany
Telephone +49 69 1344 0
Website http://www.ecb.europa.eu
Fax +49 69 1344 6000
All rights reserved.
Any reproduction, publication and reprint in the form of a different publication, whether printed or produced electronically, in whole or in part, is permitted only with the explicit written authorisation of the ECB or the author(s).
The views expressed in this paper do not necessarily refl ect those of the European Central Bank.
The statement of purpose for the ECB Working Paper Series is available from the ECB website, http://www.ecb.europa.eu/pub/scientific/wps/date/html/index.en.html
ISSN 1725-2806 (online)
3ECB
Working Paper Series No 1018March 2009
Abstract 4
Non-technical summary 5
1 Introduction 7
2 Estimation strategy to model cross-border M&As 11
2.1 Theoretical motivation 11
2.2 Description of the data on mergers and acquisitions 12
2.3 Description of the regressors 13
2.4 Specifi cation and methodology 16
3 Cross-border M&As in manufacturing sectors 17
3.1 Total cross-border M&As 17
3.2 Cross-border M&As within and across sectors 20
3.3 The role of trade, corporate taxation and product market regulation 22
4 Cross-border M&As in services 26
4.1 Benchmark regressions 26
4.2 The role of product market regulations 28
5 Robustness checks 30
5.1 Robustness checks concerning the EMU effect in manufacturing 30
5.2 Estimating the extensive versus the intensive margins of the EMU effects 33
5.3 Investigating the role of fi nancial depth 34
5.4 Investigating the role of geography 36
6 Conclusion 37
References 40
Appendix 45
European Central Bank Working Paper Series 50
CONTENTS
4ECBWorking Paper Series No 1018March 2009
AbstractCross-border mergers and acquisitions (M&As) sharply increased over the last two decades. It is often pointed out that cross-border capital reallocation is partly the result of financial liberalization policies, government policies and regional agreements. In this paper, we identify some of the main forces driving cross-border M&As using a unique database on bilateral cross-border M&As at the sectoral level (in manufacturing and services) over the period 1985-2004. We focus on the role of institutional and financial developments with a special attention to the role played by the European Integration process. We identify the impact of (i) joining the European Union and (ii) joining the Euro on cross-border M&As. We show that EU and EMU have almost doubled M&As in manufacturing towards their members from all over the globe, with an additional 50% increase within EMU countries. Conversely, the service sector did not exploit the opportunity offered by the single currency. We also show how cross-border M&As are linked to the acquirer expected profitability and provide insights on the effectiveness of policies to attract foreign capital (such as corporate tax incentives, and interventions to improve the country's financial system and product market regulations).
Keywords: Cross Mergers and Acquisitions, Gravity Equation, Euro.
JEL Classification: F30, F36, F41, G11.
5ECB
Working Paper Series No 1018March 2009
Non-technical summary
Cross-border mergers and acquisitions activities (M&As) sharply increased over the
last two decades, partly as result of financial liberalization policies, government
policies and regional agreements.
Capital reallocation across firms occurs either through the sale of property, plant and
equipment or through M&As, in which the transfer of financial claims from the
acquiring firm brings along that of the underlying assets of the targeted firm. In the
case of cross-border M&As, the main activity of the acquirer and target firms are
registered in two different countries. Various motives for M&As can be distinguished
in general. In the industrial organization literature two basic motives stand out: an
efficiency motive and a strategic motive. Efficiency gains arise because takeovers
increase economies of scale or scope. Strategic gains arise if M&As change the
market structure and thus a company’s competitive position and profit level. The main
problems with these explanations is that they cannot explain why cross-border M&As
move for example in waves together with developments in stock markets. Moreover,
cross-border mergers are related to economy-wide shocks, such as the European
economic integration.
In this paper, we identify some of the main forces driving M&As, using a unique
database on bilateral cross-border M&As at the sectoral level (in manufacturing and
services) over the period 1985-2004. The key empirical findings are: (1) EMU helped
the restructuring of capital within the same sector of manufacturing activity among
euro area firms; (2) joining the EU favoured both horizontal and vertical mergers; (3)
policymakers can help attract capital by reducing the corporate tax rates and the
degree of product market regulations and by improving the country’s financial
systems. Specifically, over the average period 1999-2004, EMU increased intra-euro
area cross-border horizontal M&As activity in manufacturing by 200%. The estimated
effect on euro area M&As from non-euro to euro area countries amounts to a 70%
increase. The impact of the euro on vertical mergers in manufacturing sectors from
non-euro to euro area countries is also important (about 140%). We also found that
the service industry has not yet fully benefited from European integration. Existing
barriers to trade in services could have undermined M&As decisions of entrepreneurs
in the services industry. Indeed, we show that the level of protection and barriers to
entry in the services sector act as a strong deterrent to cross-border M&As in services
across countries.
6ECBWorking Paper Series No 1018March 2009
We also find that profitability is a key driver of M&As, as the acquiring sector’s stock
market capitalization is an important explanatory variable of cross-border M&As
within the same sector as well as across sectors for both firm type in manufacturing
and services. Q theory suggests that if the market value of a firm over its book value
is greater than one - implying the existence of “intangibles” such as brands, reputation
and knowledge or growth potential that business analysts and shareholders value -
then the firm should increase its capital stock as investing is profitable. The empirical
results of this paper provide support to the Tobin’s q prediction, and this result can
explain also why cross-border M&As come in waves.
Finally, we obtain interesting results on the role of corporate taxation, which are
informative for government policies. A 10 percentage point decrease in the
differential in effective average corporate taxes between target and acquiring
countries would increase the outflows of manufacturing equity investment in the same
sector by 68%. This large effect suggests that changes in corporate taxes are an
efficient tool to attract foreign capital and raise the question of the coordination of
fiscal policies in Europe.
7ECB
Working Paper Series No 1018March 2009
1 Introduction
Cross-border mergers and acquisitions (M&As) have long been an important strategy to expand
abroad. Due to technological developments and globalization, M&As activity sharply increased over
the last two decades. They skyrocketed in the 1990s reaching a pick in 2000 with the booming stock
markets and the larger degree of financial liberalization worldwide, declined sharply in 2001 and 2002
and rebounded again with new developments in the world economy after 2003 (see Figures 1 to 3
in the appendix, section 7.1).1 Traditionally, developed countries, and in particular the developed
countries of the European Union (EU15) and the United States, have been the largest acquirer and
target countries of M&As. Over the 2003-2005 period, developed countries accounted for 85% of the
USD 465 billion cross-border M&As, 47% and 23% of which respectively pertain EU15 and US firms
either as acquirer or as target countries (UNCTAD (2006)).
Despite this increased importance of cross-border M&As, which constitute by far the largest share
of foreign direct investment, the determinants underlying such activities remain unclear.2 The only
empirical papers - we are aware of - are Di Giovanni (2005) and Head and Ries (2007), who using
respectively Tobit and the Poisson maximum likelihood method, find cultural and geographical prox-
imity to be important determinants of aggregate MAs; Berger at al. (2004) who using Tobit look at
determinants of cross-border transaction values in the financial sector; while Goerg et al (2006) and
Focarelli and Pozzolo (2008) focus on the number of cross-border deals using the negative binomial
regression model, respectively for M&As in manufacturing sectors and those in banking and insurance.
In this paper, we focus on the role of institutional and financial developments on cross-border
M&As related to manufacturing and service sectors with a special attention to the role played by
European integration using Poisson maximum likelihood method. The institutional environment is of
a particular interest for cross-border M&As since they are affected by various regulations at the country
level (or regional level) such as competition policy, corporate and capital taxes, various restrictions to
capital movements across borders, protection of certain industries.
From that perspective, the Single European Market in 1992 and the Third Stage of Economic
and Monetary Union (EMU) in 1999 constitute important experiments to evaluate the impact of
regional agreements on capital reallocation. In the paper, we jointly investigate the impact on cross-
border M&As of joining the European Union (EU effect), whose single market formally removes1Capital reallocation across firms occurs either through the sale of property, plant and equipment or through M&As,
in which the transfer of financial claims from the acquiring firm brings along that of the underlying assets of the targetedfirm. In the case of cross-border M&As, the main activity of the acquirer and target firms are registered in two differentcountries.
2A review of the literature in management science can be found in Shimizu et al (2004).
8ECBWorking Paper Series No 1018March 2009
the remaining barriers to free movements of capital, labour, goods and services within the European
Economic Community;3 and the impact of adopting the euro (EMU effect), whose introduction should
have facilitated the movement of capital by boosting financial integration in the euro area, through
the reduction of the cost of capital, the elimination of exchange rate risk, the sharing of common
trading platforms (e.g. the creation of Euronext through the cross-border merger of the Amsterdam,
Brussels, Lisbon and Paris exchanges) and integration in post-trading market infrastructure.
While the impact of the EMU on trade in goods and portfolio flows has attracted a great deal
of attention from policy makers and scholars,4 such analysis has not been performed for capital re-
allocation through cross-border M&As.5 Has EU/EMU fostered capital reallocation through M&As
across their member states? Has EU/EMU increased their capacity to attract capital from the rest of
the world? These are crucial questions for potential entrants who would like to assess the benefits of
joining EU/EMU.
Besides the role played by EU or EMU membership, understanding more broadly the determi-
nants of capital reallocation across countries is key for policymakers, as most countries try to provide
incentives to attract FDI without a clear evaluation of their policies.
Literature classifies the various motives to merge in the following main groups (see e.g. Perry and
Porter (1985), Andrade et al. (2001), Nocke and Yeaple (2007), Long et al. (2007)):6 1) high-Tobin’s
q firms are those with the best technology and seek to expand their capital stock7; 2) efficiency
gains arise because takeovers increase economies of scale or scope or other synergies, such as tax
considerations or acquisition of funds; 3) strategic gains arise if M&As change the market structure
and thus a company’s competitive position and profit level by forming monopolies or oligopolies; 4)3Neary (2007) shows that trade liberalization can trigger cross-border merger waves.4Examples of the former are Rose (2000), Micco, Stein and Ordonez (2003), Flam and Nordstrom (2003), Baldwin
and Taglioni (2006), Baldwin (2006); examples of the latter are Lane (2006), Coeurdacier and Martin (2006), De Santisand Gerard (2006).
5The closest paper to our work is Petroulas (2007), who estimated the impact of the introduction of the euro oninward FDI flows and finds that the EMU increased FDI flows by approximately 15% within the euro area. See also DeSousa and Lochard (2006a, 2006b) and Schiavo (2007) for related work on the impact of EMU on FDI flows. However,these studies do not control for developments in the stock market and for the general tendency of investing in the euroarea from the rest of the world. As a result, their estimates may be somewhat upward biased.
6See Nocke and Yeaple (2007) and Head and Ries (2007) for additional references on theoretical industrial organizationissues.
7Q theory suggests that if the market value of a firm over its book value is greater than one - implying the existenceof “intangibles” such as brands, reputation and knowledge or growth potential that business analysts and shareholdersvalue - then the firm should increase its capital stock as investing is profitable. Jovanovic and Rousseau (2002), forexample, show that the q-theory of investment can be used to explain domestic investment via M&As and find thatM&As respond to stock market developments by more than direct investment. Eisfeldt and Rampini (2005) used theTobin’s q to show that capital reallocation between firms is procyclical. De Santis et al. (2004) argue that the q-theoryof investment can also translate in higher FDI outflows and find that a rise in the euro area stock market (a proxyfor euro area Tobin’s q led to an increase in euro area outward FDI to the United States over the period 1980 to 2001.Similarly, De Santis and Ehling (2007) - looking at the interlinkages between FDI and foreign portfolio investment amongGermany, the other G7 economies and Switzerland over the quarterly period 1980-2006 - find that German FDI outflowsand inflows are both function of Tobin’s q.
9ECB
Working Paper Series No 1018March 2009
building empires allow to diversify and hedge against sectoral shocks; 5) managers might be motivated
by managerial compensation or pure ego. It is very difficult to empirically disentangle these different
strategic elements. We focus on the value-enhancing motives, which broadly encompass the first three
main groups. M&As can help satisfy future goods demand, can reduce costs, might change the market
structure and the market power, thereby affecting future profits captured by the market valuation of
the acquiring firm. We also attempt to look at the building empire motives by looking at mergers
within a given sector (horizontal) or across different sectors (vertical).
We also control for the impact of the quality of institutions in driving cross-border M&As. Sound
institutions and a high degree of governance play an important role in the competitiveness of an econ-
omy as well as a country’s credibility vis-a-vis international investors. Reliable institutions enhance
transparency, and sound legal and political systems offer a less uncertain environment to investors.
Therefore, countries’ institutions might also affect the reallocation of capital cross-border by reducing
the cost of the capital.8
We also raise the questions of the effectiveness of fiscal policies and of product market regulations
in attracting foreign capital. One implication of the processes of financial globalization and European
integration is that capital is more mobile internationally, which raises concerns regarding the use of tax
and market regulation policies in order to compete across countries. The issue of capital attractiveness
leads to several discussions within the EU on possible tax and market regulation harmonization among
member states. While one could argue that countries with higher corporate taxes and higher degree of
market regulations are less attractive for cross-border M&As, the quantitative impact of these policies
on firms’ location decisions is essentially an empirical question.
To assess the impact of the main forces driving cross-border M&As, we construct a unique database
for 10 acquiring manufacturing sectors and 10 acquiring service sectors located in 21 different countries
targeting foreign assets in 31 different host countries (over the 1985-2004 period). Specifically, an
acquiring manufacturing firm (sector) can merge with or acquire foreign firms whose main activity
can be classified (i) in the same sector of the acquiring firm (“within mergers”), or (ii) in a different
manufacturing sector or service sector (“across mergers”). Similarly, an acquiring service firm (sector)
can merge with or acquire foreign firms within the same sector, or whose main activity is either in
manufacturing or in a different service sector. We believe that mergers occurred within sectors includes
mostly horizontal mergers while mergers across sectors can be seen as vertical mergers.9
8Alfaro et al. (2007, 2008) find institutional quality to be a causal determinant of equity and FDI inflows (see alsoWei (2000a, 2000b) for earlier work on these issues). Using FDI stocks in a cross-section analysis, Daude and Fratzcher(2007) found that institutions do not affect FDI positions.
9We must be cautious with this interpretation since cross-border M&As are aggregated at the 2-digit level and somemergers within the same sector might be vertical ones.
10ECBWorking Paper Series No 1018March 2009
From 1948 to 1994, the General Agreement on Tariffs and Trade (GATT) provided the rules for
much of the world goods trade. Moreover, the OECD has been promoting the liberalization of capital
account operations among its members since the early 1960s. However, the code of liberalization cov-
ering cross-border services has not been yet agreed (OECD, 2002). The General Agreement on Trade
in Services (GATS) is the only agreement at the international level which regulates and liberalizes
trade in financial services as well as investment of financial services providers.10 The GATS agreement
was negotiated in the Uruguay Round (1986-1994). Members (self-)committed to launch successive
rounds of services negotiations with a view to achieving a progressively higher level of liberalization.
The first such round was to begin no later than five years from the date of entry into force of the
Agreement and, accordingly, started in 2000. Within the time frame of the overall negotiating deadline
of 1 January 2005, the Doha Development Agenda establishes that “participants shall submit initial
requests for specific commitments by 30 June 2002 and initial offers by 31 March 2003”. Needless to
say that large restrictions in trade in services are still in place and their elimination is under policy
discussion.
Therefore, we assess the determinants of cross-border M&As in such activities separately, as pooling
them in regression analysis would be inappropriate, given different developments on the process of
liberalization of trade and investment in manufacturing and services. This is especially important
when we test the impact of market regulations on cross-border M&As.
The key findings can be summarized as follows: (1) EMU helped the restructuring of capital within
the same sector of manufacturing activity, thereby enhancing efficiency, particularly among euro area
firms; (2) joining the EU implies adopting the Single European Market Act, which favored both
horizontal and vertical mergers; (3) the acquiring sector’s expected profitability is a key driver of cross-
border M&As; (4) policymakers can help attract capital by reducing the corporate tax rates and the
degree of market regulations and by improving the country’s financial systems. As expected, the degree
of market regulations plays a key-role for M&As in the service sector (but not for manufacturing); (5)
physical and cultural proximities facilitate cross-border M&As, while geographical distance is much
more relevant for developing countries.
Overall, we shed light on the major role played by European integration to foster cross-border
M&As between EMU countries in the manufacturing sector (preferential financial liberalization). On
top of this reallocation inside EMU, we also find that manufacturing sectors of both EU and EMU
have attracted equity capital from the rest of developed countries (unilateral financial liberalization).10According to the GATS agreement, trade in services can take different forms: cross-border trade, consumption
abroad, commercial presence, and presence of natural persons. Commercial presence implies that a service supplier ofone member establishes a territorial presence, including through ownership or lease of premises, in another member’sterritory to provide a service (e.g. domestic subsidiaries of foreign insurance companies or hotel chains).
11ECB
Working Paper Series No 1018March 2009
The European integration effects are not found in the service industry. We provide some evidence
suggesting that capital reallocation in services did not occur owing to the high degree of product
market regulations in these sectors, which hindered entry of foreign firms in national markets.
The remaining sections of the paper are structured as follows: Section 2 describes the estimation
strategy following the literature on gravity and FDI and presents the data. Sections 3 and 4 discuss the
main empirical results for manufacturing and services, respectively. Section 5 presents some additional
results on the role of EMU, financial depth and distance. Section 6 concludes.
2 Estimation strategy to model cross-border M&As
2.1 Theoretical motivation
We follow Head and Ries (2005, 2007) to model the location decision of multinational firms through
M&As.11 For simplicity, we abstract from time and sectoral subscripts.
Denote with pij the probability that a randomly drawn company from country i acquires a ran-
domly drawn target in country j. Using the total stock of targets in country j (kj) and the total
number of potential acquiring company in country i (mi), the expected value of mergers and acquisi-
tions (M&Aij) between country i and j is:
E(M&Aij) = mipijkj (1)
Assume also that net profits from an acquiring company si in country (i) for an investment in
country j are [πi−σtij+εsij ], where πi is the discounted value of the gross profits due to the profitability
of the merger, tij denote transaction costs between markets i and j (note that tij can be a multi-
dimensional vector) and εsij is random term of unobserved firm level characteristics, independently
distributed with Type I Extreme value cumulative distribution (CDF (ε) = exp(− exp(−ε))).
Using discrete choice theory (see Mac Fadden (1974)), one can show that under such assumptions:
pij =exp(πi − σtij)∑
l ml exp(πl − σtlj)(2)
where the probability to win the bid for a firm in country i is positively related to the discounted
value of its expected profits and negatively related to transaction costs; but it also depends on the
position of all the potential competitors, Bj =∑
l ml exp(πl − σtlj), with respect to market j. Using
the latter expression, we get:
E(M&Aij) = miexp(πi − σtij)
Bjkj (3)
11See also Guimaraes, Figueirdo and Woodward (2003).
12ECBWorking Paper Series No 1018March 2009
where Bj is a measure of the “financial remoteness” of market j. The interpretation of this term is
clearcut: (i) the higher the discounted value of the expected profits of all other potential buyers or
(ii) the easier it is for all potential acquiring firms to buy a target firm in country j, the more difficult
it is for a firm in country i to compete on such an asset. Given the analogy with the “multilateral
resistance factor” developed in the trade literature (Anderson and Van Wincoop (2003)), Bj is alike
the “market potential” (or “supplier access”). We can rewrite (3) as follows:
E(M&Aij) = exp (log(mi) + log(kj) − log(Bj) + πi − σtij) (4)
where mi and kj are related to market sizes, πi is related to the profitability of investments in country
i and tij is related to transaction costs between markets.
We can therefore use the gravity equations framework to estimate the impact of various determi-
nants of cross-border M&A in a given sector s, which takes the following form12
M&Aij,s,t = eαieαjeαteαs(Gdpi,s,t Gdpj,s,t)βZθij,s,tηij,s,t (5)
where M&Aij,s,t denotes M&A between source country i (acquirer) and host country j (target) at
time t in sector s, Gdpi,s,t (resp. Gdpj,s,t) stands for the market size of sector s in country i (resp.
j), Zij,s,t is a set of control variables (linked to expected profitability of firms, transactions costs and
other barriers) that might affect cross-border M&A and αi, αj , αt and αs are the source and host
country fixed effects, a time-fixed effect and a sectoral fixed-effect respectively. ηij,s,t is an error term
assumed to be statistically independent of the regressors.
The use of acquirer/target fixed-effects is necessary to control for unobservable countries charac-
teristics in order to limit potential biases due to omitted variables in the estimation. In particular, it
allows to control for the “financial remoteness” Bj of some host markets (assumed to be constant over
time). We also control for time fixed-effects since cross-border M&As have been strongly increasing
over time due to increasing financial integration across countries. As for Zij,s,t, we assume that they
are function of geography, institutions and financial variables capturing expected profitability of firms.
Variables are described in detail in the following subsections.
2.2 Description of the data on mergers and acquisitions
We construct an annual panel of cross-border M&As of completed transactions in the manufacturing
sector and services at the second digit for a sample of 21 “source” (acquiring) countries and 31 “host”
(target) countries using Thomson Financial (SDC Platinum) over the 1985-2004 period. Countries
and sectors (10 manufacturing and 10 service sectors) are described in the Appendix (section 7.2).12For other theoretical foundations of gravity models for FDI, see among others Bergstrand and Egger (2007) and
Ramondo (2007).
13ECB
Working Paper Series No 1018March 2009
The panel covers the largest industrialized markets, which accounts for a very large share of cross-
border M&As. For example, over the 1999-2004 period, the panel covers 74% of the world cross-border
M&As (72% in manufacturing and 75% in services). Over this period, the total annual transactions
covered by the panel amount to EUR 458 billions. Over the period considered, services accounted for
about one half of total cross-border M&As. At the end of the 1980s, cross-border M&As accounted
for about one tenth the amount of transactions recorded at the turn of the new century (see Tables
18 and 19 in the Appendix).
Over the period considered, the most important acquiring manufacturing sectors in terms of size
accounting for almost three quarters of global M&As in manufacturing are (i) chemicals, petroleum,
coal, rubber and plastic products, (ii) machinery and equipment, and (iii) food, beverages and tobacco.
For services, one third of world M&A in services involved electric, gas and water supply as the acquiring
sector with Japan being very active. The second most important sector is financial intermediation
excluding banking and insurance with the United States playing an important role.
We divide the twenty years sectoral observations in two main groups:
1) M&As occuring within the same sector (“within sectors”): acquirer and target firms belong to
the same sector.
2) M&As occuring across sectors (“across sectors”): the acquirer firm is targeting a firm whose
main activity does not belong to the sector of the acquirer (according to our level of disaggregation).
Broadly speaking, this decomposition allows us to indirectly disentangle the determinants of M&As
driven to allocate efficiently production across the globe from M&As that are intended to build con-
glomerates (and essentially driven by risk diversification motives or “empire building” motives). In
the sample, around two thirds of M&A transactions have occurred within the same sector.
2.3 Description of the regressors
Following expression (5), we study M&As by assessing the roles of market size, transaction costs and
firms’ expected profitability.
The first key variable is sectoral GDP in the source and the host country at time t. We restrict
the elasticity to be the same for country i and country j by using the log of the product of the two
GDPs at date t (log(Gdpi,s,t Gdpj,s,t)), but none of the results depend on this restriction.
As for transaction costs, the empirical literature on trade and FDI flows points out the roles of
geography and institutional settings. Accordingly, we use the bilateral geographical distance13 between
the main cities of country i and country j denoted by Distij and a dummy Borderij , which equals one
when the two countries share a common border. We also use the dummy ComLangij , which equals
13Geographical distance is taken from the data set on manufacturing trade of the World Bank (Nicita and Olarreaga(2007)).
14ECBWorking Paper Series No 1018March 2009
one if the two countries share a common language.
As for the institutional setting, we control for the quality of institutions in the source (resp. host)
country by means of an indicator of civil liberties CivLibi,t (resp. CivLibj,t) at time t, which measures
over time and across countries the freedom of expression and belief, the association and organization
rights, the rule of law and human rights, personal autonomy and economic rights. Civil liberties is
taken from Freedom House and ranges between one (the best country) and seven (the worst country).
It quantifies the expansion of political democracy, personal liberties, and good government practices,
which has been remarkable over the years, also because the abuse of power by governments and their
interference with the lives of their citizens have generally been on the declining trend. We expect
that an improvement in countries’ civil liberties reduces the cost of capital and encourages investment
in these economies. We choose this indicator rather than an indicator of institutional quality more
related to economic concepts mostly because of its wide cross-country coverage over the sample. This
indicator is nevertheless highly correlated to other institutional variables, such as corruption indices
from Transparency International or variables from La Porta et al. (2006).
In discussing the institutional setting, given the important role of EU and particularly euro area
firms in cross-border deals, it is useful to assess the role of European integration. To study the impact of
EMU we use two dummies constructed as follows: Emui,t Emuj,t is equal to one if both countries belong
to EMU at time t and zero otherwise; nonEmui,t Emuj,t is equal to one when the host country j belongs
to the euro zone but not the source country. Using two different dummies allow us to quantify the
impact of EMU on cross-border M&A both within the euro area (preferential financial liberalization)
and between countries outside the EMU and EMU countries (unilateral financial liberalization). One
could also add a dummy equal to 1 when the source country belongs to EMU but not the target.
Indeed, one could potentially expect some diversion effects similar to the trade literature. However,
this dummy was never significant and we decided not to consider it in our analysis.
A similar set of dummies is used to study the effect of EU: Eui,t Euj,t is equal to one if both
countries belong to the EU at time t and zero otherwise; nonEui,t Euj,t is equal to one when the
target belongs to the EU but not the acquirer.
As for expected profitability of firms, a neoclassical model of investment predicts that countries with
higher Tobin’s q increase their capital stock also through cross-border M&As. Therefore, we control
for the market capitalization over GDP of the acquirer country i in a given sector s: log(
MktCapi,s,t
GDPi,s,t
).
One could argue that the Tobin’s q should be measured by the market-to-book ratio but unfortunately
such a variable is not available for a wide cross-section of countries over the period considered. For the
countries on which data is available, the market-to-book ratio is highly correlated with market-to-GDP
15ECB
Working Paper Series No 1018March 2009
ratio: the correlation coefficient is as high as 0.9.14
We also control for the market value-GDP ratio of the target country j, as M&As might be more
likely when foreign capital is more economical (Baker, Foley and Wurgler (2008)), log(
MktCapj,s,t
GDPj,s,t
).
The use of the market capitalization to GDP ratio of acquirer and target countries can also help
controlling for equity bubbles, which ex post was particularly evident at the turn of the century. Data
market capitalization is the yearly average market value of the sector from Thomson Datastream and
data on sectoral GDPs are obtained from OECD (Stan database).
Finally, we study the role played by some other potential barriers to cross-border M&As such
as corporate taxation and product market regulation. We do not include these variables in our
benchmark regressions but add them in some robustness checks as they are not available for the whole
set of countries considered.
We assess the role of corporate taxation using annual corporate tax rates constructed by Devereux
and Griffith (2003) for a wide range of OECD countries.15
As for product market regulations, the OECD has constructed comprehensive and internationally-
comparable set of indicators that measure the degree to which policies promote or inhibit competition
in areas of the product market where competition is viable. Specifically, the indicators cover for-
mal regulations in the following areas: state control of business enterprizes, legal and administrative
barriers to entrepreneurship, barriers to international trade and investment16. Two different types
of product market indicators exist that are consistent across time and countries: (1) economy-wide
indicators and (2) sectoral indicators for a given country.
(1) The economy-wide indicator is an index that summarizes a large set of rules and regulations that
have the potential to reduce the strength of competition (regulations to entry, public ownership and
degree of competition). This indicator has been constructed for the economy as a whole only at two
points in time - 1998 and 2003 - and for the service industry for annual period between 1975 and 2003.
Given that the correlation between the aggregate indicators for services and the whole economy for
the two years 1998 and 2003 is very high (around 0.8), the indicator on the regulation for services is
used as a proxy for the degree of product market regulation also in manufacturing to cover the time
dimension of the sample. Moreover, the OECD disaggregates the product market regulation indica-
tor in three different dimensions: an index of regulation excluding public ownership (based on entry
barriers and degree of competition), an index of entry barriers and an index of public ownership. We
make use of these disaggregated components, as they can provide valuable information about which14Note that this correlation should be unity if the capital-output ratio were constant.15Data on corporate taxation among OECD countries over the period 1984-2004 are taken from M.P Devereux’s
website. See Devereux and Griffith (2003) and Devereux, Griffith and Klemm (2002).16Data on product regulations are available only for OECD countries (see Indicator of Product Market Regulations
on the OECD website for data source).
16ECBWorking Paper Series No 1018March 2009
dimension of regulations matters most for cross-border M&As.
(2) The sectoral indicators in OECD countries between 1975 and 2003 are computed assessing the
degree of regulations in some key service industries, such as airline, rail and road transport, elec-
tricity and gas, post and telecommunications and retail distribution (see Conway et al. (2005) and
Conway and Nicoletti (2006)). They measure the potential costs of anti-competitive regulation in a
given sector of the economy. Conversely, the indicators for manufacturing are incomplete, as they are
simply imputed from those in services using input-output tables: the indicators for manufacturing are
increasing with the use of the output of the service industries as intermediate inputs in the production
process of the sector.
The descriptive statistics concerning the sectoral indicators (across countries and across sectors)
are provided in the appendix (see Tables 16 and 17). They indicate that services are strongly regulated
particularly in Greece and France and less so in New Zealand, the UK and the US.
Finally, as robustness checks, we also control for bilateral trade in goods at the sectoral level as
well as the financial depth of a country using the ratio of domestic credit to GDP in the target and
acquiring country at a given date. Sectoral goods trade data (exports) are provided by the World Bank
(Nicita and Olarreaga (2007)), while domestic credit over GDP is provided by the World Development
Indicators of the World Bank.
2.4 Specification and methodology
Cross-border M&As (M&Aij,s,t) are the total value of assets purchased through M&As in the target
country j firms in sector s resident in country i at year t. The determinants of such variable are
obtained estimating the following regression
M&Aij,s,t = exp[αi + αj + αt + αs + β1 log(Gdpi,s,tGdpj,s,t) + β2 log(Distij) + β3Borderij + β4ComLangij
+β5CivLibi,t + β6CivLibj,t + β7 log(MktCapi,s,t
Gdpi,s,t) + β8 log(
MktCapj,s,t
Gdpj,s,t) + γ1Emui,t Emuj,t
+γ2nonEmui,t Emuj,t + δ1Eui,t Euj,t + δ2nonEui,t Euj,t + θzij,s,t] (6)
where the α’s are our set of fixed-effects, which control for unobservable country/sector characteristics,
and zij,s,t is a set of additional controls variables (not used in our benchmark regressions), such as
corporate taxation, product market regulation, exports and credit.
Once taken into account data attrition caused by our control variables, we have about 8000 ob-
servations in each manufacturing or service sector; since we have 10 sectors in manufacturing (resp.
10 in services), this makes approximately 80,000 observations in manufacturing (resp. 80,000 obser-
vations in services) of which about 5% are non-zero. Indeed, at a given date, in a given sector and
for a given pair of countries, it is very likely that no M&A deal occurs. The lack of M&As deals
17ECB
Working Paper Series No 1018March 2009
in the sample leads to biased estimators in standard OLS regression and therefore we use Poisson
Maximum-Likelihood estimators throughout the analysis (see Santos Silva and Tenreyro (2006), and
Head and Ries (2007)).17 As explained by Razin and Sadka (2007a, 2007b), Tobit estimators are
consistent if the presence of zeroes is due to measurement errors (some transactions are not observed).
While our data are certainly subject to some measurement errors (some M&As might not be recorded
by Thomson Financial), most of the zeroes are “true zeroes” in the sense that no M&As occur that
year for a given sector s and a given country-pair {i; j}. In that case, Tobit estimator are likely to be
biased. Therefore, the discussion of the empirical results is based on Poisson estimations.
Being concerned by the large amount of zeroes, we also ran regressions on bilateral cross-border
M&As at the aggregate level (where non-zero observations account for more than 20%): the estimates
are fully consistent with the results obtained using sectoral data. Therefore, we mostly focus the
analysis showing regression at the sectoral level (except for some robustness checks on the role of
EMU in Section 5 of the paper).
3 Cross-border M&As in manufacturing sectors
3.1 Total cross-border M&As
The results of the benchmark specifications for total manufacturing obtained using Poisson quasi-
MLE are shown in Table 1. The sectoral regressions cover the period 1985-2003 due to the lack of
the sectoral value added in 2004, while the aggregate regressions (non reported because results are
broadly similar) are based over the period 1985-2004.
Common language and border dummies are significant. The estimates of the common language
dummy is fully in line with previous estimates of Head and Ries (2007). Surprisingly, the impact of
geographical distance is close to zero and non significant while in previous papers it has been shown
to be a major determinant for M&A transactions (Di Giovanni (2005), Goerg, Hijzen and Manchin,
(2006), Head and Ries (2007)).18 We attribute this finding to the combination of three factors. First,
as shown by Head and Ries (2007) and Santos Silva and Tenreyro (2006), estimates tend to be strongly
biased upwards in standard OLS or Tobit estimations, which have been widely used in past literature.19
Second, most countries in our sample are developed markets. If distance proxies for information costs
(Portes and Rey (2005)) or monitoring costs (Head and Ries (2007)), it is very likely that such costs
are much less distance related among developed markets. Finally, the specification includes a border17Razin and Sadka (2007a, 2007b) also show the bias in OLS or Tobit estimations and correct it using an alternative
method based on an Heckman-selection model.18We also tested a dummy variable for a common legal system, following La Porta et al. (1998) but this variable was
not significant.19In an non-reported regression, we find that Tobit estimations give a large impact of distance on M&A transactions.
Other variables of interest were essentially unaffected.
18ECBWorking Paper Series No 1018March 2009
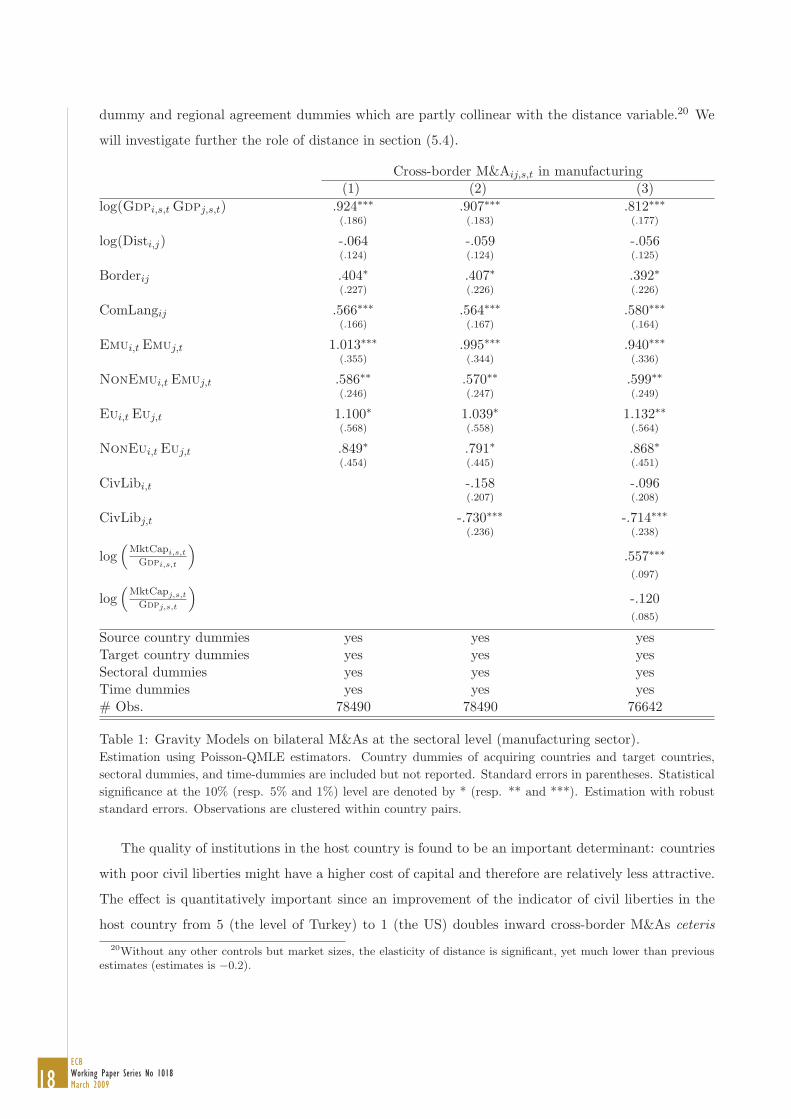
dummy and regional agreement dummies which are partly collinear with the distance variable.20 We
will investigate further the role of distance in section (5.4).
Cross-border M&Aij,s,t in manufacturing(1) (2) (3)
log(Gdpi,s,t Gdpj,s,t) .924∗∗∗ .907∗∗∗ .812∗∗∗(.186) (.183) (.177)
log(Disti,j) -.064 -.059 -.056(.124) (.124) (.125)
Borderij .404∗ .407∗ .392∗(.227) (.226) (.226)
ComLangij .566∗∗∗ .564∗∗∗ .580∗∗∗(.166) (.167) (.164)
Emui,t Emuj,t 1.013∗∗∗ .995∗∗∗ .940∗∗∗(.355) (.344) (.336)
NonEmui,t Emuj,t .586∗∗ .570∗∗ .599∗∗(.246) (.247) (.249)
Eui,t Euj,t 1.100∗ 1.039∗ 1.132∗∗(.568) (.558) (.564)
NonEui,t Euj,t .849∗ .791∗ .868∗(.454) (.445) (.451)
CivLibi,t -.158 -.096(.207) (.208)
CivLibj,t -.730∗∗∗ -.714∗∗∗(.236) (.238)
log(
MktCapi,s,t
Gdpi,s,t
).557∗∗∗(.097)
log(
MktCapj,s,t
Gdpj,s,t
)-.120(.085)
Source country dummies yes yes yesTarget country dummies yes yes yesSectoral dummies yes yes yesTime dummies yes yes yes# Obs. 78490 78490 76642
Table 1: Gravity Models on bilateral M&As at the sectoral level (manufacturing sector).Estimation using Poisson-QMLE estimators. Country dummies of acquiring countries and target countries,sectoral dummies, and time-dummies are included but not reported. Standard errors in parentheses. Statisticalsignificance at the 10% (resp. 5% and 1%) level are denoted by * (resp. ** and ***). Estimation with robuststandard errors. Observations are clustered within country pairs.
The quality of institutions in the host country is found to be an important determinant: countries
with poor civil liberties might have a higher cost of capital and therefore are relatively less attractive.
The effect is quantitatively important since an improvement of the indicator of civil liberties in the
host country from 5 (the level of Turkey) to 1 (the US) doubles inward cross-border M&As ceteris20Without any other controls but market sizes, the elasticity of distance is significant, yet much lower than previous
estimates (estimates is −0.2).
19ECB
Working Paper Series No 1018March 2009
paribus.
The interpretation of the EMU effects is relatively straightforward: the adoption of the single
currency has increased both cross-border M&As between euro area countries (preferential financial
liberalization, γ1 � 0.95) and M&As from non-euro area countries towards euro area countries (unilat-
eral financial liberalization, γ2 � 0.6). The magnitude of these effects is large since the single currency
has raised respectively intra-euro area cross-border M&As by 160% and M&As from non-euro area
countries towards euro area countries by 80%. In other words, EMU has increased cross-border M&As
towards the euro area from all over the globe (including the individual euro area countries) by 80% with
an additional increase between euro area countries of about 40%.21 The EMU effects on cross-border
M&As are of the same order of magnitude than those found for the reallocation of bond portfolios
and larger than those found for equity portfolios (see Lane (2005), Coeurdacier and Martin (2006),
De Santis and Gerard (2006)).
Similarly to the criticisms against the common currency effect on trade, it could be argued that the
EMU effects are too large because the gravity equations are not well performed. First, we control for
the common preferential trade agreement (the EU), geography as well as institution quality. Second,
the EMU effects are neither driven by unobservable characteristics of euro area countries (controlled
by source/host countries fixed effects), nor by an increasing number of M&As through time due to
financial liberalization (controlled by the time fixed-effects), nor by some cyclical properties of stock
prices in euro countries around the beginning of the EMU (controlled by both the acquirer and the
target countries market capitalization). Still, it can be argued that EMU dummies are capturing the
impact of some omitted variables. In the next section, we will try a number of potential candidates
(trade, taxation and market regulations)22. Moreover, we run some additional robustness checks in
section 5, focusing on the impact of EMU over time by controlling for unobservable factors with EMU
that have been constant over time. Results hardly change.
The results concerning the EU effects are similar to those described for EMU, but note that
δ1 = 1.13 and δ2 = 0.87 are not very different; everything else equal, the EU Single market has mostly
increased M&As towards the EU from all countries in the world. We have weak evidence that the
EU fostered M&As between EU countries in addition to the unilateral financial liberalization effect.
Overall, the additional “M&A creating” effect of the EU is slightly less robust than for EMU.
Finally, sectoral M&As strongly react to movements in the market capitalization to GDP ratio of
the acquiring sector. Sectors experiencing a stock market boom tend to expand by investing abroad21Given the functional form (5) and the definition of the two EMU dummies, the additional EMU effect between euro
area countries is computed as follows eγ1−γ2 − 1.22We also control for bilateral nominal exchange rate volatility. Results remain invariant and this additional control
was not significant (non-reported).
20ECBWorking Paper Series No 1018March 2009
through M&As. This is consistent with standard Q-theory of investment. The estimates are both
significant and large in magnitude. One could have expected that firms tend to buy assets in countries
experiencing a drop in asset prices. This would be consistent with an efficient reallocation of capital
from high Q countries towards low Q countries (see Jovanovic and Rousseau (2008)). This does not
seem to be the case, since the estimate is not significant (even though the sign is negative).
Bris et al. (2007) show that the euro has increased Tobin’s q-ratios among 11 euro area member
states relative to the other 5 European countries. Part of the increase in corporate valuations is
explained by the decrease in interest rates and by the decrease in the cost of equity. This result is very
interesting in the light of our paper because the impact of EMU via the stock market capitalization to
GDP ratio would capture the effect of the reduction of the cost of capital, while the binary variables
would capture other elements linked to the removal of barriers to financial trade, which have all
facilitated the reallocation of capital among euro area countries.
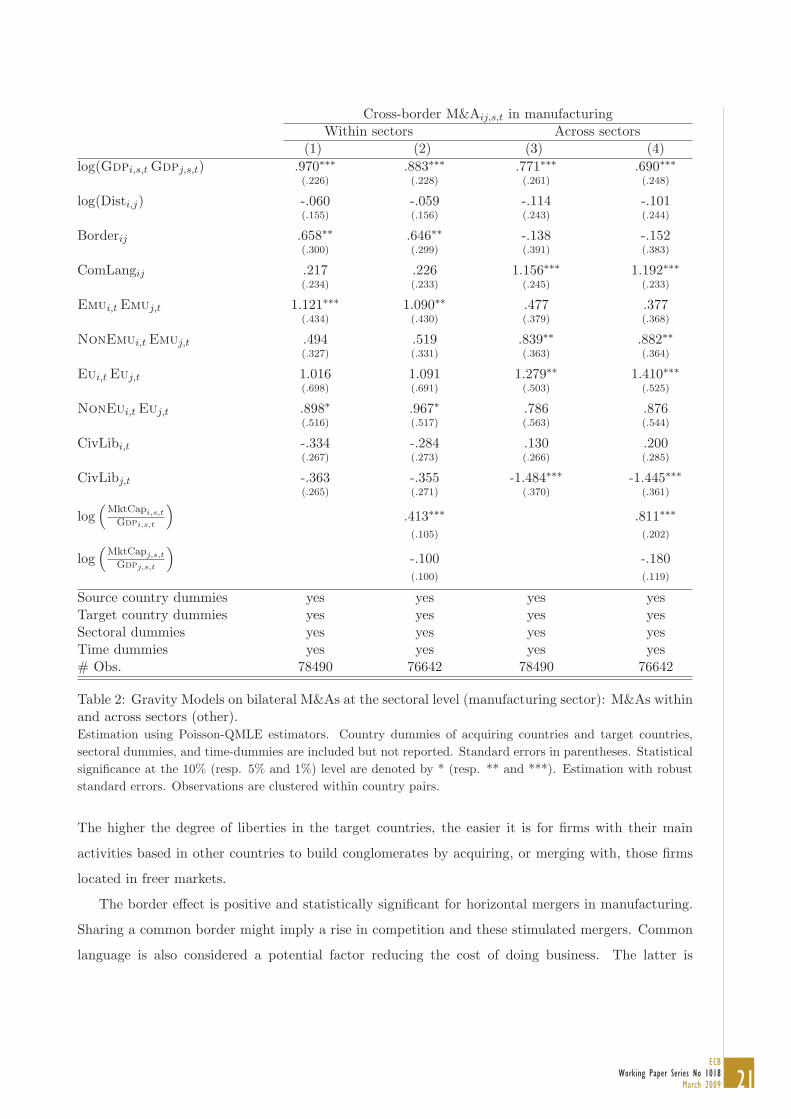
3.2 Cross-border M&As within and across sectors
How do results change when considering horizontal and vertical cross-border M&As separately? Re-
sults with such decomposition are shown in Table 2.
EMU increased intra euro area horizontal cross-border M&As in manufacturing by about 200%.
The estimated effect on euro area M&As from non-euro to euro area countries amounts to about 70%,
but it is statistically significant at 15% level. The impact of the euro on vertical M&As between euro
area countries is not statistically significant, while non-euro area countries seem to have diversified
their investment risk purchasing euro area assets. Therefore, the euro has facilitated cross-border
M&As within the euro area, which aimed at restructuring capital within the same sector of activity,
rather then boosting the formation of conglomerate activities between euro area sectors.
Both EU binary variables are very similar in magnitude in both horizontal and vertical mergers
of the manufacturing sector. However, reducing the number of observed deals by cutting the sample
in two increases the standard errors of the variables capturing the EU effect in (i) intra-EU horizon-
tal activity and (ii) extra-EU vertical mergers targeting EU firms, thereby making the coefficients
statistically significant only at 10-15% confidence interval.
A 1% increase in the stock market capitalization to GDP ratio in a given country is associated with
a 0.4% increase in mergers within the same sector (horizontal) from firms of that country, while the
response of mergers across sectors (vertical) is twice as large (0.8%). We see that as a confirmation that
stock market developments and profitability are important drivers of M&As whatever their nature.
As for the institutional setting, we find the variable to be statistically significant only for mergers
across sectors (vertical). The variable aims at capturing the degree of economic freedom in a country.
21ECB
Working Paper Series No 1018March 2009
Cross-border M&Aij,s,t in manufacturingWithin sectors Across sectors
(1) (2) (3) (4)log(Gdpi,s,t Gdpj,s,t) .970∗∗∗ .883∗∗∗ .771∗∗∗ .690∗∗∗
(.226) (.228) (.261) (.248)
log(Disti,j) -.060 -.059 -.114 -.101(.155) (.156) (.243) (.244)
Borderij .658∗∗ .646∗∗ -.138 -.152(.300) (.299) (.391) (.383)
ComLangij .217 .226 1.156∗∗∗ 1.192∗∗∗(.234) (.233) (.245) (.233)
Emui,t Emuj,t 1.121∗∗∗ 1.090∗∗ .477 .377(.434) (.430) (.379) (.368)
NonEmui,t Emuj,t .494 .519 .839∗∗ .882∗∗(.327) (.331) (.363) (.364)
Eui,t Euj,t 1.016 1.091 1.279∗∗ 1.410∗∗∗(.698) (.691) (.503) (.525)
NonEui,t Euj,t .898∗ .967∗ .786 .876(.516) (.517) (.563) (.544)
CivLibi,t -.334 -.284 .130 .200(.267) (.273) (.266) (.285)
CivLibj,t -.363 -.355 -1.484∗∗∗ -1.445∗∗∗(.265) (.271) (.370) (.361)
log(
MktCapi,s,t
Gdpi,s,t
).413∗∗∗ .811∗∗∗(.105) (.202)
log(
MktCapj,s,t
Gdpj,s,t
)-.100 -.180(.100) (.119)
Source country dummies yes yes yes yesTarget country dummies yes yes yes yesSectoral dummies yes yes yes yesTime dummies yes yes yes yes# Obs. 78490 76642 78490 76642
Table 2: Gravity Models on bilateral M&As at the sectoral level (manufacturing sector): M&As withinand across sectors (other).Estimation using Poisson-QMLE estimators. Country dummies of acquiring countries and target countries,sectoral dummies, and time-dummies are included but not reported. Standard errors in parentheses. Statisticalsignificance at the 10% (resp. 5% and 1%) level are denoted by * (resp. ** and ***). Estimation with robuststandard errors. Observations are clustered within country pairs.
The higher the degree of liberties in the target countries, the easier it is for firms with their main
activities based in other countries to build conglomerates by acquiring, or merging with, those firms
located in freer markets.
The border effect is positive and statistically significant for horizontal mergers in manufacturing.
Sharing a common border might imply a rise in competition and these stimulated mergers. Common
language is also considered a potential factor reducing the cost of doing business. The latter is
22ECBWorking Paper Series No 1018March 2009
significant for vertical mergers. Overall, the results suggest that physical and cultural proximity are
determinants of cross-border mergers in manufacturing.
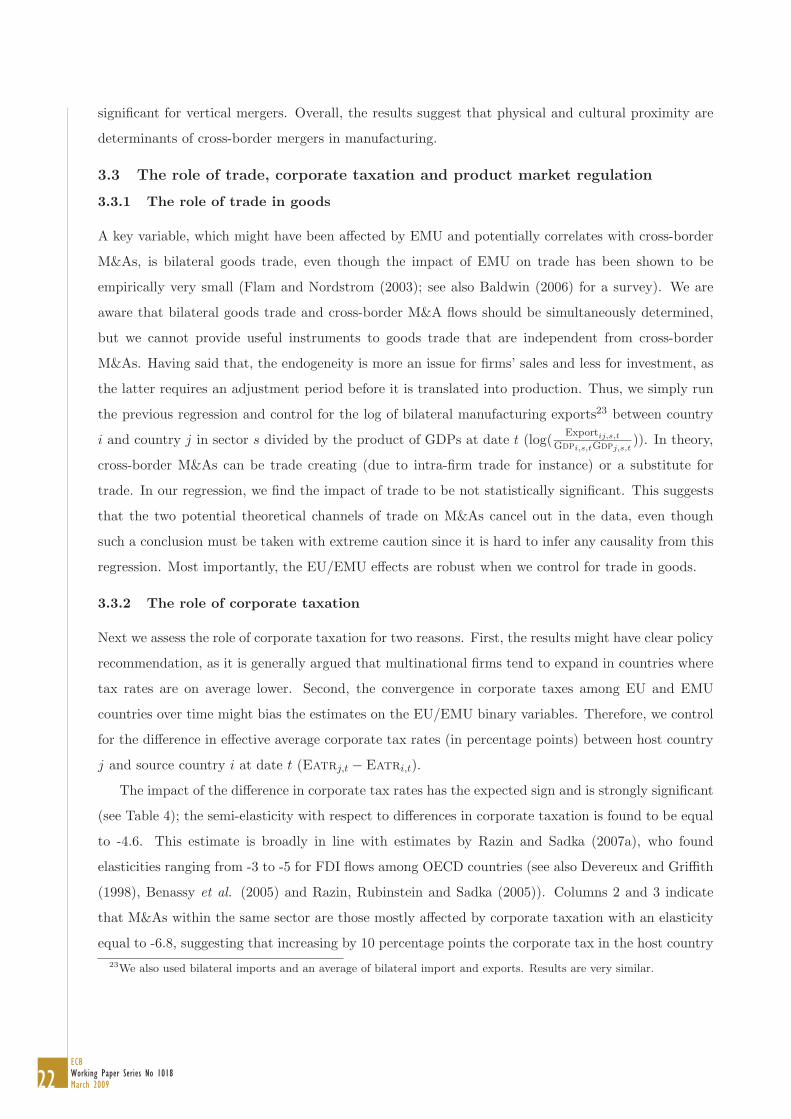
3.3 The role of trade, corporate taxation and product market regulation
3.3.1 The role of trade in goods
A key variable, which might have been affected by EMU and potentially correlates with cross-border
M&As, is bilateral goods trade, even though the impact of EMU on trade has been shown to be
empirically very small (Flam and Nordstrom (2003); see also Baldwin (2006) for a survey). We are
aware that bilateral goods trade and cross-border M&A flows should be simultaneously determined,
but we cannot provide useful instruments to goods trade that are independent from cross-border
M&As. Having said that, the endogeneity is more an issue for firms’ sales and less for investment, as
the latter requires an adjustment period before it is translated into production. Thus, we simply run
the previous regression and control for the log of bilateral manufacturing exports23 between country
i and country j in sector s divided by the product of GDPs at date t (log( Exportij,s,t
Gdpi,s,tGdpj,s,t)). In theory,
cross-border M&As can be trade creating (due to intra-firm trade for instance) or a substitute for
trade. In our regression, we find the impact of trade to be not statistically significant. This suggests
that the two potential theoretical channels of trade on M&As cancel out in the data, even though
such a conclusion must be taken with extreme caution since it is hard to infer any causality from this
regression. Most importantly, the EU/EMU effects are robust when we control for trade in goods.
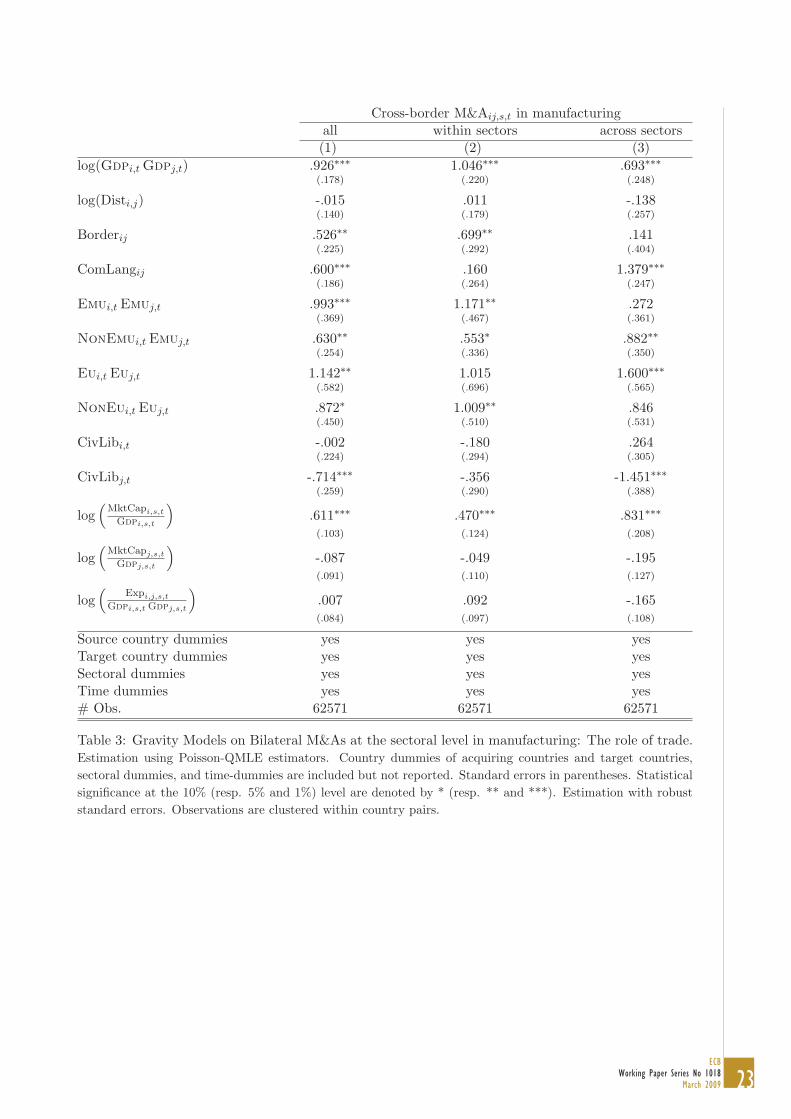
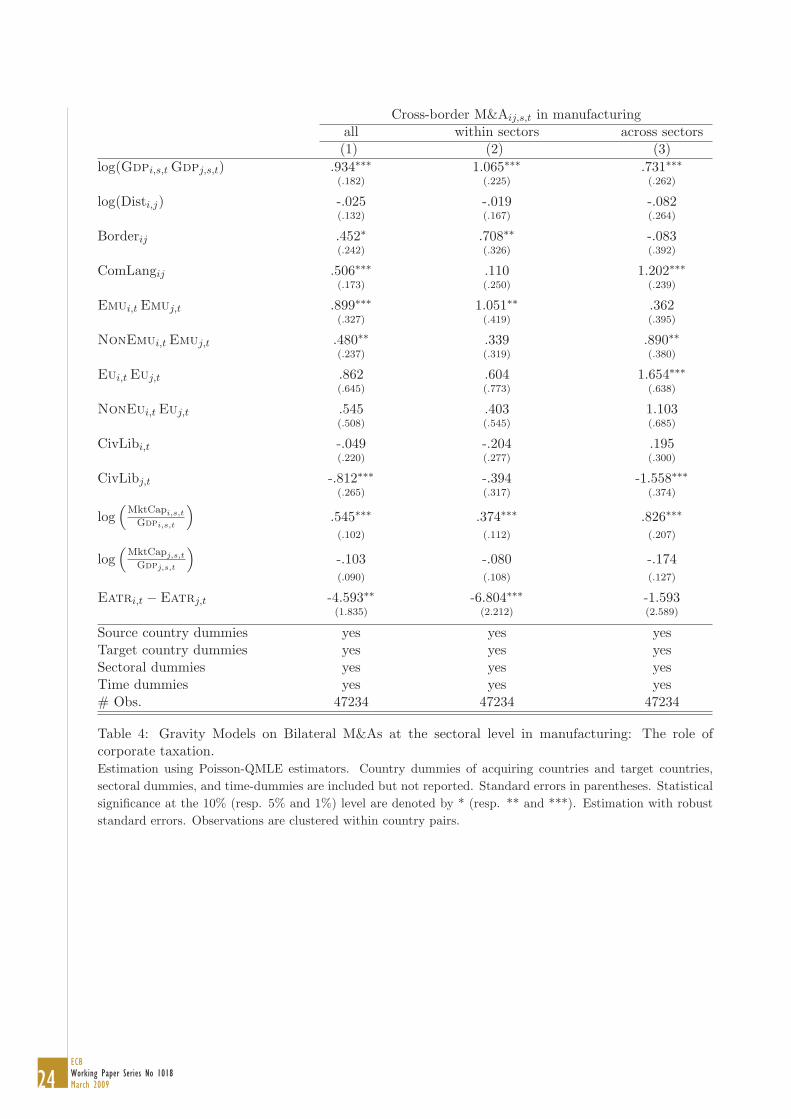
3.3.2 The role of corporate taxation
Next we assess the role of corporate taxation for two reasons. First, the results might have clear policy
recommendation, as it is generally argued that multinational firms tend to expand in countries where
tax rates are on average lower. Second, the convergence in corporate taxes among EU and EMU
countries over time might bias the estimates on the EU/EMU binary variables. Therefore, we control
for the difference in effective average corporate tax rates (in percentage points) between host country
j and source country i at date t (Eatrj,t − Eatri,t).
The impact of the difference in corporate tax rates has the expected sign and is strongly significant
(see Table 4); the semi-elasticity with respect to differences in corporate taxation is found to be equal
to -4.6. This estimate is broadly in line with estimates by Razin and Sadka (2007a), who found
elasticities ranging from -3 to -5 for FDI flows among OECD countries (see also Devereux and Griffith
(1998), Benassy et al. (2005) and Razin, Rubinstein and Sadka (2005)). Columns 2 and 3 indicate
that M&As within the same sector are those mostly affected by corporate taxation with an elasticity
equal to -6.8, suggesting that increasing by 10 percentage points the corporate tax in the host country23We also used bilateral imports and an average of bilateral import and exports. Results are very similar.
23ECB
Working Paper Series No 1018March 2009
Cross-border M&Aij,s,t in manufacturingall within sectors across sectors(1) (2) (3)
log(Gdpi,t Gdpj,t) .926∗∗∗ 1.046∗∗∗ .693∗∗∗(.178) (.220) (.248)
log(Disti,j) -.015 .011 -.138(.140) (.179) (.257)
Borderij .526∗∗ .699∗∗ .141(.225) (.292) (.404)
ComLangij .600∗∗∗ .160 1.379∗∗∗(.186) (.264) (.247)
Emui,t Emuj,t .993∗∗∗ 1.171∗∗ .272(.369) (.467) (.361)
NonEmui,t Emuj,t .630∗∗ .553∗ .882∗∗(.254) (.336) (.350)
Eui,t Euj,t 1.142∗∗ 1.015 1.600∗∗∗(.582) (.696) (.565)
NonEui,t Euj,t .872∗ 1.009∗∗ .846(.450) (.510) (.531)
CivLibi,t -.002 -.180 .264(.224) (.294) (.305)
CivLibj,t -.714∗∗∗ -.356 -1.451∗∗∗(.259) (.290) (.388)
log(
MktCapi,s,t
Gdpi,s,t
).611∗∗∗ .470∗∗∗ .831∗∗∗(.103) (.124) (.208)
log(
MktCapj,s,t
Gdpj,s,t
)-.087 -.049 -.195(.091) (.110) (.127)
log(
Expi,j,s,t
Gdpi,s,t Gdpj,s,t
).007 .092 -.165(.084) (.097) (.108)
Source country dummies yes yes yesTarget country dummies yes yes yesSectoral dummies yes yes yesTime dummies yes yes yes# Obs. 62571 62571 62571
Table 3: Gravity Models on Bilateral M&As at the sectoral level in manufacturing: The role of trade.Estimation using Poisson-QMLE estimators. Country dummies of acquiring countries and target countries,sectoral dummies, and time-dummies are included but not reported. Standard errors in parentheses. Statisticalsignificance at the 10% (resp. 5% and 1%) level are denoted by * (resp. ** and ***). Estimation with robuststandard errors. Observations are clustered within country pairs.
24ECBWorking Paper Series No 1018March 2009
Cross-border M&Aij,s,t in manufacturingall within sectors across sectors(1) (2) (3)
log(Gdpi,s,t Gdpj,s,t) .934∗∗∗ 1.065∗∗∗ .731∗∗∗(.182) (.225) (.262)
log(Disti,j) -.025 -.019 -.082(.132) (.167) (.264)
Borderij .452∗ .708∗∗ -.083(.242) (.326) (.392)
ComLangij .506∗∗∗ .110 1.202∗∗∗(.173) (.250) (.239)
Emui,t Emuj,t .899∗∗∗ 1.051∗∗ .362(.327) (.419) (.395)
NonEmui,t Emuj,t .480∗∗ .339 .890∗∗(.237) (.319) (.380)
Eui,t Euj,t .862 .604 1.654∗∗∗(.645) (.773) (.638)
NonEui,t Euj,t .545 .403 1.103(.508) (.545) (.685)
CivLibi,t -.049 -.204 .195(.220) (.277) (.300)
CivLibj,t -.812∗∗∗ -.394 -1.558∗∗∗(.265) (.317) (.374)
log(
MktCapi,s,t
Gdpi,s,t
).545∗∗∗ .374∗∗∗ .826∗∗∗(.102) (.112) (.207)
log(
MktCapj,s,t
Gdpj,s,t
)-.103 -.080 -.174(.090) (.108) (.127)
Eatri,t − Eatrj,t -4.593∗∗ -6.804∗∗∗ -1.593(1.835) (2.212) (2.589)
Source country dummies yes yes yesTarget country dummies yes yes yesSectoral dummies yes yes yesTime dummies yes yes yes# Obs. 47234 47234 47234
Table 4: Gravity Models on Bilateral M&As at the sectoral level in manufacturing: The role ofcorporate taxation.Estimation using Poisson-QMLE estimators. Country dummies of acquiring countries and target countries,sectoral dummies, and time-dummies are included but not reported. Standard errors in parentheses. Statisticalsignificance at the 10% (resp. 5% and 1%) level are denoted by * (resp. ** and ***). Estimation with robuststandard errors. Observations are clustered within country pairs.
25ECB
Working Paper Series No 1018March 2009
Cross-border M&Aij,s,t in manufacturingall within other all within other(1) (2) (3) (4) (5) (6)
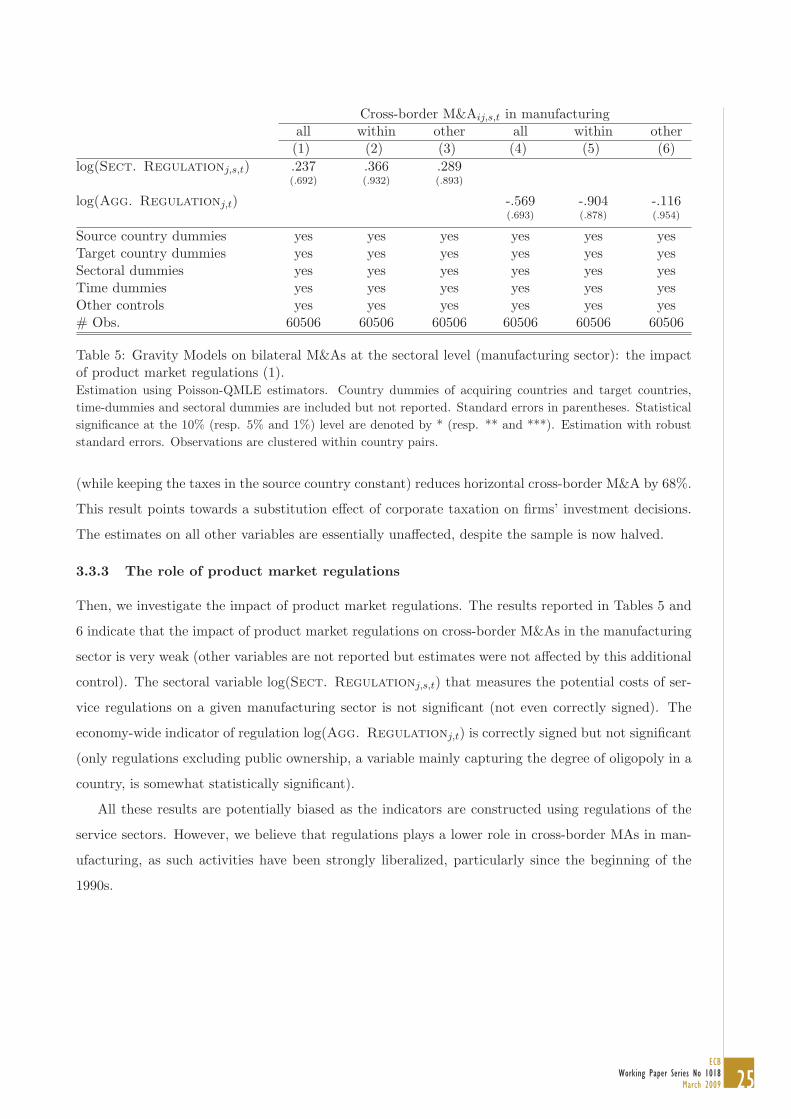
log(Sect. Regulationj,s,t) .237 .366 .289(.692) (.932) (.893)
log(Agg. Regulationj,t) -.569 -.904 -.116(.693) (.878) (.954)
Source country dummies yes yes yes yes yes yesTarget country dummies yes yes yes yes yes yesSectoral dummies yes yes yes yes yes yesTime dummies yes yes yes yes yes yesOther controls yes yes yes yes yes yes# Obs. 60506 60506 60506 60506 60506 60506
Table 5: Gravity Models on bilateral M&As at the sectoral level (manufacturing sector): the impactof product market regulations (1).Estimation using Poisson-QMLE estimators. Country dummies of acquiring countries and target countries,time-dummies and sectoral dummies are included but not reported. Standard errors in parentheses. Statisticalsignificance at the 10% (resp. 5% and 1%) level are denoted by * (resp. ** and ***). Estimation with robuststandard errors. Observations are clustered within country pairs.
(while keeping the taxes in the source country constant) reduces horizontal cross-border M&A by 68%.
This result points towards a substitution effect of corporate taxation on firms’ investment decisions.
The estimates on all other variables are essentially unaffected, despite the sample is now halved.
3.3.3 The role of product market regulations
Then, we investigate the impact of product market regulations. The results reported in Tables 5 and
6 indicate that the impact of product market regulations on cross-border M&As in the manufacturing
sector is very weak (other variables are not reported but estimates were not affected by this additional
control). The sectoral variable log(Sect. Regulationj,s,t) that measures the potential costs of ser-
vice regulations on a given manufacturing sector is not significant (not even correctly signed). The
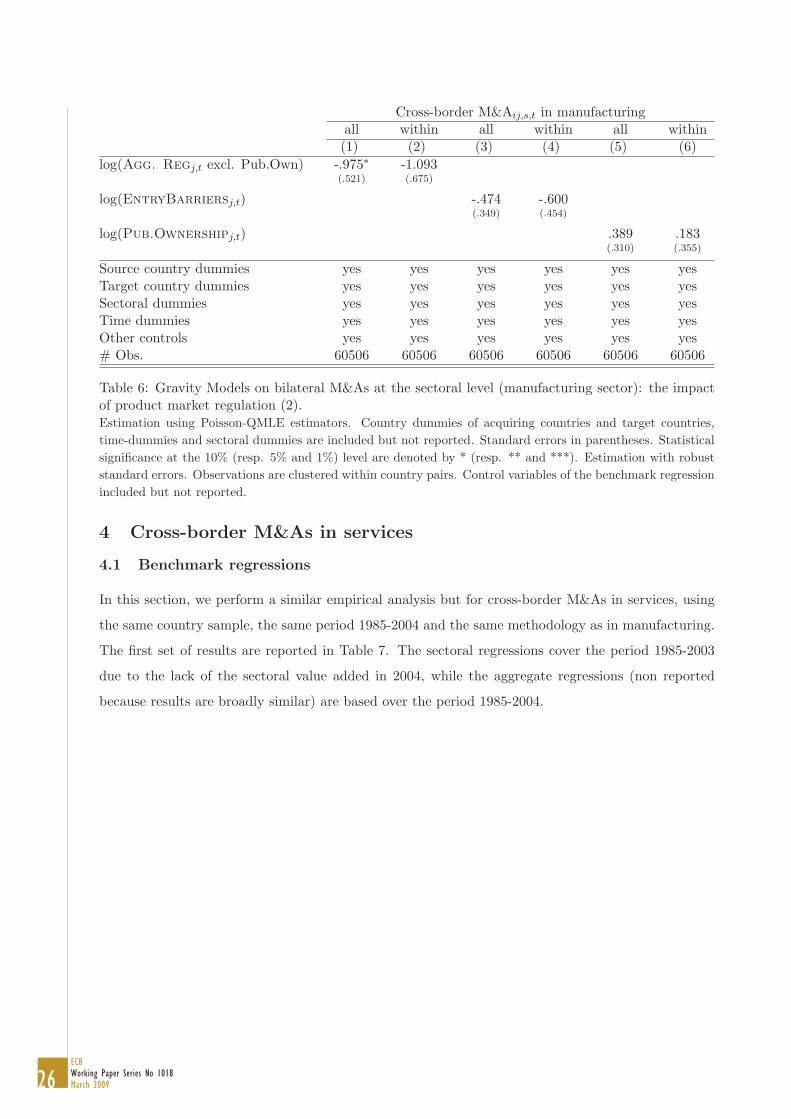
economy-wide indicator of regulation log(Agg. Regulationj,t) is correctly signed but not significant
(only regulations excluding public ownership, a variable mainly capturing the degree of oligopoly in a
country, is somewhat statistically significant).
All these results are potentially biased as the indicators are constructed using regulations of the
service sectors. However, we believe that regulations plays a lower role in cross-border MAs in man-
ufacturing, as such activities have been strongly liberalized, particularly since the beginning of the
1990s.
26ECBWorking Paper Series No 1018March 2009
Cross-border M&Aij,s,t in manufacturingall within all within all within(1) (2) (3) (4) (5) (6)
log(Agg. Regj,t excl. Pub.Own) -.975∗ -1.093(.521) (.675)
log(EntryBarriersj,t) -.474 -.600(.349) (.454)
log(Pub.Ownershipj,t) .389 .183(.310) (.355)
Source country dummies yes yes yes yes yes yesTarget country dummies yes yes yes yes yes yesSectoral dummies yes yes yes yes yes yesTime dummies yes yes yes yes yes yesOther controls yes yes yes yes yes yes# Obs. 60506 60506 60506 60506 60506 60506
Table 6: Gravity Models on bilateral M&As at the sectoral level (manufacturing sector): the impactof product market regulation (2).Estimation using Poisson-QMLE estimators. Country dummies of acquiring countries and target countries,time-dummies and sectoral dummies are included but not reported. Standard errors in parentheses. Statisticalsignificance at the 10% (resp. 5% and 1%) level are denoted by * (resp. ** and ***). Estimation with robuststandard errors. Observations are clustered within country pairs. Control variables of the benchmark regressionincluded but not reported.
4 Cross-border M&As in services
4.1 Benchmark regressions
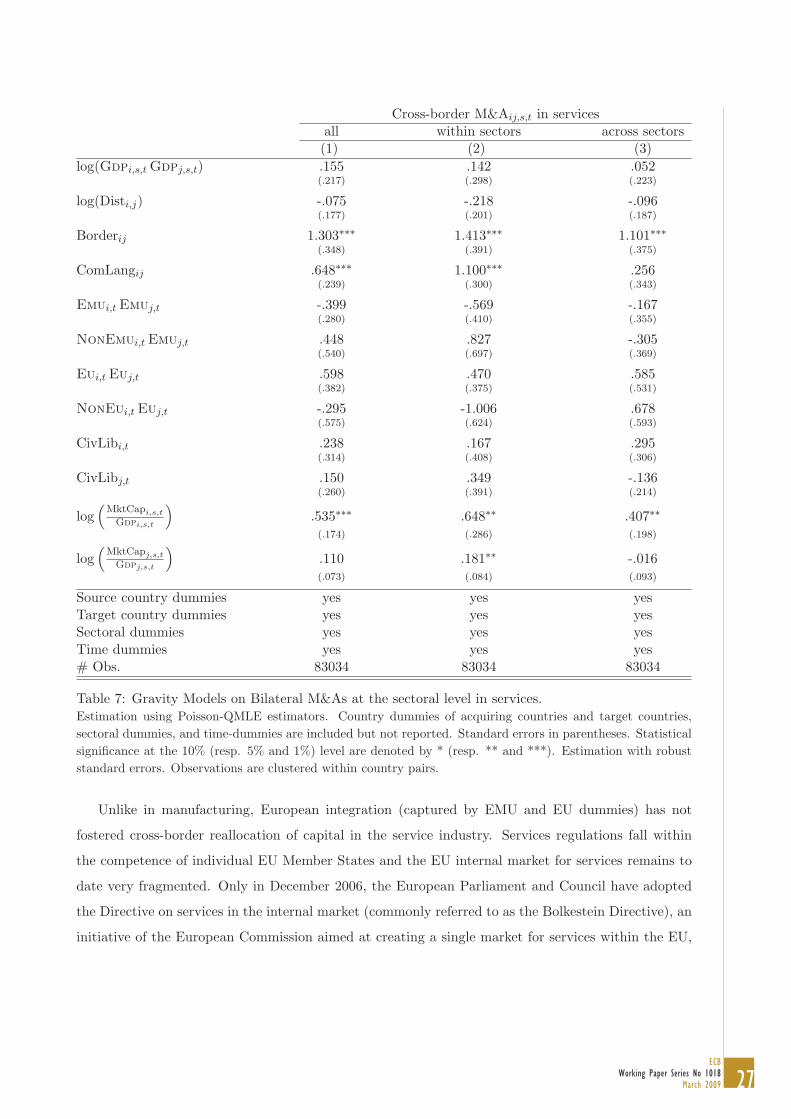
In this section, we perform a similar empirical analysis but for cross-border M&As in services, using
the same country sample, the same period 1985-2004 and the same methodology as in manufacturing.
The first set of results are reported in Table 7. The sectoral regressions cover the period 1985-2003
due to the lack of the sectoral value added in 2004, while the aggregate regressions (non reported
because results are broadly similar) are based over the period 1985-2004.
27ECB
Working Paper Series No 1018March 2009
Cross-border M&Aij,s,t in servicesall within sectors across sectors(1) (2) (3)
log(Gdpi,s,t Gdpj,s,t) .155 .142 .052(.217) (.298) (.223)
log(Disti,j) -.075 -.218 -.096(.177) (.201) (.187)
Borderij 1.303∗∗∗ 1.413∗∗∗ 1.101∗∗∗(.348) (.391) (.375)
ComLangij .648∗∗∗ 1.100∗∗∗ .256(.239) (.300) (.343)
Emui,t Emuj,t -.399 -.569 -.167(.280) (.410) (.355)
NonEmui,t Emuj,t .448 .827 -.305(.540) (.697) (.369)
Eui,t Euj,t .598 .470 .585(.382) (.375) (.531)
NonEui,t Euj,t -.295 -1.006 .678(.575) (.624) (.593)
CivLibi,t .238 .167 .295(.314) (.408) (.306)
CivLibj,t .150 .349 -.136(.260) (.391) (.214)
log(
MktCapi,s,t
Gdpi,s,t
).535∗∗∗ .648∗∗ .407∗∗(.174) (.286) (.198)
log(
MktCapj,s,t
Gdpj,s,t
).110 .181∗∗ -.016(.073) (.084) (.093)
Source country dummies yes yes yesTarget country dummies yes yes yesSectoral dummies yes yes yesTime dummies yes yes yes# Obs. 83034 83034 83034
Table 7: Gravity Models on Bilateral M&As at the sectoral level in services.Estimation using Poisson-QMLE estimators. Country dummies of acquiring countries and target countries,sectoral dummies, and time-dummies are included but not reported. Standard errors in parentheses. Statisticalsignificance at the 10% (resp. 5% and 1%) level are denoted by * (resp. ** and ***). Estimation with robuststandard errors. Observations are clustered within country pairs.
Unlike in manufacturing, European integration (captured by EMU and EU dummies) has not
fostered cross-border reallocation of capital in the service industry. Services regulations fall within
the competence of individual EU Member States and the EU internal market for services remains to
date very fragmented. Only in December 2006, the European Parliament and Council have adopted
the Directive on services in the internal market (commonly referred to as the Bolkestein Directive), an
initiative of the European Commission aimed at creating a single market for services within the EU,
28ECBWorking Paper Series No 1018March 2009
similar to the single market for goods.24 If this directive helps liberalizing trade in services, it might
trigger a new wave of cross-border mergers.
Although distance is not significant, physical and cultural proximity affect cross-border M&As
in services given the large and highly significant estimates of the impacts of border and common
language. This confirms the results obtained for manufacturing. Again, in our sample, geography is
not a key-driver of capital reallocation across borders. Given that existing literature founds distance
to be an important barrier to cross-border M&As (Di Giovanni (2005), Head and Ries (2007), Goerg
et al (2006)), we will investigate this issue more in depth in section (5.4).
We also find that cross-border M&As of services are fostered by stock market expansions of the
acquiring sector. This result is robust across all specifications aiming at capturing horizontal and
vertical M—As. Quantitatively, the response to an increase in the acquiring sector’s stock market
over GDP ratio is very similar to that obtained in the case of manufacturing. This evidence confirms
the major role played by stock markets developments in triggering cross-border reallocation of capital
across the globe.25
We do not report the regressions including differences in corporate taxation because it is not
statistically significant, while we cannot control for trade in services due to lack of data. The fact that
institutions and corporate taxation are not significant may be due to the large trade barriers existing
in the service industry. This issue is looked carefully in the next session.
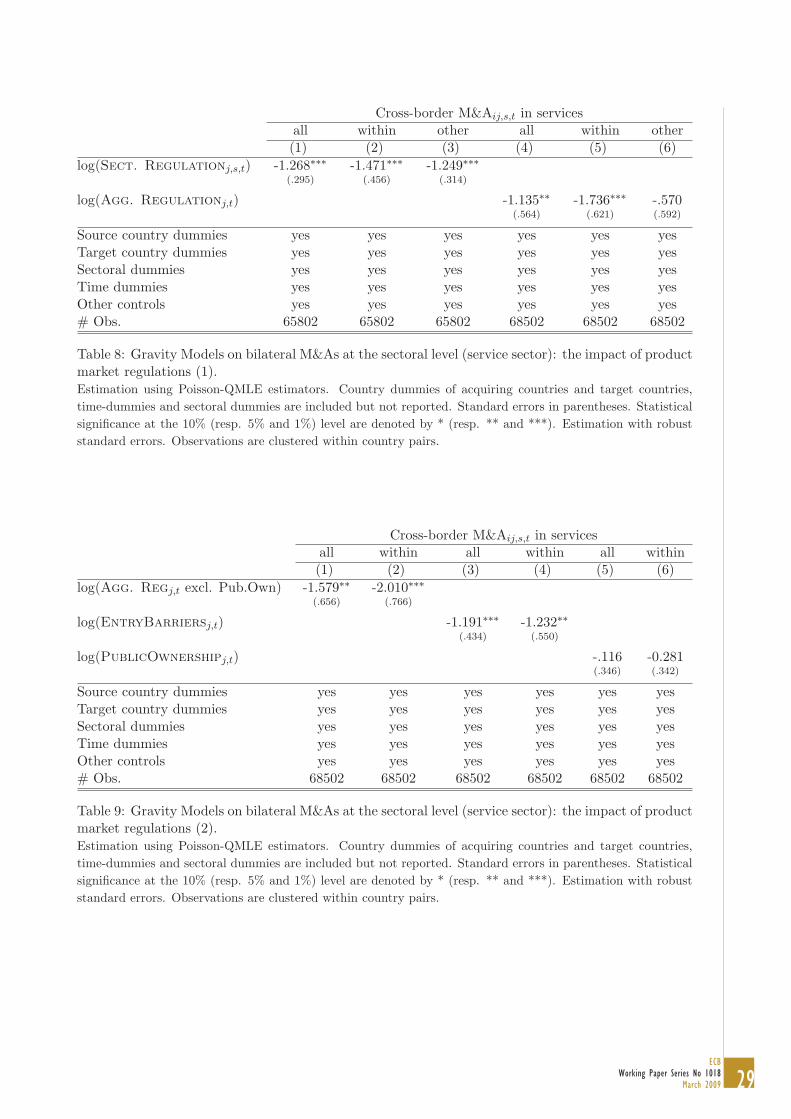
4.2 The role of product market regulations
We expect the role of market regulations to be a key determinant in services, as most sectors are
strongly protected. This is confirmed by the data (see Tables 8 and 9): the impact of product market
regulations on cross-border M&As in services is strong, statistically significant and robust across the
various alternative measures. Quantitative estimates are also very similar, regardless whether using
the aggregate (log(Agg. Regulationj,t)) or the sectoral indicators (log(Sect. Regulationj,s,t)).
Interestingly, the percentage of shares owned by the government is not an impediment for cross-border
M&As in services, while tougher entry regulations or lower competition in the domestic economy24This Directive is seen as an important kick-start to the Lisbon Agenda which, launched in 2000, is an agreed
strategy to make the EU ”the world’s most dynamic and competitive economy” by 2010. With the proposed legislation,the Commission wants to reduce the barriers to cross-border trade in services, objectively justified on the grounds ofpublic interest.
25One could be concerned that we do not control well for market sizes in our regressions, which might cast doubt onour results. Indeed, the impact of GDPs is small and not statistically significant. But, most of the impact of marketsizes is already taken care of by the source and host country fixed-effects. In fact, GDP changes in the service sector arevery smooth, which makes it harder to identify their impact over time. Note that we obtain coefficients on GDP closeto one when excluding fixed effects.
29ECB
Working Paper Series No 1018March 2009
Cross-border M&Aij,s,t in servicesall within other all within other(1) (2) (3) (4) (5) (6)
log(Sect. Regulationj,s,t) -1.268∗∗∗ -1.471∗∗∗ -1.249∗∗∗(.295) (.456) (.314)
log(Agg. Regulationj,t) -1.135∗∗ -1.736∗∗∗ -.570(.564) (.621) (.592)
Source country dummies yes yes yes yes yes yesTarget country dummies yes yes yes yes yes yesSectoral dummies yes yes yes yes yes yesTime dummies yes yes yes yes yes yesOther controls yes yes yes yes yes yes# Obs. 65802 65802 65802 68502 68502 68502
Table 8: Gravity Models on bilateral M&As at the sectoral level (service sector): the impact of productmarket regulations (1).Estimation using Poisson-QMLE estimators. Country dummies of acquiring countries and target countries,time-dummies and sectoral dummies are included but not reported. Standard errors in parentheses. Statisticalsignificance at the 10% (resp. 5% and 1%) level are denoted by * (resp. ** and ***). Estimation with robuststandard errors. Observations are clustered within country pairs.
Cross-border M&Aij,s,t in servicesall within all within all within(1) (2) (3) (4) (5) (6)
log(Agg. Regj,t excl. Pub.Own) -1.579∗∗ -2.010∗∗∗(.656) (.766)
log(EntryBarriersj,t) -1.191∗∗∗ -1.232∗∗(.434) (.550)
log(PublicOwnershipj,t) -.116 -0.281(.346) (.342)
Source country dummies yes yes yes yes yes yesTarget country dummies yes yes yes yes yes yesSectoral dummies yes yes yes yes yes yesTime dummies yes yes yes yes yes yesOther controls yes yes yes yes yes yes# Obs. 68502 68502 68502 68502 68502 68502
Table 9: Gravity Models on bilateral M&As at the sectoral level (service sector): the impact of productmarket regulations (2).Estimation using Poisson-QMLE estimators. Country dummies of acquiring countries and target countries,time-dummies and sectoral dummies are included but not reported. Standard errors in parentheses. Statisticalsignificance at the 10% (resp. 5% and 1%) level are denoted by * (resp. ** and ***). Estimation with robuststandard errors. Observations are clustered within country pairs.
30ECBWorking Paper Series No 1018March 2009
reduces the degree of foreign investment (see Table 9). Services account for around 70% of value-
added in most OECD countries and, depending on the country, account for between one-third and
one-half of total intermediate inputs of manufacturing activities (e.g. business services, transport,
telecommunications and electricity). Therefore, policymakers can attract large amounts of equity
capital by reducing the degree of market regulations in the service sectors. Quantitatively, such
policies can have large impact. According to the estimate on total cross-border M&As (and using the
aggregate index; see Table 8, column (1)), ceteris paribus, reducing the degree of regulations from the
level of the most regulated countries over the period 1998-2003 (France and Greece) to the level of
the least regulated (US and UK) could increase inward investment towards these countries by about
70%, an economically large impact.26
All in all, as for the manufacturing sector, proximity and expected profitability are key determi-
nants of cross-border M&As in services. Furthermore, domestic regulations are relevant for foreign
investors, because the implied fixed costs to enter the domestic market are potentially larger than the
economies of scale and scope resulting from the M&As. Conversely, institutional variables (EMU, EU,
civil liberties) perform poorly in explaining cross-border M&As in services. Most likely, the existing
international barriers in the service industry have dramatically reduced the potential role of European
integration and, more specifically, have dampened the potential impact of the adoption of the single
currency.
5 Robustness checks
5.1 Robustness checks concerning the EMU effect in manufacturing
One common criticism in the literature on the role of common currencies on trade is that the usual
regression does not control for some unobservable characteristics (constant over time) in the bilateral
dimension; if such a variable increases both the probability of joining the same currency union and
the intensity of transactions between the two countries, the coefficient related to the impact of the
common currency would be biased upward (see Glick and Rose (2002), Baldwin and Taglioni (2006)).
The various robustness checks require the use of additional dummy variables. In all our robustness
checks, we keep all the controls of our benchmark regression (column (3) of Table 1).
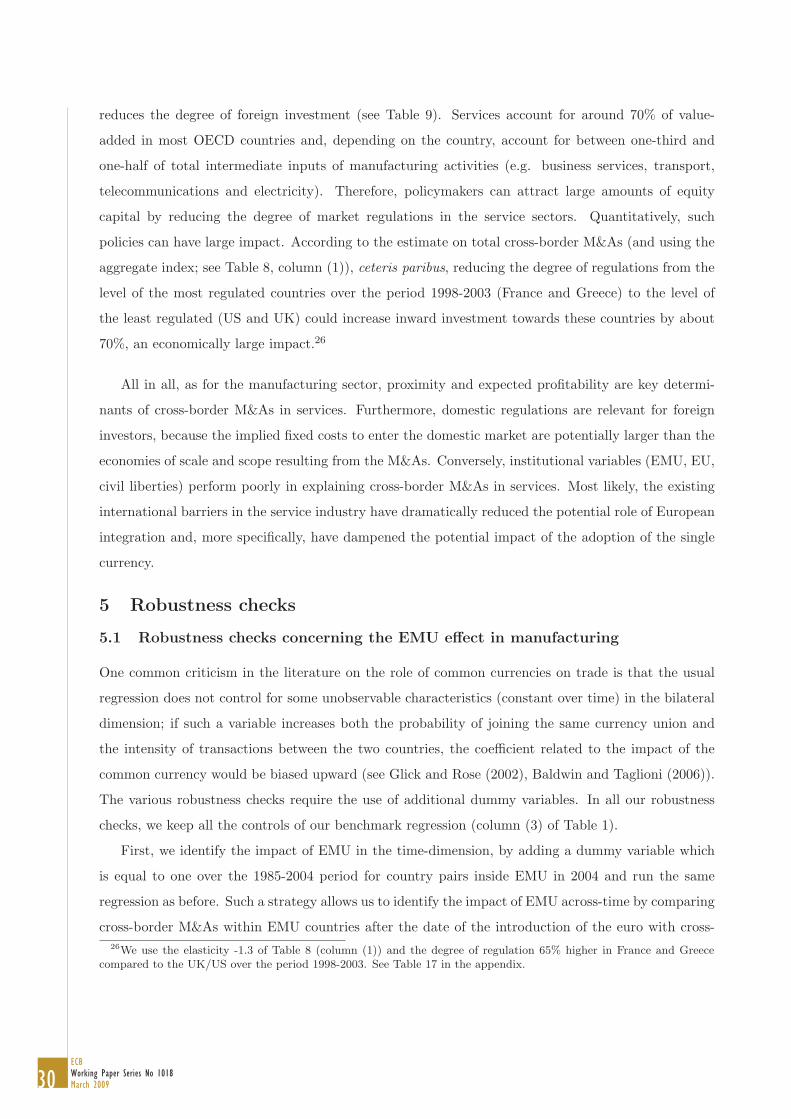
First, we identify the impact of EMU in the time-dimension, by adding a dummy variable which
is equal to one over the 1985-2004 period for country pairs inside EMU in 2004 and run the same
regression as before. Such a strategy allows us to identify the impact of EMU across-time by comparing
cross-border M&As within EMU countries after the date of the introduction of the euro with cross-26We use the elasticity -1.3 of Table 8 (column (1)) and the degree of regulation 65% higher in France and Greece
compared to the UK/US over the period 1998-2003. See Table 17 in the appendix.
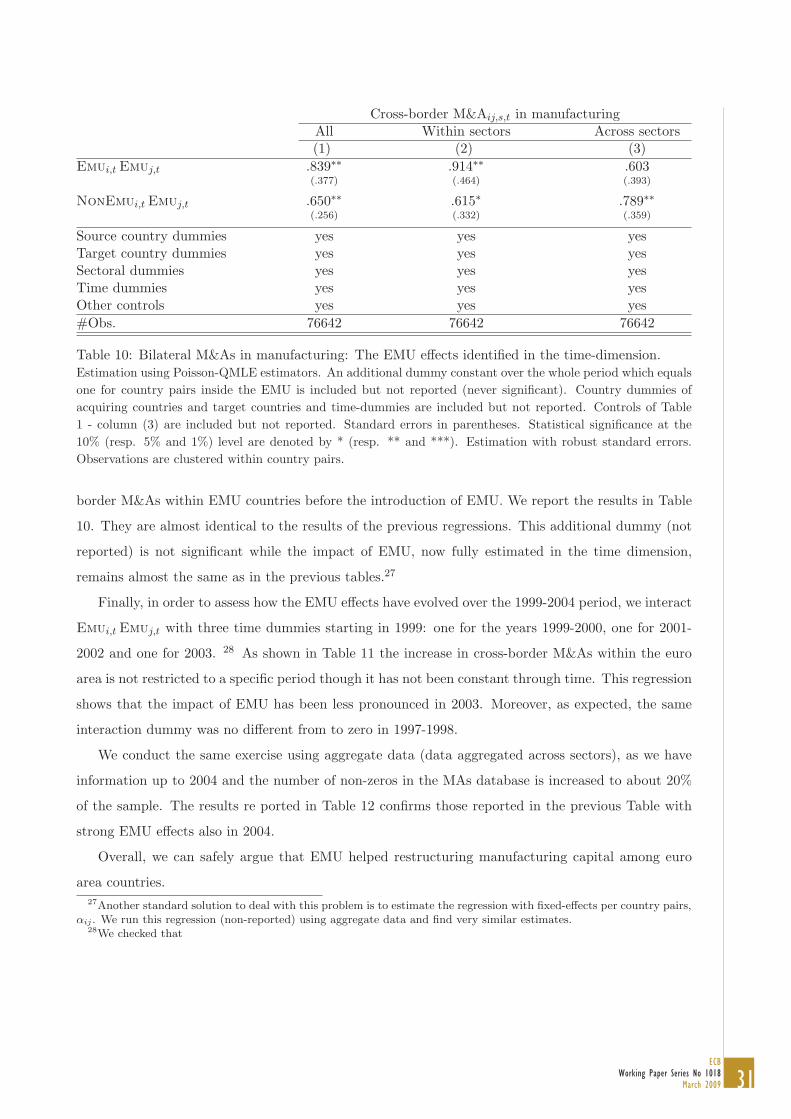
31ECB
Working Paper Series No 1018March 2009
Cross-border M&Aij,s,t in manufacturingAll Within sectors Across sectors(1) (2) (3)
Emui,t Emuj,t .839∗∗ .914∗∗ .603(.377) (.464) (.393)
NonEmui,t Emuj,t .650∗∗ .615∗ .789∗∗(.256) (.332) (.359)
Source country dummies yes yes yesTarget country dummies yes yes yesSectoral dummies yes yes yesTime dummies yes yes yesOther controls yes yes yes#Obs. 76642 76642 76642
Table 10: Bilateral M&As in manufacturing: The EMU effects identified in the time-dimension.Estimation using Poisson-QMLE estimators. An additional dummy constant over the whole period which equalsone for country pairs inside the EMU is included but not reported (never significant). Country dummies ofacquiring countries and target countries and time-dummies are included but not reported. Controls of Table1 - column (3) are included but not reported. Standard errors in parentheses. Statistical significance at the10% (resp. 5% and 1%) level are denoted by * (resp. ** and ***). Estimation with robust standard errors.Observations are clustered within country pairs.
border M&As within EMU countries before the introduction of EMU. We report the results in Table
10. They are almost identical to the results of the previous regressions. This additional dummy (not
reported) is not significant while the impact of EMU, now fully estimated in the time dimension,
remains almost the same as in the previous tables.27
Finally, in order to assess how the EMU effects have evolved over the 1999-2004 period, we interact
Emui,t Emuj,t with three time dummies starting in 1999: one for the years 1999-2000, one for 2001-
2002 and one for 2003. 28 As shown in Table 11 the increase in cross-border M&As within the euro
area is not restricted to a specific period though it has not been constant through time. This regression
shows that the impact of EMU has been less pronounced in 2003. Moreover, as expected, the same
interaction dummy was no different from to zero in 1997-1998.
We conduct the same exercise using aggregate data (data aggregated across sectors), as we have
information up to 2004 and the number of non-zeros in the MAs database is increased to about 20%
of the sample. The results re ported in Table 12 confirms those reported in the previous Table with
strong EMU effects also in 2004.
Overall, we can safely argue that EMU helped restructuring manufacturing capital among euro
area countries.27Another standard solution to deal with this problem is to estimate the regression with fixed-effects per country pairs,
αij . We run this regression (non-reported) using aggregate data and find very similar estimates.28We checked that
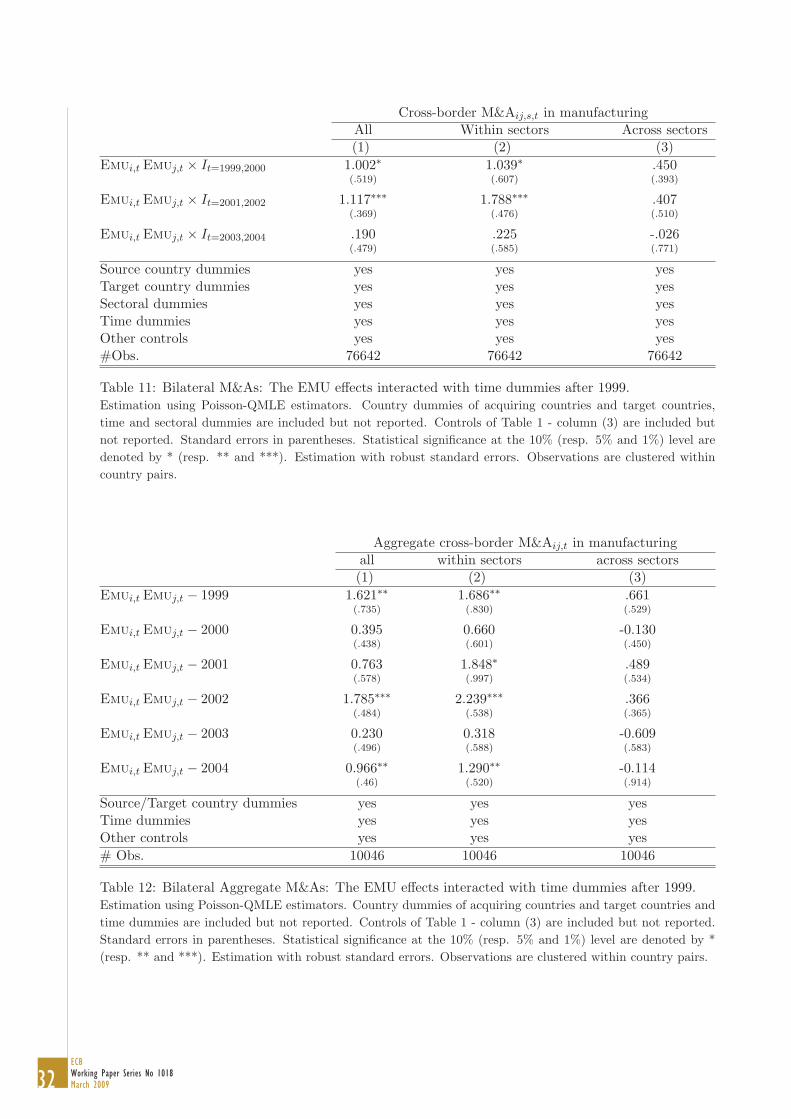
32ECBWorking Paper Series No 1018March 2009
Cross-border M&Aij,s,t in manufacturingAll Within sectors Across sectors(1) (2) (3)
Emui,t Emuj,t × It=1999,2000 1.002∗ 1.039∗ .450(.519) (.607) (.393)
Emui,t Emuj,t × It=2001,2002 1.117∗∗∗ 1.788∗∗∗ .407(.369) (.476) (.510)
Emui,t Emuj,t × It=2003,2004 .190 .225 -.026(.479) (.585) (.771)
Source country dummies yes yes yesTarget country dummies yes yes yesSectoral dummies yes yes yesTime dummies yes yes yesOther controls yes yes yes#Obs. 76642 76642 76642
Table 11: Bilateral M&As: The EMU effects interacted with time dummies after 1999.Estimation using Poisson-QMLE estimators. Country dummies of acquiring countries and target countries,time and sectoral dummies are included but not reported. Controls of Table 1 - column (3) are included butnot reported. Standard errors in parentheses. Statistical significance at the 10% (resp. 5% and 1%) level aredenoted by * (resp. ** and ***). Estimation with robust standard errors. Observations are clustered withincountry pairs.
Aggregate cross-border M&Aij,t in manufacturingall within sectors across sectors(1) (2) (3)
Emui,t Emuj,t − 1999 1.621∗∗ 1.686∗∗ .661(.735) (.830) (.529)
Emui,t Emuj,t − 2000 0.395 0.660 -0.130(.438) (.601) (.450)
Emui,t Emuj,t − 2001 0.763 1.848∗ .489(.578) (.997) (.534)
Emui,t Emuj,t − 2002 1.785∗∗∗ 2.239∗∗∗ .366(.484) (.538) (.365)
Emui,t Emuj,t − 2003 0.230 0.318 -0.609(.496) (.588) (.583)
Emui,t Emuj,t − 2004 0.966∗∗ 1.290∗∗ -0.114(.46) (.520) (.914)
Source/Target country dummies yes yes yesTime dummies yes yes yesOther controls yes yes yes# Obs. 10046 10046 10046
Table 12: Bilateral Aggregate M&As: The EMU effects interacted with time dummies after 1999.Estimation using Poisson-QMLE estimators. Country dummies of acquiring countries and target countries andtime dummies are included but not reported. Controls of Table 1 - column (3) are included but not reported.Standard errors in parentheses. Statistical significance at the 10% (resp. 5% and 1%) level are denoted by *(resp. ** and ***). Estimation with robust standard errors. Observations are clustered within country pairs.
33ECB
Working Paper Series No 1018March 2009
5.2 Estimating the extensive versus the intensive margins of the EMU effects
We also investigate whether EMU has affected the probability of engaging in M&As with an EMU
country (“extensive margin”) or affected the volume of M&As among member states (“intensive mar-
gin”). Implicitly, the former would capture the effect of EMU on the fixed costs in undertaking M&As,
while the latter would capture the effect of EMU on transaction costs. We do it using aggregate data
(data aggregated across sectors) of bilateral cross-border M&As as the number of zeroes with sectoral
data is too large given the empirical strategy we use to identify the two margins.
To assess whether EMU has influenced the decision to engage in M&As with a given country
(“extensive margin”), we compute a dummy which is set equal to one if there is at least one transaction
between country i and country j at date t (1aggM&Aij,t>0) and we run the same exercise as before with
the addition of such dummy using a logit estimation. The results on the EMU dummies are shown in
column (2) of Table 13.
We also run a standard OLS gravity regression, which excludes the zero transactions (see Table
13, column (1)). This regression is informative as it gives the impact of EMU on the size of M&As
conditionally on observing transactions (“intensive margin”).
The comparison of the two columns provides a decomposition of the overall effect already measured
with the Poisson estimations. We can argue that EMU acted as “preferential liberalization” mostly
by increasing the probability of M&As between two euro area countries (Table 13, column (2)). The
“extensive margin” effect is large since the probability of M&As between two euro area countries has
increased by 50% after EMU while the probability of a M&A between non-euro area countries and
euro area countries has not been affected by the introduction of the euro.
The single currency has also increased the size of M&As towards the euro area from all countries
in the world including euro area countries29. The “intensive margin” effect is around 50% (Table 13 -
column (1)). This decomposition is a confirmation of the previous results. Indeed, if we add the two
margins, cross-border M&As (in value) have doubled between euro area countries (e0.305+0.389 = 2),
while non-euro area M&As targeting the euro area have risen by about one quarter (e0.480−0.240 = 1.27).
Using such computations, the EMU effect between euro area countries in addition to the general
tendency to invest in the euro area would amount to about 50% (� 2/1.27− 1). These results suggest
that EMU acted through a decrease in fixed-costs within EMU countries (“extensive margin”) and a
decrease in proportional transaction costs for every single country in the world (“intensive margin”).
With lower transactions costs, the euro area becomes more like one bigger economy, and this encourages
MAs also from non euro area countries.29The estimate of the dummy Emui,t Emuj,t is even smaller than the one of the dummy nonEmui,t Emuj,t, but not
statistically different.
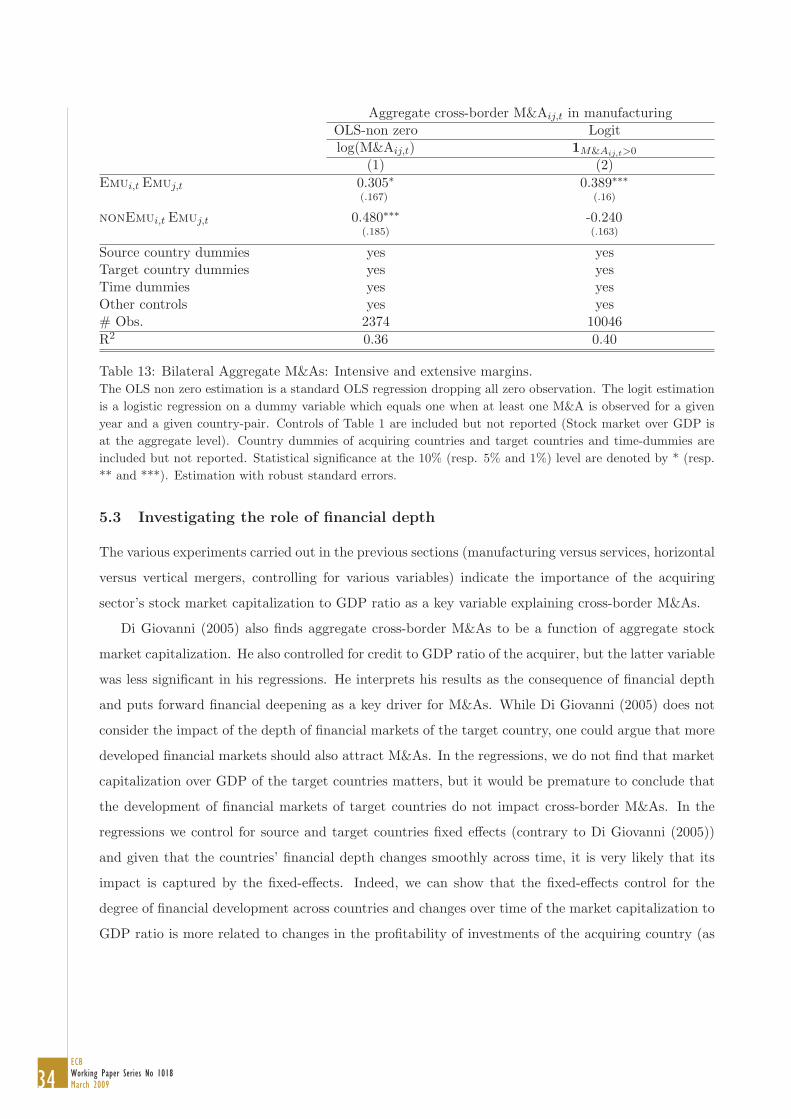
34ECBWorking Paper Series No 1018March 2009
Aggregate cross-border M&Aij,t in manufacturingOLS-non zero Logitlog(M&Aij,t) 1M&Aij,t>0
(1) (2)Emui,t Emuj,t 0.305∗ 0.389∗∗∗
(.167) (.16)
nonEmui,t Emuj,t 0.480∗∗∗ -0.240(.185) (.163)
Source country dummies yes yesTarget country dummies yes yesTime dummies yes yesOther controls yes yes# Obs. 2374 10046R2 0.36 0.40
Table 13: Bilateral Aggregate M&As: Intensive and extensive margins.The OLS non zero estimation is a standard OLS regression dropping all zero observation. The logit estimationis a logistic regression on a dummy variable which equals one when at least one M&A is observed for a givenyear and a given country-pair. Controls of Table 1 are included but not reported (Stock market over GDP isat the aggregate level). Country dummies of acquiring countries and target countries and time-dummies areincluded but not reported. Statistical significance at the 10% (resp. 5% and 1%) level are denoted by * (resp.** and ***). Estimation with robust standard errors.
5.3 Investigating the role of financial depth
The various experiments carried out in the previous sections (manufacturing versus services, horizontal
versus vertical mergers, controlling for various variables) indicate the importance of the acquiring
sector’s stock market capitalization to GDP ratio as a key variable explaining cross-border M&As.
Di Giovanni (2005) also finds aggregate cross-border M&As to be a function of aggregate stock
market capitalization. He also controlled for credit to GDP ratio of the acquirer, but the latter variable
was less significant in his regressions. He interprets his results as the consequence of financial depth
and puts forward financial deepening as a key driver for M&As. While Di Giovanni (2005) does not
consider the impact of the depth of financial markets of the target country, one could argue that more
developed financial markets should also attract M&As. In the regressions, we do not find that market
capitalization over GDP of the target countries matters, but it would be premature to conclude that
the development of financial markets of target countries do not impact cross-border M&As. In the
regressions we control for source and target countries fixed effects (contrary to Di Giovanni (2005))
and given that the countries’ financial depth changes smoothly across time, it is very likely that its
impact is captured by the fixed-effects. Indeed, we can show that the fixed-effects control for the
degree of financial development across countries and changes over time of the market capitalization to
GDP ratio is more related to changes in the profitability of investments of the acquiring country (as
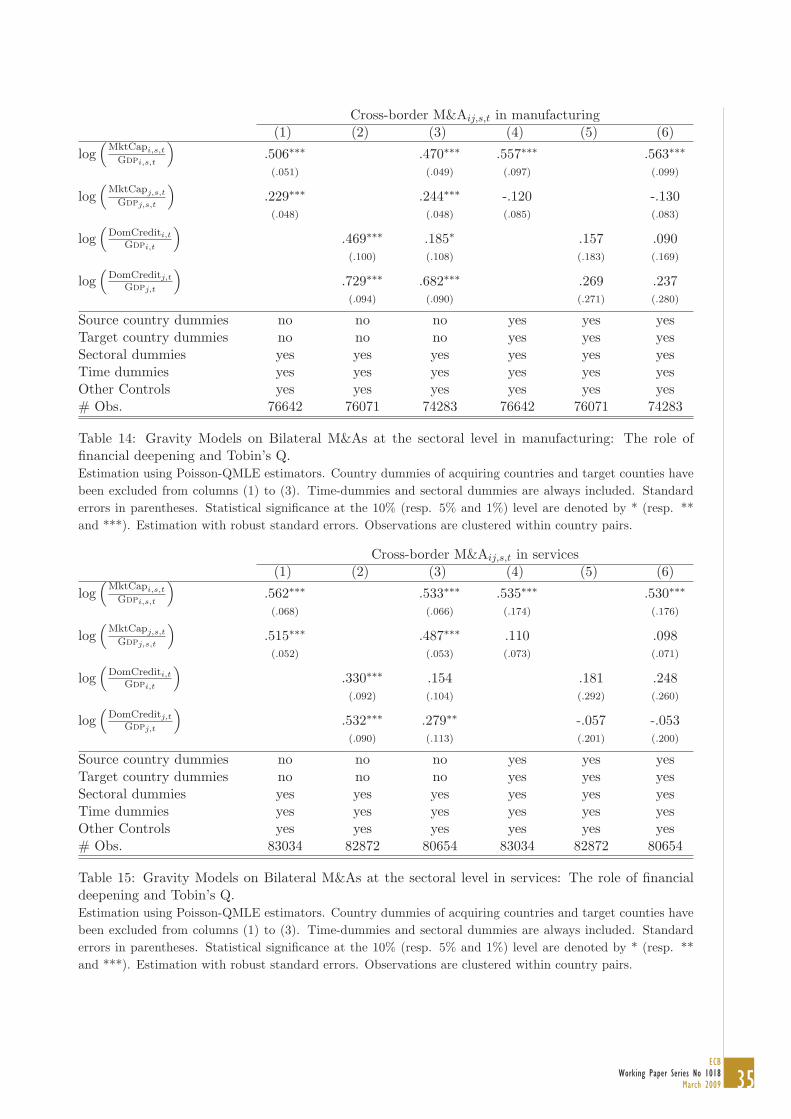
35ECB
Working Paper Series No 1018March 2009
Cross-border M&Aij,s,t in manufacturing(1) (2) (3) (4) (5) (6)
log(
MktCapi,s,t
Gdpi,s,t
).506∗∗∗ .470∗∗∗ .557∗∗∗ .563∗∗∗(.051) (.049) (.097) (.099)
log(
MktCapj,s,t
Gdpj,s,t
).229∗∗∗ .244∗∗∗ -.120 -.130(.048) (.048) (.085) (.083)
log(
DomCrediti,t
Gdpi,t
).469∗∗∗ .185∗ .157 .090(.100) (.108) (.183) (.169)
log(
DomCreditj,t
Gdpj,t
).729∗∗∗ .682∗∗∗ .269 .237(.094) (.090) (.271) (.280)
Source country dummies no no no yes yes yesTarget country dummies no no no yes yes yesSectoral dummies yes yes yes yes yes yesTime dummies yes yes yes yes yes yesOther Controls yes yes yes yes yes yes# Obs. 76642 76071 74283 76642 76071 74283
Table 14: Gravity Models on Bilateral M&As at the sectoral level in manufacturing: The role offinancial deepening and Tobin’s Q.Estimation using Poisson-QMLE estimators. Country dummies of acquiring countries and target counties havebeen excluded from columns (1) to (3). Time-dummies and sectoral dummies are always included. Standarderrors in parentheses. Statistical significance at the 10% (resp. 5% and 1%) level are denoted by * (resp. **and ***). Estimation with robust standard errors. Observations are clustered within country pairs.
Cross-border M&Aij,s,t in services(1) (2) (3) (4) (5) (6)
log(
MktCapi,s,t
Gdpi,s,t
).562∗∗∗ .533∗∗∗ .535∗∗∗ .530∗∗∗(.068) (.066) (.174) (.176)
log(
MktCapj,s,t
Gdpj,s,t
).515∗∗∗ .487∗∗∗ .110 .098(.052) (.053) (.073) (.071)
log(
DomCrediti,t
Gdpi,t
).330∗∗∗ .154 .181 .248(.092) (.104) (.292) (.260)
log(
DomCreditj,t
Gdpj,t
).532∗∗∗ .279∗∗ -.057 -.053(.090) (.113) (.201) (.200)
Source country dummies no no no yes yes yesTarget country dummies no no no yes yes yesSectoral dummies yes yes yes yes yes yesTime dummies yes yes yes yes yes yesOther Controls yes yes yes yes yes yes# Obs. 83034 82872 80654 83034 82872 80654
Table 15: Gravity Models on Bilateral M&As at the sectoral level in services: The role of financialdeepening and Tobin’s Q.Estimation using Poisson-QMLE estimators. Country dummies of acquiring countries and target counties havebeen excluded from columns (1) to (3). Time-dummies and sectoral dummies are always included. Standarderrors in parentheses. Statistical significance at the 10% (resp. 5% and 1%) level are denoted by * (resp. **and ***). Estimation with robust standard errors. Observations are clustered within country pairs.
36ECBWorking Paper Series No 1018March 2009
in a standard Q-theory of investment).
We investigate this hypothesis by running the same regressions wit and without fixed-effects and
add two additional controls for financial depth: domestic credit over GDP of source and target coun-
tries. Regressions in Tables 14 and 15 (see columns (1) to (3)) indicate that countries with deeper
financial markets have a more intense M&A activity, both as buyers and sellers of financial assets. This
holds for both measures of financial depth as market capitalization and domestic credit of the host and
source countries are all statistically significant for manufacturing as well as services. However, when
controlling for fixed effects, the only variable which remains statistically significant is the acquiring
sector’s market capitalization to GDP ratio (Tables 14 and 15; columns (4) to (6)). We see these
regressions as very suggestive evidence that financial deepening is an important driver of cross-border
M&As across countries (both for source and host countries) but this effect cannot be identified across
time. Across time, only changes in expected profitability of the acquiring sector (of a given country)
affect significantly cross-border M&As, supporting the Tobin’s q theory of investment.
5.4 Investigating the role of geography
We found very little impact of distance on cross-border M&As, which contradicts some previous
work where geography has usually been found to play a major role in shaping international financial
transactions (Portes and Rey (2005), Georg, et al (2006), Head and Ries (2007)). We test two
competitive explanations for this result: first, as already argued, the sample is mostly restricted to
developed markets and if distance proxies some information asymmetries, it is likely that information
costs are less related to distance for those countries. Second, a large share of M&A activities occurs
from 1995 onwards and it is possible that the improvement of information technologies worldwide
reduced information costs dramatically, making distance statistically insignificant.
We investigate the first explanation by estimating whether geographical distance is a larger barrier
for M&As towards developing countries compared to M&As towards developed markets (see appendix,
section 7.2, for the classification) by simply interacting the variable log(Distij) with a dummy which is
equal to one when the target country is a developed country. As shown in Table 16 (column (1) in the
case of manufacturing and column (3) in the case of services), distance matters more when the target
country is a developing country (the elasticity is around -0.5 for both manufacturing and services and
highly significant), while the effect of distance is negligible when the target country is a developed
market. This evidence supports the hypothesis that distance is essentially related to monitoring and
information costs for cross-border M&As.
We also investigate the second explanation by estimating the effect of distance over time for both
developed and developing markets, by dividing the sample in two periods (before and after 1995).
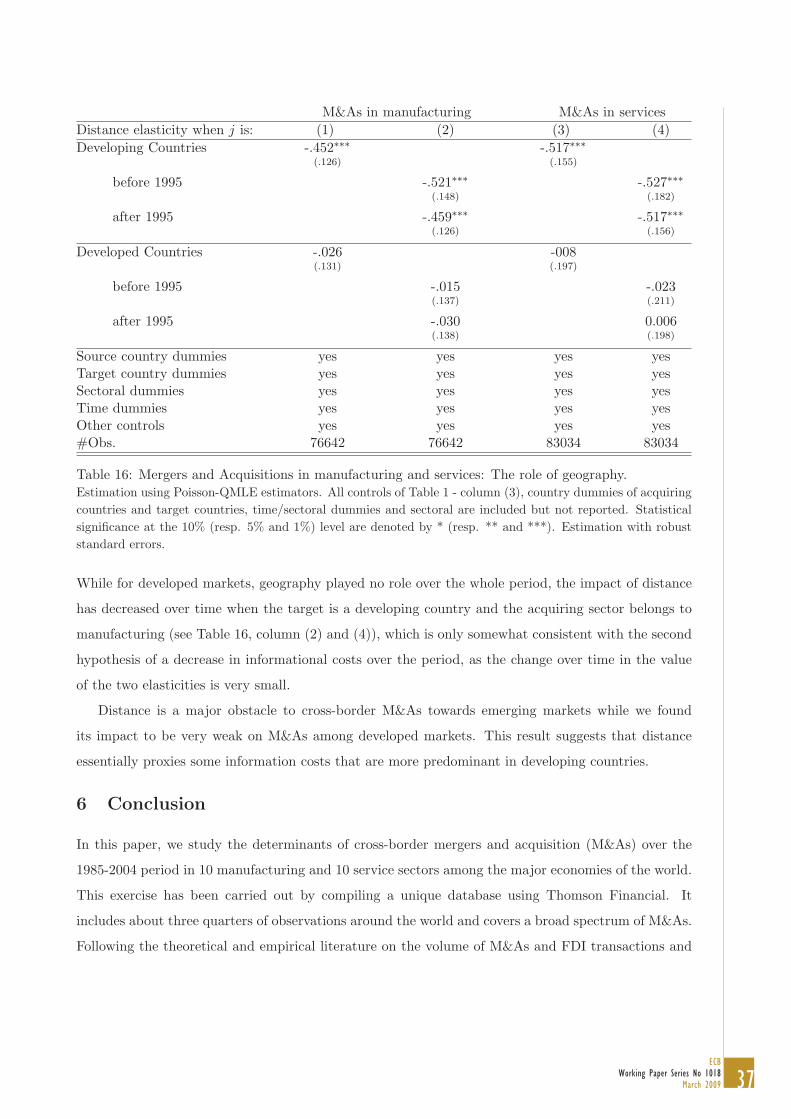
37ECB
Working Paper Series No 1018March 2009
M&As in manufacturing M&As in servicesDistance elasticity when j is: (1) (2) (3) (4)Developing Countries -.452∗∗∗ -.517∗∗∗
(.126) (.155)
before 1995 -.521∗∗∗ -.527∗∗∗(.148) (.182)
after 1995 -.459∗∗∗ -.517∗∗∗(.126) (.156)
Developed Countries -.026 -008(.131) (.197)
before 1995 -.015 -.023(.137) (.211)
after 1995 -.030 0.006(.138) (.198)
Source country dummies yes yes yes yesTarget country dummies yes yes yes yesSectoral dummies yes yes yes yesTime dummies yes yes yes yesOther controls yes yes yes yes#Obs. 76642 76642 83034 83034
Table 16: Mergers and Acquisitions in manufacturing and services: The role of geography.Estimation using Poisson-QMLE estimators. All controls of Table 1 - column (3), country dummies of acquiringcountries and target countries, time/sectoral dummies and sectoral are included but not reported. Statisticalsignificance at the 10% (resp. 5% and 1%) level are denoted by * (resp. ** and ***). Estimation with robuststandard errors.
While for developed markets, geography played no role over the whole period, the impact of distance
has decreased over time when the target is a developing country and the acquiring sector belongs to
manufacturing (see Table 16, column (2) and (4)), which is only somewhat consistent with the second
hypothesis of a decrease in informational costs over the period, as the change over time in the value
of the two elasticities is very small.
Distance is a major obstacle to cross-border M&As towards emerging markets while we found
its impact to be very weak on M&As among developed markets. This result suggests that distance
essentially proxies some information costs that are more predominant in developing countries.
6 Conclusion
In this paper, we study the determinants of cross-border mergers and acquisition (M&As) over the
1985-2004 period in 10 manufacturing and 10 service sectors among the major economies of the world.
This exercise has been carried out by compiling a unique database using Thomson Financial. It
includes about three quarters of observations around the world and covers a broad spectrum of M&As.
Following the theoretical and empirical literature on the volume of M&As and FDI transactions and
38ECBWorking Paper Series No 1018March 2009
using the gravity modelling approach, we study the role of: the EU single market, EMU, expected
profitability, institutions, corporate taxation, product market regulations, financial depth and physical
and cultural proximity.
The empirical results suggest that European integration and the improvement of the institutional
setting in the target country have positively influenced the world developments of cross-border M&As
of the manufacturing sector. We can safely argue that institutional changes acted as trigger factors of
capital reallocation of manufacturing across the globe.
The impact of the euro is very strong for M&As within the same sector (horizontal) in manufac-
turing. EMU almost tripled intra euro area cross-border horizontal M&As activity in manufacturing.
The estimated effect on euro area M&As from non-euro to euro area countries amounts to a 70%
increase. The impact of the euro on vertical mergers in manufacturing sectors from non-euro to euro
area countries is also important (about 140%). Therefore, EMU had the effect typical of unilateral
financial liberalization and fostered the re-allocation of capital across firms by reducing marginal and
fixed costs to undertake such transactions. The euro facilitated cross-border M&As within the euro
area, which aimed at restructuring capital within the same sector of activity, rather then boosting the
formation of conglomerate activities between sectors. These results are very indicative particularly
for countries which have recently joint the EU and EMU or might join in the near future. They
might attract sizeable foreign investment and gain from a more efficient reallocation of manufacturing
capital.
Conversely, the impact on cross-border M&As in services of EU, EMU and institutions is not
statistically significant pointing out that such activities may be affected by the significant barriers to
cross-border trade in services, which could have undermined M&As decisions of entrepreneurs. This
also implies that large structural changes will most likely occur as cross-border barriers are dismantled
in the service industry. We find support for this hypothesis when testing the impact of product market
regulation on cross-border M&As. The level of protection and barriers to entry in the service sector
act as a strong deterrent to cross-border M&As in services across countries. The new directive on
services in the EU adopted in 2006 can help breaking such barriers allowing firms to find the most
efficient location for their investment in Europe, thereby triggering a new wave of cross border M&As
within the EU.
The empirical results of this paper provide support to the value enhancing motive of M&As, as
the acquiring sector’s stock market capitalization is an important explanatory variable of cross-border
M&As within the same sector as well as across sectors for both firm type in manufacturing and
services. As a rule of thumb, a 10% increase in the sectoral market value relative to its GDP rises
M&As of such sector by about 5%. The result that M&As respond to the acquiring sector’s stock
39ECB
Working Paper Series No 1018March 2009
market capitalization explains why cross-border M&As come in waves and implies that they ought
to enhance economic efficiency in the home and target country, unless they are driven by an equity
bubble, managerial motives or strategic policy considerations which however do not boost profits. It
could be pointed out that market capitalization over GDP is rather a proxy of financial depth, as deep
liquid markets provide firms access to capital necessary to undertake investment projects which they
might otherwise have to forego. We argue that financial depth is an important variable influencing
cross-border M&As, but it is a smooth process which cannot be easily identified across time; while -
even controlling for sectoral/country/time fixed effects - sectoral market capitalization over GDP of
the acquirer remains always statistically significant. This implies that Tobin’s q theory of investment
is at work.
We also obtain interesting results on the role of corporate taxation and product market regulations,
which are informative for government policies. A 10 percentage point decrease in the differential in
corporate taxes between target and acquiring countries would increase the outflows of manufacturing
equity investment by 68%. The results also undisputable suggest that firms in manufacturing and
particularly in services prefer to expand in those countries characterized by a lower degree of product
market regulation, regardless of the public sector size in the target country. This implies that govern-
ment can act and be successful to attract foreign equity capital. This also raises the question of the
coordination of such policies within regional agreements.
Finally, as a by-side product, we reinvestigate the role of geography on cross-border M&As. Ge-
ography is measured using standard variables employed in gravity equations, such as geographical
distance and binary variables for common border and common language. We find that proximity is of
importance to understand M&As activities. Indeed, there is considerable anecdotal evidence to sug-
gest that top management decisions are affected by national culture. Strategic decisions and actions,
for example, may be influenced by differences of opportunism and trust in other societies (Angwin
(2001)). Cultural differences do play an important role in affecting acquirers’ perceptions of target
companies and that this may have important consequences for the negotiation of cross-border M&As
deals. However, the impact of geography seems to be much more relevant for developing countries
than for developed markets.
40ECBWorking Paper Series No 1018March 2009
References
[1] Anderson, J. and E. Van Wincoop (2003). ’Gravity with Gravitas: A Solution to the Border
Puzzle’, American Economic Review, 93, 170-192.
[2] Alfaro, L., Kalemli-Ozcan, S. and V. Volosovych (2007). ’Capital flows in a globalised world:
The role of policies and institutions’, in S. Edwards (ed), Capital Controls and Capital Flows
in Emerging Economies: Policies, Practices and Consequences, University of Chicago Press, p.
19-68.
[3] Alfaro, L., Kalemli-Ozcan, S. and V. Volosovych (2008). ’Why doesn’t capital flow from rich to
poor countries? An empirical investigation’, Review of Economics and Statistics, forthcoming.
[4] Anderson, J. and E. Van Wincoop (2004). ’Trade costs’, Journal of Economic Literature, 42,
691-751.
[5] Angwin, D. (2001). ’Mergers and acquisitions across european borders: National perspectives on
pre-acquisition perspectives, due diligence and the use of professional advisers’ Journal of World
Business, 36, 32-57.
[6] Baldwin, R. E. (2006). ’The euro’s trade effects’ ECB Working Paper Series No. 594.
[7] Baldwin, A. and D. Taglioni (2006). ’Gravity dummies and dummies for gravity equations’, NBER
Working Paper Series No. 12516.
[8] Baker, M., Foley, C. F., and J. Wurgler (2008). ’Multinational as arbitrageurs? The stock market
and investment: evidence from FDI flows’, Review of Financial Stusies, forthcoming.
[9] Benassy, A., Fontagne, L. and A. Lahreche-Revil (2005). ’How does FDI react to corporate
taxation?, International Tax and Public Finance, 12, 583-603.
[10] Bergstrand, J. H and P. Egger (2007). ’A knowledge-and-physical-capital model of international
trade flows, foreign direct investment, and multinational enterprises’ Journal of International
Economics, 73, 278-308.
[11] Bris, A., Koskinen, Y. and M. Nilsson (2007). ’The euro and corporate valuations’, mimeo.
[12] Burns, M. R. (1986). ’Predatory pricing and acquisitions costs of competitors’, Journal of Political
Economy, 94, 266-296.
[13] Coeurdacier, N. and P. Martin (2006). ’The Geography of Asset Trade and the Euro: Insiders
and Outsiders’, CEPR Discussion Paper No. 6032.
41ECB
Working Paper Series No 1018March 2009
[14] Conway, P., V. Janod and G. Nicoletti (2005). ’Product Market Regulation in OECD Countries:
1998 to 2003’, OECD Economics Department Working Papers No. 419.
[15] Conway, P. and G. Nicoletti (2006), ’Product market regulation in non-manufacturing sectors in
OECD countries: measurement and highlights, OECD Economics Department Working Paper
No. 530.
[16] Daude, C. and M. Fratzscher’(2006). ’The pecking order of cross-border investment’, Journal of
International Economics, 74, 94-119.
[17] De Santis R. A. and B. Gerard (2006). ’Financial integration, international portfolio choice and
the European monetary union’, ECB Working Paper Series No. 626.
[18] De Santis R. A. and P. Ehling (2007). ’Do International Portfolio Investors Follow Firms’ Foreign
Investment Decisions?’, ECB Working Paper Series No. 815.
[19] De Santis R. A., Anderton, R. and A. Hijzen (2004). ’On the determinants of euro area FDI to
the United States: The knowledge-capital-Tobin’s q framework’, ECB Working Paper Series No.
329.
[20] De Sousa, J. and J. Lochard (2006a). ’Does the single currency affect foreign direct investment?
A gravity-like approach’, Mimeo Paris I.
[21] De Sousa, J. and J. Lochard (2006b). ’The currency union effect on trade and the foreign direct
investment channel’, Mimeo Paris I.
[22] Devereux, M. P., Griffith, R. and A. Klemm (2002). ’Corporate income tax reforms and interna-
tional tax competition’, Economic Policy, 17, 449-495.
[23] Devereux, M. P. and R. Griffith (2003). ’Evaluating tax policy for location decisions’, International
Tax and Public Finance, 10, 107-126.
[24] Devereux, M. P. and R. Griffith (1998), ’Taxes and the location of production: Evidence from a
panel of US multinationals’, Journal of Public Economics, 68, 335-367.
[25] Di Giovanni, J. (2005). ’What drives capital flows? The case of cross-border M&A activity and
financial deepening’, Journal of International Economics, 65, 127-49.
[26] Eisfeldt, A. L. and A. A. Rampini (2005). ’Capital reallocation and liquidity’. Journal of Monetary
Economics, 53, 369-399.
42ECBWorking Paper Series No 1018March 2009
[27] Flam, H., and H. Nordstrom (2003). ’Trade volume effects of the euro: Aggregate and sector
estimates’, mimeo Institute for International Economic Studies, Stockholm.
[28] Focarelli, D. and A.F Pozzolo (2008). ’Cross-border M&As in the financial sector: Is banking
different from insurance?’, Journal of Banking Finance, 32, 15-29.
[29] Glick, R. and A. Rose (2002). ’Does a currency union affect trade? The time-series evidence’,
European Economic Review, 46, 1125-1151.
[30] Guimaraes, P., Fuigueirdo O. and D. Woodward (2003). ’A tractable approach to the firm location
decision problem’, Review of Economics and Statistics, 85, 201-204.
[31] Hijzen, A., H. Grg and M. Manchin (2006). ’Cross-border mergers and acquisitions and the role
of trade costs’, CEPR Working Paper No. 6397, forthcoming in European Economic Review.
[32] Head, K and J. Ries (2005). ’Judging Japan’s FDI: The verdict from a dartboard model’, Journal
of the Japanese and International Economies, 19, 215-232.
[33] Head, K and J. Ries (2007). ’FDI as an outcome of the market for corporate control: Theory and
evidence’, Journal of International Economics, 74, 2-20.
[34] Jovanovic, B. and P. L. Rousseau (2002). ’The q-theory of mergers’, American Economic Review
P&P, 92, 198-204.
[35] Jovanovic, B. and P. L. Rousseau (2008). ’Mergers as reallocation’, Review of Economics and
Statistics, forthcoming.
[36] Lane, P. (2006). ’Global bond portfolios and EMU’, International Journal of Central Banking,
June 2006, 1-23.
[37] La Porta, R., Lopez–de–Silanes, F. and A. Schleifer (2006). ’What works in securities law?’,
Journal of Finance, 61, 1-31.
[38] La Porta, R., Lopez–de–Silanes, F., Schleifer, A. and R. W. Vishny (1998). ’Law and finance’,
Journal of Political Economy, 106, 1113-1155.
[39] Long, N. V., Horst, R. and F. Stahler (2007). ’The Effects of trade Liberalization on productivity
and welfare: The role of firm heterogeneity, R&D and market structure’, Kiel Economics Working
Paper No. 2007-20.
[40] Mac Fadden, D. (1974). ’Conditional logit analysis of qualitative choice behavior’, in P. Zarembka
(ed.), Frontiers in Econometrics, Academic Press: New York, pp. 105-142.
43ECB
Working Paper Series No 1018March 2009
[41] Micco, A., E. Stein and G. Ordonez (2003). ’The currency union effect on trade: Early evidence
from EMU’, Economic Policy, 37, 315-336.
[42] Neary, P. (2007). ’Cross-border mergers as instruments of comparative advantage’, Review of
Economic Studies, 74, 1229-1257.
[43] Nocke, V. and S. R. Yeaple (2007). ’Cross-Border mergers and acquisitions versus greenfield
foreign direct investment: The role of firm heterogeneity’, Journal of International Economics,
72(2), 336-365.
[44] Nicita A. and M. Olarreaga (2007). ’Trade, production and protection 1976-2004’, World Bank
Economic Review, Jan. 2007, 1-7.
[45] Perry, M. K. and R. H. Porter (1985). ’Oligopoly and the incentive for horizontal merger’, Amer-
ican Economic Review, 75(1), 219-227.
[46] Petroulas, P. (2007). ’The Effect of the euro on foreign direct investment’, European Economic
Review, 51(6), pp. 1468-1491.
[47] Portes, R. and H. Rey (2005). ’The determinants of cross-border equity flows’, Journal of Inter-
national Economics, 62(1), 53-82.
[48] OECD (2002). ’Forty Years’ Experience with the OECD Code of Liberalisation of Capital Move-
ments. Paris.
[49] Ramondo, N. (2007). ’Size, geography, and multinational production’, mimeo University of
Chicago.
[50] Razin, A. and E. Sadka (2007a). ’Productivity and taxes as drivers of FDI’, NBER Working
Paper Series No. 13094.
[51] Razin, A. and E. Sadka (2007b). Foreign Direct Investment: Analysis of Aggregate Flows. Prince-
ton University Press.
[52] Razin, A., Rubinstein Y. and E. Sadka (2005). ’Corporate taxation and bilateral FDI with thresh-
old barriers’, NBER Working Paper Series No. 11196.
[53] Rose, A. (2000). ’One money, one market: Estimating the effect of common currencies on trade’,
Economic Policy, 15(30), 7-45.
[54] Saloner, G. (1987). ’Predation, mergers and incomplete information’, Rand Journal of Economics,
18(2), 165-186.
44ECBWorking Paper Series No 1018March 2009
[55] Santos Silva, J. M. C. and S. Tenreyro (2006). ’The log of gravity’, Review of Economics and
Statistics, 88(4), 641-658.
[56] Schiavo, S. (2007). ’Common currency and FDI flows’, Oxford Economic Papers, 59, 536-560.
[57] Shimizu, K, Hitt, M.A., Vaidyanath, D. and V. Pisano (2004). ’Cross-border mergers and acqui-
sitions: Reviews and research issues’, Journal of International Management, 10, 307-353.
[58] UNCTAD (2006). World Investment Report 2006 - FDI from Developing and Transition
Economies: Implications for Development, Geneva.
[59] Wei, S-J. (2000a). ’How taxing is corruption on international investors’, Review of Economics
and Statistics, 82(1), 1-11.
[60] Wei, S-J. (2000b). ’Local corruption and global capital flows’, Brookings Papers on Economic
Activity, 2000(2), 303-354.
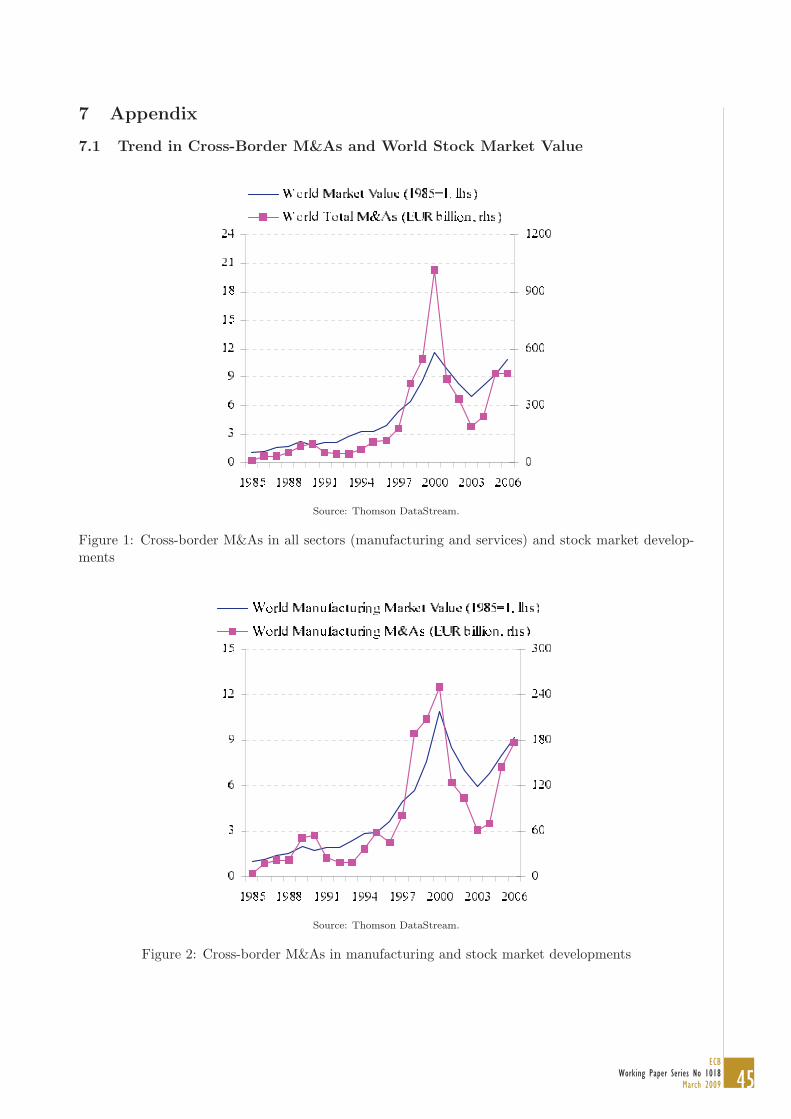
45ECB
Working Paper Series No 1018March 2009
7 Appendix
7.1 Trend in Cross-Border M&As and World Stock Market Value
Source: Thomson DataStream.
Figure 1: Cross-border M&As in all sectors (manufacturing and services) and stock market develop-ments
Source: Thomson DataStream.
Figure 2: Cross-border M&As in manufacturing and stock market developments
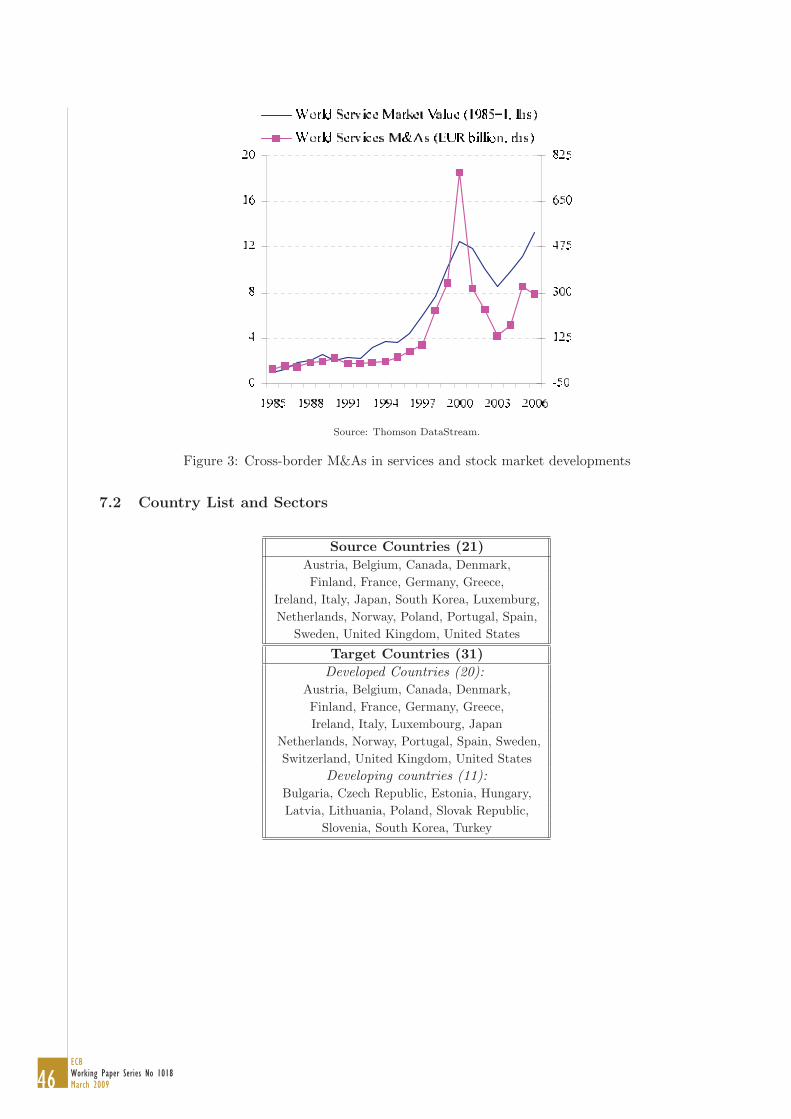
46ECBWorking Paper Series No 1018March 2009
Source: Thomson DataStream.
Figure 3: Cross-border M&As in services and stock market developments
7.2 Country List and Sectors
Source Countries (21)Austria, Belgium, Canada, Denmark,Finland, France, Germany, Greece,
Ireland, Italy, Japan, South Korea, Luxemburg,Netherlands, Norway, Poland, Portugal, Spain,
Sweden, United Kingdom, United States
Target Countries (31)Developed Countries (20):
Austria, Belgium, Canada, Denmark,Finland, France, Germany, Greece,Ireland, Italy, Luxembourg, Japan
Netherlands, Norway, Portugal, Spain, Sweden,Switzerland, United Kingdom, United States
Developing countries (11):Bulgaria, Czech Republic, Estonia, Hungary,Latvia, Lithuania, Poland, Slovak Republic,
Slovenia, South Korea, Turkey
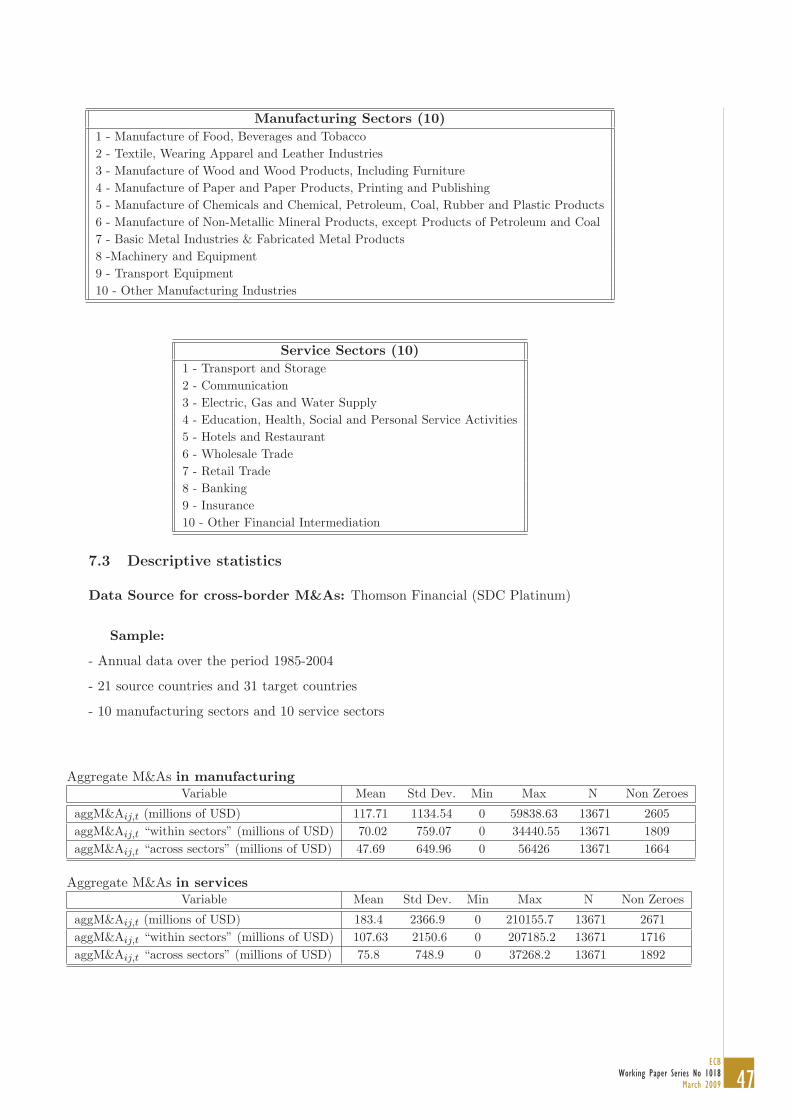
47ECB
Working Paper Series No 1018March 2009
Manufacturing Sectors (10)1 - Manufacture of Food, Beverages and Tobacco2 - Textile, Wearing Apparel and Leather Industries3 - Manufacture of Wood and Wood Products, Including Furniture4 - Manufacture of Paper and Paper Products, Printing and Publishing5 - Manufacture of Chemicals and Chemical, Petroleum, Coal, Rubber and Plastic Products6 - Manufacture of Non-Metallic Mineral Products, except Products of Petroleum and Coal7 - Basic Metal Industries & Fabricated Metal Products8 -Machinery and Equipment9 - Transport Equipment10 - Other Manufacturing Industries
Service Sectors (10)1 - Transport and Storage2 - Communication3 - Electric, Gas and Water Supply4 - Education, Health, Social and Personal Service Activities5 - Hotels and Restaurant6 - Wholesale Trade7 - Retail Trade8 - Banking9 - Insurance10 - Other Financial Intermediation
7.3 Descriptive statistics
Data Source for cross-border M&As: Thomson Financial (SDC Platinum)
Sample:
- Annual data over the period 1985-2004
- 21 source countries and 31 target countries
- 10 manufacturing sectors and 10 service sectors
Aggregate M&As in manufacturingVariable Mean Std Dev. Min Max N Non Zeroes
aggM&Aij,t (millions of USD) 117.71 1134.54 0 59838.63 13671 2605aggM&Aij,t “within sectors” (millions of USD) 70.02 759.07 0 34440.55 13671 1809aggM&Aij,t “across sectors” (millions of USD) 47.69 649.96 0 56426 13671 1664
Aggregate M&As in servicesVariable Mean Std Dev. Min Max N Non Zeroes
aggM&Aij,t (millions of USD) 183.4 2366.9 0 210155.7 13671 2671aggM&Aij,t “within sectors” (millions of USD) 107.63 2150.6 0 207185.2 13671 1716aggM&Aij,t “across sectors” (millions of USD) 75.8 748.9 0 37268.2 13671 1892
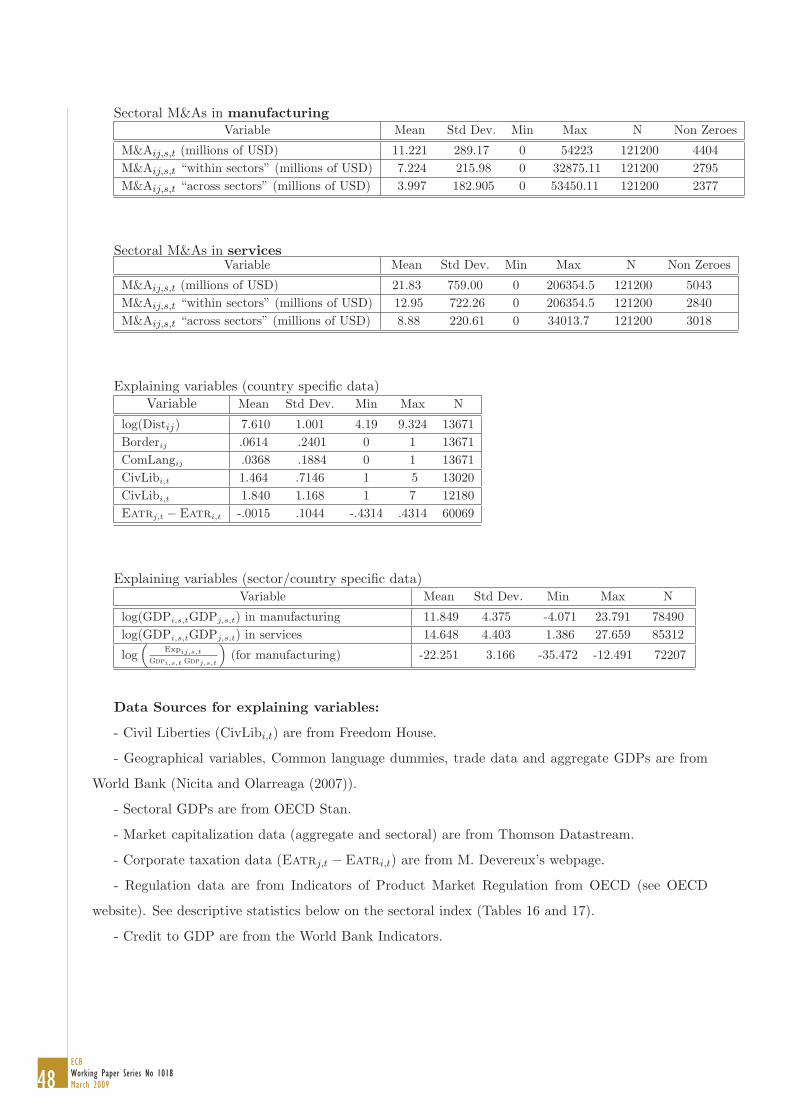
48ECBWorking Paper Series No 1018March 2009
Sectoral M&As in manufacturingVariable Mean Std Dev. Min Max N Non Zeroes
M&Aij,s,t (millions of USD) 11.221 289.17 0 54223 121200 4404M&Aij,s,t “within sectors” (millions of USD) 7.224 215.98 0 32875.11 121200 2795M&Aij,s,t “across sectors” (millions of USD) 3.997 182.905 0 53450.11 121200 2377
Sectoral M&As in servicesVariable Mean Std Dev. Min Max N Non Zeroes
M&Aij,s,t (millions of USD) 21.83 759.00 0 206354.5 121200 5043M&Aij,s,t “within sectors” (millions of USD) 12.95 722.26 0 206354.5 121200 2840M&Aij,s,t “across sectors” (millions of USD) 8.88 220.61 0 34013.7 121200 3018
Explaining variables (country specific data)Variable Mean Std Dev. Min Max N
log(Distij) 7.610 1.001 4.19 9.324 13671Borderij .0614 .2401 0 1 13671ComLangij .0368 .1884 0 1 13671CivLibi,t 1.464 .7146 1 5 13020CivLibi,t 1.840 1.168 1 7 12180Eatrj,t − Eatri,t -.0015 .1044 -.4314 .4314 60069
Explaining variables (sector/country specific data)Variable Mean Std Dev. Min Max N
log(GDPi,s,tGDPj,s,t) in manufacturing 11.849 4.375 -4.071 23.791 78490log(GDPi,s,tGDPj,s,t) in services 14.648 4.403 1.386 27.659 85312
log(
Expij,s,t
Gdpi,s,t Gdpj,s,t
)(for manufacturing) -22.251 3.166 -35.472 -12.491 72207
Data Sources for explaining variables:
- Civil Liberties (CivLibi,t) are from Freedom House.
- Geographical variables, Common language dummies, trade data and aggregate GDPs are from
World Bank (Nicita and Olarreaga (2007)).
- Sectoral GDPs are from OECD Stan.
- Market capitalization data (aggregate and sectoral) are from Thomson Datastream.
- Corporate taxation data (Eatrj,t − Eatri,t) are from M. Devereux’s webpage.
- Regulation data are from Indicators of Product Market Regulation from OECD (see OECD
website). See descriptive statistics below on the sectoral index (Tables 16 and 17).
- Credit to GDP are from the World Bank Indicators.
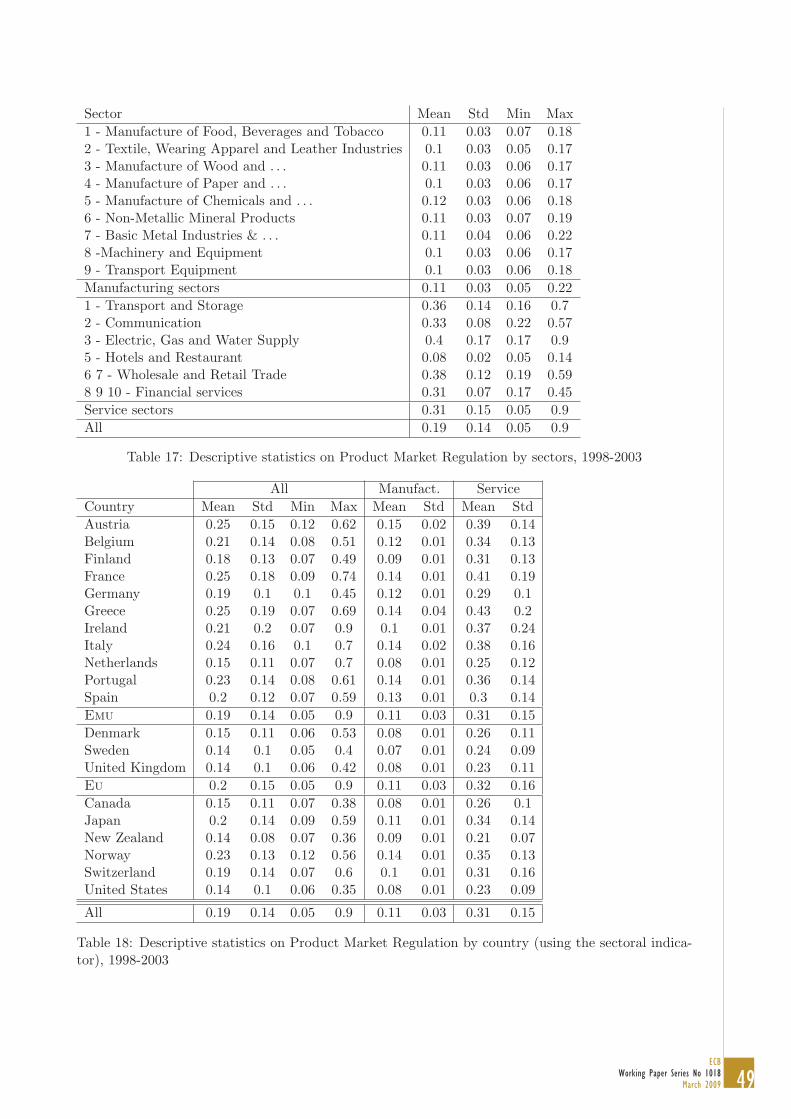
49ECB
Working Paper Series No 1018March 2009
Sector Mean Std Min Max1 - Manufacture of Food, Beverages and Tobacco 0.11 0.03 0.07 0.182 - Textile, Wearing Apparel and Leather Industries 0.1 0.03 0.05 0.173 - Manufacture of Wood and . . . 0.11 0.03 0.06 0.174 - Manufacture of Paper and . . . 0.1 0.03 0.06 0.175 - Manufacture of Chemicals and . . . 0.12 0.03 0.06 0.186 - Non-Metallic Mineral Products 0.11 0.03 0.07 0.197 - Basic Metal Industries & . . . 0.11 0.04 0.06 0.228 -Machinery and Equipment 0.1 0.03 0.06 0.179 - Transport Equipment 0.1 0.03 0.06 0.18Manufacturing sectors 0.11 0.03 0.05 0.221 - Transport and Storage 0.36 0.14 0.16 0.72 - Communication 0.33 0.08 0.22 0.573 - Electric, Gas and Water Supply 0.4 0.17 0.17 0.95 - Hotels and Restaurant 0.08 0.02 0.05 0.146 7 - Wholesale and Retail Trade 0.38 0.12 0.19 0.598 9 10 - Financial services 0.31 0.07 0.17 0.45Service sectors 0.31 0.15 0.05 0.9All 0.19 0.14 0.05 0.9
Table 17: Descriptive statistics on Product Market Regulation by sectors, 1998-2003
All Manufact. ServiceCountry Mean Std Min Max Mean Std Mean StdAustria 0.25 0.15 0.12 0.62 0.15 0.02 0.39 0.14Belgium 0.21 0.14 0.08 0.51 0.12 0.01 0.34 0.13Finland 0.18 0.13 0.07 0.49 0.09 0.01 0.31 0.13France 0.25 0.18 0.09 0.74 0.14 0.01 0.41 0.19Germany 0.19 0.1 0.1 0.45 0.12 0.01 0.29 0.1Greece 0.25 0.19 0.07 0.69 0.14 0.04 0.43 0.2Ireland 0.21 0.2 0.07 0.9 0.1 0.01 0.37 0.24Italy 0.24 0.16 0.1 0.7 0.14 0.02 0.38 0.16Netherlands 0.15 0.11 0.07 0.7 0.08 0.01 0.25 0.12Portugal 0.23 0.14 0.08 0.61 0.14 0.01 0.36 0.14Spain 0.2 0.12 0.07 0.59 0.13 0.01 0.3 0.14Emu 0.19 0.14 0.05 0.9 0.11 0.03 0.31 0.15Denmark 0.15 0.11 0.06 0.53 0.08 0.01 0.26 0.11Sweden 0.14 0.1 0.05 0.4 0.07 0.01 0.24 0.09United Kingdom 0.14 0.1 0.06 0.42 0.08 0.01 0.23 0.11Eu 0.2 0.15 0.05 0.9 0.11 0.03 0.32 0.16Canada 0.15 0.11 0.07 0.38 0.08 0.01 0.26 0.1Japan 0.2 0.14 0.09 0.59 0.11 0.01 0.34 0.14New Zealand 0.14 0.08 0.07 0.36 0.09 0.01 0.21 0.07Norway 0.23 0.13 0.12 0.56 0.14 0.01 0.35 0.13Switzerland 0.19 0.14 0.07 0.6 0.1 0.01 0.31 0.16United States 0.14 0.1 0.06 0.35 0.08 0.01 0.23 0.09
All 0.19 0.14 0.05 0.9 0.11 0.03 0.31 0.15
Table 18: Descriptive statistics on Product Market Regulation by country (using the sectoral indica-tor), 1998-2003
50ECBWorking Paper Series No 1018March 2009
European Central Bank Working Paper Series
For a complete list of Working Papers published by the ECB, please visit the ECB’s website
(http://www.ecb.europa.eu).
973 “Do China and oil exporters influence major currency configurations?” by M. Fratzscher and A. Mehl,
December 2008.
974 “Institutional features of wage bargaining in 23 European countries, the US and Japan” by P. Du Caju, E. Gautier,
D. Momferatou and M. Ward-Warmedinger, December 2008.
975 “Early estimates of euro area real GDP growth: a bottom up approach from the production side” by E. Hahn
and F. Skudelny, December 2008.
976 “The term structure of interest rates across frequencies” by K. Assenmacher-Wesche and S. Gerlach,
December 2008.
977 “Predictions of short-term rates and the expectations hypothesis of the term structure of interest rates”
by M. Guidolin and D. L. Thornton, December 2008.
978 “Measuring monetary policy expectations from financial market instruments” by M. Joyce, J. Relleen and
S. Sorensen, December 2008.
979 “Futures contract rates as monetary policy forecasts” by G. Ferrero and A. Nobili, December 2008.
980 “Extracting market expectations from yield curves augmented by money market interest rates: the case of Japan”
by T. Nagano and N. Baba, December 2008.
981 “Why the effective price for money exceeds the policy rate in the ECB tenders?” by T. Välimäki,
December 2008.
982 “Modelling short-term interest rate spreads in the euro money market” by N. Cassola and C. Morana,
December 2008.
983 “What explains the spread between the euro overnight rate and the ECB’s policy rate?” by T. Linzert and
S. Schmidt, December 2008.
984 “The daily and policy-relevant liquidity effects” by D. L. Thornton, December 2008.
985 “Portuguese banks in the euro area market for daily funds” by L. Farinha and V. Gaspar, December 2008.
986 “The topology of the federal funds market” by M. L. Bech and E. Atalay, December 2008.
987 “Probability of informed trading on the euro overnight market rate: an update” by J. Idier and S. Nardelli,
December 2008.
988 “The interday and intraday patterns of the overnight market: evidence from an electronic platform”
by R. Beaupain and A. Durré, December 2008.
989 “Modelling loans to non-financial corporations in the euro area” by C. Kok Sørensen, D. Marqués Ibáñez and
C. Rossi, January 2009.
990 “Fiscal policy, housing and stock prices” by A. Afonso and R. M. Sousa, January 2009.
991 “The macroeconomic effects of fiscal policy” by A. Afonso and R. M. Sousa, January 2009.
51ECB
Working Paper Series No 1018March 2009
992 “FDI and productivity convergence in central and eastern Europe: an industry-level investigation”
by M. Bijsterbosch and M. Kolasa, January 2009.
993 “Has emerging Asia decoupled? An analysis of production and trade linkages using the Asian international input-
output table” by G. Pula and T. A. Peltonen, January 2009.
994 “Fiscal sustainability and policy implications for the euro area” by F. Balassone, J. Cunha, G. Langenus, B. Manzke,
J. Pavot, D. Prammer and P. Tommasino, January 2009.
995 “Current account benchmarks for central and eastern Europe: a desperate search?” by M. Ca’ Zorzi, A. Chudik
and A. Dieppe, January 2009.
996 “What drives euro area break-even inflation rates?” by M. Ciccarelli and J. A. García, January 2009.
997 “Financing obstacles and growth: an analysis for euro area non-financial corporations” by C. Coluzzi, A. Ferrando
and C. Martinez-Carrascal, January 2009.
998 “Infinite-dimensional VARs and factor models” by A. Chudik and M. H. Pesaran, January 2009.
999 “Risk-adjusted forecasts of oil prices” by P. Pagano and M. Pisani, January 2009.
1000 “Wealth effects in emerging market economies” by T. A. Peltonen, R. M. Sousa and I. S. Vansteenkiste,
January 2009.
1001 “Identifying the elasticity of substitution with biased technical change” by M. A. León-Ledesma, P. McAdam and
A. Willman, January 2009.
1002 “Assessing portfolio credit risk changes in a sample of EU large and complex banking groups in reaction to
macroeconomic shocks” by O. Castrén, T. Fitzpatrick and M. Sydow, February 2009.
1003 “Real wages over the business cycle: OECD evidence from the time and frequency domains” by J. Messina,
C. Strozzi and J. Turunen, February 2009.
1004 “Characterising the inflation targeting regime in South Korea” by M. Sánchez, February 2009.
1005 “Labor market institutions and macroeconomic volatility in a panel of OECD countries” by F. Rumler and
J. Scharler, February 2009.
1006 “Understanding sectoral differences in downward real wage rigidity: workforce composition, institutions,
technology and competition” by P. Du Caju, C. Fuss and L. Wintr, February 2009.
1007 “Sequential bargaining in a new-Keynesian model with frictional unemployment and staggered wage negotiation”
by G. de Walque, O. Pierrard, H. Sneessens and R. Wouters, February 2009.
1008 “Liquidity (risk) concepts: definitions and interactions” by K. Nikolaou, February 2009.
1009 “Optimal sticky prices under rational inattention” by B. Maćkowiak and M. Wiederholt, February 2009.
K. Moll, February 2009.
1012 “Petrodollars and imports of oil exporting countries” by R. Beck and A. Kamps, February 2009.
1011 “The global dimension of inflation – evidence from factor-augmented Phillips curves” by S. Eickmeier and
1010 “Business cycles in the euro area” by D. Giannone, M. Lenza and L. Reichlin, February 2009.
1013 “Structural breaks, cointegration and the Fisher effect” by A. Beyer, A. A. Haug and B. Dewald, February 2009.
52ECBWorking Paper Series No 1018March 2009
1014 “Asset prices and current account fluctuations in G7 economies” by M. Fratzscher and R. Straub, February 2009.
February 2009.
1016 “When does lumpy factor adjustment matter for aggregate dynamics?” by S. Fahr and F. Yao, March 2009.
1017 “Optimal prediction pools” by J. Geweke and G. Amisano, March 2009.
1018 “Cross-border mergers and acquisitions: financial and institutional forces” by N. Coeurdacier, R. A. De Santis
and A. Aviat, March 2009.
1015 “Inflation forecasting in the new EU Member States” by O. Arratibel, C. Kamps and N. Leiner-Killinger,