Embed Size (px)
Citation preview
THE QUASI-BIENNIAL OSCILLATION
M. P. Baldwin,1 L. J. Gray,2 T. J. Dunkerton,1 K. Hamilton,3 P. H. Haynes,4
W. J. Randel,5 J. R. Holton,6 M. J. Alexander,7 I. Hirota,8 T. Horinouchi,9 D. B. A. Jones,10
J. S. Kinnersley,11 C. Marquardt,12 K. Sato,13 and M. Takahashi14
Abstract. The quasi-biennial oscillation (QBO) dom-inates the variability of the equatorial stratosphere(;16–50 km) and is easily seen as downward propagat-ing easterly and westerly wind regimes, with a variableperiod averaging approximately 28 months. From a fluiddynamical perspective, the QBO is a fascinating exampleof a coherent, oscillating mean flow that is driven bypropagating waves with periods unrelated to that of theresulting oscillation. Although the QBO is a tropicalphenomenon, it affects the stratospheric flow from poleto pole by modulating the effects of extratropical waves.Indeed, study of the QBO is inseparable from the studyof atmospheric wave motions that drive it and are mod-ulated by it. The QBO affects variability in the meso-sphere near 85 km by selectively filtering waves thatpropagate upward through the equatorial stratosphere,and may also affect the strength of Atlantic hurricanes.The effects of the QBO are not confined to atmosphericdynamics. Chemical constituents, such as ozone, watervapor, and methane, are affected by circulation changesinduced by the QBO. There are also substantial QBOsignals in many of the shorter-lived chemical constitu-
ents. Through modulation of extratropical wave propa-gation, the QBO has an effect on the breakdown of thewintertime stratospheric polar vortices and the severityof high-latitude ozone depletion. The polar vortex in thestratosphere affects surface weather patterns, providinga mechanism for the QBO to have an effect at theEarth’s surface. As more data sources (e.g., wind andtemperature measurements from both ground-based sys-tems and satellites) become available, the effects of theQBO can be more precisely assessed. This review coversthe current state of knowledge of the tropical QBO, itsextratropical dynamical effects, chemical constituenttransport, and effects of the QBO in the troposphere(;0–16 km) and mesosphere (;50–100 km). It is in-tended to provide a broad overview of the QBO and itseffects to researchers outside the field, as well as asource of information and references for specialists. Thehistory of research on the QBO is discussed only briefly,and the reader is referred to several historical reviewpapers. The basic theory of the QBO is summarized, andtutorial references are provided.
1. INTRODUCTION
1.1. The Discovery of the Quasi-Biennial OscillationThe first observations of equatorial stratospheric
winds were made when it was discovered that debrisfrom the eruption of Krakatau (1883) circled the globefrom east to west in about 2 weeks; these winds becameknown as the “Krakatau easterlies.” (For a more com-plete review of the discovery of the quasi-biennial oscil-
lation, and subsequent developments in observationsand theory, see Maruyama [1997] and Labitzke and vanLoon [1999].) In 1908 the German meteorologist A.Berson launched balloons from tropical Africa andfound winds blowing from west to east at about 15 km,near the tropopause, which became known as the “Ber-son westerlies.” For nearly 50 years, there were onlysporadic balloon observations [Hamilton, 1998a] to con-tradict the existence of equatorial stratospheric easterly
1NorthWest Research Associates, Inc., Bellevue, Wash-ington.
2Rutherford Appleton Laboratory, Oxon, England, UnitedKingdom.
3International Pacific Research Center and Department ofMeteorology, University of Hawaii, Honolulu, Hawaii.
4Department of Applied Mathematics and TheoreticalPhysics, University of Cambridge, Cambridge, England,United Kingdom.
5National Center for Atmospheric Research, Boulder,Colorado.
6Department of Atmospheric Sciences, University of Wash-ington, Seattle, Washington.
7NorthWest Research Associates, Colorado Research As-sociates Division, Boulder, Colorado.
8Department of Geophysics, Kyoto University, Kyoto, Japan.9Radio Atmospheric Science Center, Kyoto University, Uji,
Japan.10Division of Engineering and Applied Sciences, Harvard
University, Cambridge, Massachusetts.11Qwest, Seattle, Washington.12GeoForschungsZentrum Potsdam, Potsdam, Germany.13National Institute of Polar Research, Arctic Environment
Research Center, Tokyo, Japan.14Center for Climate System Research, University of To-
kyo, Tokyo, Japan.
Copyright 2001 by the American Geophysical Union. Reviews of Geophysics, 39, 2 / May 2001pages 179–229
8755-1209/01/1999RG000073$15.00 Paper number 1999RG000073● 179 ●
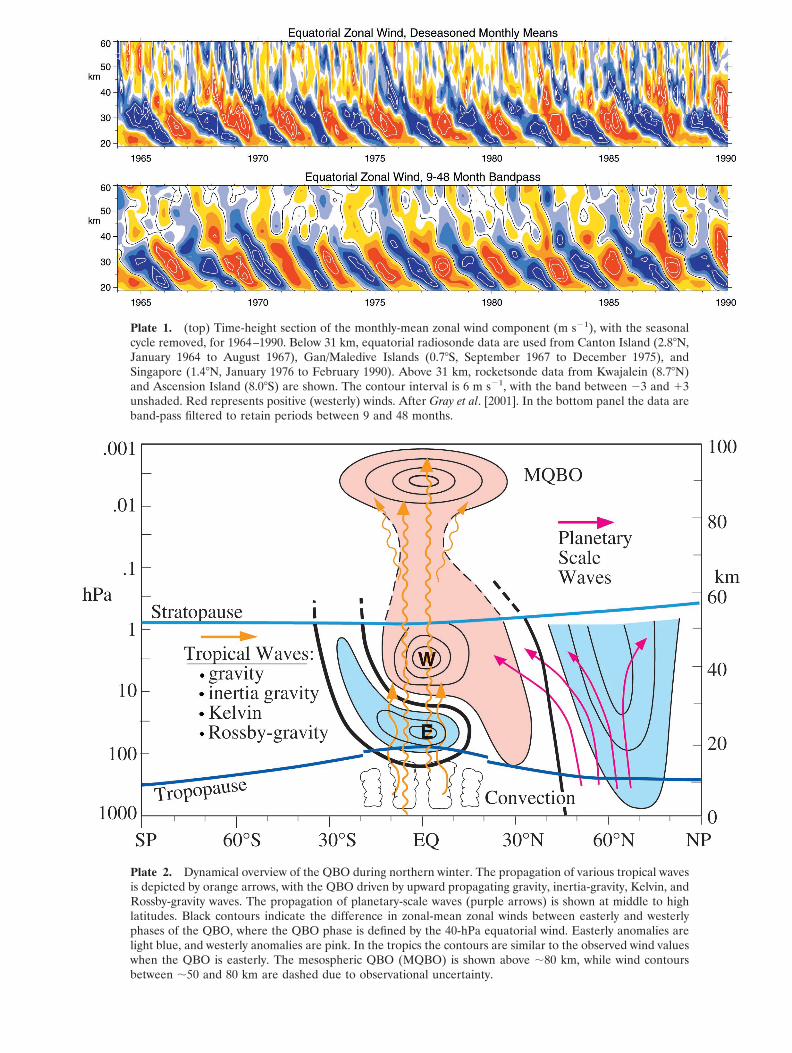
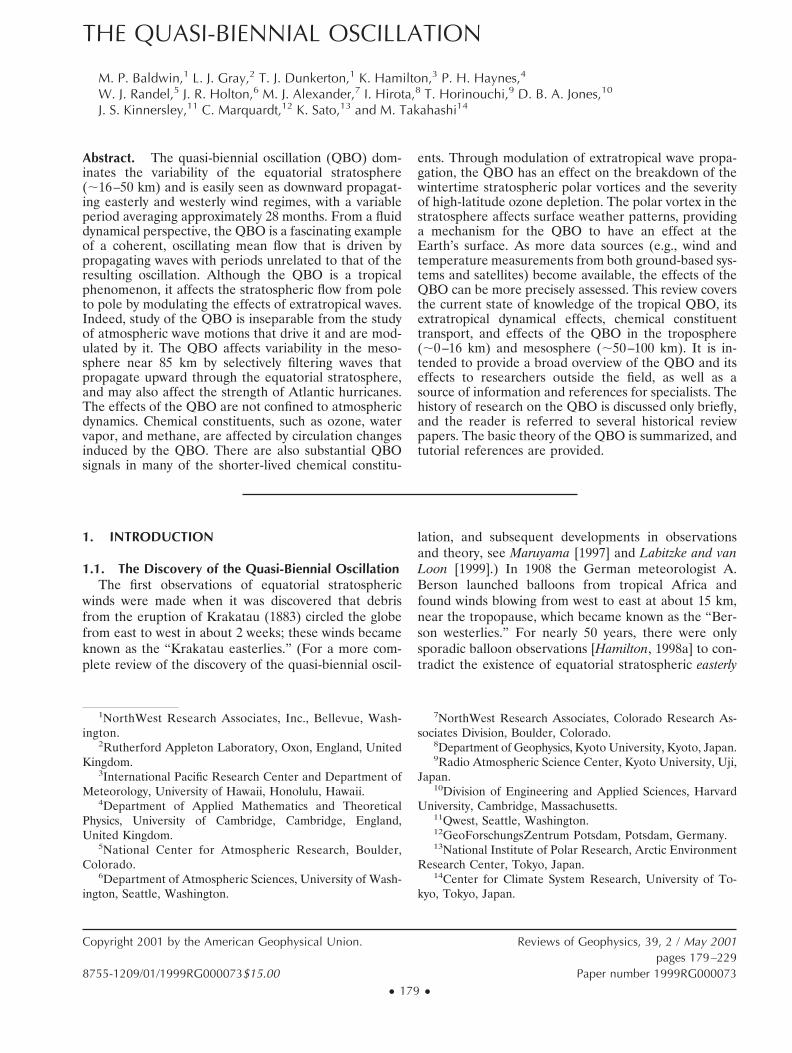
Plate 1. (top) Time-height section of the monthly-mean zonal wind component (m s21), with the seasonalcycle removed, for 1964–1990. Below 31 km, equatorial radiosonde data are used from Canton Island (2.88N,January 1964 to August 1967), Gan/Maledive Islands (0.78S, September 1967 to December 1975), andSingapore (1.48N, January 1976 to February 1990). Above 31 km, rocketsonde data from Kwajalein (8.78N)and Ascension Island (8.08S) are shown. The contour interval is 6 m s21, with the band between 23 and 13unshaded. Red represents positive (westerly) winds. After Gray et al. [2001]. In the bottom panel the data areband-pass filtered to retain periods between 9 and 48 months.
Plate 2. Dynamical overview of the QBO during northern winter. The propagation of various tropical wavesis depicted by orange arrows, with the QBO driven by upward propagating gravity, inertia-gravity, Kelvin, andRossby-gravity waves. The propagation of planetary-scale waves (purple arrows) is shown at middle to highlatitudes. Black contours indicate the difference in zonal-mean zonal winds between easterly and westerlyphases of the QBO, where the QBO phase is defined by the 40-hPa equatorial wind. Easterly anomalies arelight blue, and westerly anomalies are pink. In the tropics the contours are similar to the observed wind valueswhen the QBO is easterly. The mesospheric QBO (MQBO) is shown above ;80 km, while wind contoursbetween ;50 and 80 km are dashed due to observational uncertainty.
winds overlying westerly winds. (Italicized terms are de-fined in the glossary, after the main text. The meteoro-logical term “easterlies” describes winds that blow fromthe east, while “westerlies” blow from the west. Unfor-tunately, the terms eastward (to the east) and westward(to the west) are used commonly in discussions of wavepropagation and flow and have the opposite meaning ofeasterly and westerly. Throughout this review we will useboth descriptions, as found in the literature.) Palmer[1954] used upper air sounding data, gathered to studyfallout from nuclear testing on the Marshall Islands, tofind that the transition between the Berson westerliesand Krakatau easterlies varied from month to monthand year to year. However, the data were insufficient toshow any periodicity. By using observations from Christ-mas Island (2.08N), Graystone [1959] contoured 2 yearsof wind speeds in the time-height plane, which showedgradually descending easterly and westerly wind regimes.
Discovery of the QBO must be credited to the inde-pendent work of R. J. Reed in the United States andR. A. Ebdon in Great Britain. In a paper entitled “Thecirculation of the stratosphere” presented at the fortiethanniversary meeting of the American MeteorologicalSociety, Boston, January 1960, Reed announced thediscovery, using rawinsonde (balloon) data at CantonIsland (2.88S), of “alternate bands of easterly and west-erly winds which originate above 30 km and which movedownward through the stratosphere at a speed of about1 km per month.” Reed pointed out that the bands“appear at intervals of roughly 13 months, 26 monthsbeing required for a complete cycle.” This work was laterpublished as Reed et al. [1961]. Ebdon [1960] also useddata from Canton Island, spanning 1954–1959, to showthat the wind oscillation had an apparent 2-year period.Ebdon and Veryard [1961] used additional data fromCanton Island (January 1954 to January 1960) at 50 hPa(hectopascals, equal to millibars) to show that the windfluctuated with a period of 25–27 months, rather thanexactly 2 years. They extended the earlier study of Eb-don to include other equatorial stations and concludedthat the wind fluctuations occurred simultaneouslyaround the equatorial belt and estimated that the windregimes (when the equatorial winds are easterly or west-erly) took about a year to descend from 10 to 60 hPa.Veryard and Ebdon [1961] extended this study to find adominant period of 26 months and observed similarfluctuations in temperature.
With the observation of a longer-period cycle startingin 1963, Angell and Korshover [1964] coined the term“quasi-biennial oscillation,” which gained acceptanceand was abbreviated QBO. Many of the dynamical as-pects of the QBO are best illustrated by a time-heightcross section of monthly-mean equatorial zonal (longi-tudinal) wind (Plate 1). Ideally, such a diagram would beof the zonally averaged zonal wind, but the approximatelongitudinal symmetry of the QBO [Belmont and Dartt,1968] allows rawinsonde observations from a single sta-tion near the equator to suffice. The alternating wind
regimes repeat at intervals that vary from 22 to 34months, with an average period of slightly more than 28months. Westerly shear zones (in which westerly windsincrease with height) descend more regularly and rapidlythan easterly shear zones. The amplitude of ;20 m s21
is nearly constant from 5 to 40 hPa but decreases rapidlyas the wind regimes descend below 50 hPa. Rawinsondeobservations are used up to 10 hPa, and rocketsondes(meteorological rockets) are used above that. The QBOamplitude diminishes to less than 5 m s21 at 1 hPa, nearthe stratopause. The amplitude of the QBO is approxi-mately Gaussian about the equator with a 128 half widthand little phase dependence on latitude within the trop-ics [Wallace, 1973]. Although the QBO is definitely not abiennial oscillation, there is a tendency for a seasonalpreference in the phase reversal [Dunkerton, 1990] sothat, for example, the onset of both easterly and westerlywind regimes occurs mainly during Northern Hemi-sphere (NH) late spring at the 50-hPa level. The threemost remarkable features of the QBO that any theorymust explain are (1) the quasi-biennial periodicity, (2)the occurrence of zonally symmetric westerly winds atthe equator (conservation of angular momentum doesnot allow zonal-mean advection to create an equatorialwesterly wind maximum), and (3) the downward propa-gation without loss of amplitude.
1.2. The Search for an Explanation of the QBOAt the time of discovery of the QBO, there were no
observations of tropical atmospheric waves and therewas no theory predicting their existence. The search foran explanation for the QBO initially involved a variety ofother causes: some internal feedback mechanism, a nat-ural period of atmospheric oscillation, an external pro-cess, or some combination of these mechanisms. Allthese attempts failed to explain features such as thedownward propagation and maintenance of the ampli-tude of the QBO (and hence increase in energy density)as it descends.
Apparently, forcing by zonally asymmetric waves isrequired to explain the equatorial westerly wind maxi-mum. Wallace and Holton [1968] tried to drive the QBOin a numerical model through heat sources or throughextratropical planetary-scale waves propagating towardthe equator. They showed rather conclusively that lateralmomentum transfer by planetary waves could not ex-plain the downward propagation of the QBO withoutloss of amplitude. They made the crucial realizationthat the only way to reproduce the observations was tohave a driving force (a momentum source) whichactually propagates downward with the mean equato-rial winds.
Booker and Bretherton’s [1967] seminal paper on theabsorption of gravity waves at a critical level provided thespark that would lead to an understanding of how theQBO is driven (see Lindzen [1987] for a historical reviewof the development of the theory of the QBO). It wasLindzen’s leap of insight to realize that vertically prop-
39, 2 / REVIEWS OF GEOPHYSICS Baldwin et al.: THE QUASI-BIENNIAL OSCILLATION ● 181
agating gravity waves could provide the necessary waveforcing for the QBO. Lindzen and Holton [1968] showedexplicitly in a two-dimensional (2-D) model how a QBOcould be driven by a broad spectrum of vertically prop-agating gravity waves (including phase speeds in bothwestward and eastward directions) and that the oscilla-tion arose through an internal mechanism involving atwo-way feedback between the waves and the back-ground flow. The first part of the feedback is the effectof the background flow on the propagation of the waves(and hence on the momentum fluxes). The second partof the feedback is the effect of the momentum fluxes onthe background flow. Lindzen and Holton’s model rep-resented the behavior of the waves and their effect onthe background flow through a simple parameterization.The modeled oscillation took the form of a downwardpropagating pattern of easterly and westerly winds. Animportant corollary to Lindzen and Holton’s work wasthat the period of the oscillation was controlled, in part,by the wave momentum fluxes, and hence a range ofperiods was possible. The fact that the observed oscilla-tion had a period close to a subharmonic of the annualcycle was therefore pure coincidence.
It was a bold assertion to ascribe the forcing of theQBO to eastward and westward propagating equatorialgravity waves, considering that most observational evi-dence of waves was yet to come. The theory of equato-rial waves was first developed during the late 1960s, inparallel with the theory of the QBO. The solutionsincluded a Rossby mode, and a mode which becameknown as the (mixed) Rossby-gravity mode. A third so-lution, an eastward propagating gravity mode, was calledthe equatorial Kelvin mode. Maruyama [1967] displayedobservations consistent with a westward propagatingRossby-gravity mode. Wallace and Kousky [1968a] firstshowed observations of equatorial Kelvin waves in thelower stratosphere and noted that the wave produced anupward flux of westerly momentum, which could accountfor the westerly acceleration associated with the QBO. Anet easterly acceleration is contributed by Rossby-grav-ity waves [Bretherton, 1969].
Holton and Lindzen [1972] refined the work ofLindzen and Holton [1968] by simulating, in a 1-Dmodel, a QBO driven by vertically propagating Kelvinwaves, which contribute a westerly force, and Rossby-gravity waves, which contribute an easterly force. Theobserved amplitudes of these waves, though small, werearguably (given the paucity of equatorial wave observa-tions) large enough to drive the QBO. The Holton andLindzen mechanism continued to be the accepted para-digm for the QBO for more than 2 decades.
The conceptual model of the QBO, which formed thebasis of the Lindzen and Holton [1968] model, wasstrongly supported by the ingenious laboratory experi-ment of Plumb and McEwan [1978], which used a salt-stratified fluid contained in a large annulus. The bottomboundary of the annulus consisted of a flexible mem-brane that oscillated up and down to produce vertically
propagating gravity waves traveling clockwise and coun-terclockwise around the annulus. For waves of sufficientamplitude, a wave-induced mean flow regime was estab-lished that was characterized by downward progressingperiodic reversals of the mean flow. This experiment,which remains one of the most dramatic laboratoryanalogues of a large-scale geophysical flow, showed thatthe theoretical paradigm for the QBO was consistentwith the behavior of a real fluid system.
While the observed amplitudes of Kelvin and mixedRossby-gravity waves may be sufficient to drive a QBOin idealized models of the atmosphere, Gray and Pyle[1989] found it necessary to increase the wave ampli-tudes by a factor of 3 over those observed to achieve arealistic QBO in a full radiative-dynamical-photochem-ical model. Dunkerton [1991a, 1997], and McIntyre [1994]pointed out that the observed rate of tropical upwelling(about 1 km per month) effectively requires that theQBO wind regimes propagate downward much fasterthan was thought, relative to the background air motion,because the whole of the tropical stratosphere is movingupward. This fact more than doubles the required mo-mentum transport by vertically propagating equatorialwaves. Observations indicate that mixed Rossby-gravityand Kelvin waves cannot provide sufficient forcing todrive the QBO with the observed period. Dunkerton[1997] reasoned that additional momentum flux must besupplied by a broad spectrum of gravity waves similar tothose postulated by Lindzen and Holton [1968].
Although the QBO is a tropical phenomenon, it in-fluences the global stratosphere, as first shown by Holtonand Tan [1980]. Through modulation of winds, tempera-tures, extratropical waves, and the circulation in the merid-ional plane, the QBO affects the distribution and transportof trace constituents and may be a factor in stratosphericozone depletion. Thus an understanding of the QBOand its global effects is necessary for studies of long-termvariability or trends in trace gases and aerosols.
2. AN OVERVIEW OF THE QBO AND ITS GLOBALEFFECTS
2.1. Zonal WindA composite of the QBO in equatorial zonal winds
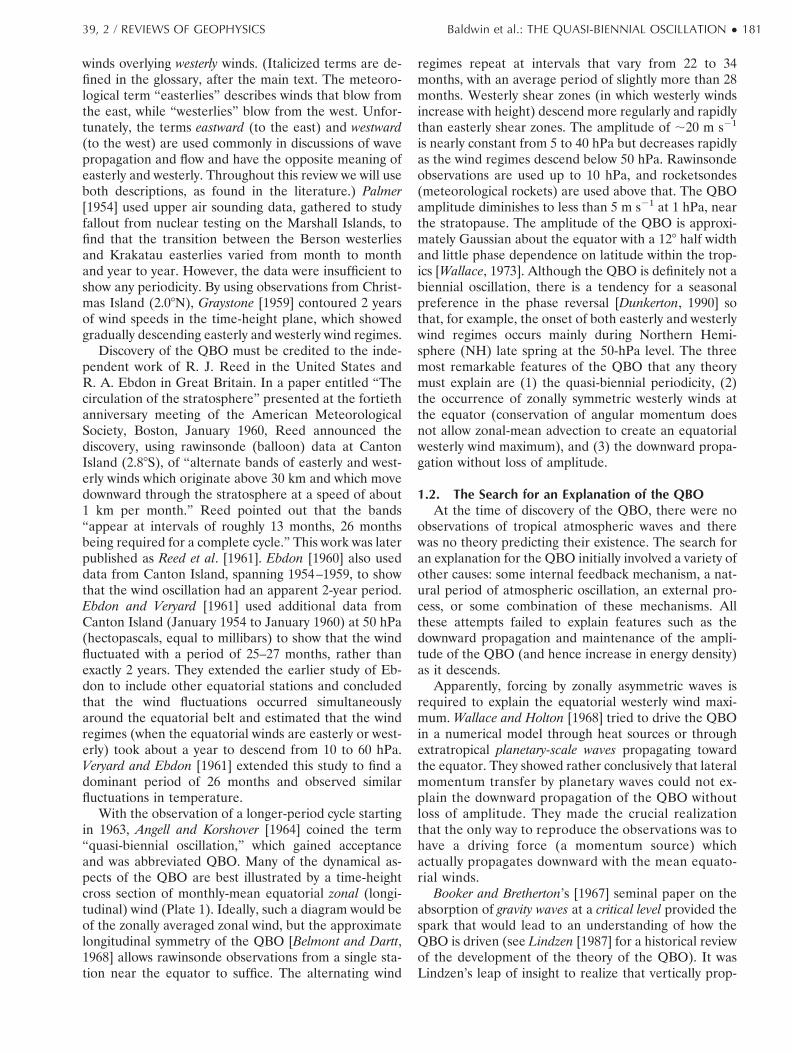
(Figure 1) [Pawson et al., 1993] shows faster and moreregular downward propagation of the westerly phase andthe stronger intensity and longer duration of the easterlyphase. The mean period of the QBO for data during1953–1995 is 28.2 months, slightly longer than the 27.7months obtained from the shorter record of Naujokat[1986]. The standard deviation about the compositeQBO is also included in Figure 1, showing maxima invariability close to the descending easterly and westerlyshear zones (larger for the westerly phase). This mainlyreflects deviations in the duration of each phase (as seen inPlate 1).
Dunkerton [1990] showed that the QBO may be some-
182 ● Baldwin et al.: THE QUASI-BIENNIAL OSCILLATION 39, 2 / REVIEWS OF GEOPHYSICS
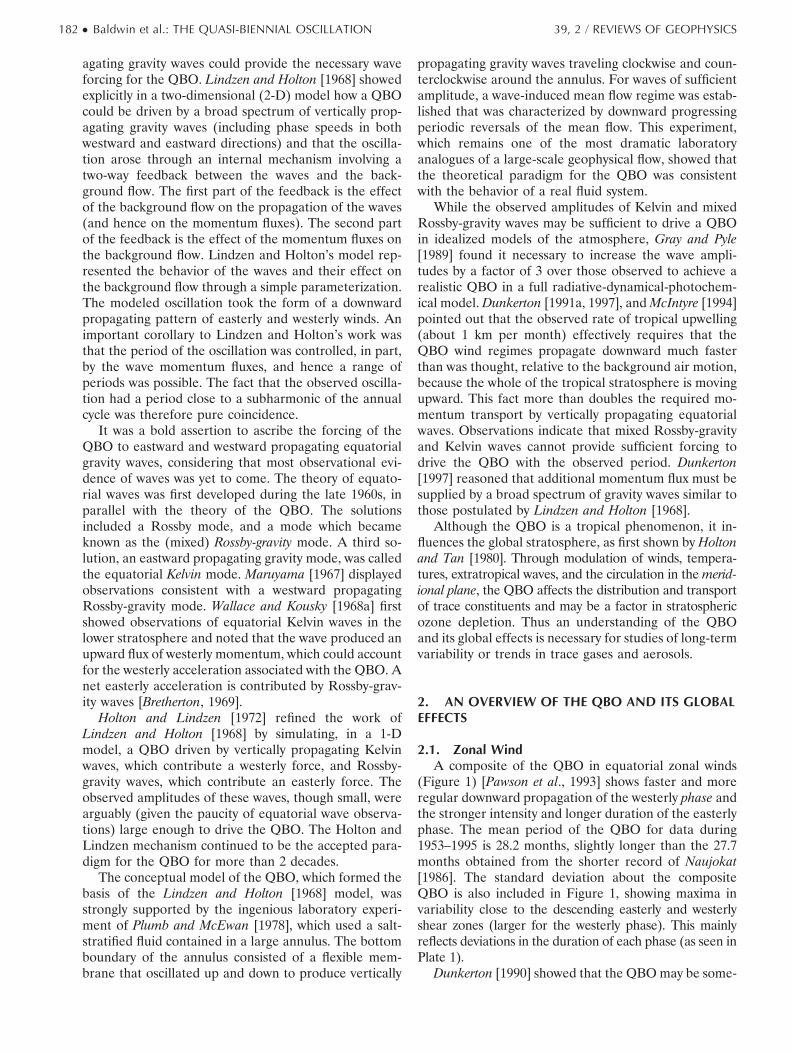
what synchronized to the annual cycle, demonstratingthat the onset of the easterly regime at 50 hPa tends tooccur during NH late spring or summer. His analysis isupdated in Figure 2, which shows the onset of each windregime at 50 hPa. The easterly and westerly transitionsboth show a strong preference to occur during April–June.
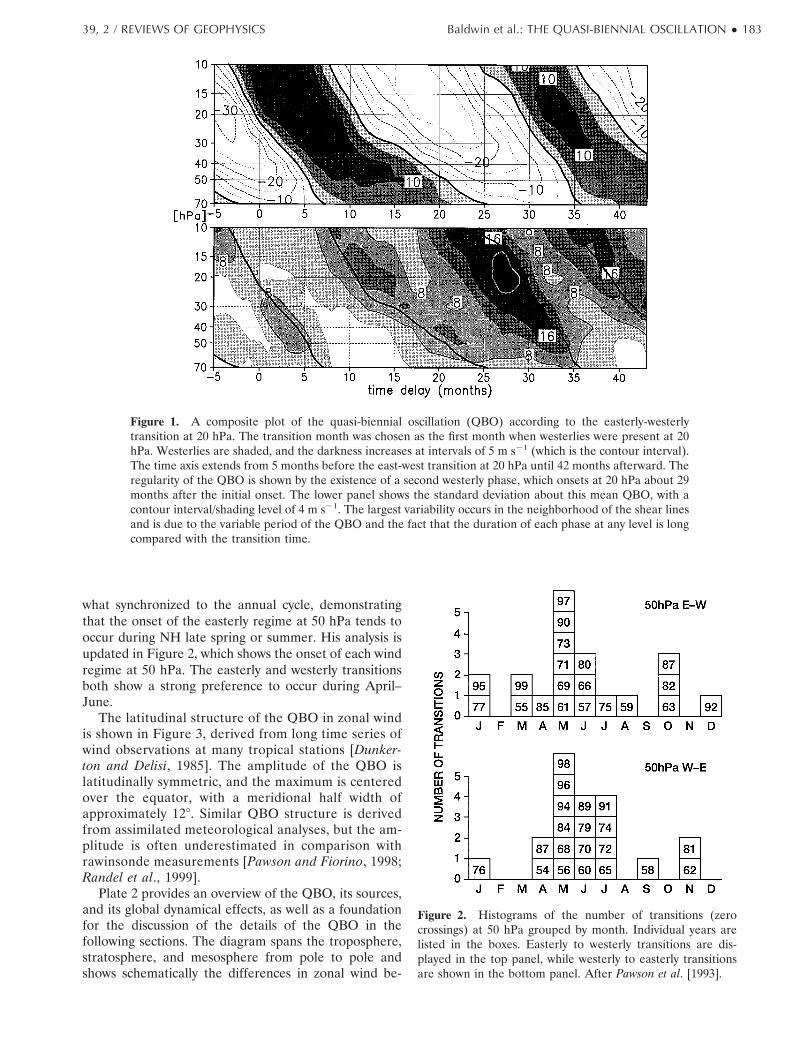
The latitudinal structure of the QBO in zonal windis shown in Figure 3, derived from long time series ofwind observations at many tropical stations [Dunker-ton and Delisi, 1985]. The amplitude of the QBO islatitudinally symmetric, and the maximum is centeredover the equator, with a meridional half width ofapproximately 128. Similar QBO structure is derivedfrom assimilated meteorological analyses, but the am-plitude is often underestimated in comparison withrawinsonde measurements [Pawson and Fiorino, 1998;Randel et al., 1999].
Plate 2 provides an overview of the QBO, its sources,and its global dynamical effects, as well as a foundationfor the discussion of the details of the QBO in thefollowing sections. The diagram spans the troposphere,stratosphere, and mesosphere from pole to pole andshows schematically the differences in zonal wind be-
Figure 1. A composite plot of the quasi-biennial oscillation (QBO) according to the easterly-westerlytransition at 20 hPa. The transition month was chosen as the first month when westerlies were present at 20hPa. Westerlies are shaded, and the darkness increases at intervals of 5 m s21 (which is the contour interval).The time axis extends from 5 months before the east-west transition at 20 hPa until 42 months afterward. Theregularity of the QBO is shown by the existence of a second westerly phase, which onsets at 20 hPa about 29months after the initial onset. The lower panel shows the standard deviation about this mean QBO, with acontour interval/shading level of 4 m s21. The largest variability occurs in the neighborhood of the shear linesand is due to the variable period of the QBO and the fact that the duration of each phase at any level is longcompared with the transition time.
Figure 2. Histograms of the number of transitions (zerocrossings) at 50 hPa grouped by month. Individual years arelisted in the boxes. Easterly to westerly transitions are dis-played in the top panel, while westerly to easterly transitionsare shown in the bottom panel. After Pawson et al. [1993].
39, 2 / REVIEWS OF GEOPHYSICS Baldwin et al.: THE QUASI-BIENNIAL OSCILLATION ● 183
tween the 40-hPa easterly and westerly phases of theQBO.
Convection in the tropical troposphere, ranging fromthe scale of mesoscale convective complexes (spanningmore than 100 km) to planetary-scale phenomena, pro-duces a broad spectrum of waves (orange wavy arrows),including gravity, inertia-gravity, Kelvin, and Rossby-gravity waves (see section 3). These waves, with a varietyof vertical and horizontal wavelengths and phase speeds,propagate into the stratosphere, transporting easterlyand westerly zonal momentum. Most of this zonal mo-mentum is deposited at stratospheric levels, driving thezonal wind anomalies of the QBO. For each wave thevertical profile of the zonal wind determines the criticallevel at or below which the momentum is deposited. Thecritical levels for these waves depend, in part, on theshear zones of the QBO. Some gravity waves propagatethrough the entire stratosphere and produce a QBO
near the mesopause known as the mesospheric QBO, orMQBO (section 6).
In the tropical lower stratosphere the time-averagedwind speeds are small, so the easterly minus westerlycomposite in Plate 2 is similar in appearance to theactual winds during the easterly phase of the QBO. Athigh latitudes, there is a pronounced annual cycle, withstrong westerly winds during the winter season. To thenorth of the equator in the lower stratosphere, tropicalwinds alter the effective waveguide for upward andequatorward propagating planetary-scale waves (curvedpurple arrows). The effect of the zonal wind structure inthe easterly phase of the QBO is to focus more waveactivity toward the pole, where the waves converge andslow the zonal-mean flow. Thus the polar vortex north of;458N shows weaker westerly winds (or easterly anom-aly, shown in light blue). The high-latitude wind anom-alies penetrate the troposphere and provide a mecha-nism for the QBO to have a small influence ontropospheric weather patterns (section 6).
2.2. Temperature and Meridional CirculationThe QBO exhibits a clear signature in temperature,
with pronounced signals in both tropics and extratropics.The tropical temperature QBO is in thermal wind bal-ance with the vertical shear of the zonal winds, expressedfor the equatorial b-plane as
]u] z 5
2RHb
]2T] y2 (1a)
[Andrews et al., 1987, equation 8.2.2], where u is thezonal wind, T is temperature, z is log-pressure height(approximately corresponding to geometric altitude), yis latitude, R is the gas constant for dry air, H ' 7 km isthe nominal (constant) scale height used in the log-pressure coordinates, and b is the latitudinal derivativeof the Coriolis parameter. For QBO variations centeredon the equator with meridional scale L, thermal windbalance at the equator is approximated as
]u] z ,
RHb
TL2 . (1b)
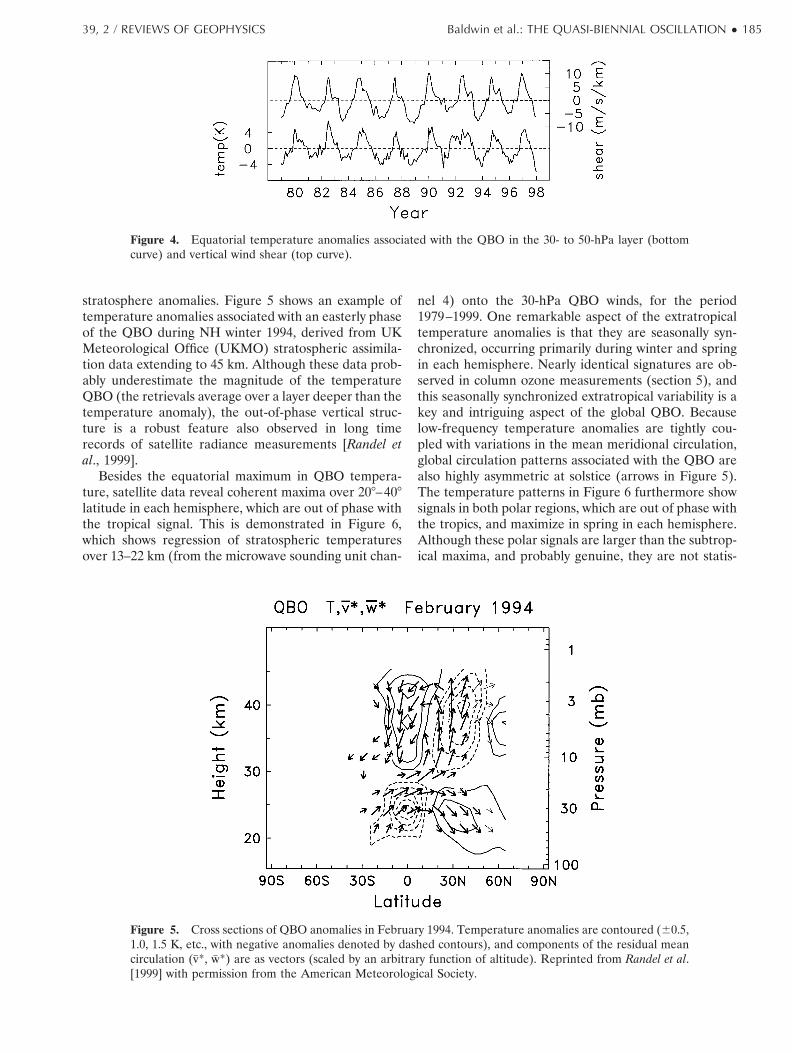
The equatorial temperature anomalies associatedwith the QBO in the lower stratosphere are of the orderof 64 K, maximizing near 30–50 hPa. Figure 4 comparestime series (after subtraction of the seasonal cycle) of30-hPa temperature measurements at Singapore withthe corresponding zonal wind vertical shear in the 30- to50-hPa level, showing good correlation (see also Plate1). The slope of ]u/] z versus temperature estimatedfrom regression is consistent with a meridional scale L ;1000–1200 km (;108 of latitude) [Randel et al., 1999].
Smaller anomalies extend downward, with QBO vari-ations of the order of 60.5 K observed near the tropo-pause [Angell and Korshover, 1964]. The QBO tempera-ture anomalies also extend into the middle and upperstratosphere, where they are out of phase with the lower
Figure 3. Harmonic analysis of 30-hPa zonal wind, showingthe amplitude of the annual cycle (squares), semiannual cycle(triangles), and residual deseasoned component (circles). Sym-bols show individual rawinsonde station amplitudes. Solid linesare based on binned data. Reprinted from Dunkerton andDelisi [1985] with permission from the American Meteorolog-ical Society.
184 ● Baldwin et al.: THE QUASI-BIENNIAL OSCILLATION 39, 2 / REVIEWS OF GEOPHYSICS
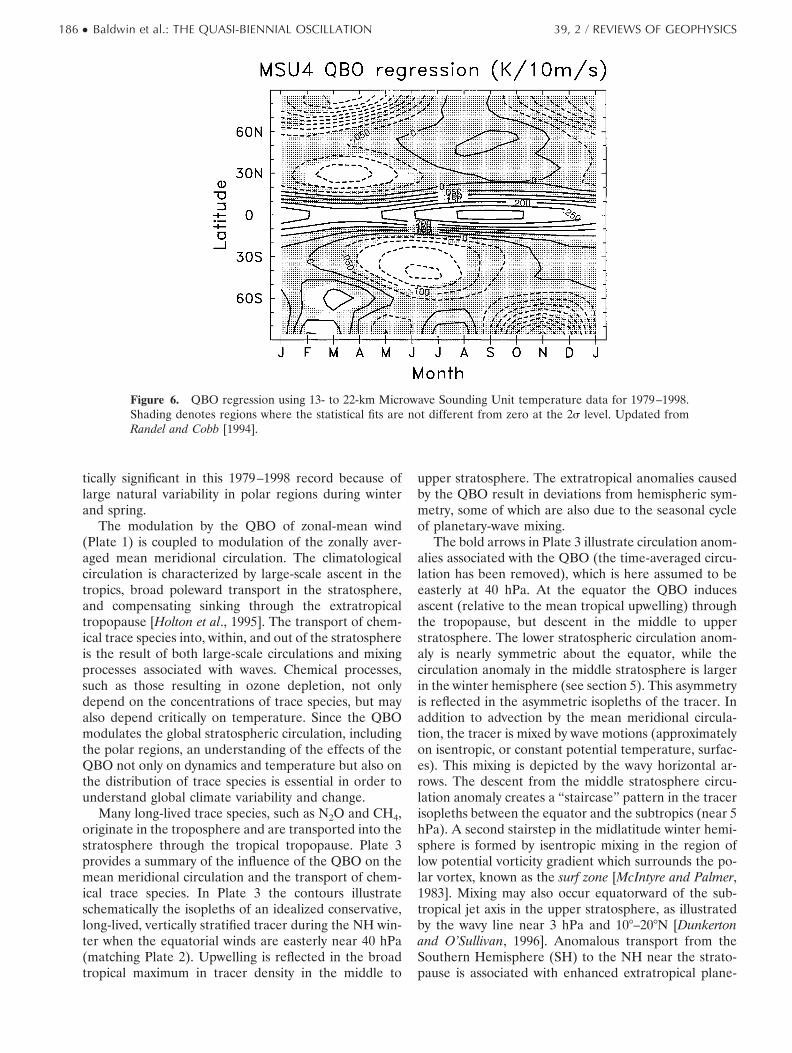
stratosphere anomalies. Figure 5 shows an example oftemperature anomalies associated with an easterly phaseof the QBO during NH winter 1994, derived from UKMeteorological Office (UKMO) stratospheric assimila-tion data extending to 45 km. Although these data prob-ably underestimate the magnitude of the temperatureQBO (the retrievals average over a layer deeper than thetemperature anomaly), the out-of-phase vertical struc-ture is a robust feature also observed in long timerecords of satellite radiance measurements [Randel etal., 1999].
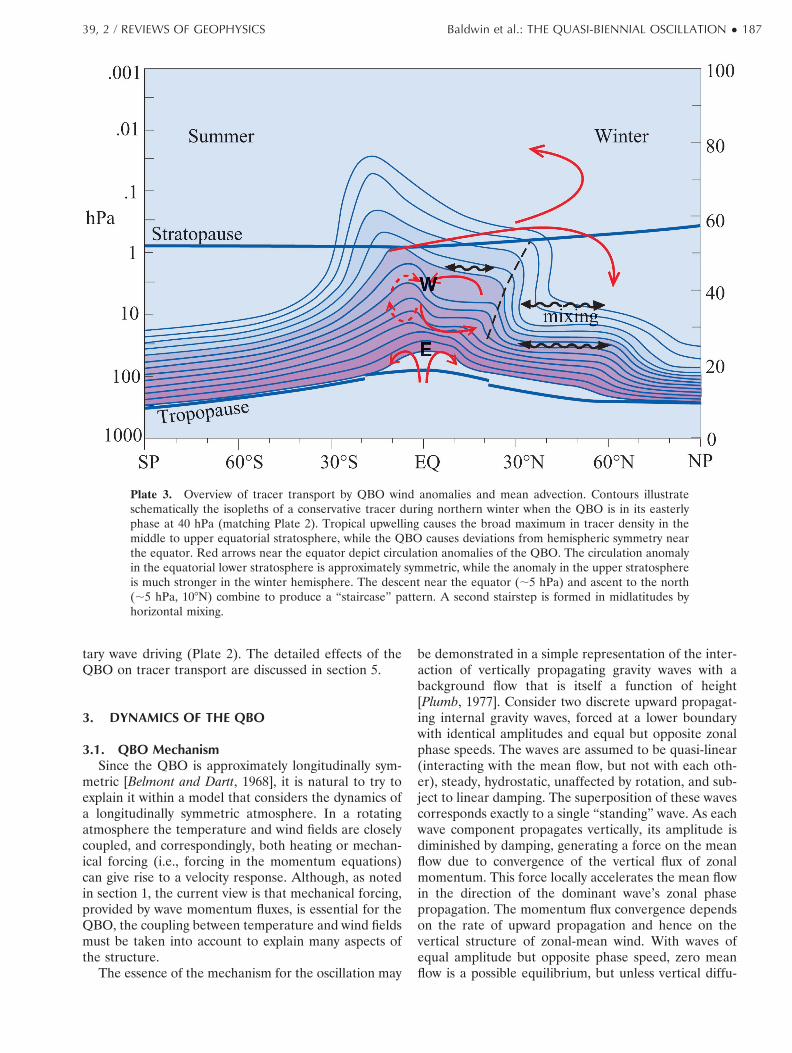
Besides the equatorial maximum in QBO tempera-ture, satellite data reveal coherent maxima over 208–408latitude in each hemisphere, which are out of phase withthe tropical signal. This is demonstrated in Figure 6,which shows regression of stratospheric temperaturesover 13–22 km (from the microwave sounding unit chan-
nel 4) onto the 30-hPa QBO winds, for the period1979–1999. One remarkable aspect of the extratropicaltemperature anomalies is that they are seasonally syn-chronized, occurring primarily during winter and springin each hemisphere. Nearly identical signatures are ob-served in column ozone measurements (section 5), andthis seasonally synchronized extratropical variability is akey and intriguing aspect of the global QBO. Becauselow-frequency temperature anomalies are tightly cou-pled with variations in the mean meridional circulation,global circulation patterns associated with the QBO arealso highly asymmetric at solstice (arrows in Figure 5).The temperature patterns in Figure 6 furthermore showsignals in both polar regions, which are out of phase withthe tropics, and maximize in spring in each hemisphere.Although these polar signals are larger than the subtrop-ical maxima, and probably genuine, they are not statis-
Figure 4. Equatorial temperature anomalies associated with the QBO in the 30- to 50-hPa layer (bottomcurve) and vertical wind shear (top curve).
Figure 5. Cross sections of QBO anomalies in February 1994. Temperature anomalies are contoured (60.5,1.0, 1.5 K, etc., with negative anomalies denoted by dashed contours), and components of the residual meancirculation (v#*, w# *) are as vectors (scaled by an arbitrary function of altitude). Reprinted from Randel et al.[1999] with permission from the American Meteorological Society.
39, 2 / REVIEWS OF GEOPHYSICS Baldwin et al.: THE QUASI-BIENNIAL OSCILLATION ● 185
tically significant in this 1979–1998 record because oflarge natural variability in polar regions during winterand spring.
The modulation by the QBO of zonal-mean wind(Plate 1) is coupled to modulation of the zonally aver-aged mean meridional circulation. The climatologicalcirculation is characterized by large-scale ascent in thetropics, broad poleward transport in the stratosphere,and compensating sinking through the extratropicaltropopause [Holton et al., 1995]. The transport of chem-ical trace species into, within, and out of the stratosphereis the result of both large-scale circulations and mixingprocesses associated with waves. Chemical processes,such as those resulting in ozone depletion, not onlydepend on the concentrations of trace species, but mayalso depend critically on temperature. Since the QBOmodulates the global stratospheric circulation, includingthe polar regions, an understanding of the effects of theQBO not only on dynamics and temperature but also onthe distribution of trace species is essential in order tounderstand global climate variability and change.
Many long-lived trace species, such as N2O and CH4,originate in the troposphere and are transported into thestratosphere through the tropical tropopause. Plate 3provides a summary of the influence of the QBO on themean meridional circulation and the transport of chem-ical trace species. In Plate 3 the contours illustrateschematically the isopleths of an idealized conservative,long-lived, vertically stratified tracer during the NH win-ter when the equatorial winds are easterly near 40 hPa(matching Plate 2). Upwelling is reflected in the broadtropical maximum in tracer density in the middle to
upper stratosphere. The extratropical anomalies causedby the QBO result in deviations from hemispheric sym-metry, some of which are also due to the seasonal cycleof planetary-wave mixing.
The bold arrows in Plate 3 illustrate circulation anom-alies associated with the QBO (the time-averaged circu-lation has been removed), which is here assumed to beeasterly at 40 hPa. At the equator the QBO inducesascent (relative to the mean tropical upwelling) throughthe tropopause, but descent in the middle to upperstratosphere. The lower stratospheric circulation anom-aly is nearly symmetric about the equator, while thecirculation anomaly in the middle stratosphere is largerin the winter hemisphere (see section 5). This asymmetryis reflected in the asymmetric isopleths of the tracer. Inaddition to advection by the mean meridional circula-tion, the tracer is mixed by wave motions (approximatelyon isentropic, or constant potential temperature, surfac-es). This mixing is depicted by the wavy horizontal ar-rows. The descent from the middle stratosphere circu-lation anomaly creates a “staircase” pattern in the tracerisopleths between the equator and the subtropics (near 5hPa). A second stairstep in the midlatitude winter hemi-sphere is formed by isentropic mixing in the region oflow potential vorticity gradient which surrounds the po-lar vortex, known as the surf zone [McIntyre and Palmer,1983]. Mixing may also occur equatorward of the sub-tropical jet axis in the upper stratosphere, as illustratedby the wavy line near 3 hPa and 108–208N [Dunkertonand O’Sullivan, 1996]. Anomalous transport from theSouthern Hemisphere (SH) to the NH near the strato-pause is associated with enhanced extratropical plane-
Figure 6. QBO regression using 13- to 22-km Microwave Sounding Unit temperature data for 1979–1998.Shading denotes regions where the statistical fits are not different from zero at the 2s level. Updated fromRandel and Cobb [1994].
186 ● Baldwin et al.: THE QUASI-BIENNIAL OSCILLATION 39, 2 / REVIEWS OF GEOPHYSICS
tary wave driving (Plate 2). The detailed effects of theQBO on tracer transport are discussed in section 5.
3. DYNAMICS OF THE QBO
3.1. QBO MechanismSince the QBO is approximately longitudinally sym-
metric [Belmont and Dartt, 1968], it is natural to try toexplain it within a model that considers the dynamics ofa longitudinally symmetric atmosphere. In a rotatingatmosphere the temperature and wind fields are closelycoupled, and correspondingly, both heating or mechan-ical forcing (i.e., forcing in the momentum equations)can give rise to a velocity response. Although, as notedin section 1, the current view is that mechanical forcing,provided by wave momentum fluxes, is essential for theQBO, the coupling between temperature and wind fieldsmust be taken into account to explain many aspects ofthe structure.
The essence of the mechanism for the oscillation may
be demonstrated in a simple representation of the inter-action of vertically propagating gravity waves with abackground flow that is itself a function of height[Plumb, 1977]. Consider two discrete upward propagat-ing internal gravity waves, forced at a lower boundarywith identical amplitudes and equal but opposite zonalphase speeds. The waves are assumed to be quasi-linear(interacting with the mean flow, but not with each oth-er), steady, hydrostatic, unaffected by rotation, and sub-ject to linear damping. The superposition of these wavescorresponds exactly to a single “standing” wave. As eachwave component propagates vertically, its amplitude isdiminished by damping, generating a force on the meanflow due to convergence of the vertical flux of zonalmomentum. This force locally accelerates the mean flowin the direction of the dominant wave’s zonal phasepropagation. The momentum flux convergence dependson the rate of upward propagation and hence on thevertical structure of zonal-mean wind. With waves ofequal amplitude but opposite phase speed, zero meanflow is a possible equilibrium, but unless vertical diffu-
Plate 3. Overview of tracer transport by QBO wind anomalies and mean advection. Contours illustrateschematically the isopleths of a conservative tracer during northern winter when the QBO is in its easterlyphase at 40 hPa (matching Plate 2). Tropical upwelling causes the broad maximum in tracer density in themiddle to upper equatorial stratosphere, while the QBO causes deviations from hemispheric symmetry nearthe equator. Red arrows near the equator depict circulation anomalies of the QBO. The circulation anomalyin the equatorial lower stratosphere is approximately symmetric, while the anomaly in the upper stratosphereis much stronger in the winter hemisphere. The descent near the equator (;5 hPa) and ascent to the north(;5 hPa, 108N) combine to produce a “staircase” pattern. A second stairstep is formed in midlatitudes byhorizontal mixing.
39, 2 / REVIEWS OF GEOPHYSICS Baldwin et al.: THE QUASI-BIENNIAL OSCILLATION ● 187
sion is strong, it is an unstable equilibrium; any smalldeviation from zero will inevitably grow with time.
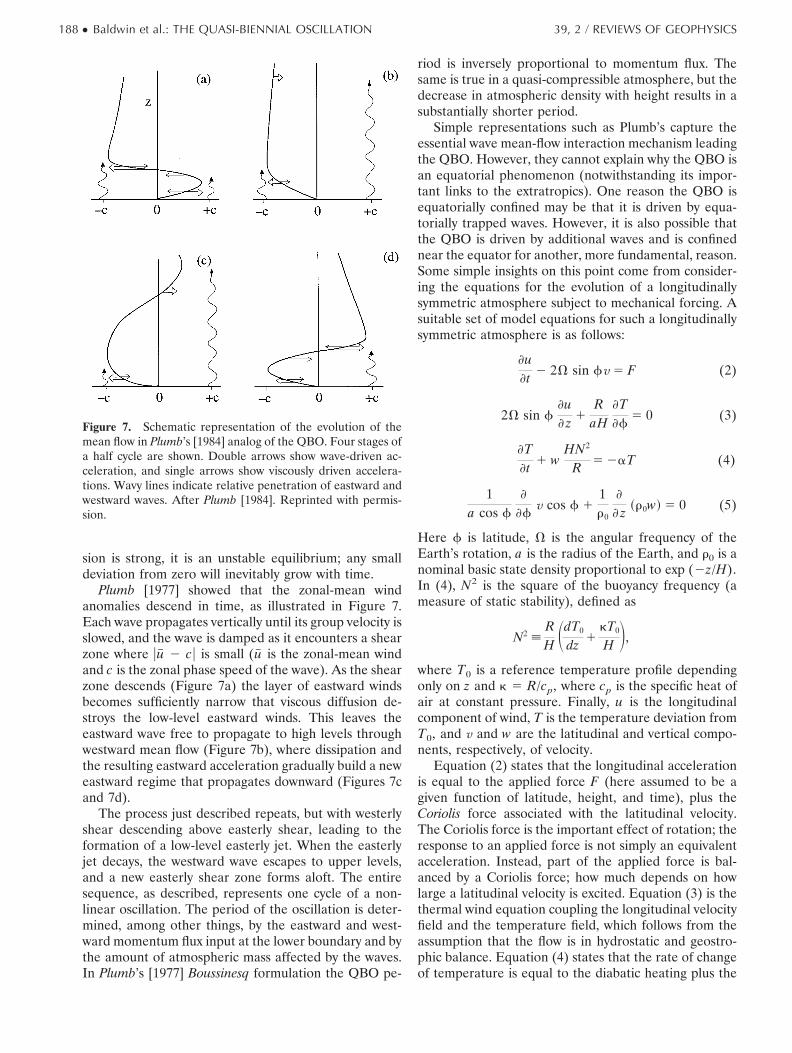
Plumb [1977] showed that the zonal-mean windanomalies descend in time, as illustrated in Figure 7.Each wave propagates vertically until its group velocity isslowed, and the wave is damped as it encounters a shearzone where uu# 2 cu is small (u# is the zonal-mean windand c is the zonal phase speed of the wave). As the shearzone descends (Figure 7a) the layer of eastward windsbecomes sufficiently narrow that viscous diffusion de-stroys the low-level eastward winds. This leaves theeastward wave free to propagate to high levels throughwestward mean flow (Figure 7b), where dissipation andthe resulting eastward acceleration gradually build a neweastward regime that propagates downward (Figures 7cand 7d).
The process just described repeats, but with westerlyshear descending above easterly shear, leading to theformation of a low-level easterly jet. When the easterlyjet decays, the westward wave escapes to upper levels,and a new easterly shear zone forms aloft. The entiresequence, as described, represents one cycle of a non-linear oscillation. The period of the oscillation is deter-mined, among other things, by the eastward and west-ward momentum flux input at the lower boundary and bythe amount of atmospheric mass affected by the waves.In Plumb’s [1977] Boussinesq formulation the QBO pe-
riod is inversely proportional to momentum flux. Thesame is true in a quasi-compressible atmosphere, but thedecrease in atmospheric density with height results in asubstantially shorter period.
Simple representations such as Plumb’s capture theessential wave mean-flow interaction mechanism leadingthe QBO. However, they cannot explain why the QBO isan equatorial phenomenon (notwithstanding its impor-tant links to the extratropics). One reason the QBO isequatorially confined may be that it is driven by equa-torially trapped waves. However, it is also possible thatthe QBO is driven by additional waves and is confinednear the equator for another, more fundamental, reason.Some simple insights on this point come from consider-ing the equations for the evolution of a longitudinallysymmetric atmosphere subject to mechanical forcing. Asuitable set of model equations for such a longitudinallysymmetric atmosphere is as follows:
]u]t 2 2V sin fv 5 F (2)
2V sin f]u] z 1
RaH
]T]f
5 0 (3)
]T]t 1 w
HN2
R 5 2aT (4)
1a cos f
]
]fv cos f 1
1r0
]
] z ~r0w! 5 0 (5)
Here f is latitude, V is the angular frequency of theEarth’s rotation, a is the radius of the Earth, and r0 is anominal basic state density proportional to exp (2z/H).In (4), N2 is the square of the buoyancy frequency (ameasure of static stability), defined as
N2 ;RH SdT0
dz 1kT0
H D,
where T0 is a reference temperature profile dependingonly on z and k 5 R/cp, where cp is the specific heat ofair at constant pressure. Finally, u is the longitudinalcomponent of wind, T is the temperature deviation fromT0, and v and w are the latitudinal and vertical compo-nents, respectively, of velocity.
Equation (2) states that the longitudinal accelerationis equal to the applied force F (here assumed to be agiven function of latitude, height, and time), plus theCoriolis force associated with the latitudinal velocity.The Coriolis force is the important effect of rotation; theresponse to an applied force is not simply an equivalentacceleration. Instead, part of the applied force is bal-anced by a Coriolis force; how much depends on howlarge a latitudinal velocity is excited. Equation (3) is thethermal wind equation coupling the longitudinal velocityfield and the temperature field, which follows from theassumption that the flow is in hydrostatic and geostro-phic balance. Equation (4) states that the rate of changeof temperature is equal to the diabatic heating plus the
Figure 7. Schematic representation of the evolution of themean flow in Plumb’s [1984] analog of the QBO. Four stages ofa half cycle are shown. Double arrows show wave-driven ac-celeration, and single arrows show viscously driven accelera-tions. Wavy lines indicate relative penetration of eastward andwestward waves. After Plumb [1984]. Reprinted with permis-sion.
188 ● Baldwin et al.: THE QUASI-BIENNIAL OSCILLATION 39, 2 / REVIEWS OF GEOPHYSICS
adiabatic temperature change associated with verticalmotion. Here the diabatic heating is represented by theterm 2aT, where a is a constant rate, representinglong-wave heating or cooling. Equation (5) is the mass-continuity equation.
Equation (2)–(5) may be regarded as predictive equa-tions for the unknowns ]u/]t, ]T/]t, v, and w. They maybe combined to give a single equation for one of theunknowns, with a single forcing term containing theforce F. It is convenient to follow Garcia [1987] andassume that the time dependence is purely harmonic.Thus we write F(f, z, t) 5 Re (F(f, z)eivt) and considerthe response in the longitudinal velocity u, assumed tobe of the form u(f, z, t) 5 Re (u(f, z)eivt). Equations(2)–(5) then can be transformed to a single equation
1cos f
]
]f S 1cos f
]
]f Scos f
sin fuDD
11r0
]
] z Sr0S1 1a
ivD 4V2a2
N2
sin f
cos f
]u] zD
51iv
1cos f
]
]f S 1cos f
]
]f Scos f
sin fFDD . (6)
The operator acting on u on the left-hand side of theequation is elliptic, consistent with the well-known prop-erty of rotating, stratified systems that localized forcinggives rise to a nonlocal response. For an oscillation withperiod 2 years, v ' 1027 s21. The Newtonian coolingrate a is, for the lower stratosphere, generally taken tobe about 5 3 1027 s21, corresponding to a timescale ofabout 20 days. Hence the factor 1 1 a/(iv) appearing inthe second term on the left-hand side may be approxi-mated by a/(iv).
A scale analysis of (6) shows that when rotationaleffects are weak, i.e., when sin f is small, the dominantbalance is between the forcing term and the first term onthe left-hand side. This implies that the acceleration isequal to the applied force. More generally, the secondterm on the left-hand side will play a major role in thebalance, implying that the Coriolis force must be sub-stantially canceling the applied force in (2). FollowingHaynes [1998], a quantitative comparison of the twoterms on the left-hand side of (6) may be performed byassuming a height scale D and a latitudinal scale L forthe velocity response. Then, at low latitudes, noting thatsin f scales as f and hence as L/a, the ratio of thesecond term on the left-hand side of (6) to the first is4V2L4a/(a2D2N2v). It follows that if L ,, (aDN/(2V))1/ 2(v/a)1/4, then the acceleration is approxi-mately equal to the applied force. This might be calledthe “tropical response”; it occurs if the latitudinal scaleL is small enough. On the other hand, if L .. (aDN/(2V))1/ 2(v/a)1/4, then the applied force is largely can-celed by the Coriolis torque and most of the response tothe applied force appears as a mean meridional circula-tion. This might be called the “extratropical response”
(though clearly the scaling would require modification ifit were to be applied well away from the equator).
The physical reason for the distinction between thetropical and extratropical responses is the link betweenvelocity and temperature fields in a rotating system,expressed by (3), together with the temperature damp-ing implied by (4). At high latitudes an applied force,varying on sufficiently long timescales, will tend to becanceled by the Coriolis force due to a mean meridionalcirculation. This circulation will induce temperatureanomalies, upon which the thermal damping will act,effectively damping the velocity response and limiting itsamplitude. At low latitudes, on the other hand, the forcewill give rise to an acceleration, there will be relativelylittle temperature response, and thermal damping willhave little effect on the velocity response. It is as iflow-latitude velocities have a longer “memory” thanhigh-latitude velocities; anomalies at low latitudes takelonger to dissipate [Scott and Haynes, 1998]. Thus theQBO mechanism might be expected to work only at lowlatitudes. The Lindzen and Holton [1968] experiments ina 2-D model showed that the Coriolis torque reducedthe amplitude of the wind oscillation away from theequator. Haynes [1998] went further to suggest that thetransition from the tropical regime to the extratropicalregime may set the latitudinal width of the QBO, ratherthan, for example, the latitudinal scale of the waves thatprovide the necessary momentum flux. Simulations in asimple numerical model where the momentum forcing isprovided by a latitudinally broad field of small-scalegravity waves, designed not to impose any latitudinalscale, predicted a transition scale at about 108.
To summarize, a long-period oscillation that requiresthe zonal velocity field to respond directly to a wave-induced forced is likely to work only in the tropics, sinceelsewhere the force will tend to be balanced by theCoriolis torque due to a meridional circulation. For thisreason, 1-D models, which omit Coriolis torques alto-gether, can capture the tropical oscillation. However,they cannot simulate the latitudinal structure that arisesin part from the increase of Coriolis torques with lati-tude.
3.2. Waves in the Tropical Lower StratosphereThere exists a broad spectrum of waves in the tropics,
many of which contribute to the QBO. On the basis ofobservations of wave amplitudes, we now believe that acombination of Kelvin, Rossby-gravity, inertia-gravity,and smaller-scale gravity waves provide most of themomentum flux needed to drive the QBO [Dunkerton,1997]. All of these waves originate in the tropical tropo-sphere and propagate vertically to interact with theQBO. Convection plays a significant role in the genera-tion of tropical waves. Modes are formed through lateralpropagation, refraction, and reflection within an equa-torial waveguide, the horizontal extent of which dependson wave properties, for example, turning points where
39, 2 / REVIEWS OF GEOPHYSICS Baldwin et al.: THE QUASI-BIENNIAL OSCILLATION ● 189
wave intrinsic frequency equals the local inertial fre-quency.
Equatorward propagating waves originating outsidethe tropics, such as planetary Rossby waves from thewinter hemisphere, may have some influence in upperlevels of the QBO [Ortland, 1997]. The lower region ofthe QBO (;20–23 km) near the equator is relativelywell shielded from the intrusion of extratropical plane-tary waves [O’Sullivan, 1997].
Vertically propagating waves relevant to the QBO areeither those with slow vertical group propagation under-going absorption (due to radiative or mechanical damp-ing) at such a rate that their momentum is deposited atQBO altitudes, or those with fast vertical group propa-gation up to a critical level lying within the range ofQBO wind speeds [Dunkerton, 1997]. The height atwhich momentum is deposited depends on the verticalgroup velocity (supposing for argument’s sake that thedamping rate per unit time is independent of waveproperties). Waves with very slow group propagation areconfined within a few kilometers of the tropopause [Li etal., 1997]. On the other hand, waves with fast verticalgroup velocity and with phase speeds lying outside therange of QBO wind speeds propagate more or lesstransparently through the QBO.
Long-period waves tend to dominate spectra of hor-izontal wind and temperature. However, higher-fre-quency waves contribute more to momentum fluxes thanmight be expected from consideration of temperaturealone. We can organize the waves relevant to the QBOinto three categories: (1) Kelvin and Rossby-gravitywaves, which are equatorially trapped; periods of *3days; wave numbers 1–4 (zonal wavelengths *10,000km); (2) inertia-gravity waves, which may or may not beequatorially trapped; periods of ;1–3 days; wave num-bers ;4–40 (zonal wavelengths ;1000–10,000 km); and(3) gravity waves; periods of &1 day; wave number .40(zonal wavelengths ;10–1000 km) propagating rapidlyin the vertical. (Waves with very short horizontal wave-lengths &10 km tend to be trapped vertically at tropo-spheric levels near the altitude where they are forcedand are not believed to play a significant role in middleatmosphere dynamics.)
The observations reviewed below suggest that inter-mediate and high-frequency waves help to drive theQBO. However, uncertainties remain in the wave mo-mentum flux spectrum, with regard to actual values offlux and the relative contribution from various parts ofthe spectrum. Although the momentum flux in me-soscale waves is locally very large, it is necessary to knowthe spatial and temporal distribution of these waves inorder to assess their role in the QBO. Available obser-vations are insufficient for this purpose. For intermedi-ate-scale waves, it is unclear what fraction of the wavesis important to the QBO without a more precise esti-mate of their phase speeds, modal structure, and absorp-tion characteristics. Twice-daily rawinsondes provide anaccurate picture of vertical structure but have poor hor-
izontal and temporal coverage. Their description of hor-izontal structure is inadequate, and temporal aliasingmay occur, obscuring the true frequency of the waves.
The QBO, in principle, depends on wave driving fromthe entire tropical belt, but the observing network canonly sample a small fraction of horizontal area and time.Thus it is uncertain how to translate the informationfrom local observations of intermediate and small-scalewaves into a useful estimate of QBO wave driving on aglobal scale. Ultimately, satellite observations will pro-vide the needed coverage in space and time. Theseobservations have already proven useful for planetary-scale equatorial waves and small-scale extratropicalgravity waves with deep vertical wavelength. Significantimprovement in the vertical resolution of satellite instru-ments and their ability to measure or infer horizontalwind components will be necessary, however, beforesuch observations are quantitatively useful for estimatesof momentum flux due to intermediate and small-scalewaves in the QBO region.
3.2.1. Kelvin and Rossby-gravity waves. Kelvinand Rossby-gravity waves were detected using rawin-sonde observational data by Yanai and Maruyama [1966]and Wallace and Kousky [1968b]; these discoveries wereimportant to the development of a modified theory ofthe QBO by Holton and Lindzen [1972]. For reviews ofearly equatorial wave observations, see Wallace [1973],Holton [1975], Cornish and Larsen [1985], Andrews et al.[1987], and Dunkerton [1997]. Interpretation of distur-bances as equatorial wave modes relies on a comparisonof wave parameters (e.g., the relation of horizontal scaleand frequency), latitudinal structure (e.g., symmetric orantisymmetric about the equator), and phase relation-ship between variables (e.g., wind components and tem-perature) with those predicted by theory. The identifi-cation of equatorial modes is relatively easy in regionswith good spatial coverage so that coherent propagationmay be observed.
Long records of rawinsonde data from high-qualitystations have been used to derive seasonal and QBO-related variations of Kelvin and Rossby-gravity waveactivity near the equator [Maruyama, 1991; Dunkerton,1991b, 1993; Shiotani and Horinouchi, 1993; Sato et al.,1994; Wikle et al., 1997]. The QBO variation of Kelvinwave activity observed in fluctuations of zonal wind andtemperature is consistent with the expected amplifica-tion of these waves in descending westerly shear zones.Annual variation of Rossby-gravity wave activity is ob-served in the lowermost equatorial stratosphere and mayhelp to explain the observed seasonal variation of QBOonsets near 50 hPa [Dunkerton, 1990].
Equatorially trapped waves have been observed intemperature and trace constituent data obtained fromvarious satellite instruments. Most of these studies dealtwith waves in the upper stratosphere relevant to thestratopause semiannual oscillation (SAO); a few, how-ever, also observed waves in the equatorial lower strato-sphere relevant to the QBO [e.g., Salby et al., 1984;
190 ● Baldwin et al.: THE QUASI-BIENNIAL OSCILLATION 39, 2 / REVIEWS OF GEOPHYSICS
Randel, 1990; Ziemke and Stanford, 1994; Canziani et al.,1995; Kawamoto et al., 1997; Shiotani et al., 1997; Mote etal., 1998; Canziani and Holton, 1998]. It is difficult todetect the weak, shallow temperature signals associatedwith vertically propagating equatorial waves, and satel-lite sampling usually recovers only the lowest zonal wavenumbers (e.g., waves 1–6). Nevertheless, satellite obser-vations are valuable for their global view, complement-ing the irregular sampling of the rawinsonde network.
Two-dimensional modeling studies [Gray and Pyle,1989; Dunkerton, 1991a, 1997] showed that Kelvin andRossby-gravity waves are insufficient to account for therequired vertical flux of momentum to drive the QBO.The required momentum flux is much larger than waspreviously assumed because the tropical stratosphericair moves upward with the Brewer-Dobson circulation.When realistic equatorial upwelling is included in mod-els, the required total wave flux for a realistic QBO is2–4 times as large as that of the observed large-scale,long-period Kelvin and Rossby-gravity waves. Three-dimensional simulations [e.g., Takahashi and Boville,1992; Hayashi and Golder, 1994; Takahashi, 1996] de-scribed in section 3.3.2 confirm the need for additionalwave fluxes. Therefore it is necessary to understandbetter from observations the morphology of smaller-scale inertia-gravity and gravity waves and their possiblerole in the QBO.
3.2.2. Inertia-gravity waves. Eastward propagat-ing equatorial inertia-gravity waves are seen in westerlyshear phases of the QBO, while westward propagatingwaves are seen in easterly shear phases. Observationalcampaigns using rawinsondes have provided data withhigh temporal and vertical resolution, so that analysis ispossible both for temporal and vertical phase variations.
Cadet and Teitelbaum [1979] conducted a pioneeringstudy on inertia-gravity waves in the equatorial region,analyzing 3-hourly rawinsonde data at 8.58N, 23.58Wduring the Global Atmospheric Research Project Atlan-tic Tropical Experiment (GATE). The QBO was in aneasterly shear phase. They detected a short verticalwavelength (,1.5 km) inertia-gravity wave-like structurehaving a period of 30–40 hours. The zonal phase veloc-ity was estimated to be westward.
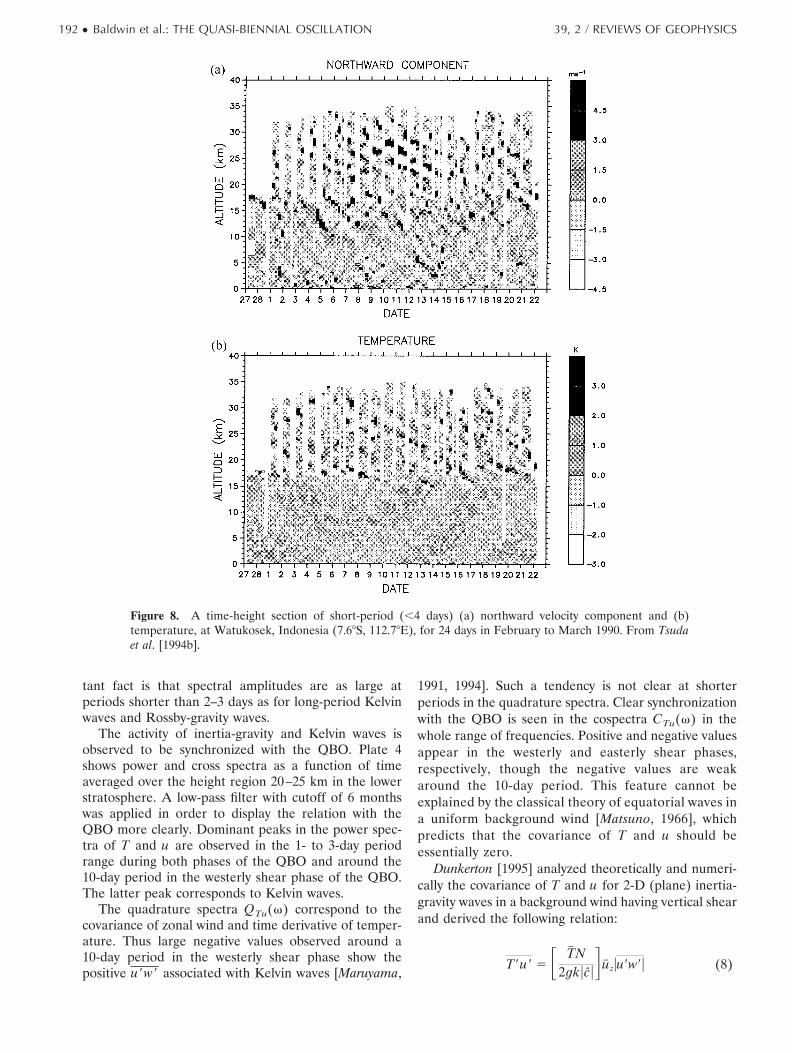
Tsuda et al. [1994a, 1994b] conducted an observa-tional campaign focusing on waves in the lower strato-sphere at Watukosek, Indonesia (7.68S, 112.78E), for 24days in February–March 1990 when the QBO was in awesterly shear phase. Wind and temperature data wereobtained with a temporal interval of 6 hours and verticalresolution of 150 m. Figure 8 shows a time-height sectionof temperature fluctuations with periods shorter than 4days. Clear downward phase propagation is observed inthe lower stratosphere (above about 16 km altitude).The vertical wavelength is about 3 km, and the waveperiod is about 2 days. Similar wave structure was seenalso for zonal (u) and meridional wind (v) fluctuations.The amplitudes of horizontal wind and temperaturefluctuations were about 3 m s21 and 2 K, respectively.
On the basis of hodographic analysis, assuming thatthese fluctuations are due to plane inertia-gravity waves,Tsuda et al. [1994b] showed that most wave activitypropagated eastward and upward in the lower strato-sphere. Similar characteristics were observed in theirsecond campaign, in Bandung, Indonesia (107.68E,6.98S), during another westerly shear phase of the QBO(November 1992 to April 1993) [Shimizu and Tsuda,1997].
Statistical studies of equatorial inertia-gravity waveshave been made using operational rawinsonde data atSingapore (1.48N, 104.08E). Maruyama [1994] and Satoet al. [1994] analyzed the year-to-year variation of 1- to3-day wave activity in the lower stratosphere using datafrom Singapore spanning 10 years. Extraction of wavesby their periods is useful since the ground-based wavefrequency is invariant during the wave propagation in asteady background field. The QBO can be consideredsufficiently steady for these purposes for inertia-gravitywaves having periods shorter than several days.
Maruyama [1994] analyzed the covariance of zonalwind and the time derivative of temperature for 1- to3-day components and estimated the vertical flux ofzonal momentum per unit density u9w9 using the follow-ing relation derived from the thermodynamic equationfor adiabatic motions:
]T9
]t u9 5 2FT# N2
g G cc u9w9, (7)
where T is temperature, t is time, u and w are the zonaland vertical components of wind velocity, c is theground-based horizontal phase speed, c 5 c 2 u# is theintrinsic horizontal phase speed, u# is the backgroundwind speed, and the overbar indicates a time average.Since c is not obtained from the observational data, thisestimate is possible only when u# is small enough toassume c/c ; 1. Maruyama showed that the momentumflux u9w9 is largely positive and that the magnitude iscomparable to that of long-period Kelvin waves in thewesterly shear phase of the QBO.
Sato et al. [1994] examined the interannual variationof power and cross spectra of horizontal wind and tem-perature fluctuations in the period range of 1–20 days atSingapore. They found that spectral amplitudes are max-imized around the tropopause for all components in thewhole frequency band, although the altitudes of thetropopause maxima are slightly different. The T and uspectra are maximized around a 10-day period, corre-sponding to Kelvin waves. In the lower stratosphere thewave period shortens, for example, 9 days at 20 km to 6days at 30 km. On the other hand, v spectra are maxi-mized around 5 days, slightly below the tropopause,corresponding to Rossby-gravity waves. The Rossby-gravity wave period also becomes shorter with increasingaltitude in the lower stratosphere, consistent with theanalysis of Dunkerton [1993] based on rawinsonde dataat several locations over the tropical Pacific. An impor-
39, 2 / REVIEWS OF GEOPHYSICS Baldwin et al.: THE QUASI-BIENNIAL OSCILLATION ● 191
tant fact is that spectral amplitudes are as large atperiods shorter than 2–3 days as for long-period Kelvinwaves and Rossby-gravity waves.
The activity of inertia-gravity and Kelvin waves isobserved to be synchronized with the QBO. Plate 4shows power and cross spectra as a function of timeaveraged over the height region 20–25 km in the lowerstratosphere. A low-pass filter with cutoff of 6 monthswas applied in order to display the relation with theQBO more clearly. Dominant peaks in the power spec-tra of T and u are observed in the 1- to 3-day periodrange during both phases of the QBO and around the10-day period in the westerly shear phase of the QBO.The latter peak corresponds to Kelvin waves.
The quadrature spectra QTu(v) correspond to thecovariance of zonal wind and time derivative of temper-ature. Thus large negative values observed around a10-day period in the westerly shear phase show thepositive u9w9 associated with Kelvin waves [Maruyama,
1991, 1994]. Such a tendency is not clear at shorterperiods in the quadrature spectra. Clear synchronizationwith the QBO is seen in the cospectra CTu(v) in thewhole range of frequencies. Positive and negative valuesappear in the westerly and easterly shear phases,respectively, though the negative values are weakaround the 10-day period. This feature cannot beexplained by the classical theory of equatorial waves ina uniform background wind [Matsuno, 1966], whichpredicts that the covariance of T and u should beessentially zero.
Dunkerton [1995] analyzed theoretically and numeri-cally the covariance of T and u for 2-D (plane) inertia-gravity waves in a background wind having vertical shearand derived the following relation:
T9u9 5 F T# N2gkucuGu# zuu9w9u (8)
Figure 8. A time-height section of short-period (,4 days) (a) northward velocity component and (b)temperature, at Watukosek, Indonesia (7.68S, 112.78E), for 24 days in February to March 1990. From Tsudaet al. [1994b].
192 ● Baldwin et al.: THE QUASI-BIENNIAL OSCILLATION 39, 2 / REVIEWS OF GEOPHYSICS
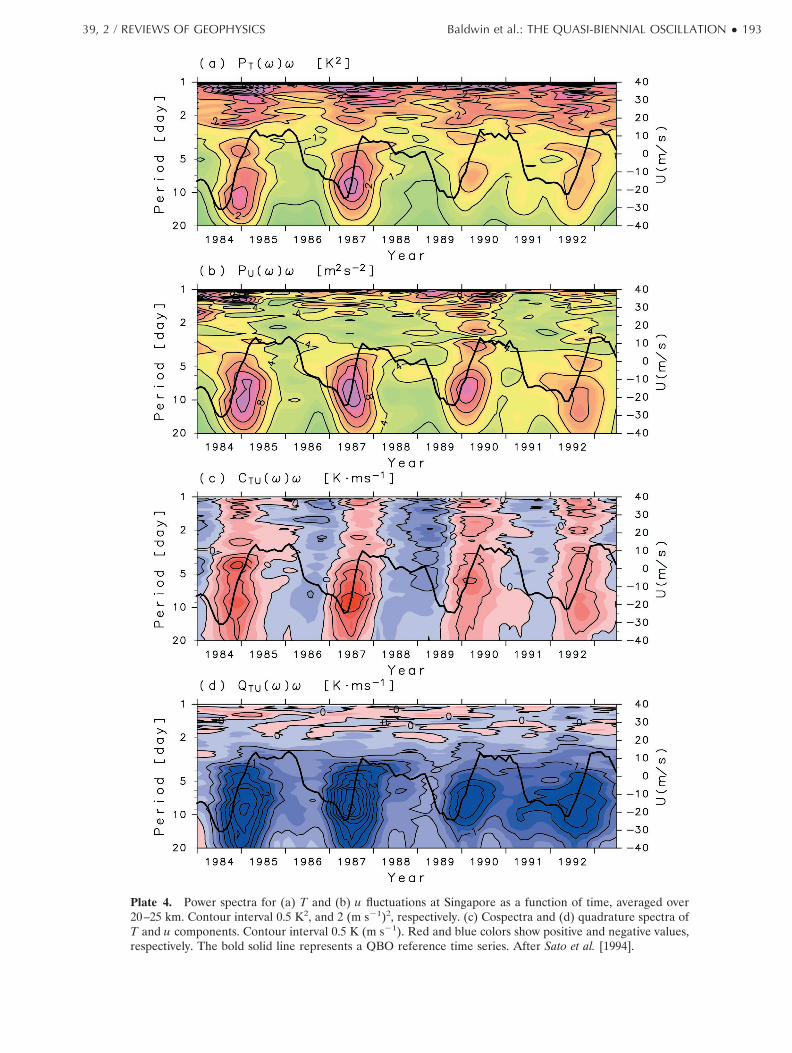
Plate 4. Power spectra for (a) T and (b) u fluctuations at Singapore as a function of time, averaged over20–25 km. Contour interval 0.5 K2, and 2 (m s21)2, respectively. (c) Cospectra and (d) quadrature spectra ofT and u components. Contour interval 0.5 K (m s21). Red and blue colors show positive and negative values,respectively. The bold solid line represents a QBO reference time series. After Sato et al. [1994].
39, 2 / REVIEWS OF GEOPHYSICS Baldwin et al.: THE QUASI-BIENNIAL OSCILLATION ● 193
for slowly varying, steady, conservative, incompressiblewaves. This theory was extended to 3-D equatoriallytrapped waves (T. J. Dunkerton, manuscript in prepara-tion, 2001). According to (8), the covariance is propor-tional to the vertical shear and vertical flux of horizontalmomentum, or radiation stress. The sign of the covari-ance is determined by the vertical shear, independent ofthe horizontal and vertical direction of inertia-gravitywave propagation. This is qualitatively consistent withthe observation in Plate 4c.
Sato and Dunkerton [1997] estimated momentumfluxes associated with 1- to 3-day period waves directlyand indirectly based on the quadrature and cospectra ofT and u components at Singapore obtained by Sato et al.[1994]. Unlike Kelvin waves, which propagate only east-ward, inertia-gravity waves can propagate both eastwardand westward. Thus the net momentum flux estimatefrom quadrature spectra as obtained by Maruyama[1994] may be a residual after cancelation between pos-itive and negative values. On the other hand, cospectracorrespond to the sum of absolute values of positive andnegative momentum fluxes. Using an indirect estimateof momentum fluxes from cospectra and a direct esti-mate from quadrature spectra, positive and negativeparts of momentum fluxes can be obtained separately.
The direct estimate of momentum flux for Kelvin
waves (5- to 20-day period) is 2–9 3 1023 m2 s22 andaccords with the indirect estimate within the estimationerror, supporting the validity of the indirect method.Note that momentum flux is properly measured in pas-cals (Pa), equal to air density times the product ofvelocity components. In most QBO literature the densityterm is ignored, and the resulting “flux” is described inunits of m2 s22. Near the tropical tropopause the densityis about 0.1 in MKS units, providing an easy conversionbetween the two definitions of flux.
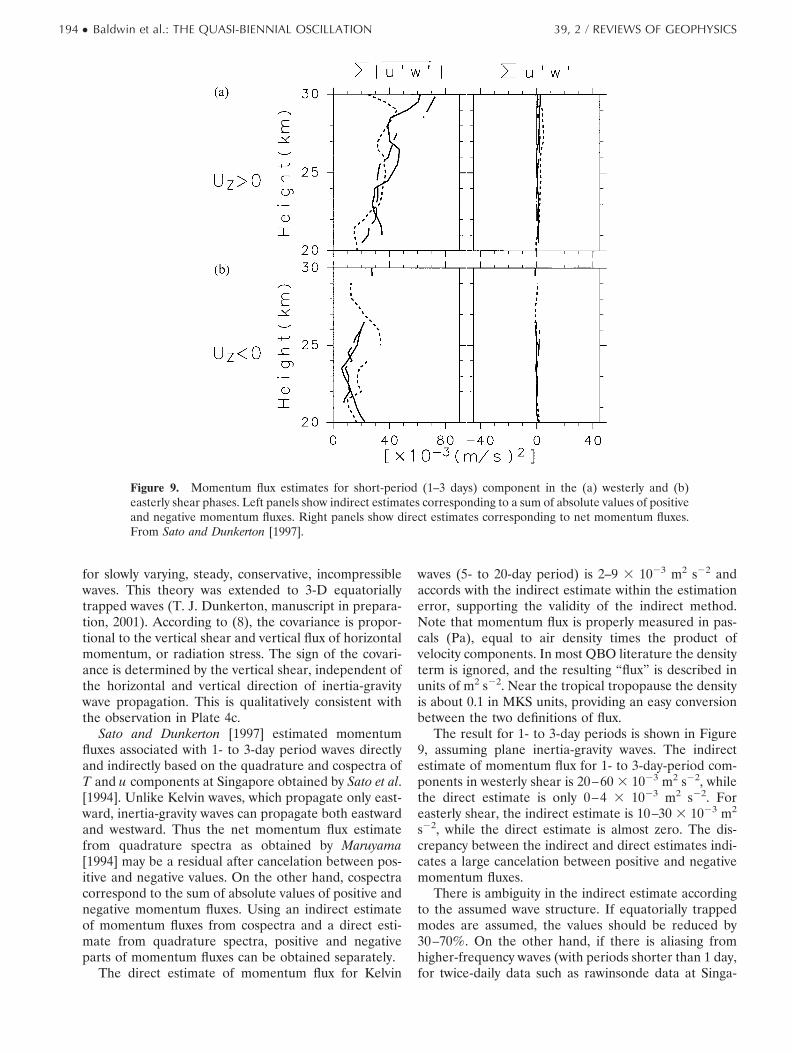
The result for 1- to 3-day periods is shown in Figure9, assuming plane inertia-gravity waves. The indirectestimate of momentum flux for 1- to 3-day-period com-ponents in westerly shear is 20–60 3 1023 m2 s22, whilethe direct estimate is only 0–4 3 1023 m2 s22. Foreasterly shear, the indirect estimate is 10–30 3 1023 m2
s22, while the direct estimate is almost zero. The dis-crepancy between the indirect and direct estimates indi-cates a large cancelation between positive and negativemomentum fluxes.
There is ambiguity in the indirect estimate accordingto the assumed wave structure. If equatorially trappedmodes are assumed, the values should be reduced by30–70%. On the other hand, if there is aliasing fromhigher-frequency waves (with periods shorter than 1 day,for twice-daily data such as rawinsonde data at Singa-
Figure 9. Momentum flux estimates for short-period (1–3 days) component in the (a) westerly and (b)easterly shear phases. Left panels show indirect estimates corresponding to a sum of absolute values of positiveand negative momentum fluxes. Right panels show direct estimates corresponding to net momentum fluxes.From Sato and Dunkerton [1997].
194 ● Baldwin et al.: THE QUASI-BIENNIAL OSCILLATION 39, 2 / REVIEWS OF GEOPHYSICS
pore), the actual momentum flux should be much largerthan shown in Figure 9. Even considering these ambigu-ities, it appears that intermediate-frequency period grav-ity or inertia-gravity waves have significant momentumflux compared with Kelvin and Rossby-gravity waves.
According to the analysis of Sato and Dunkerton[1997], momentum fluxes associated with eastward andwestward propagating gravity waves are almost equal,though eastward propagating gravity waves are slightlydominant in the eastward shear phases. This fact doesnot contradict the result from observational campaignsby Cadet and Teitelbaum [1979] and Tsuda et al. [1994b]that eastward (westward) propagating gravity waves aredominant in the time-height sections of u and T com-ponents in the eastward (westward) shear phase. Obser-vations confirm that it is more likely to observe waveswith short vertical wavelengths (corresponding to smallintrinsic frequencies) if those waves propagate eastwardin eastward shear or westward in westward shear. Fortwo waves with equal momentum flux but different in-trinsic frequencies, the amplitudes of u and T are largerfor the wave having smaller intrinsic frequency. West-ward (eastward) propagating gravity waves having smallintrinsic phase speeds, i.e., small vertical wavelengths,probably would not be found in the eastward (westward)shear phase because such waves would have encoun-tered critical levels or been absorbed at lower levels.Westward (eastward) gravity waves having large intrinsicphase speeds carrying significant momentum flux canexist but may not be recognized in the rawinsonde databecause their vertical wavelengths are too long and theiramplitudes in u and T are too small. Thus, in theeastward (westward) shear phase, only eastward (west-ward) propagating gravity waves have small intrinsicphase speeds and hence small vertical wavelengths thatare observable.
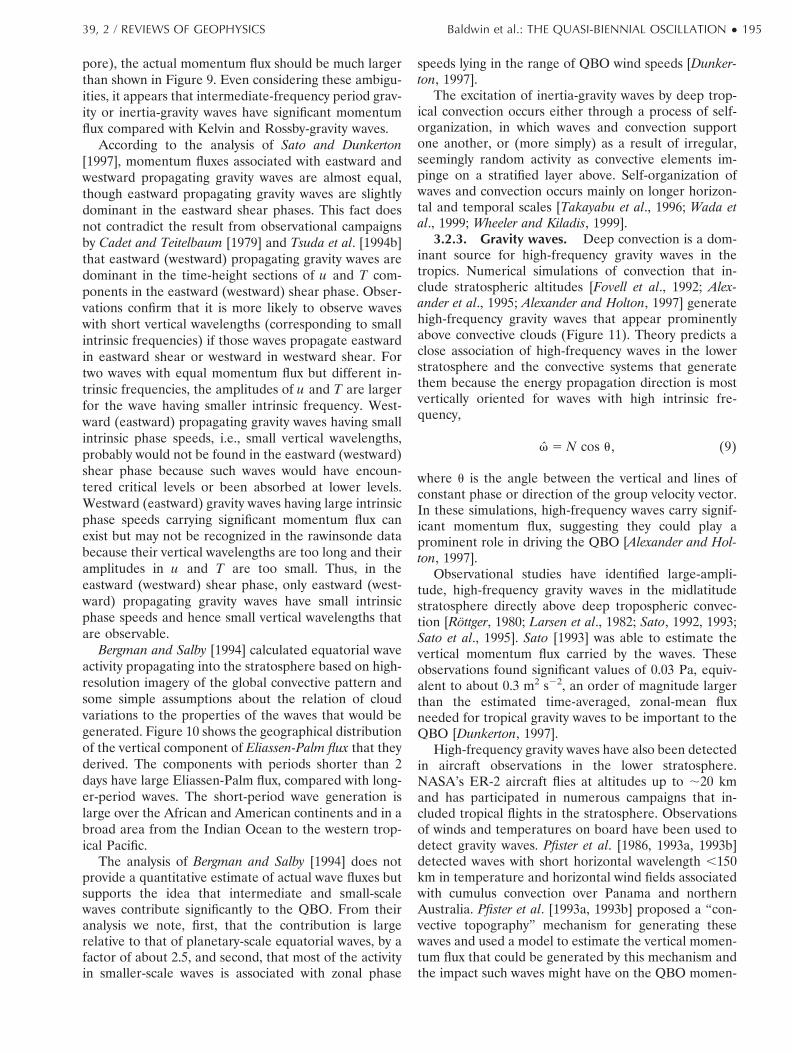
Bergman and Salby [1994] calculated equatorial waveactivity propagating into the stratosphere based on high-resolution imagery of the global convective pattern andsome simple assumptions about the relation of cloudvariations to the properties of the waves that would begenerated. Figure 10 shows the geographical distributionof the vertical component of Eliassen-Palm flux that theyderived. The components with periods shorter than 2days have large Eliassen-Palm flux, compared with long-er-period waves. The short-period wave generation islarge over the African and American continents and in abroad area from the Indian Ocean to the western trop-ical Pacific.
The analysis of Bergman and Salby [1994] does notprovide a quantitative estimate of actual wave fluxes butsupports the idea that intermediate and small-scalewaves contribute significantly to the QBO. From theiranalysis we note, first, that the contribution is largerelative to that of planetary-scale equatorial waves, by afactor of about 2.5, and second, that most of the activityin smaller-scale waves is associated with zonal phase
speeds lying in the range of QBO wind speeds [Dunker-ton, 1997].
The excitation of inertia-gravity waves by deep trop-ical convection occurs either through a process of self-organization, in which waves and convection supportone another, or (more simply) as a result of irregular,seemingly random activity as convective elements im-pinge on a stratified layer above. Self-organization ofwaves and convection occurs mainly on longer horizon-tal and temporal scales [Takayabu et al., 1996; Wada etal., 1999; Wheeler and Kiladis, 1999].
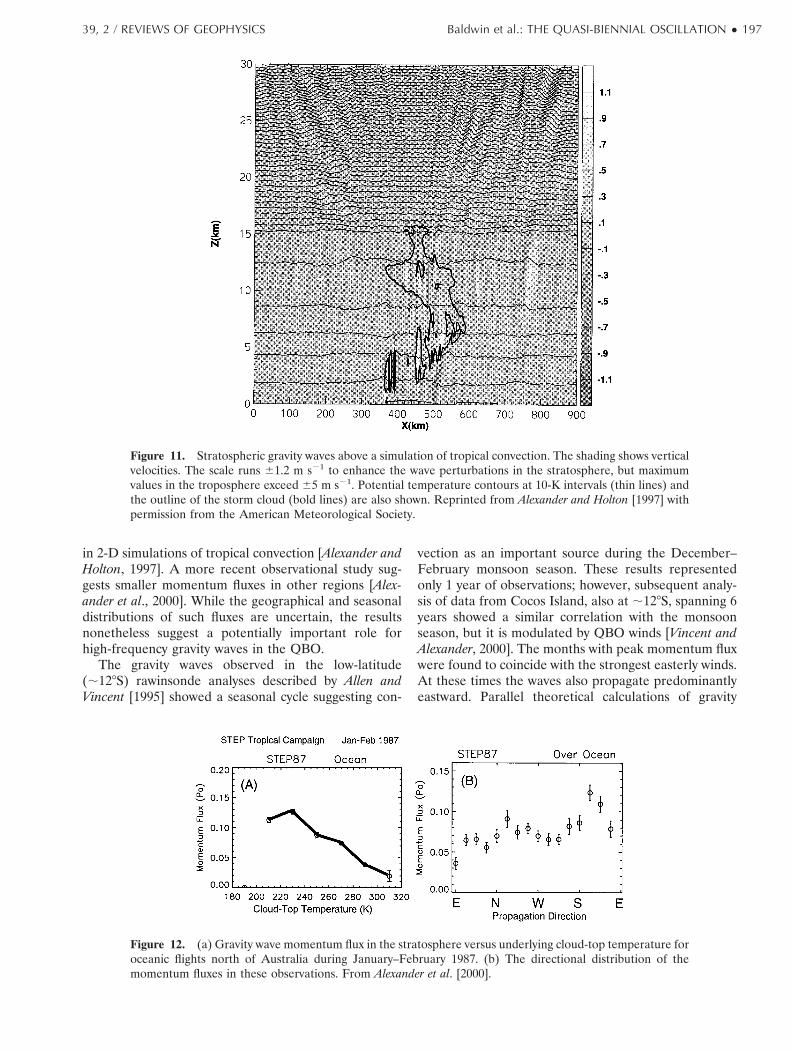
3.2.3. Gravity waves. Deep convection is a dom-inant source for high-frequency gravity waves in thetropics. Numerical simulations of convection that in-clude stratospheric altitudes [Fovell et al., 1992; Alex-ander et al., 1995; Alexander and Holton, 1997] generatehigh-frequency gravity waves that appear prominentlyabove convective clouds (Figure 11). Theory predicts aclose association of high-frequency waves in the lowerstratosphere and the convective systems that generatethem because the energy propagation direction is mostvertically oriented for waves with high intrinsic fre-quency,
v 5 N cos u, (9)
where u is the angle between the vertical and lines ofconstant phase or direction of the group velocity vector.In these simulations, high-frequency waves carry signif-icant momentum flux, suggesting they could play aprominent role in driving the QBO [Alexander and Hol-ton, 1997].
Observational studies have identified large-ampli-tude, high-frequency gravity waves in the midlatitudestratosphere directly above deep tropospheric convec-tion [Rottger, 1980; Larsen et al., 1982; Sato, 1992, 1993;Sato et al., 1995]. Sato [1993] was able to estimate thevertical momentum flux carried by the waves. Theseobservations found significant values of 0.03 Pa, equiv-alent to about 0.3 m2 s22, an order of magnitude largerthan the estimated time-averaged, zonal-mean fluxneeded for tropical gravity waves to be important to theQBO [Dunkerton, 1997].
High-frequency gravity waves have also been detectedin aircraft observations in the lower stratosphere.NASA’s ER-2 aircraft flies at altitudes up to ;20 kmand has participated in numerous campaigns that in-cluded tropical flights in the stratosphere. Observationsof winds and temperatures on board have been used todetect gravity waves. Pfister et al. [1986, 1993a, 1993b]detected waves with short horizontal wavelength ,150km in temperature and horizontal wind fields associatedwith cumulus convection over Panama and northernAustralia. Pfister et al. [1993a, 1993b] proposed a “con-vective topography” mechanism for generating thesewaves and used a model to estimate the vertical momen-tum flux that could be generated by this mechanism andthe impact such waves might have on the QBO momen-
39, 2 / REVIEWS OF GEOPHYSICS Baldwin et al.: THE QUASI-BIENNIAL OSCILLATION ● 195
tum budget. The calculated effect was small (,10%)compared with estimates of planetary-scale wave driv-ing. Other forcing mechanisms may be active, however,and the effects of high-frequency waves would be under-estimated in these calculations [Dunkerton, 1997]. Theestimates are also uncertain because of the unknowngeographical distribution and occurrence frequency ofconvectively forced gravity waves based on only a fewcase studies.
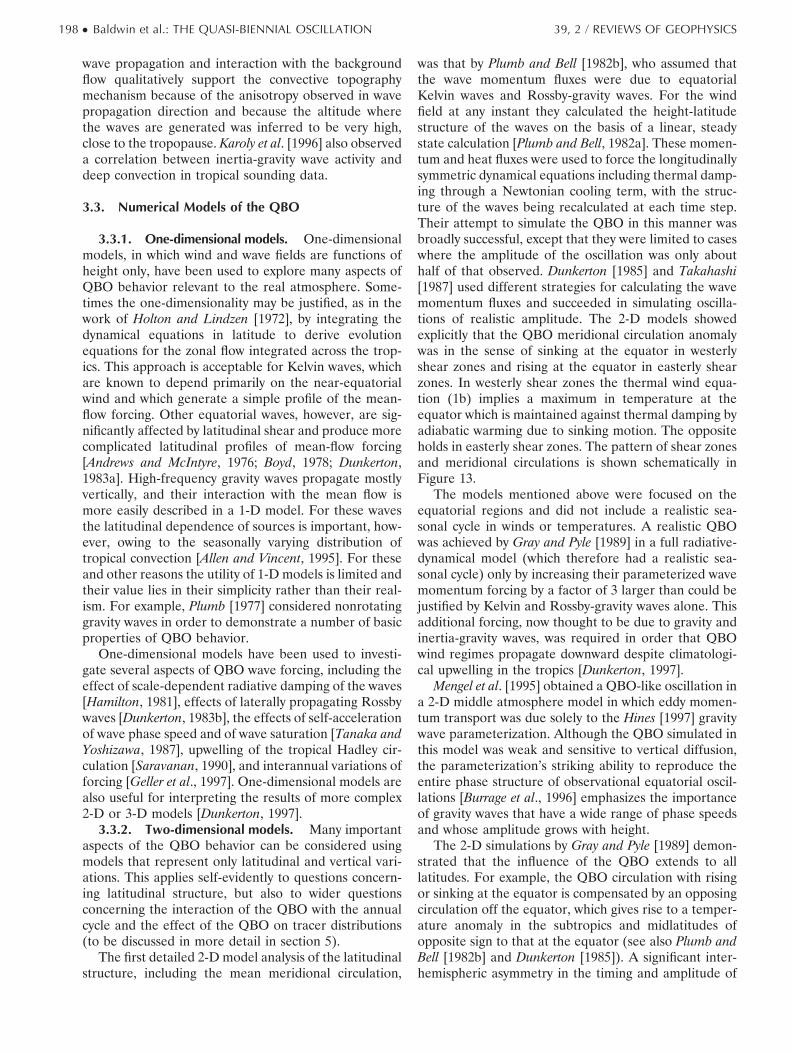
Alexander and Pfister [1995] used observations of both
the horizontal and vertical winds together to estimatemomentum flux along an ER-2 flight path over deepconvection north of Australia. The momentum flux em-phasizes shorter-period waves. Very large values ;0.1Pa were observed over the deepest, highest clouds. Moreextensive correlations of these data with cloud top tem-perature were reported by Alexander et al. [2000] and areshown in Figure 12. These results suggested that largevalues of momentum flux are correlated with deep con-vection and have magnitudes similar to waves generated
Figure 10. Geographical distribution of vertical component of Eliassen-Palm flux for equatorial waves withperiods (a) longer than 5 days, (b) of 2–5 days, and (c) shorter than 2 days, estimated based on high-resolutionimagery of the global convective pattern constructed from six satellites. Shown here is the frequency-integrated absolute value of the Eliassen-Palm flux. Units are arbitrary, and contour increments are linear.Reprinted from Bergman and Salby [1994] with permission from the American Meteorological Society.
196 ● Baldwin et al.: THE QUASI-BIENNIAL OSCILLATION 39, 2 / REVIEWS OF GEOPHYSICS
in 2-D simulations of tropical convection [Alexander andHolton, 1997]. A more recent observational study sug-gests smaller momentum fluxes in other regions [Alex-ander et al., 2000]. While the geographical and seasonaldistributions of such fluxes are uncertain, the resultsnonetheless suggest a potentially important role forhigh-frequency gravity waves in the QBO.
The gravity waves observed in the low-latitude(;128S) rawinsonde analyses described by Allen andVincent [1995] showed a seasonal cycle suggesting con-
vection as an important source during the December–February monsoon season. These results representedonly 1 year of observations; however, subsequent analy-sis of data from Cocos Island, also at ;128S, spanning 6years showed a similar correlation with the monsoonseason, but it is modulated by QBO winds [Vincent andAlexander, 2000]. The months with peak momentum fluxwere found to coincide with the strongest easterly winds.At these times the waves also propagate predominantlyeastward. Parallel theoretical calculations of gravity
Figure 11. Stratospheric gravity waves above a simulation of tropical convection. The shading shows verticalvelocities. The scale runs 61.2 m s21 to enhance the wave perturbations in the stratosphere, but maximumvalues in the troposphere exceed 65 m s21. Potential temperature contours at 10-K intervals (thin lines) andthe outline of the storm cloud (bold lines) are also shown. Reprinted from Alexander and Holton [1997] withpermission from the American Meteorological Society.
Figure 12. (a) Gravity wave momentum flux in the stratosphere versus underlying cloud-top temperature foroceanic flights north of Australia during January–February 1987. (b) The directional distribution of themomentum fluxes in these observations. From Alexander et al. [2000].
39, 2 / REVIEWS OF GEOPHYSICS Baldwin et al.: THE QUASI-BIENNIAL OSCILLATION ● 197
wave propagation and interaction with the backgroundflow qualitatively support the convective topographymechanism because of the anisotropy observed in wavepropagation direction and because the altitude wherethe waves are generated was inferred to be very high,close to the tropopause. Karoly et al. [1996] also observeda correlation between inertia-gravity wave activity anddeep convection in tropical sounding data.
3.3. Numerical Models of the QBO
3.3.1. One-dimensional models. One-dimensionalmodels, in which wind and wave fields are functions ofheight only, have been used to explore many aspects ofQBO behavior relevant to the real atmosphere. Some-times the one-dimensionality may be justified, as in thework of Holton and Lindzen [1972], by integrating thedynamical equations in latitude to derive evolutionequations for the zonal flow integrated across the trop-ics. This approach is acceptable for Kelvin waves, whichare known to depend primarily on the near-equatorialwind and which generate a simple profile of the mean-flow forcing. Other equatorial waves, however, are sig-nificantly affected by latitudinal shear and produce morecomplicated latitudinal profiles of mean-flow forcing[Andrews and McIntyre, 1976; Boyd, 1978; Dunkerton,1983a]. High-frequency gravity waves propagate mostlyvertically, and their interaction with the mean flow ismore easily described in a 1-D model. For these wavesthe latitudinal dependence of sources is important, how-ever, owing to the seasonally varying distribution oftropical convection [Allen and Vincent, 1995]. For theseand other reasons the utility of 1-D models is limited andtheir value lies in their simplicity rather than their real-ism. For example, Plumb [1977] considered nonrotatinggravity waves in order to demonstrate a number of basicproperties of QBO behavior.
One-dimensional models have been used to investi-gate several aspects of QBO wave forcing, including theeffect of scale-dependent radiative damping of the waves[Hamilton, 1981], effects of laterally propagating Rossbywaves [Dunkerton, 1983b], the effects of self-accelerationof wave phase speed and of wave saturation [Tanaka andYoshizawa, 1987], upwelling of the tropical Hadley cir-culation [Saravanan, 1990], and interannual variations offorcing [Geller et al., 1997]. One-dimensional models arealso useful for interpreting the results of more complex2-D or 3-D models [Dunkerton, 1997].
3.3.2. Two-dimensional models. Many importantaspects of the QBO behavior can be considered usingmodels that represent only latitudinal and vertical vari-ations. This applies self-evidently to questions concern-ing latitudinal structure, but also to wider questionsconcerning the interaction of the QBO with the annualcycle and the effect of the QBO on tracer distributions(to be discussed in more detail in section 5).
The first detailed 2-D model analysis of the latitudinalstructure, including the mean meridional circulation,
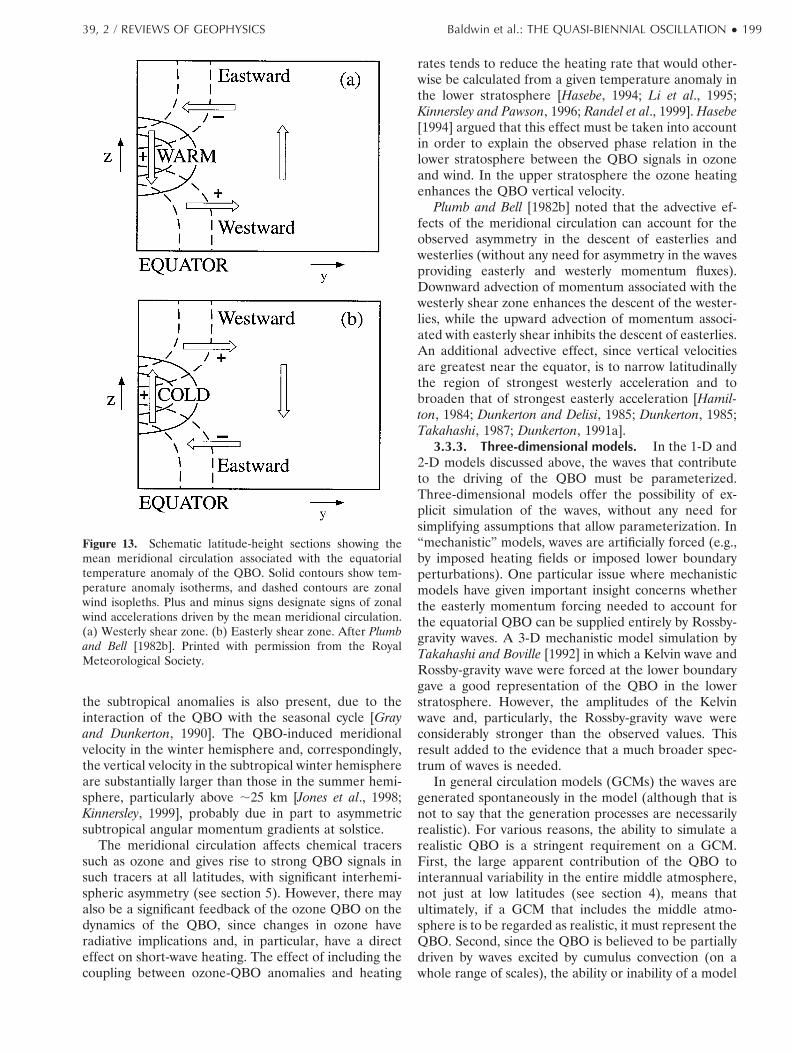
was that by Plumb and Bell [1982b], who assumed thatthe wave momentum fluxes were due to equatorialKelvin waves and Rossby-gravity waves. For the windfield at any instant they calculated the height-latitudestructure of the waves on the basis of a linear, steadystate calculation [Plumb and Bell, 1982a]. These momen-tum and heat fluxes were used to force the longitudinallysymmetric dynamical equations including thermal damp-ing through a Newtonian cooling term, with the struc-ture of the waves being recalculated at each time step.Their attempt to simulate the QBO in this manner wasbroadly successful, except that they were limited to caseswhere the amplitude of the oscillation was only abouthalf of that observed. Dunkerton [1985] and Takahashi[1987] used different strategies for calculating the wavemomentum fluxes and succeeded in simulating oscilla-tions of realistic amplitude. The 2-D models showedexplicitly that the QBO meridional circulation anomalywas in the sense of sinking at the equator in westerlyshear zones and rising at the equator in easterly shearzones. In westerly shear zones the thermal wind equa-tion (1b) implies a maximum in temperature at theequator which is maintained against thermal damping byadiabatic warming due to sinking motion. The oppositeholds in easterly shear zones. The pattern of shear zonesand meridional circulations is shown schematically inFigure 13.
The models mentioned above were focused on theequatorial regions and did not include a realistic sea-sonal cycle in winds or temperatures. A realistic QBOwas achieved by Gray and Pyle [1989] in a full radiative-dynamical model (which therefore had a realistic sea-sonal cycle) only by increasing their parameterized wavemomentum forcing by a factor of 3 larger than could bejustified by Kelvin and Rossby-gravity waves alone. Thisadditional forcing, now thought to be due to gravity andinertia-gravity waves, was required in order that QBOwind regimes propagate downward despite climatologi-cal upwelling in the tropics [Dunkerton, 1997].
Mengel et al. [1995] obtained a QBO-like oscillation ina 2-D middle atmosphere model in which eddy momen-tum transport was due solely to the Hines [1997] gravitywave parameterization. Although the QBO simulated inthis model was weak and sensitive to vertical diffusion,the parameterization’s striking ability to reproduce theentire phase structure of observational equatorial oscil-lations [Burrage et al., 1996] emphasizes the importanceof gravity waves that have a wide range of phase speedsand whose amplitude grows with height.
The 2-D simulations by Gray and Pyle [1989] demon-strated that the influence of the QBO extends to alllatitudes. For example, the QBO circulation with risingor sinking at the equator is compensated by an opposingcirculation off the equator, which gives rise to a temper-ature anomaly in the subtropics and midlatitudes ofopposite sign to that at the equator (see also Plumb andBell [1982b] and Dunkerton [1985]). A significant inter-hemispheric asymmetry in the timing and amplitude of
198 ● Baldwin et al.: THE QUASI-BIENNIAL OSCILLATION 39, 2 / REVIEWS OF GEOPHYSICS
the subtropical anomalies is also present, due to theinteraction of the QBO with the seasonal cycle [Grayand Dunkerton, 1990]. The QBO-induced meridionalvelocity in the winter hemisphere and, correspondingly,the vertical velocity in the subtropical winter hemisphereare substantially larger than those in the summer hemi-sphere, particularly above ;25 km [Jones et al., 1998;Kinnersley, 1999], probably due in part to asymmetricsubtropical angular momentum gradients at solstice.
The meridional circulation affects chemical tracerssuch as ozone and gives rise to strong QBO signals insuch tracers at all latitudes, with significant interhemi-spheric asymmetry (see section 5). However, there mayalso be a significant feedback of the ozone QBO on thedynamics of the QBO, since changes in ozone haveradiative implications and, in particular, have a directeffect on short-wave heating. The effect of including thecoupling between ozone-QBO anomalies and heating
rates tends to reduce the heating rate that would other-wise be calculated from a given temperature anomaly inthe lower stratosphere [Hasebe, 1994; Li et al., 1995;Kinnersley and Pawson, 1996; Randel et al., 1999]. Hasebe[1994] argued that this effect must be taken into accountin order to explain the observed phase relation in thelower stratosphere between the QBO signals in ozoneand wind. In the upper stratosphere the ozone heatingenhances the QBO vertical velocity.
Plumb and Bell [1982b] noted that the advective ef-fects of the meridional circulation can account for theobserved asymmetry in the descent of easterlies andwesterlies (without any need for asymmetry in the wavesproviding easterly and westerly momentum fluxes).Downward advection of momentum associated with thewesterly shear zone enhances the descent of the wester-lies, while the upward advection of momentum associ-ated with easterly shear inhibits the descent of easterlies.An additional advective effect, since vertical velocitiesare greatest near the equator, is to narrow latitudinallythe region of strongest westerly acceleration and tobroaden that of strongest easterly acceleration [Hamil-ton, 1984; Dunkerton and Delisi, 1985; Dunkerton, 1985;Takahashi, 1987; Dunkerton, 1991a].
3.3.3. Three-dimensional models. In the 1-D and2-D models discussed above, the waves that contributeto the driving of the QBO must be parameterized.Three-dimensional models offer the possibility of ex-plicit simulation of the waves, without any need forsimplifying assumptions that allow parameterization. In“mechanistic” models, waves are artificially forced (e.g.,by imposed heating fields or imposed lower boundaryperturbations). One particular issue where mechanisticmodels have given important insight concerns whetherthe easterly momentum forcing needed to account forthe equatorial QBO can be supplied entirely by Rossby-gravity waves. A 3-D mechanistic model simulation byTakahashi and Boville [1992] in which a Kelvin wave andRossby-gravity wave were forced at the lower boundarygave a good representation of the QBO in the lowerstratosphere. However, the amplitudes of the Kelvinwave and, particularly, the Rossby-gravity wave wereconsiderably stronger than the observed values. Thisresult added to the evidence that a much broader spec-trum of waves is needed.
In general circulation models (GCMs) the waves aregenerated spontaneously in the model (although that isnot to say that the generation processes are necessarilyrealistic). For various reasons, the ability to simulate arealistic QBO is a stringent requirement on a GCM.First, the large apparent contribution of the QBO tointerannual variability in the entire middle atmosphere,not just at low latitudes (see section 4), means thatultimately, if a GCM that includes the middle atmo-sphere is to be regarded as realistic, it must represent theQBO. Second, since the QBO is believed to be partiallydriven by waves excited by cumulus convection (on awhole range of scales), the ability or inability of a model
Figure 13. Schematic latitude-height sections showing themean meridional circulation associated with the equatorialtemperature anomaly of the QBO. Solid contours show tem-perature anomaly isotherms, and dashed contours are zonalwind isopleths. Plus and minus signs designate signs of zonalwind accelerations driven by the mean meridional circulation.(a) Westerly shear zone. (b) Easterly shear zone. After Plumband Bell [1982b]. Printed with permission from the RoyalMeteorological Society.
39, 2 / REVIEWS OF GEOPHYSICS Baldwin et al.: THE QUASI-BIENNIAL OSCILLATION ● 199
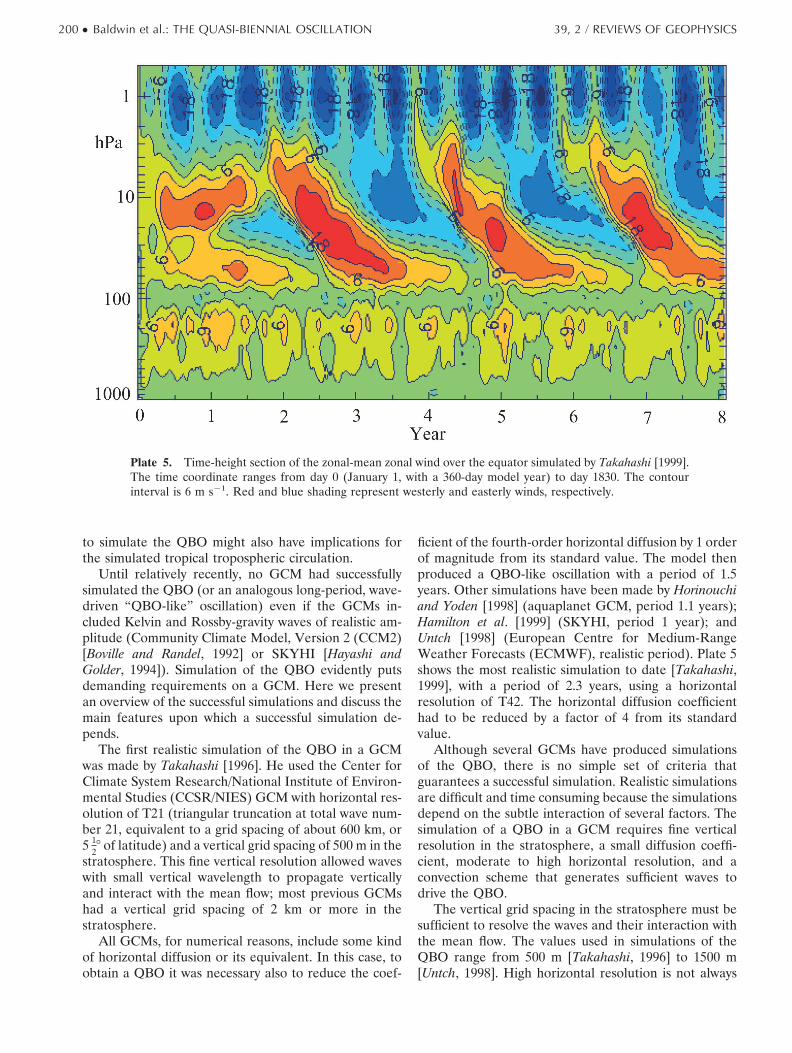
to simulate the QBO might also have implications forthe simulated tropical tropospheric circulation.
Until relatively recently, no GCM had successfullysimulated the QBO (or an analogous long-period, wave-driven “QBO-like” oscillation) even if the GCMs in-cluded Kelvin and Rossby-gravity waves of realistic am-plitude (Community Climate Model, Version 2 (CCM2)[Boville and Randel, 1992] or SKYHI [Hayashi andGolder, 1994]). Simulation of the QBO evidently putsdemanding requirements on a GCM. Here we presentan overview of the successful simulations and discuss themain features upon which a successful simulation de-pends.
The first realistic simulation of the QBO in a GCMwas made by Takahashi [1996]. He used the Center forClimate System Research/National Institute of Environ-mental Studies (CCSR/NIES) GCM with horizontal res-olution of T21 (triangular truncation at total wave num-ber 21, equivalent to a grid spacing of about 600 km, or5 1
28 of latitude) and a vertical grid spacing of 500 m in thestratosphere. This fine vertical resolution allowed waveswith small vertical wavelength to propagate verticallyand interact with the mean flow; most previous GCMshad a vertical grid spacing of 2 km or more in thestratosphere.
All GCMs, for numerical reasons, include some kindof horizontal diffusion or its equivalent. In this case, toobtain a QBO it was necessary also to reduce the coef-
ficient of the fourth-order horizontal diffusion by 1 orderof magnitude from its standard value. The model thenproduced a QBO-like oscillation with a period of 1.5years. Other simulations have been made by Horinouchiand Yoden [1998] (aquaplanet GCM, period 1.1 years);Hamilton et al. [1999] (SKYHI, period 1 year); andUntch [1998] (European Centre for Medium-RangeWeather Forecasts (ECMWF), realistic period). Plate 5shows the most realistic simulation to date [Takahashi,1999], with a period of 2.3 years, using a horizontalresolution of T42. The horizontal diffusion coefficienthad to be reduced by a factor of 4 from its standardvalue.
Although several GCMs have produced simulationsof the QBO, there is no simple set of criteria thatguarantees a successful simulation. Realistic simulationsare difficult and time consuming because the simulationsdepend on the subtle interaction of several factors. Thesimulation of a QBO in a GCM requires fine verticalresolution in the stratosphere, a small diffusion coeffi-cient, moderate to high horizontal resolution, and aconvection scheme that generates sufficient waves todrive the QBO.
The vertical grid spacing in the stratosphere must besufficient to resolve the waves and their interaction withthe mean flow. The values used in simulations of theQBO range from 500 m [Takahashi, 1996] to 1500 m[Untch, 1998]. High horizontal resolution is not always
Plate 5. Time-height section of the zonal-mean zonal wind over the equator simulated by Takahashi [1999].The time coordinate ranges from day 0 (January 1, with a 360-day model year) to day 1830. The contourinterval is 6 m s21. Red and blue shading represent westerly and easterly winds, respectively.
200 ● Baldwin et al.: THE QUASI-BIENNIAL OSCILLATION 39, 2 / REVIEWS OF GEOPHYSICS
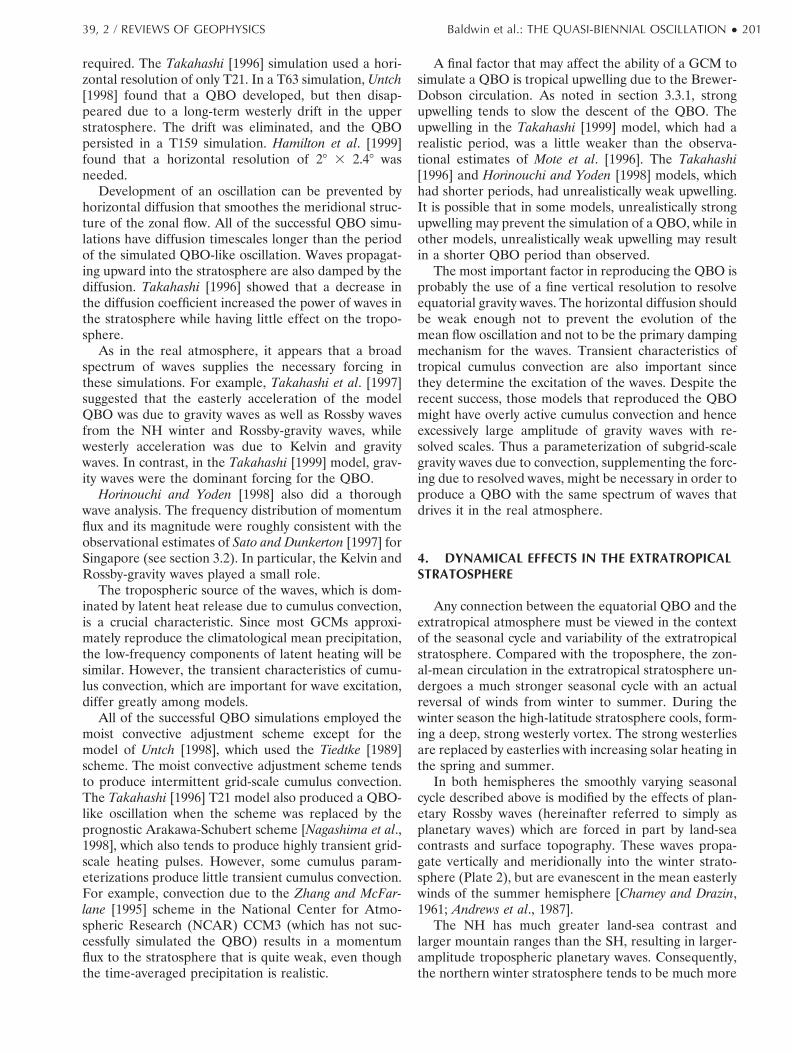
required. The Takahashi [1996] simulation used a hori-zontal resolution of only T21. In a T63 simulation, Untch[1998] found that a QBO developed, but then disap-peared due to a long-term westerly drift in the upperstratosphere. The drift was eliminated, and the QBOpersisted in a T159 simulation. Hamilton et al. [1999]found that a horizontal resolution of 28 3 2.48 wasneeded.
Development of an oscillation can be prevented byhorizontal diffusion that smoothes the meridional struc-ture of the zonal flow. All of the successful QBO simu-lations have diffusion timescales longer than the periodof the simulated QBO-like oscillation. Waves propagat-ing upward into the stratosphere are also damped by thediffusion. Takahashi [1996] showed that a decrease inthe diffusion coefficient increased the power of waves inthe stratosphere while having little effect on the tropo-sphere.
As in the real atmosphere, it appears that a broadspectrum of waves supplies the necessary forcing inthese simulations. For example, Takahashi et al. [1997]suggested that the easterly acceleration of the modelQBO was due to gravity waves as well as Rossby wavesfrom the NH winter and Rossby-gravity waves, whilewesterly acceleration was due to Kelvin and gravitywaves. In contrast, in the Takahashi [1999] model, grav-ity waves were the dominant forcing for the QBO.
Horinouchi and Yoden [1998] also did a thoroughwave analysis. The frequency distribution of momentumflux and its magnitude were roughly consistent with theobservational estimates of Sato and Dunkerton [1997] forSingapore (see section 3.2). In particular, the Kelvin andRossby-gravity waves played a small role.
The tropospheric source of the waves, which is dom-inated by latent heat release due to cumulus convection,is a crucial characteristic. Since most GCMs approxi-mately reproduce the climatological mean precipitation,the low-frequency components of latent heating will besimilar. However, the transient characteristics of cumu-lus convection, which are important for wave excitation,differ greatly among models.
All of the successful QBO simulations employed themoist convective adjustment scheme except for themodel of Untch [1998], which used the Tiedtke [1989]scheme. The moist convective adjustment scheme tendsto produce intermittent grid-scale cumulus convection.The Takahashi [1996] T21 model also produced a QBO-like oscillation when the scheme was replaced by theprognostic Arakawa-Schubert scheme [Nagashima et al.,1998], which also tends to produce highly transient grid-scale heating pulses. However, some cumulus param-eterizations produce little transient cumulus convection.For example, convection due to the Zhang and McFar-lane [1995] scheme in the National Center for Atmo-spheric Research (NCAR) CCM3 (which has not suc-cessfully simulated the QBO) results in a momentumflux to the stratosphere that is quite weak, even thoughthe time-averaged precipitation is realistic.
A final factor that may affect the ability of a GCM tosimulate a QBO is tropical upwelling due to the Brewer-Dobson circulation. As noted in section 3.3.1, strongupwelling tends to slow the descent of the QBO. Theupwelling in the Takahashi [1999] model, which had arealistic period, was a little weaker than the observa-tional estimates of Mote et al. [1996]. The Takahashi[1996] and Horinouchi and Yoden [1998] models, whichhad shorter periods, had unrealistically weak upwelling.It is possible that in some models, unrealistically strongupwelling may prevent the simulation of a QBO, while inother models, unrealistically weak upwelling may resultin a shorter QBO period than observed.
The most important factor in reproducing the QBO isprobably the use of a fine vertical resolution to resolveequatorial gravity waves. The horizontal diffusion shouldbe weak enough not to prevent the evolution of themean flow oscillation and not to be the primary dampingmechanism for the waves. Transient characteristics oftropical cumulus convection are also important sincethey determine the excitation of the waves. Despite therecent success, those models that reproduced the QBOmight have overly active cumulus convection and henceexcessively large amplitude of gravity waves with re-solved scales. Thus a parameterization of subgrid-scalegravity waves due to convection, supplementing the forc-ing due to resolved waves, might be necessary in order toproduce a QBO with the same spectrum of waves thatdrives it in the real atmosphere.
4. DYNAMICAL EFFECTS IN THE EXTRATROPICALSTRATOSPHERE
Any connection between the equatorial QBO and theextratropical atmosphere must be viewed in the contextof the seasonal cycle and variability of the extratropicalstratosphere. Compared with the troposphere, the zon-al-mean circulation in the extratropical stratosphere un-dergoes a much stronger seasonal cycle with an actualreversal of winds from winter to summer. During thewinter season the high-latitude stratosphere cools, form-ing a deep, strong westerly vortex. The strong westerliesare replaced by easterlies with increasing solar heating inthe spring and summer.
In both hemispheres the smoothly varying seasonalcycle described above is modified by the effects of plan-etary Rossby waves (hereinafter referred to simply asplanetary waves) which are forced in part by land-seacontrasts and surface topography. These waves propa-gate vertically and meridionally into the winter strato-sphere (Plate 2), but are evanescent in the mean easterlywinds of the summer hemisphere [Charney and Drazin,1961; Andrews et al., 1987].
The NH has much greater land-sea contrast andlarger mountain ranges than the SH, resulting in larger-amplitude tropospheric planetary waves. Consequently,the northern winter stratosphere tends to be much more
39, 2 / REVIEWS OF GEOPHYSICS Baldwin et al.: THE QUASI-BIENNIAL OSCILLATION ● 201
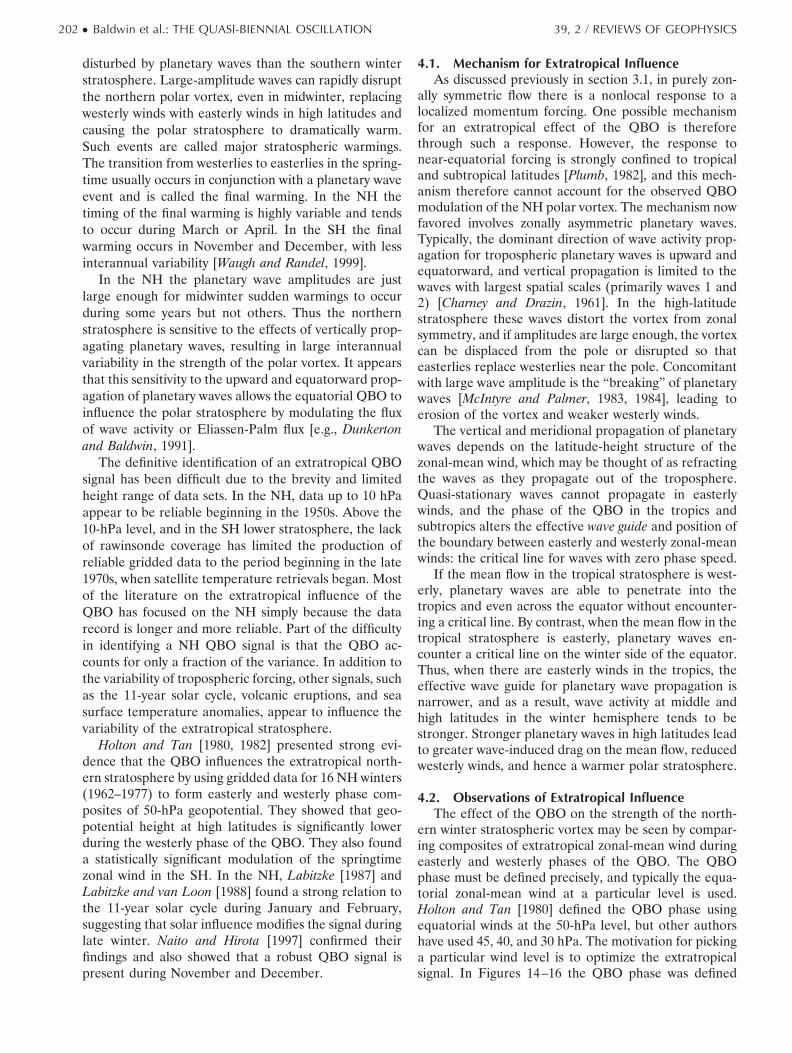
disturbed by planetary waves than the southern winterstratosphere. Large-amplitude waves can rapidly disruptthe northern polar vortex, even in midwinter, replacingwesterly winds with easterly winds in high latitudes andcausing the polar stratosphere to dramatically warm.Such events are called major stratospheric warmings.The transition from westerlies to easterlies in the spring-time usually occurs in conjunction with a planetary waveevent and is called the final warming. In the NH thetiming of the final warming is highly variable and tendsto occur during March or April. In the SH the finalwarming occurs in November and December, with lessinterannual variability [Waugh and Randel, 1999].
In the NH the planetary wave amplitudes are justlarge enough for midwinter sudden warmings to occurduring some years but not others. Thus the northernstratosphere is sensitive to the effects of vertically prop-agating planetary waves, resulting in large interannualvariability in the strength of the polar vortex. It appearsthat this sensitivity to the upward and equatorward prop-agation of planetary waves allows the equatorial QBO toinfluence the polar stratosphere by modulating the fluxof wave activity or Eliassen-Palm flux [e.g., Dunkertonand Baldwin, 1991].
The definitive identification of an extratropical QBOsignal has been difficult due to the brevity and limitedheight range of data sets. In the NH, data up to 10 hPaappear to be reliable beginning in the 1950s. Above the10-hPa level, and in the SH lower stratosphere, the lackof rawinsonde coverage has limited the production ofreliable gridded data to the period beginning in the late1970s, when satellite temperature retrievals began. Mostof the literature on the extratropical influence of theQBO has focused on the NH simply because the datarecord is longer and more reliable. Part of the difficultyin identifying a NH QBO signal is that the QBO ac-counts for only a fraction of the variance. In addition tothe variability of tropospheric forcing, other signals, suchas the 11-year solar cycle, volcanic eruptions, and seasurface temperature anomalies, appear to influence thevariability of the extratropical stratosphere.
Holton and Tan [1980, 1982] presented strong evi-dence that the QBO influences the extratropical north-ern stratosphere by using gridded data for 16 NH winters(1962–1977) to form easterly and westerly phase com-posites of 50-hPa geopotential. They showed that geo-potential height at high latitudes is significantly lowerduring the westerly phase of the QBO. They also founda statistically significant modulation of the springtimezonal wind in the SH. In the NH, Labitzke [1987] andLabitzke and van Loon [1988] found a strong relation tothe 11-year solar cycle during January and February,suggesting that solar influence modifies the signal duringlate winter. Naito and Hirota [1997] confirmed theirfindings and also showed that a robust QBO signal ispresent during November and December.
4.1. Mechanism for Extratropical InfluenceAs discussed previously in section 3.1, in purely zon-
ally symmetric flow there is a nonlocal response to alocalized momentum forcing. One possible mechanismfor an extratropical effect of the QBO is thereforethrough such a response. However, the response tonear-equatorial forcing is strongly confined to tropicaland subtropical latitudes [Plumb, 1982], and this mech-anism therefore cannot account for the observed QBOmodulation of the NH polar vortex. The mechanism nowfavored involves zonally asymmetric planetary waves.Typically, the dominant direction of wave activity prop-agation for tropospheric planetary waves is upward andequatorward, and vertical propagation is limited to thewaves with largest spatial scales (primarily waves 1 and2) [Charney and Drazin, 1961]. In the high-latitudestratosphere these waves distort the vortex from zonalsymmetry, and if amplitudes are large enough, the vortexcan be displaced from the pole or disrupted so thateasterlies replace westerlies near the pole. Concomitantwith large wave amplitude is the “breaking” of planetarywaves [McIntyre and Palmer, 1983, 1984], leading toerosion of the vortex and weaker westerly winds.
The vertical and meridional propagation of planetarywaves depends on the latitude-height structure of thezonal-mean wind, which may be thought of as refractingthe waves as they propagate out of the troposphere.Quasi-stationary waves cannot propagate in easterlywinds, and the phase of the QBO in the tropics andsubtropics alters the effective wave guide and position ofthe boundary between easterly and westerly zonal-meanwinds: the critical line for waves with zero phase speed.
If the mean flow in the tropical stratosphere is west-erly, planetary waves are able to penetrate into thetropics and even across the equator without encounter-ing a critical line. By contrast, when the mean flow in thetropical stratosphere is easterly, planetary waves en-counter a critical line on the winter side of the equator.Thus, when there are easterly winds in the tropics, theeffective wave guide for planetary wave propagation isnarrower, and as a result, wave activity at middle andhigh latitudes in the winter hemisphere tends to bestronger. Stronger planetary waves in high latitudes leadto greater wave-induced drag on the mean flow, reducedwesterly winds, and hence a warmer polar stratosphere.
4.2. Observations of Extratropical InfluenceThe effect of the QBO on the strength of the north-
ern winter stratospheric vortex may be seen by compar-ing composites of extratropical zonal-mean wind duringeasterly and westerly phases of the QBO. The QBOphase must be defined precisely, and typically the equa-torial zonal-mean wind at a particular level is used.Holton and Tan [1980] defined the QBO phase usingequatorial winds at the 50-hPa level, but other authorshave used 45, 40, and 30 hPa. The motivation for pickinga particular wind level is to optimize the extratropicalsignal. In Figures 14–16 the QBO phase was defined
202 ● Baldwin et al.: THE QUASI-BIENNIAL OSCILLATION 39, 2 / REVIEWS OF GEOPHYSICS
using the first two empirical orthogonal functions(EOFs) of the vertical variations of equatorial winds[Wallace et al., 1993; Baldwin and Dunkerton, 1998a].The QBO definition was adjusted to optimize the extra-tropical signal in either the NH or SH. The resultingdefinition of the QBO phase is very similar to the 40-hPaequatorial wind for the NH composites and the 25-hPawind for the SH composites.
Figure 14 illustrates the difference in zonal-meanwind between westerly and easterly QBO composites,using National Centers for Environmental Prediction(NCEP) analyses for the period 1978–1996. The differ-ence is formed by calculating separate averages of theJanuary wind data for the two phases of the QBO andthen taking the difference between these averages. Thezonal winds were derived from the geopotential fieldsusing the balance method [Robinson, 1986; Hitchman etal., 1987; Randel, 1987]. Although this method workswell in the extratropics, it is not possible to deriveaccurate winds in the tropics, where winds have beeninterpolated between 108N and 108S, making the QBOtoo weak. The northern signal is dominated by a mod-ulation of the polar vortex which extends from the sur-face to the 1-hPa level. Differences are of the oppositesign south of ;408N and blend into the upper branch ofthe tropical QBO.
The features in Figure 14 are not confined to themiddle stratospheric levels where the equatorial QBO isdefined. Rather, the most prominent features are foundabove 10 hPa. Correlation analysis of zonal-mean windin the latitude-height plane [Baldwin and Dunkerton,1991] suggests that the upper level features, includingthose in the SH near 308S, are a result of modulation bythe QBO of the cross-equatorial (summer to winter)branch of the mean meridional circulation. It is reason-able to suppose that this circulation is weakly modulatedby the Holton-Tan oscillation. For example, during the
westerly phase of the QBO, polar temperatures arerelatively low, implying a weaker cross-equatorial flowand a weak westerly anomaly near 308S (Figure 14). Thefeature near 308S may be interpreted not only as a directeffect of the QBO, but a remote effect of the Holton-Tan wave driving communicated by the mean meridionalcirculation, as described by (6). This behavior is alsoseen in numerical models (see section 4.3 and Figure17).
The statistical significance of the NH winter QBOsignal has been addressed by several authors and wastreated in detail by Baldwin and O’Sullivan [1995]. Thedetails of such an analysis (definition of the QBO, se-lection of winter months, level of data) are critical to theoutcome of statistical tests. For example, the effect ofthe QBO is observed to be large in December andJanuary but weaker in February. Using 1964–1993NCEP data for December–January–February at levelsup to 10 hPa, they showed that the effect of the QBO(defined by the 40-hPa Singapore wind) is statisticallysignificant at the 0.001 level using 10-hPa geopotential,as measured by the field significance test of Barnston andLivezey [1987]. In zonal-mean wind composites the sta-tistical significance of the effect of the QBO increaseswith height, at least through 10 hPa, with much highersignificance at 10 hPa than at 30 hPa.
The NH dipole pattern illustrated in Figure 14 is notunique to the influence of the QBO; it represents theleading mode of variability of the northern winter strato-sphere [Nigam, 1990; Dunkerton and Baldwin, 1992].During winter the QBO appears to excite the “northernannular mode” (NAM) (also called the Arctic Oscilla-tion) [Thompson and Wallace, 1998, 2000]. NH QBOcomposites (of geopotential, wind, temperature, etc.)tend to reflect the degree to which the QBO excites theNAM. One phase of the NAM is represented by a cold,strong vortex, while the opposite phase is represented by
Figure 14. January latitude-height zonal-mean wind difference between the average of all years withwesterly QBO and those with easterly QBO, during 1964–1996. The phase of the QBO is optimized for theNorthern Hemisphere (NH) and is defined using the empirical orthogonal function technique of Baldwin andDunkerton [1998b]; it is nearly equivalent to using 40-hPa equatorial winds. The contour interval is 2 m s21,and negative values are shaded. From Baldwin and Dunkerton [1998b].
39, 2 / REVIEWS OF GEOPHYSICS Baldwin et al.: THE QUASI-BIENNIAL OSCILLATION ● 203
a weaker vortex and higher polar temperatures. Thedipole in Figure 14 is much more prominent in thestratosphere and weaker in the troposphere. The con-nection to the stratosphere is limited to the winter sea-son, but the tropospheric NAM is observed during allseasons. The tropospheric aspects of the NAM and thetropospheric patterns associated with the QBO will bediscussed in section 6.2.
Figure 15 illustrates the 5-hPa seasonal developmentof the NH zonal wind composite difference. The extra-tropical signal begins during autumn in midlatitudes andreaches a high-latitude maximum during January. Thelate winter (February and March) composite differenceis opposite in sign, but small, north of 408. The abruptdiminution of the signal indicates that the QBO modu-lates the strength of the northern winter polar vortexuntil midwinter but has little effect on the timing of thefinal warming.
Major stratospheric warmings are defined as a rever-sal of the zonal-mean wind at 10 hPa, 608N to easterly,and higher temperature at the pole than the zonal aver-age at 10 hPa, 608N. The Holton-Tan effect implies thatmajor warmings should be more common when theQBO is easterly. Unfortunately, such a simple measureis not robust because the definitions of both QBO phase(east/west) and warming (yes/no) are arbitrary. UsingNCEP reanalyzed data from 1958–1999, and a 40-hPadefinition of the QBO phase, there were six westerlywarmings and 10 easterly warmings. However, if the“Berlin” hand-analyzed data are used with a 45-hPadefinition of the QBO, and major warmings are definedsynoptically, there were 10 westerly warmings and 11easterly warmings (K. Labitzke, personal communica-tion, 2000). The disparity between these results illus-trates that this procedure is too sensitive to the defini-tions of QBO phase and warmings. Composites, as inFigures 14 and 15, are more robust, can be used in bothhemispheres, and provide a quantitative measure of theHolton-Tan effect.
The SH polar vortex is much stronger, longer-lived,and more quiescent than its NH counterpart. Duringwinter, planetary waves generally do not disrupt thesouthern vortex in the lower to middle stratosphere. It isnot surprising that the observations indicate that theQBO does not significantly modulate the strength of theAntarctic vortex in winter. As shown in Figure 16, at 5hPa the QBO modulates the strength of winds in mid-latitudes during late autumn, as in the NH. However,unlike the NH, throughout winter and early spring themodulation is apparent only in midlatitudes. The ob-served seasonality of the QBO modulation of the extra-tropical circulation in both hemispheres is consistentwith the hypothesis that planetary waves play a vital rolein the mechanism for the modulation. The striking dif-ference between Figures 15 and 16 is that in the SH, thelargest influence of the QBO occurs during late spring(November), at the time of the final warming. In the SHthe October vortex is of the same magnitude as the NHvortex in January. Since planetary wave amplitudes aremuch smaller in the SH, the effect of the QBO is seenonly at the vortex periphery until the vortex is relativelysmall.
4.3. Model Simulations of Extratropical InfluenceIt is difficult to formulate a simple quantitative model
for the mechanism of the extratropical QBO (analogous,say, to the Holton-Lindzen model [Holton and Lindzen,1972] for interaction of the equatorial mean flow withvertically propagating waves). The main complicationsare (1) the planetary waves propagate both vertically andmeridionally, and (2) the effects of critical lines onplanetary wave propagation are not easy to predict the-oretically. Lacking a simple theory, the effects of theQBO on extratropical waves and mean circulation havebeen studied extensively in detailed numerical simula-tion experiments with models of varying complexity.
The effect of the QBO on sudden warmings was
Figure 15. NH 5-hPa month-latitude zonal-mean wind difference between the average of all years withwesterly QBO and those with easterly QBO, during 1964–1996. The phase of the QBO is defined as in Figure14, and the data are monthly means. The contour interval is 2 m s21, and negative values are shaded. FromBaldwin and Dunkerton [1998b].
204 ● Baldwin et al.: THE QUASI-BIENNIAL OSCILLATION 39, 2 / REVIEWS OF GEOPHYSICS
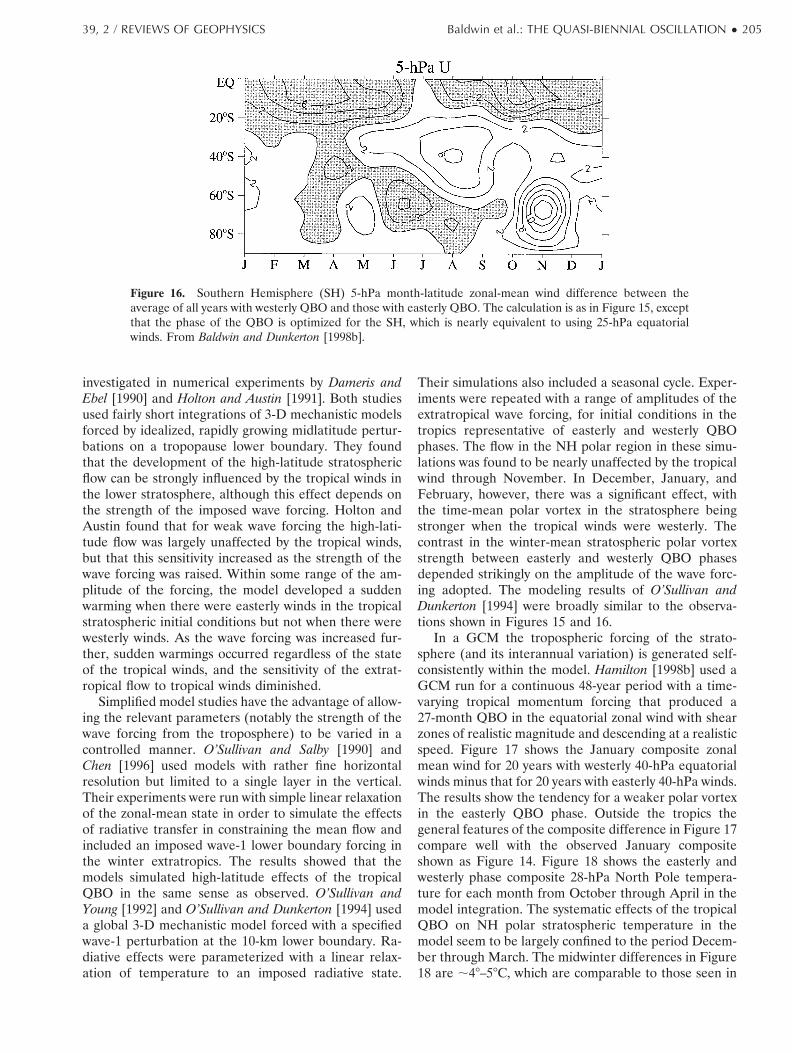
investigated in numerical experiments by Dameris andEbel [1990] and Holton and Austin [1991]. Both studiesused fairly short integrations of 3-D mechanistic modelsforced by idealized, rapidly growing midlatitude pertur-bations on a tropopause lower boundary. They foundthat the development of the high-latitude stratosphericflow can be strongly influenced by the tropical winds inthe lower stratosphere, although this effect depends onthe strength of the imposed wave forcing. Holton andAustin found that for weak wave forcing the high-lati-tude flow was largely unaffected by the tropical winds,but that this sensitivity increased as the strength of thewave forcing was raised. Within some range of the am-plitude of the forcing, the model developed a suddenwarming when there were easterly winds in the tropicalstratospheric initial conditions but not when there werewesterly winds. As the wave forcing was increased fur-ther, sudden warmings occurred regardless of the stateof the tropical winds, and the sensitivity of the extrat-ropical flow to tropical winds diminished.
Simplified model studies have the advantage of allow-ing the relevant parameters (notably the strength of thewave forcing from the troposphere) to be varied in acontrolled manner. O’Sullivan and Salby [1990] andChen [1996] used models with rather fine horizontalresolution but limited to a single layer in the vertical.Their experiments were run with simple linear relaxationof the zonal-mean state in order to simulate the effectsof radiative transfer in constraining the mean flow andincluded an imposed wave-1 lower boundary forcing inthe winter extratropics. The results showed that themodels simulated high-latitude effects of the tropicalQBO in the same sense as observed. O’Sullivan andYoung [1992] and O’Sullivan and Dunkerton [1994] useda global 3-D mechanistic model forced with a specifiedwave-1 perturbation at the 10-km lower boundary. Ra-diative effects were parameterized with a linear relax-ation of temperature to an imposed radiative state.
Their simulations also included a seasonal cycle. Exper-iments were repeated with a range of amplitudes of theextratropical wave forcing, for initial conditions in thetropics representative of easterly and westerly QBOphases. The flow in the NH polar region in these simu-lations was found to be nearly unaffected by the tropicalwind through November. In December, January, andFebruary, however, there was a significant effect, withthe time-mean polar vortex in the stratosphere beingstronger when the tropical winds were westerly. Thecontrast in the winter-mean stratospheric polar vortexstrength between easterly and westerly QBO phasesdepended strikingly on the amplitude of the wave forc-ing adopted. The modeling results of O’Sullivan andDunkerton [1994] were broadly similar to the observa-tions shown in Figures 15 and 16.
In a GCM the tropospheric forcing of the strato-sphere (and its interannual variation) is generated self-consistently within the model. Hamilton [1998b] used aGCM run for a continuous 48-year period with a time-varying tropical momentum forcing that produced a27-month QBO in the equatorial zonal wind with shearzones of realistic magnitude and descending at a realisticspeed. Figure 17 shows the January composite zonalmean wind for 20 years with westerly 40-hPa equatorialwinds minus that for 20 years with easterly 40-hPa winds.The results show the tendency for a weaker polar vortexin the easterly QBO phase. Outside the tropics thegeneral features of the composite difference in Figure 17compare well with the observed January compositeshown as Figure 14. Figure 18 shows the easterly andwesterly phase composite 28-hPa North Pole tempera-ture for each month from October through April in themodel integration. The systematic effects of the tropicalQBO on NH polar stratospheric temperature in themodel seem to be largely confined to the period Decem-ber through March. The midwinter differences in Figure18 are ;48–58C, which are comparable to those seen in
Figure 16. Southern Hemisphere (SH) 5-hPa month-latitude zonal-mean wind difference between theaverage of all years with westerly QBO and those with easterly QBO. The calculation is as in Figure 15, exceptthat the phase of the QBO is optimized for the SH, which is nearly equivalent to using 25-hPa equatorialwinds. From Baldwin and Dunkerton [1998b].
39, 2 / REVIEWS OF GEOPHYSICS Baldwin et al.: THE QUASI-BIENNIAL OSCILLATION ● 205
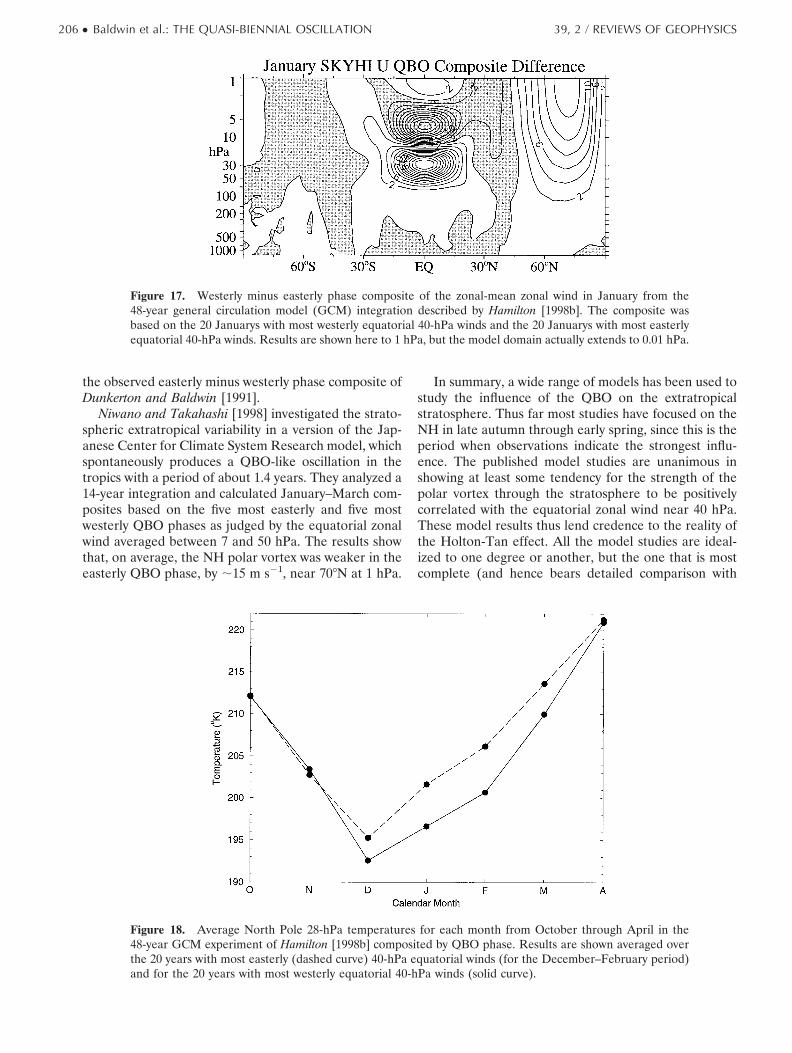
the observed easterly minus westerly phase composite ofDunkerton and Baldwin [1991].
Niwano and Takahashi [1998] investigated the strato-spheric extratropical variability in a version of the Jap-anese Center for Climate System Research model, whichspontaneously produces a QBO-like oscillation in thetropics with a period of about 1.4 years. They analyzed a14-year integration and calculated January–March com-posites based on the five most easterly and five mostwesterly QBO phases as judged by the equatorial zonalwind averaged between 7 and 50 hPa. The results showthat, on average, the NH polar vortex was weaker in theeasterly QBO phase, by ;15 m s21, near 708N at 1 hPa.
In summary, a wide range of models has been used tostudy the influence of the QBO on the extratropicalstratosphere. Thus far most studies have focused on theNH in late autumn through early spring, since this is theperiod when observations indicate the strongest influ-ence. The published model studies are unanimous inshowing at least some tendency for the strength of thepolar vortex through the stratosphere to be positivelycorrelated with the equatorial zonal wind near 40 hPa.These model results thus lend credence to the reality ofthe Holton-Tan effect. All the model studies are ideal-ized to one degree or another, but the one that is mostcomplete (and hence bears detailed comparison with
Figure 17. Westerly minus easterly phase composite of the zonal-mean zonal wind in January from the48-year general circulation model (GCM) integration described by Hamilton [1998b]. The composite wasbased on the 20 Januarys with most westerly equatorial 40-hPa winds and the 20 Januarys with most easterlyequatorial 40-hPa winds. Results are shown here to 1 hPa, but the model domain actually extends to 0.01 hPa.
Figure 18. Average North Pole 28-hPa temperatures for each month from October through April in the48-year GCM experiment of Hamilton [1998b] composited by QBO phase. Results are shown averaged overthe 20 years with most easterly (dashed curve) 40-hPa equatorial winds (for the December–February period)and for the 20 years with most westerly equatorial 40-hPa winds (solid curve).
206 ● Baldwin et al.: THE QUASI-BIENNIAL OSCILLATION 39, 2 / REVIEWS OF GEOPHYSICS
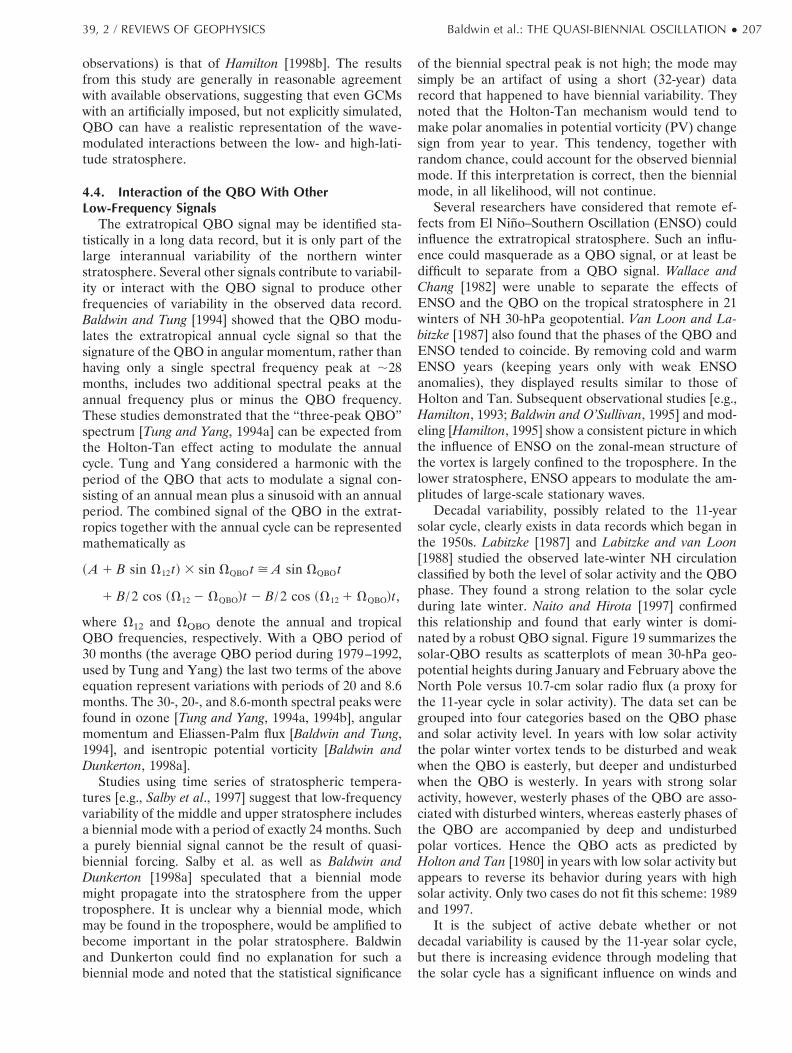
observations) is that of Hamilton [1998b]. The resultsfrom this study are generally in reasonable agreementwith available observations, suggesting that even GCMswith an artificially imposed, but not explicitly simulated,QBO can have a realistic representation of the wave-modulated interactions between the low- and high-lati-tude stratosphere.
4.4. Interaction of the QBO With OtherLow-Frequency Signals
The extratropical QBO signal may be identified sta-tistically in a long data record, but it is only part of thelarge interannual variability of the northern winterstratosphere. Several other signals contribute to variabil-ity or interact with the QBO signal to produce otherfrequencies of variability in the observed data record.Baldwin and Tung [1994] showed that the QBO modu-lates the extratropical annual cycle signal so that thesignature of the QBO in angular momentum, rather thanhaving only a single spectral frequency peak at ;28months, includes two additional spectral peaks at theannual frequency plus or minus the QBO frequency.These studies demonstrated that the “three-peak QBO”spectrum [Tung and Yang, 1994a] can be expected fromthe Holton-Tan effect acting to modulate the annualcycle. Tung and Yang considered a harmonic with theperiod of the QBO that acts to modulate a signal con-sisting of an annual mean plus a sinusoid with an annualperiod. The combined signal of the QBO in the extrat-ropics together with the annual cycle can be representedmathematically as
~ A 1 B sin V12 t! 3 sin VQBO t > A sin VQBO t
1 B/ 2 cos ~V12 2 VQBO!t 2 B/ 2 cos ~V12 1 VQBO!t,
where V12 and VQBO denote the annual and tropicalQBO frequencies, respectively. With a QBO period of30 months (the average QBO period during 1979–1992,used by Tung and Yang) the last two terms of the aboveequation represent variations with periods of 20 and 8.6months. The 30-, 20-, and 8.6-month spectral peaks werefound in ozone [Tung and Yang, 1994a, 1994b], angularmomentum and Eliassen-Palm flux [Baldwin and Tung,1994], and isentropic potential vorticity [Baldwin andDunkerton, 1998a].
Studies using time series of stratospheric tempera-tures [e.g., Salby et al., 1997] suggest that low-frequencyvariability of the middle and upper stratosphere includesa biennial mode with a period of exactly 24 months. Sucha purely biennial signal cannot be the result of quasi-biennial forcing. Salby et al. as well as Baldwin andDunkerton [1998a] speculated that a biennial modemight propagate into the stratosphere from the uppertroposphere. It is unclear why a biennial mode, whichmay be found in the troposphere, would be amplified tobecome important in the polar stratosphere. Baldwinand Dunkerton could find no explanation for such abiennial mode and noted that the statistical significance
of the biennial spectral peak is not high; the mode maysimply be an artifact of using a short (32-year) datarecord that happened to have biennial variability. Theynoted that the Holton-Tan mechanism would tend tomake polar anomalies in potential vorticity (PV) changesign from year to year. This tendency, together withrandom chance, could account for the observed biennialmode. If this interpretation is correct, then the biennialmode, in all likelihood, will not continue.
Several researchers have considered that remote ef-fects from El Nino–Southern Oscillation (ENSO) couldinfluence the extratropical stratosphere. Such an influ-ence could masquerade as a QBO signal, or at least bedifficult to separate from a QBO signal. Wallace andChang [1982] were unable to separate the effects ofENSO and the QBO on the tropical stratosphere in 21winters of NH 30-hPa geopotential. Van Loon and La-bitzke [1987] also found that the phases of the QBO andENSO tended to coincide. By removing cold and warmENSO years (keeping years only with weak ENSOanomalies), they displayed results similar to those ofHolton and Tan. Subsequent observational studies [e.g.,Hamilton, 1993; Baldwin and O’Sullivan, 1995] and mod-eling [Hamilton, 1995] show a consistent picture in whichthe influence of ENSO on the zonal-mean structure ofthe vortex is largely confined to the troposphere. In thelower stratosphere, ENSO appears to modulate the am-plitudes of large-scale stationary waves.
Decadal variability, possibly related to the 11-yearsolar cycle, clearly exists in data records which began inthe 1950s. Labitzke [1987] and Labitzke and van Loon[1988] studied the observed late-winter NH circulationclassified by both the level of solar activity and the QBOphase. They found a strong relation to the solar cycleduring late winter. Naito and Hirota [1997] confirmedthis relationship and found that early winter is domi-nated by a robust QBO signal. Figure 19 summarizes thesolar-QBO results as scatterplots of mean 30-hPa geo-potential heights during January and February above theNorth Pole versus 10.7-cm solar radio flux (a proxy forthe 11-year cycle in solar activity). The data set can begrouped into four categories based on the QBO phaseand solar activity level. In years with low solar activitythe polar winter vortex tends to be disturbed and weakwhen the QBO is easterly, but deeper and undisturbedwhen the QBO is westerly. In years with strong solaractivity, however, westerly phases of the QBO are asso-ciated with disturbed winters, whereas easterly phases ofthe QBO are accompanied by deep and undisturbedpolar vortices. Hence the QBO acts as predicted byHolton and Tan [1980] in years with low solar activity butappears to reverse its behavior during years with highsolar activity. Only two cases do not fit this scheme: 1989and 1997.
It is the subject of active debate whether or notdecadal variability is caused by the 11-year solar cycle,but there is increasing evidence through modeling thatthe solar cycle has a significant influence on winds and
39, 2 / REVIEWS OF GEOPHYSICS Baldwin et al.: THE QUASI-BIENNIAL OSCILLATION ● 207
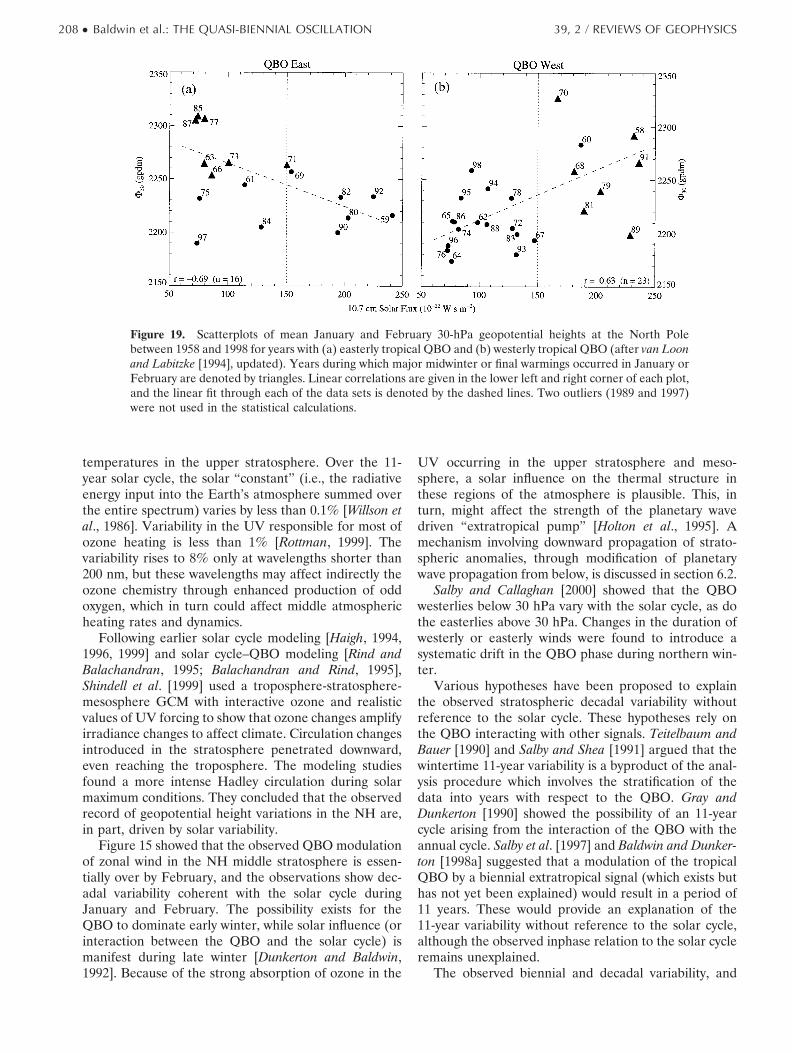
temperatures in the upper stratosphere. Over the 11-year solar cycle, the solar “constant” (i.e., the radiativeenergy input into the Earth’s atmosphere summed overthe entire spectrum) varies by less than 0.1% [Willson etal., 1986]. Variability in the UV responsible for most ofozone heating is less than 1% [Rottman, 1999]. Thevariability rises to 8% only at wavelengths shorter than200 nm, but these wavelengths may affect indirectly theozone chemistry through enhanced production of oddoxygen, which in turn could affect middle atmosphericheating rates and dynamics.
Following earlier solar cycle modeling [Haigh, 1994,1996, 1999] and solar cycle–QBO modeling [Rind andBalachandran, 1995; Balachandran and Rind, 1995],Shindell et al. [1999] used a troposphere-stratosphere-mesosphere GCM with interactive ozone and realisticvalues of UV forcing to show that ozone changes amplifyirradiance changes to affect climate. Circulation changesintroduced in the stratosphere penetrated downward,even reaching the troposphere. The modeling studiesfound a more intense Hadley circulation during solarmaximum conditions. They concluded that the observedrecord of geopotential height variations in the NH are,in part, driven by solar variability.
Figure 15 showed that the observed QBO modulationof zonal wind in the NH middle stratosphere is essen-tially over by February, and the observations show dec-adal variability coherent with the solar cycle duringJanuary and February. The possibility exists for theQBO to dominate early winter, while solar influence (orinteraction between the QBO and the solar cycle) ismanifest during late winter [Dunkerton and Baldwin,1992]. Because of the strong absorption of ozone in the
UV occurring in the upper stratosphere and meso-sphere, a solar influence on the thermal structure inthese regions of the atmosphere is plausible. This, inturn, might affect the strength of the planetary wavedriven “extratropical pump” [Holton et al., 1995]. Amechanism involving downward propagation of strato-spheric anomalies, through modification of planetarywave propagation from below, is discussed in section 6.2.
Salby and Callaghan [2000] showed that the QBOwesterlies below 30 hPa vary with the solar cycle, as dothe easterlies above 30 hPa. Changes in the duration ofwesterly or easterly winds were found to introduce asystematic drift in the QBO phase during northern win-ter.
Various hypotheses have been proposed to explainthe observed stratospheric decadal variability withoutreference to the solar cycle. These hypotheses rely onthe QBO interacting with other signals. Teitelbaum andBauer [1990] and Salby and Shea [1991] argued that thewintertime 11-year variability is a byproduct of the anal-ysis procedure which involves the stratification of thedata into years with respect to the QBO. Gray andDunkerton [1990] showed the possibility of an 11-yearcycle arising from the interaction of the QBO with theannual cycle. Salby et al. [1997] and Baldwin and Dunker-ton [1998a] suggested that a modulation of the tropicalQBO by a biennial extratropical signal (which exists buthas not yet been explained) would result in a period of11 years. These would provide an explanation of the11-year variability without reference to the solar cycle,although the observed inphase relation to the solar cycleremains unexplained.
The observed biennial and decadal variability, and
Figure 19. Scatterplots of mean January and February 30-hPa geopotential heights at the North Polebetween 1958 and 1998 for years with (a) easterly tropical QBO and (b) westerly tropical QBO (after van Loonand Labitzke [1994], updated). Years during which major midwinter or final warmings occurred in January orFebruary are denoted by triangles. Linear correlations are given in the lower left and right corner of each plot,and the linear fit through each of the data sets is denoted by the dashed lines. Two outliers (1989 and 1997)were not used in the statistical calculations.
208 ● Baldwin et al.: THE QUASI-BIENNIAL OSCILLATION 39, 2 / REVIEWS OF GEOPHYSICS
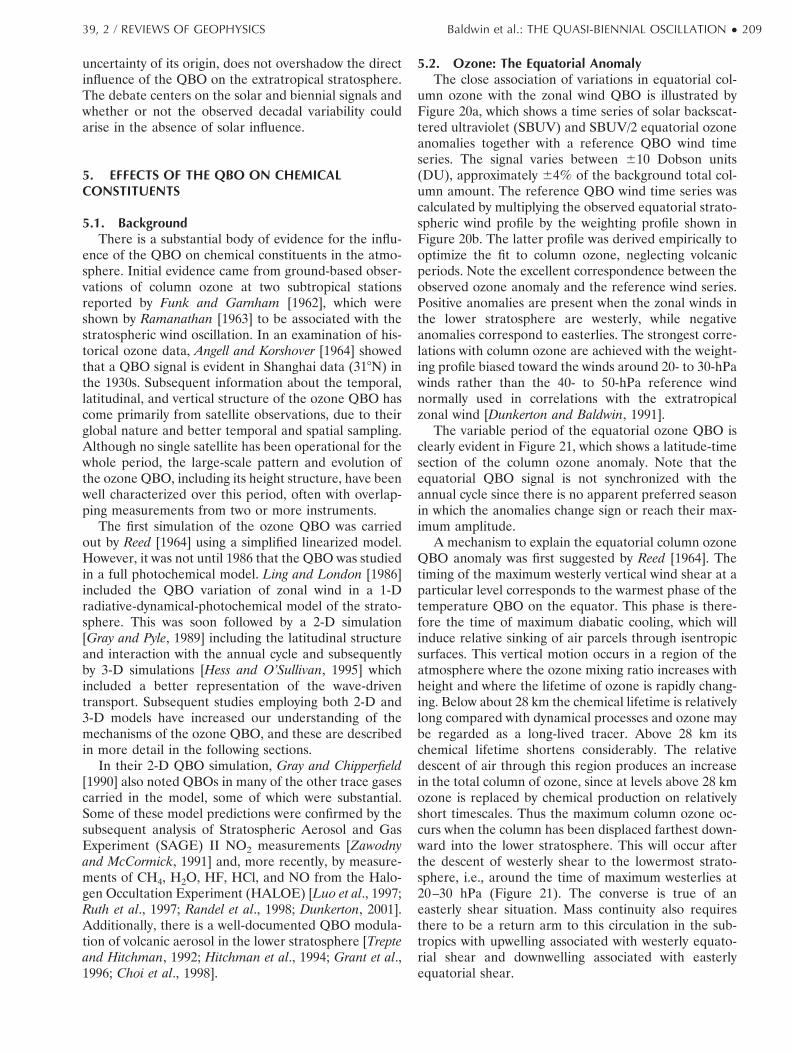
uncertainty of its origin, does not overshadow the directinfluence of the QBO on the extratropical stratosphere.The debate centers on the solar and biennial signals andwhether or not the observed decadal variability couldarise in the absence of solar influence.
5. EFFECTS OF THE QBO ON CHEMICALCONSTITUENTS
5.1. BackgroundThere is a substantial body of evidence for the influ-
ence of the QBO on chemical constituents in the atmo-sphere. Initial evidence came from ground-based obser-vations of column ozone at two subtropical stationsreported by Funk and Garnham [1962], which wereshown by Ramanathan [1963] to be associated with thestratospheric wind oscillation. In an examination of his-torical ozone data, Angell and Korshover [1964] showedthat a QBO signal is evident in Shanghai data (318N) inthe 1930s. Subsequent information about the temporal,latitudinal, and vertical structure of the ozone QBO hascome primarily from satellite observations, due to theirglobal nature and better temporal and spatial sampling.Although no single satellite has been operational for thewhole period, the large-scale pattern and evolution ofthe ozone QBO, including its height structure, have beenwell characterized over this period, often with overlap-ping measurements from two or more instruments.
The first simulation of the ozone QBO was carriedout by Reed [1964] using a simplified linearized model.However, it was not until 1986 that the QBO was studiedin a full photochemical model. Ling and London [1986]included the QBO variation of zonal wind in a 1-Dradiative-dynamical-photochemical model of the strato-sphere. This was soon followed by a 2-D simulation[Gray and Pyle, 1989] including the latitudinal structureand interaction with the annual cycle and subsequentlyby 3-D simulations [Hess and O’Sullivan, 1995] whichincluded a better representation of the wave-driventransport. Subsequent studies employing both 2-D and3-D models have increased our understanding of themechanisms of the ozone QBO, and these are describedin more detail in the following sections.
In their 2-D QBO simulation, Gray and Chipperfield[1990] also noted QBOs in many of the other trace gasescarried in the model, some of which were substantial.Some of these model predictions were confirmed by thesubsequent analysis of Stratospheric Aerosol and GasExperiment (SAGE) II NO2 measurements [Zawodnyand McCormick, 1991] and, more recently, by measure-ments of CH4, H2O, HF, HCl, and NO from the Halo-gen Occultation Experiment (HALOE) [Luo et al., 1997;Ruth et al., 1997; Randel et al., 1998; Dunkerton, 2001].Additionally, there is a well-documented QBO modula-tion of volcanic aerosol in the lower stratosphere [Trepteand Hitchman, 1992; Hitchman et al., 1994; Grant et al.,1996; Choi et al., 1998].
5.2. Ozone: The Equatorial AnomalyThe close association of variations in equatorial col-
umn ozone with the zonal wind QBO is illustrated byFigure 20a, which shows a time series of solar backscat-tered ultraviolet (SBUV) and SBUV/2 equatorial ozoneanomalies together with a reference QBO wind timeseries. The signal varies between 610 Dobson units(DU), approximately 64% of the background total col-umn amount. The reference QBO wind time series wascalculated by multiplying the observed equatorial strato-spheric wind profile by the weighting profile shown inFigure 20b. The latter profile was derived empirically tooptimize the fit to column ozone, neglecting volcanicperiods. Note the excellent correspondence between theobserved ozone anomaly and the reference wind series.Positive anomalies are present when the zonal winds inthe lower stratosphere are westerly, while negativeanomalies correspond to easterlies. The strongest corre-lations with column ozone are achieved with the weight-ing profile biased toward the winds around 20- to 30-hPawinds rather than the 40- to 50-hPa reference windnormally used in correlations with the extratropicalzonal wind [Dunkerton and Baldwin, 1991].
The variable period of the equatorial ozone QBO isclearly evident in Figure 21, which shows a latitude-timesection of the column ozone anomaly. Note that theequatorial QBO signal is not synchronized with theannual cycle since there is no apparent preferred seasonin which the anomalies change sign or reach their max-imum amplitude.
A mechanism to explain the equatorial column ozoneQBO anomaly was first suggested by Reed [1964]. Thetiming of the maximum westerly vertical wind shear at aparticular level corresponds to the warmest phase of thetemperature QBO on the equator. This phase is there-fore the time of maximum diabatic cooling, which willinduce relative sinking of air parcels through isentropicsurfaces. This vertical motion occurs in a region of theatmosphere where the ozone mixing ratio increases withheight and where the lifetime of ozone is rapidly chang-ing. Below about 28 km the chemical lifetime is relativelylong compared with dynamical processes and ozone maybe regarded as a long-lived tracer. Above 28 km itschemical lifetime shortens considerably. The relativedescent of air through this region produces an increasein the total column of ozone, since at levels above 28 kmozone is replaced by chemical production on relativelyshort timescales. Thus the maximum column ozone oc-curs when the column has been displaced farthest down-ward into the lower stratosphere. This will occur afterthe descent of westerly shear to the lowermost strato-sphere, i.e., around the time of maximum westerlies at20–30 hPa (Figure 21). The converse is true of aneasterly shear situation. Mass continuity also requiresthere to be a return arm to this circulation in the sub-tropics with upwelling associated with westerly equato-rial shear and downwelling associated with easterlyequatorial shear.
39, 2 / REVIEWS OF GEOPHYSICS Baldwin et al.: THE QUASI-BIENNIAL OSCILLATION ● 209
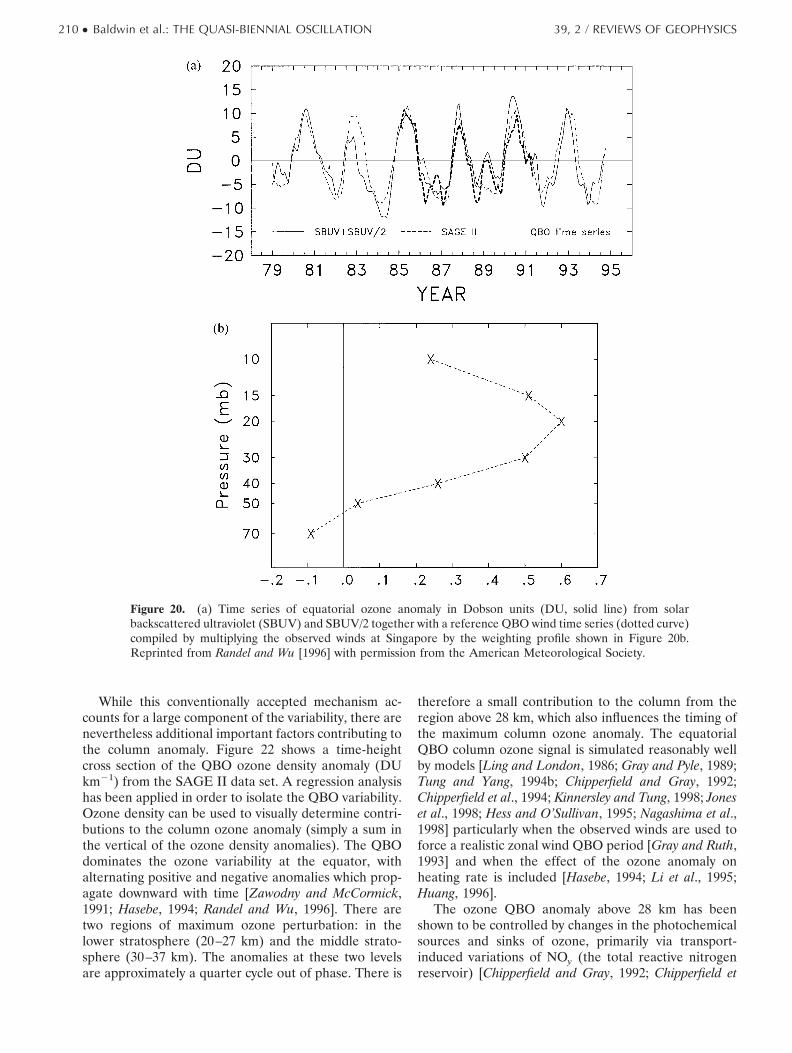
While this conventionally accepted mechanism ac-counts for a large component of the variability, there arenevertheless additional important factors contributing tothe column anomaly. Figure 22 shows a time-heightcross section of the QBO ozone density anomaly (DUkm21) from the SAGE II data set. A regression analysishas been applied in order to isolate the QBO variability.Ozone density can be used to visually determine contri-butions to the column ozone anomaly (simply a sum inthe vertical of the ozone density anomalies). The QBOdominates the ozone variability at the equator, withalternating positive and negative anomalies which prop-agate downward with time [Zawodny and McCormick,1991; Hasebe, 1994; Randel and Wu, 1996]. There aretwo regions of maximum ozone perturbation: in thelower stratosphere (20–27 km) and the middle strato-sphere (30–37 km). The anomalies at these two levelsare approximately a quarter cycle out of phase. There is
therefore a small contribution to the column from theregion above 28 km, which also influences the timing ofthe maximum column ozone anomaly. The equatorialQBO column ozone signal is simulated reasonably wellby models [Ling and London, 1986; Gray and Pyle, 1989;Tung and Yang, 1994b; Chipperfield and Gray, 1992;Chipperfield et al., 1994; Kinnersley and Tung, 1998; Joneset al., 1998; Hess and O’Sullivan, 1995; Nagashima et al.,1998] particularly when the observed winds are used toforce a realistic zonal wind QBO period [Gray and Ruth,1993] and when the effect of the ozone anomaly onheating rate is included [Hasebe, 1994; Li et al., 1995;Huang, 1996].
The ozone QBO anomaly above 28 km has beenshown to be controlled by changes in the photochemicalsources and sinks of ozone, primarily via transport-induced variations of NOy (the total reactive nitrogenreservoir) [Chipperfield and Gray, 1992; Chipperfield et
Figure 20. (a) Time series of equatorial ozone anomaly in Dobson units (DU, solid line) from solarbackscattered ultraviolet (SBUV) and SBUV/2 together with a reference QBO wind time series (dotted curve)compiled by multiplying the observed winds at Singapore by the weighting profile shown in Figure 20b.Reprinted from Randel and Wu [1996] with permission from the American Meteorological Society.
210 ● Baldwin et al.: THE QUASI-BIENNIAL OSCILLATION 39, 2 / REVIEWS OF GEOPHYSICS
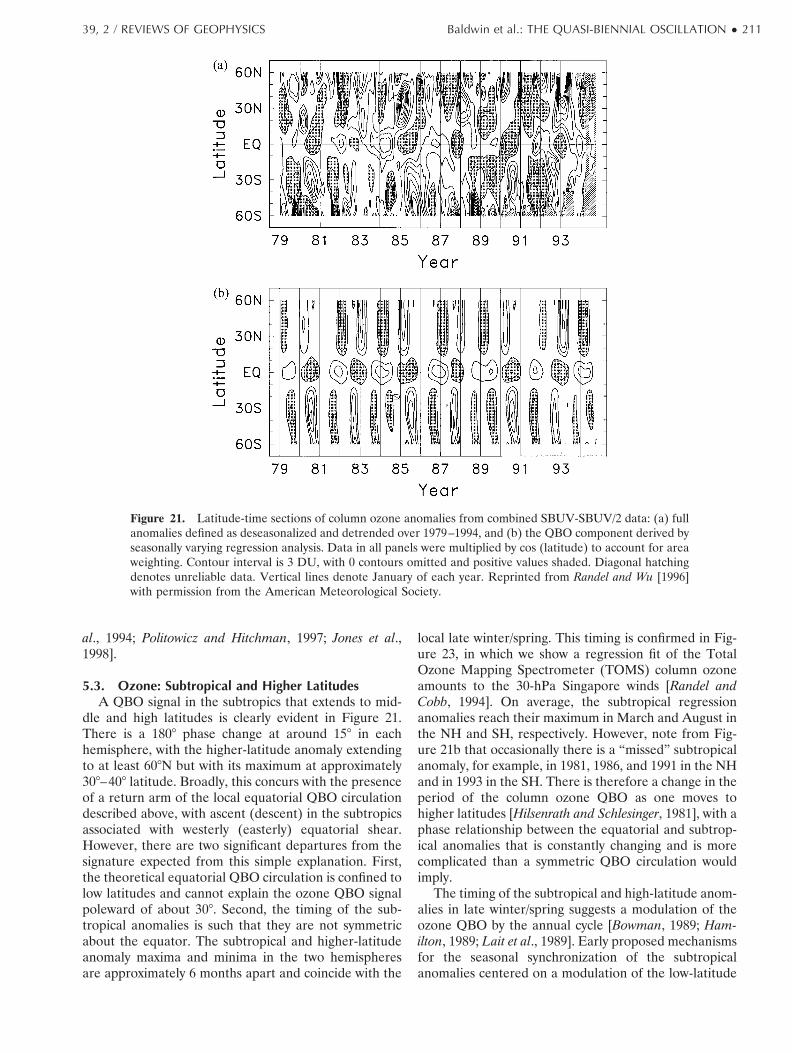
al., 1994; Politowicz and Hitchman, 1997; Jones et al.,1998].
5.3. Ozone: Subtropical and Higher LatitudesA QBO signal in the subtropics that extends to mid-
dle and high latitudes is clearly evident in Figure 21.There is a 1808 phase change at around 158 in eachhemisphere, with the higher-latitude anomaly extendingto at least 608N but with its maximum at approximately308–408 latitude. Broadly, this concurs with the presenceof a return arm of the local equatorial QBO circulationdescribed above, with ascent (descent) in the subtropicsassociated with westerly (easterly) equatorial shear.However, there are two significant departures from thesignature expected from this simple explanation. First,the theoretical equatorial QBO circulation is confined tolow latitudes and cannot explain the ozone QBO signalpoleward of about 308. Second, the timing of the sub-tropical anomalies is such that they are not symmetricabout the equator. The subtropical and higher-latitudeanomaly maxima and minima in the two hemispheresare approximately 6 months apart and coincide with the
local late winter/spring. This timing is confirmed in Fig-ure 23, in which we show a regression fit of the TotalOzone Mapping Spectrometer (TOMS) column ozoneamounts to the 30-hPa Singapore winds [Randel andCobb, 1994]. On average, the subtropical regressionanomalies reach their maximum in March and August inthe NH and SH, respectively. However, note from Fig-ure 21b that occasionally there is a “missed” subtropicalanomaly, for example, in 1981, 1986, and 1991 in the NHand in 1993 in the SH. There is therefore a change in theperiod of the column ozone QBO as one moves tohigher latitudes [Hilsenrath and Schlesinger, 1981], with aphase relationship between the equatorial and subtrop-ical anomalies that is constantly changing and is morecomplicated than a symmetric QBO circulation wouldimply.
The timing of the subtropical and high-latitude anom-alies in late winter/spring suggests a modulation of theozone QBO by the annual cycle [Bowman, 1989; Ham-ilton, 1989; Lait et al., 1989]. Early proposed mechanismsfor the seasonal synchronization of the subtropicalanomalies centered on a modulation of the low-latitude
Figure 21. Latitude-time sections of column ozone anomalies from combined SBUV-SBUV/2 data: (a) fullanomalies defined as deseasonalized and detrended over 1979–1994, and (b) the QBO component derived byseasonally varying regression analysis. Data in all panels were multiplied by cos (latitude) to account for areaweighting. Contour interval is 3 DU, with 0 contours omitted and positive values shaded. Diagonal hatchingdenotes unreliable data. Vertical lines denote January of each year. Reprinted from Randel and Wu [1996]with permission from the American Meteorological Society.
39, 2 / REVIEWS OF GEOPHYSICS Baldwin et al.: THE QUASI-BIENNIAL OSCILLATION ● 211
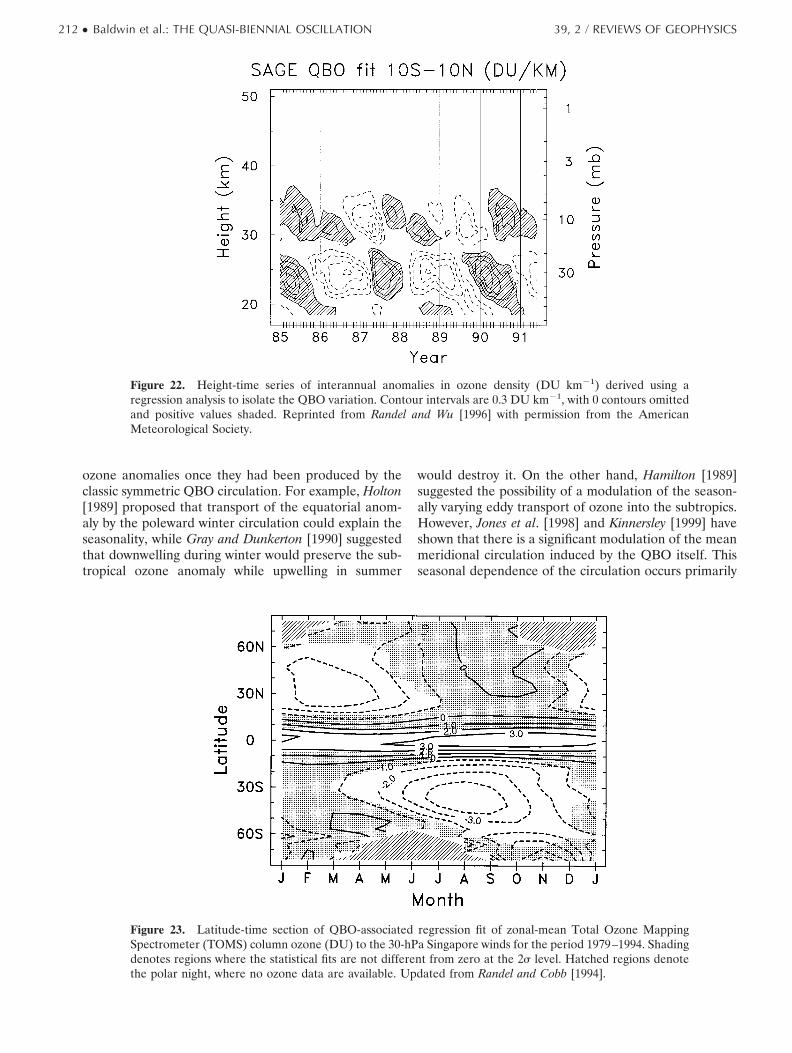
ozone anomalies once they had been produced by theclassic symmetric QBO circulation. For example, Holton[1989] proposed that transport of the equatorial anom-aly by the poleward winter circulation could explain theseasonality, while Gray and Dunkerton [1990] suggestedthat downwelling during winter would preserve the sub-tropical ozone anomaly while upwelling in summer
would destroy it. On the other hand, Hamilton [1989]suggested the possibility of a modulation of the season-ally varying eddy transport of ozone into the subtropics.However, Jones et al. [1998] and Kinnersley [1999] haveshown that there is a significant modulation of the meanmeridional circulation induced by the QBO itself. Thisseasonal dependence of the circulation occurs primarily
Figure 22. Height-time series of interannual anomalies in ozone density (DU km21) derived using aregression analysis to isolate the QBO variation. Contour intervals are 0.3 DU km21, with 0 contours omittedand positive values shaded. Reprinted from Randel and Wu [1996] with permission from the AmericanMeteorological Society.
Figure 23. Latitude-time section of QBO-associated regression fit of zonal-mean Total Ozone MappingSpectrometer (TOMS) column ozone (DU) to the 30-hPa Singapore winds for the period 1979–1994. Shadingdenotes regions where the statistical fits are not different from zero at the 2s level. Hatched regions denotethe polar night, where no ozone data are available. Updated from Randel and Cobb [1994].
212 ● Baldwin et al.: THE QUASI-BIENNIAL OSCILLATION 39, 2 / REVIEWS OF GEOPHYSICS
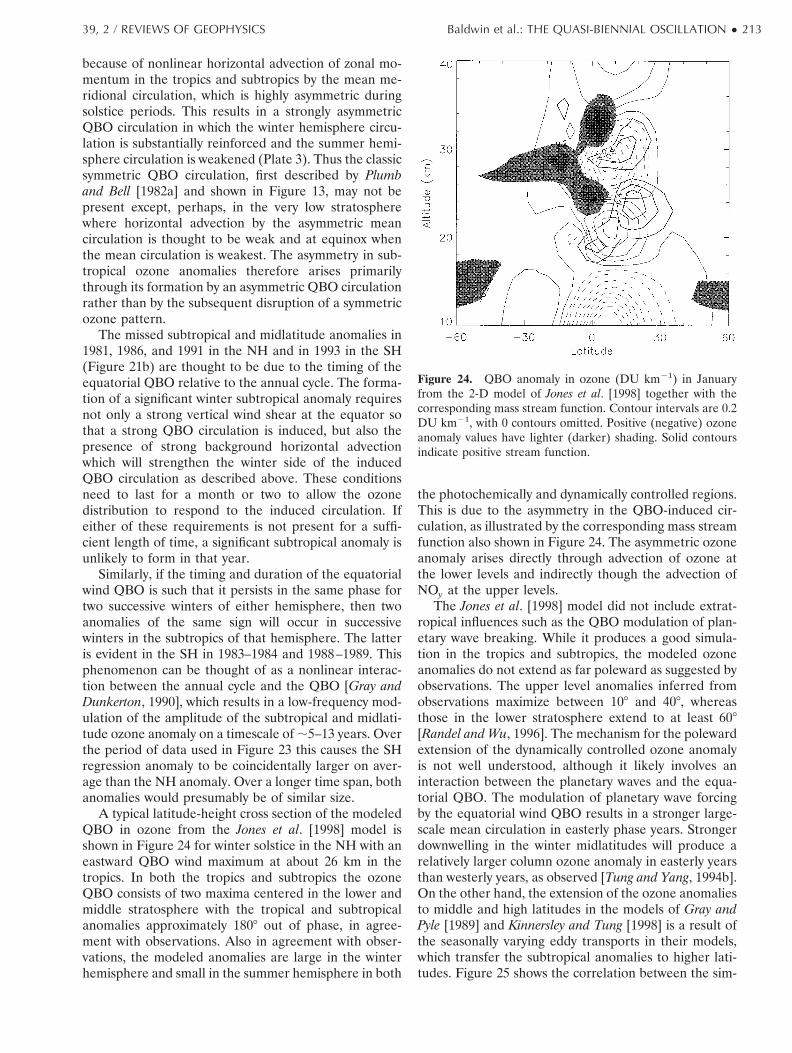
because of nonlinear horizontal advection of zonal mo-mentum in the tropics and subtropics by the mean me-ridional circulation, which is highly asymmetric duringsolstice periods. This results in a strongly asymmetricQBO circulation in which the winter hemisphere circu-lation is substantially reinforced and the summer hemi-sphere circulation is weakened (Plate 3). Thus the classicsymmetric QBO circulation, first described by Plumband Bell [1982a] and shown in Figure 13, may not bepresent except, perhaps, in the very low stratospherewhere horizontal advection by the asymmetric meancirculation is thought to be weak and at equinox whenthe mean circulation is weakest. The asymmetry in sub-tropical ozone anomalies therefore arises primarilythrough its formation by an asymmetric QBO circulationrather than by the subsequent disruption of a symmetricozone pattern.
The missed subtropical and midlatitude anomalies in1981, 1986, and 1991 in the NH and in 1993 in the SH(Figure 21b) are thought to be due to the timing of theequatorial QBO relative to the annual cycle. The forma-tion of a significant winter subtropical anomaly requiresnot only a strong vertical wind shear at the equator sothat a strong QBO circulation is induced, but also thepresence of strong background horizontal advectionwhich will strengthen the winter side of the inducedQBO circulation as described above. These conditionsneed to last for a month or two to allow the ozonedistribution to respond to the induced circulation. Ifeither of these requirements is not present for a suffi-cient length of time, a significant subtropical anomaly isunlikely to form in that year.
Similarly, if the timing and duration of the equatorialwind QBO is such that it persists in the same phase fortwo successive winters of either hemisphere, then twoanomalies of the same sign will occur in successivewinters in the subtropics of that hemisphere. The latteris evident in the SH in 1983–1984 and 1988–1989. Thisphenomenon can be thought of as a nonlinear interac-tion between the annual cycle and the QBO [Gray andDunkerton, 1990], which results in a low-frequency mod-ulation of the amplitude of the subtropical and midlati-tude ozone anomaly on a timescale of ;5–13 years. Overthe period of data used in Figure 23 this causes the SHregression anomaly to be coincidentally larger on aver-age than the NH anomaly. Over a longer time span, bothanomalies would presumably be of similar size.
A typical latitude-height cross section of the modeledQBO in ozone from the Jones et al. [1998] model isshown in Figure 24 for winter solstice in the NH with aneastward QBO wind maximum at about 26 km in thetropics. In both the tropics and subtropics the ozoneQBO consists of two maxima centered in the lower andmiddle stratosphere with the tropical and subtropicalanomalies approximately 1808 out of phase, in agree-ment with observations. Also in agreement with obser-vations, the modeled anomalies are large in the winterhemisphere and small in the summer hemisphere in both
the photochemically and dynamically controlled regions.This is due to the asymmetry in the QBO-induced cir-culation, as illustrated by the corresponding mass streamfunction also shown in Figure 24. The asymmetric ozoneanomaly arises directly through advection of ozone atthe lower levels and indirectly though the advection ofNOy at the upper levels.
The Jones et al. [1998] model did not include extrat-ropical influences such as the QBO modulation of plan-etary wave breaking. While it produces a good simula-tion in the tropics and subtropics, the modeled ozoneanomalies do not extend as far poleward as suggested byobservations. The upper level anomalies inferred fromobservations maximize between 108 and 408, whereasthose in the lower stratosphere extend to at least 608[Randel and Wu, 1996]. The mechanism for the polewardextension of the dynamically controlled ozone anomalyis not well understood, although it likely involves aninteraction between the planetary waves and the equa-torial QBO. The modulation of planetary wave forcingby the equatorial wind QBO results in a stronger large-scale mean circulation in easterly phase years. Strongerdownwelling in the winter midlatitudes will produce arelatively larger column ozone anomaly in easterly yearsthan westerly years, as observed [Tung and Yang, 1994b].On the other hand, the extension of the ozone anomaliesto middle and high latitudes in the models of Gray andPyle [1989] and Kinnersley and Tung [1998] is a result ofthe seasonally varying eddy transports in their models,which transfer the subtropical anomalies to higher lati-tudes. Figure 25 shows the correlation between the sim-
Figure 24. QBO anomaly in ozone (DU km21) in Januaryfrom the 2-D model of Jones et al. [1998] together with thecorresponding mass stream function. Contour intervals are 0.2DU km21, with 0 contours omitted. Positive (negative) ozoneanomaly values have lighter (darker) shading. Solid contoursindicate positive stream function.
39, 2 / REVIEWS OF GEOPHYSICS Baldwin et al.: THE QUASI-BIENNIAL OSCILLATION ● 213
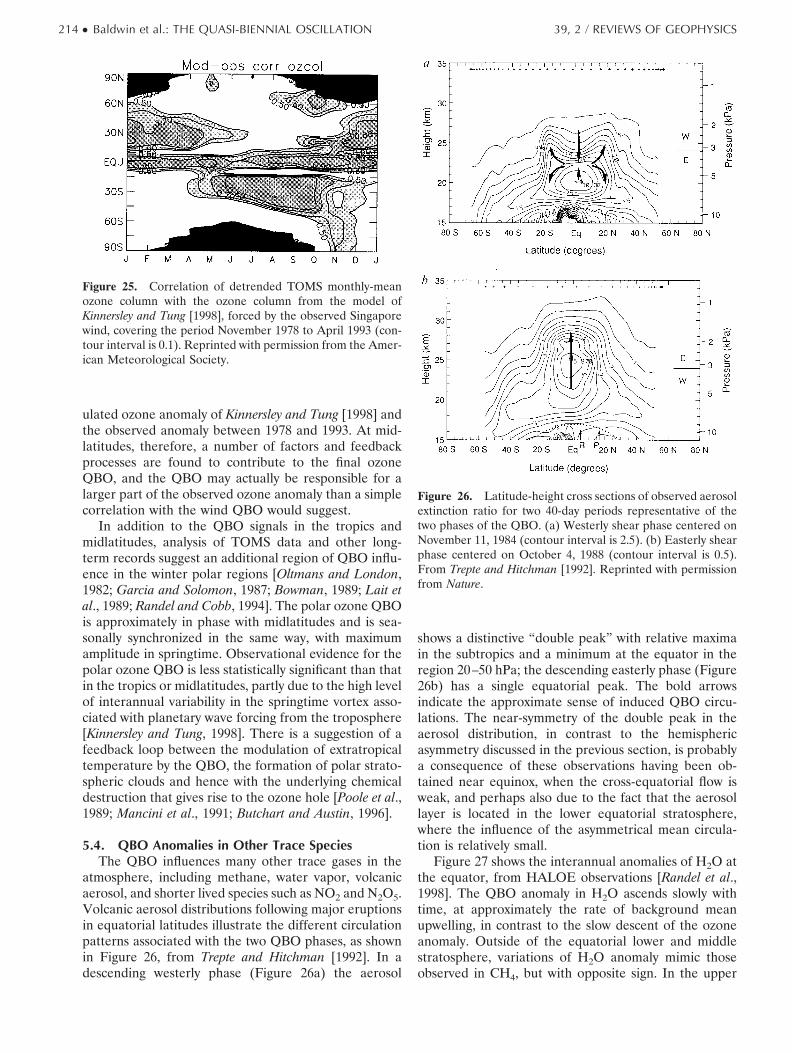
ulated ozone anomaly of Kinnersley and Tung [1998] andthe observed anomaly between 1978 and 1993. At mid-latitudes, therefore, a number of factors and feedbackprocesses are found to contribute to the final ozoneQBO, and the QBO may actually be responsible for alarger part of the observed ozone anomaly than a simplecorrelation with the wind QBO would suggest.
In addition to the QBO signals in the tropics andmidlatitudes, analysis of TOMS data and other long-term records suggest an additional region of QBO influ-ence in the winter polar regions [Oltmans and London,1982; Garcia and Solomon, 1987; Bowman, 1989; Lait etal., 1989; Randel and Cobb, 1994]. The polar ozone QBOis approximately in phase with midlatitudes and is sea-sonally synchronized in the same way, with maximumamplitude in springtime. Observational evidence for thepolar ozone QBO is less statistically significant than thatin the tropics or midlatitudes, partly due to the high levelof interannual variability in the springtime vortex asso-ciated with planetary wave forcing from the troposphere[Kinnersley and Tung, 1998]. There is a suggestion of afeedback loop between the modulation of extratropicaltemperature by the QBO, the formation of polar strato-spheric clouds and hence with the underlying chemicaldestruction that gives rise to the ozone hole [Poole et al.,1989; Mancini et al., 1991; Butchart and Austin, 1996].
5.4. QBO Anomalies in Other Trace SpeciesThe QBO influences many other trace gases in the
atmosphere, including methane, water vapor, volcanicaerosol, and shorter lived species such as NO2 and N2O5.Volcanic aerosol distributions following major eruptionsin equatorial latitudes illustrate the different circulationpatterns associated with the two QBO phases, as shownin Figure 26, from Trepte and Hitchman [1992]. In adescending westerly phase (Figure 26a) the aerosol
shows a distinctive “double peak” with relative maximain the subtropics and a minimum at the equator in theregion 20–50 hPa; the descending easterly phase (Figure26b) has a single equatorial peak. The bold arrowsindicate the approximate sense of induced QBO circu-lations. The near-symmetry of the double peak in theaerosol distribution, in contrast to the hemisphericasymmetry discussed in the previous section, is probablya consequence of these observations having been ob-tained near equinox, when the cross-equatorial flow isweak, and perhaps also due to the fact that the aerosollayer is located in the lower equatorial stratosphere,where the influence of the asymmetrical mean circula-tion is relatively small.
Figure 27 shows the interannual anomalies of H2O atthe equator, from HALOE observations [Randel et al.,1998]. The QBO anomaly in H2O ascends slowly withtime, at approximately the rate of background meanupwelling, in contrast to the slow descent of the ozoneanomaly. Outside of the equatorial lower and middlestratosphere, variations of H2O anomaly mimic thoseobserved in CH4, but with opposite sign. In the upper
Figure 25. Correlation of detrended TOMS monthly-meanozone column with the ozone column from the model ofKinnersley and Tung [1998], forced by the observed Singaporewind, covering the period November 1978 to April 1993 (con-tour interval is 0.1). Reprinted with permission from the Amer-ican Meteorological Society.
Figure 26. Latitude-height cross sections of observed aerosolextinction ratio for two 40-day periods representative of thetwo phases of the QBO. (a) Westerly shear phase centered onNovember 11, 1984 (contour interval is 2.5). (b) Easterly shearphase centered on October 4, 1988 (contour interval is 0.5).From Trepte and Hitchman [1992]. Reprinted with permissionfrom Nature.
214 ● Baldwin et al.: THE QUASI-BIENNIAL OSCILLATION 39, 2 / REVIEWS OF GEOPHYSICS
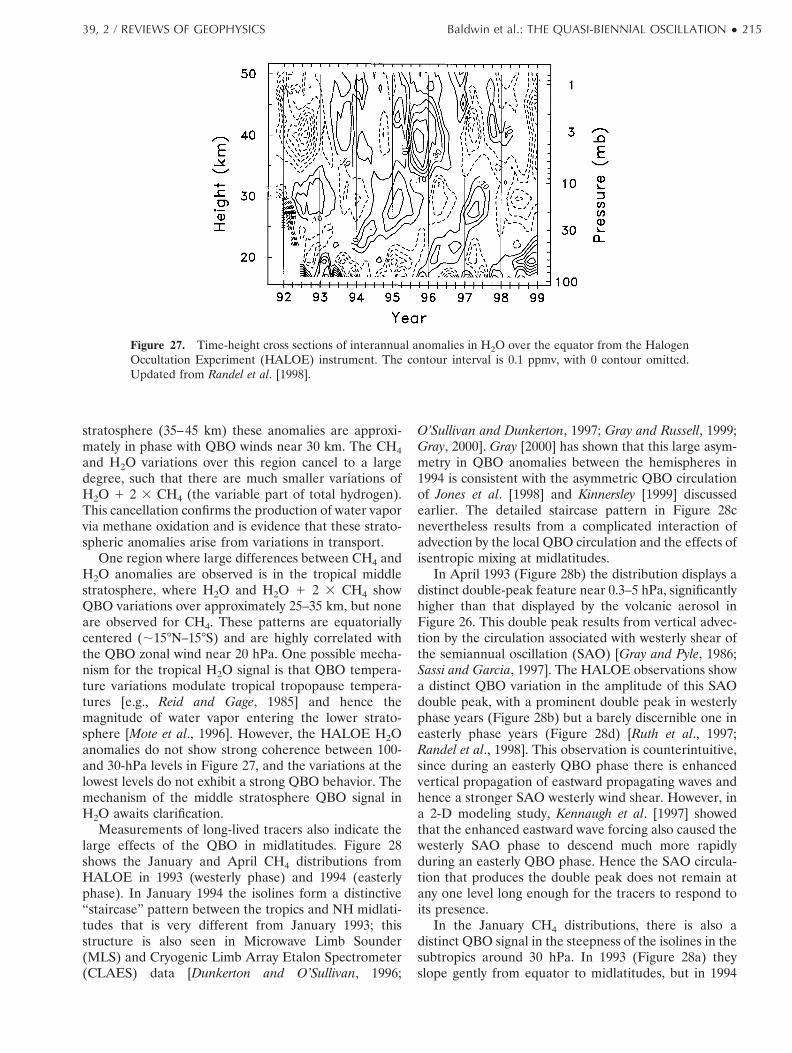
stratosphere (35–45 km) these anomalies are approxi-mately in phase with QBO winds near 30 km. The CH4and H2O variations over this region cancel to a largedegree, such that there are much smaller variations ofH2O 1 2 3 CH4 (the variable part of total hydrogen).This cancellation confirms the production of water vaporvia methane oxidation and is evidence that these strato-spheric anomalies arise from variations in transport.
One region where large differences between CH4 andH2O anomalies are observed is in the tropical middlestratosphere, where H2O and H2O 1 2 3 CH4 showQBO variations over approximately 25–35 km, but noneare observed for CH4. These patterns are equatoriallycentered (;158N–158S) and are highly correlated withthe QBO zonal wind near 20 hPa. One possible mecha-nism for the tropical H2O signal is that QBO tempera-ture variations modulate tropical tropopause tempera-tures [e.g., Reid and Gage, 1985] and hence themagnitude of water vapor entering the lower strato-sphere [Mote et al., 1996]. However, the HALOE H2Oanomalies do not show strong coherence between 100-and 30-hPa levels in Figure 27, and the variations at thelowest levels do not exhibit a strong QBO behavior. Themechanism of the middle stratosphere QBO signal inH2O awaits clarification.
Measurements of long-lived tracers also indicate thelarge effects of the QBO in midlatitudes. Figure 28shows the January and April CH4 distributions fromHALOE in 1993 (westerly phase) and 1994 (easterlyphase). In January 1994 the isolines form a distinctive“staircase” pattern between the tropics and NH midlati-tudes that is very different from January 1993; thisstructure is also seen in Microwave Limb Sounder(MLS) and Cryogenic Limb Array Etalon Spectrometer(CLAES) data [Dunkerton and O’Sullivan, 1996;
O’Sullivan and Dunkerton, 1997; Gray and Russell, 1999;Gray, 2000]. Gray [2000] has shown that this large asym-metry in QBO anomalies between the hemispheres in1994 is consistent with the asymmetric QBO circulationof Jones et al. [1998] and Kinnersley [1999] discussedearlier. The detailed staircase pattern in Figure 28cnevertheless results from a complicated interaction ofadvection by the local QBO circulation and the effects ofisentropic mixing at midlatitudes.
In April 1993 (Figure 28b) the distribution displays adistinct double-peak feature near 0.3–5 hPa, significantlyhigher than that displayed by the volcanic aerosol inFigure 26. This double peak results from vertical advec-tion by the circulation associated with westerly shear ofthe semiannual oscillation (SAO) [Gray and Pyle, 1986;Sassi and Garcia, 1997]. The HALOE observations showa distinct QBO variation in the amplitude of this SAOdouble peak, with a prominent double peak in westerlyphase years (Figure 28b) but a barely discernible one ineasterly phase years (Figure 28d) [Ruth et al., 1997;Randel et al., 1998]. This observation is counterintuitive,since during an easterly QBO phase there is enhancedvertical propagation of eastward propagating waves andhence a stronger SAO westerly wind shear. However, ina 2-D modeling study, Kennaugh et al. [1997] showedthat the enhanced eastward wave forcing also caused thewesterly SAO phase to descend much more rapidlyduring an easterly QBO phase. Hence the SAO circula-tion that produces the double peak does not remain atany one level long enough for the tracers to respond toits presence.
In the January CH4 distributions, there is also adistinct QBO signal in the steepness of the isolines in thesubtropics around 30 hPa. In 1993 (Figure 28a) theyslope gently from equator to midlatitudes, but in 1994
Figure 27. Time-height cross sections of interannual anomalies in H2O over the equator from the HalogenOccultation Experiment (HALOE) instrument. The contour interval is 0.1 ppmv, with 0 contour omitted.Updated from Randel et al. [1998].
39, 2 / REVIEWS OF GEOPHYSICS Baldwin et al.: THE QUASI-BIENNIAL OSCILLATION ● 215
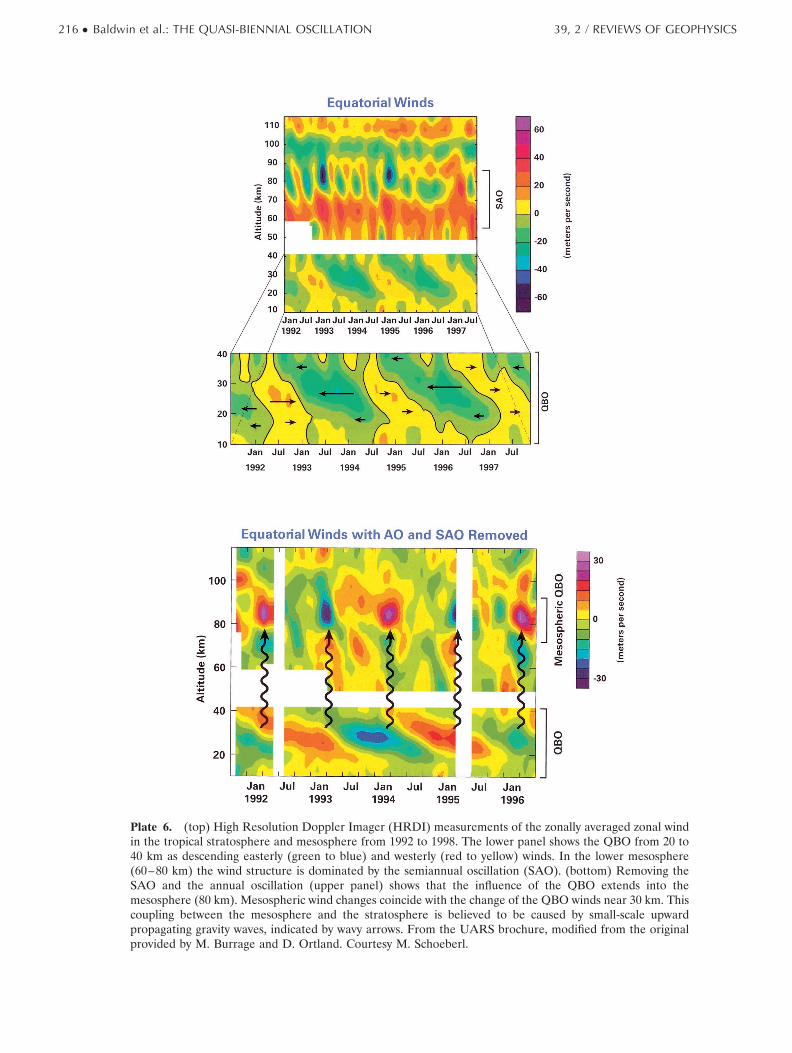
Plate 6. (top) High Resolution Doppler Imager (HRDI) measurements of the zonally averaged zonal windin the tropical stratosphere and mesosphere from 1992 to 1998. The lower panel shows the QBO from 20 to40 km as descending easterly (green to blue) and westerly (red to yellow) winds. In the lower mesosphere(60–80 km) the wind structure is dominated by the semiannual oscillation (SAO). (bottom) Removing theSAO and the annual oscillation (upper panel) shows that the influence of the QBO extends into themesosphere (80 km). Mesospheric wind changes coincide with the change of the QBO winds near 30 km. Thiscoupling between the mesosphere and the stratosphere is believed to be caused by small-scale upwardpropagating gravity waves, indicated by wavy arrows. From the UARS brochure, modified from the originalprovided by M. Burrage and D. Ortland. Courtesy M. Schoeberl.
216 ● Baldwin et al.: THE QUASI-BIENNIAL OSCILLATION 39, 2 / REVIEWS OF GEOPHYSICS
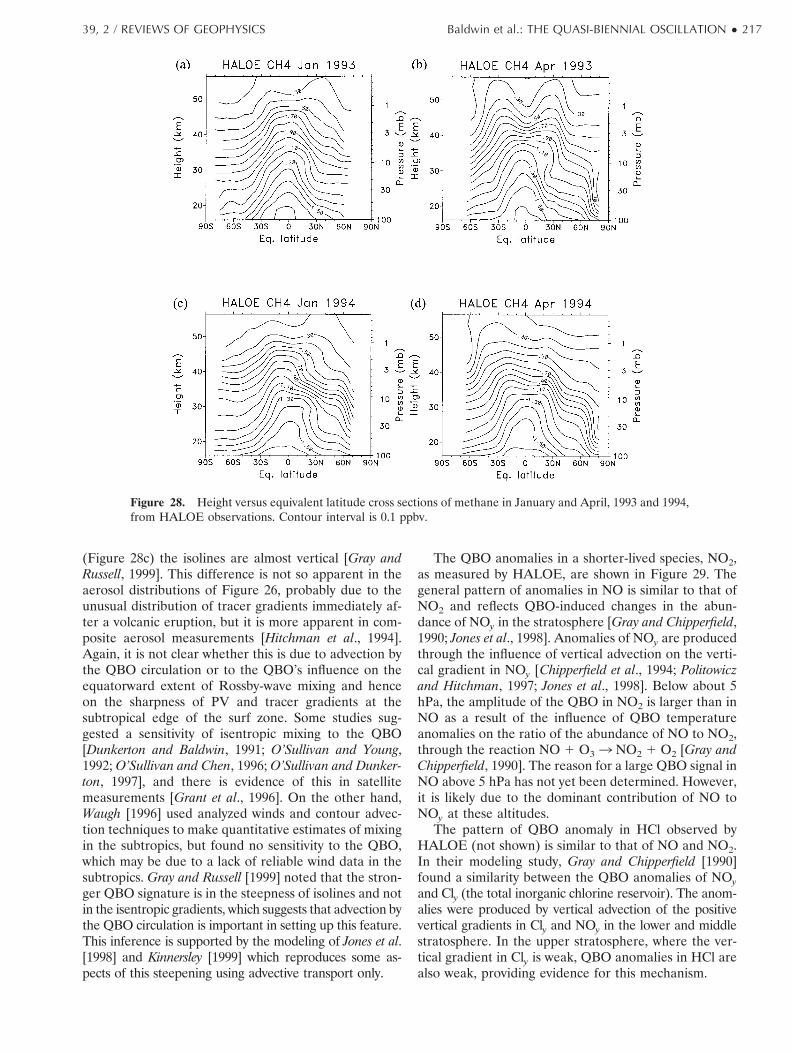
(Figure 28c) the isolines are almost vertical [Gray andRussell, 1999]. This difference is not so apparent in theaerosol distributions of Figure 26, probably due to theunusual distribution of tracer gradients immediately af-ter a volcanic eruption, but it is more apparent in com-posite aerosol measurements [Hitchman et al., 1994].Again, it is not clear whether this is due to advection bythe QBO circulation or to the QBO’s influence on theequatorward extent of Rossby-wave mixing and henceon the sharpness of PV and tracer gradients at thesubtropical edge of the surf zone. Some studies sug-gested a sensitivity of isentropic mixing to the QBO[Dunkerton and Baldwin, 1991; O’Sullivan and Young,1992; O’Sullivan and Chen, 1996; O’Sullivan and Dunker-ton, 1997], and there is evidence of this in satellitemeasurements [Grant et al., 1996]. On the other hand,Waugh [1996] used analyzed winds and contour advec-tion techniques to make quantitative estimates of mixingin the subtropics, but found no sensitivity to the QBO,which may be due to a lack of reliable wind data in thesubtropics. Gray and Russell [1999] noted that the stron-ger QBO signature is in the steepness of isolines and notin the isentropic gradients, which suggests that advection bythe QBO circulation is important in setting up this feature.This inference is supported by the modeling of Jones et al.[1998] and Kinnersley [1999] which reproduces some as-pects of this steepening using advective transport only.
The QBO anomalies in a shorter-lived species, NO2,as measured by HALOE, are shown in Figure 29. Thegeneral pattern of anomalies in NO is similar to that ofNO2 and reflects QBO-induced changes in the abun-dance of NOy in the stratosphere [Gray and Chipperfield,1990; Jones et al., 1998]. Anomalies of NOy are producedthrough the influence of vertical advection on the verti-cal gradient in NOy [Chipperfield et al., 1994; Politowiczand Hitchman, 1997; Jones et al., 1998]. Below about 5hPa, the amplitude of the QBO in NO2 is larger than inNO as a result of the influence of QBO temperatureanomalies on the ratio of the abundance of NO to NO2,through the reaction NO 1 O33 NO2 1 O2 [Gray andChipperfield, 1990]. The reason for a large QBO signal inNO above 5 hPa has not yet been determined. However,it is likely due to the dominant contribution of NO toNOy at these altitudes.
The pattern of QBO anomaly in HCl observed byHALOE (not shown) is similar to that of NO and NO2.In their modeling study, Gray and Chipperfield [1990]found a similarity between the QBO anomalies of NOy
and Cly (the total inorganic chlorine reservoir). The anom-alies were produced by vertical advection of the positivevertical gradients in Cly and NOy in the lower and middlestratosphere. In the upper stratosphere, where the ver-tical gradient in Cly is weak, QBO anomalies in HCl arealso weak, providing evidence for this mechanism.
Figure 28. Height versus equivalent latitude cross sections of methane in January and April, 1993 and 1994,from HALOE observations. Contour interval is 0.1 ppbv.
39, 2 / REVIEWS OF GEOPHYSICS Baldwin et al.: THE QUASI-BIENNIAL OSCILLATION ● 217
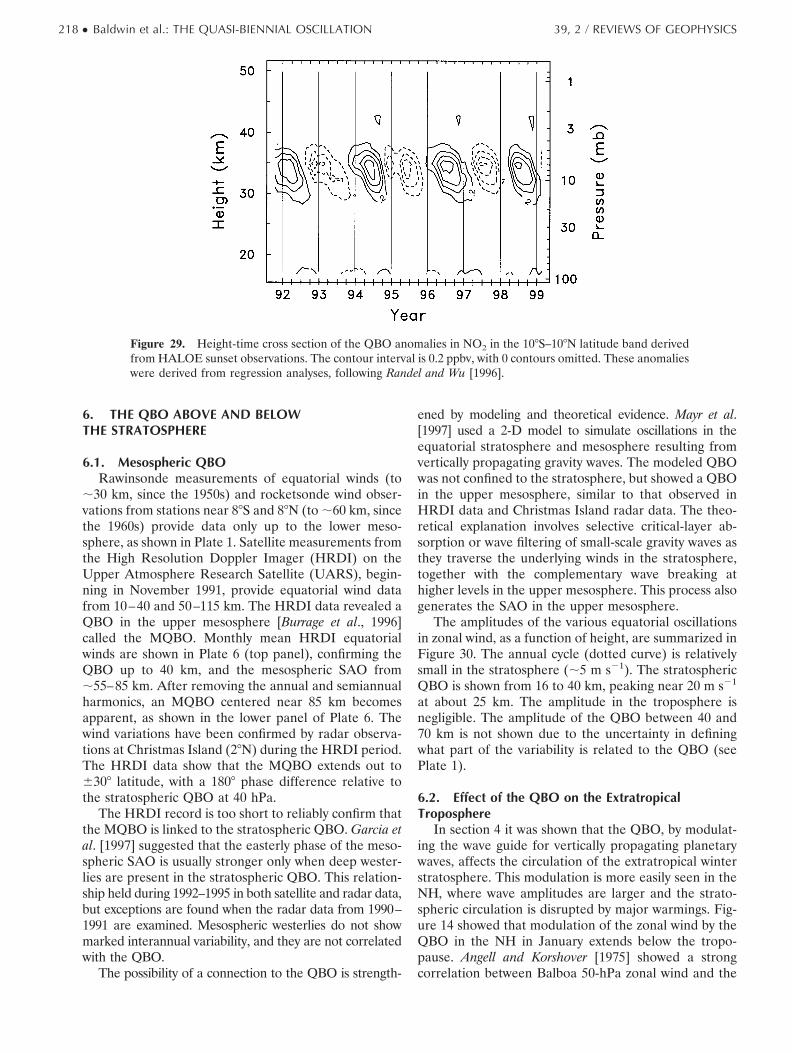
6. THE QBO ABOVE AND BELOWTHE STRATOSPHERE
6.1. Mesospheric QBORawinsonde measurements of equatorial winds (to
;30 km, since the 1950s) and rocketsonde wind obser-vations from stations near 88S and 88N (to ;60 km, sincethe 1960s) provide data only up to the lower meso-sphere, as shown in Plate 1. Satellite measurements fromthe High Resolution Doppler Imager (HRDI) on theUpper Atmosphere Research Satellite (UARS), begin-ning in November 1991, provide equatorial wind datafrom 10–40 and 50–115 km. The HRDI data revealed aQBO in the upper mesosphere [Burrage et al., 1996]called the MQBO. Monthly mean HRDI equatorialwinds are shown in Plate 6 (top panel), confirming theQBO up to 40 km, and the mesospheric SAO from;55–85 km. After removing the annual and semiannualharmonics, an MQBO centered near 85 km becomesapparent, as shown in the lower panel of Plate 6. Thewind variations have been confirmed by radar observa-tions at Christmas Island (28N) during the HRDI period.The HRDI data show that the MQBO extends out to6308 latitude, with a 1808 phase difference relative tothe stratospheric QBO at 40 hPa.
The HRDI record is too short to reliably confirm thatthe MQBO is linked to the stratospheric QBO. Garcia etal. [1997] suggested that the easterly phase of the meso-spheric SAO is usually stronger only when deep wester-lies are present in the stratospheric QBO. This relation-ship held during 1992–1995 in both satellite and radar data,but exceptions are found when the radar data from 1990–1991 are examined. Mesospheric westerlies do not showmarked interannual variability, and they are not correlatedwith the QBO.
The possibility of a connection to the QBO is strength-
ened by modeling and theoretical evidence. Mayr et al.[1997] used a 2-D model to simulate oscillations in theequatorial stratosphere and mesosphere resulting fromvertically propagating gravity waves. The modeled QBOwas not confined to the stratosphere, but showed a QBOin the upper mesosphere, similar to that observed inHRDI data and Christmas Island radar data. The theo-retical explanation involves selective critical-layer ab-sorption or wave filtering of small-scale gravity waves asthey traverse the underlying winds in the stratosphere,together with the complementary wave breaking athigher levels in the upper mesosphere. This process alsogenerates the SAO in the upper mesosphere.
The amplitudes of the various equatorial oscillationsin zonal wind, as a function of height, are summarized inFigure 30. The annual cycle (dotted curve) is relativelysmall in the stratosphere (;5 m s21). The stratosphericQBO is shown from 16 to 40 km, peaking near 20 m s21
at about 25 km. The amplitude in the troposphere isnegligible. The amplitude of the QBO between 40 and70 km is not shown due to the uncertainty in definingwhat part of the variability is related to the QBO (seePlate 1).
6.2. Effect of the QBO on the ExtratropicalTroposphere
In section 4 it was shown that the QBO, by modulat-ing the wave guide for vertically propagating planetarywaves, affects the circulation of the extratropical winterstratosphere. This modulation is more easily seen in theNH, where wave amplitudes are larger and the strato-spheric circulation is disrupted by major warmings. Fig-ure 14 showed that modulation of the zonal wind by theQBO in the NH in January extends below the tropo-pause. Angell and Korshover [1975] showed a strongcorrelation between Balboa 50-hPa zonal wind and the
Figure 29. Height-time cross section of the QBO anomalies in NO2 in the 108S–108N latitude band derivedfrom HALOE sunset observations. The contour interval is 0.2 ppbv, with 0 contours omitted. These anomalieswere derived from regression analyses, following Randel and Wu [1996].
218 ● Baldwin et al.: THE QUASI-BIENNIAL OSCILLATION 39, 2 / REVIEWS OF GEOPHYSICS
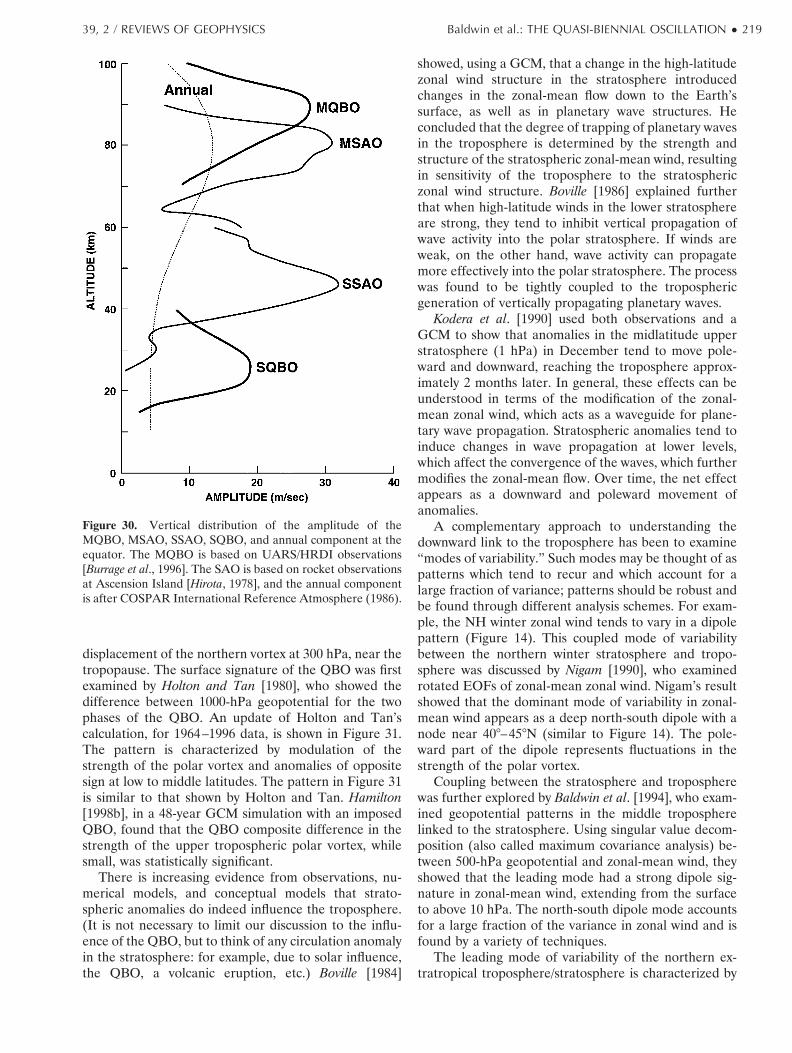
displacement of the northern vortex at 300 hPa, near thetropopause. The surface signature of the QBO was firstexamined by Holton and Tan [1980], who showed thedifference between 1000-hPa geopotential for the twophases of the QBO. An update of Holton and Tan’scalculation, for 1964–1996 data, is shown in Figure 31.The pattern is characterized by modulation of thestrength of the polar vortex and anomalies of oppositesign at low to middle latitudes. The pattern in Figure 31is similar to that shown by Holton and Tan. Hamilton[1998b], in a 48-year GCM simulation with an imposedQBO, found that the QBO composite difference in thestrength of the upper tropospheric polar vortex, whilesmall, was statistically significant.
There is increasing evidence from observations, nu-merical models, and conceptual models that strato-spheric anomalies do indeed influence the troposphere.(It is not necessary to limit our discussion to the influ-ence of the QBO, but to think of any circulation anomalyin the stratosphere: for example, due to solar influence,the QBO, a volcanic eruption, etc.) Boville [1984]
showed, using a GCM, that a change in the high-latitudezonal wind structure in the stratosphere introducedchanges in the zonal-mean flow down to the Earth’ssurface, as well as in planetary wave structures. Heconcluded that the degree of trapping of planetary wavesin the troposphere is determined by the strength andstructure of the stratospheric zonal-mean wind, resultingin sensitivity of the troposphere to the stratosphericzonal wind structure. Boville [1986] explained furtherthat when high-latitude winds in the lower stratosphereare strong, they tend to inhibit vertical propagation ofwave activity into the polar stratosphere. If winds areweak, on the other hand, wave activity can propagatemore effectively into the polar stratosphere. The processwas found to be tightly coupled to the troposphericgeneration of vertically propagating planetary waves.
Kodera et al. [1990] used both observations and aGCM to show that anomalies in the midlatitude upperstratosphere (1 hPa) in December tend to move pole-ward and downward, reaching the troposphere approx-imately 2 months later. In general, these effects can beunderstood in terms of the modification of the zonal-mean zonal wind, which acts as a waveguide for plane-tary wave propagation. Stratospheric anomalies tend toinduce changes in wave propagation at lower levels,which affect the convergence of the waves, which furthermodifies the zonal-mean flow. Over time, the net effectappears as a downward and poleward movement ofanomalies.
A complementary approach to understanding thedownward link to the troposphere has been to examine“modes of variability.” Such modes may be thought of aspatterns which tend to recur and which account for alarge fraction of variance; patterns should be robust andbe found through different analysis schemes. For exam-ple, the NH winter zonal wind tends to vary in a dipolepattern (Figure 14). This coupled mode of variabilitybetween the northern winter stratosphere and tropo-sphere was discussed by Nigam [1990], who examinedrotated EOFs of zonal-mean zonal wind. Nigam’s resultshowed that the dominant mode of variability in zonal-mean wind appears as a deep north-south dipole with anode near 408–458N (similar to Figure 14). The pole-ward part of the dipole represents fluctuations in thestrength of the polar vortex.
Coupling between the stratosphere and tropospherewas further explored by Baldwin et al. [1994], who exam-ined geopotential patterns in the middle tropospherelinked to the stratosphere. Using singular value decom-position (also called maximum covariance analysis) be-tween 500-hPa geopotential and zonal-mean wind, theyshowed that the leading mode had a strong dipole sig-nature in zonal-mean wind, extending from the surfaceto above 10 hPa. The north-south dipole mode accountsfor a large fraction of the variance in zonal wind and isfound by a variety of techniques.
The leading mode of variability of the northern ex-tratropical troposphere/stratosphere is characterized by
Figure 30. Vertical distribution of the amplitude of theMQBO, MSAO, SSAO, SQBO, and annual component at theequator. The MQBO is based on UARS/HRDI observations[Burrage et al., 1996]. The SAO is based on rocket observationsat Ascension Island [Hirota, 1978], and the annual componentis after COSPAR International Reference Atmosphere (1986).
39, 2 / REVIEWS OF GEOPHYSICS Baldwin et al.: THE QUASI-BIENNIAL OSCILLATION ● 219
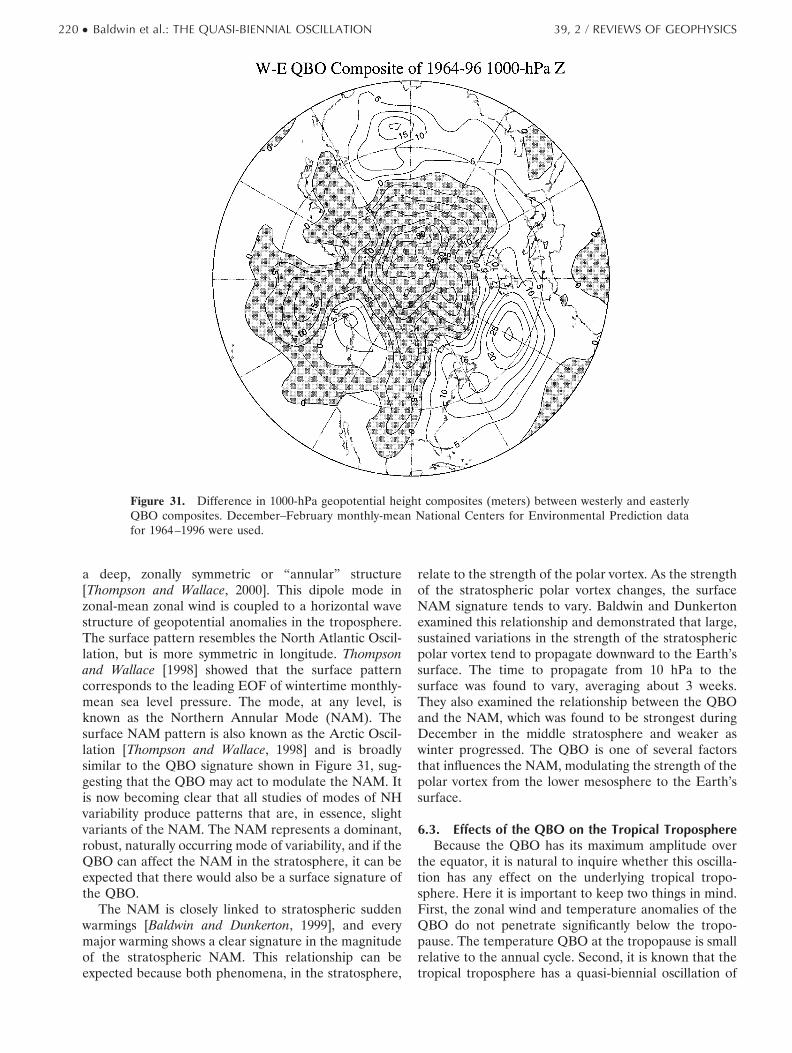
a deep, zonally symmetric or “annular” structure[Thompson and Wallace, 2000]. This dipole mode inzonal-mean zonal wind is coupled to a horizontal wavestructure of geopotential anomalies in the troposphere.The surface pattern resembles the North Atlantic Oscil-lation, but is more symmetric in longitude. Thompsonand Wallace [1998] showed that the surface patterncorresponds to the leading EOF of wintertime monthly-mean sea level pressure. The mode, at any level, isknown as the Northern Annular Mode (NAM). Thesurface NAM pattern is also known as the Arctic Oscil-lation [Thompson and Wallace, 1998] and is broadlysimilar to the QBO signature shown in Figure 31, sug-gesting that the QBO may act to modulate the NAM. Itis now becoming clear that all studies of modes of NHvariability produce patterns that are, in essence, slightvariants of the NAM. The NAM represents a dominant,robust, naturally occurring mode of variability, and if theQBO can affect the NAM in the stratosphere, it can beexpected that there would also be a surface signature ofthe QBO.
The NAM is closely linked to stratospheric suddenwarmings [Baldwin and Dunkerton, 1999], and everymajor warming shows a clear signature in the magnitudeof the stratospheric NAM. This relationship can beexpected because both phenomena, in the stratosphere,
relate to the strength of the polar vortex. As the strengthof the stratospheric polar vortex changes, the surfaceNAM signature tends to vary. Baldwin and Dunkertonexamined this relationship and demonstrated that large,sustained variations in the strength of the stratosphericpolar vortex tend to propagate downward to the Earth’ssurface. The time to propagate from 10 hPa to thesurface was found to vary, averaging about 3 weeks.They also examined the relationship between the QBOand the NAM, which was found to be strongest duringDecember in the middle stratosphere and weaker aswinter progressed. The QBO is one of several factorsthat influences the NAM, modulating the strength of thepolar vortex from the lower mesosphere to the Earth’ssurface.
6.3. Effects of the QBO on the Tropical TroposphereBecause the QBO has its maximum amplitude over
the equator, it is natural to inquire whether this oscilla-tion has any effect on the underlying tropical tropo-sphere. Here it is important to keep two things in mind.First, the zonal wind and temperature anomalies of theQBO do not penetrate significantly below the tropo-pause. The temperature QBO at the tropopause is smallrelative to the annual cycle. Second, it is known that thetropical troposphere has a quasi-biennial oscillation of
Figure 31. Difference in 1000-hPa geopotential height composites (meters) between westerly and easterlyQBO composites. December–February monthly-mean National Centers for Environmental Prediction datafor 1964–1996 were used.
220 ● Baldwin et al.: THE QUASI-BIENNIAL OSCILLATION 39, 2 / REVIEWS OF GEOPHYSICS
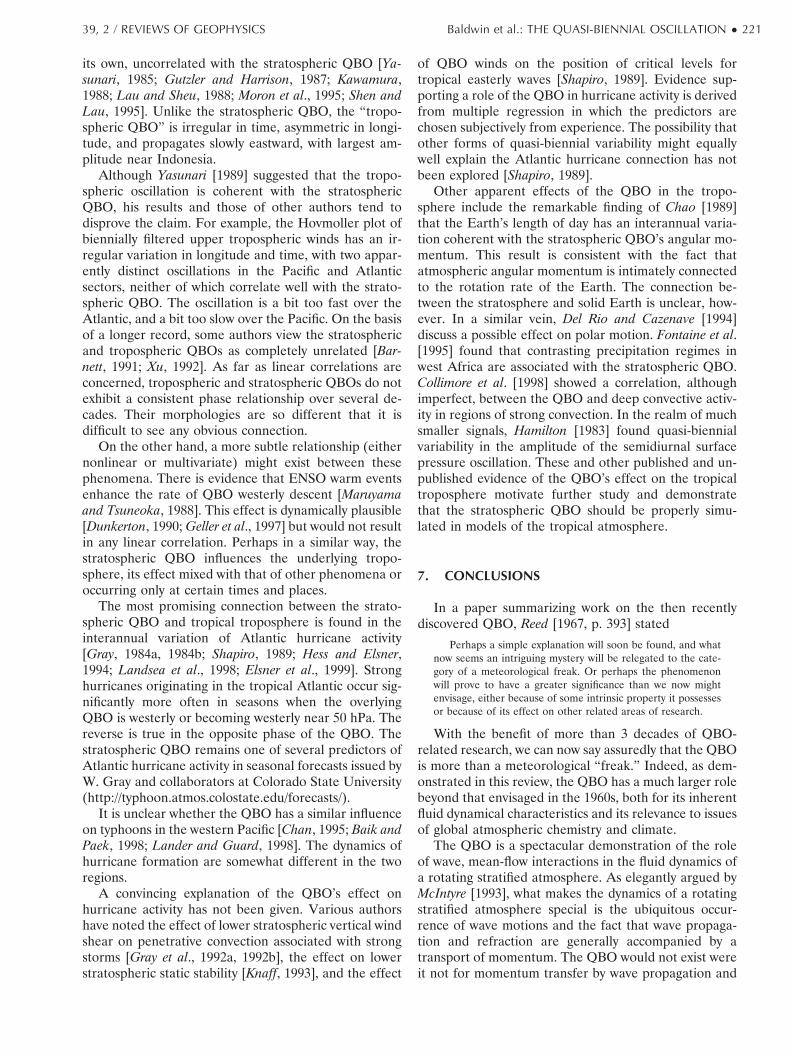
its own, uncorrelated with the stratospheric QBO [Ya-sunari, 1985; Gutzler and Harrison, 1987; Kawamura,1988; Lau and Sheu, 1988; Moron et al., 1995; Shen andLau, 1995]. Unlike the stratospheric QBO, the “tropo-spheric QBO” is irregular in time, asymmetric in longi-tude, and propagates slowly eastward, with largest am-plitude near Indonesia.
Although Yasunari [1989] suggested that the tropo-spheric oscillation is coherent with the stratosphericQBO, his results and those of other authors tend todisprove the claim. For example, the Hovmoller plot ofbiennially filtered upper tropospheric winds has an ir-regular variation in longitude and time, with two appar-ently distinct oscillations in the Pacific and Atlanticsectors, neither of which correlate well with the strato-spheric QBO. The oscillation is a bit too fast over theAtlantic, and a bit too slow over the Pacific. On the basisof a longer record, some authors view the stratosphericand tropospheric QBOs as completely unrelated [Bar-nett, 1991; Xu, 1992]. As far as linear correlations areconcerned, tropospheric and stratospheric QBOs do notexhibit a consistent phase relationship over several de-cades. Their morphologies are so different that it isdifficult to see any obvious connection.
On the other hand, a more subtle relationship (eithernonlinear or multivariate) might exist between thesephenomena. There is evidence that ENSO warm eventsenhance the rate of QBO westerly descent [Maruyamaand Tsuneoka, 1988]. This effect is dynamically plausible[Dunkerton, 1990; Geller et al., 1997] but would not resultin any linear correlation. Perhaps in a similar way, thestratospheric QBO influences the underlying tropo-sphere, its effect mixed with that of other phenomena oroccurring only at certain times and places.
The most promising connection between the strato-spheric QBO and tropical troposphere is found in theinterannual variation of Atlantic hurricane activity[Gray, 1984a, 1984b; Shapiro, 1989; Hess and Elsner,1994; Landsea et al., 1998; Elsner et al., 1999]. Stronghurricanes originating in the tropical Atlantic occur sig-nificantly more often in seasons when the overlyingQBO is westerly or becoming westerly near 50 hPa. Thereverse is true in the opposite phase of the QBO. Thestratospheric QBO remains one of several predictors ofAtlantic hurricane activity in seasonal forecasts issued byW. Gray and collaborators at Colorado State University(http://typhoon.atmos.colostate.edu/forecasts/).
It is unclear whether the QBO has a similar influenceon typhoons in the western Pacific [Chan, 1995; Baik andPaek, 1998; Lander and Guard, 1998]. The dynamics ofhurricane formation are somewhat different in the tworegions.
A convincing explanation of the QBO’s effect onhurricane activity has not been given. Various authorshave noted the effect of lower stratospheric vertical windshear on penetrative convection associated with strongstorms [Gray et al., 1992a, 1992b], the effect on lowerstratospheric static stability [Knaff, 1993], and the effect
of QBO winds on the position of critical levels fortropical easterly waves [Shapiro, 1989]. Evidence sup-porting a role of the QBO in hurricane activity is derivedfrom multiple regression in which the predictors arechosen subjectively from experience. The possibility thatother forms of quasi-biennial variability might equallywell explain the Atlantic hurricane connection has notbeen explored [Shapiro, 1989].
Other apparent effects of the QBO in the tropo-sphere include the remarkable finding of Chao [1989]that the Earth’s length of day has an interannual varia-tion coherent with the stratospheric QBO’s angular mo-mentum. This result is consistent with the fact thatatmospheric angular momentum is intimately connectedto the rotation rate of the Earth. The connection be-tween the stratosphere and solid Earth is unclear, how-ever. In a similar vein, Del Rio and Cazenave [1994]discuss a possible effect on polar motion. Fontaine et al.[1995] found that contrasting precipitation regimes inwest Africa are associated with the stratospheric QBO.Collimore et al. [1998] showed a correlation, althoughimperfect, between the QBO and deep convective activ-ity in regions of strong convection. In the realm of muchsmaller signals, Hamilton [1983] found quasi-biennialvariability in the amplitude of the semidiurnal surfacepressure oscillation. These and other published and un-published evidence of the QBO’s effect on the tropicaltroposphere motivate further study and demonstratethat the stratospheric QBO should be properly simu-lated in models of the tropical atmosphere.
7. CONCLUSIONS
In a paper summarizing work on the then recentlydiscovered QBO, Reed [1967, p. 393] stated
Perhaps a simple explanation will soon be found, and whatnow seems an intriguing mystery will be relegated to the cate-gory of a meteorological freak. Or perhaps the phenomenonwill prove to have a greater significance than we now mightenvisage, either because of some intrinsic property it possessesor because of its effect on other related areas of research.
With the benefit of more than 3 decades of QBO-related research, we can now say assuredly that the QBOis more than a meteorological “freak.” Indeed, as dem-onstrated in this review, the QBO has a much larger rolebeyond that envisaged in the 1960s, both for its inherentfluid dynamical characteristics and its relevance to issuesof global atmospheric chemistry and climate.
The QBO is a spectacular demonstration of the roleof wave, mean-flow interactions in the fluid dynamics ofa rotating stratified atmosphere. As elegantly argued byMcIntyre [1993], what makes the dynamics of a rotatingstratified atmosphere special is the ubiquitous occur-rence of wave motions and the fact that wave propaga-tion and refraction are generally accompanied by atransport of momentum. The QBO would not exist wereit not for momentum transfer by wave propagation and
39, 2 / REVIEWS OF GEOPHYSICS Baldwin et al.: THE QUASI-BIENNIAL OSCILLATION ● 221
refraction. The dependence of wave refraction on themean flow provides the mechanism whereby wave-in-duced momentum fluxes in the equatorial stratospherecan produce a feedback onto the mean flow. In theQBO, not only do the oscillating waves interact with themean flow to produce a flow rectification, but also therectified flow itself oscillates on a period completelydifferent from that of the driving waves.
Plate 1 shows that the QBO (which in the 1960s wasregarded by some as most likely a transient phenome-non) is a persistent feature of the circulation of theequatorial stratosphere. We have observed directly 20full cycles of the oscillation, and there is indirect evi-dence covering a much longer time. By study of long-term variations in the solar semidiurnal tidal signal insurface pressure at equatorial stations (which is sensitiveto the zonal winds in the stratosphere), Hamilton [1983]and Teitelbaum et al. [1995] argued that the QBO musthave existed for at least the past 120 years.
This robust nature of the QBO suggests that similarphenomena should be present on other planets withrotating stratified atmospheres and equatorial convec-tion zones. Indeed, an analogous oscillation, the quasi-quadrennial oscillation (QQO), has been documented inthe equatorial atmosphere of Jupiter [Leovy et al., 1991;Friedson, 1999]. The observed meridional scale of theQQO on Jupiter (;78) is about half that of the terres-trial QBO. For the parameters given by Friedson, this isconsistent with the transition scale discussed in section3.1, provided that the vertical scale of forcing is set at 12km, rather than the 4-km value appropriate for theterrestrial QBO. McIntyre [1994] suggested that a similaroscillation may occur in the solar interior.
The possibility of broader implications of the QBOfor other areas of research, as suggested by Reed [1967]in the above quotation, has certainly proved to be true.As discussed in section 6.2, the influence of the QBO oninterannual climate variations in the extratropical tropo-sphere and stratosphere is a major subject of currentinterest. Attempts to better understand and predicttrends and variability of atmospheric ozone require care-ful consideration of direct and indirect effects of theequatorial QBO on the ozone layer (see section 5). Thusmodels of interannual climate variability and of globalstratospheric chemistry both should include the effectsof the QBO either explicitly or through some parame-terization.
Unfortunately, simulation of the QBO remains agreat challenge for general circulation models. Suchmodels are currently being used for prediction of climatetrends and variability associated with human-inducedchanges in the concentrations of various greenhousegases. Yet, as discussed in section 3.3.2, many models areunable to spontaneously generate a realistic QBO. Theatmosphere, however, has no such difficulties. A skepticmight argue that the absence of such a robust global-scale dynamical phenomenon demonstrates that modelsare still far from reality. It would be more accurate to say
that the QBO places stringent requirements on a numer-ical model, requiring an accurate computationalmethod, fine spatial resolution, and low diffusion. Theneed for accurate parameterization of subgrid-scale mo-mentum fluxes is also clear.
The arguments presented above suggest that gravitywaves generated by equatorial convection are essentialto forcing of the QBO. This implies that among otherthings, better modeling of the dynamics of mesoscaleconvective systems, and the synoptic-scale tropical wavesin which these systems are embedded, is required ifGCMs are to routinely reproduce the fascinating wave,mean-flow feedback interactions that result in the equa-torial QBO.
GLOSSARY
b-plane: An approximation of the Coriolis param-eter in which f 5 f0 1 by, where beta is a constant. TheCoriolis parameter is assumed to vary linearly in thenorth-south direction.
Boussinesq limit: A simplification in which densityis treated as a constant except where it is coupled togravity in the buoyancy term of the vertical momentumequation.
Coriolis parameter f : Equal to 2V sin f, where V isthe rotation rate of the Earth and f is latitude.
Critical level or line: For a wave propagating on abackground flow, the location at which the phase speedof the wave in the flow direction is equal to the flowspeed. Waves tend to dissipate or break near such loca-tions.
Easterly: From the east.Eastward: To the east.Eliassen-Palm (EP) flux: A measure of the propaga-
tion of wave activity in the latitude-height plane [Elias-sen and Palm, 1961; Edmon et al., 1980]. The conver-gence of EP flux is a measure of the westward (oreasterly) force exerted by the waves on the zonal-meanflow.
Gravity waves: Oscillations usually of high fre-quency and short horizontal scale, relative to synoptic-scale motions, that arise in a stably stratified fluid whenparcels are displaced vertically.
Inertia-gravity waves: Low-frequency gravity wavesthat are substantially affected by the Coriolis force.
Kelvin waves: At the equator, eastward propagat-ing waves with negligible meridional velocity componentand Gaussian latitudinal structure in zonal velocity, geo-potential, and temperature, symmetric about the equator.
Log-pressure height: A vertical coordinate propor-tional to the logarithm of pressure, approximately equalto physical height.
Meridional plane: The latitude-height plane. Themean meridional circulation is the zonally averaged cir-culation in the meridional plane.
222 ● Baldwin et al.: THE QUASI-BIENNIAL OSCILLATION 39, 2 / REVIEWS OF GEOPHYSICS
Phase of the QBO: Easterly or westerly as definedby the equatorial winds at a specified level. Historically,the level has been chosen in the range 50–25 hPa.
Planetary-scale waves: Tropical or extratropicaldisturbances with low zonal wave number (1–3), forexample, equatorial Kelvin waves, or Rossby waves inthe winter stratosphere.
Planetary waves and planetary-wave breaking: Plan-etary waves are planetary-scale Rossby waves. In thewintertime stratosphere the polar vortex creates steepmeridional gradients of PV, surrounded by weak gradi-ents. Outside the vortex, there is overturning (in thelatitudinal direction) of PV contours by Rossby waves astheir amplitudes become large. This is a kind of “wavebreaking,” and the region where it takes place is there-fore referred to as the stratospheric “surf zone.” Thewave breaking results in long, drawn-out tongues of PVand irreversible mixing of PV to small scales.
Rossby waves: A generic term for waves that owetheir existence to latitudinal gradients of potential vor-ticity. Such gradients provide a restoring mechanism toallow propagation of the waves.
Rossby-gravity waves: Westward propagating waveswith Gaussian latitudinal structure in meridional velocitysymmetric about the equator. Zonal wind, temperature,and geopotential are antisymmetric.
Semiannual oscillation: Oscillation with a period ofapproximately 6 months.
Surf zone: See planetary-wave breaking.Waveguide: A region in which waves propagate
and are spatially confined by reflecting boundaries orinternal turning points. The propagation of planetarywaves is approximately analogous to the propagation oflight through a medium with a variable index of refrac-tion. For planetary Rossby waves the index of refractiondepends on the zonally averaged zonal wind, and verticalpropagation is allowed for waves propagating westwardrelative to the mean flow.
Westerly: From the west.Westward: To the west.Zonal: Longitudinal. By convention, the zonal wind
is positive when it is from the west.
ACKNOWLEDGMENTS. This review was the outgrowthof a workshop held in March 1998 in La Jolla, California,sponsored by the World Climate Research Program (WCRP)Stratospheric Processes and Their Role in Climate (SPARC)Initiative and NASA’s Atmospheric Chemistry Modeling andAnalysis Program (ACMAP). We thank Sandy Grant andSusan Ball for preparing the manuscript and Michael McIntyreand Charles McLandress for comments. The NCEP/NCARReanalysis data were provided by the NOAA-CIRES ClimateDiagnostics Center. The Singapore zonal wind data were pro-vided by Barbara Naujokat (Free University Berlin). M.P.B.and T.J.D. were supported by the Climate Dynamics andLarge-Scale Dynamic Meteorology Programs of the NSF, theNASA ACMAP and SR&T Programs, and the NOAA Officeof Global Programs. M.J.A. was supported by NSF’s Physical
Meteorology Program. W.J.R. was supported by NCAR (spon-sored by NSF) and NASA’s ACMAP and UARS Programs.
Jim Smith was the Editor responsible for this paper. He andthe authors thank two anonymous technical reviewers and oneanonymous cross-disciplinary reviewer.
REFERENCES
Alexander, M. J., and J. R. Holton, A model study of zonalforcing in the equatorial stratosphere by convectively in-duced gravity waves, J. Atmos. Sci., 54, 408–419, 1997.
Alexander, M. J., and L. Pfister, Gravity wave momentum fluxin the lower stratosphere over convection, Geophys. Res.Lett., 22, 2029–2032, 1995.
Alexander, M. J., J. R. Holton, and D. R. Durran, The gravitywave response above deep convection in a squall line sim-ulation, J. Atmos. Sci., 52, 2212–2226, 1995.
Alexander, M. J., J. Beres, and L. Pfister, Tropical strato-spheric gravity waves and cloud correlations, J. Geophys.Res., 105, 22,299–22,310, 2000.
Allen, S. J., and R. A. Vincent, Gravity wave activity in thelower atmosphere: Seasonal and latitudinal variations, J.Geophys. Res., 100, 1327–1350, 1995.
Andrews, D. G., and M. E. McIntyre, Planetary waves inhorizontal and vertical shear: The generalized Eliassen-Palm relation and the mean zonal acceleration, J. Atmos.Sci., 33, 2031–2048, 1976.
Andrews, D. G., J. R. Holton, and C. B. Leovy, Middle Atmo-sphere Dynamics, 489 pp., Academic, San Diego, Calif., 1987.
Angell, J. K., and J. Korshover, Quasi-biennial variations intemperature, total ozone, and tropopause height, J. Atmos.Sci., 21, 479–492, 1964.
Angell, J. K., and J. Korshover, Evidence for a quasi-biennialvariation in eccentricity of the North Polar vortex, J. Atmos.Sci., 32, 634–635, 1975.
Baik, J.-J., and J.-S. Paek, A climatology of sea surface tem-perature and the maximum intensity of western North Pacifictropical cyclones, J. Meteorol. Soc. Jpn., 76, 129–137, 1998.
Balachandran, N. K., and D. Rind, Modeling the effects of UVvariability and the QBO on the troposphere-stratospheresystem, part I, The middle atmosphere, J. Clim., 8, 2058–2079, 1995.
Baldwin, M. P., and T. J. Dunkerton, Quasi-biennial oscillationabove 10 mbar, Geophys. Res. Lett., 18, 1205–1208, 1991.
Baldwin, M. P., and T. J. Dunkerton, Biennial, quasi-biennial,and decadal oscillations of potential vorticity in the north-ern stratosphere, J. Geophys. Res., 103, 3919–3928, 1998a.
Baldwin, M. P., and T. J. Dunkerton, Quasi-biennial modula-tions of the Southern Hemisphere stratospheric polar vor-tex, Geophys. Res. Lett., 25, 3343–3346, 1998b.
Baldwin, M. P., and T. J. Dunkerton, Propagation of the ArcticOscillation from the stratosphere to the troposphere, J.Geophys. Res., 104, 30,937–30,946, 1999.
Baldwin, M. P., and D. O’Sullivan, Stratospheric effects ofENSO-related tropospheric circulation anomalies, J. Clim.,4, 649–667, 1995.
Baldwin, M. P., and K.-K. Tung, Extratropical QBO signals inangular momentum and wave forcing, Geophys. Res. Lett.,21, 2717–2720, 1994.
Baldwin, M. P., X. Cheng, and T. J. Dunkerton, Observedcorrelation between winter-mean tropospheric and strato-spheric circulation anomalies, Geophys. Res. Lett., 21, 1140–1144, 1994.
Barnett, T. P., The interaction of multiple time scales in thetropical climate system, J. Clim., 4, 269–285, 1991.
Barnston, A. G., and R. E. Livezey, A closer look at the effectof the 11-year solar cycle and the QBO on the Northern
39, 2 / REVIEWS OF GEOPHYSICS Baldwin et al.: THE QUASI-BIENNIAL OSCILLATION ● 223
Hemisphere 700 mb height and extratropical North Amer-ican surface temperature, J. Clim., 2, 1295–1313, 1987.
Belmont, A. D., and D. G. Dartt, Variation with longitude ofthe quasi-biennial oscillation, Mon. Weather Rev., 96, 767–777, 1968.
Bergman, J. W., and M. L. Salby, Equatorial wave activityderived from fluctuations in observed convection, J. Atmos.Sci., 51, 3791–3806, 1994.
Booker, J. R., and F. P. Bretherton, The critical layer forinternal gravity waves in a shear flow, J. Fluid Mech., 27,513–539, 1967.
Boville, B. A., The influence of the polar night jet on thetropospheric circulation in a GCM, J. Atmos. Sci., 41, 1132–1142, 1984.
Boville, B. A., Wave-mean flow interactions in a general cir-culation model of the troposphere and stratosphere, J.Atmos. Sci., 43, 1711–1725, 1986.
Boville, B. A., and W. J. Randel, Equatorial waves in a strato-spheric GCM: Effects of vertical resolution, J. Atmos. Sci.,49, 785–801, 1992.
Bowman, K. P., Global patterns of the quasi-biennial oscilla-tion in total ozone, J. Atmos. Sci., 46, 3328–3343, 1989.
Boyd, J. P., The effects of latitudinal shear on equatorialwaves, part 1, Theory and methods, J. Atmos. Sci., 35,2236–2258, 1978.
Bretherton, F. P., Momentum transport by gravity waves,Q. J. R. Meteorol. Soc., 95, 213–243, 1969.
Burrage, M. D., R. A. Vincent, H. G. Mayr, W. R. Skinner,N. F. Arnold, and P. B. Hays, Long-term variability of theequatorial middle atmosphere zonal wind, J. Geophys. Res.,101, 12,847–12,854, 1996.
Butchart, N., and J. Austin, On the relationship between thequasi-biennial oscillation, total chlorine and the severity ofthe Antarctic ozone hole, Q. J. R. Meteorol. Soc., 122,183–217, 1996.
Cadet, D., and H. Teitelbaum, Observational evidence of in-ternal inertia-gravity waves in the tropical stratosphere, J.Atmos. Sci., 36, 892–907, 1979.
Canziani, P. O., and J. R. Holton, Kelvin waves and thequasi-biennial oscillation: An observational analysis, J. Geo-phys. Res., 103, 31,509–31,521, 1998.
Canziani, P. O., J. R. Holton, E. Fishbein, and L. Froidevaux,Equatorial Kelvin wave variability during 1992 and 1993, J.Geophys. Res., 100, 5193–5202, 1995.
Chan, J. C. L., Tropical cyclone activity in the western NorthPacific in relation to the stratospheric quasi-biennial oscil-lation, Mon. Weather Rev., 123, 2567–2571, 1995.
Chao, B. F., Length-of-day variations caused by El Nino–Southern Oscillation and quasi-biennial oscillation, Science,243, 923–926, 1989.
Charney, J. G., and P. G. Drazin, Propagation of planetary-scale disturbances from the lower into the upper atmo-sphere, J. Geophys. Res., 66, 83–109, 1961.
Chen, P., The influences of zonal flow on wave breaking andtropical-extratropical interaction in the lower stratosphere,J. Atmos. Sci., 53, 2379–2392, 1996.
Chipperfield, M. P., and L. J. Gray, Two-dimensional modelstudies of interannual variability of trace gases in the middleatmosphere, J. Geophys. Res., 97, 5963–5980, 1992.
Chipperfield, M. P., L. J. Gray, J. S. Kinnersley, and J.Zawodny, A two-dimensional model study of the QBOsignal in SAGE II NO2 and O3, Geophys. Res. Lett., 21,589–592, 1994.
Choi, W., W. B. Grant, J. H. Park, K.-M. Lee, H. Lee, andJ. M. Russell III, Role of the quasi-biennial oscillation inthe transport of aerosols from the tropical stratospherereservoir to midlatitudes, J. Geophys. Res., 103, 6033–6042,1998.
Collimore, C. C., M. H. Hitchman, and D. W. Martin, Is there
a quasi-biennial oscillation in tropical deep convection?,Geophys. Res. Lett., 25, 333–336, 1998.
Cornish, C. R., and M. F. Larsen, A review of synoptic scalewave perturbations in the equatorial stratosphere, J. Atmos.Terr. Phys., 47, 769–780, 1985.
Dameris, M., and A. Ebel, The quasi-biennial oscillation andmajor stratospheric warmings: A three-dimensional modelstudy, Ann. Geophys., 8, 79–85, 1990.
Del Rio, R. A., and A. Cazenave, Interannual variations in theEarth’s polar motion for 1963–1991: Comparison with at-mospheric angular momentum over 1980–1991, Geophys.Res. Lett., 21, 2361–2364, 1994.
Dunkerton, T. J., The evolution of latitudinal shear in Rossby-gravity wave, mean flow interaction, J. Geophys. Res., 88,3836–3842, 1983a.
Dunkerton, T. J., Laterally-propagating Rossby waves in theeasterly acceleration phase of the quasi-biennial oscillation,Atmos. Ocean, 21, 55–68, 1983b.
Dunkerton, T. J., A two-dimensional model of the quasi-biennial oscillation, J. Atmos. Sci., 42, 1151–1160, 1985.
Dunkerton, T. J., Annual variation of deseasonalized meanflow acceleration in the equatorial lower stratosphere, J.Meteorol. Soc. Jpn., 68, 499–508, 1990.
Dunkerton, T. J., Nonlinear propagation of zonal winds in anatmosphere with Newtonian cooling and equatorialwavedriving, J. Atmos. Sci., 48, 236–263, 1991a.
Dunkerton, T. J., Intensity variation and coherence of 3- to6-day equatorial waves, Geophys. Res. Lett., 18, 1469–1472,1991b.
Dunkerton, T. J., Observation of 3–6 day meridional windoscillations over the tropical Pacific, 1973–1992: Verticalstructure and interannual variability, J. Atmos. Sci., 50,3292–3307, 1993.
Dunkerton, T. J., Horizontal buoyancy flux of internal gravitywaves in vertical shear, J. Meteorol. Soc. Jpn., 73, 747–755,1995.
Dunkerton, T. J., The role of gravity waves in the quasi-biennial oscillation, J. Geophys. Res., 102, 26,053–26,076,1997.
Dunkerton, T. J., Quasi-biennial and subbiennial variations ofstratospheric trace constituents derived from HALOE ob-servations, J. Atmos. Sci., 58, 7–25, 2001.
Dunkerton, T. J., and M. P. Baldwin, Quasi-biennial modula-tion of planetary-wave fluxes in the Northern Hemispherewinter, J. Atmos. Sci., 48, 1043–1061, 1991.
Dunkerton, T. J., and M. P. Baldwin, Modes of interannualvariability in the stratosphere, Geophys. Res. Lett., 19, 49–51, 1992.
Dunkerton, T. J., and D. P. Delisi, Climatology of the equa-torial lower stratosphere, J. Atmos. Sci., 42, 376–396, 1985.
Dunkerton, T. J., and D. J. O’Sullivan, Mixing zone in thetropical stratosphere above 10 mbar, Geophys. Res. Lett., 23,2497–2500, 1996.
Ebdon, R. A., Notes on the wind flow at 50 mb in tropical andsubtropical regions in January 1957 and in 1958, Q. J. R.Meteorol. Soc., 86, 540–542, 1960.
Ebdon, R. A., and R. G. Veryard, Fluctuations in equatorialstratospheric winds, Nature, 189, 791–793, 1961.
Edmon, H. J., B. J. Hoskins, and M. E. McIntyre, Eliassen-Palm cross sections for the troposphere, J. Atmos. Sci., 37,2600–2616, 1980.
Eliassen, A., and E. E. Palm, On the transport of energy instationary mountain waves, Geophys. Publ., 22, 1–23, 1961.
Elsner, J. B., A. B. Kara, and M. A. Owens, Fluctuations inNorth Atlantic hurricane frequency, J. Clim., 12, 427–437,1999.
Fontaine, B., S. Janicot, and V. Moron, Rainfall anomalypatterns and wind field signals over west Africa in August,J. Clim., 8, 1503–1510, 1995.
224 ● Baldwin et al.: THE QUASI-BIENNIAL OSCILLATION 39, 2 / REVIEWS OF GEOPHYSICS
Fovell, R., D. Durran, and J. R. Holton, Numerical simulationsof convectively generated stratospheric gravity waves, J.Atmos. Sci., 49, 1427–1442, 1992.
Friedson, A. J., New observations and modelling of a QBO-like oscillation in Jupiter’s stratosphere, Icarus, 137, 34–55,1999.
Funk, J. P., and G. L. Garnham, Australian ozone observationsand a suggested 24 month cycle, Tellus, 14, 378–382, 1962.
Garcia, R. R., On the mean meridional circulation of themiddle atmosphere, J. Atmos. Sci., 41, 2113–2125, 1987.
Garcia, R. R., and S. Solomon, A possible relationship be-tween interannual variability in Antarctic ozone and thequasi-biennial oscillation, Geophys. Res. Lett., 14, 848–851,1987.
Garcia, R. R., T. J. Dunkerton, R. S. Lieberman, and R. A.Vincent, Climatology of the semiannual oscillation in thetropical middle atmosphere, J. Geophys. Res., 102, 26,019–26,032, 1997.
Geller, M. A., W. Shen, M. Zhang, and W.-W. Tan, Calcula-tions of the stratospheric quasi-biennial oscillation for time-varying wave forcing, J. Atmos. Sci., 54, 883–894, 1997.
Grant, W. B., E. V. Browell, C. S. Long, L. L. Stowe, R. G.Grainger, and A. Lambert, Use of volcanic aerosols to studythe tropical stratospheric reservoir, J. Geophys. Res., 101,3973–3988, 1996.
Gray, L. J., A model study of the influence of the quasi-biennial oscillation on trace gas distributions in the middleand upper stratosphere, J. Geophys. Res., 105, 4539–4551,2000.
Gray, L. J., and M. P. Chipperfield, On the interannual vari-ability of trace gases in the middle atmosphere, Geophys.Res. Lett., 17, 933–936, 1990.
Gray, L. J., and T. J. Dunkerton, The role of the seasonal cyclein the quasi-biennial oscillation of ozone, J. Atmos. Sci., 47,2429–2451, 1990.
Gray, L. J., and J. A. Pyle, The semi-annual oscillation andequatorial tracer distributions, Q. J. R. Meteorol. Soc., 112,387–407, 1986.
Gray, L. J., and J. A. Pyle, A two-dimensional model of thequasi-biennial oscillation in ozone, J. Atmos. Sci., 46, 203–220, 1989.
Gray, L. J., and J. M. Russell III, Interannual variability oftrace gases in the subtropical winter stratosphere, J. Atmos.Sci., 56, 977–993, 1999.
Gray, L. J., and S. L. Ruth, The modeled latitudinal distribu-tion of the ozone quasi-biennial oscillation using observedequatorial winds, J. Atmos. Sci., 50, 1033–1046, 1993.
Gray, L. J., S. J. Phipps, T. J. Dunkerton, M. P. Baldwin, E. F.Drysdale, and M. R. Allen, A data study of the influence ofthe upper stratosphere on Northern Hemisphere strato-spheric sudden warmings, Q. J. R. Meteorol. Soc., in press,2001.
Gray, W. M., Atlantic seasonal hurricane frequency, part I, ElNino and 30 mb quasi-biennial oscillation influences, Mon.Weather Rev., 112, 1649–1668, 1984a.
Gray, W. M., Atlantic seasonal hurricane frequency, part II,Forecasting its variability, Mon. Weather Rev., 112, 1669–1683, 1984b.
Gray, W. M., J. D. Sheaffer, and J. A. Knaff, Hypothesizedmechanism for stratospheric QBO influence on ENSO vari-ability, Geophys. Res. Lett., 19, 107–110, 1992a.
Gray, W. M., J. D. Sheaffer, and J. A. Knaff, Influence of thestratospheric QBO on ENSO variability, J. Meteorol. Soc.Jpn., 70, 975–995, 1992b.
Graystone, P., Meteorological office discussion—Tropical me-teorology, Meteorol. Mag., 88, 113–119, 1959.
Gutzler, D. S., and D. E. Harrison, The structure and evolutionof seasonal wind anomalies over the near-equatorial east-
ern Indian and western Pacific oceans, Mon. Weather Rev.,115, 169–192, 1987.
Haigh, J. D., The role of stratospheric ozone in modulating thesolar radiative forcing of climate, Nature, 370, 544–546,1994.
Haigh, J. D., The impact of solar variability on climate, Science,272, 981–984, 1996.
Haigh, J. D., A GCM study of climate change in response tothe annual 11-year solar cycle, Q. J. R. Meteorol. Soc., 125,817–892, 1999.
Hamilton, K., The vertical structure of the quasi-biennial os-cillation: Observations and theory, Atmos. Ocean, 19, 236–250, 1981.
Hamilton, K., Quasi-biennial and other long-period variationsin the solar semidiurnal barometric oscillation: Observa-tions, theory and possible application to the problem ofmonitoring changes in global ozone, J. Atmos. Sci., 40,2432–2443, 1983.
Hamilton, K., Mean wind evolution through the quasi-biennialcycle of the tropical lower stratosphere, J. Atmos. Sci., 41,2113–2125, 1984.
Hamilton, K., Interhemispheric asymmetry and annual syn-chronization of the ozone quasi-biennial oscillation, J. At-mos. Sci., 46, 1019–1025, 1989.
Hamilton, K., An examination of observed Southern Oscilla-tion effects in the Northern Hemisphere stratosphere, J.Atmos. Sci., 50, 3468–3473, 1993.
Hamilton, K., Interannual variability in the Northern Hemi-sphere winter middle atmosphere in control and perturbedexperiments with the GFDL SKYHI general circulationmodel, J. Atmos. Sci., 52, 44–66, 1995.
Hamilton, K., Observations of tropical stratospheric windsbefore World War II, Bull. Am. Meteorol. Soc., 79, 1367–1371, 1998a.
Hamilton, K., Effects of an imposed quasi-biennial oscillationin a comprehensive troposphere-stratosphere-mesospheregeneral circulation model, J. Atmos. Sci., 55, 2393–2418,1998b.
Hamilton, K., R. J. Wilson, and R. Hemler, Middle atmo-sphere simulated with high vertical and horizontal resolu-tion versions of a GCM: Improvement in the cold pole biasand generation of a QBO-like oscillation in the tropics, J.Atmos. Sci., 56, 3829–3846, 1999.
Hasebe, F., Quasi-biennial oscillations of ozone and diabaticcirculation in the equatorial stratosphere, J. Atmos. Sci., 51,729–745, 1994.
Hayashi, Y., and D. G. Golder, Kelvin and mixed Rossby-gravity waves appearing in the GFDL “SKYHI” generalcirculation model and the FGGE data set: Implications fortheir generation mechanism and role in the QBO, J. Me-teorol. Soc. Jpn., 72, 901–935, 1994.
Haynes, P. H., The latitudinal structure of the quasi-biennialoscillation, Q. J. R. Meteorol. Soc., 124, 2645–2670, 1998.
Hess, J. C., and J. B. Elsner, Extended-range hindcasts oftropical-origin Atlantic hurricane activity, Geophys. Res.Lett., 21, 365–368, 1994.
Hess, P. G., and D. O’Sullivan, A three-dimensional modelingstudy of the extratropical quasi-biennial oscillation inozone, J. Atmos. Sci., 52, 1539–1554, 1995.
Hilsenrath, E., and B. M. Schlesinger, Total ozone seasonaland interannual variations derived from the 7-year Nimbus4 BUV data set, J. Geophys. Res., 86, 12,087–12,096, 1981.
Hines, C. O., Doppler-spread parameterization of gravity wavemomentum deposition in the middle atmosphere, 2, Broadand quasi-monochromatic spectra, and implementation, J.Atmos. Terr. Phys., 59, 387–400, 1997.
Hirota, I., Equatorial waves in the upper stratosphere andmesosphere in relation to the semiannual oscillation of thezonal wind, J. Atmos. Sci., 35, 714–722, 1978.
39, 2 / REVIEWS OF GEOPHYSICS Baldwin et al.: THE QUASI-BIENNIAL OSCILLATION ● 225
Hitchman, M. H., C. B. Leovy, J. C. Gille, and P. L. Bailey,Quasi-stationary asymmetric circulations in the equatoriallower mesosphere, J. Atmos. Sci., 44, 2219–2236, 1987.
Hitchman, M. H., M. McKay, and C. R. Trepte, A climatologyof stratospheric aerosol, J. Geophys. Res., 99, 20,689–20,700,1994.
Holton, J. R., The Dynamic Meteorology of the Stratosphere andMesosphere, 319 pp., Am. Meteorol. Soc., Boston, Mass., 1975.
Holton, J. R., Influence of the annual cycle in meridionaltransport on the quasi-biennial oscillation in total ozone, J.Atmos. Sci., 46, 1434–1439, 1989.
Holton, J. R., and J. Austin, The influence of the QBO on suddenstratospheric warmings, J. Atmos. Sci., 48, 607–618, 1991.
Holton, J. R., and R. S. Lindzen, An updated theory for thequasi-biennial cycle of the tropical stratosphere, J. Atmos.Sci., 29, 1076–1080, 1972.
Holton, J. R., and H.-C. Tan, The influence of the equatorialquasi-biennial oscillation on the global circulation at 50 mb,J. Atmos. Sci., 37, 2200–2208, 1980.
Holton, J. R., and H.-C. Tan, The quasi-biennial oscillation inthe Northern Hemisphere lower stratosphere, J. Meteorol.Soc. Jpn., 60, 140–148, 1982.
Holton, J. R., P. H. Haynes, M. E. McIntyre, A. R. Douglass,R. B. Hood, and L. Pfister, Stratosphere-troposphere ex-change, Rev. Geophys., 33, 403–439, 1995.
Horinouchi, T., and S. Yoden, Excitation of transient waves bylocalized episode heating in the tropics and their propaga-tion in the middle atmosphere, J. Meteorol. Soc. Jpn., 74,189–210, 1996.
Horinouchi, T., and S. Yoden, Wave-mean flow interactionassociated with a QBO-like oscillation simulated in a sim-plified GCM, J. Atmos. Sci., 55, 502–526, 1998.
Huang, T. Y. W., The impact of solar radiation on the quasi-biennial oscillation of ozone in the tropical stratosphere,Geophys. Res. Lett., 23, 3211–3214, 1996.
Jones, D. B. A., H. R. Schneider, and M. B. McElroy, Effectsof the quasi-biennial oscillation on the zonally averaged trans-port of tracers, J. Geophys. Res., 103, 11,235–11,249, 1998.
Karoly, D. J., G. L. Roff, and M. J. Reeder, Gravity waveactivity associated with tropical convection detected inTOGA COARE sounding data, Geophys. Res. Lett., 23,261–264, 1996.
Kawamoto, N., M. Shiotani, and J. C. Gille, Equatorial Kelvinwaves and corresponding tracer oscillations in the lowerstratosphere as seen in LIMS data, J. Meteorol. Soc. Jpn., 75,763–773, 1997.
Kawamura, R., Quasi-biennial oscillation modes appearing inthe tropical sea water temperature and 700 mb zonal wind,J. Meteorol. Soc. Jpn., 66, 955–965, 1988.
Kennaugh, R., S. Ruth, and L. J. Gray, Modeling quasi-bien-nial variability in the semiannual double peak, J. Geophys.Res., 102, 16,169–16,187, 1997.
Kinnersley, J. S., On the seasonal asymmetry of the lower andmiddle latitude QBO circulation anomaly, J. Atmos. Sci., 56,1942–1962, 1999.
Kinnersley, J. S., and S. Pawson, The descent rates of the shearzones of the equatorial QBO, J. Atmos. Sci., 53, 1937–1949,1996.
Kinnersley, J. S., and K. K. Tung, Modeling the global inter-annual variability of ozone due to the equatorial QBO andto extratropical planetary wave variability, J. Geophys. Res.,94, 11,559–11,571, 1998.
Knaff, J. A., Evidence of a stratospheric QBO modulation oftropical convection, Pap. 520, 91 pp., Dep. of Atmos. Sci.,Colo. State Univ., Fort Collins, 1993.
Kodera, K., K. Yamazaki, M. Chiba, and K. Shibata, Down-ward propagation of upper stratospheric mean zonal windperturbation to the troposphere, Geophys. Res. Lett., 17,1263–1266, 1990.
Labitzke, K., Sunspots, the QBO, and the stratospheric tem-perature in the North Polar region, Geophys. Res. Lett., 14,535–537, 1987.
Labitzke, K., and H. van Loon, Association between the 11-year solar cycle, the QBO and the atmosphere, part I, Thetroposphere and stratosphere in the Northern Hemispherein winter, J. Atmos. Terr. Phys., 50, 197–206, 1988.
Labitzke, K., and H. van Loon, The Stratosphere, 179 pp.,Springer-Verlag, New York, 1999.
Lait, L. R., M. R. Schoeberl, and P. A. Newman, Quasi-biennial modulation of the Antarctic ozone depletion, J.Geophys. Res., 94, 11,559–11,571, 1989.
Lander, M. A., and C. P. Guard, A look at global tropicalcyclone activity during 1995: Contrasting high Atlantic ac-tivity with low activity in other basins, Mon. Weather Rev.,126, 1163–1173, 1998.
Landsea, C. W., G. D. Bell, W. M. Gray, and S. B. Goldenberg,The extremely active 1995 Atlantic hurricane season: Envi-ronmental conditions and verification of seasonal forecasts,Mon. Weather Rev., 126, 1174–1193, 1998.
Larsen, M. F., W. E. Schwartz, and R. F. Woodman, Gravitywave generation by thunderstorms observed with a verti-cally pointing 430-MHz radar, Geophys. Res. Lett., 9, 571–574, 1982.
Lau, K.-M., and P. J. Sheu, Annual cycle, quasi-biennial oscil-lation, and Southern Oscillation in global precipitation, J.Geophys. Res., 93, 10,975–10,988, 1988.
Leovy, C. B., A. J. Friedson, and G. S. Orton, The quasi-quadrennial oscillation of Jupiter’s equatorial stratosphere,Nature, 354, 380–382, 1991.
Li, D., K. P. Shine, and L. J. Gray, The role of ozone-induceddiabatic heating anomalies in the quasi-biennial oscillation,Q. J. R. Meteorol. Soc., 121, 937–943, 1995.
Li, X., P. L. Read, and D. G. Andrews, Mode selection, wavebreaking and parametric sensitivity in the quasi-biennialoscillation, Q. J. R. Meteorol. Soc., 123, 2041–2068, 1997.
Lindzen, R. S., On the development of the theory of the QBO,Bull. Am. Meteorol. Soc., 68, 329–337, 1987.
Lindzen, R. S., and J. R. Holton, A theory of the quasi-biennialoscillation, J. Atmos. Sci., 25, 1095–1107, 1968.
Ling, X.-D., and J. London, The quasi-biennial oscillation ofozone in the tropical middle stratosphere: A one-dimen-sional model, J. Atmos. Sci., 43, 3122–3136, 1986.
Luo, M., J. M. Russell III, and T. Y. W. Huang, HalogenOccultation Experiment observations of the quasi-biennialoscillation and the effects of Pinatubo aerosols in the trop-ical stratosphere, J. Geophys. Res., 102, 19,187–19,198, 1997.
Mancini, E., G. Visconti, G. Pitari, and M. Verdecchia, Anestimate of the Antarctic ozone modulation by the QBO,Geophys. Res. Lett., 18, 175–178, 1991.
Maruyama, T., Large-scale disturbances in the equatoriallower stratosphere, J. Meteorol. Soc. Jpn., 45, 196–199, 1967.
Maruyama, T., Annual and QBO-synchronized variations oflower-stratospheric equatorial wave activity over Singaporeduring 1961–1989, J. Meteorol. Soc. Jpn., 69, 219–232, 1991.
Maruyama, T., Upward transport of westerly momentum dueto disturbances of the equatorial lower stratosphere in theperiod range of about 2 days—Singapore data analysis for1983–1993, J. Meteorol. Soc. Jpn., 72, 423–432, 1994.
Maruyama, T., The quasi-biennial oscillation (QBO) andequatorial waves—A historical review, Pap. Meteorol. Geo-phys., 48, 1–17, 1997.
Maruyama, T., and Y. Tsuneoka, Anomalously short durationof the easterly wind phase of QBO at 50 hPa in 1987 and itsrelation with an El Nino event, J. Meteorol. Soc. Jpn., 69,219–232, 1988.
Matsuno, T., Quasi-geostrophic motions in the equatorial area,J. Meteorol. Soc. Jpn., 44, 25–43, 1966.
Mayr, H. G., J. G. Mengel, C. O. Hines, K. L. Chan, N. F.
226 ● Baldwin et al.: THE QUASI-BIENNIAL OSCILLATION 39, 2 / REVIEWS OF GEOPHYSICS
Arnold, C. A. Reddy, and H. S. Porter, The gravity waveDoppler spread theory applied in a numerical spectralmodel of the middle atmosphere, 2, Equatorial oscillations,J. Geophys. Res., 102, 26,093–26,105, 1997.
McIntyre, M. E., On the role of wave propagation and wavebreaking in atmosphere-ocean dynamics, in Theoretical andApplied Mechanics 1992, Proceedings of the XVIII Interna-tional Congress on Theoretical and Applied Mechanics, ed-ited by S. R. Bodner et al., pp. 281–304, Elsevier Sci., NewYork, 1993.
McIntyre, M. E., The quasi-biennial oscillation (QBO): Somepoints about the terrestrial QBO and the possibility ofrelated phenomena in the solar interior, in The Solar Engineand Its Influence on the Terrestrial Atmosphere and Climate,edited by E. Nesme-Ribes, pp. 293–320, Springer-Verlag,New York, 1994.
McIntyre, M. E., and T. N. Palmer, Breaking planetary wavesin the stratosphere, Nature, 305, 593–600, 1983.
McIntyre, M. E., and T. N. Palmer, The “surf zone” in thestratosphere, J. Atmos. Terr. Phys., 46, 825–849, 1984.
Mengel, J. G., H. G. Mayr, K. L. Chan, C. O. Hines, C. A.Reddy, N. F. Arnold, and H. S. Porter, Equatorial oscilla-tions in the middle atmosphere generated by small-scalegravity waves, Geophys. Res. Lett., 22, 3027–3030, 1995.
Moron, V., B. Fontaine, and P. Roucou, Global equatorialvariability of 850- and 200-hPa zonal winds from rawin-sondes between 1963 and 1989, Geophys. Res. Lett., 22,1701–1704, 1995.
Mote, P. W., K. H. Rosenlof, M. E. McIntyre, E. S. Carr, J. C.Gille, J. R. Holton, J. S. Kinnersley, H. C. Pumphrey, J. M.Russell, and J. W. Waters, An atmospheric tape recorder:The imprint of tropical tropopause temperatures on strato-spheric water vapor, J. Geophys. Res., 101, 3989–4006, 1996.
Mote, P. W., T. J. Dunkerton, and H. C. Pumphrey, Subsea-sonal variations in lower stratospheric water vapor, Geo-phys. Res. Lett., 25, 2445–2448, 1998.
Nagashima, T., M. Takahashi, and F. Hasebe, The first simu-lation of an ozone QBO in a general circulation model,Geophys. Res. Lett., 25, 3131–3134, 1998.
Naito, Y., and I. Hirota, Interannual variability of the northernwinter stratospheric circulation related to the QBO and thesolar cycle, J. Meteorol. Soc. Jpn., 75, 925–937, 1997.
Naujokat, B., An update of the observed quasi-biennial oscil-lation of the stratospheric winds over the tropics, J. Atmos.Sci., 43, 1873–1877, 1986.
Nigam, S., On the structure of variability of the observedtropospheric and stratospheric zonal-mean wind, J. Atmos.Sci., 47, 1799–1813, 1990.
Niwano, M., and M. Takahashi, Notes and correspondence:The influence of the equatorial QBO on the NorthernHemisphere winter circulation of a GCM, J. Meteorol. Soc.Jpn., 76, 453–461, 1998.
Oltmans, S. J., and J. London, The quasi-biennial oscillation inatmospheric ozone, J. Geophys. Res., 87, 8981–8989, 1982.
Ortland, D. A., Rossby wave propagation into the tropicalstratosphere observed by the High Resolution DopplerImager, Geophys. Res. Lett., 24, 1999–2002, 1997.
O’Sullivan, D., Interaction of extratropical Rossby waves withwesterly quasi-biennial oscillation winds, J. Geophys. Res.,102, 19,461–19,469, 1997.
O’Sullivan, D., and P. Chen, Modeling the QBO’s influence onisentropic tracer transport in the subtropics, J. Geophys.Res., 101, 6811–6821, 1996.
O’Sullivan, D., and T. J. Dunkerton, Seasonal development ofthe extratropical QBO in a numerical model of the middleatmosphere, J. Atmos. Sci., 51, 3706–3721, 1994.
O’Sullivan, D., and T. J. Dunkerton, The influence of thequasi-biennial oscillation on global constituent distribu-tions, J. Geophys. Res., 102, 21,731–21,743, 1997.
O’Sullivan, D., and M. L. Salby, Coupling of the quasi-biennialoscillation and the extratropical circulation in the strato-sphere through planetary wave transport, J. Atmos. Sci., 47,650–673, 1990.
O’Sullivan, D., and R. E. Young, Modeling the quasi-biennialoscillation’s effect on the winter stratospheric circulation, J.Atmos. Sci., 49, 2437–2448, 1992.
Palmer, C. E., The general circulation between 200 mb and 10mb over the equatorial Pacific, Weather, 9, 3541–3549, 1954.
Pawson, S., and M. Fiorino, A comparison of reanalyses in thetropical stratosphere, part 1, Thermal structure and theannual cycle, Clim. Dyn., 14, 631–644, 1998.
Pawson, S., K. Labitzke, R. Lenschow, B. Naujokat, B. Rajew-ski, M. Wiesner, and R.-C. Wohlfart, Climatology of theNorthern Hemisphere stratosphere derived from Berlinanalyses, part 1, Monthly means, technical report, Ser. A,7(3), Freie Univ. Berlin, 1993.
Pfister, L., W. Starr, R. Craig, M. Loewenstein, and M. Legg,Small-scale motions observed by aircraft in the tropicallower stratosphere: Evidence for mixing and its relationshipto large scale flows, J. Atmos. Sci., 43, 3210–3225, 1986.
Pfister, L., S. Scott, M. Loewenstein, S. Bowen, and M. Legg,Mesoscale disturbances in the tropical stratosphere excitedby convection: Observations and effects on the strato-spheric momentum budget, J. Atmos. Sci., 50, 1058–1075,1993a.
Pfister, L., K. R. Chan, T. P. Bui, S. Bowen, M. Legg, B. Gary,K. Kelly, M. Proffitt, and W. Starr, Gravity waves generatedby a tropical cyclone during the STEP tropical field pro-gram: A case study, J. Geophys. Res., 98, 8611–8638, 1993b.
Plumb, R. A., The interaction of two internal waves with themean flow: Implications for the theory of the quasi-biennialoscillation, J. Atmos. Sci., 34, 1847–1858, 1977.
Plumb, R. A., Zonally symmetric Hough modes and meridi-onal circulations in the middle atmosphere, J. Atmos. Sci.,39, 983–991, 1982.
Plumb, R. A., The quasi-biennial oscillation, in Dynamics of theMiddle Atmosphere, edited by J. R. Holton and T. Matsuno,pp. 217–251, Terra Sci., Tokyo, 1984.
Plumb, R. A., and R. C. Bell, Equatorial waves in steady zonalshear flow, Q. J. R. Meteorol. Soc., 108, 313–334, 1982a.
Plumb, R. A., and R. C. Bell, A model of the quasi-biennialoscillation on an equatorial beta-plane, Q. J. R. Meteorol.Soc., 108, 335–352, 1982b.
Plumb, R. A., and A. D. McEwan, The instability of a forcedstanding wave in a viscous stratified fluid: A laboratoryanalogue of the quasi-biennial oscillation, J. Atmos. Sci., 35,1827–1839, 1978.
Politowicz, P. A., and M. H. Hitchman, Exploring the effects offorcing the quasi-biennial oscillation in a two-dimensionalmodel, J. Geophys. Res., 102, 16,481–16,497, 1997.
Poole, L. R., S. Solomon, M. P. McCormick, and M. C. Pitts,The interannual variability of polar stratospheric clouds andrelated parameters in Antarctica during September andOctober, Geophys. Res. Lett., 16, 1157–1160, 1989.
Ramanathan, K. R., Bi-annual variation of atmospheric ozoneover the tropics, Q. J. R. Meteorol. Soc., 89, 540–542, 1963.
Randel, W. J., The evaluation of winds from geopotentialheight data in the stratosphere, J. Atmos. Sci., 44, 3097–3120, 1987.
Randel, W. J., Kelvin wave induced trace constituent oscilla-tions in the equatorial stratosphere, J. Geophys. Res., 95,18,641–18,652, 1990.
Randel, W. J., and J. B. Cobb, Coherent variations of monthlymean column ozone and lower stratospheric temperature, J.Geophys. Res., 99, 5433–5447, 1994.
Randel, W. J., and F. Wu, Isolation of the ozone QBO inSAGE II data by singular decomposition, J. Atmos. Sci., 53,2546–2559, 1996.
39, 2 / REVIEWS OF GEOPHYSICS Baldwin et al.: THE QUASI-BIENNIAL OSCILLATION ● 227
Randel, W. J., F. Wu, J. M. Russel III, A. Roche, and J.Waters, Seasonal cycles and QBO variations in strato-spheric CH4 and H2O observed in UARS HALOE data, J.Atmos. Sci., 55, 163–185, 1998.
Randel, W. J., F. Wu, R. Swinbank, J. Nash, and A. O’Neill,Global QBO circulation derived from UKMO stratosphericanalyses, J. Atmos. Sci., 56, 457–474, 1999.
Reed, R. J., A tentative model of the 26-month oscillation intropical latitudes, Q. J. R. Meteorol. Soc., 90, 441–466, 1964.
Reed, R. J., The structure and dynamics of the 26-monthoscillation, in Proceedings of the International Symposium onthe Dynamics of Large-Scale Processes in the Atmosphere, pp.376–387, Russ. Acad. of Sci., Moscow, 1967.
Reed, R. J., W. J. Campbell, L. A. Rasmussen, and R. G. Rogers,Evidence of a downward propagating annual wind reversal inthe equatorial stratosphere, J. Geophys. Res., 66, 813–818, 1961.
Reid, G. C., and K. S. Gage, Interannual variations in theheight of the tropical tropopause, J. Geophys. Res., 90,5629–5635, 1985.
Rind, D., and N. K. Balachandran, Modeling the effects of UVvariability and the QBO on the troposphere-stratosphere sys-tem, part II, The troposphere, J. Clim., 8, 2080–2095, 1995.
Robinson, W., The application of quasi-geostrophic Eliassen-Palm flux to the analysis of stratospheric data, J. Atmos. Sci.,43, 1017–1023, 1986.
Rottger, J., Structure and dynamics of the stratosphere andmesosphere revealed by VHF radar investigations, PureAppl. Geophys., 118, 494–527, 1980.
Rottman, G., Solar ultraviolet irradiance and its temporalvariability, J. Atmos. Sol. Terr. Phys., 61, 37–44, 1999.
Ruth, S., R. Kennaugh, L. J. Gray, and J. M. Russell III,Seasonal, semiannual, and interannual variability seen inmeasurements of methane made by the UARS HalogenOccultation Experiment, J. Geophys. Res., 102, 16,189–16,199, 1997.
Salby, M., and P. Callaghan, Connection between the solar cycleand the QBO: The missing link, J. Clim., 13, 2652–2662, 2000.
Salby, M., and D. Shea, Correlations between solar activity andthe atmosphere: An unphysical explanation, J. Geophys.Res., 96, 22,579–22,595, 1991.
Salby, M. L., D. L. Hartmann, P. L. Bailey, and J. C. Gille,Evidence for equatorial Kelvin modes in Nimbus-7 LIMS, J.Atmos. Sci., 41, 220–235, 1984.
Salby, M., P. Callaghan, and D. Shea, Interdependence of thetropical and extratropical QBO: Relationship to the solarcycle versus a biennial oscillation in the stratosphere, J.Geophys. Res., 102, 29,789–29,798, 1997.
Saravanan, R., A multiwave model of the quasi-biennial oscil-lation, J. Atmos. Sci., 47, 2465–2474, 1990.
Sassi, F., and R. R. Garcia, The role of equatorial waves forcedby convection in the tropical semiannual oscillation, J. At-mos. Sci., 54, 1925–1942, 1997.
Sato, K., Vertical wind disturbances in the afternoon of mid-summer revealed by the MU radar, Geophys. Res. Lett., 19,1943–1946, 1992.
Sato, K., Small-scale wind disturbances observed by the MUradar during the passage of Typhoon Kelly, J. Atmos. Sci.,50, 518–537, 1993.
Sato, K., and T. J. Dunkerton, Estimates of momentum fluxassociated with equatorial Kelvin and gravity waves, J. Geo-phys. Res., 102, 26,247–26,261, 1997.
Sato, K., F. Hasegawa, and I. Hirota, Short-period distur-bances in the equatorial lower stratosphere, J. Meteorol.Soc. Jpn., 72, 859–872, 1994.
Sato, K., H. Hashiguchi, and S. Fukao, Gravity waves andturbulence associated with cumulus convection observedwith the UHF/VHF clear-air Doppler radars, J. Geophys.Res., 100, 7111–7119, 1995.
Scott, R. K., and P. H. Haynes, Internal interannual variability
of the extratropical stratospheric circulation: The low lati-tude flywheel, Q. J. R. Meteorol. Soc., 124, 2149–2173, 1998.
Shapiro, L. J., The relationship of the quasi-biennial oscillationto Atlantic tropical storm activity, Mon. Weather Rev., 117,1545–1552, 1989.
Shen, S., and K.-M. Lau, Biennial oscillation associated withthe east Asian summer monsoon and tropical sea surfacetemperatures, J. Meteorol. Soc. Jpn., 73, 105–124, 1995.
Shimizu, A., and T. Tsuda, Radiosonde observations of equa-torial atmosphere dynamics over Indonesia, J. Geophys.Res., 102, 26,159–26,172, 1997.
Shindell, D., D. Rind, N. B. Balanchandran, J. Lean, and P.Lonergan, Solar cycle variability, ozone and climate, Sci-ence, 284, 305–308, 1999.
Shiotani, M., and T. Horinouchi, Kelvin wave activity and thequasi-biennial oscillation in the equatorial lower strato-sphere, J. Meteorol. Soc. Jpn., 71, 175–182, 1993.
Shiotani, M., J. C. Gille, and A. E. Roche, Kelvin waves in theequatorial lower stratosphere as revealed by CryogenicLimb Array Etalon Spectrometer temperature data, J. Geo-phys. Res., 102, 26,131–26,140, 1997.
Takahashi, M., A two-dimensional numerical model of thequasi-biennial oscillation, J. Meteorol. Soc. Jpn., 65, 523–535, 1987.
Takahashi, M., Simulation of the stratospheric quasi-biennialoscillation using a general circulation model, Geophys. Res.Lett., 23, 661–664, 1996.
Takahashi, M., Simulation of the stratospheric quasi-biennialoscillation in a general circulation model, Geophys. Res.Lett., 26, 1307–1310, 1999.
Takahashi, M., and B. A. Boville, A three-dimensional simu-lation of the equatorial quasi-biennial oscillation, J. Atmos.Sci., 49, 1020–1035, 1992.
Takahashi, M., N. Zhao, and T. Kumakura, Equatorial wavesin a general circulation model simulating a quasi-biennialoscillation, J. Meteorol. Soc. Jpn., 75, 529–540, 1997.
Takayabu, Y. N., K.-M. Lau, and C.-H. Sui, Observation of aquasi-2-day wave during TOGA COARE, Mon. WeatherRev., 124, 1892–1913, 1996.
Tanaka, H., and N. Yoshizawa, A slowly-varying model of thequasi-biennial oscillation involving effects of transience,self-acceleration and saturation of equatorial waves, J. At-mos. Sci., 44, 1427–1436, 1987.
Teitelbaum, H., and P. Bauer, Stratospheric temperatureeleven year variation: Solar cycle influence or stroboscopiceffect?, Ann. Geophys., 8, 239–242, 1990.
Teitelbaum, H., F. Vial, and P. Bauer, The stratospheric quasi-biennial oscillation observed in the semidiurnal groundpressure data, Ann. Geophys., 13, 740–744, 1995.
Thompson, D. W. J., and J. M. Wallace, The Arctic Oscillationsignature in the wintertime geopotential height and tem-perature fields, Geophys. Res. Lett., 25, 1297–1300, 1998.
Thompson, D. W. J., and J. M. Wallace, Annular modes in theextratropical circulation, part I, Month-to-month variabil-ity, J. Clim., 13, 1000–1016, 2000.
Tiedtke, M., A comprehensive mass flux scheme for cumulusparameterization in large-scale models, Mon. Weather Rev.,117, 1779–1800, 1989.
Trepte, C. R., and M. H. Hitchman, Tropical stratosphericcirculation deduced from satellite aerosol data, Nature, 355,626–628, 1992.
Tsuda, T., Y. Murayama, H. Wiryosumarto, S. W. B. Harijono,and S. Kato, Radiosonde observations of equatorial atmo-spheric dynamics over Indonesia, 1, Equatorial waves anddiurnal tides, J. Geophys. Res., 99, 10,491–10,506, 1994a.
Tsuda, T., Y. Murayama, H. Wiryosumarto, S. W. B. Harijono,and S. Kato, Radiosonde observations of equatorial atmo-spheric dynamics over Indonesia, 2, Characteristics of grav-ity waves, J. Geophys. Res., 99, 10,507–10,516, 1994b.
228 ● Baldwin et al.: THE QUASI-BIENNIAL OSCILLATION 39, 2 / REVIEWS OF GEOPHYSICS
Tung, K., and H. Yang, Global QBO in circulation and ozone,part I, Reexamination of observational evidence, J. Atmos.Sci., 51, 2699–2707, 1994a.
Tung, K., and H. Yang, Global QBO in circulation and ozone,part II, A simple mechanistic model, J. Atmos. Sci., 51,2708–2721, 1994b.
Untch, A., Simulation of the quasi-biennial oscillation with theECMWF model, in Research Activities in the Atmosphericand Oceanic Modelling, pp. 6.26–6.27, World Meteorol.Organ., Geneva, 1998.
van Loon, H., and K. Labitzke, The Southern Oscillation, partV, The anomalies in the lower stratosphere of the NorthernHemisphere in winter and a comparison with the quasi-biennial oscillation, Mon. Weather Rev., 115, 357–369, 1987.
van Loon, H., and K. Labitzke, The 10–12 year atmosphericoscillation, Meteorol. Z., 3, 259–266, 1994.
Veryard, R. G., and R. A. Ebdon, Fluctuations in tropicalstratospheric winds, Meteorol. Mag., 90, 125–143, 1961.
Vincent, R. A., and M. J. Alexander, Gravity waves in thetropical lower stratosphere: An observational study of sea-sonal and interannual variability, J. Geophys. Res., 105,17,971–17,982, 2000.
Wada, K., T. Nitta, and K. Sato, Equatorial inertia-gravitywaves in the lower stratosphere revealed by TOGA-COARE IOP data, J. Meteorol. Soc. Jpn., 77, 721–736, 1999.
Wallace, J. M., General circulation of the tropical lower strato-sphere, Rev. Geophys., 11, 191–222, 1973.
Wallace, J. M., and F.-C. Chang, Interannual variability of thewintertime polar vortex in the Northern Hemisphere mid-dle stratosphere, J. Meteorol. Soc. Jpn., 60, 149–155, 1982.
Wallace, J. M., and J. R. Holton, A diagnostic numerical modelof the quasi-biennial oscillation, J. Atmos. Sci., 25, 280–292,1968.
Wallace, J. M., and V. E. Kousky, Observational evidence ofKelvin waves in the tropical stratosphere, J. Atmos. Sci., 25,900–907, 1968a.
Wallace, J. M., and V. E. Kousky, On the relation betweenKelvin waves and the quasi-biennial oscillation, J. Meteorol.Soc. Jpn., 46, 496–502, 1968b.
Wallace, J. M., R. L. Panetta, and J. Estberg, Representationof the equatorial stratospheric quasi-biennial oscillation inEOF phase space, J. Atmos. Sci., 50, 1751–1762, 1993.
Waugh, D. W., Seasonal variation of isentropic transport out ofthe tropical stratosphere, J. Atmos. Sci., 101, 4007–4023, 1996.
Waugh, D. W., and W. J. Randel, Climatology of Arctic andAntarctic polar vortices using elliptical diagnostics, J. At-mos. Sci., 56, 1594–1613, 1999.
Wheeler, M., and G. N. Kiladis, Convectively coupled equatorialwaves: Analysis of clouds and temperature in the wavenum-ber-frequency domain, J. Atmos. Sci., 56, 374–399, 1999.
Wikle, C. K., R. A. Madden, and T.-C. Chen, Seasonal varia-tions of upper tropospheric and lower stratospheric equa-torial waves over the tropical Pacific, J. Atmos. Sci., 54,1895–1909, 1997.
Willson, R., H. Hudson, C. Frohlich, and R. Brusa, Long-termdownward trend in total solar irradiance, Science, 234,1114–1117, 1986.
Xu, J.-S., On the relationship between the stratospheric quasi-biennial oscillation and the tropospheric Southern Oscilla-tion, J. Atmos. Sci., 49, 725–734, 1992.
Yanai, M., and T. Maruyama, Stratospheric wave disturbances
propagating over the equatorial Pacific, J. Meteorol. Soc.Jpn., 44, 291–294, 1966.
Yasunari, T., Zonally propagating modes of the global east-west circulation associated with the Southern Oscillation, J.Meteorol. Soc. Jpn., 63, 1013–1029, 1985.
Yasunari, T., A possible link of the QBOs between the strato-sphere, troposphere and sea surface temperature in thetropics, J. Meteorol. Soc. Jpn., 67, 483–493, 1989.
Zawodny, J. M., and M. P. McCormick, Stratospheric Aerosoland Gas Experiment II measurements of the quasi-biennialoscillations in ozone and nitrogen dioxide, J. Geophys. Res.,96, 9371–9377, 1991.
Zhang, G. J., and N. A. McFarlane, Sensitivity of climatesimulations to the parameterization of cumulus convectionin the Canadian Climate Centre general circulation model,Atmos. Ocean, 33, 407–446, 1995.
Ziemke, J. R., and J. L. Stanford, Quasi-biennial oscillationand tropical waves in total ozone, J. Geophys. Res., 99,23,041–23,056, 1994.
M. J. Alexander, Colorado Research Associates, 3380Mitchell Lane, Boulder, CO 80301. ([email protected])
M. P. Baldwin and T. J. Dunkerton, NorthWest ResearchAssociates, Inc., 14508 NE 20th Street, Bellevue, WA 98007-3713. ([email protected]; [email protected])
L. J. Gray, Rutherford Appleton Laboratory, Chilton, Didcot,Oxon, OX11 0QX, England, UK. ([email protected])
K. Hamilton, International Pacific Research Center, SOEST,University of Hawaii, 1680 East-West Road, Post 802, Hono-lulu, HI 96822. ([email protected])
P. H. Haynes, Centre for Atmospheric Science, Departmentof Applied Mathematics and Theoretical Physics, University ofCambridge, Silver Street, Cambridge CB3 9EW, England, UK.([email protected])
I. Hirota, Department of Geophysics, Kyoto University,Kyoto 606-8502, Japan. ([email protected])
J. R. Holton, Department of Atmospheric Sciences, Univer-sity of Washington, Box 351640, Seattle, WA 98195.([email protected])
T. Horinouchi, Radio Atmospheric Science Center, KyotoUniversity, Uji 611-0011, Japan. ([email protected])
D. B. A. Jones, Division of Engineering and Applied Sci-ences, Harvard University, 29 Oxford Street, Cambridge, MA02138. ([email protected])
J. S. Kinnersley, 938 19th Street, Seattle, WA 98122.C. Marquardt, GeoForschungsZentrum, Potsdam, Am
Telegrafenberg, D-14473 Potsdam, Germany. ([email protected])
W. J. Randel, Atmospheric Chemistry Division, NationalCenter for Atmospheric Research, P.O. Box 3000, Boulder, CO80307-3000. ([email protected])
K. Sato, National Institute of Polar Research, Arctic Envi-ronment Research Center, Kaga 1-9-10, Itabashi, Tokyo 173-8515, Japan. ([email protected])
M. Takahashi, Center for Climate System Research, Univer-sity of Tokyo, Komaba 4-6-1, Meguro-ku, Tokyo 153-8904,Japan. ([email protected])
39, 2 / REVIEWS OF GEOPHYSICS Baldwin et al.: THE QUASI-BIENNIAL OSCILLATION ● 229

● 230 ●