Embed Size (px)
Citation preview
The predictionThe prediction of equatorial total ozoneof equatorial total ozone
up to the end of 2018 basing on theup to the end of 2018 basing on the exact seasonal synchronization exact seasonal synchronization
of the quasi-biennial oscillation (QBO)of the quasi-biennial oscillation (QBO) of equatorial stratospheric zonal windof equatorial stratospheric zonal wind
Irina P. Gabis and Oleg A. TroshichevIrina P. Gabis and Oleg A. Troshichev
Arctic and Antarctic Research Institute St. Petersburg
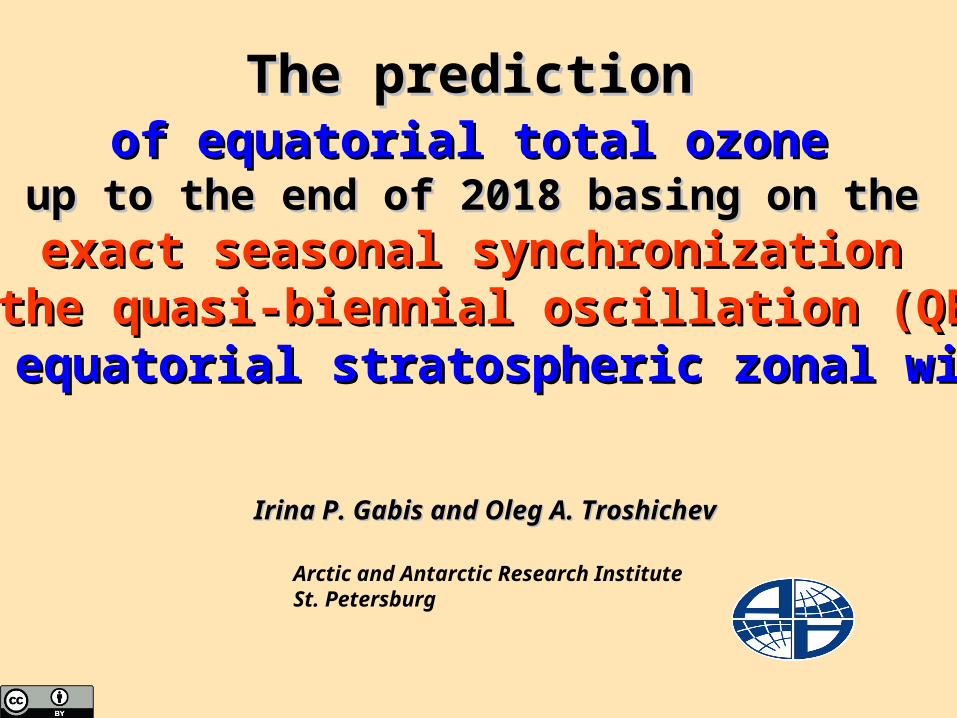
QBO influence on the weather and climateQBO influence on the weather and climatemotivates the prediction ofmotivates the prediction of QBO cycle evolutionQBO cycle evolution
QBO affects the atmosphere globally
Antarctic ozone hole
equatorial QBO
modulation of solar activity effects
polar stratospheric warmings
atmospheric ozone layer
trace gas distribution
meridional circulation
………
85 86 87 88 89 90 917050
30
10
E
E
EE WWW
WWW E E
Pre
ssur
e, h
Pa
year
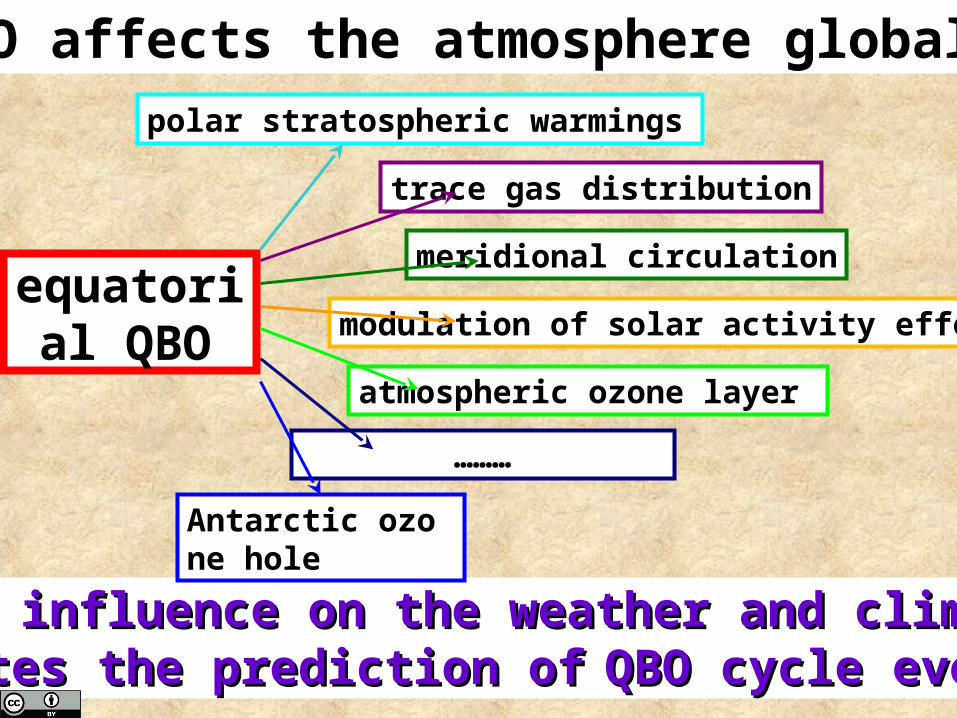
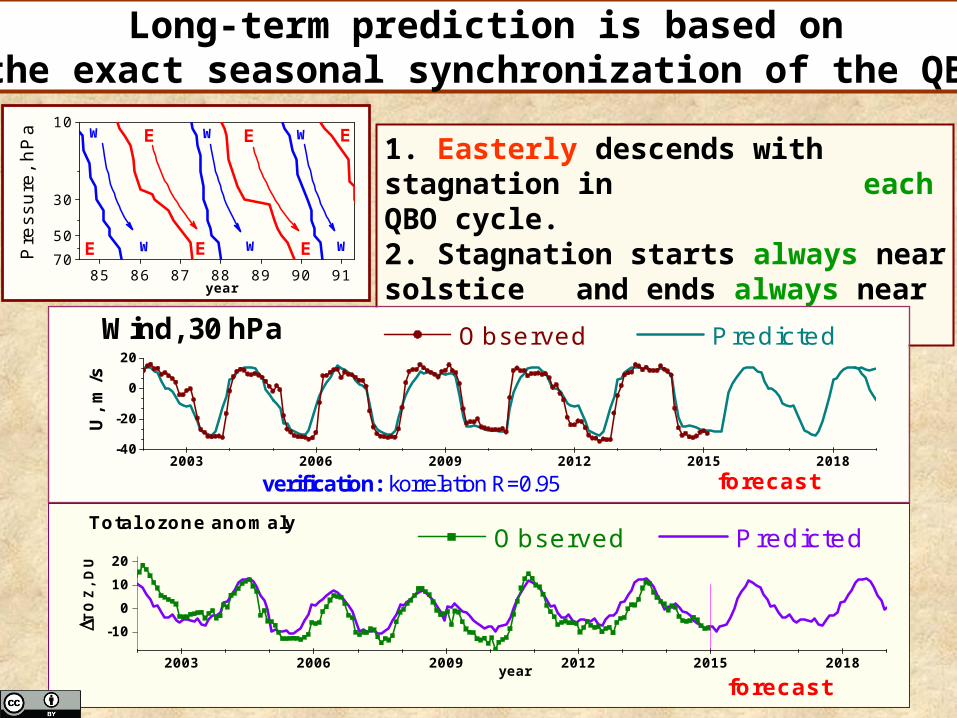
Long-term prediction is based onthe exact seasonal synchronization of the QBO
1. Easterly descends with stagnation in each QBO cycle.2. Stagnation starts always near solstice
and ends always near equinox.
2003 2006 2009 2012 2015 2018-40
-20
0
20
verification: korrelation R=0.95
U,
m/s
Observed Predicted Wind, 30 hPa
forecast
2003 2006 2009 2012 2015 2018
-10
0
10
20
year
TO
Z, D
U
Observed PredictedTotal ozone anomaly
forecast

Time – height section of zonal winds (m/s) at the equatorial stations for 1993 - 2008; westerlies are shaded.
Quasi – Biennial Oscillation (QBO) is a quasi-periodic alternation of zonal wind direction in the tropical stratosphere as a consequence of descent of EASTERLY and WESTERLY wind regimes in a layer from ~16 to ~50 km.
http://www.geo.fu-berlin.de/en/met/ag/strat/produkte/qbo/index.html Freie Universität Berlin, Department of Earth Sciences,
Institute of Meteorology, Physics of the Middle Atmosphere
According to common belief:
QBO period varies from cycle to cycle in range from 17 to 38 months, mean QBO period is ~28 months;
There is only some tendency for the QBO-phase changes to occur in specific seasons – “seasonal modulation”;
The predictability of the QBO is reduced due to the unpredictable EASTERLY delays in a layer 20 – 25 km (40 – 50 hPa);
QBO of zonal wind can be accurately predicted for several months in advance.

The Quasi-Biennial-Oscillation (QBO) Data Serie http://www.geo.fu-berlin.de/en/met/ag/strat/produkte/qbo/index.html
Freie Universität Berlin, Department of Earth Sciences, Institute of Meteorology, Physics of the Middle Atmosphere
Analysis of the height profiles of wind speedusing the measurements at equatorial stations
for pressure levels from 70 to 10 hPa (~ 16-31 km) in 1953-2015.
U > 0 m/s: WesterlyU < 0 m/s: Easterly
7050
30
10
-20 0 20
E
w
Mar 06
U, m/s-20 0 20
Monthly mean zonal wind components (0.1 m/s) at Singapore (48698), 1N/104E; 2006
hPa JAN FEB MAR APR MAY JUN JUL AUG SEP OCT NOV DEC 10 171 127 116 6 69 19 -21 -28 -54 -137 -228 -200 15 165 152 166 94 132 132 114 62 73 -7 -139 -206 20 94 164 176 126 141 173 131 65 76 14 -123 -210 30 -288 -93 83 85 106 123 126 71 109 93 89 73 40 -271 -261 -240 -48 89 110 117 99 133 110 89 118 50 -152 -138 -154 -201 -71 79 107 86 109 92 104 124 70 -14 -63 -31 -72 -125 -110 -24 8 68 76 62 81
7050
30
10
-20 0 20P
, hP
a E
w
Jan 07
U, m/s
28 hPa
7050
30
10
-20 0 20
AugSep
U, m/s
Oct
Sep
P, h
Pa
Nov
Oct
2006
DecNov
Jan
Dec
JanFeb
2007
FebMar
Mar
AprApr
May
May
JunJun
JulJul
Aug
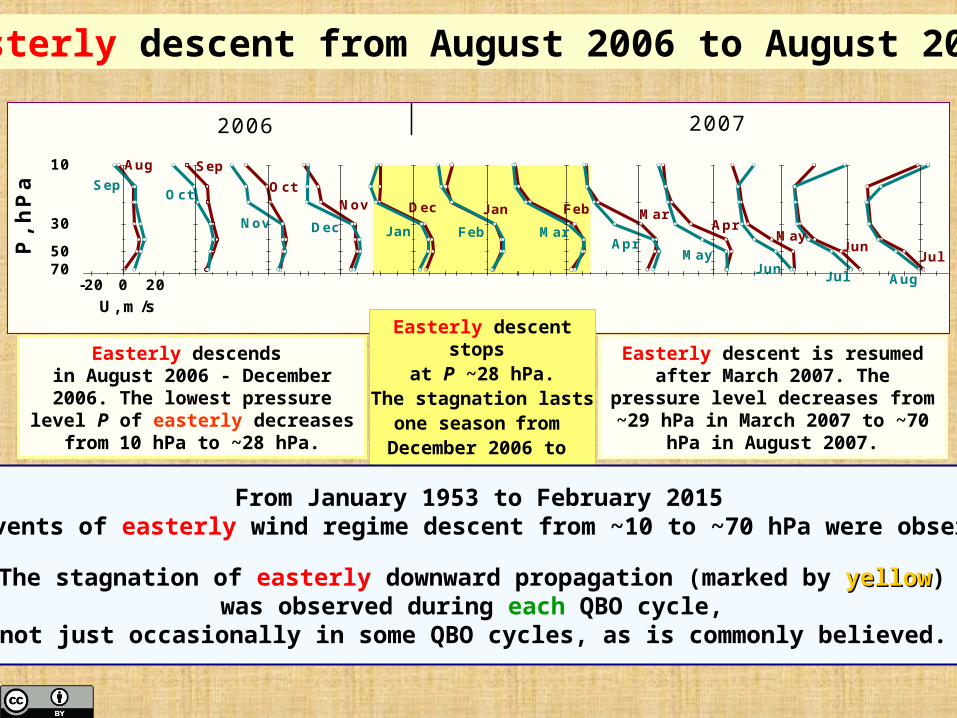
Easterly descent stops at P ~28 hPa.
The stagnation lasts one season from
December 2006 to March 2007.
Easterly descent from August 2006 to August 2007
Easterly descends in August 2006 - December 2006. The
lowest pressure level P of easterly decreases from 10 hPa to ~28 hPa.
Easterly descent is resumed after March 2007. The pressure level
decreases from ~29 hPa in March 2007 to ~70 hPa in August 2007.
From January 1953 to February 2015 27 events of easterly wind regime descent from ~10 to ~70 hPa were observed.
The stagnation of easterly downward propagation (marked by yellowyellow) was observed during each QBO cycle,
not just occasionally in some QBO cycles, as is commonly believed.
705030
10
705030
10
705030
10
705030
10
705030
10
705030
10
705030
10
705030
10
705030
10
705030
10
705030
10
-30 -15 0 15 -30 -15 0 15 -30 -15 0 15 -30 -15 0 15 -30 -15 0 15
1955 - 1956
AprMay-Aug Sep
Oct Nov Dec
Jan Feb Mar
Apr May Jun
JulAug-Nov Dec
1957 - 1958
1959 - 1960
1961 - 1962
1969 - 1970
1971 - 1972
1973 - 1974
P, h
Pa
1995 - 1996
1997 - 1998
2004 - 2005
U, m/s
U, m/s
2006 - 2007 U, m/s
U, m/s
U, m/s
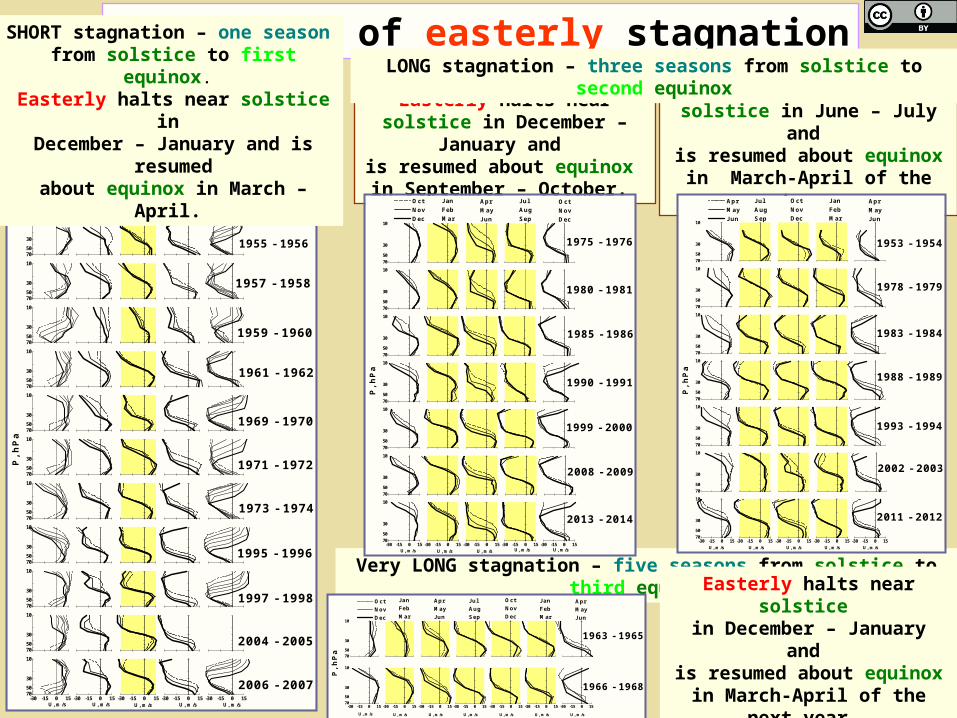
Four types of easterly stagnation
Easterly halts near solstice in December – January and is resumed about equinox in September – October.
SHORT stagnation – one season from solstice to first equinox. Easterly halts near solstice in
December – January and is resumedabout equinox in March – April.
Easterly halts near solstice in June – July and
is resumed about equinox in March-April of the next year.
Very LONG stagnation – five seasons from solstice to third equinox
LONG stagnation – three seasons from solstice to second equinox
Easterly halts near solstice in December – January and is resumed about equinox in March-April of the next year.
7050
30
10
7050
30
10
7050
30
10
7050
30
10
7050
30
10
7050
30
10
7050
30
10
-30 -15 0 15 -30 -15 0 15 -30 -15 0 15 -30 -15 0 15 -30 -15 0 15
1975 - 1976
Oct Nov Dec
JanFebMar
AprMayJun
JulAugSep
OctNovDec
1980 - 1981
1985 - 1986
P, h
Pa
1990 - 1991
1999 - 2000
2008 - 2009
U, m/s U, m/s
U, m/s
U, m/s
2013 - 2014
U, m/s
7050
30
10
7050
30
10
7050
30
10
7050
30
10
7050
30
10
7050
30
10
7050
30
10
-30 -15 0 15 -30 -15 0 15 -30 -15 0 15 -30 -15 0 15 -30 -15 0 15
1953 - 1954
Apr May Jun
JulAugSep
OctNovDec
JanFebMar
AprMayJun
1978 - 1979
1983 - 1984
P, h
Pa
1988 - 1989
1993 - 1994
2002 - 2003
U, m/s U, m/s
U, m/s
U, m/s
2011 - 2012
U, m/s
7050
30
10
7050
30
10
-30 -15 0 15 -30 -15 0 15 -30 -15 0 15 -30 -15 0 15 -30 -15 0 15 -30 -15 0 15 -30 -15 0 15
1963 - 1965
Oct Nov Dec
JanFebMar
AprMayJun
JulAugSep
OctNovDec
JanFebMar
AprMayJun
1966 - 1968
U, m/s
P, h
Pa
U, m/s
U, m/s
U, m/s U, m/s
U, m/s
U, m/s
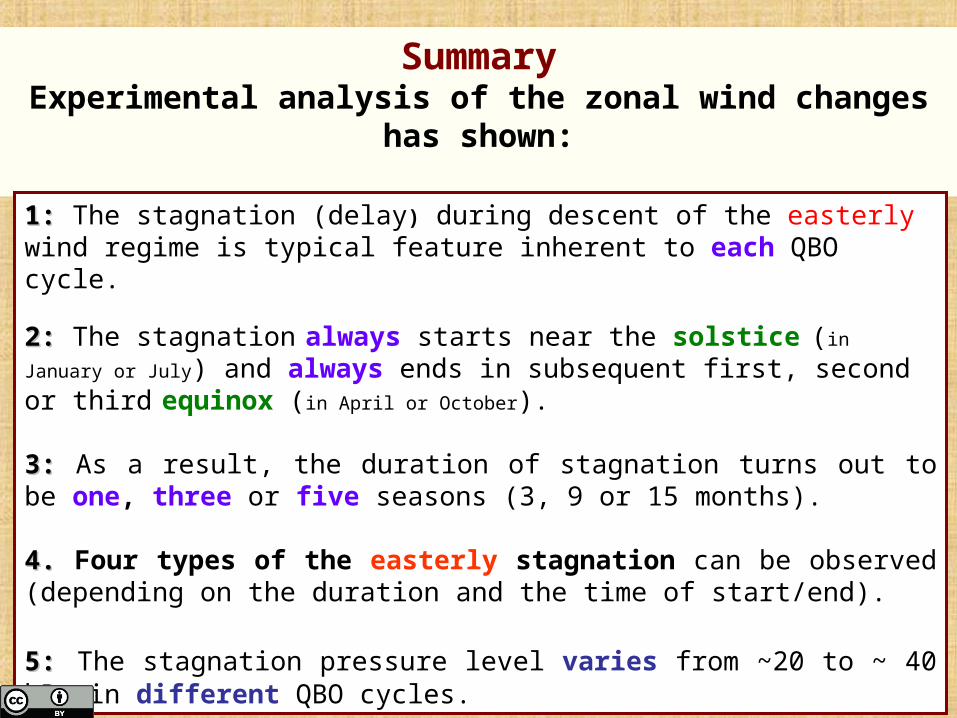
SummaryExperimental analysis of the zonal wind changes has shown:
1:1: The stagnation (delay) during descent of the easterly wind regime is typical feature inherent to each QBO cycle.
2:2: The stagnation always starts near the solstice (in January or July) and always ends in subsequent first, second or third equinox (in April or October).
3:3: As a result, the duration of stagnation turns out to be one, three or five seasons (3, 9 or 15 months).
4.4. Four types of the easterly stagnation can be observed (depending on the duration and the time of start/end).
5:5: The stagnation pressure level varies from ~20 to ~ 40 hPa in different QBO cycles.
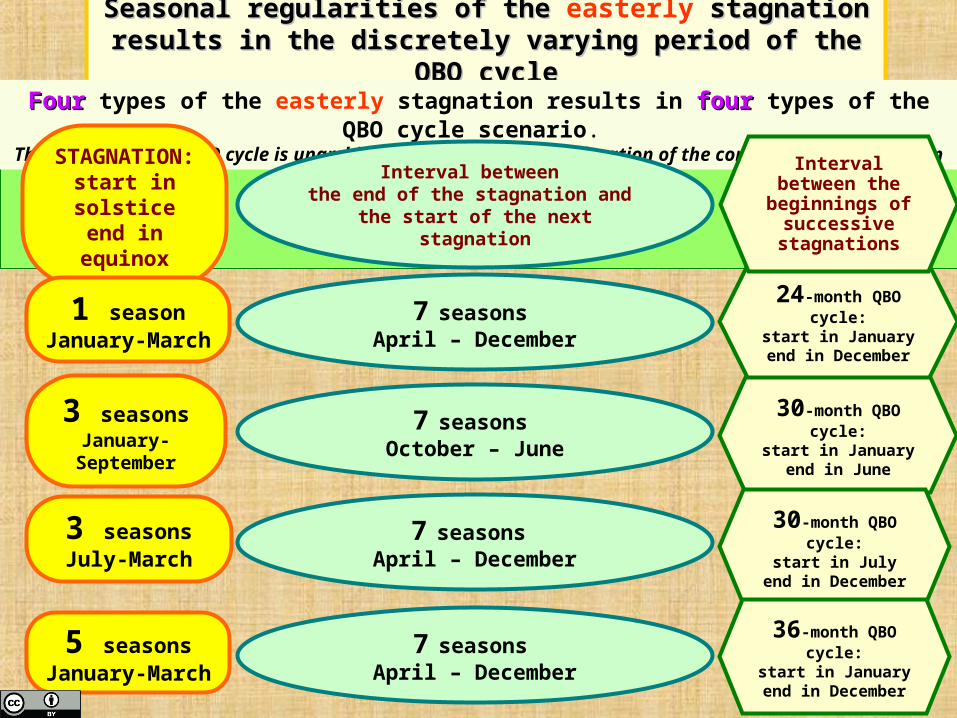
Seasonal regularities of the Seasonal regularities of the easterly stagnation stagnation results in the discretely varying period of the QBO cycleresults in the discretely varying period of the QBO cycle
FourFour types of the easterly stagnation results in fourfour types of the QBO cycle scenario. The length of each QBO cycle is unambiguously associated with duration of the corresponding
stagnation
24-month QBO cycle:start in January
end in December
30-month QBO cycle:start in January
end in June
30-month QBO cycle:start in July
end in December
36-month QBO cycle:start in January
end in December
STAGNATION:start in solsticeend in equinox
Interval between the beginnings of
successive stagnations
1 seasonJanuary-March
3 seasonsJanuary-September
3 seasonsJuly-March
5 seasonsJanuary-March
Interval between the end of the stagnation and the start of the next stagnation
7 seasons
April – December
7 seasons
October – June
7 seasons April – December
7 seasons
April – December

QBO-cyclenumber
24-monthscenario
30-month scenario36-monthscenariobeginning in January beginning in July
1 Jul 53 – Dec 55 2 Jan 56 – Dec 57 3 Jan 58 – Dec 59 4 Jan 60 – Dec 61 5 Jan 62 – Dec 63 6 Jan 64 – Dec 667 Jan 67 – Dec 698 Jan 70 – Dec 71 9 Jan 72 – Dec 73
10 Jan 74 – Dec 75 11 Jan 76 – Jun 78 12 Jul 78 – Dec 80 13 Jan 81 – Jun 83 14 Jul 83 – Dec 85 15 Jan 86 – Jun 88 16 Jul 88 – Dec 90 17 Jan 91 – Jun 93 18 Jul 93 – Dec 95 19 Jan 96 – Dec 97 20 Jan 98 – Dec 99 21 Jan 00 – Jun 02 22 Jul 02 – Dec 04 23 Jan 05 – Dec 06 24 Jan 07 – Dec 08 25 Jan 09 – Jun 11 26 Jul 11 – Dec 13 27 Jan 14 – Jun 16 28 Jul 16 – Dec 18
All QBO cycles of different periods in interval from 1953 to 2018

Eleven QBO cycles of 24-month scenario
Profiles for first, second and third month during each season are shown by bold, dashed and thin lines, respectively. Time periods corresponding to stagnation stage are marked by light yellow fill. 36-month QBO cycles are not shown.
Six QBO cycles of 30-month scenario (start in January)
30-month QBO cycle, which began in January, is followed, evidently, by the QBO cycle, which began in July.
Seven QBO-cycles of30-month scenario
(start in July)
All QBO cycles of different periods in interval from 1953 to 2014
705030
10
1970-1972
705030
10
705030
10
P,
hP
a
705030
10
1962-1964
1972-1974
1974-1976
705030
10
Jan Feb Mar
1956-1958
1958-1960
1960-1962
AprMayJun
JulAugSep
OctNovDec
Jan Feb Mar
AprMayJun
JulAugSep
OctNovDec
JanFebMar
705030
10
705030
10
705030
10
2007-2009
1996-1998
2005-2007
1998-2000
705030
10
705030
10
705030
10
-20 0 20 U, m/s
705030
10
1991-1993
2000-2002
2009-2011
705030
10
705030
10
-20 0 20 U, m/s
P,
hP
a
705030
10
Jan Feb Mar
1976-1978
1981-1983
1986-1988
AprMayJun
JulAugSep
OctNovDec
Jan Feb Mar
AprMayJun
JulAugSep
OctNovDec
Jan Feb Mar
AprMayJun
JulAugSep
705030
10
705030
10
705030
10
1988-1991
1993-1996
2002-2005
705030
10
705030
10
705030
10
-20 0 20 U, m/s
P,h
Pa
2011-2014
705030
10
Jul Aug Sep
1953-1956
1978-1981
1983-1986
OctNovDec
JanFebMar
AprMayJun
JulAugSep
OctNovDec
JanFebMar
AprMayJun
JulAugSep
OctNovDec
JanFebMar
705030
10
705030
10
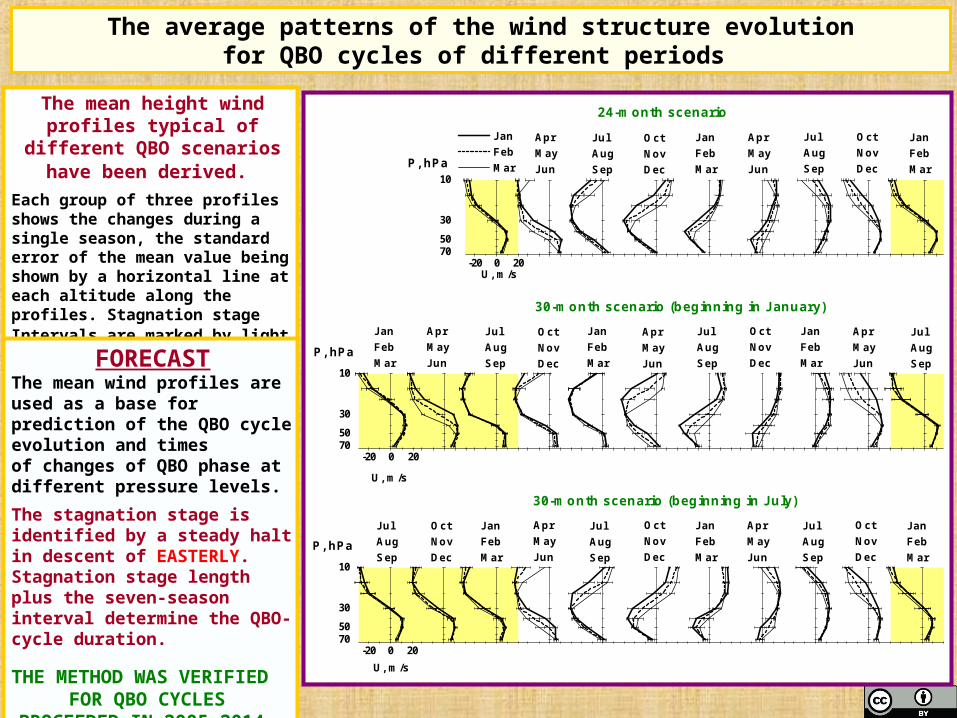
The average patterns of the wind structure evolutionfor QBO cycles of different periods
The mean height wind profiles typical of different QBO
scenarios have been derived. Each group of three profiles shows the changes during a single season, the standard error of the mean value being shown by a horizontal line at each altitude along the profiles. Stagnation stage Intervals are marked by light yellow.
FORECASTThe mean wind profiles are used as a base for prediction of the QBO cycle evolution and times of changes of QBO phase at different pressure levels.
The stagnation stage is identified by a steady halt in descent of EASTERLY. Stagnation stage length plus the seven-season interval determine the QBO-cycle duration.
THE METHOD WAS VERIFIED FOR QBO CYCLES
PROCEEDED IN 2005-2014.
705030
10
-20 0 20
P, hPa
P, hPa
24-month scenario
JanFebMar
U, m/s
30-month scenario (beginning in January)
P, hPa
AprMayJun
JulAugSep
OctNovDec
JanFebMar
AprMayJun
JulAugSep
OctNovDec
JanFeb Mar
AprMayJun
JulAugSep
705030
10
-20 0 20 U, m/s
Jan Feb Mar
AprMayJun
JulAugSep
OctNovDec
JanFebMar
AprMayJun
JulAugSep
OctNovDec
JanFebMar
705030
10
-20 0 20
JulAugSep
U, m/s
30-month scenario (beginning in July)
OctNovDec
JanFebMar
AprMayJun
JulAugSep
OctNovDec
JanFebMar
AprMayJun
JulAugSep
OctNovDec
JanFebMar

705030
10 Jan
2006
2006
2005
2005
Feb
Mar
Apr
May
Jun
705030
10 Jul Aug
Sep
Oct
Nov
Dec
705030
10 Jan
P, hPa
Feb
Mar
Apr
May
Jun
705030
10
-20 0 20 U, m/s
Jul Aug
Sep
Oct
Nov
Dec
Wind profiles for period from January 2005 to December 2006.
QBO-cycle was developed according to 24-month scenario and completed in December 2006. The next QBO cycle should start in January 2007 (Gabis, I.P., Troshichev,
O.A., J. Atmos. Sol. Terrestrial Phys. v.68. pp.1987-1999. 2006).
Wind profiles for period from January 2007 to December 2008.
QBO-cycle was developed according to 24-month scenario and completed in December 2008. The next QBO cycle should start in January 2009 (Gabis, Troshichev, in: Wang, P. (Ed.), Solar Physics Research Trends. Nova Science
Publishers, Inc., New York, 165-194, 2008).
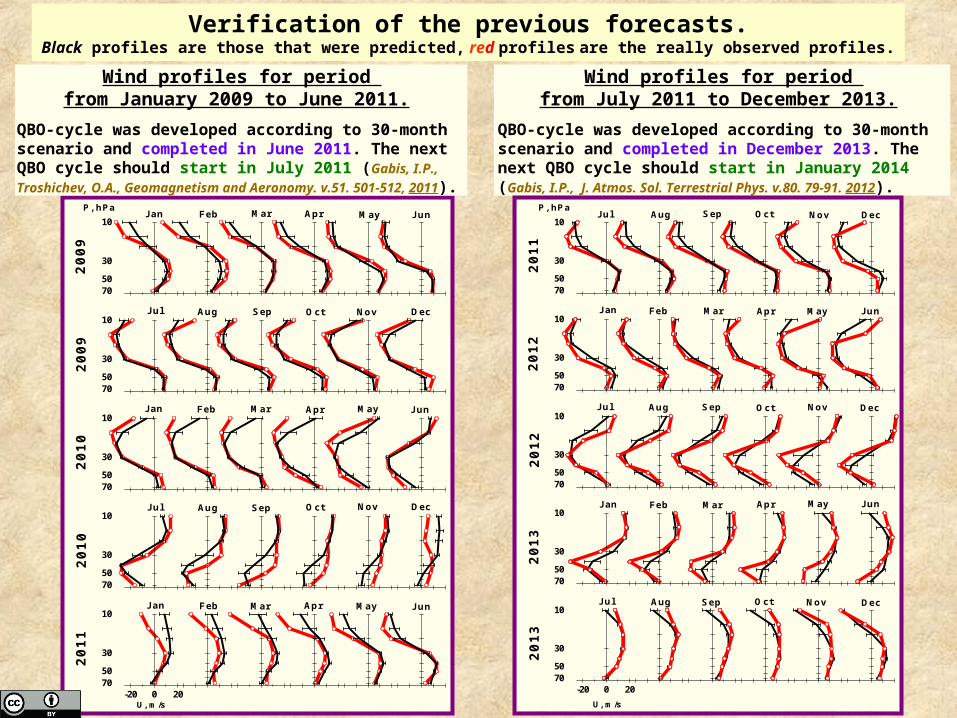
Verification of the previous forecasts.Black profiles are those that were predicted, red profiles are the really observed profiles.
705030
10 Jan
2008
2008
2007
2007
Feb
Mar
Apr
May
Jun
705030
10 Jul Aug
Sep
Oct
Nov
Dec
705030
10 Jan
P, hPa
Feb
Mar
Apr
May
Jun
705030
10
-20 0 20 U, m/s
Jul Aug
Sep
Oct
Nov
Dec
705030
10 Jan
Feb
Mar
Apr
May
Jun
705030
10 Jul Aug
Sep
Oct
Nov
Dec
705030
10 Jan
P, hPa
Feb
Mar
Apr
May
Jun
705030
10 Jul Aug
Sep
Oct
Nov
Dec
705030
10
-20 0 20
Jan
U, m/s
Feb
Mar
Apr
20
09
20
09
20
10
20
10
May
20
11
Jun
Wind profiles for period from January 2009 to June 2011.
QBO-cycle was developed according to 30-month scenario and completed in June 2011. The next QBO cycle should start in July 2011 (Gabis, I.P., Troshichev, O.A., Geomagnetism and
Aeronomy. v.51. 501-512, 2011).
Wind profiles for period from July 2011 to December 2013.
QBO-cycle was developed according to 30-month scenario and completed in December 2013. The next QBO cycle should start in January 2014 (Gabis, I.P., J. Atmos. Sol.
Terrestrial Phys. v.80. 79-91. 2012).
Verification of the previous forecasts.Black profiles are those that were predicted, red profiles are the really observed profiles.
705030
10 Jul
Aug
Sep
Oct
Nov
Dec
705030
10 Jan Feb
Mar
Apr
May
Jun
705030
10 Jul
P, hPa
Aug
Sep
Oct
Nov
Dec
705030
10 Jan Feb
Mar
Apr
May
Jun
705030
10
-20 0 20
Jul
U, m/s
Aug
Sep
Oct
20
12
20
11
20
12
20
13
Nov
20
13
Dec
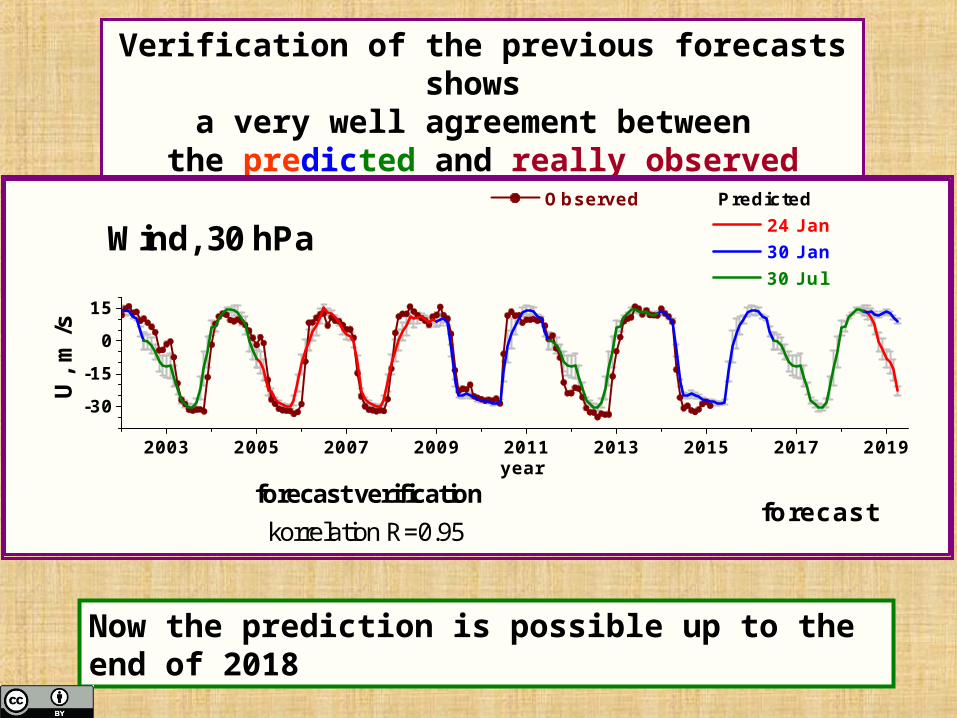
Verification of the previous forecasts shows a very well agreement between
the predicted and really observed variations
Now the prediction is possible up to the end of 2018
2003 2005 2007 2009 2011 2013 2015 2017 2019
-30
-15
0
15
forecast verification korrelation R=0.95
U, m
/s
year
Observed Predicted 24 Jan 30 Jan 30 Jul
Wind, 30 hPa
forecast

QBO cycle onset
Stagnation durationQBO cycle
periodNext QBO cycle onset
January 1 seasons (January – March)
24 months January after a lapse of 2 years
January 3 seasons(January–September)
30 months July after a lapse of 2.5 years
July 3 seasons (July–December–March)
30 months January after a lapse of 2.5 years
January 5 seasons(January–December–March)
36 months(low probability)
January after a lapse of 3 years
Forecast of the next QBO cycle onset based on the observed duration of the stagnation
If the stagnation, starting in January, is If the stagnation, starting in January, is not completednot completed in 3 months, the forecast is real for two subsequent QBO in 3 months, the forecast is real for two subsequent QBO cycles, i.e. for 5 years in advance (since the OBO cycles starting in July always last 30 months).cycles, i.e. for 5 years in advance (since the OBO cycles starting in July always last 30 months).
After the onset of 30-month QBO cycle in After the onset of 30-month QBO cycle in January 2014January 2014the prediction is possible for the next the prediction is possible for the next 5 years
The 36-month QBO cycle is apparently anomalous, and its probability is low.
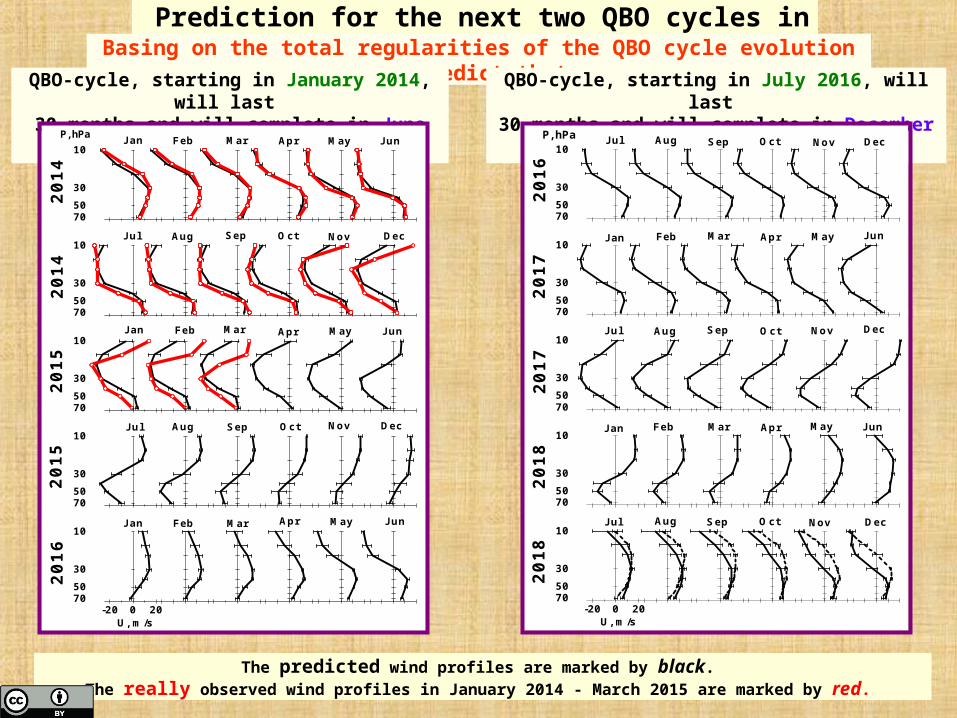
Prediction for the next two QBO cycles in 2014-2018 Basing on the total regularities of the QBO cycle evolution we predict that:
The predicted wind profiles are marked by black.
The really observed wind profiles in January 2014 - March 2015 are marked by red.
QBO-cycle, starting in January 2014, will last
30 months and will complete in June 2016. QBO-cycle, starting in July 2016, will last
30 months and will complete in December 2018
7050
30
10 Jul
Aug
Sep
Oct
Nov
Dec
7050
30
10 Jan Feb
Mar
Apr
May
Jun
7050
30
10 Jul
P, hPa
Aug
Sep
Oct
Nov
Dec
7050
30
10 Jan Feb
Mar
Apr
May
Jun
7050
30
10
-20 0 20
Jul
U, m/s
Aug
Sep
Oct
2017
2016
2017
2018
Nov
2018
Dec
7050
30
10 Jan
Feb
Mar
Apr
May
Jun
7050
30
10 Jul Aug
Sep
Oct
Nov
Dec
7050
30
10 Jan
P, hPa
Feb
Mar
Apr
May
Jun
7050
30
10 Jul Aug
Sep
Oct
Nov
Dec
7050
30
10
-20 0 20
Jan
U, m/s
Feb
Mar
Apr
20
14
20
14
20
15
20
15
May
20
16
Jun
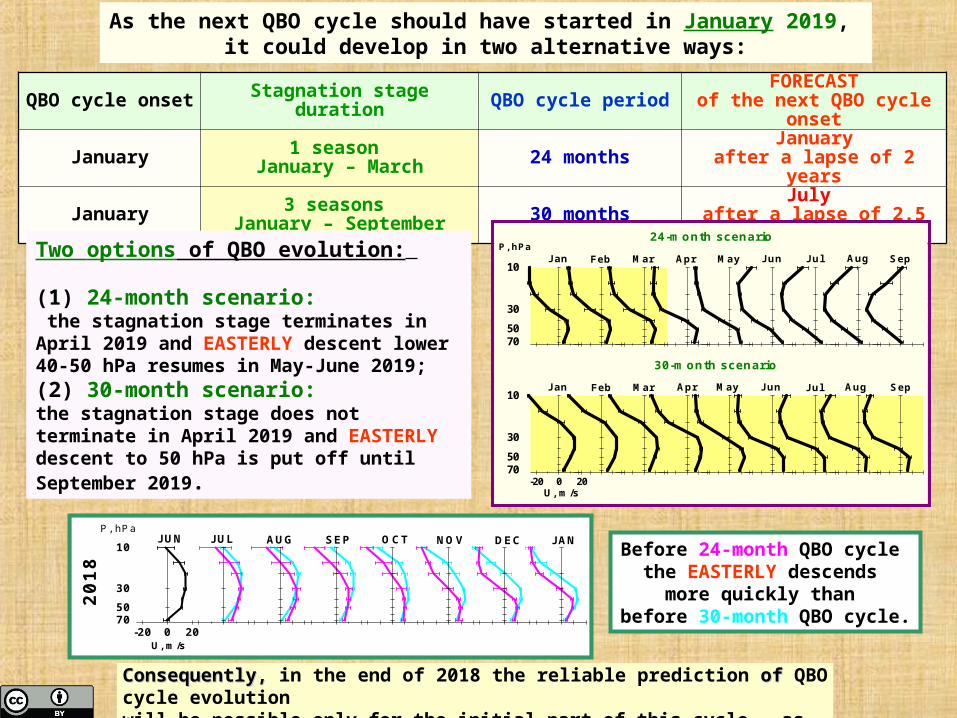
QBO cycle onset Stagnation stage duration QBO cycle period FORECASTof the next QBO cycle onset
January 1 season January – March 24 months January
after a lapse of 2 years
January 3 seasons January – September 30 months July
after a lapse of 2.5 years
As the next QBO cycle should have started in January 2019, it could develop in two alternative ways:
Consequently, Consequently, in the end of 2018 the reliable prediction ofof QBO cycle evolution will be possible only for the initial part of this cycle – as far as April 2019.
Two options of QBO evolution:
(1) 24-month scenario: the stagnation stage terminates in April 2019 and EASTERLY descent lower 40-50 hPa resumes in May-June 2019;(2) 30-month scenario:the stagnation stage does not terminate in April 2019 and EASTERLY descent to 50 hPa is put off until September 2019.
Before 24-month QBO cycle the EASTERLY descends
more quickly than before 30-month QBO cycle.
705030
10
Jan
P, hPa Feb
Mar
Apr
May
30-month scenario
Jun
24-month scenario
Jul Aug
Sep
Feb
Mar
Apr
May
Jun
Jul
Aug
Sep
705030
10
-20 0 20 U, m/s
Jan
7050
30
10
-20 0 20 U, m/s
JUN
JUL AUG
SEP
OCT
20
18
NOV
DEC
JAN
P, hPa

The long-term predictability of QBO in equatorial total ozone (TOZ) The long-term predictability of QBO in equatorial total ozone (TOZ)
In figure: Mean ΔTOZ during QBO cycles of different scenarios.
(ΔTOZ – deseasonalized TOZ at latitudes from 5°S to 5°N)
The wind QBO affects the ΔTOZ variations in equatorial region:WESTERLY descent associated with growth of ΔTOZ, EASTERLY descent associated with decrease of ΔTOZ
The increase phase of ΔTOZ has approximately the same duration in all types of QBO scenarios and continues always within one year.
The duration of ΔTOZ decrease phase can be equal to one year or one and half a year depending on the sequence of the QBO cycles of different scenarios.
The decrease phase of ΔTOZ continues about half a year in course of the current QBO cycle and later during half a year or one year in course of the next 24-month or 30-month QBO cycle, respectively. This is in accordance with the more prolonged stage of stagnation in 30-month scenarios.
Ju
l
Oct
Jan
Apr
Jul
Oct
Jan
Apr
Jul
Oct
Jan
-10
0
10
Jan
Ap
r
Ju
l
Oct
Jan
Ap
r
Jul
Oct
Jan
-10
0
10
Jan
Ap
r
Jul
Oc
t
Jan
Ap
r
Jul
Oct
Jan
Ap
r
Ju
l
-10
0
10
7050
30
10
-20 0 20
P, h
Pa
P, h
Pa
24-month scenario
Jan
U, m/s
30-month scenario (beginning in January)
P, h
Pa
Apr
Jul
Oct
Jan
Apr
Jul
Oct
Jan
Apr
Jul
7050
30
10
-20 0 20 U, m/s
Jan
Apr
Jul
Oct
Jan
Apr
Jul
Oct
Jan
7050
30
10
-20 0 20
Jul
U, m/s
30-month scenario (beginning in July)
Oct
Jan
Apr
Jul
Oct
Jan
Apr
Jul
Oct
Jan
T
OZ
, D
U
T
OZ
, DU
T
OZ
, D
U
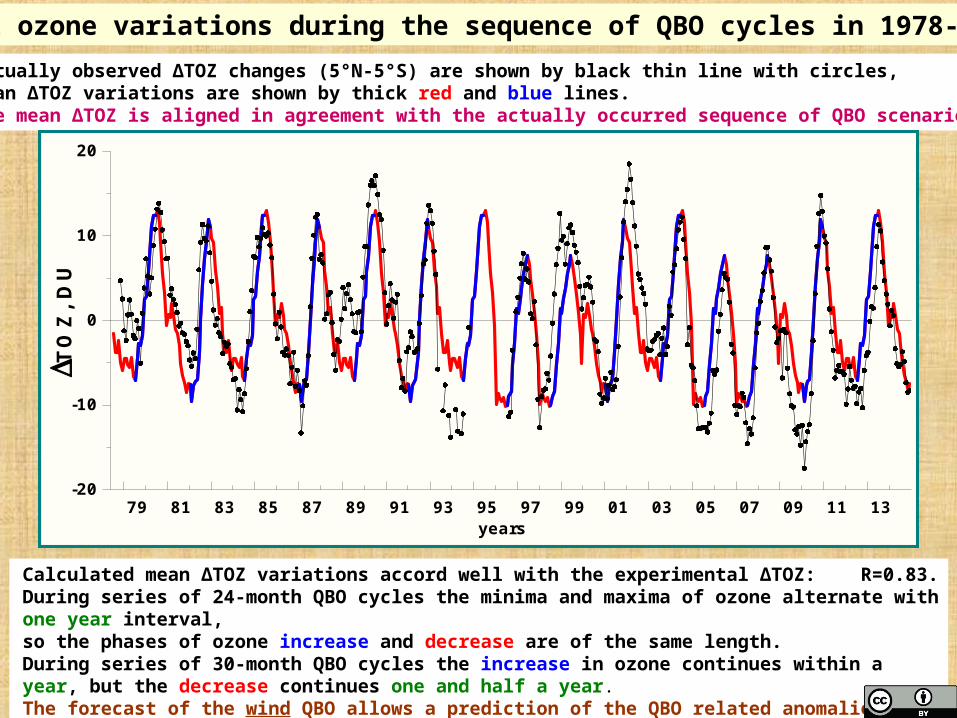
Total ozone variations during the sequence of QBO cycles in 1978-2014
Actually observed ΔTOZ changes (5°N-5°S) are shown by black thin line with circles,Mean ΔTOZ variations are shown by thick red and blue lines.The mean ΔTOZ is aligned in agreement with the actually occurred sequence of QBO scenarios.
Calculated mean ΔTOZ variations accord well with the experimental ΔTOZ: R=0.83. During series of 24-month QBO cycles the minima and maxima of ozone alternate with one year interval, so the phases of ozone increase and decrease are of the same length. During series of 30-month QBO cycles the increase in ozone continues within a year, but the decrease continues one and half a year.The forecast of the wind QBO allows a prediction of the QBO related anomalies in total ozone.
79 81 83 85 87 89 91 93 95 97 99 01 03 05 07 09 11 13-20
-10
0
10
20
years
TO
Z,
DU
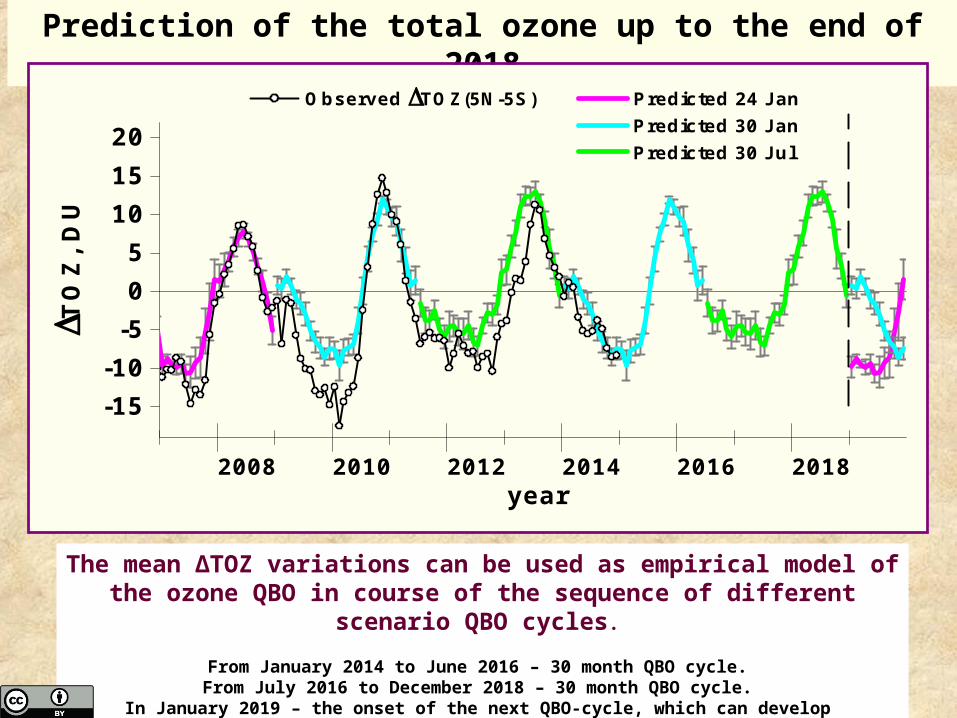
Prediction of the total ozone up to the end of 2018
The mean ΔTOZ variations can be used as empirical model of the ozone QBO in course of the sequence of different scenario QBO cycles.
From January 2014 to June 2016 – 30 month QBO cycle. From July 2016 to December 2018 – 30 month QBO cycle.
In January 2019 – the onset of the next QBO-cycle, which can develop in two alternative options: 24- or 30-month QBO scenario.
2008 2010 2012 2014 2016 2018
-15-10-505
101520
year
TO
Z,
DU
Observed TOZ(5N-5S) Predicted 24 Jan Predicted 30 Jan Predicted 30 Jul
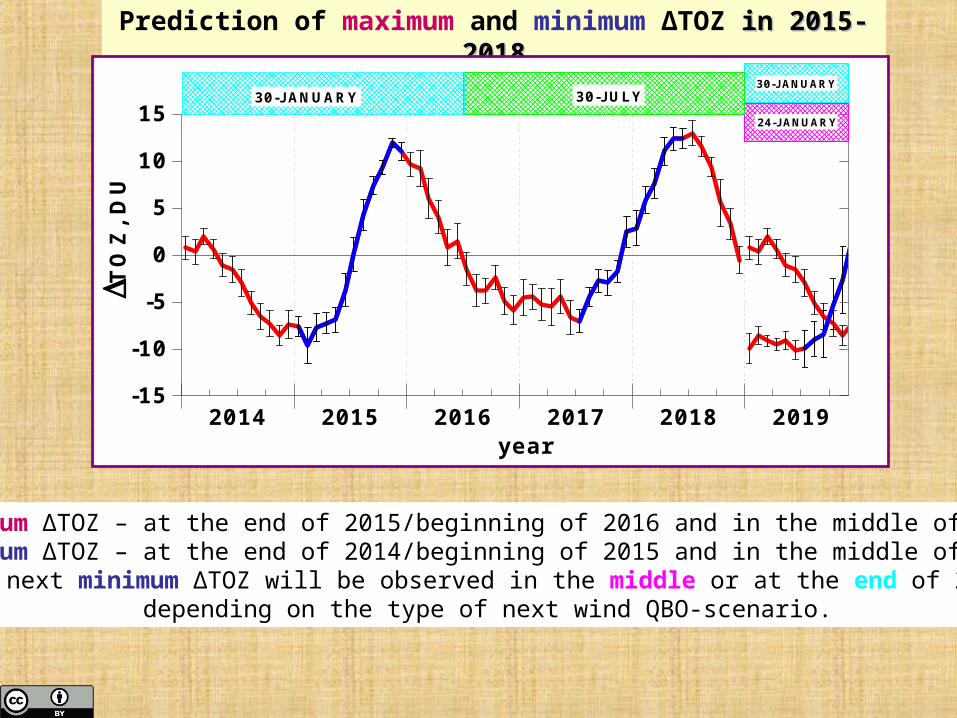
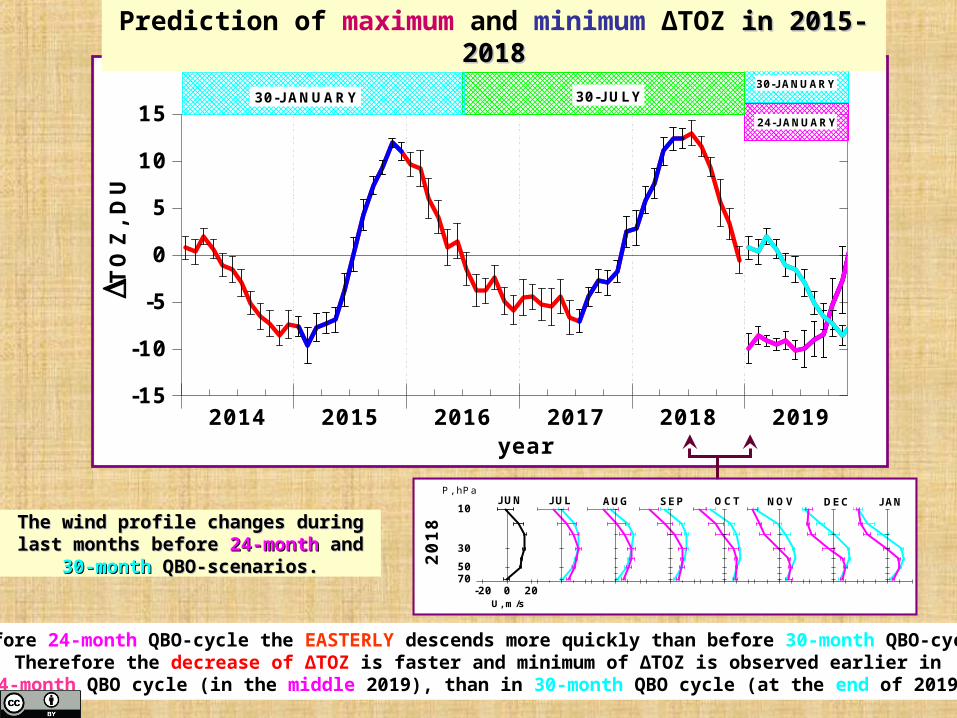
Prediction of maximum and minimum ΔTOZ in 2015-2018in 2015-2018
2014 2015 2016 2017 2018 2019-15
-10
-5
0
5
10
15
year
TO
Z,
DU
30-JANUARY 30-JULY30-JANUARY
24-JANUARY
Maximum ΔTOZ – at the end of 2015/beginning of 2016 and in the middle of 2018.Minimum ΔTOZ – at the end of 2014/beginning of 2015 and in the middle of 2017.
The next minimum ΔTOZ will be observed in the middle or at the end of 2019 depending on the type of next wind QBO-scenario.
2014 2015 2016 2017 2018 2019-15
-10
-5
0
5
10
15
year
TO
Z,
DU
30-JANUARY 30-JULY30-JANUARY
24-JANUARY
Prediction of maximum and minimum ΔTOZ in 2015-2018in 2015-2018
The wind profile changes during last The wind profile changes during last months before months before 24-month24-month and and 30-month30-month
QBO-scenarios.QBO-scenarios.
Before 24-month QBO-cycle the EASTERLY descends more quickly than before 30-month QBO-cycle.Therefore the decrease of ΔTOZ is faster and minimum of ΔTOZ is observed earlier in
24-month QBO cycle (in the middle 2019), than in 30-month QBO cycle (at the end of 2019).
7050
30
10
-20 0 20 U, m/s
JUN
JUL AUG
SEP
OCT
20
18
NOV
DEC
JAN
P, hPa

CONCLUSIONSCONCLUSIONS
1. The EASTERLY wind regime descent demonstrates an invariable relation to seasons:The EASTERLY halts near the solstice and is resumed in one of subsequent equinoxes. Seasonal attachment of the
stagnation causes its discrete length: one, three, or five seasons.The discrete duration of stagnation predetermines the discreteness of the QBO periods: 24, 30, or 36 months.
2. The discretely varying length of the EASTERLY stagnation and the discreteness of QBO period cause the quite definite duration of decrease and increase phases of the QBO related anomalies of equatorial total ozone (TOZ).
The increase phase of TOZ has the same duration in all types of QBO scenarios and continues always within a year.The length of TOZ decrease phase varies discretely and can be equal to one year or one and half a year depending on the
sequence of the QBO scenarios.
3. Seasonal regularity of the EASTERLY descent and arising from it the discreteness of the QBO period makes it possible to forecast the duration of current QBO cycle and the starting date of next QBO cycle.
The technique for prediction of the QBO cycle evolution has been elaborated basing on the wind height profiles data and verified for QBO cycle proceeded during 2005-2014.
4. Basing on the total regularities of QBO cycle evolution the prediction has been made for the next two QBO cycles in 2014-2018:
The current QBO cycle starting in January 2014 will last 30 months and will end in June 2016. The subsequent QBO cycle will begin in July 2016 and will complete in December 2018. Hereafter the next QBO cycle will begin in January 2019, and regular stagnation will continue at least until March-April 2019.
5. The forecast of the wind QBO provides the ability to predict the QBO related variations of equatorial total ozone up to the end of 2018:
Maximum TOZ will be observed at the end of 2015/beginning of 2016 and in the middle of 2018,Minimum TOZ will be observed at the end of 2014/beginning of 2015 and in the middle of 2017.The next minimum TOZ will be observed in the middle or at the end of 2019 depending on the type of next wind QBO scenario.

At present the questions remain open:
(1) what causes the stagnation during each easterly wind regime descent?
(2) why are the stagnations with beginning in July always long?
(3) what is the reason of two alternative durations (long or short) of stagnations with beginning in January?
The additional investigations are necessary to further elucidate the physical mechanism of the stagnation in course of the easterly wind regime descent.
1955 1965 1975 1985 1995 2005 2015
80
120
160
200
240
24
24 Jan 30 Jan 30 Jul 36 Jan
year
2322212019
F10
.7 ,
W / m
2 / Hz
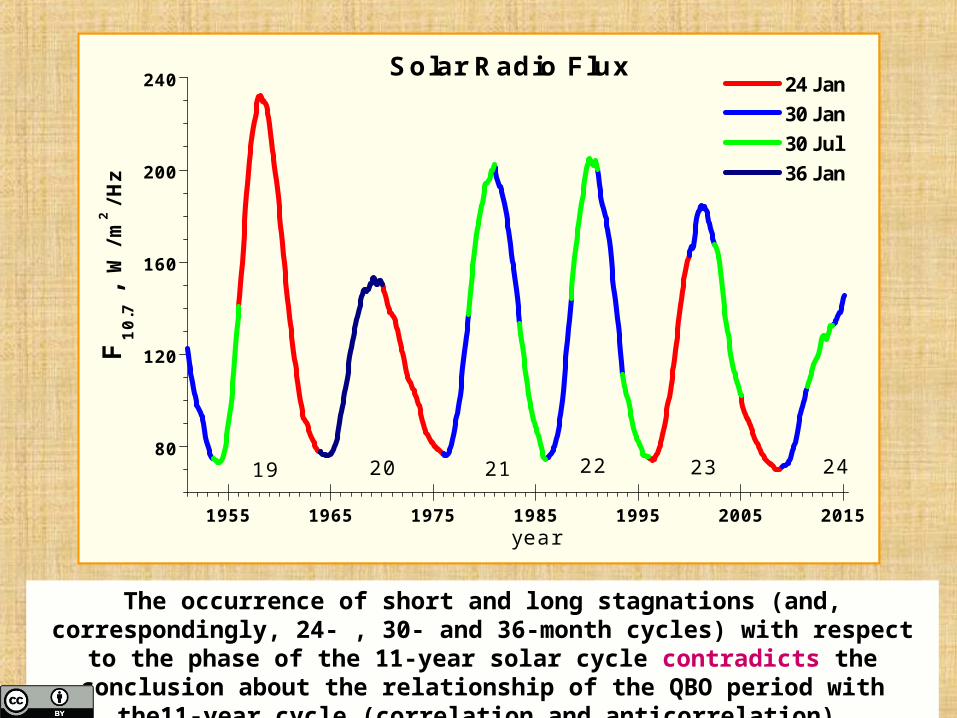
Solar Radio Flux
The occurrence of short and long stagnations (and, correspondingly, 24- , 30- and 36-month cycles) with respect to the phase of the 11-year solar cycle contradicts the conclusion about the relationship of the QBO period with
the11-year cycle (correlation and anticorrelation)