Embed Size (px)
Citation preview
The Patterns of Histone Modifications in the Vicinity ofTranscription Factor Binding Sites in HumanLymphoblastoid Cell LinesYumin Nie, Hongde Liu, Xiao Sun*
State Key Laboratory of Bioelectronics, School of Biological Science & Medical Engineering, Southeast University, Nanjing, China
Abstract
Transcription factor (TF) binding at specific DNA sequences is the fundamental step in transcriptional regulation and ishighly dependent on the chromatin structure context, which may be affected by specific histone modifications and variants,known as histone marks. The lack of a global binding map for hundreds of TFs means that previous studies have focusedmainly on histone marks at binding sites for several specific TFs. We therefore studied 11 histone marks aroundcomputationally-inferred and experimentally-determined TF binding sites (TFBSs), based on 164 and 34 TFs, respectively, inhuman lymphoblastoid cell lines. For H2A.Z, methylation of H3K4, and acetylation of H3K27 and H3K9, the mark patternsexhibited bimodal distributions and strong pairwise correlations in the 600-bp region around enriched TFBSs, suggestingthat these marks mainly coexist within the two nucleosomes proximal to the TF sites. TFs competing with nucleosomes toaccess DNA at most binding sites, contributes to the bimodal distribution, which is a common feature of histone marks forTF binding. Mark H3K79me2 showed a unimodal distribution on one side of TFBSs and the signals extended up to 4000 bp,indicating a longer-distance pattern. Interestingly, H4K20me1, H3K27me3, H3K36me3 and H3K9me3, which were morediffuse and less enriched surrounding TFBSs, showed unimodal distributions around the enriched TFBSs, suggesting thatsome TFs may bind to nucleosomal DNA. Besides, asymmetrical distributions of H3K36me3 and H3K9me3 indicated thatrepressors might establish a repressive chromatin structure in one direction to repress gene expression. In conclusion, thisstudy demonstrated the ranges of histone marks associated with TF binding, and the common features of these marksaround the binding sites. These findings have epigenetic implications for future analysis of regulatory elements.
Citation: Nie Y, Liu H, Sun X (2013) The Patterns of Histone Modifications in the Vicinity of Transcription Factor Binding Sites in Human Lymphoblastoid CellLines. PLoS ONE 8(3): e60002. doi:10.1371/journal.pone.0060002
Editor: I. King Jordan, Georgia Institute of Technology, United States of America
Received July 12, 2012; Accepted February 25, 2013; Published March 19, 2013
Copyright: � 2013 Nie et al. This is an open-access article distributed under the terms of the Creative Commons Attribution License, which permits unrestricteduse, distribution, and reproduction in any medium, provided the original author and source are credited.
Funding: This work was supported by a grant from the National Basic Research Program of China (No. 2012CB316501) and the National Natural ScienceFoundation of China (No. 61073141). The funders had no role in study design, data collection and analysis, decision to publish, or preparation of the manuscript.
Competing Interests: The authors have declared that no competing interests exist.
* E-mail: [email protected]
Introduction
Most eukaryotic genomic DNA is packaged into chromatin
structure to achieve high compaction. The basic units of
chromatin structure are nucleosomes, consisting of an octamer
of four core histones (H2A, H2B, H3 and H4) wrapped in 146
base pairs (bps) of DNA [1,2]. Nucleosomal histones are subject to
specific posttranslational modifications and variants, known as
histone marks, which may affect the chromatin structure and thus
play crucial roles in regulating gene expression in a cell-type-
specific manner [3–7]. A comprehensive analysis of 39 different
histone methylation and acetylation marks in human CD4+T cells
has indicated that most modifications, except H3K27me2,
H3K27me3, H3K9me2, H3K9me3 and H4K20me3, are associ-
ated with gene activation [8,9], and specific combinations of
chromatin marks are correlated with various genomic regions
[5,10]. For example, H3K4me2, H3K4me3, histone acetylation
and H2A.Z are commonly located in active promoters, while
H3K36me3 and H3K79me2 are enriched in transcribed regions
[5].
Transcription factors (TFs) bind to specific DNA sequences and
interact with components of the polymerase complex or with other
complexes to initiate transcription in eukaryotes, and this process
is highly associated with specific histone variants and modifications
[11–14]. It has been suggested that enhancers are characterized by
H3K4me1 and H3K4me2 [15,16], while CTCF (CCCTC-
binding factor) binding sites are enriched with H2A.Z,
H3K9me1 and all three states of H3K4 methylation and may
function as barriers separating active and repressive regions of
chromatin [8,17]. However, TF binding is a dynamic process that
varies between species, individuals within the same species, and
even alleles within the same individual [18], making it difficult to
identify binding locations for large numbers of factors in specific
cell types. Previous studies have therefore focused mainly on
histone marks around binding sites for few specific TFs.
However, the development of experimental technology and
computational algorithms has permitted further progress in
detecting TF binding along the genome. Recent advances in
chromatin immunoprecipitation followed by sequencing (ChIP-
seq) have allowed investigators to determine experimentally the
genome-wide binding locations for specific TFs in a given cell type
[12,19,20]. However, ChIP-seq is only applied to one TF in a
single experiment, and it would therefore be time-consuming to
create a global binding map for all TFs in the human genome by
ChIP-seq. Computational methods that integrate genome
PLOS ONE | www.plosone.org 1 March 2013 | Volume 8 | Issue 3 | e60002

sequence information and cell-specific experimental data, howev-
er, have the advantage of allowing accurate profiles for many
factors in a specific sample to be determined [21–23], and a
genome-wide map of 827,000 TF binding sites (TFBSs) in a
human lymphoblastoid cell line has been completed using the
CENTIPEDE algorithm [23].
To better understand the relationship between histone modifi-
cations and TF binding, we examined the enrichment profiles of
11 available histone marks in different windows at CENTIPEDE
and ChIP-seq binding sites, respectively, in a human lymphoblas-
toid cell line, to provide a basis for the choice of an informative
mark window size. The intensities of histone marks at TFBSs are
generally represented by the number of tags in a specific window
around the site [23], and a site is considered to be enriched with a
mark if the tag count exceeds the threshold set for the mark. We
subsequently explored the patterns of 11 histone marks and
discovered that most marks showed bimodal distributions around
binding sites, but differed in the distances between the two local
maxima. We then focused on two sets of binding sites classified by
the distance of the sites relative to the nearest gene and the
functions of the bound TFs, to test whether the marks exhibited
distinct patterns around these sites. We finally investigated the
pairwise correlations between the histone marks at TFBSs. All the
analyses were applied to CENTIPEDE and ChIP-seq sites,
respectively.
Results
Enrichment of histone marks at binding sitesWe examined the relative enrichments of H2A.Z, H3K4me1,
H3K4me2, H3K4me3, H3K9ac, H3K27ac, H3K79me2,
H4K20me1, H3K27me3, H3K36me3 and H3K9me3 at CEN-
TIPEDE binding sites, as described in the Materials and Methods.
The marks were enriched to different degrees in different windows
(Figure 1). Previous studies found that some enhancers were
marked by histone modification H3K4me1 or H3K4me2 [15,16],
while our results also indicated higher frequencies of H2A.Z,
H3K4me3, H3K27ac and H3K9ac at TFBSs. More than 50% of
CENTIPEDE sites were enriched with the above marks, except
for H3K4me1, at a window size of 600 bp, while 70% of sites were
enriched with H3K4me1, with the highest frequency at a window
size of 4000 bp.
All the histone marks were more enriched at CENTIPEDE sites
compared with the genome as a whole (One-sided binomial test,
p,2.2610216), indicating an association between histone modi-
fications and TF binding in transcription. However, the modified
regions associated with binding differed widely between marks
(Figure 1). In the cases of H2A.Z, H3K4me2, H3K4me3,
H3K27ac and H3K9ac, the percentage of enriched sites remained
stable at window sizes greater than 600 bp, indicating that the five
marks were associated with binding over a range in the 600-bp
region around binding sites. The regions for H3K4me1 and
H3K79me2 marks, however, extended to 4000 bp, and were even
larger for H4K20me1, H3K27me3, H3K36me3 and H3K9me3.
We therefore considered the latter four marks as long-range
marks, and the other seven as short-range marks.
The same conclusions were reached by analysing the ChIP-seq
binding sites (Figure S1). However, compared with the CENTI-
PEDE sites, ChIP-seq sites showed a slightly lower enrichment for
most of the marks. CENTIPEDE sites tend to be in the proximity
of transcription start sites (TSSs) [23], while more ChIP-seq sites
are located in the distal regions. We inferred this might account for
the higher enrichment of CENTIPEDE sites.
The total number of mapped tags in each sample ranged from
14.5 million (M) to 33.0 M. In order to test whether the different
number of tags had a great influence on the definition of the
threshold, 10 M tags for each mark were randomly sampled to
repeat the enrichment analysis. Both CENTIPEDE and ChIP-seq
analyses (Figure S2) indicated a decrease in the proportion of sites
enriched with each mark, especially in the cases of H2A.Z,
H3K4me1, H3K4me3 and H3K79me2. However, compared with
the previous results, each mark showed the similar enrichment
tendency with increasing window size, indicating that H2A.Z,
H3K4me2, H3K4me3, H3K27ac, H3K9ac, H3K4me1 and
H3K79me2 were associated with binding in the 4000-bp region
and the regions for H4K20me1, H3K27me3, H3K36me3 and
H3K9me3 were longer, which was consistent with the previous
definition of short- and long-range marks.
Patterns of histone marks around binding sitesTo account for the different regions of histone marks, we
investigated the mark patterns around the CENTIPEDE (Figure 2)
and ChIP-seq sites, respectively (Figure S3). Both sets of results
indicated that the six short-range marks H2A.Z, H3K4me2,
H3K4me3, H3K27ac, H3K9ac and H3K4me1, which were
associated with TF accessibility within 4000 bp, showed bimodal
distributions around the binding sites. These short-range marks
decreased at the binding sites and decreased with increasing
distance in the flanking regions. H3K79me2, which differed from
other short-range marks, exhibited a strong peak on one side of
TFBSs. Because of their lower enrichments at binding sites, the
signals of the long-range marks H4K20me1, H3K27me3,
H3K36me3 and H3K9me3 were so weak that the obvious mark
patterns were not observed.
We also examined the average nucleosome occupancy around
CENTIPEDE sites, and observed nucleosome-free regions (NFRs)
at the binding sites (Figure 2), suggesting that the lower mark
Figure 1. Proportion of CENTIPEDE binding sites enriched withhistone marks in different windows. Histone marks showeddifferent tendencies with increasing window size, indicating that themarks were associated with TF binding within different regions aroundbinding sites. Enrichment was determined by comparing the number oftags mapping in the window region surrounding the sites with thethreshold set for the mark. Sites with more tags than the threshold wereconsidered as enriched sites.doi:10.1371/journal.pone.0060002.g001
Patterns of Histone Modifications around TFBSs
PLOS ONE | www.plosone.org 2 March 2013 | Volume 8 | Issue 3 | e60002
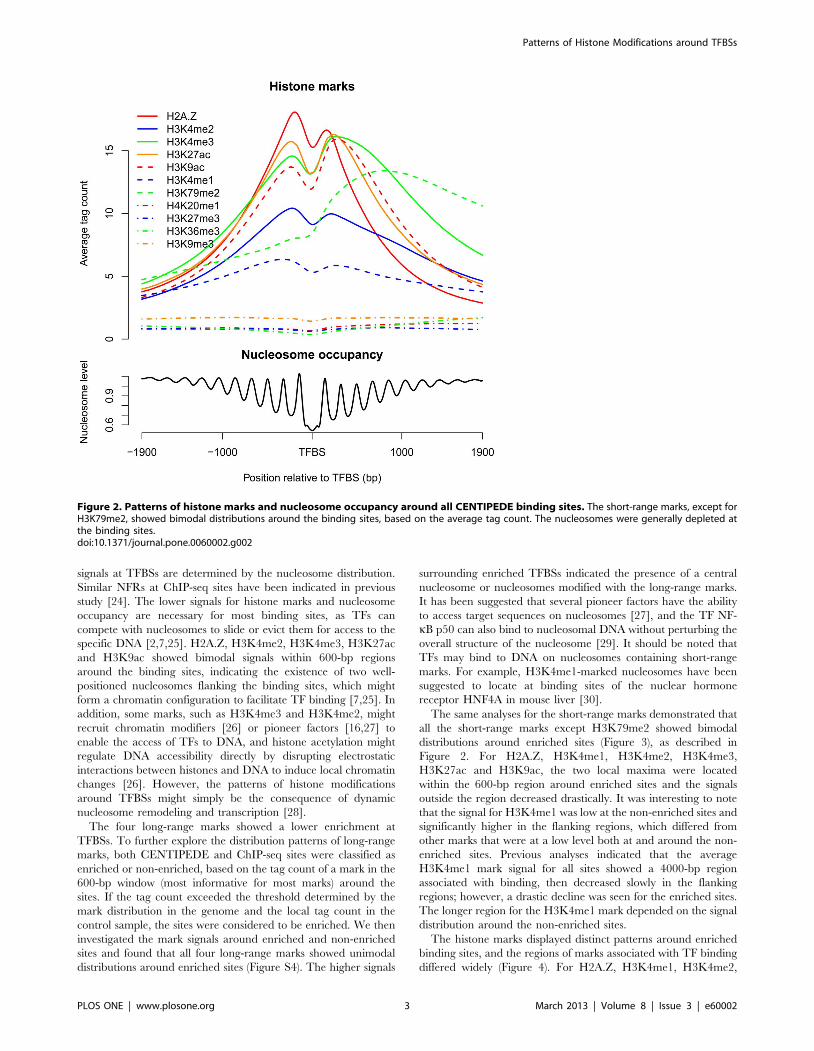
signals at TFBSs are determined by the nucleosome distribution.
Similar NFRs at ChIP-seq sites have been indicated in previous
study [24]. The lower signals for histone marks and nucleosome
occupancy are necessary for most binding sites, as TFs can
compete with nucleosomes to slide or evict them for access to the
specific DNA [2,7,25]. H2A.Z, H3K4me2, H3K4me3, H3K27ac
and H3K9ac showed bimodal signals within 600-bp regions
around the binding sites, indicating the existence of two well-
positioned nucleosomes flanking the binding sites, which might
form a chromatin configuration to facilitate TF binding [7,25]. In
addition, some marks, such as H3K4me3 and H3K4me2, might
recruit chromatin modifiers [26] or pioneer factors [16,27] to
enable the access of TFs to DNA, and histone acetylation might
regulate DNA accessibility directly by disrupting electrostatic
interactions between histones and DNA to induce local chromatin
changes [26]. However, the patterns of histone modifications
around TFBSs might simply be the consequence of dynamic
nucleosome remodeling and transcription [28].
The four long-range marks showed a lower enrichment at
TFBSs. To further explore the distribution patterns of long-range
marks, both CENTIPEDE and ChIP-seq sites were classified as
enriched or non-enriched, based on the tag count of a mark in the
600-bp window (most informative for most marks) around the
sites. If the tag count exceeded the threshold determined by the
mark distribution in the genome and the local tag count in the
control sample, the sites were considered to be enriched. We then
investigated the mark signals around enriched and non-enriched
sites and found that all four long-range marks showed unimodal
distributions around enriched sites (Figure S4). The higher signals
surrounding enriched TFBSs indicated the presence of a central
nucleosome or nucleosomes modified with the long-range marks.
It has been suggested that several pioneer factors have the ability
to access target sequences on nucleosomes [27], and the TF NF-
kB p50 can also bind to nucleosomal DNA without perturbing the
overall structure of the nucleosome [29]. It should be noted that
TFs may bind to DNA on nucleosomes containing short-range
marks. For example, H3K4me1-marked nucleosomes have been
suggested to locate at binding sites of the nuclear hormone
receptor HNF4A in mouse liver [30].
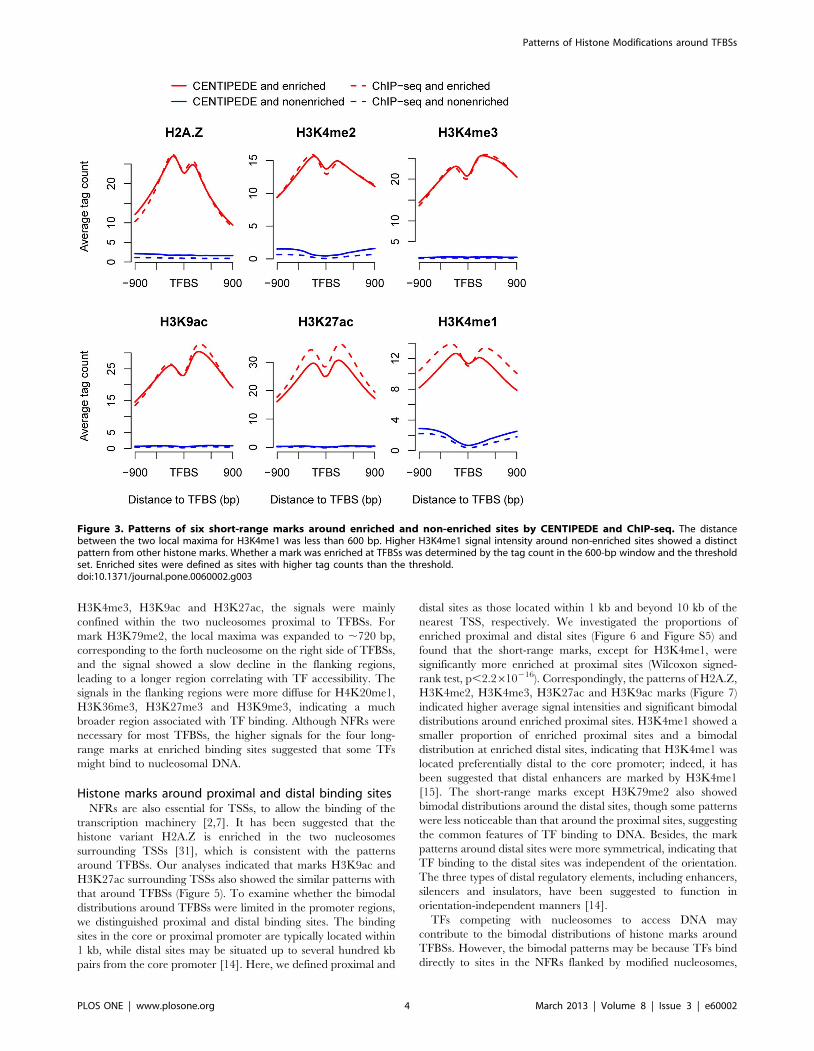
The same analyses for the short-range marks demonstrated that
all the short-range marks except H3K79me2 showed bimodal
distributions around enriched sites (Figure 3), as described in
Figure 2. For H2A.Z, H3K4me1, H3K4me2, H3K4me3,
H3K27ac and H3K9ac, the two local maxima were located
within the 600-bp region around enriched sites and the signals
outside the region decreased drastically. It was interesting to note
that the signal for H3K4me1 was low at the non-enriched sites and
significantly higher in the flanking regions, which differed from
other marks that were at a low level both at and around the non-
enriched sites. Previous analyses indicated that the average
H3K4me1 mark signal for all sites showed a 4000-bp region
associated with binding, then decreased slowly in the flanking
regions; however, a drastic decline was seen for the enriched sites.
The longer region for the H3K4me1 mark depended on the signal
distribution around the non-enriched sites.
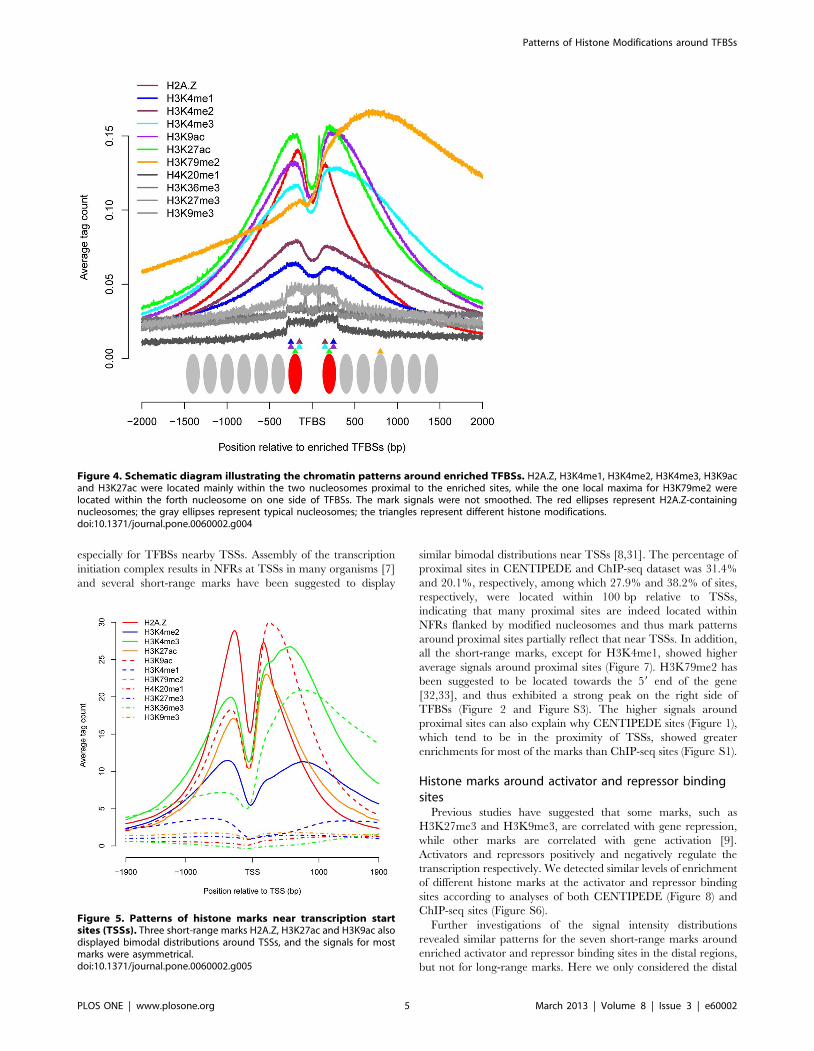
The histone marks displayed distinct patterns around enriched
binding sites, and the regions of marks associated with TF binding
differed widely (Figure 4). For H2A.Z, H3K4me1, H3K4me2,
Figure 2. Patterns of histone marks and nucleosome occupancy around all CENTIPEDE binding sites. The short-range marks, except forH3K79me2, showed bimodal distributions around the binding sites, based on the average tag count. The nucleosomes were generally depleted atthe binding sites.doi:10.1371/journal.pone.0060002.g002
Patterns of Histone Modifications around TFBSs
PLOS ONE | www.plosone.org 3 March 2013 | Volume 8 | Issue 3 | e60002
H3K4me3, H3K9ac and H3K27ac, the signals were mainly
confined within the two nucleosomes proximal to TFBSs. For
mark H3K79me2, the local maxima was expanded to ,720 bp,
corresponding to the forth nucleosome on the right side of TFBSs,
and the signal showed a slow decline in the flanking regions,
leading to a longer region correlating with TF accessibility. The
signals in the flanking regions were more diffuse for H4K20me1,
H3K36me3, H3K27me3 and H3K9me3, indicating a much
broader region associated with TF binding. Although NFRs were
necessary for most TFBSs, the higher signals for the four long-
range marks at enriched binding sites suggested that some TFs
might bind to nucleosomal DNA.
Histone marks around proximal and distal binding sitesNFRs are also essential for TSSs, to allow the binding of the
transcription machinery [2,7]. It has been suggested that the
histone variant H2A.Z is enriched in the two nucleosomes
surrounding TSSs [31], which is consistent with the patterns
around TFBSs. Our analyses indicated that marks H3K9ac and
H3K27ac surrounding TSSs also showed the similar patterns with
that around TFBSs (Figure 5). To examine whether the bimodal
distributions around TFBSs were limited in the promoter regions,
we distinguished proximal and distal binding sites. The binding
sites in the core or proximal promoter are typically located within
1 kb, while distal sites may be situated up to several hundred kb
pairs from the core promoter [14]. Here, we defined proximal and
distal sites as those located within 1 kb and beyond 10 kb of the
nearest TSS, respectively. We investigated the proportions of
enriched proximal and distal sites (Figure 6 and Figure S5) and
found that the short-range marks, except for H3K4me1, were
significantly more enriched at proximal sites (Wilcoxon signed-
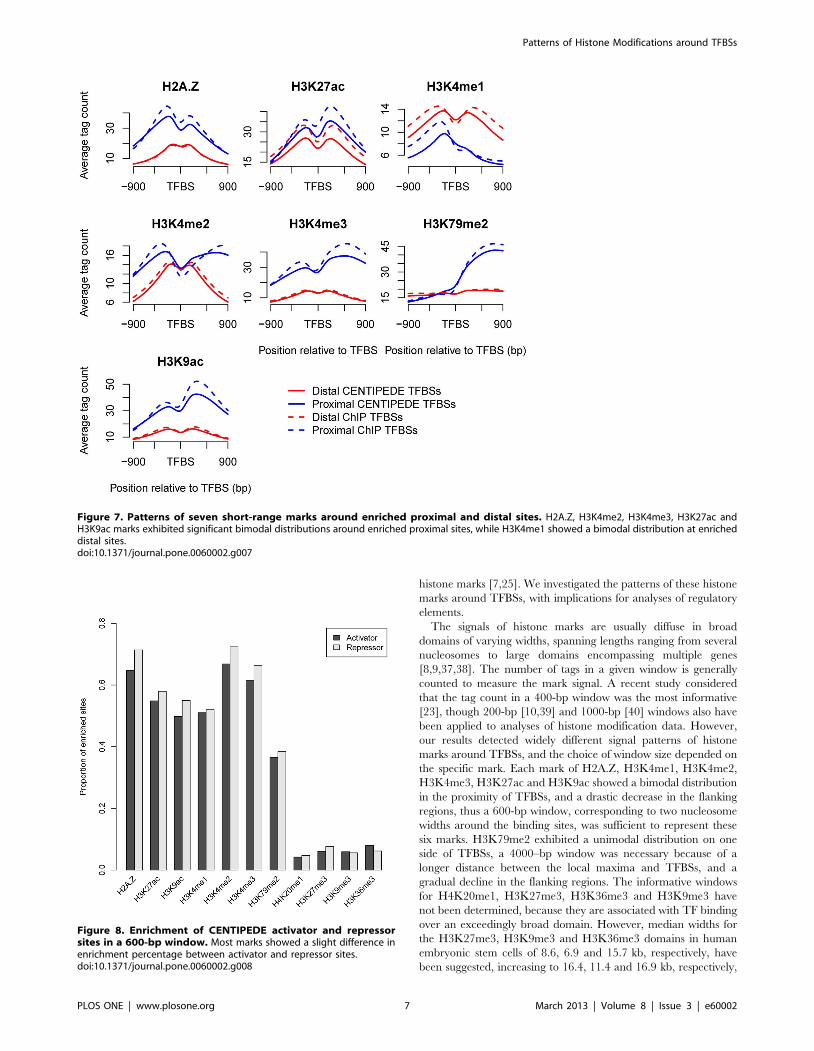
rank test, p,2.2610216). Correspondingly, the patterns of H2A.Z,
H3K4me2, H3K4me3, H3K27ac and H3K9ac marks (Figure 7)
indicated higher average signal intensities and significant bimodal
distributions around enriched proximal sites. H3K4me1 showed a
smaller proportion of enriched proximal sites and a bimodal
distribution at enriched distal sites, indicating that H3K4me1 was
located preferentially distal to the core promoter; indeed, it has
been suggested that distal enhancers are marked by H3K4me1
[15]. The short-range marks except H3K79me2 also showed
bimodal distributions around the distal sites, though some patterns
were less noticeable than that around the proximal sites, suggesting
the common features of TF binding to DNA. Besides, the mark
patterns around distal sites were more symmetrical, indicating that
TF binding to the distal sites was independent of the orientation.
The three types of distal regulatory elements, including enhancers,
silencers and insulators, have been suggested to function in
orientation-independent manners [14].
TFs competing with nucleosomes to access DNA may
contribute to the bimodal distributions of histone marks around
TFBSs. However, the bimodal patterns may be because TFs bind
directly to sites in the NFRs flanked by modified nucleosomes,
Figure 3. Patterns of six short-range marks around enriched and non-enriched sites by CENTIPEDE and ChIP-seq. The distancebetween the two local maxima for H3K4me1 was less than 600 bp. Higher H3K4me1 signal intensity around non-enriched sites showed a distinctpattern from other histone marks. Whether a mark was enriched at TFBSs was determined by the tag count in the 600-bp window and the thresholdset. Enriched sites were defined as sites with higher tag counts than the threshold.doi:10.1371/journal.pone.0060002.g003
Patterns of Histone Modifications around TFBSs
PLOS ONE | www.plosone.org 4 March 2013 | Volume 8 | Issue 3 | e60002
especially for TFBSs nearby TSSs. Assembly of the transcription
initiation complex results in NFRs at TSSs in many organisms [7]
and several short-range marks have been suggested to display
similar bimodal distributions near TSSs [8,31]. The percentage of
proximal sites in CENTIPEDE and ChIP-seq dataset was 31.4%
and 20.1%, respectively, among which 27.9% and 38.2% of sites,
respectively, were located within 100 bp relative to TSSs,
indicating that many proximal sites are indeed located within
NFRs flanked by modified nucleosomes and thus mark patterns
around proximal sites partially reflect that near TSSs. In addition,
all the short-range marks, except for H3K4me1, showed higher
average signals around proximal sites (Figure 7). H3K79me2 has
been suggested to be located towards the 59 end of the gene
[32,33], and thus exhibited a strong peak on the right side of
TFBSs (Figure 2 and Figure S3). The higher signals around
proximal sites can also explain why CENTIPEDE sites (Figure 1),
which tend to be in the proximity of TSSs, showed greater
enrichments for most of the marks than ChIP-seq sites (Figure S1).
Histone marks around activator and repressor bindingsites
Previous studies have suggested that some marks, such as
H3K27me3 and H3K9me3, are correlated with gene repression,
while other marks are correlated with gene activation [9].
Activators and repressors positively and negatively regulate the
transcription respectively. We detected similar levels of enrichment
of different histone marks at the activator and repressor binding
sites according to analyses of both CENTIPEDE (Figure 8) and
ChIP-seq sites (Figure S6).
Further investigations of the signal intensity distributions
revealed similar patterns for the seven short-range marks around
enriched activator and repressor binding sites in the distal regions,
but not for long-range marks. Here we only considered the distal
Figure 4. Schematic diagram illustrating the chromatin patterns around enriched TFBSs. H2A.Z, H3K4me1, H3K4me2, H3K4me3, H3K9acand H3K27ac were located mainly within the two nucleosomes proximal to the enriched sites, while the one local maxima for H3K79me2 werelocated within the forth nucleosome on one side of TFBSs. The mark signals were not smoothed. The red ellipses represent H2A.Z-containingnucleosomes; the gray ellipses represent typical nucleosomes; the triangles represent different histone modifications.doi:10.1371/journal.pone.0060002.g004
Figure 5. Patterns of histone marks near transcription startsites (TSSs). Three short-range marks H2A.Z, H3K27ac and H3K9ac alsodisplayed bimodal distributions around TSSs, and the signals for mostmarks were asymmetrical.doi:10.1371/journal.pone.0060002.g005
Patterns of Histone Modifications around TFBSs
PLOS ONE | www.plosone.org 5 March 2013 | Volume 8 | Issue 3 | e60002

activator and repressor sites to avoid the influence of TSSs. Each
of the six short-range marks H2A.Z, H3K4me1, H3K4me2,
H3K4me3, H3K27ac and H3K9ac showed similar bimodal
distributions around enriched activator and repressor sites
according to both CENTIPEDE and ChIP-seq analyses (Fig-
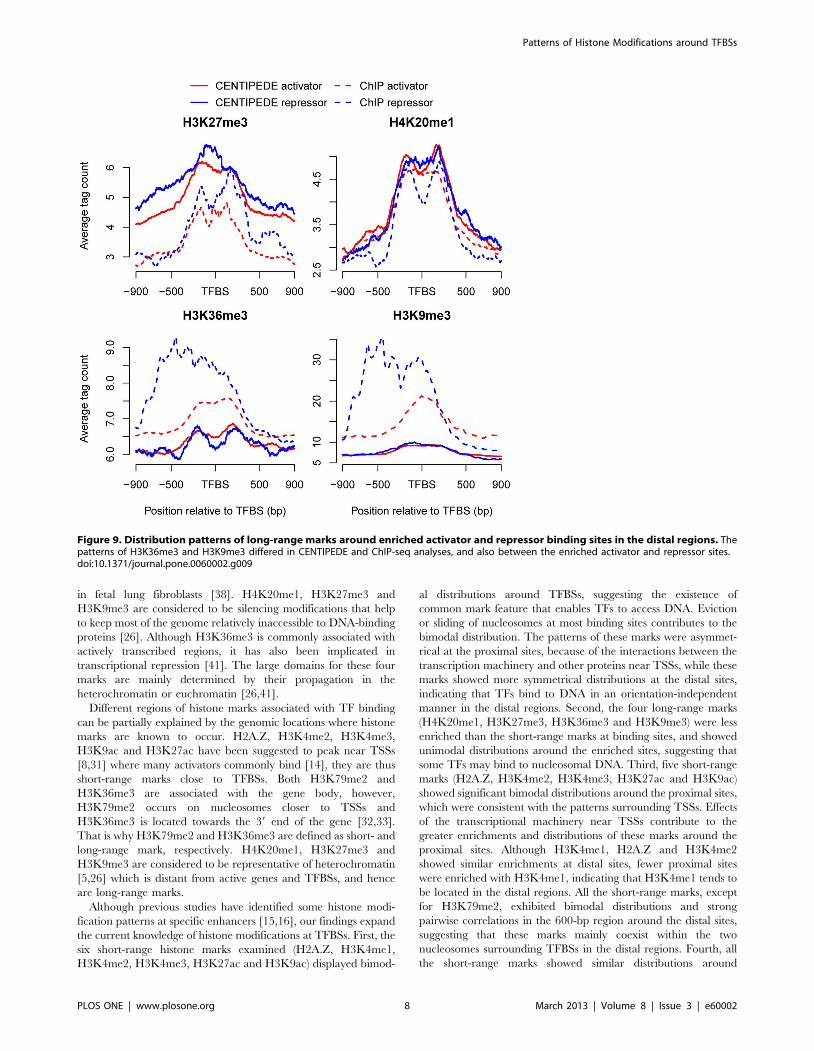
ure S7). However, the signal intensities of the two long-range
marks H3K36me3 and H3K9me3 differed between CENTIPEDE
and ChIP-seq analyses, and also between the enriched activator
and repressor binding sites (Figure 9). CENTIPEDE sites were
identified based on DNase-seq data reflecting chromatin accessi-
bility [34], and were more likely to be associated with open
chromatin [23], CENTIPEDE analysis thus showed similar mark
patterns for activator and repressor binding sites. However, the
two marks differed widely around activator and repressor binding
sites in the ChIP-seq analysis, suggesting different regulatory
mechanisms of activators and repressors. In some cases, repressors
may compete for the same site with an activator [35]. Alterna-
tively, repressors may establish a repressive chromatin structure to
prevent the activator accessing a promoter [14,36]. H3K36me3
and H3K9me3 showed higher signal intensities on one side of the
repressor sites in ChIP-seq analysis, suggesting that some
repressors might establish a repressive chromatin structure in
one direction. It should be noted that the average signal intensities
for long-range marks were much weaker than those for short-
range marks, indicating a finite function of long-range marks for
TF binding.
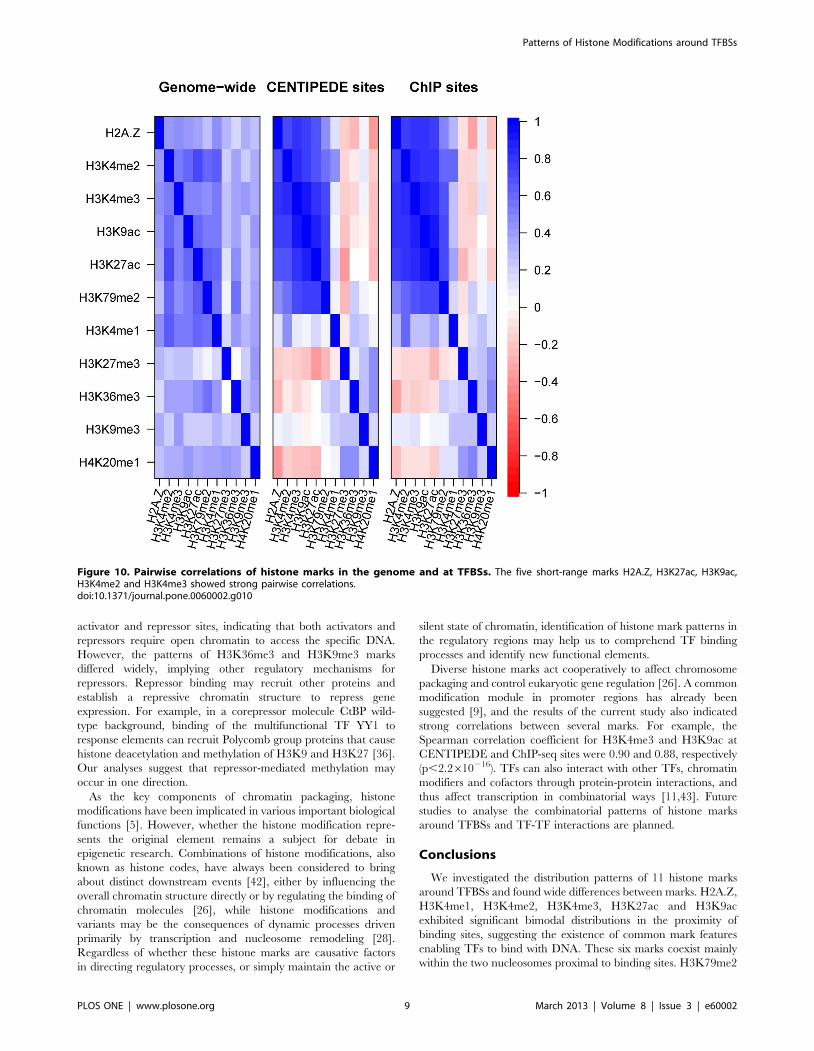
Correlations of histone marks at TFBSsDifferent histone marks can cross-talk [26], and thus exhibit
combinatorial patterns in the genome. It has been suggested that a
common module consisting of 17 modifications exists in promoter
regions [9]. We examined the modification module at TFBSs by
pairwise Spearman correlation analysis of the histone marks, using
a 600-bp window. Analyses of both CENTIPEDE and ChIP sites
(Figure 10) indicated that the five short-range marks H2A.Z,
H3K27ac, H3K9ac, H3K4me2 and H3K4me3 showed strong
pairwise correlations (r.0.65; p,2.2610216), consistent with the
notion that these marks coexist in the 600-bp region around the
binding sites. H3K79me2 was strongly correlated with H3K27ac,
H3K9ac and H3K4me3, but less strongly correlated with H2A.Z
and H3K4me2. H3K4me1 and four long-range marks showed
weaker correlations with each other and with other marks. The
same conclusion was obtained for correlation analyses of activator
and repressor binding sites, with little difference between the two
types of binding sites (Figure S8). However, the analyses of distal
and proximal sites indicated that both H3K4me1 and H3K4me2
were strongly correlated with H2A.Z, H3K27ac, H3K4me3 and
H3K9ac at distal, but not proximal sites (Figure S9). The results of
previous studies have suggested that H3K4me1 also coexists in the
600-bp region, and is mainly enriched at distal sites, H3K4me1 is
thus highly correlated with H2A.Z, H3K27ac, H3K4me2,
H3K4me3 and H3K9ac at distal sites.
Discussion
TF binding at specific DNA sequences is the initial and crucial
step of transcription in eukaryotes. Most genomic DNA in
eukaryotes is packaged into nucleosomes, and DNA accessibility
is thus strongly associated with chromatin structure [2,7,11,25].
Sites in NFRs are easier to access, while the accessibility of sites
within nucleosomes depends on the nucleosome dynamics, which
are affected by histone variants and modifications, referred to as
Figure 6. Enrichment of the CENTIPEDE proximal and distal sites in a 600-bp window. The short-range marks, except for H3K4me1,showed significantly higher enrichment at proximal sites.doi:10.1371/journal.pone.0060002.g006
Patterns of Histone Modifications around TFBSs
PLOS ONE | www.plosone.org 6 March 2013 | Volume 8 | Issue 3 | e60002
histone marks [7,25]. We investigated the patterns of these histone
marks around TFBSs, with implications for analyses of regulatory
elements.
The signals of histone marks are usually diffuse in broad
domains of varying widths, spanning lengths ranging from several
nucleosomes to large domains encompassing multiple genes
[8,9,37,38]. The number of tags in a given window is generally
counted to measure the mark signal. A recent study considered
that the tag count in a 400-bp window was the most informative
[23], though 200-bp [10,39] and 1000-bp [40] windows also have
been applied to analyses of histone modification data. However,
our results detected widely different signal patterns of histone
marks around TFBSs, and the choice of window size depended on
the specific mark. Each mark of H2A.Z, H3K4me1, H3K4me2,
H3K4me3, H3K27ac and H3K9ac showed a bimodal distribution
in the proximity of TFBSs, and a drastic decrease in the flanking
regions, thus a 600-bp window, corresponding to two nucleosome
widths around the binding sites, was sufficient to represent these
six marks. H3K79me2 exhibited a unimodal distribution on one
side of TFBSs, a 4000–bp window was necessary because of a
longer distance between the local maxima and TFBSs, and a
gradual decline in the flanking regions. The informative windows
for H4K20me1, H3K27me3, H3K36me3 and H3K9me3 have
not been determined, because they are associated with TF binding
over an exceedingly broad domain. However, median widths for
the H3K27me3, H3K9me3 and H3K36me3 domains in human
embryonic stem cells of 8.6, 6.9 and 15.7 kb, respectively, have
been suggested, increasing to 16.4, 11.4 and 16.9 kb, respectively,
Figure 7. Patterns of seven short-range marks around enriched proximal and distal sites. H2A.Z, H3K4me2, H3K4me3, H3K27ac andH3K9ac marks exhibited significant bimodal distributions around enriched proximal sites, while H3K4me1 showed a bimodal distribution at enricheddistal sites.doi:10.1371/journal.pone.0060002.g007
Figure 8. Enrichment of CENTIPEDE activator and repressorsites in a 600-bp window. Most marks showed a slight difference inenrichment percentage between activator and repressor sites.doi:10.1371/journal.pone.0060002.g008
Patterns of Histone Modifications around TFBSs
PLOS ONE | www.plosone.org 7 March 2013 | Volume 8 | Issue 3 | e60002
in fetal lung fibroblasts [38]. H4K20me1, H3K27me3 and
H3K9me3 are considered to be silencing modifications that help
to keep most of the genome relatively inaccessible to DNA-binding
proteins [26]. Although H3K36me3 is commonly associated with
actively transcribed regions, it has also been implicated in
transcriptional repression [41]. The large domains for these four
marks are mainly determined by their propagation in the
heterochromatin or euchromatin [26,41].
Different regions of histone marks associated with TF binding
can be partially explained by the genomic locations where histone
marks are known to occur. H2A.Z, H3K4me2, H3K4me3,
H3K9ac and H3K27ac have been suggested to peak near TSSs
[8,31] where many activators commonly bind [14], they are thus
short-range marks close to TFBSs. Both H3K79me2 and
H3K36me3 are associated with the gene body, however,
H3K79me2 occurs on nucleosomes closer to TSSs and
H3K36me3 is located towards the 39 end of the gene [32,33].
That is why H3K79me2 and H3K36me3 are defined as short- and
long-range mark, respectively. H4K20me1, H3K27me3 and
H3K9me3 are considered to be representative of heterochromatin
[5,26] which is distant from active genes and TFBSs, and hence
are long-range marks.
Although previous studies have identified some histone modi-
fication patterns at specific enhancers [15,16], our findings expand
the current knowledge of histone modifications at TFBSs. First, the
six short-range histone marks examined (H2A.Z, H3K4me1,
H3K4me2, H3K4me3, H3K27ac and H3K9ac) displayed bimod-
al distributions around TFBSs, suggesting the existence of
common mark feature that enables TFs to access DNA. Eviction
or sliding of nucleosomes at most binding sites contributes to the
bimodal distribution. The patterns of these marks were asymmet-
rical at the proximal sites, because of the interactions between the
transcription machinery and other proteins near TSSs, while these
marks showed more symmetrical distributions at the distal sites,
indicating that TFs bind to DNA in an orientation-independent
manner in the distal regions. Second, the four long-range marks
(H4K20me1, H3K27me3, H3K36me3 and H3K9me3) were less
enriched than the short-range marks at binding sites, and showed
unimodal distributions around the enriched sites, suggesting that
some TFs may bind to nucleosomal DNA. Third, five short-range
marks (H2A.Z, H3K4me2, H3K4me3, H3K27ac and H3K9ac)
showed significant bimodal distributions around the proximal sites,
which were consistent with the patterns surrounding TSSs. Effects
of the transcriptional machinery near TSSs contribute to the
greater enrichments and distributions of these marks around the
proximal sites. Although H3K4me1, H2A.Z and H3K4me2
showed similar enrichments at distal sites, fewer proximal sites
were enriched with H3K4me1, indicating that H3K4me1 tends to
be located in the distal regions. All the short-range marks, except
for H3K79me2, exhibited bimodal distributions and strong
pairwise correlations in the 600-bp region around the distal sites,
suggesting that these marks mainly coexist within the two
nucleosomes surrounding TFBSs in the distal regions. Fourth, all
the short-range marks showed similar distributions around
Figure 9. Distribution patterns of long-range marks around enriched activator and repressor binding sites in the distal regions. Thepatterns of H3K36me3 and H3K9me3 differed in CENTIPEDE and ChIP-seq analyses, and also between the enriched activator and repressor sites.doi:10.1371/journal.pone.0060002.g009
Patterns of Histone Modifications around TFBSs
PLOS ONE | www.plosone.org 8 March 2013 | Volume 8 | Issue 3 | e60002
activator and repressor sites, indicating that both activators and
repressors require open chromatin to access the specific DNA.
However, the patterns of H3K36me3 and H3K9me3 marks
differed widely, implying other regulatory mechanisms for
repressors. Repressor binding may recruit other proteins and
establish a repressive chromatin structure to repress gene
expression. For example, in a corepressor molecule CtBP wild-
type background, binding of the multifunctional TF YY1 to
response elements can recruit Polycomb group proteins that cause
histone deacetylation and methylation of H3K9 and H3K27 [36].
Our analyses suggest that repressor-mediated methylation may
occur in one direction.
As the key components of chromatin packaging, histone
modifications have been implicated in various important biological
functions [5]. However, whether the histone modification repre-
sents the original element remains a subject for debate in
epigenetic research. Combinations of histone modifications, also
known as histone codes, have always been considered to bring
about distinct downstream events [42], either by influencing the
overall chromatin structure directly or by regulating the binding of
chromatin molecules [26], while histone modifications and
variants may be the consequences of dynamic processes driven
primarily by transcription and nucleosome remodeling [28].
Regardless of whether these histone marks are causative factors
in directing regulatory processes, or simply maintain the active or
silent state of chromatin, identification of histone mark patterns in
the regulatory regions may help us to comprehend TF binding
processes and identify new functional elements.
Diverse histone marks act cooperatively to affect chromosome
packaging and control eukaryotic gene regulation [26]. A common
modification module in promoter regions has already been
suggested [9], and the results of the current study also indicated
strong correlations between several marks. For example, the
Spearman correlation coefficient for H3K4me3 and H3K9ac at
CENTIPEDE and ChIP-seq sites were 0.90 and 0.88, respectively
(p,2.2610216). TFs can also interact with other TFs, chromatin
modifiers and cofactors through protein-protein interactions, and
thus affect transcription in combinatorial ways [11,43]. Future
studies to analyse the combinatorial patterns of histone marks
around TFBSs and TF-TF interactions are planned.
Conclusions
We investigated the distribution patterns of 11 histone marks
around TFBSs and found wide differences between marks. H2A.Z,
H3K4me1, H3K4me2, H3K4me3, H3K27ac and H3K9ac
exhibited significant bimodal distributions in the proximity of
binding sites, suggesting the existence of common mark features
enabling TFs to bind with DNA. These six marks coexist mainly
within the two nucleosomes proximal to binding sites. H3K79me2
Figure 10. Pairwise correlations of histone marks in the genome and at TFBSs. The five short-range marks H2A.Z, H3K27ac, H3K9ac,H3K4me2 and H3K4me3 showed strong pairwise correlations.doi:10.1371/journal.pone.0060002.g010
Patterns of Histone Modifications around TFBSs
PLOS ONE | www.plosone.org 9 March 2013 | Volume 8 | Issue 3 | e60002

showed a unimodal distribution on one side of TFBSs and the
local maxima was located ,720 bp relative to TFBSs.
H4K20me1, H3K27me3, H3K36me3 and H3K9me3 were more
diffuse and less enriched. The latter two marks showed higher
signals on one side of enriched sites in the distal regions, indicating
the existence of repressors with specific regulatory mechanisms.
These results provide insight into the correlations between histone
marks and TFBSs, and provide useful epigenetic information for
mapping regulatory elements in the genome.
Materials and Methods
Data sourceChIP-seq data generated by the Broad/MGH ENCODE group
[6], corresponding to 10 histone modifications, one histone variant
H2A.Z and input control dataset in the GM12878 cell line, were
downloaded from the UCSC ftp server (http://genome.ucsc.edu).
Downloaded files display tags aligned to the human reference
genome hg19 in BAM format and we therefore converted these to
BED format using BEDTools [44]. We then combined the tags for
multiple experimental replicates of the same mark and filtered out
tags with a quality score ,10 [23]. We finally applied a shift of 100
bases to the genomic coordinates of all tags in the 59 to 39
direction, as described previously [10]. The nucleosome occupan-
cy data in the GM12878 cell line, generated by the Snyder
laboratory, was also downloaded from the UCSC ftp server
(http://genome.ucsc.edu).
The hg19 RefSeq gene annotations and the RNA-seq expres-
sion data for the GM12878 cell line were obtained from the
UCSC website browser (http://genome.ucsc.edu). Non-protein-
coding transcripts were excluded. For alternatively spliced
transcripts encoding the same protein, only the transcript with
the highest expression value was used and transcript expression
was quantified in reads per kilobase of exon per million mapped
sequence reads [45]. Finally 18,937 TSSs of RefSeq genes were
used to investigate the mark patterns around TSSs and define the
distance between binding sites and the nearest TSS.
ChIP-seq peak files generated by Myers lab [46], displaying
binding regions of 34 TFs along the whole genome in the
GM12878 cell line, were downloaded from the UCSC website
browser (http://genome.ucsc.edu). The center location of each
peak region was considered as the real binding site.
A total of 775,270 binding sites for 164 TFs estimated with
CENTIPEDE in the GM12878 cell line, were downloaded from
http://centipede.uchicago.edu/. The initial data downloaded
were mapped to the human reference genome hg18, and the
binding locations were therefore converted from hg18 to hg19
using liftOver, provided by UCSC, and binding sites located on
the Y chromosome and unplaced sequences on reference
chromosomes were also removed.
Enrichment of a histone markHistone mark intensities at TFBSs were represented by the
number of tags in a specific window around the sites, as described
previously [23]. To determine whether a histone mark was
enriched at a binding location, we identified a threshold based on
the distribution of the mark tag count in the genome and the local
tag count in the control sample; if the mark tag count in the
window around a binding site was greater than the threshold, the
mark was considered to be enriched at that site.
The threshold for each mark was calculated as follows: for a
specific window size centered at a site, the number of tags in a
window X was hypothesized to follow a Poisson distribution
parameterized by a dynamic parameter, llocal , defined as [47]:
llocal~ max (lBG,l1k,l5k,l10k)
where lBG was the expected number of tags mapped to thewindow by random chance [39,48] and l1k,l5k,l10k were
calculated based on the control tags within the 1 kb, 5 kb and
10 kb centered at the regions of interest [47]. Instead of using a
uniform lBG estimated from the whole genome, a dynamic llocal
was estimated to capture the local fluctuations and biases in ChIP-
seq data. The threshold, t, for each mark at a site was then defined
as the smallest integer t such that P(X.t) ,1024 [10].
Distribution of histone marks around TFBSsFor a group of CENTIPEDE or ChIP-seq sites, the mark signals
were averaged over all sites after a subtraction of the tag count in theinput control data at each position. Except in certain cases, all the markprofiles represented by the average tag count were smoothed with awindow of 200 bp when considering the patterns of histone marks.
Promoter upstream to a TSS contains multiple binding sites foractivators [14]. Many histone marks have been suggested to belocated in specific regions relative to TSSs. For example, H2A.Z andH3K4me2 are enriched upstream of TSSs, while H3K36me3 andH3K79me2 are enriched downstream of TSSs [5,8,9]. Asymmet-rical distributions of these marks around TSSs are correlated withthe direction of transcription. If we overlook the orientation ofTFBSs relative to TSSs on the positive and negative strands, andaverage together many TFBSs that lie upstream of genes on bothstrands, artificially symmetrical distributions would be obtainedaround TFBSs. Therefore we assigned each CENTIPEDE andChIP-seq TFBS to the nearest gene based on its distance to the TSSand reversed the shape profile of binding sites for genes on thenegative strand before averaging, to avoid a misleading aggregate.
Identification of activators and repressorsActivators are proteins that positively regulate transcription or
translation, while repressors are proteins that interfere withtranscription or repress translation. We queried the UniProtdatabases [49], a comprehensive resource for protein sequence dataand annotation data, to determine if each of the 164 CENTIPEDETFs and 34 ChIP-seq TFs was an activator or repressor. We thenremoved some multifunctional TFs that were annotated as bothactivator and repressor, prior to further analyses. We finallyidentified 36 activators and nine repressors for CENTIPEDE TFs,and 11 activators and five repressors for ChIP-seq TFs.
Pairwise correlations of histone marks in the genomeWe divided the human genome into non-overlapping 600-bp
intervals (the informative window for most histone marks) andcounted the adjusted mark tags assigned to each interval, based onthe location of the 59 end of the tag [9,10]. Finally, the Spearmancoefficient for each pair of histone marks was calculated anddisplayed using R packages (http://www.r-project.org/).
Supporting Information
Figure S1 Proportion of ChIP-seq binding sites en-riched with histone marks in different windows.(TIF)
Figure S2 Proportion of enriched CENTIPEDE (A) andChIP-seq (B) sites when a sampling approach was used.(TIF)
Figure S3 Patterns of 11 histone marks around ChIP-seq binding sites.(TIF)
Patterns of Histone Modifications around TFBSs
PLOS ONE | www.plosone.org 10 March 2013 | Volume 8 | Issue 3 | e60002
Figure S4 Patterns of long-range marks around CEN-TIPEDE and ChIP-seq binding sites.
(TIF)
Figure S5 Proportion of enriched proximal and distalsites by ChIP-seq in a 600-bp window.
(TIF)
Figure S6 Proportion of enriched activator and repres-sor sites by ChIP-seq in a 600-bp window.
(TIF)
Figure S7 Patterns of seven short-range marks aroundenriched activator and repressor sites in the distalregions inferred by CENTIPEDE and ChIP-seq.
(TIF)
Figure S8 Correlations of histone marks at activatorand repressor binding sites.(TIF)
Figure S9 Correlations of histone marks at distal andproximal binding sites.(TIF)
Acknowledgments
We thank the two anonymous reviewers for their valuable suggestions.
Author Contributions
Conceived and designed the experiments: YN HL XS. Performed the
experiments: YN. Analyzed the data: YN. Contributed reagents/
materials/analysis tools: YN. Wrote the paper: YN HL XS.
References
1. Luger K, Mader AW, Richmond RK, Sargent DF, Richmond TJ (1997) Crystal
structure of the nucleosome core particle at 2.8 A resolution. Nature 389: 251–260.
2. Bai L, Morozov AV (2010) Gene regulation by nucleosome positioning. TrendsGenet 26: 476–483.
3. Pan Y, Tsai CJ, Ma B, Nussinov R (2010) Mechanisms of transcription factorselectivity. Trends Genet 26: 75–83.
4. Huda A, Bowen NJ, Conley AB, Jordan IK (2011) Epigenetic regulation of
transposable element derived human gene promoters. Gene 475: 39–48.
5. Zhou VW, Goren A, Bernstein BE (2011) Charting histone modifications and
the functional organization of mammalian genomes. Nat Rev Genet 12: 7–18.
6. Ernst J, Kheradpour P, Mikkelsen TS, Shoresh N, Ward LD, et al. (2011)
Mapping and analysis of chromatin state dynamics in nine human cell types.Nature 473: 43–49.
7. Jiang C, Pugh BF (2009) Nucleosome positioning and gene regulation: advances
through genomics. Nat Rev Genet 10: 161–172.
8. Barski A, Cuddapah S, Cui K, Roh TY, Schones DE, et al. (2007) High-
resolution profiling of histone methylations in the human genome. Cell 129:823–837.
9. Wang Z, Zang C, Rosenfeld JA, Schones DE, Barski A, et al. (2008)
Combinatorial patterns of histone acetylations and methylations in the humangenome. Nat Genet 40: 897–903.
10. Ernst J, Kellis M (2010) Discovery and characterization of chromatin states forsystematic annotation of the human genome. Nat Biotechnol 28: 817–825.
11. Field Y, Sharon E, Segal E (2011) How transcription factors identify regulatorysites in genomic sequence. In: Hughes TR, editor. Handbook of transcription
factors. pp. 193–204.
12. Farnham PJ (2009) Insights from genomic profiling of transcription factors. NatRev Genet 10: 605–616.
13. Wasserman WW, Sandelin A (2004) Applied bioinformatics for the identificationof regulatory elements. Nat Rev Genet 5: 276–287.
14. Maston GA, Evans SK, Green MR (2006) Transcriptional regulatory elementsin the human genome. Annu Rev Genomics Hum Genet 7: 29–59.
15. Heintzman ND, Stuart RK, Hon G, Fu Y, Ching CW, et al. (2007) Distinct and
predictive chromatin signatures of transcriptional promoters and enhancers inthe human genome. Nat Genet 39: 311–318.
16. He HH, Meyer CA, Shin H, Bailey ST, Wei G, et al. (2010) Nucleosomedynamics define transcriptional enhancers. Nat Genet 42: 343–347.
17. Cuddapah S, Jothi R, Schones DE, Roh TY, Cui K, et al. (2009) Global analysisof the insulator binding protein CTCF in chromatin barrier regions reveals
demarcation of active and repressive domains. Genome Res 19: 24–32.
18. Dowell RD (2010) Transcription factor binding variation in the evolution ofgene regulation. Trends Genet 26: 468–475.
19. Park PJ (2009) ChIP-seq: advantages and challenges of a maturing technology.Nat Rev Genet 10: 669–680.
20. Kharchenko PV, Tolstorukov MY, Park PJ (2008) Design and analysis of ChIP-
seq experiments for DNA-binding proteins. Nat Biotechnol 26: 1351–1359.
21. Ernst J, Plasterer HL, Simon I, Bar-Joseph Z (2010) Integrating multiple
evidence sources to predict transcription factor binding in the human genome.Genome Res 20: 526–536.
22. Won KJ, Ren B, Wang W (2010) Genome-wide prediction of transcriptionfactor binding sites using an integrated model. Genome Biol 11: R7.
23. Pique-Regi R, Degner JF, Pai AA, Gaffney DJ, Gilad Y, et al. (2011) Accurate
inference of transcription factor binding from DNA sequence and chromatinaccessibility data. Genome Res 21: 447–455.
24. Wang J, Zhuang J, Iyer S, Lin X, Whitfield TW, et al. (2012) Sequence featuresand chromatin structure around the genomic regions bound by 119 human
transcription factors. Genome Res 22: 1798–1812.
25. Bell O, Tiwari VK, Thoma NH, Schubeler D (2011) Determinants and
dynamics of genome accessibility. Nat Rev Genet 12: 554–564.26. Bannister AJ, Kouzarides T (2011) Regulation of chromatin by histone
modifications. Cell Res 21: 381–395.27. Zaret KS, Carroll JS (2011) Pioneer transcription factors: establishing
competence for gene expression. Genes Dev 25: 2227–2241.
28. Henikoff S, Shilatifard A (2011) Histone modification: cause or cog? TrendsGenet 27: 389–396.
29. Angelov D, Lenouvel F, Hans F, Muller CW, Bouvet P, et al. (2004) The histoneoctamer is invisible when NF-kappaB binds to the nucleosome. J Biol Chem 279:
42374–42382.30. Hoffman BG, Robertson G, Zavaglia B, Beach M, Cullum R, et al. (2010) Locus
co-occupancy, nucleosome positioning, and H3K4me1 regulate the functionality
of FOXA2-, HNF4A-, and PDX1-bound loci in islets and liver. Genome Res 20:1037–1051.
31. Zlatanova J, Thakar A (2008) H2A.Z: view from the top. Structure 16: 166–179.32. Song Q, Smith AD (2011) Identifying dispersed epigenomic domains from
ChIP-Seq data. Bioinformatics 27: 870–871.
33. Barski A, Zhao K (2009) Genomic location analysis by ChIP-Seq. J CellBiochem 107: 11–18.
34. Boyle AP, Davis S, Shulha HP, Meltzer P, Margulies EH, et al. (2008) High-resolution mapping and characterization of open chromatin across the genome.
Cell 132: 311–322.35. Li L, He S, Sun JM, Davie JR (2004) Gene regulation by Sp1 and Sp3. Biochem
Cell Biol 82: 460–471.
36. Srinivasan L, Atchison ML (2004) YY1 DNA binding and PcG recruitmentrequires CtBP. Genes Dev 18: 2596–2601.
37. Wen B, Wu H, Shinkai Y, Irizarry RA, Feinberg AP (2009) Large histone H3lysine 9 dimethylated chromatin blocks distinguish differentiated from
embryonic stem cells. Nat Genet 41: 246–250.
38. Hawkins RD, Hon GC, Lee LK, Ngo Q, Lister R, et al. (2010) Distinctepigenomic landscapes of pluripotent and lineage-committed human cells. Cell
Stem Cell 6: 479–491.39. Zang C, Schones DE, Zeng C, Cui K, Zhao K, et al. (2009) A clustering
approach for identification of enriched domains from histone modificationChIP-Seq data. Bioinformatics 25: 1952–1958.
40. Xu H, Wei CL, Lin F, Sung WK (2008) An HMM approach to genome-wide
identification of differential histone modification sites from ChIP-seq data.Bioinformatics 24: 2344–2349.
41. Wagner EJ, Carpenter PB (2012) Understanding the language of Lys36methylation at histone H3. Nat Rev Mol Cell Biol 13: 115–126.
42. Strahl BD, Allis CD (2000) The language of covalent histone modifications.
Nature 403: 41–45.43. Ravasi T, Suzuki H, Cannistraci CV, Katayama S, Bajic VB, et al. (2010) An
atlas of combinatorial transcriptional regulation in mouse and man. Cell 140:744–752.
44. Quinlan AR, Hall IM (2010) BEDTools: a flexible suite of utilities for comparinggenomic features. Bioinformatics 26: 841–842.
45. Mortazavi A, Williams BA, McCue K, Schaeffer L, Wold B (2008) Mapping and
quantifying mammalian transcriptomes by RNA-Seq. Nat Methods 5: 621–628.46. Johnson DS, Mortazavi A, Myers RM, Wold B (2007) Genome-wide mapping of
in vivo protein-DNA interactions. Science 316: 1497–1502.47. Zhang Y, Liu T, Meyer CA, Eeckhoute J, Johnson DS, et al. (2008) Model-based
analysis of ChIP-Seq (MACS). Genome Biol 9: R137.
48. Nix DA, Courdy SJ, Boucher KM (2008) Empirical methods for controlling falsepositives and estimating confidence in ChIP-Seq peaks. BMC Bioinformatics 9:
523.49. (2012) Reorganizing the protein space at the Universal Protein Resource
(UniProt). Nucleic Acids Res 40: D71–75.
Patterns of Histone Modifications around TFBSs
PLOS ONE | www.plosone.org 11 March 2013 | Volume 8 | Issue 3 | e60002