Embed Size (px)
Citation preview
PIIM IS A RESEARCH AND DEVELOPMENT FACILITY AT THE NEW SCHOOL
© 2016 PARSONS JOURNAL FOR INFORMATION MAPPING AND PARSONS INSTITUTE FOR INFORMATION MAPPING
79 Fifth Avenue New York, NY 10011
THE PARSONS INSTITUTE FOR INFORMATION MAPPING
212 229 6825piim.newschool.edu
KEYWORDS Cross referencing, custom visualization tools, data visualization, hierarchical structures, non-linear data, set/graph theory
DATE 2013–present
URL http://www.bradtober.com/work/skydive/
ABSTRACT This paper presents an information visual-ization titled Mapping the Colosseo and the Panteon through Le Antichità Romane. The base data set for this visualization, Le Antichità Romane, is a collection of etchings of ancient Rome by printmaker Giovanni Battista Piranesi. As a reference work the nature of this data is very much non-linear, although it features a significant hierarchical categorization. The concept for this visualization initially arose out of a colleague’s desire to track each textual/image reference from both the Colosseo (Colosseum) and the Panteon (Pantheon) throughout the data set. These references cross the hierar-chical structure of the data set. The final visualization uses an approach that leverages formal qualities such as value, pattern, directional arrows, and text labels to identify the relationships between the pages of the collection. In addition to an overview of the final visualization, this contribution details the design process that produced it, describing Skydive, a custom prototype/interface proof-of-concept data visualization tool for mapping cross-references within data sets. This process and the final visualization are further contextualized by describing their relationships to set/graph theory concepts as found in Euler, spider, and constraint diagrams.
INTRODUCTION
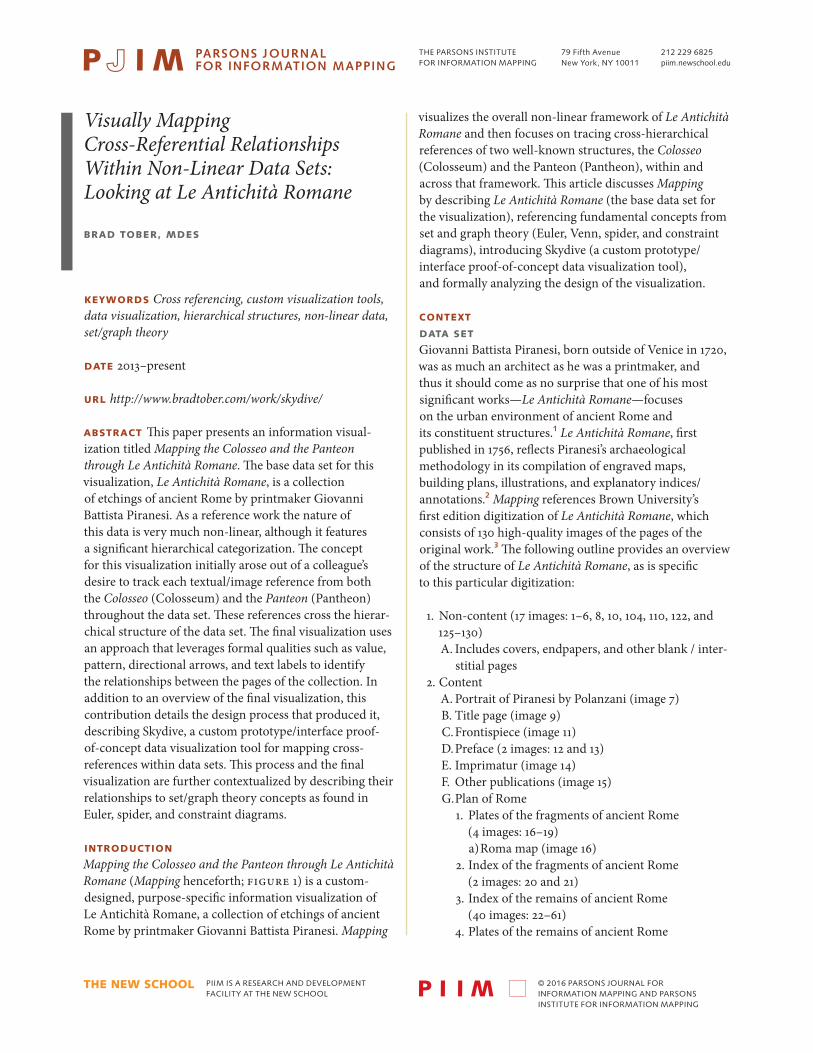
Mapping the Colosseo and the Panteon through Le Antichità Romane (Mapping henceforth; figure 1) is a custom-designed, purpose-specific information visualization of Le Antichità Romane, a collection of etchings of ancient Rome by printmaker Giovanni Battista Piranesi. Mapping
Visually Mapping Cross-Referential Relationships Within Non-Linear Data Sets: Looking at Le Antichità Romane
BRAD TOBER, MDES
visualizes the overall non-linear framework of Le Antichità Romane and then focuses on tracing cross-hierarchical references of two well-known structures, the Colosseo (Colosseum) and the Panteon (Pantheon), within and across that framework. This article discusses Mapping by describing Le Antichità Romane (the base data set for the visualization), referencing fundamental concepts from set and graph theory (Euler, Venn, spider, and constraint diagrams), introducing Skydive (a custom prototype/ interface proof-of-concept data visualization tool), and formally analyzing the design of the visualization.
CONTEXT
DATA SET
Giovanni Battista Piranesi, born outside of Venice in 1720, was as much an architect as he was a printmaker, and thus it should come as no surprise that one of his most significant works—Le Antichità Romane—focuses on the urban environment of ancient Rome and its constituent structures.1 Le Antichità Romane, first published in 1756, reflects Piranesi’s archaeological methodology in its compilation of engraved maps, building plans, illustrations, and explanatory indices/ annotations.2 Mapping references Brown University’s first edition digitization of Le Antichità Romane, which consists of 130 high-quality images of the pages of the original work.3 The following outline provides an overview of the structure of Le Antichità Romane, as is specific to this particular digitization:
1. Non-content (17 images: 1–6, 8, 10, 104, 110, 122, and 125–130)A. Includes covers, endpapers, and other blank / inter-
stitial pages2. Content
A. Portrait of Piranesi by Polanzani (image 7)B. Title page (image 9)C. Frontispiece (image 11)D. Preface (2 images: 12 and 13)E. Imprimatur (image 14)F. Other publications (image 15)G. Plan of Rome
1. Plates of the fragments of ancient Rome (4 images: 16–19)a) Roma map (image 16)
2. Index of the fragments of ancient Rome (2 images: 20 and 21)
3. Index of the remains of ancient Rome (40 images: 22–61)
4. Plates of the remains of ancient Rome
VISUALLY MAPPING CROSS-REFERENTIAL RELATIONSHIPS WITHIN NON-LINEAR DATA SETS: LOOKING AT LE ANTICHITÀ ROMANE BRAD TOBER, MDES
PARSONS JOURNAL FOR INFORMATION MAPPINGVOLUME VII I ISSUE 1, WINTER 2016[PAGE 2]
© 2016 PARSONS JOURNAL FOR INFORMATION MAPPING AND PARSONS INSTITUTE FOR INFORMATION MAPPING
Mapping the Colosseo and the Panteon through Le Antichità Romane
Image numbers refer to Brown University’s first edition digitization at http://library.brown.edu/projects/rome/books/252240/
Indices / explanations
PlatesColosseoreferences
Panteonreferences
Imagenumber
16
Foro Romano
Topography of Rome
Baths of Caracalla
Preface
Monte Capitolino
Plan of Rome
Repertoire
Observations on the boundaries of the Campus Martius
Plates of the remains of ancient Rome
Roma mapand fragments
Fragment index
Index of the remains of ancient Rome
Aqueduct map
114
123
92
113
60 16
91
page 39, #310
plate 37, figures 1 & 2
Colosseo; Anfiteatro Flavio
plate 43, #35
page i, #35
124
313169
68
101page ix, #61
Anfiteatro Flavio; Panteon, #61
Panteon
page 10, #78 & 79
plate 14, figure 2
plate 15, figures 1 & 2
Colosseo, #310; Panteon, #78 & 79
Figure 1: The full Mapping visualization
VISUALLY MAPPING CROSS-REFERENTIAL RELATIONSHIPS WITHIN NON-LINEAR DATA SETS: LOOKING AT LE ANTICHITÀ ROMANE BRAD TOBER, MDES
PARSONS JOURNAL FOR INFORMATION MAPPINGVOLUME VII I ISSUE 1, WINTER 2016[PAGE 3]
© 2016 PARSONS JOURNAL FOR INFORMATION MAPPING AND PARSONS INSTITUTE FOR INFORMATION MAPPING
(30 images: 62–91)H. Topography of Rome
1. Aqueduct map (image 92)2. Explanation of the Aqueducts (7 images: 93–99)3. Observations on the boundaries of the Campus
Martius (4 images: 100–103)I. Baths of Caracalla
1. Plates (2 images: 105 and 106)2. Index (3 images: 107–109)
J. Foro Romano1. Plates (3 images: 111–113)2. Index (4 images: 114–117)
K. Monte Capitolino1. Plate (image 118)2. Index (3 images: 119–121)
L. Repertoire of the remains of ancient buildings in volume 1 (2 images: 123 and 124)
This outline clearly points to the presence of a hierarchical structure in Le Antichità Romane; however, any sort of linear narrative that might be present—beyond the overarching topic/theme itself—is deemphasized in a number of ways, including by the lack of a consistent system of page numbers to facilitate navigation. Instead, the various sections of the content (such as “Plan of Rome” and “Repertoire…”) are connected via an elaborate system of cross-references that increase the complexity of the hierarchical organization of the work. The nature of this complexity is especially evident when following the cross-referential relationships of individual structures/buildings throughout Le Antichità Romane, and thus necessitating a visualization like Mapping. In particular, Mapping visualizes the cross-references of two well-known structures, the Colosseo (Colosseum) and the Panteon (Pantheon).4 For example, one such sequence of cross-references for the Colosseo begins on the page represented by image 123, located in the “Repertoire…” section. Here, one Colosseo-related remark references another on the same page, but also references image 60 in the “Index of the remains…” section of the “Plan of Rome.” Image 60 then references image 91 in the “Plates of the remains…” and image 16 (the “Roma map”) in the “Plates of the fragments…” section.
PROCESS
The process of developing the design of Mapping was informed by a number of fundamental approaches to information visualization and diagramming. One such approach involved the use of nested circles to represent a hierarchical structure. Using this technique, data
elements (represented by circles) at the same level of hierarchy are encompassed by a larger circle, which is then laid out alongside other groupings of the same level of hierarchy, and so on. Often, achieving this type of layout efficiently relies on circle-packing algorithms, an example of which can be seen in a bubble chart example generated using the D3/Data-Driven Documents JavaScript library.5 The bubble chart lacks a nested hierarchy, instead using scale to communicate relative importance. Perhaps most valuable for Mapping, the nested circle technique, in contrast to more conventional node-link diagrams or rectangular space-filling treemaps, “makes it easier to see groupings and [the] structural relationships” of data.6
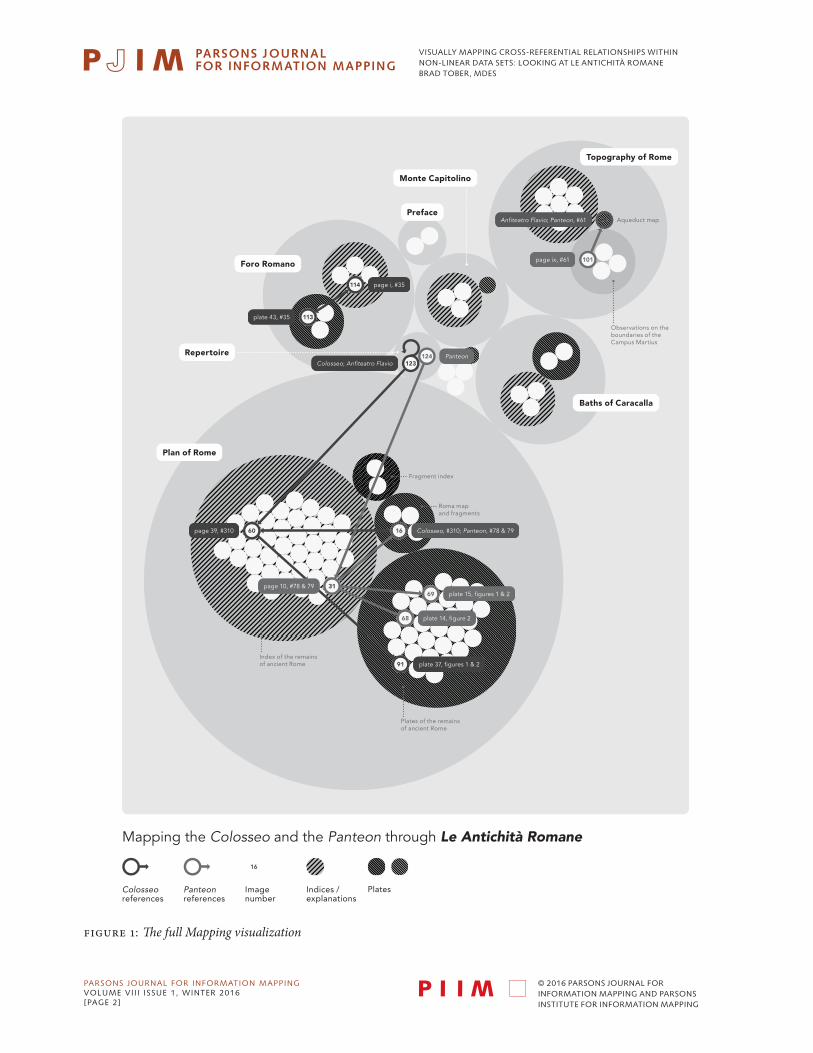
Euler diagrams (figure 2), of which familiar Venn diagrams (figure 3) are a special case, also visualize
X Y Z
X
Y Z
Figure 2: Sample Euler diagram
Figure 3: Sample Venn diagram representation of the same scenario in figure 2
VISUALLY MAPPING CROSS-REFERENTIAL RELATIONSHIPS WITHIN NON-LINEAR DATA SETS: LOOKING AT LE ANTICHITÀ ROMANE BRAD TOBER, MDES
PARSONS JOURNAL FOR INFORMATION MAPPINGVOLUME VII I ISSUE 1, WINTER 2016[PAGE 4]
© 2016 PARSONS JOURNAL FOR INFORMATION MAPPING AND PARSONS INSTITUTE FOR INFORMATION MAPPING
structural relationships. They are often used to visually demonstrate logical concepts of mathematical set theory and identify the relationships between various sets. This approach uses closed contours to split the plane into zones. These contours can be nested inside of and/or intersect other contours (Venn diagrams must visualize all possible intersections of contours, while Euler diagrams may display only a particular subset as is necessary).7 This means that Euler diagrams can visualize extremely complex hierarchies. However, as more contours become part of the diagram, it quickly becomes visually overwhelming and its information can prove challenging to comprehend.
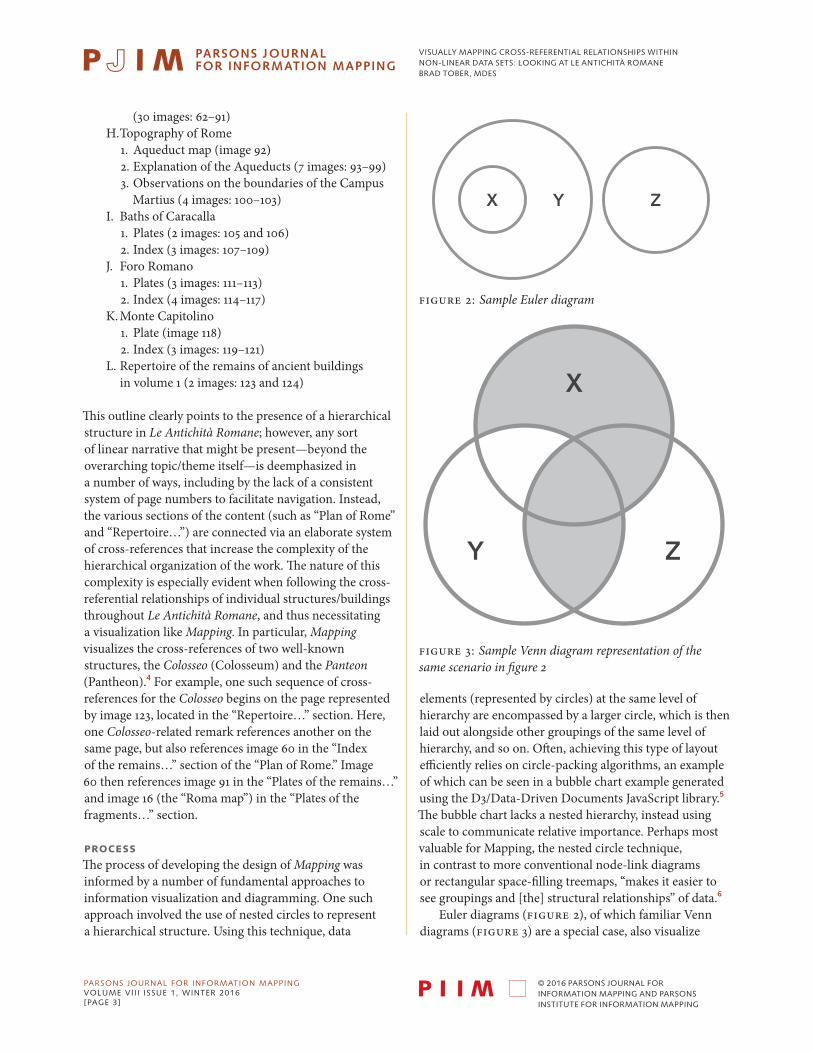
It is possible that Mapping could have visualized the Colosseo and Panteon cross-references using an approach that closely resembled an Euler diagram alone; it would be likely, however, that the cross-references would be indicated using awkwardly shaped and placed contours. Instead, Mapping also incorporates aspects that resemble characteristics of spider (figure 4) and constraint (figure 5) diagrams. Spider diagrams impose a spider (tree) diagram on top of the contours of an Euler diagram, with nodes placed in different zones.8 Constraint diagrams extendspider diagrams further by adding directional arrows to indicate binary relationships between specific parts of the diagram.9 While Mapping is not intended to be a strict representation of either a spider or constraint diagram, it appropriates key elements of both in order to impose an additional system of organization on top of the hierarchical structure of Le Antichità Romane.
The final design of Mapping was developed, in part, through the use of Skydive, a custom prototype/interface proof-of-concept data visualization tool designed and developed using Processing, a programming language and development environment, based on Java, that promotes software literacy within visual art and design. Skydive, while initially developed for another purpose, was useful in automating certain steps of the design process—particularly, the generation of a rough layout from data stored in an XML file. Please refer to the technical brief that accompanies this article for more information on Skydive.
VISUALIZATION ANALYSIS
As alluded to in the previous section, Mapping consists of two integrated systems of visual organization. The first visualizes the structural hierarchy of Le Antichità Romane using nested circles. At the highest level of visual hierarchy, twelve circles represent items II.A through II.L from the outline introduced earlier in this article (Mapping does not
A B C
D E
Figure 4: Sample spider diagram
Figure 5: Sample constraint diagram
Mapping the Colosseo and the Panteon through Le Antichità Romane
Image numbers refer to Brown University’s first edition digitization at http://library.brown.edu/projects/rome/books/252240/
Indices / explanations
PlatesColosseoreferences
Panteonreferences
Imagenumber
16
Foro Romano
Topography of Rome
Baths of Caracalla
Preface
Monte Capitolino
Plan of Rome
Repertoire
Observations on the boundaries of the Campus Martius
Plates of the remains of ancient Rome
Roma mapand fragments
Fragment index
Index of the remains of ancient Rome
Aqueduct map
114
123
92
113
60 16
91
124
313169
68
101
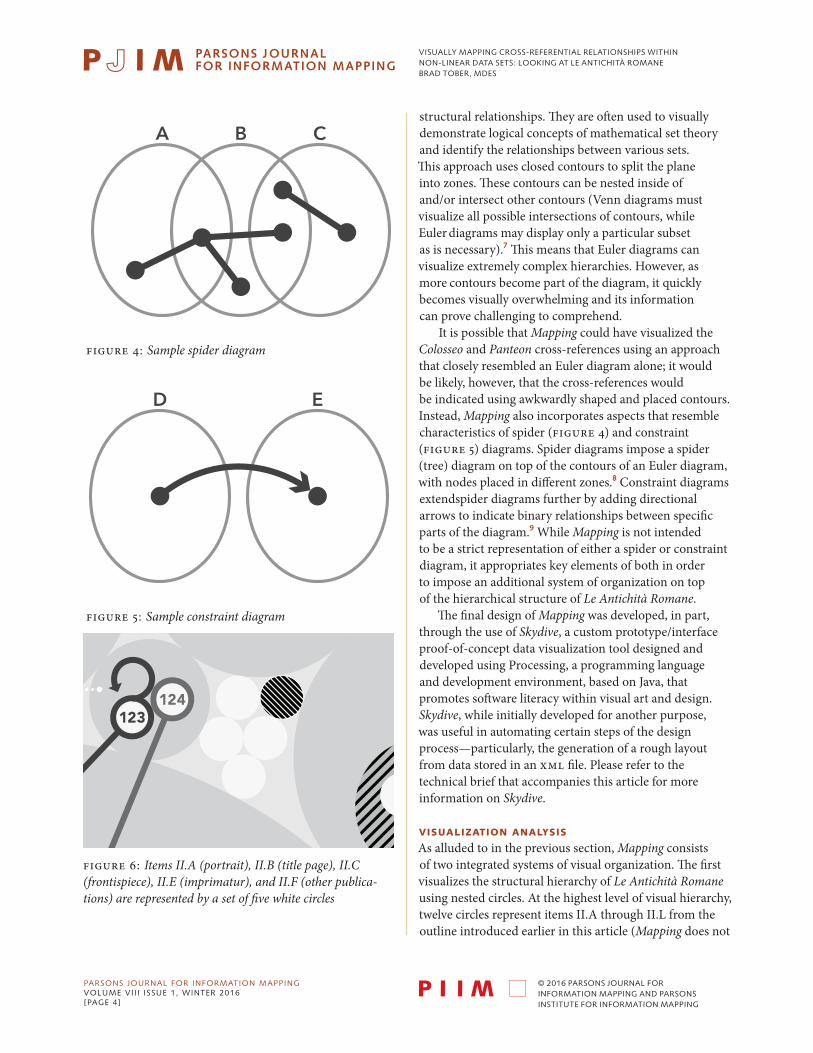
Figure 6: Items II.A (portrait), II.B (title page), II.C (frontispiece), II.E (imprimatur), and II.F (other publica-tions) are represented by a set of five white circles
VISUALLY MAPPING CROSS-REFERENTIAL RELATIONSHIPS WITHIN NON-LINEAR DATA SETS: LOOKING AT LE ANTICHITÀ ROMANE BRAD TOBER, MDES
PARSONS JOURNAL FOR INFORMATION MAPPINGVOLUME VII I ISSUE 1, WINTER 2016[PAGE 5]
© 2016 PARSONS JOURNAL FOR INFORMATION MAPPING AND PARSONS INSTITUTE FOR INFORMATION MAPPING
visualize the non-content images of Le Antichità Romane). Items II.A (portrait), II.B (title page), II.C (frontispiece), II.E (imprimatur), and II.F (other publications) are repre-sented by a set of five white circles located just above the center of the visualization (figure 6). Of these circles, one (representing item II.C) features a light top-left to bottom-right diagonal background pattern, indicating its status as a standalone plate—arguably, item II.A is a
“plate” as well, but it is not numbered as part of the plate sequence of Le Antichità Romane. In general, identifying numbers are not provided for all images; they only appear for those relevant to the Colosseo and the Panteon.
The seven other items (II.D and II.G through II.L) are presented as larger gray circles that contain deeper levels of hierarchy within them. These circles feature descriptive text labels set on a white background. The entire visualization was designed in grayscale to accommodate potential publication/printing
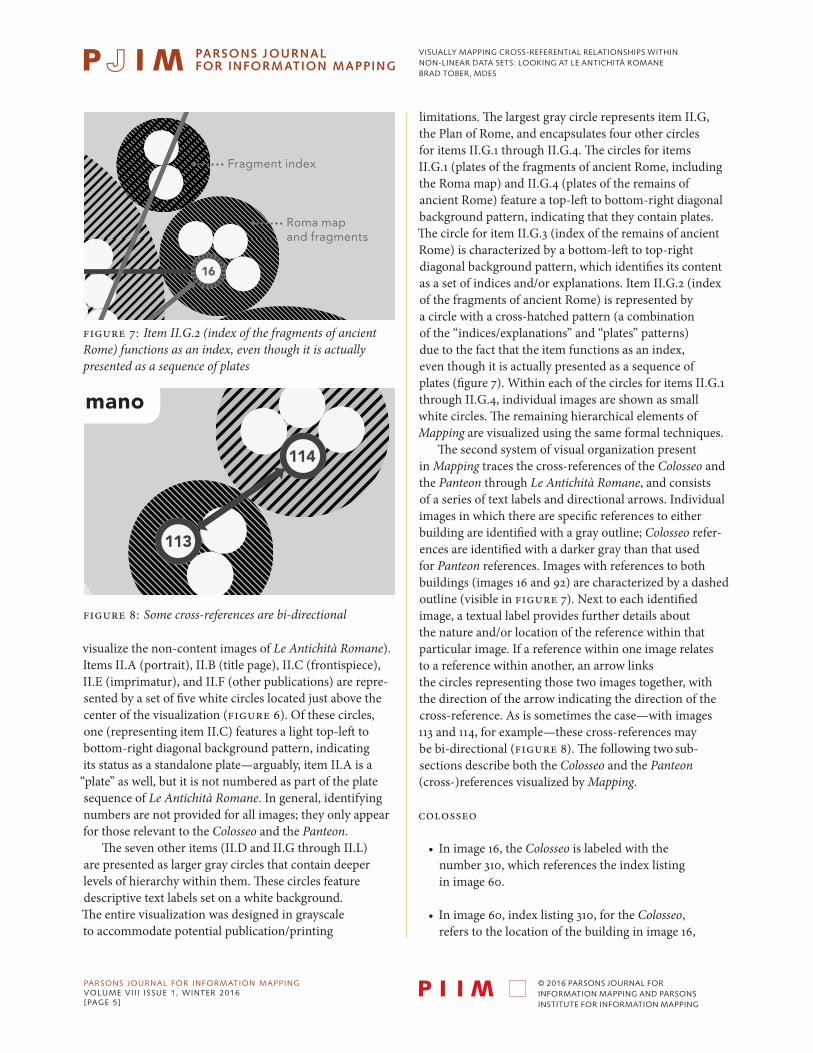
limitations. The largest gray circle represents item II.G, the Plan of Rome, and encapsulates four other circles for items II.G.1 through II.G.4. The circles for items II.G.1 (plates of the fragments of ancient Rome, including the Roma map) and II.G.4 (plates of the remains of ancient Rome) feature a top-left to bottom-right diagonal background pattern, indicating that they contain plates. The circle for item II.G.3 (index of the remains of ancient Rome) is characterized by a bottom-left to top-right diagonal background pattern, which identifies its content as a set of indices and/or explanations. Item II.G.2 (index of the fragments of ancient Rome) is represented by a circle with a cross-hatched pattern (a combination of the “indices/explanations” and “plates” patterns) due to the fact that the item functions as an index, even though it is actually presented as a sequence of plates (figure 7). Within each of the circles for items II.G.1 through II.G.4, individual images are shown as small white circles. The remaining hierarchical elements of Mapping are visualized using the same formal techniques.
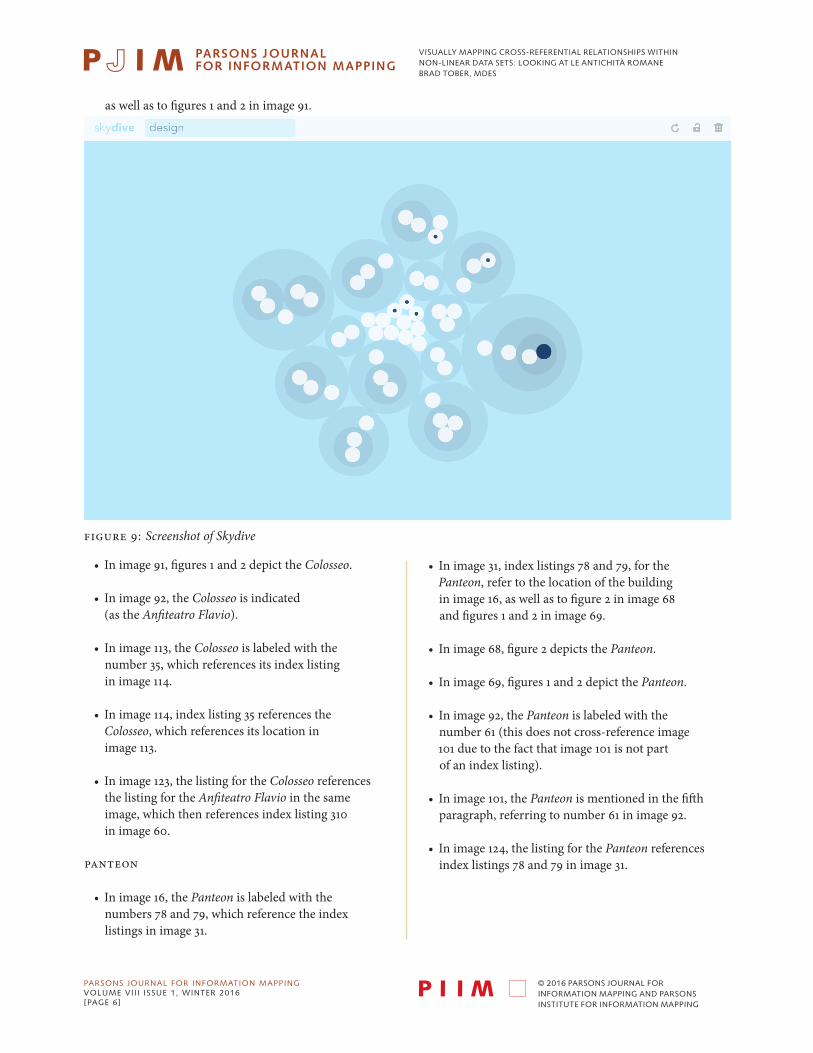
The second system of visual organization present in Mapping traces the cross-references of the Colosseo and the Panteon through Le Antichità Romane, and consists of a series of text labels and directional arrows. Individual images in which there are specific references to either building are identified with a gray outline; Colosseo refer-ences are identified with a darker gray than that used for Panteon references. Images with references to both buildings (images 16 and 92) are characterized by a dashed outline (visible in figure 7). Next to each identified image, a textual label provides further details about the nature and/or location of the reference within that particular image. If a reference within one image relates to a reference within another, an arrow links the circles representing those two images together, with the direction of the arrow indicating the direction of the cross-reference. As is sometimes the case—with images 113 and 114, for example—these cross-references may be bi-directional (figure 8). The following two sub-sections describe both the Colosseo and the Panteon (cross-)references visualized by Mapping.
Colosseo
• In image 16, the Colosseo is labeled with the number 310, which references the index listing in image 60.
• In image 60, index listing 310, for the Colosseo, refers to the location of the building in image 16,
Mapping the Colosseo and the Panteon through Le Antichità Romane
Image numbers refer to Brown University’s first edition digitization at http://library.brown.edu/projects/rome/books/252240/
Indices / explanations
PlatesColosseoreferences
Panteonreferences
Imagenumber
16
Foro Romano
Topography of Rome
Baths of Caracalla
Preface
Monte Capitolino
Plan of Rome
Repertoire
Observations on the boundaries of the Campus Martius
Plates of the remains of ancient Rome
Roma mapand fragments
Fragment index
Index of the remains of ancient Rome
Aqueduct map
114
123
92
113
60 16
91
124
313169
68
101
Figure 7: Item II.G.2 (index of the fragments of ancient Rome) functions as an index, even though it is actually presented as a sequence of plates
Figure 8: Some cross-references are bi-directional
VISUALLY MAPPING CROSS-REFERENTIAL RELATIONSHIPS WITHIN NON-LINEAR DATA SETS: LOOKING AT LE ANTICHITÀ ROMANE BRAD TOBER, MDES
PARSONS JOURNAL FOR INFORMATION MAPPINGVOLUME VII I ISSUE 1, WINTER 2016[PAGE 6]
© 2016 PARSONS JOURNAL FOR INFORMATION MAPPING AND PARSONS INSTITUTE FOR INFORMATION MAPPING
as well as to figures 1 and 2 in image 91.
• In image 91, figures 1 and 2 depict the Colosseo.
• In image 92, the Colosseo is indicated (as the Anfiteatro Flavio).
• In image 113, the Colosseo is labeled with the number 35, which references its index listing in image 114.
• In image 114, index listing 35 references the Colosseo, which references its location in image 113.
• In image 123, the listing for the Colosseo references the listing for the Anfiteatro Flavio in the same image, which then references index listing 310 in image 60.
Panteon
• In image 16, the Panteon is labeled with the numbers 78 and 79, which reference the index listings in image 31.
• In image 31, index listings 78 and 79, for the Panteon, refer to the location of the building in image 16, as well as to figure 2 in image 68 and figures 1 and 2 in image 69.
• In image 68, figure 2 depicts the Panteon.
• In image 69, figures 1 and 2 depict the Panteon.
• In image 92, the Panteon is labeled with the number 61 (this does not cross-reference image 101 due to the fact that image 101 is not part of an index listing).
• In image 101, the Panteon is mentioned in the fifth paragraph, referring to number 61 in image 92.
• In image 124, the listing for the Panteon references index listings 78 and 79 in image 31.
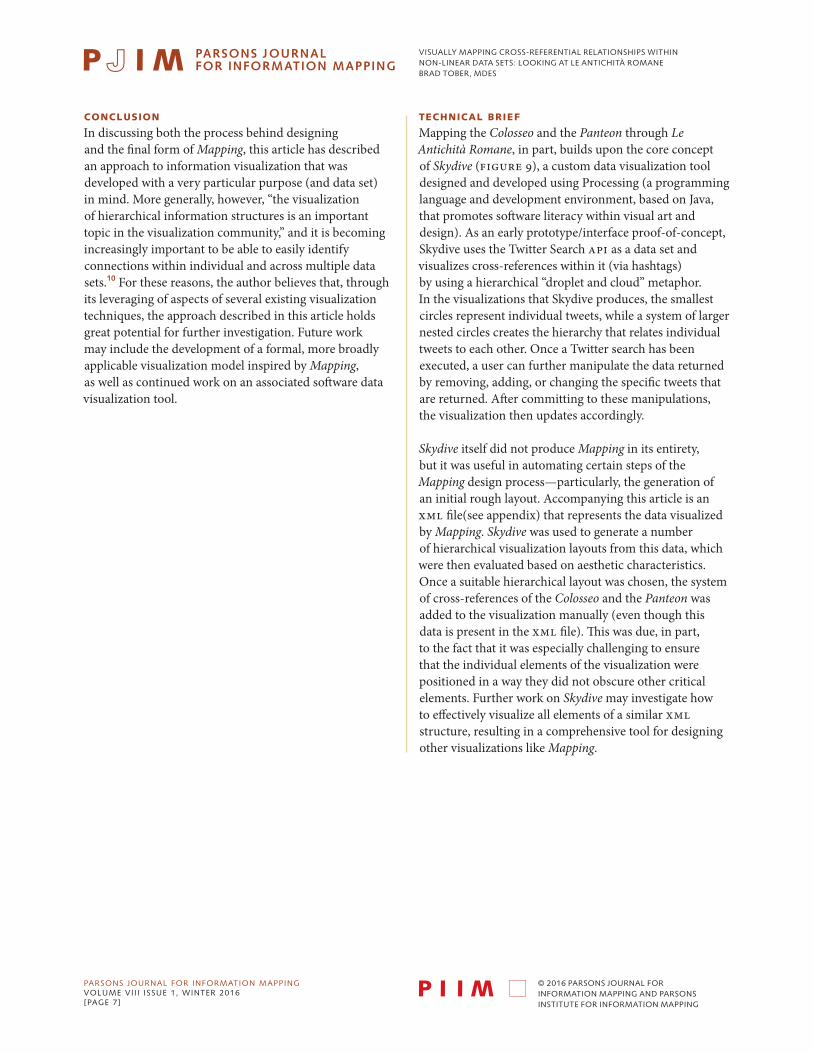
Figure 9: Screenshot of Skydive
VISUALLY MAPPING CROSS-REFERENTIAL RELATIONSHIPS WITHIN NON-LINEAR DATA SETS: LOOKING AT LE ANTICHITÀ ROMANE BRAD TOBER, MDES
PARSONS JOURNAL FOR INFORMATION MAPPINGVOLUME VII I ISSUE 1, WINTER 2016[PAGE 7]
© 2016 PARSONS JOURNAL FOR INFORMATION MAPPING AND PARSONS INSTITUTE FOR INFORMATION MAPPING
CONCLUSION
In discussing both the process behind designing and the final form of Mapping, this article has described an approach to information visualization that was developed with a very particular purpose (and data set) in mind. More generally, however, “the visualization of hierarchical information structures is an important topic in the visualization community,” and it is becoming increasingly important to be able to easily identify connections within individual and across multiple data sets.10 For these reasons, the author believes that, through its leveraging of aspects of several existing visualization techniques, the approach described in this article holds great potential for further investigation. Future work may include the development of a formal, more broadly applicable visualization model inspired by Mapping, as well as continued work on an associated software data visualization tool.
TECHNICAL BRIEF
Mapping the Colosseo and the Panteon through Le Antichità Romane, in part, builds upon the core concept of Skydive (figure 9), a custom data visualization tool designed and developed using Processing (a programming language and development environment, based on Java, that promotes software literacy within visual art and design). As an early prototype/interface proof-of-concept, Skydive uses the Twitter Search API as a data set and visualizes cross-references within it (via hashtags) by using a hierarchical “droplet and cloud” metaphor. In the visualizations that Skydive produces, the smallest circles represent individual tweets, while a system of larger nested circles creates the hierarchy that relates individual tweets to each other. Once a Twitter search has been executed, a user can further manipulate the data returned by removing, adding, or changing the specific tweets that are returned. After committing to these manipulations, the visualization then updates accordingly.
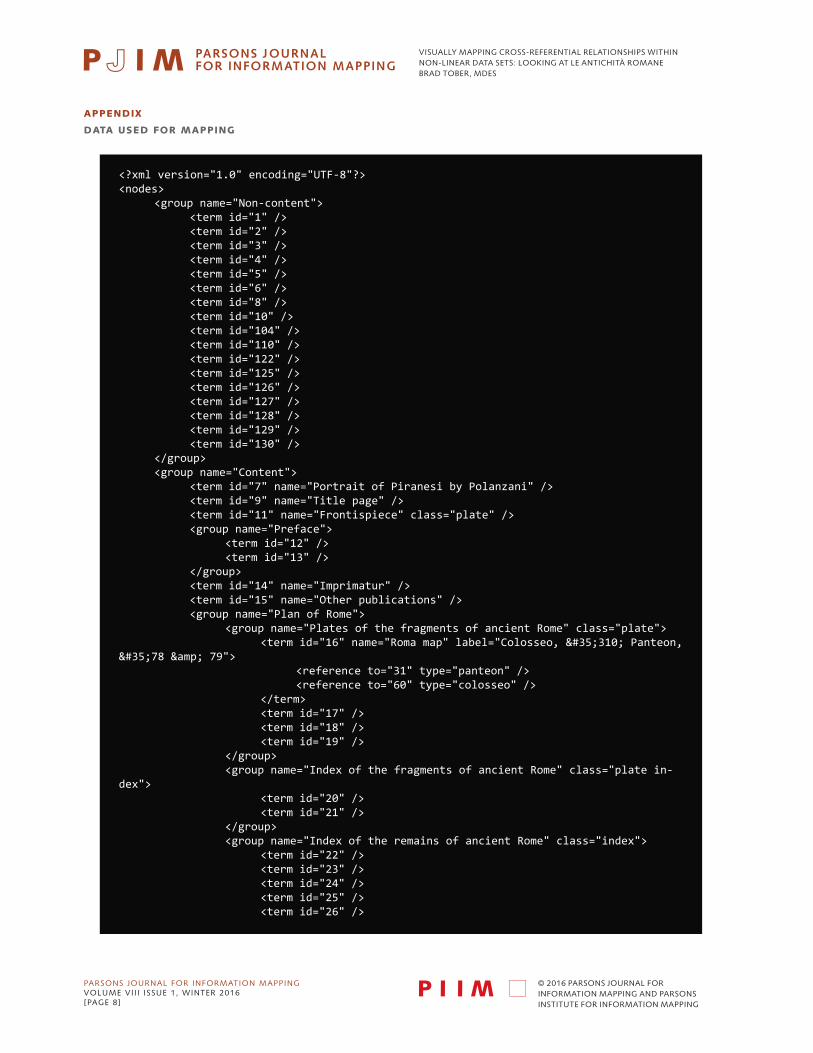
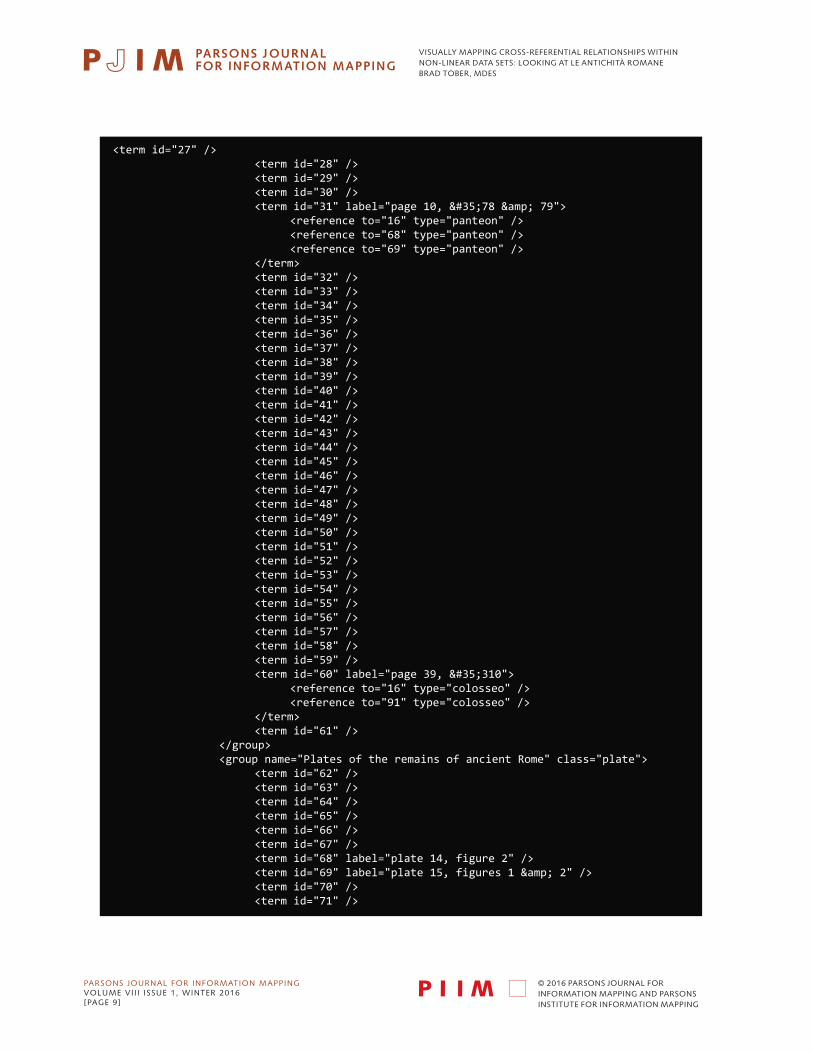
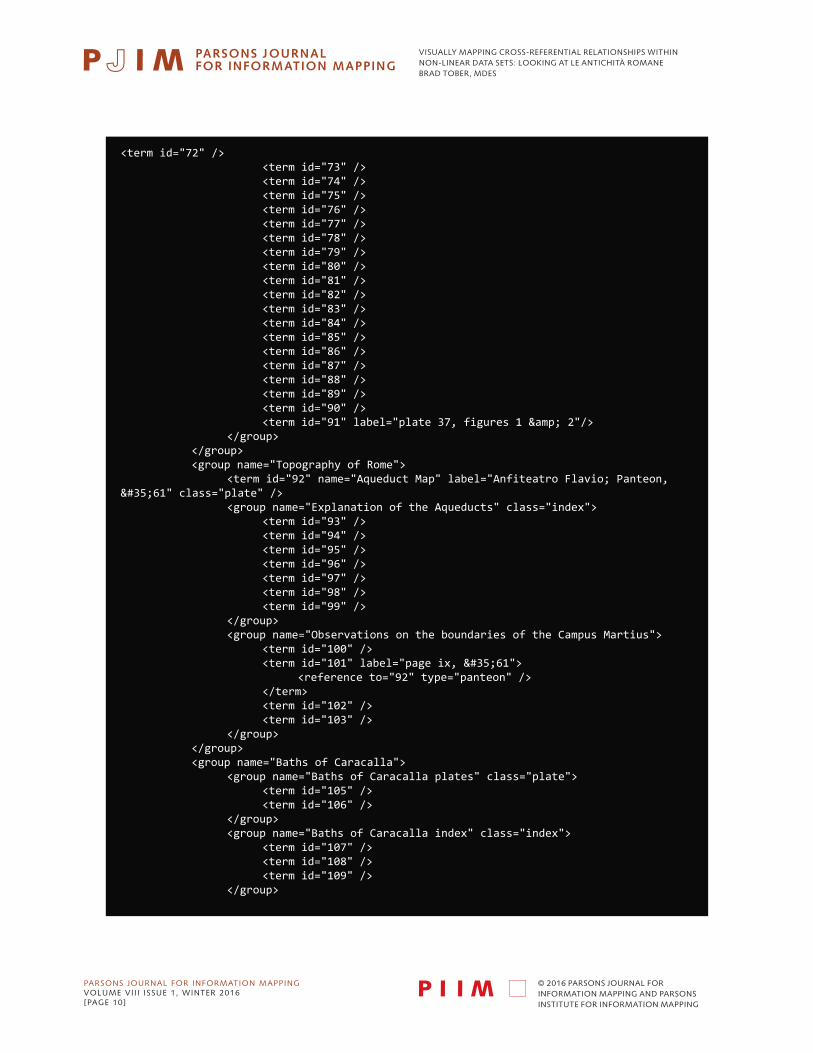
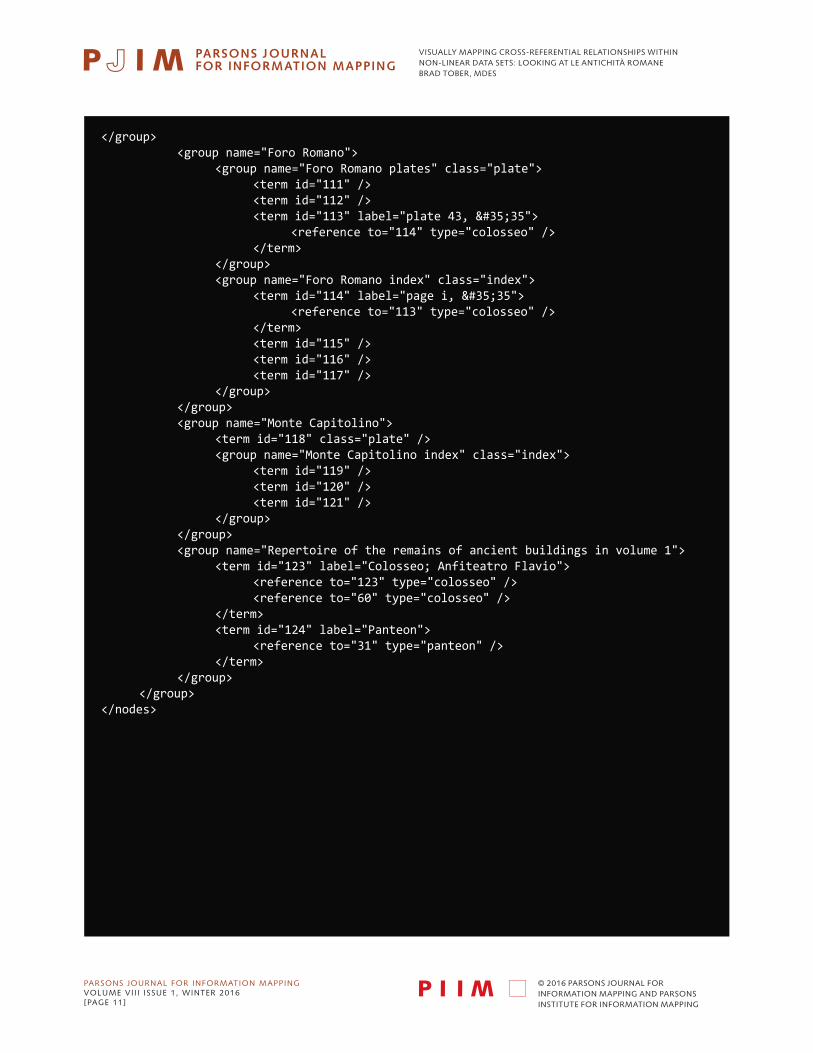
Skydive itself did not produce Mapping in its entirety, but it was useful in automating certain steps of the Mapping design process—particularly, the generation of an initial rough layout. Accompanying this article is an XML file(see appendix) that represents the data visualized by Mapping. Skydive was used to generate a number of hierarchical visualization layouts from this data, which were then evaluated based on aesthetic characteristics. Once a suitable hierarchical layout was chosen, the system of cross-references of the Colosseo and the Panteon was added to the visualization manually (even though this data is present in the XML file). This was due, in part, to the fact that it was especially challenging to ensure that the individual elements of the visualization were positioned in a way they did not obscure other critical elements. Further work on Skydive may investigate how to effectively visualize all elements of a similar XML structure, resulting in a comprehensive tool for designing other visualizations like Mapping.
VISUALLY MAPPING CROSS-REFERENTIAL RELATIONSHIPS WITHIN NON-LINEAR DATA SETS: LOOKING AT LE ANTICHITÀ ROMANE BRAD TOBER, MDES
PARSONS JOURNAL FOR INFORMATION MAPPINGVOLUME VII I ISSUE 1, WINTER 2016[PAGE 8]
© 2016 PARSONS JOURNAL FOR INFORMATION MAPPING AND PARSONS INSTITUTE FOR INFORMATION MAPPING
APPENDIX
DATA USED FOR MAPPING
<?xml version="1.0" encoding="UTF-8"?><nodes> <group name="Non-content"> <term id="1" /> <term id="2" /> <term id="3" /> <term id="4" /> <term id="5" /> <term id="6" /> <term id="8" /> <term id="10" /> <term id="104" /> <term id="110" /> <term id="122" /> <term id="125" /> <term id="126" /> <term id="127" /> <term id="128" /> <term id="129" /> <term id="130" /> </group> <group name="Content"> <term id="7" name="Portrait of Piranesi by Polanzani" /> <term id="9" name="Title page" /> <term id="11" name="Frontispiece" class="plate" /> <group name="Preface"> <term id="12" /> <term id="13" /> </group> <term id="14" name="Imprimatur" /> <term id="15" name="Other publications" /> <group name="Plan of Rome"> <group name="Plates of the fragments of ancient Rome" class="plate"> <term id="16" name="Roma map" label="Colosseo, #310; Panteon, #78 & 79"> <reference to="31" type="panteon" /> <reference to="60" type="colosseo" /> </term> <term id="17" /> <term id="18" /> <term id="19" /> </group> <group name="Index of the fragments of ancient Rome" class="plate in-dex"> <term id="20" /> <term id="21" /> </group> <group name="Index of the remains of ancient Rome" class="index"> <term id="22" /> <term id="23" /> <term id="24" /> <term id="25" /> <term id="26" />
VISUALLY MAPPING CROSS-REFERENTIAL RELATIONSHIPS WITHIN NON-LINEAR DATA SETS: LOOKING AT LE ANTICHITÀ ROMANE BRAD TOBER, MDES
PARSONS JOURNAL FOR INFORMATION MAPPINGVOLUME VII I ISSUE 1, WINTER 2016[PAGE 9]
© 2016 PARSONS JOURNAL FOR INFORMATION MAPPING AND PARSONS INSTITUTE FOR INFORMATION MAPPING
<term id="27" /> <term id="28" /> <term id="29" /> <term id="30" /> <term id="31" label="page 10, #78 & 79"> <reference to="16" type="panteon" /> <reference to="68" type="panteon" /> <reference to="69" type="panteon" /> </term> <term id="32" /> <term id="33" /> <term id="34" /> <term id="35" /> <term id="36" /> <term id="37" /> <term id="38" /> <term id="39" /> <term id="40" /> <term id="41" /> <term id="42" /> <term id="43" /> <term id="44" /> <term id="45" /> <term id="46" /> <term id="47" /> <term id="48" /> <term id="49" /> <term id="50" /> <term id="51" /> <term id="52" /> <term id="53" /> <term id="54" /> <term id="55" /> <term id="56" /> <term id="57" /> <term id="58" /> <term id="59" /> <term id="60" label="page 39, #310"> <reference to="16" type="colosseo" /> <reference to="91" type="colosseo" /> </term> <term id="61" /> </group> <group name="Plates of the remains of ancient Rome" class="plate"> <term id="62" /> <term id="63" /> <term id="64" /> <term id="65" /> <term id="66" /> <term id="67" /> <term id="68" label="plate 14, figure 2" /> <term id="69" label="plate 15, figures 1 & 2" /> <term id="70" /> <term id="71" />
VISUALLY MAPPING CROSS-REFERENTIAL RELATIONSHIPS WITHIN NON-LINEAR DATA SETS: LOOKING AT LE ANTICHITÀ ROMANE BRAD TOBER, MDES
PARSONS JOURNAL FOR INFORMATION MAPPINGVOLUME VII I ISSUE 1, WINTER 2016[PAGE 10]
© 2016 PARSONS JOURNAL FOR INFORMATION MAPPING AND PARSONS INSTITUTE FOR INFORMATION MAPPING
<term id="72" /> <term id="73" /> <term id="74" /> <term id="75" /> <term id="76" /> <term id="77" /> <term id="78" /> <term id="79" /> <term id="80" /> <term id="81" /> <term id="82" /> <term id="83" /> <term id="84" /> <term id="85" /> <term id="86" /> <term id="87" /> <term id="88" /> <term id="89" /> <term id="90" /> <term id="91" label="plate 37, figures 1 & 2"/> </group> </group> <group name="Topography of Rome"> <term id="92" name="Aqueduct Map" label="Anfiteatro Flavio; Panteon, #61" class="plate" /> <group name="Explanation of the Aqueducts" class="index"> <term id="93" /> <term id="94" /> <term id="95" /> <term id="96" /> <term id="97" /> <term id="98" /> <term id="99" /> </group> <group name="Observations on the boundaries of the Campus Martius"> <term id="100" /> <term id="101" label="page ix, #61"> <reference to="92" type="panteon" /> </term> <term id="102" /> <term id="103" /> </group> </group> <group name="Baths of Caracalla"> <group name="Baths of Caracalla plates" class="plate"> <term id="105" /> <term id="106" /> </group> <group name="Baths of Caracalla index" class="index"> <term id="107" /> <term id="108" /> <term id="109" /> </group>
VISUALLY MAPPING CROSS-REFERENTIAL RELATIONSHIPS WITHIN NON-LINEAR DATA SETS: LOOKING AT LE ANTICHITÀ ROMANE BRAD TOBER, MDES
PARSONS JOURNAL FOR INFORMATION MAPPINGVOLUME VII I ISSUE 1, WINTER 2016[PAGE 11]
© 2016 PARSONS JOURNAL FOR INFORMATION MAPPING AND PARSONS INSTITUTE FOR INFORMATION MAPPING
</group> <group name="Foro Romano"> <group name="Foro Romano plates" class="plate"> <term id="111" /> <term id="112" /> <term id="113" label="plate 43, #35"> <reference to="114" type="colosseo" /> </term> </group> <group name="Foro Romano index" class="index"> <term id="114" label="page i, #35"> <reference to="113" type="colosseo" /> </term> <term id="115" /> <term id="116" /> <term id="117" /> </group> </group> <group name="Monte Capitolino"> <term id="118" class="plate" /> <group name="Monte Capitolino index" class="index"> <term id="119" /> <term id="120" /> <term id="121" /> </group> </group> <group name="Repertoire of the remains of ancient buildings in volume 1"> <term id="123" label="Colosseo; Anfiteatro Flavio"> <reference to="123" type="colosseo" /> <reference to="60" type="colosseo" /> </term> <term id="124" label="Panteon"> <reference to="31" type="panteon" /> </term> </group> </group></nodes>
VISUALLY MAPPING CROSS-REFERENTIAL RELATIONSHIPS WITHIN NON-LINEAR DATA SETS: LOOKING AT LE ANTICHITÀ ROMANE BRAD TOBER, MDES
PARSONS JOURNAL FOR INFORMATION MAPPINGVOLUME VII I ISSUE 1, WINTER 2016[PAGE 12]
© 2016 PARSONS JOURNAL FOR INFORMATION MAPPING AND PARSONS INSTITUTE FOR INFORMATION MAPPING
NOTES
1 Weiner, “Eighteenth-Century Italian Prints,” 217.
2 Ibid., 221.
3 Mapping references Brown University’s high-quality first edition digitization of Le Antichità Romane. More information is available at http://library.brown.edu/projects/rome/books/252240/.
4 Heather Hyde Minor, Associate Professor of Art History at the University of Notre Dame, has recently authored and published (through The Pennsylvania State University Press) a book on Piranesi and his work, Piranesi’s Lost Words. Mapping was prompted and inspired by an engaging conversation with her as she was preparing her manuscript. More information is available at http://www.psupress.org/books/titles/978-0-271-06549-6.html.
5 Mike Bostock, “Bubble Chart” http://bl.ocks.org/mbostock/4063269.
6 Wang et al., “Visualization of large hierarchical data,” 517.
7 Flower, Rodgers, and Mutton, “Layout metrics,” 272.
8 Gil, Howse, and Kent, “Toward a formalization,” 73.
9 Ibid., 74.
10 See note 6.
BIOGRAPHY
Brad Tober investigates the potential of code-based and interactive visual communication technologies, aiming to contextualize their relationships to design practice and pedagogy. His practice-led research is often specu-lative, recognizing that forms of and methodologies for contemporary practice spanning design and technology are best developed through exploratory processes.
VISUALLY MAPPING CROSS-REFERENTIAL RELATIONSHIPS WITHIN NON-LINEAR DATA SETS: LOOKING AT LE ANTICHITÀ ROMANE BRAD TOBER, MDES
PARSONS JOURNAL FOR INFORMATION MAPPINGVOLUME VII I ISSUE 1, WINTER 2016[PAGE 13]
© 2016 PARSONS JOURNAL FOR INFORMATION MAPPING AND PARSONS INSTITUTE FOR INFORMATION MAPPING
BIBLIOGRAPHY
Flower, Jean, Peter Rodgers, and Paul Mutton. 2003. “Layout metrics for Euler diagrams.” In Proceedings of the Seventh International Conference on Information Visualization. IEEE, New York: 272–280.
Gil, Joseph, John Howse, and Stuart Kent. 2001. “Toward a formalization of constraint diagrams.” In Proceedings of IEEE Symposia on Human-Centric Computing Languages and Environments. IEEE, New York: 72–79.
Wang, Weixin, Hui Wang, Guozhong Dai, and Hongan Wang. 2006. “Visualization of large hierarchical data by circle packing.” In Proceedings of the SIGCHI Conference on Human Factors in Computing Systems. ACM, New York: 517-520.
Wiener, Victor. 1971. “Eighteenth-Century Italian Prints.” The Metropolitan Museum of Art Bulletin 29 (5). The Metropolitan Museum of Art, New York: 203–225.